Geographic Prevalence and Mix of Regional Cuisines in Chinese Cities


1
State Key Laboratory of Information Engineering in Surveying, Mapping and Remote Sensing, Wuhan University, 129 Luoyu Road, Wuhan 430079, China
2
Department of Land Surveying and Geo-Informatics, The Hong Kong Polytechnic University, Hong Kong, China
3
Department of Geography, University of Tennessee, Knoxville, TN 37916, USA
4
Guangzhou Institute of Geography, 100 Xianlie Zhong Road, Guangzhou 510070, China
5
Department of Urban Planning and Design, The University of Hong Kong, Hong Kong, China
*
Author to whom correspondence should be addressed.
ISPRS Int. J. Geo-Inf. 2018, 7(5), 183; https://doi.org/10.3390/ijgi7050183
Submission received: 15 March 2018
/
Revised: 30 April 2018
/
Accepted: 7 May 2018
/
Published: 11 May 2018
Abstract
:Previous research on the geographies of food put a considerable focus on analyzing how different types of food or ingredients are consumed across different places. Little is known, however, about how food culture is manifested through various cooking traditions as well as people’s perceptions over different culinary styles. Using a data set captured from one of the largest online review sites in China (www.dianping.com), this study demonstrates how geo-referenced social review data can be leveraged to better understand the geographic prevalence and mix of regional cuisines in Chinese cities. Based on information of millions of restaurants obtained in selected cities (i.e., provincial capitals and municipalities under direct supervision of the Chinese central government), we first measure by each city the diversity of restaurants that serve regional Chinese cuisines using the Shannon entropy, and analyze how cities with different characteristics are geographically distributed. A hierarchical clustering algorithm is then used to further explore the similarities of consumers’ dining options among these cities. By associating each regional Chinese cuisine to its origin, we then develop a weighted distance measure to quantify the geographic prevalence of each cuisine type. Finally, a popularity index (POPU) is introduced to quantify consumers’ preferences for different regional cuisines. We find that: (1) diversity of restaurants among the cities shows an “east–west” contrast that is in general agreement with the socioeconomic divide in China; (2) most of the cities have their own unique characteristics, which are mainly driven by a large market share of the corresponding local cuisine; (3) there exists great heterogeneity of the geographic prevalence of different Chinese cuisines. In particular, Chuan and Xiang, which are famous for their spicy taste, are widely distributed across the mainland China and (4) among the top-tier restaurants ranked by the consumers in a city, the local cuisine is not usually favored, while other cuisines are favored by consumers in many different cities. This study demonstrates the use of social review data as a cost-effective approach of studying urban gastronomy and its relationship with human activities.
1. Introduction
Understanding food culture and consumption in cities is an important topic in food geography [1,2]. A city’s ‘culinary scene’ oftentimes reflects its socioeconomic development, cultural transformation, as well as access to food materials [3,4]. Moreover, what people eat in cities and their perceptions on dining experiences are important information for governments, local service providers, and communities at large. Studying how these patterns vary across geographic space is also important because it can help cities better understand their own food culture, which would shape many aspects of urban development, such as tourism marketing [5,6], place branding [7], and obesity control [8]. This is particularly the case for China, where there exists a long and diverse history of food culture and cooking traditions (i.e., regional cuisines).
Despite its theoretical significance, limited work has been devoted to systematically examine the ‘culinary scene’ across Chinese cities. The literature on food geography has conjectured that a city’s culinary scene in general and its mix of restaurants in specific are closely linked with the underlying urban socioeconomic transformations; however, existing empirical studies are often resort to resource- and time- consuming data collection methods. While there is a burgeoning literature on urban China, relatively limited attention has been paid to consumption in cities and in particular the transformation of the ‘culinary scene’ among Chinese cities. Despite the new urban data environment [9] which has opened up possibilities of exploring urban dynamics with big and open data, few attempts have been made to explore consumers’ dining activities and related geographic heterogeneity.
To fill the research gap, this study uses a data set captured from one of the largest online review sites in China—Dianping (www.dianping.com)—to demonstrate how big social review data can be leveraged to better understand the geography of consumers’ dining options and experiences. By analyzing data of millions of restaurants in major Chinese cities (i.e., provincial capitals and municipalities under direct supervision of the Chinese central government), this research aims to generate new insight into the geographic prevalence and mix of regional cuisines in China. The major contributions of this study are as follows:
- By classifying restaurants based on regional Chinese cuisines and other culinary styles, we measure the diversity of restaurants by city, and analyze how cities with a different diversity of restaurants that serve regional Chinese cuisines are geographically distributed.
- We further examine each individual city to generate the percentage of restaurants by type, and apply a hierarchical clustering algorithm to explore the similarities of consumers’ dining options among these cities. We then examine how the similarities are related to geographic distance.
- By associating each regional Chinese cuisine to its origin, we introduce a weighted distance measure to quantify its geographic prevalence. The distance measure is able to distinguish the cuisine types that spread across various cities in China from those that exhibit strong local characteristics.
- For the restaurants in each individual city, we further analyze consumers’ ratings on taste to gain insights into their dining preferences. A popularity index based on location quotient is developed to examine whether certain regional Chinese cuisines dominate among the top-tier restaurants in a city.
This research sheds light on the social, economic and cultural aspects of people’s dining activities and experiences in China, which can benefit decision-making in catering business, public health, tourism, and sustainable urban development.
2. Literature Review
2.1. Food, Consumption, and Urban Culinary Scene
The literature on food culture and consumption in cities has grown substantively in both scope and depth. Scholarly attention has been paid to amongst others the cultural and experiential dimensions of food consumption [10,11], the interplay between the global and local forces in shaping urban culinary scene [12,13], neighborhood food environment and health outcomes [14], the nexus between culinary scene and tourism [15], as well as typologies of cities and their culinary scene [3,16]. In this large body of literature, an important line of research that is most relevant to our study here is the exploration of whether and to what extent urban culinary scene reflects the underlying socioeconomic and cultural conditions. For example, such relationship could rest on the post-materialist notion of ‘self-actualization’ [3,17,18]. More specifically, as the demands for material necessities are increasingly met in economically advanced societies, individuals start to place higher values on the ability to ‘actualize’ their desired economic and cultural identities, which may in turn give rise to certain consumption spaces such as specific types of restaurants [3,19,20]. Still, urban culinary scene can be related to the ‘consumer city’ thesis [21,22] that the diversity of consumption amenities is an important driver for urban agglomeration. In other words, greater cuisine scope and diversity are more likely to be observed in larger and richer cities, and vice versa.
However, information about urban culinary scene and its geographic heterogeneity is not easy to acquire. Existing studies often rely on surveys [1,2,23] or recipe data [24,25], and these studies mainly focused on analyzing how different types of food or ingredients are consumed across different places. Despite valuable insights uncovered by these studies, there is a lack of large-scale systematic studies of food culture in individual cities as manifested by various cuisines [26].
2.2. The Evolving Urban Culinary Scene in China
There are a number of conjectures regarding how restaurants reflect socioeconomic and cultural changes in Chinese cities. First, the distribution of restaurants in individual cities depends on the country’s rich cuisine traditions. The emergence of regional cuisines is often linked with climate/geographic conditions, access to food materials, economic development, as well as local culture [2,27]. Therefore, cities are oftentimes populated with restaurants of the corresponding regional cuisines [28]. Second, inter-city flows of information, people, and goods can significantly enrich cities’ culinary scene. Third and relatedly, the interplay between urban culinary scene and globalizing forces can take place in a number of different ways [13,15]. For example, we have seen the ‘McDonaldization’ process, with the entrance of international restaurant franchises [29], as well as restaurant clusters of certain foreign cuisines in Chinese cities (e.g., clusters of Korean restaurants in Shandong Province, where there are large sums of investments and inflows of expatriates from South Korea [4]).
However, there are no systematic studies on the geographic prevalence and mix of regional cuisines in Chinese cities. How different cuisines contribute to the culinary scene of a city and how people react to these cooking styles are less well understood. Still, efforts are required to properly characterize the relationship between individual cities’ culinary scene and their socioeconomic development.
2.3. Exploring Urban Dynamics with User-Generated Content
The advent of Web 2.0—a new paradigm in the information age that emphasizes user-generated content (UGC) [30]—has brought new opportunities to how various aspects of human dynamics are sensed and understood. In recent years, UGC has been widely used to address critical questions in social networks [31,32,33], disaster response [34,35,36], and urban pattern detection [37,38,39]. However, the exploration of UGC in revealing consumer dining activities and the geographic heterogeneity is still at an early stage. Although some studies have used social media (e.g., Twitter) or online recipe data to examine human public health issues [40,41], people’s dietary choices [42] or the geographic similarities of regional cuisines [43], how human dining activities are tied to specific cuisine types in a city, and how these associations are manifested in geographic space were not addressed. Based on the data of restaurants gathered from a social review website (i.e., dianping , a Chinese equivalent of Yelp), a recent study used cartogram to map the geographic prevalence of regional cuisines in China [4]. The study shows that different cuisines tend to spread across China in different ways. However, the mix of different cuisines in a single city as well as the similarities between cities were not examined. Moreover, to make their findings useful, empirical evidence about consumers’ views on restaurants or culinary styles are needed. For example, what type(s) of restaurants tend to be favored by people in a city and how do the patterns vary across cities? Are local cuisines always favored by the consumers? Answering these questions could provide additional information on people’s perceptions over different cuisine types, which is important to the preservation of local food culture [44], and benefit applications such as restaurant recommendation [45,46].
3. Study Area and Data Set
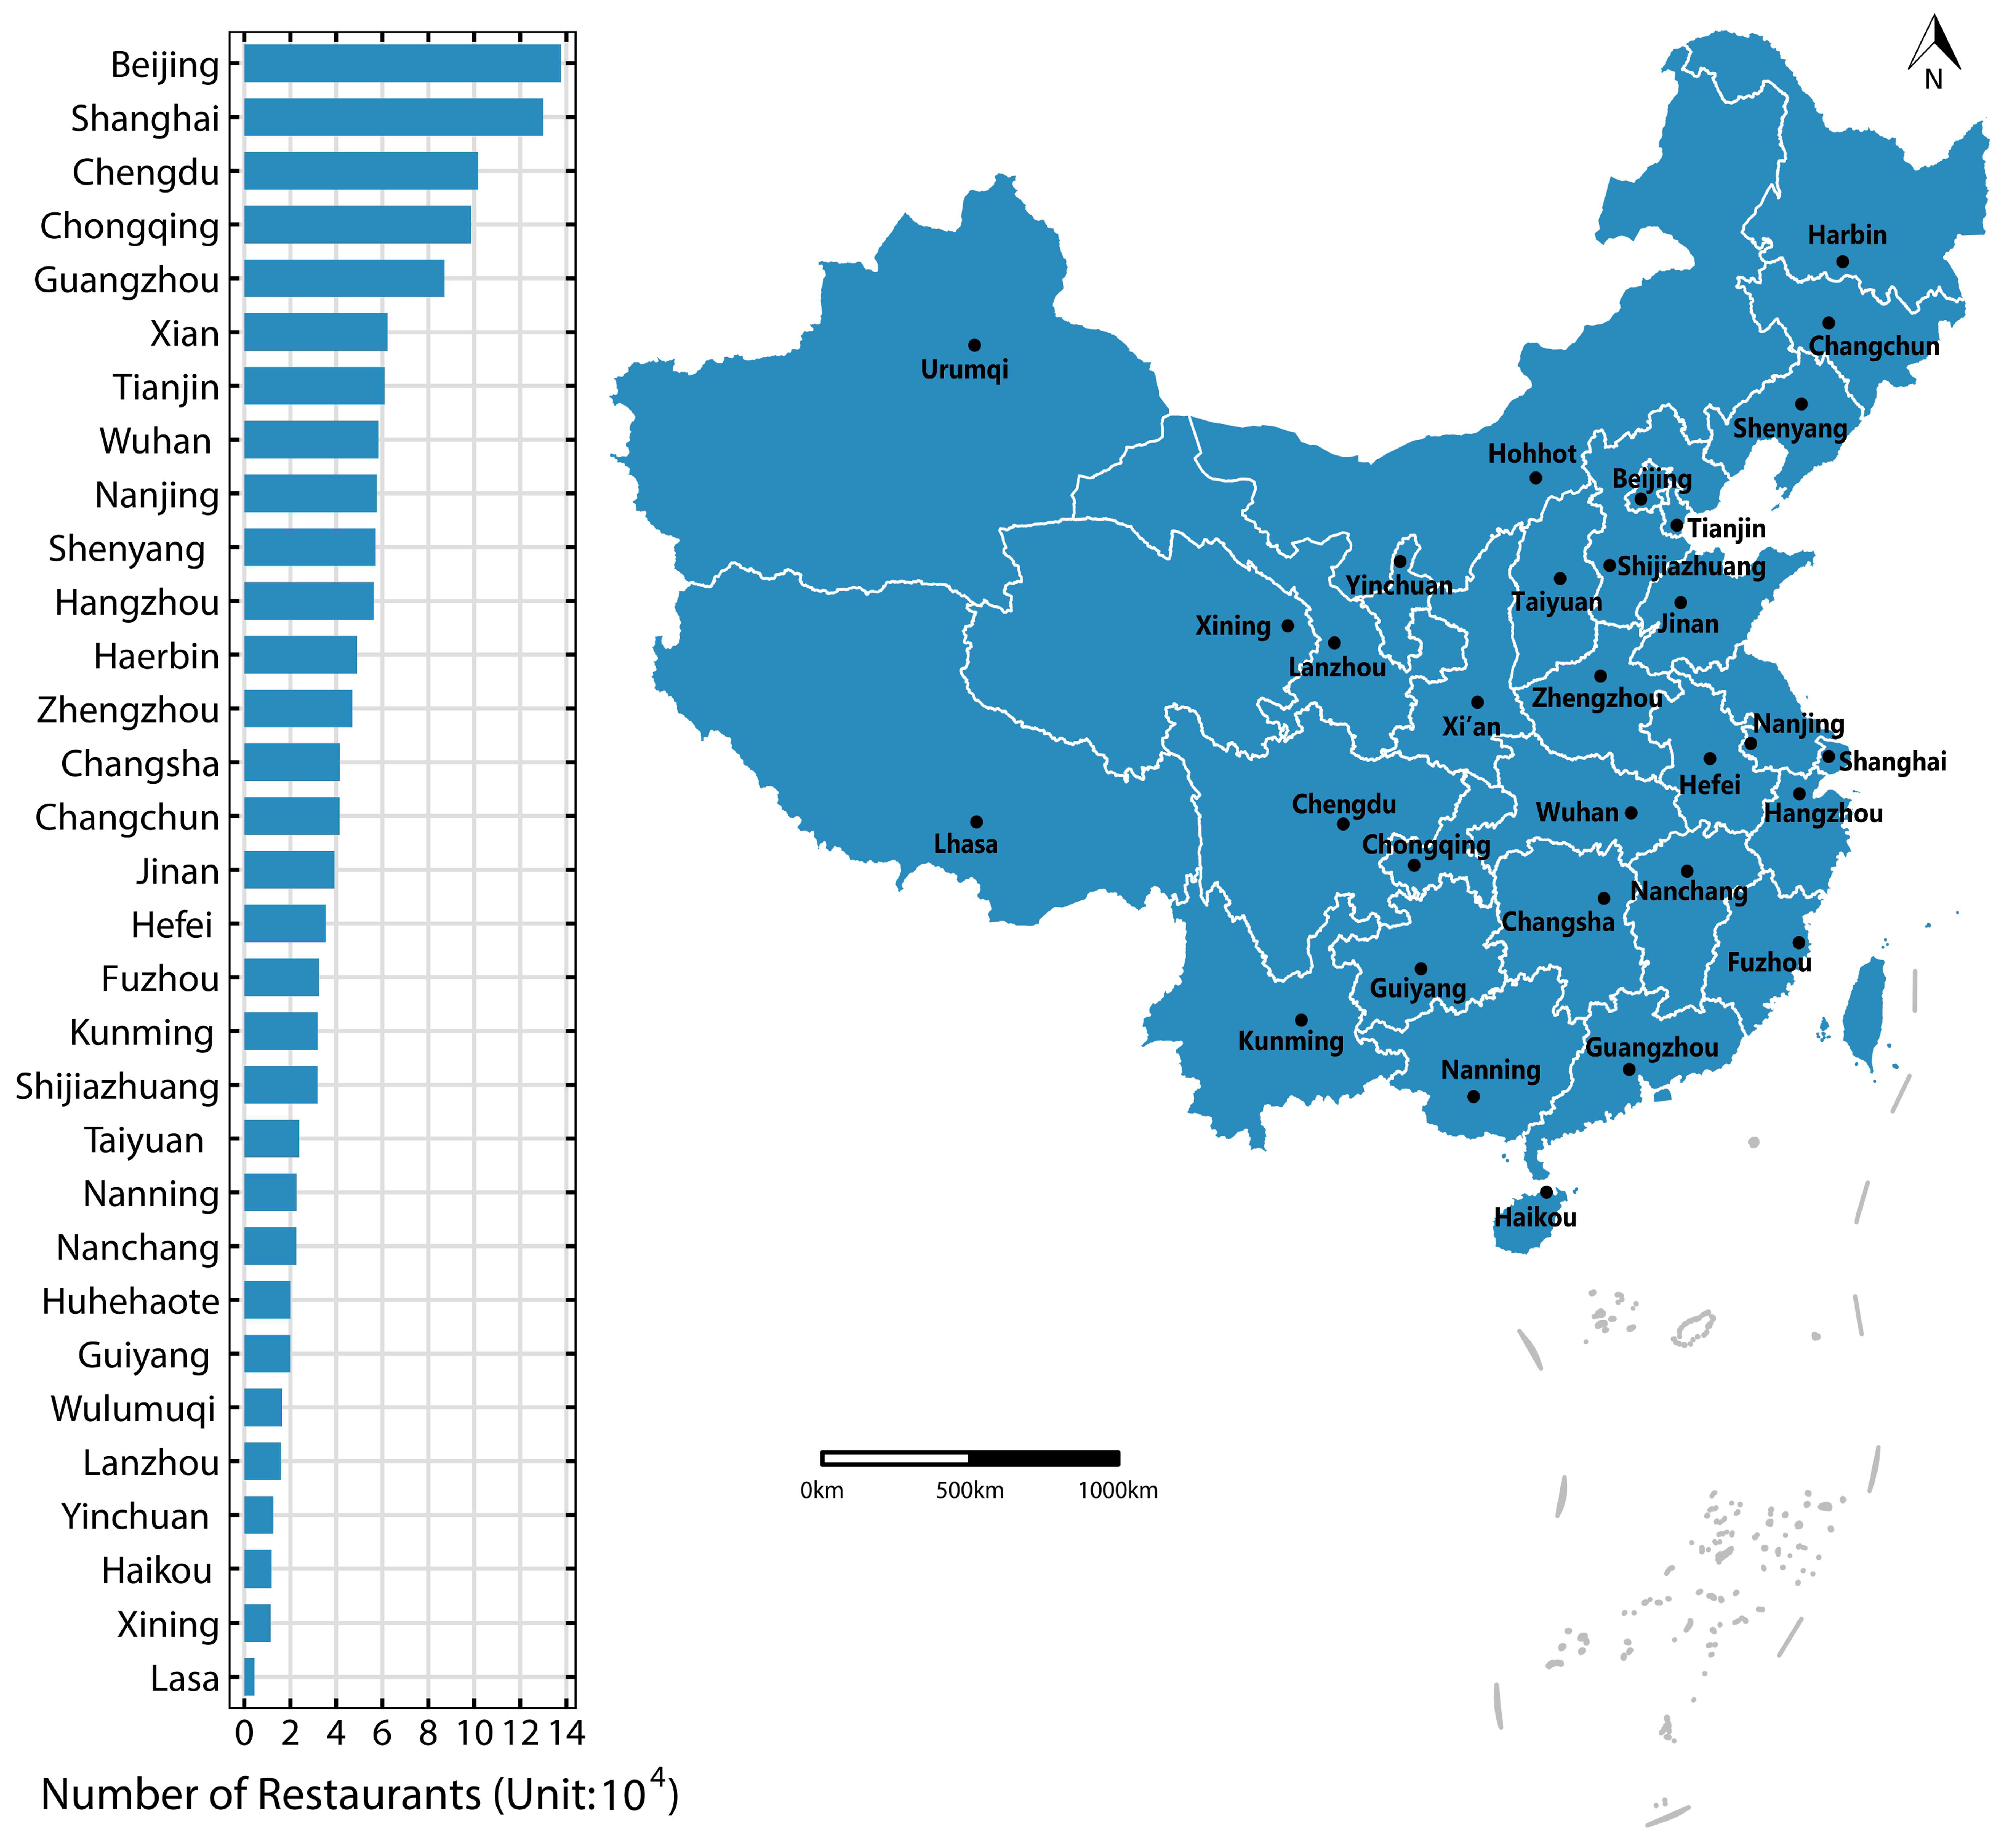
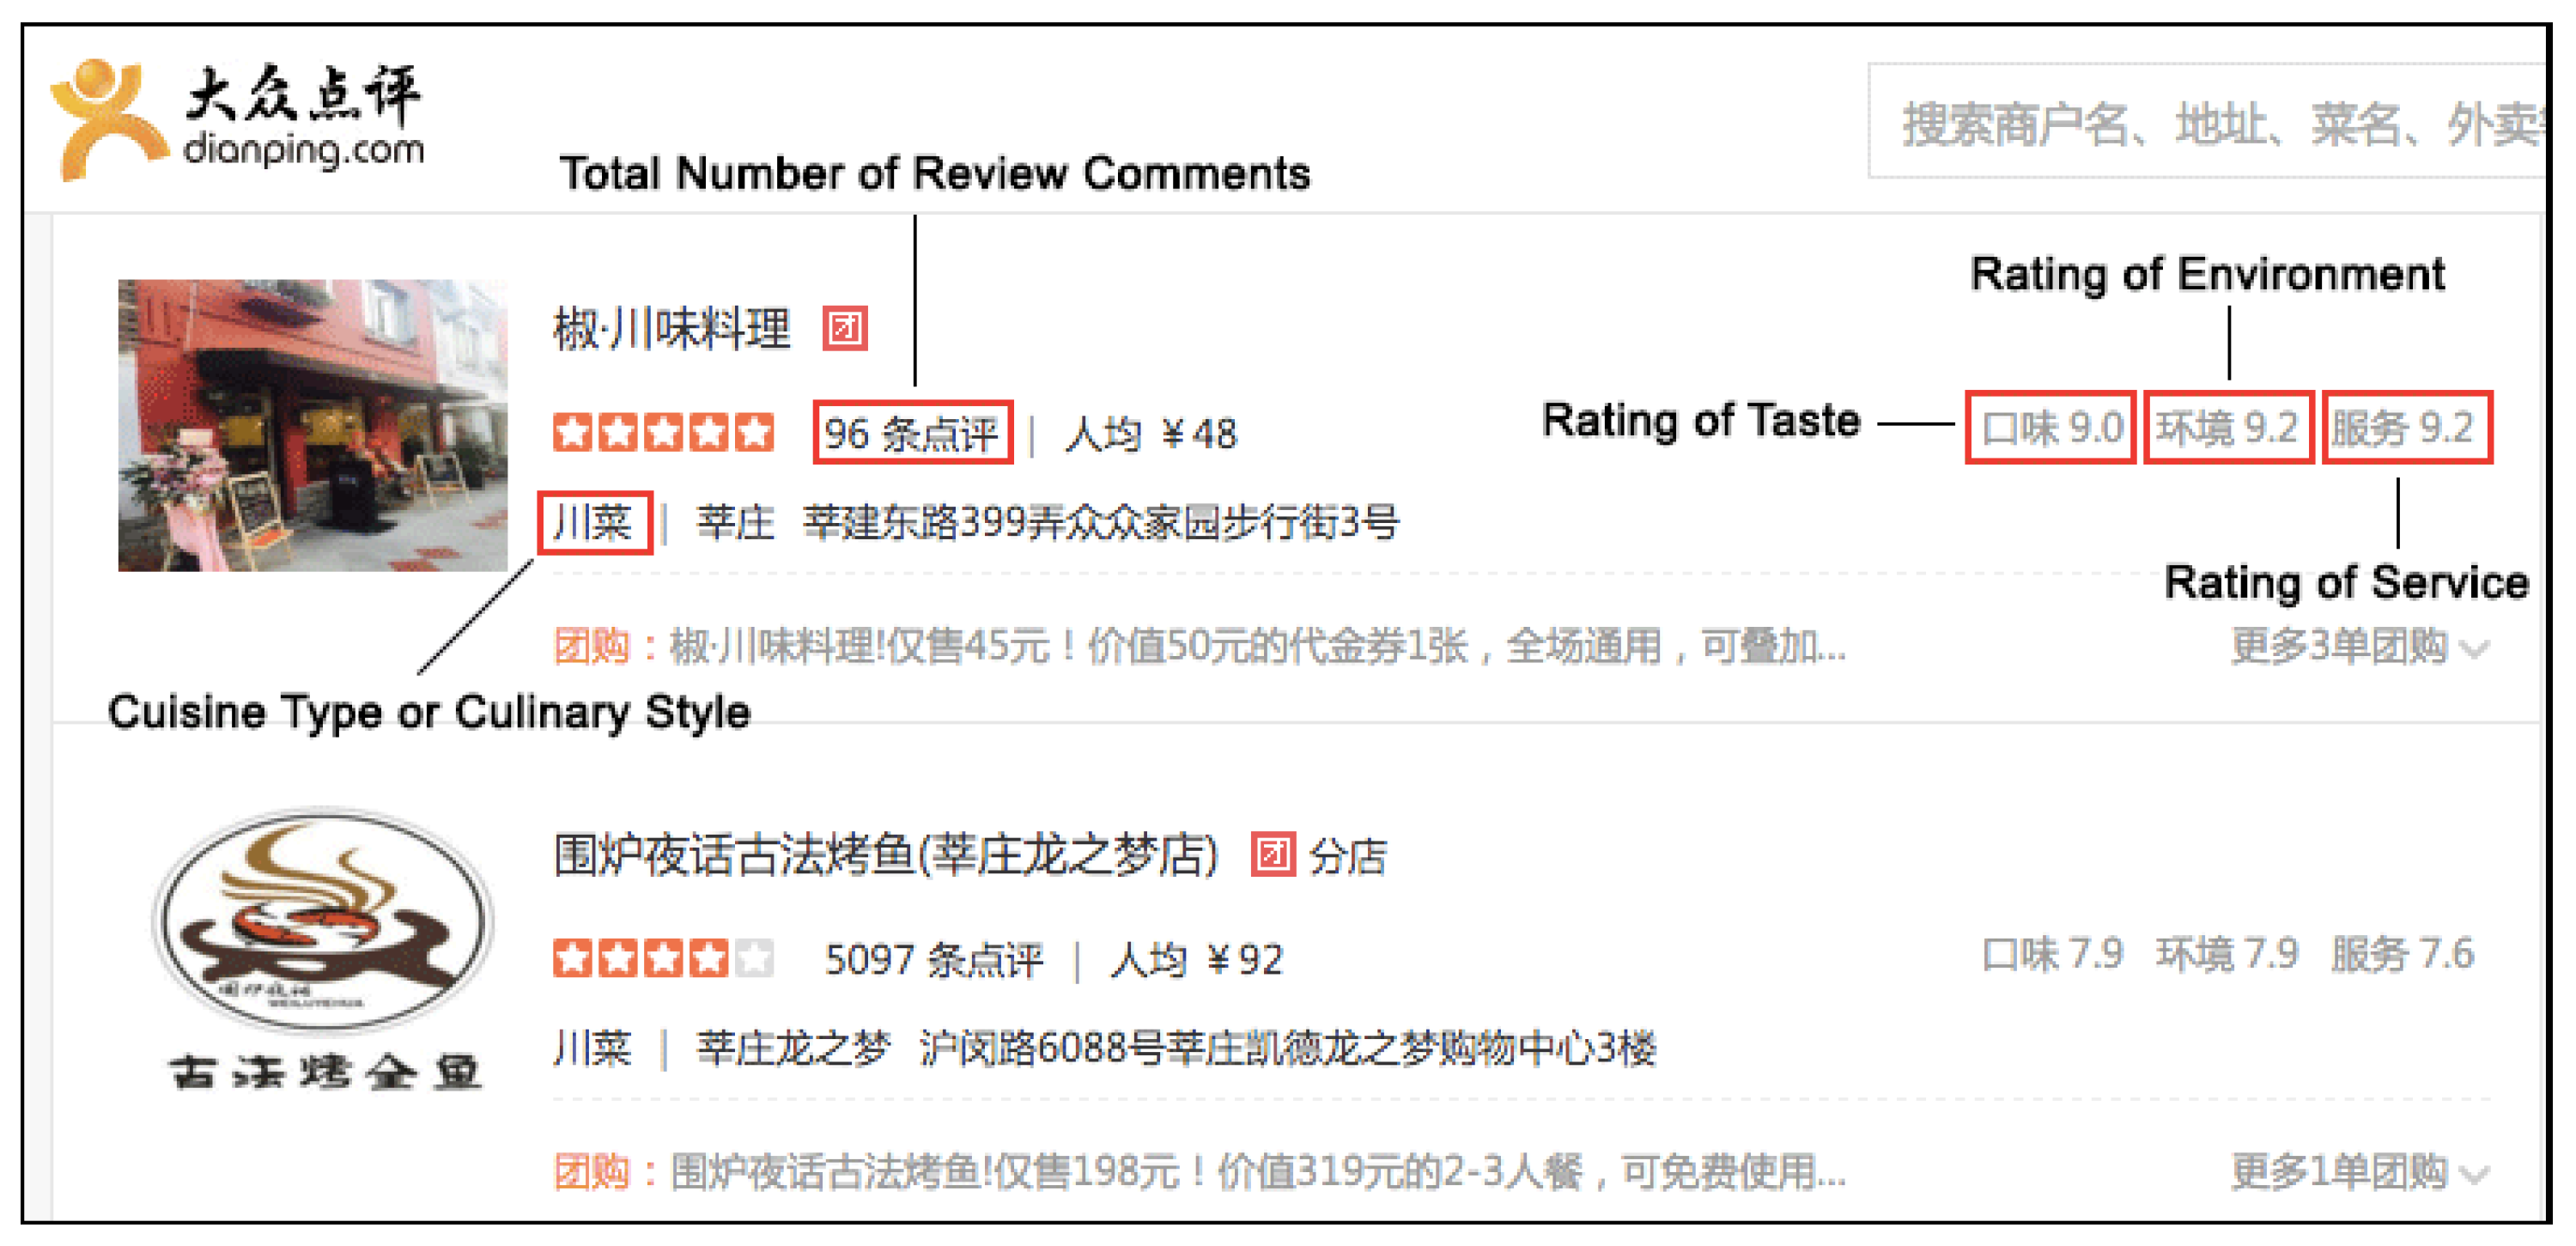
Dianping was founded in April, 2003. It is one of the leading websites in China that provides independent consumer reviews of local services, which include but are not limited to dining, movies, lodging, entertainment, sports, health care, and home renovations [47]. Similar to other food review websites (Yelp—https://www.yelp.com/sf, Tabelog—https://tabelog.com/en/, etc.), Dianping offers a platform for customers to browse and comment on various restaurants. These consumer reviews reflect individuals’ impressions on local services. For example, a consumer could leave review comments and personal ratings through Dianping to a restaurant where he or she had dinner before. The data set used in this study, which was captured from Dianping using a web crawler between 9 December 2015 and 14 February 2016, consists of 1.4 million restaurants located in 31 cities in China. As illustrated in Figure 1, these cities cover four municipalities (i.e., Beijing, Tianjing, Shanghai, and Chongqing) and the capital city of twenty-two provinces and five autonomous regions in China (the structures of the corresponding web pages for HongKong, Macau, and Taipei are different from the remaining capital cities in the mainland China. The data of restaurants in these three cities is maintained differently from other ones. Hence, we do not incorporate them into this study). For each individual restaurant, as illustrated in Figure 2, the following information was recorded: (1) a tag that indicates its cuisine type or culinary style; (2) ratings of taste, environment, and service (range of score: 0–10) that are calculated as the weighted average of individual customers; (3) total number of review comments by the time the data was collected; and (4) the name of the city where the restaurant is located.
4. Diversity of Restaurants and Similarities between Cities
4.1. Reclassification of Restaurants
To examine the diversity of each city’s restaurants and the similarities between cities, the first step is to associate each individual restaurant to a particular cuisine type or culinary style. Although such information is already presented in this data set, it is not appropriate to use them directly, and the reasons are as follows. First, in the raw data set, different tags (of restaurants) might belong to the same regional Chinese cuisine or culinary style based on their semantics or definitions. For example, the following tags—“Yuecai”, “Yuecaiguan”, and “Chaoshancai”—all refer to Yue (i.e., Cantonese Cuisine), which is one of the China’s eight major regional cuisines [48]. Second, some restaurants are tagged by cooking styles or signature dishes rather than specific cuisine types. For instance, tags such as “Sichuan Hotpot” and “Chongqing Hotpot” should be regarded as part of Chuan (i.e., Sichuan Cuisine), which is also a popular regional Chinese cuisine.
By performing a restaurant reclassification based on the semantics of these tags as well as the definition of various regional Chinese cuisines in [43,48], we manually group 292 unique tags from the raw data set into 25 major types. As shown in Table 1, type 1 to type 19 refer to regional Chinese cuisines, such as Chuan, Yue, Xiang, etc. Types 20 to 23 (i.e., Fast Food, Street Food, and Barbecue) do not belong to any regional Chinese cuisines. However, they each account for a considerable proportion of the restaurants. Type 24 covers all foreign cuisine types and culinary styles (e.g., Japanese Food, South Korean Dishes). As the restaurants which belong to this category only account for 4.58% of total restaurants in the data set, we do not further distinguish each foreign cuisine type, and we simply consider them as a single class (i.e., Foreign). Type 25 includes the remaining Chinese cuisine types and culinary styles that are relatively unique, i.e., each cuisine type with a percentage of total restaurants less than 0.1%. As illustrated in Table 1, each of the regional Chinese cuisines (i.e., type 1 to 19)—except Chuan—accounts for a limited proportion of total restaurants in this data set, while other types (i.e., type 20 to 25) share a large proportion of the market.
4.2. Diversity of Restaurants by City
What people eat in their everyday lives is closely related to the local food culture, demographic characteristics, and economic development. In this section, we explore people’s dining options in each individual city by measuring the diversity of restaurants. Note that, in this particular analysis, we only consider restaurants that serve regional Chinese cuisines (type 1–19) since other restaurants (type 20–25) belong to more general categories. In addition, given the large market shares of other types (type 20–25 shown in Table 1), they could easily affect the analysis results by blurring the influences that regional Chinese cuisines exert on cities’ overall diversity. After removing those restaurants and performing a normalization, the percentage of restaurants that serve regional Chinese cuisines in a given city can be represented as a vector C:
where denotes the percentage of restaurants which belongs to type i (note that ), and i denotes the unique ID of the cuisine type or culinary style as shown in Table 1 (e.g., refers to the percentage of restaurants which belong to Lu).
This study adopts the Shannon Entropy to measure the diversity of restaurants in each individual city. The Shannon Entropy has been widely used in information theory to quantify the information contained in a message or the randomness of the input data [49] . Note that the diversity of restaurants in a city can be measured as the Shannon Entropy (H) of the corresponding vector C:
The larger H is, the more diverse the city’s restaurants are.
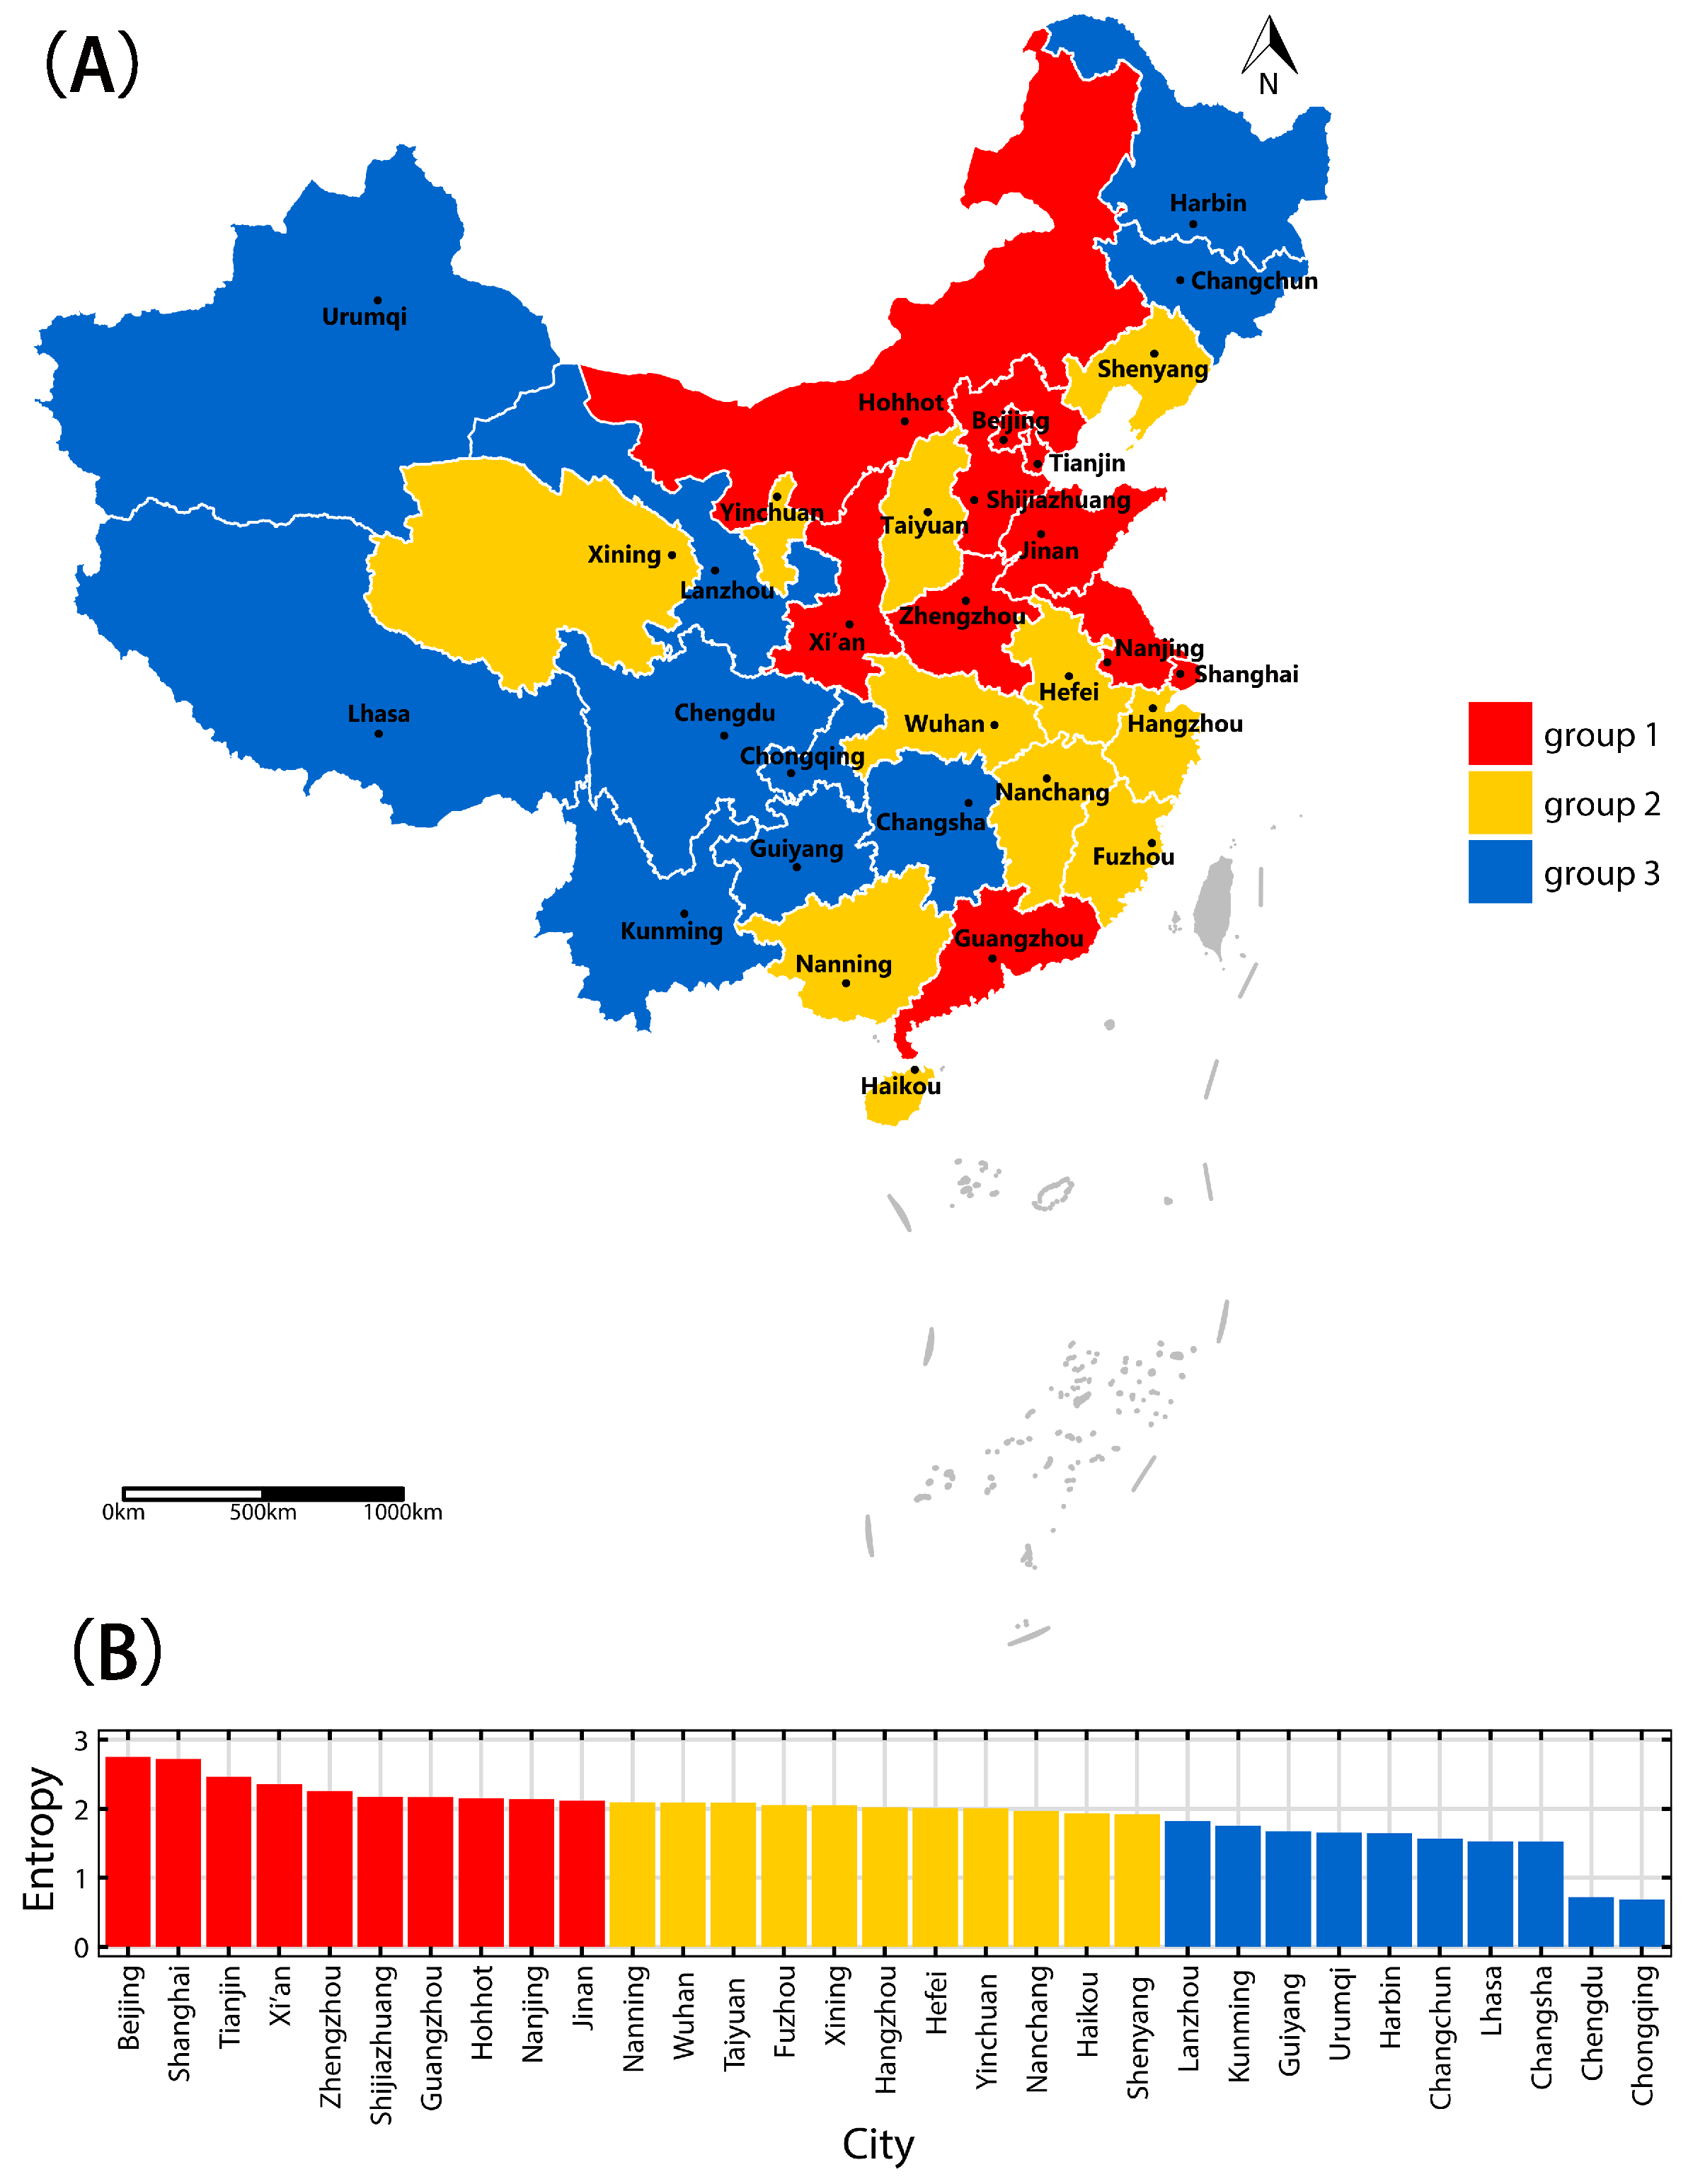
Figure 3 shows the entropy of the 31 cities and their geographic patterns. To distinguish cities with different cuisine characteristics, we order them by their entropy values in descending order and divide them into three groups (Figure 3A). Each group of cities is marked with a specific color on the map (Figure 3B). According to our analysis, cities with a high entropy (group 1), also known as high diversity, are mainly located in northeastern China, while those with a low entropy/diversity (group 3) are mainly in the western part. The east–west contrast of the cities’ entropy is in general agreement with the economic divide in China. Since 1978, the cities in eastern China, especially the ones within coastal regions, have achieved rapid economic growth due to the Chinese economic reform [50]. However, the western half of China has fallen behind. Although the Chinese government proposed a development strategy in 1999 to boost the economy of western China [50], the geographic imbalance of China’s economy is still noticeable today. It appears that the diversity of restaurants in a city is partially shaped by its economic development.
By further investigating individual cities, we find that the most diverse three cities by entropy refer to three municipalities in eastern China, Beijing (), Shanghai (), and Tianjin (). The GDP rankings of these three cities in 2016 stand at 1st, 2nd and 5th places, respectively, among all the capital cities and municipalities under direct supervision of the Chinese central government. The statistical annual GDP of a list of cities in China can be obtained from official website: National Bureau of Statistics of China (http://data.stats.gov.cn/english/easyquery.htm?cn=E0105). The two most developed cities in China, Beijing and Shanghai have populations of more than 20 million each, over one third of which are migrants. Guangzhou, which is also in group 1, high entropy, is one of the largest cities along the coastal. It holds the 3rd place in 2016 GDP ranking, and 36% of its population were migrants. Economic prosperity and the social mix in these cities serve as potential driving forces of restaurant diversity.
The cities with a low entropy can be divided into two general types. The first group of cities such as Chongqing, Chengdu and Changsha have a large proportion of restaurants that serve the local cuisine, i.e., the regional cuisine that originates from the corresponding province. Chuan cuisine, the local cuisine of Sichuan and Chongqing, accounts for 90% and 91% of the total restaurants (that serve the regional cuisines) in these two cities (see Appendix A.1). A low level of restaurant diversity in these cities is largely influenced by the strong development of the local cuisine. The other group of cities such as Urumqi, Lhasa, Kunming, Harbin, and Changchun are located in geographically-isolated areas. Lhasa and Urumqi are less developed areas, with their GDPs in 2016 ranked the lowest and the 6th-lowest, respectively. In northern areas such as Harbin and Shenyang, farming is constrained by natural factors such as adverse weather and shortage of water resources [51]. It is likely that a self-sustained agriculture system and relatively limited local food products in these northern cities are driving factors of a low level of culinary diversity.
Note that we have also used another diversity index, the Gini–Simpson index [52], to test our findings and we observe a high correlation between the two measures (Pearson’s r = 0.944), which indicates the robustness of our analysis result.
4.3. Similarities between Cities
We next compute, for each city, the percentage of restaurants by type and explore the similarities between them. As shown in Table 1, the derived cuisine types and culinary styles can be divided into two main categories, which are regional Chinese cuisines (i.e., types 1 to 19) and other culinary styles (e.g., types 20 to 25). Again, it would be meaningful to distinguish these two categories when analyzing cities’ similarities.
Figure 4 (right part) illustrates the percentage of restaurants in each city organized by regional Chinese cuisines. The rows of the heat map denote each individual city and the columns denote the regional Chinese cuisines. The color of a grid cell denotes the percentage of the corresponding cuisine type in a city. For most of the cities, the percentages of the majority of cuisine types are relatively small (i.e., less than 5%), while few cuisine types occupy a considerable proportion of the market. We find that most of the cities tend to exhibit strong local characteristics. In general, the local cuisine type, which originates from a particular region (e.g., province), tends to account for a large proportion of restaurants in the corresponding capital city. This indicates the dominant position of local cuisines in its origins. For example, Originated in Shandong province, Lu dominates in the capital city Jinan. Chuan, which comes from Sichuan province, occupies a large market in Chengdu and Chongqing.
We next explore the similarities between cities using the agglomerative hierarchical clustering algorithm [53]. Specifically, the distance between two cities is calculated as the Euclidean distance between their corresponding vectors:
During the clustering process, the distance between any two clusters is calculated using the average linkage method [53]. Figure 4 (left part) shows the clustering result in the form of a dendrogram. The height of each branch point indicates how different the leaves (i.e., cities) are from each other. The higher the value (of height), the greater the difference. By observing the dendrogram, we find that some cities are merged together to form small subgroups during the first few steps of the clustering process: (1) Shenyang, Harbin and Changchun (with Dongbei as their local cuisine type); (2) Yinchuan, Lanzhou, Xining and Urumqi (with Islamic as local cuisine type); (3) Kunming and Guiyang (with Yungui as local cuisine type); (4) Chongqing and Chengdu (with Chuan as the local cuisine type). Each of these subgroups refer to cities that are geographically close to each other (Figure 3A), and in which the local Chinese cuisine accounts for a large percentage of the total restaurants. However, once these subgroups are formed, the remaining cities or clusters are grouped with each other following a stepwise process. The “step-like shape” of the dendrogram indicates that no big city groups are formed during the clustering process. Instead, most of these cities have their own unique characteristics, which are largely driven by the prevalence of the local Chinese cuisine.
To better understand the cities’ similarities within a geographic context, we examine the relationship between similarity and geographic distance. First, we compute the normalized similarity between any of the two cities:
where D refers to the Euclidean distance (i.e., dissimilarity) between the city pair calculated based on Equation (3), and refers to the maximum value of dissimilarity among all city pairs (i.e., Chongqing—Changsha in this analysis). In this analysis, we use straight-line distance to reflect how far two cities are from each other.
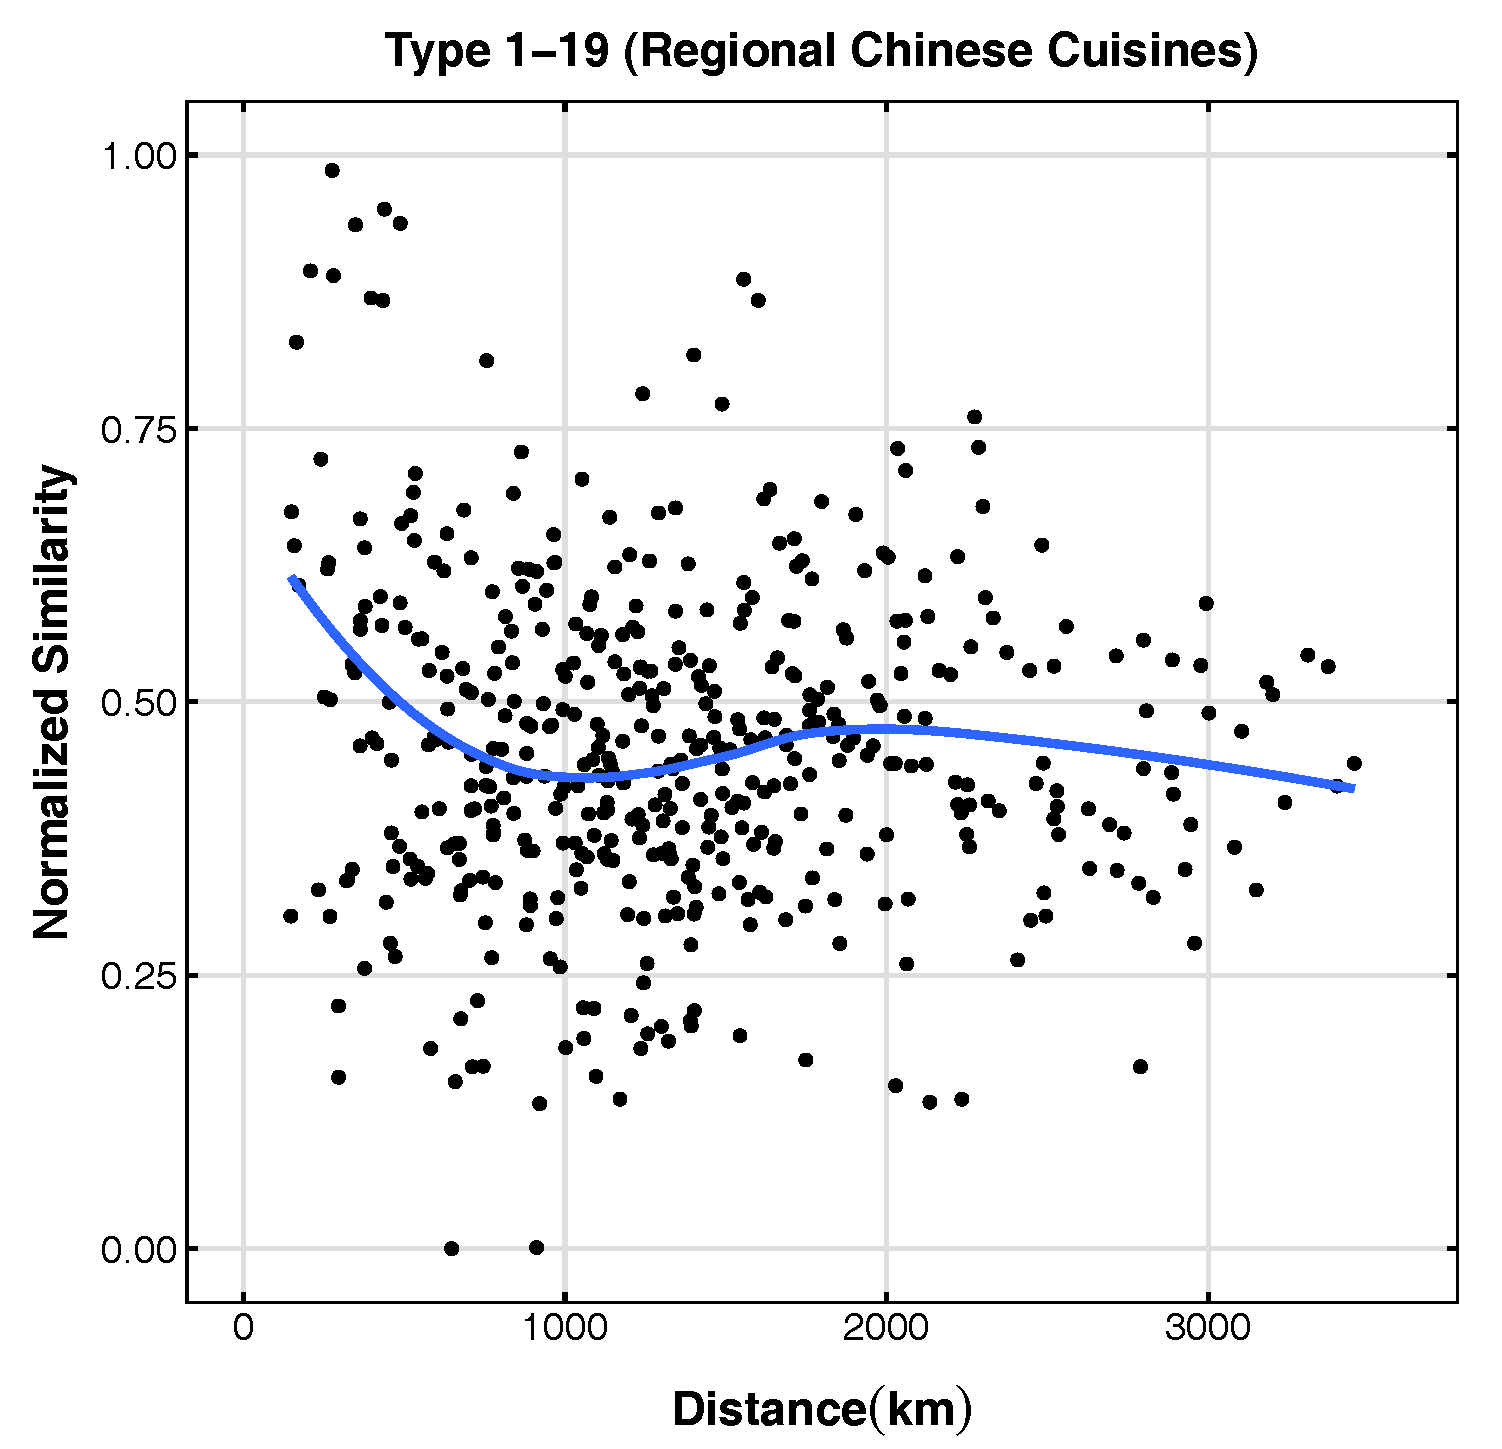
Figure 5 illustrates the relationship between cities’ similarities and their geographic distances. Here, each point in the plot refer to a pair of cities. In general, the normalized similarity at different distance values are relatively close to each other, indicating that similarities tend not to decay with geographic distance. The dispersion of points in short distances in scatter plot also suggests that cities that are geographically close to each other can also be very different. The result reaffirms that the local Chinese cuisines play an important role in shaping the characteristics of restaurants in the 31 cities.
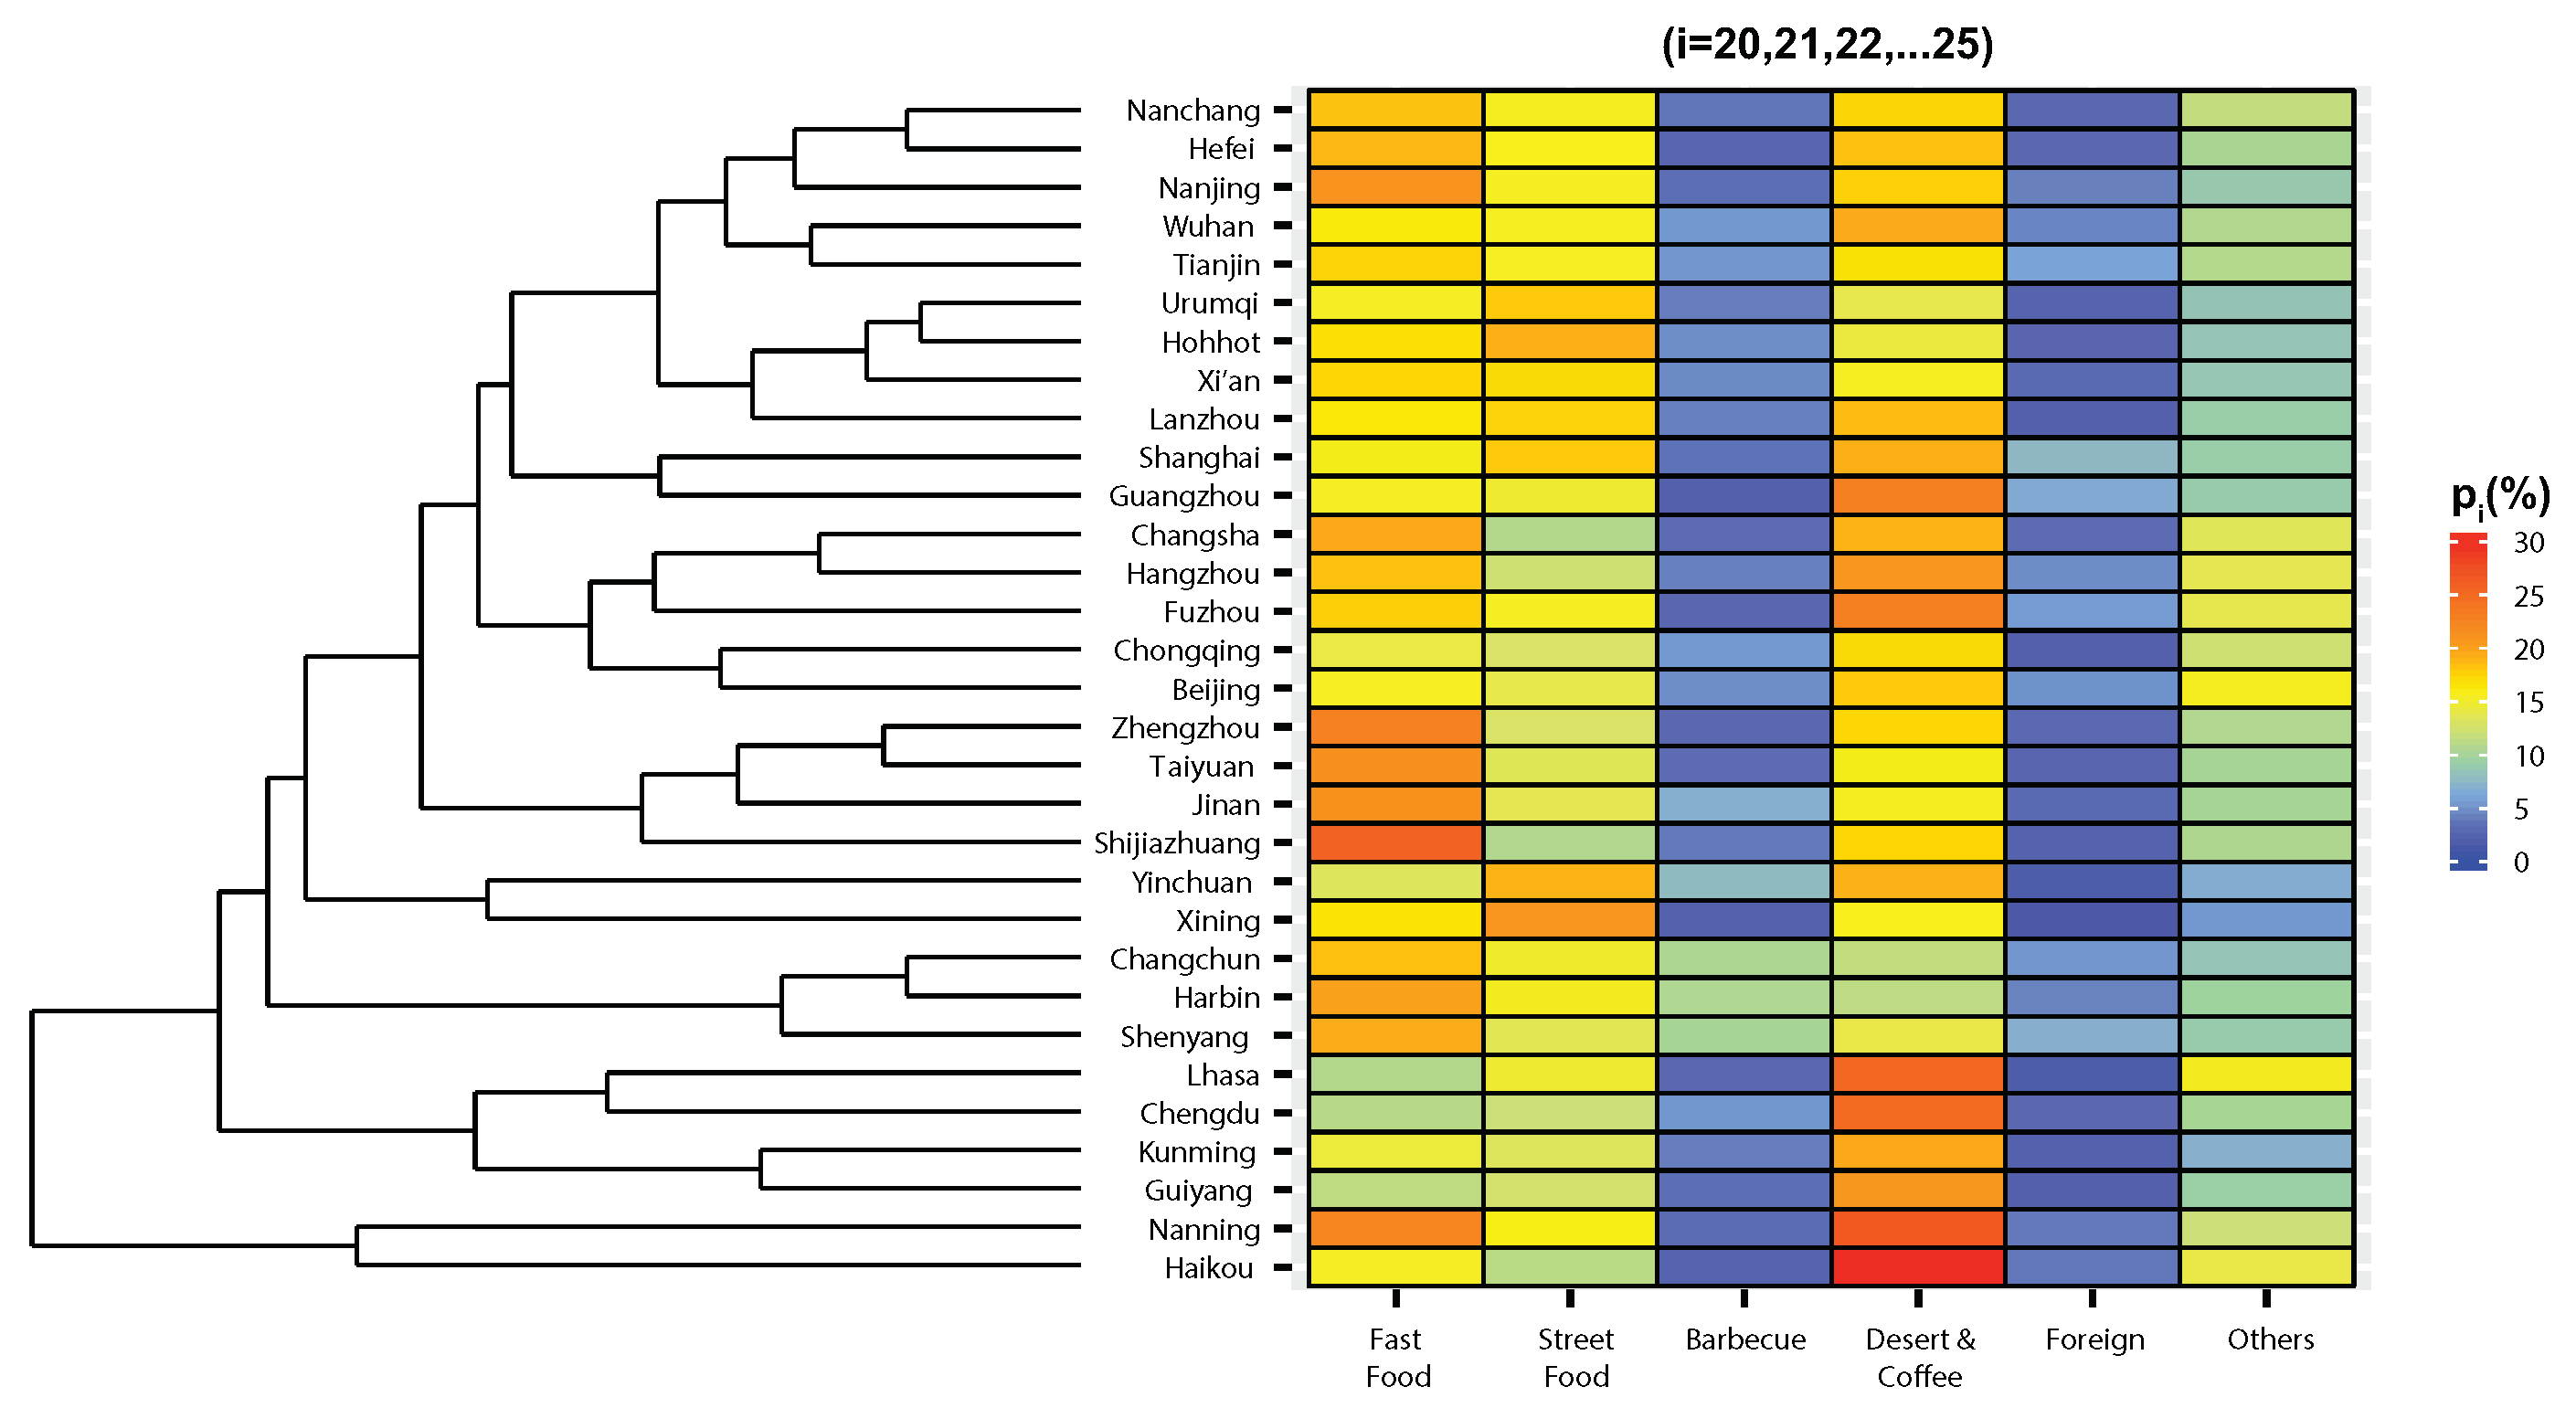
We next examine cities’ similarities based on the other six types of culinary styles (i.e., types 20 to 25). As shown in Figure 6 (right part), compared to most regional Chinese cuisines that dominate in a few cities, the proportion (over all the cuisine) of these culinary styles, such as Street Food, Barbecue, and Foreign, are more uniform across the cities. However, some notable differences between the cities are worth discussing. For example, some cities in northeastern China (e.g., Changchun, Harbin and Shenyang) have more restaurants in Fast Food than in Dessert & Coffee, while certain cities in western China (e.g., Lhasa, Chengdu, Kunming and Guiyang) exhibit opposite characteristics. As Fast Food are prepared and served quickly at restaurants while Dessert & Coffee correspond to places that are more relaxing, it would be interesting to investigate if the life styles or the working pace of people in these two city groups are different from each other. We also find that cities with a higher GDP per capita (e.g., Tianjin, Shanghai, Guangzhou and Beijing) tend to have more Foreign restaurants than other ones. With rapid economic development after China’s economic reform, these major Chinese cities start to attract foreign investments and food imports, which potentially drives the proliferation of western-style restaurants [54].
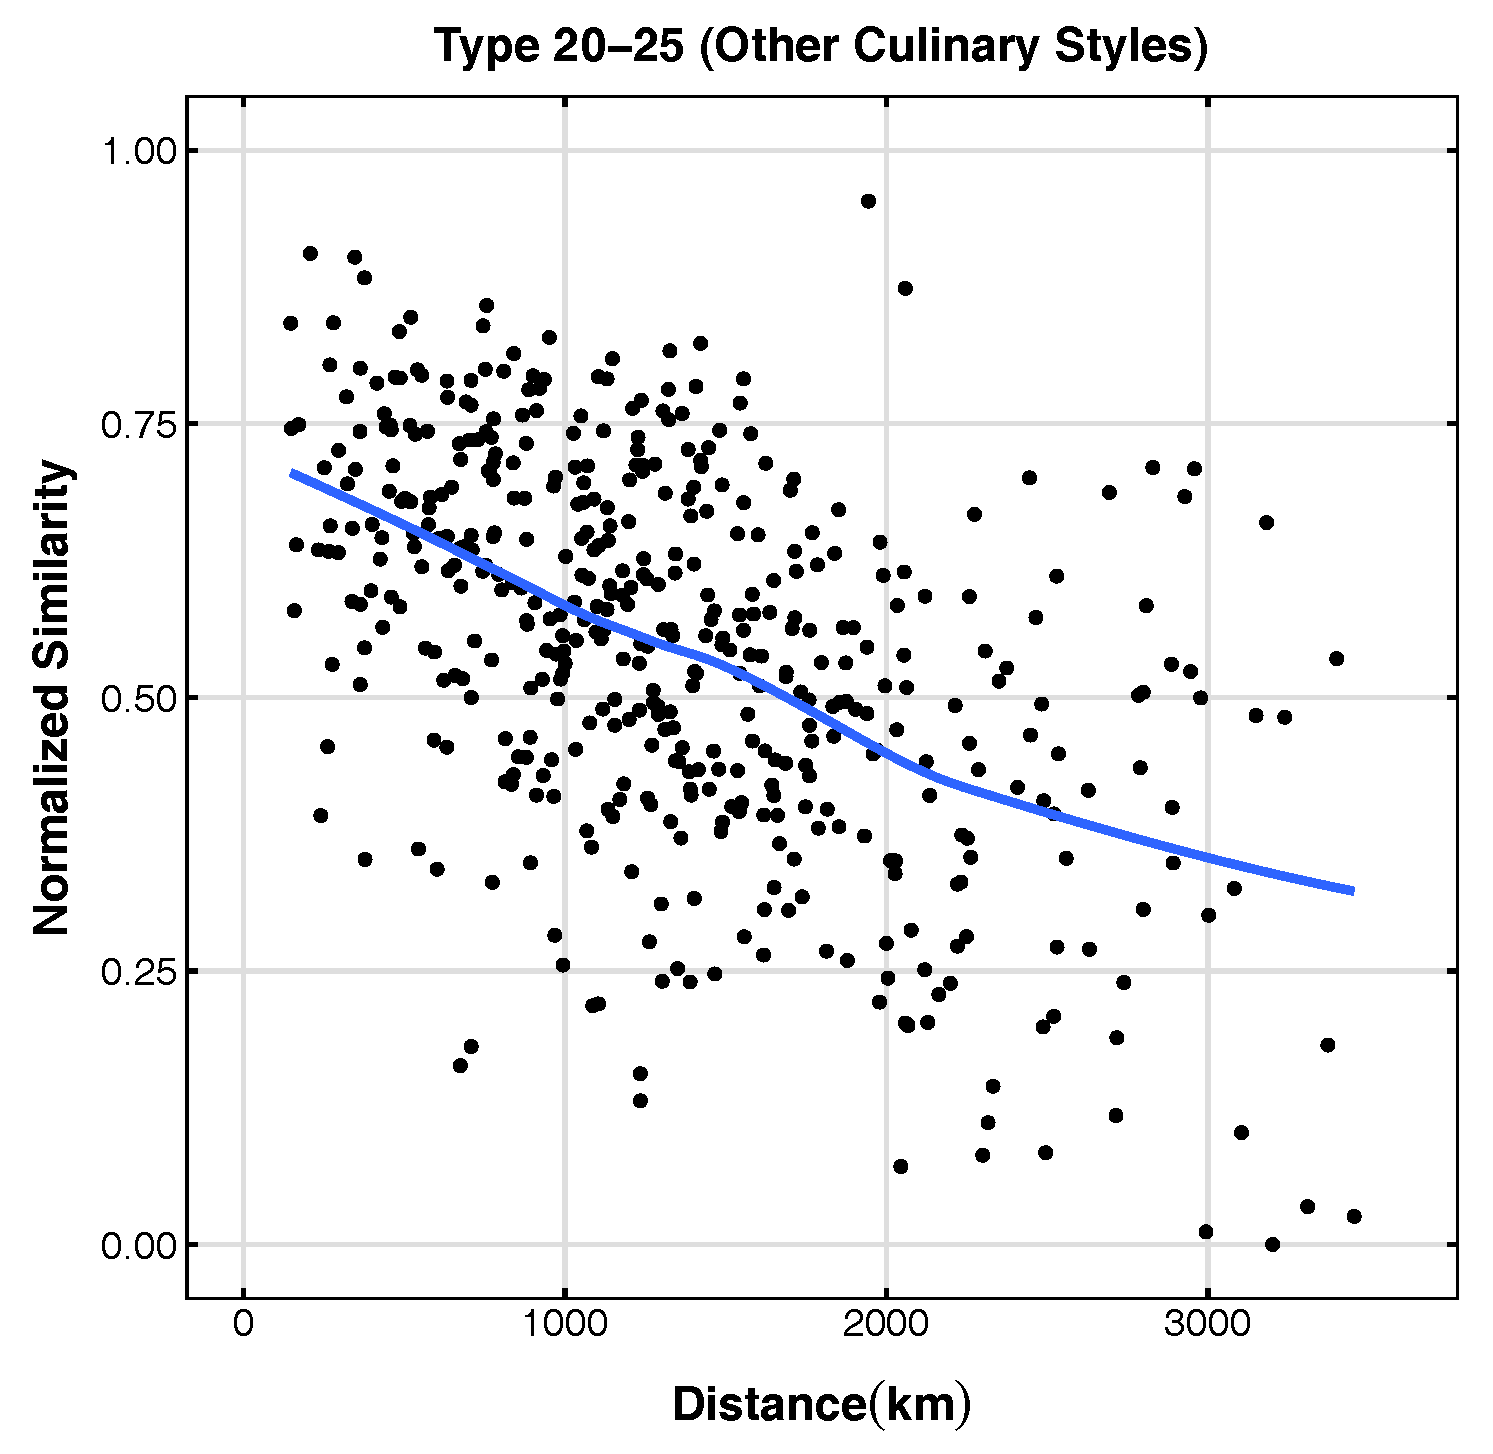
The dendrogram (left part of Figure 6), which is produced using the same hierarchical clustering algorithm, shows that a few city groups (e.g., Nanchang—Hefei; Urumqi—Hohhot; Zhengzhou—Taiyuan; Changchun—Harbin—Shenyang; Kunming—Guiyang) are merged together during the first few steps of the clustering process. Like what we observe in Figure 4, the cities in these subgroups are usually close to each other in geographic space. However, this dendrogram is different from the one in Figure 4, in the way that more small city groups are formed together. Again, by plotting the cities’ similarities against their straight-line distances (Figure 7), we find that cities that are closer to each other tend to be more similar than the ones that are far apart. The comparison between Figure 5 and Figure 7 indicates that there exist two different geographic processes that govern the characteristics of the restaurants in the 31 cities. More importantly, individual cities are characterized more by the restaurants that serve regional Chinese cuisines (i.e., types 1–19) than by the ones that belong to other culinary styles (i.e., types 20–25).
5. Geographic Prevalence of Regional Chinese Cuisines
When measuring the similarities between cities using regional Chinese cuisines (Figure 4), we find that certain cuisine types (e.g., Chu and Min) exhibit strong local characteristics, while some other types (e.g., Chuan) tend to spread across various cities in China, which suggests that the geographic prevalence of regional Chinese cuisines could vary significantly from each other. In this section, we introduce a weighted distance measure to quantify the spatial dispersion of each regional Chinese cuisine. First, we extract the origin of each cuisine type as the corresponding province/municipality, as shown in Table 1. For example, the origin of Yue is assigned to Guangdong province, and Min is matched to Fujian province. For the cuisine types that originate from multiple provinces/municipalities, we merge the corresponding regions together and consider them as a single spatial object. For instance, Chuan will be matched to the combination of Sichuan province and Chongqing municipality. Note that Islamic cuisine is not included in this analysis since the cuisine originally came from predominantly Islamic countries.
Then, we extract the total number of restaurants by cuisine type. For each cuisine type i, we calculate the percentage of restaurants in each individual city, and a weighted distance is computed to quantify its spatial dispersion:
where n denotes the total number of cities in this study (); denotes the percentages of restaurants that serve cuisine type i in city j (note that ). denotes the origin of cuisine type i, and refers to the province/municipality where city j is located. We use the same geographic distance introduced in the previous section to compute , which is defined as the straight-line distance from to .
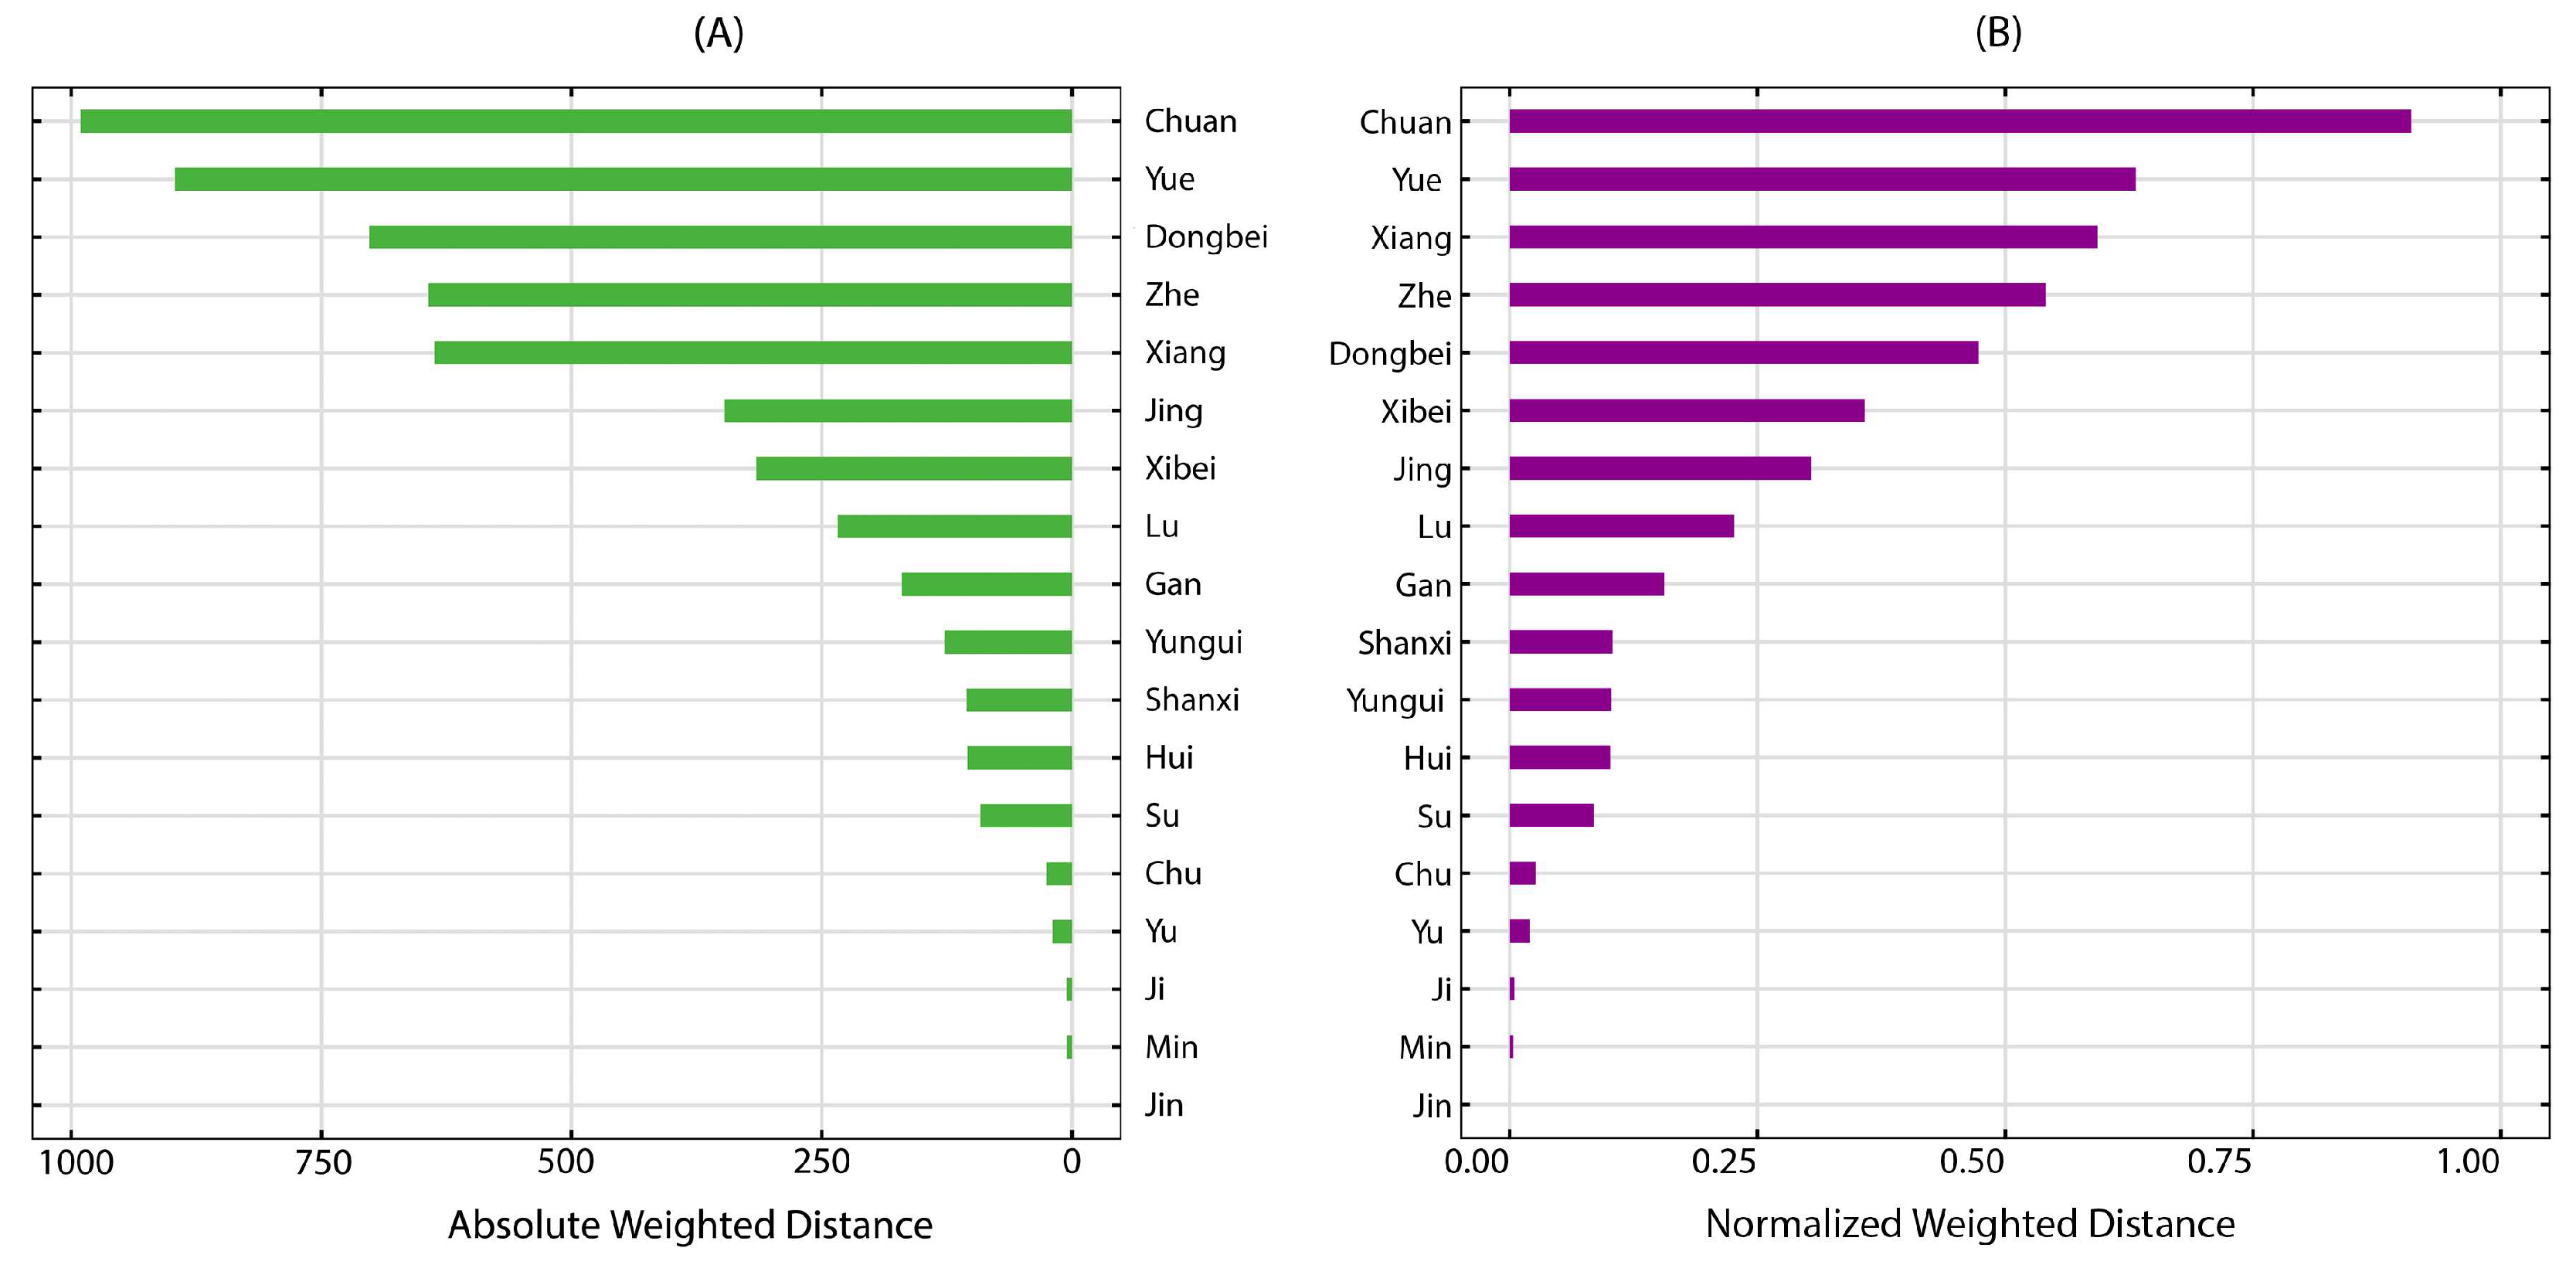
Figure 8A illustrates the weighted distance of each regional Chinese cuisine. According to the result, Chuan, which originates from Sichuan Province (and Chongqing Municipality), has the highest distance value (). Other cuisine types that have a relatively large distance value include Yue (), Dongbei () , Zhe (), and Xiang (). Some cuisine types, such as Chu, Yu, Ji, Min and Jin, have very small distance values, indicating that these cuisine types exhibit chiefly strong local characteristics and are mostly served in the areas where they originate. For example, some cuisine types that originate in the central part of China (e.g., Xiang) would have a smaller number of distant cities than other ones (e.g., Dongbei) when the weighted distance is computed. To avoid this bias, we compute a base-line distance value for each cuisine type i, by assuming that the restaurants that serve this particular cuisine are uniformly distributed across all cities:
We then compute the normalized weighted distance of each cuisine type i as:
As shown in Figure 8B, after controlling for geographic locations, the 18 types of regional Chinese cuisines still follow a similar order of spatial dispersion (as compared to that of the absolute weighted distance). We notice that great heterogeneity exists among China’s eight major regional cuisines [48] (i.e., Lu, Chuan, Yue, Su, Min, Zhe, Xiang, and Hui). Specifically, Chuan and Xiang, which are famous for their hot and spicy dishes, tend to be more widely distributed across the mainland China. These two cuisines are followed by Yue and Zhe, which are well known for their light and sweet tastes. However, the remaining four types of major regional Chinese cuisines, especially Su and Min, are far less widely dispersed from their origins. The China’s eight major regional cuisines exert extensive influences in Chinese food culture due to their unique cooking techniques and long histories. However, their state of development and geographic prevalence have changed dramatically along with time. Chuan and Xiang, which originated from central China, and Yue and Zhe, originating from coastal areas, are widely spread compared to the other four. Although other less well-known cuisines, such as Jing and Xibei, don’t have strong geographic prevalence, they show high potential for popularity. The difference in distance distribution reveals the problem of the unbalanced development of regional cuisine, especially the China’s eight major regional cuisines. Hence, it is crucial to know both the factor of deterioration and the strategies to preserve and promote these regional cuisines as part of national culture. Additionally, though some cuisines are widely spread, we are interested to know whether they are popular in different regions.
6. Characterizing Top-Tier Restaurants in Cities by Cuisine Type
When searching for dining places, the consumers, no matter whether local residents, migrants, or tourists, would naturally prefer to consider those with high ratings. It is thus meaningful to examine if certain regional Chinese cuisines dominate among the top-tier restaurants in a city to gain deeper insights into consumers’ preferences. To achieve this, we pick the top five Chinese cuisine types by restaurant number in each individual city, and use these restaurants to evaluate consumer’s preferences. We use only the top five cuisine types because they on average account for 93.8% of the total restaurants (that serve regional Chinese cuisines) in the corresponding city (Table 2). We sort them in descending order and the local cuisines are marked with asterisks. As shown in Table 2, all the local cuisines come within the top 5. The predominant cuisine in each city is either Chuan or the local cuisine—such that Chuan cuisine ranks the first in 20 cities. Although local and Chuan cuisine form the majority of restaurants, the customers’ preference must be considered based on review comments. For the selected restaurants in a city, we rank them by ratings of taste (T) and we consider only the top 20 percent of restaurants in each city as top-tier restaurants. We use only the ratings of taste (T) to rank restaurants because through an exploratory analysis, we find that the correlations among the three types of customer ratings (taste (T), environment (E), and service (S)) are extremely high in every individual city. The average value of Pearson’s correlation coefficient between any of the two indices is 0.99 (see Table A2 in Appendices). We choose the top 20 percent of restaurants in each city because their mean and median values of T are notably higher than the remaining 80 percent of the restaurants (see Table A3).
A popularity index () based on location quotient is then computed for the five cuisine types in each individual city. For a cuisine type i, the popularity index is computed as the percentage of type i restaurant in the top-tier , normalized by its overall percentage in all the restaurants in the same city:
An index greater than one indicates that cuisine type i is overrepresented among the city’s top-tier restaurants. A value of one describes that the percentage of type i restaurants is equal to its overall percentage in the city, while an index smaller than one suggests that the cuisine is underrepresented among the top-tier restaurants.
Table 3 illustrates the popularity index () of the selected regional Chinese cuisines in the 31 cities. We find that there are hardly any cities of which the indices are uniformly distributed (i.e., all close to one), indicating consumers’ preferences for certain cuisine types. For example, in Beijing, Chuan and Xiang account for more top-tier restaurants as compared to their overall percentages, while Jing, the local cuisine of Beijing, is less favored by the consumers. We find that in many cities, especially some northern and western ones (e.g., Beijing, Changchun, Harbin, Kunming, Lanzhou, Shenyang, Shijiazhuang, Taiyuan, Tianjin, Urumqi, and Yinchuan), the popularity index of the local cuisine is smaller than one, indicating that local foods in these cities are less popular.
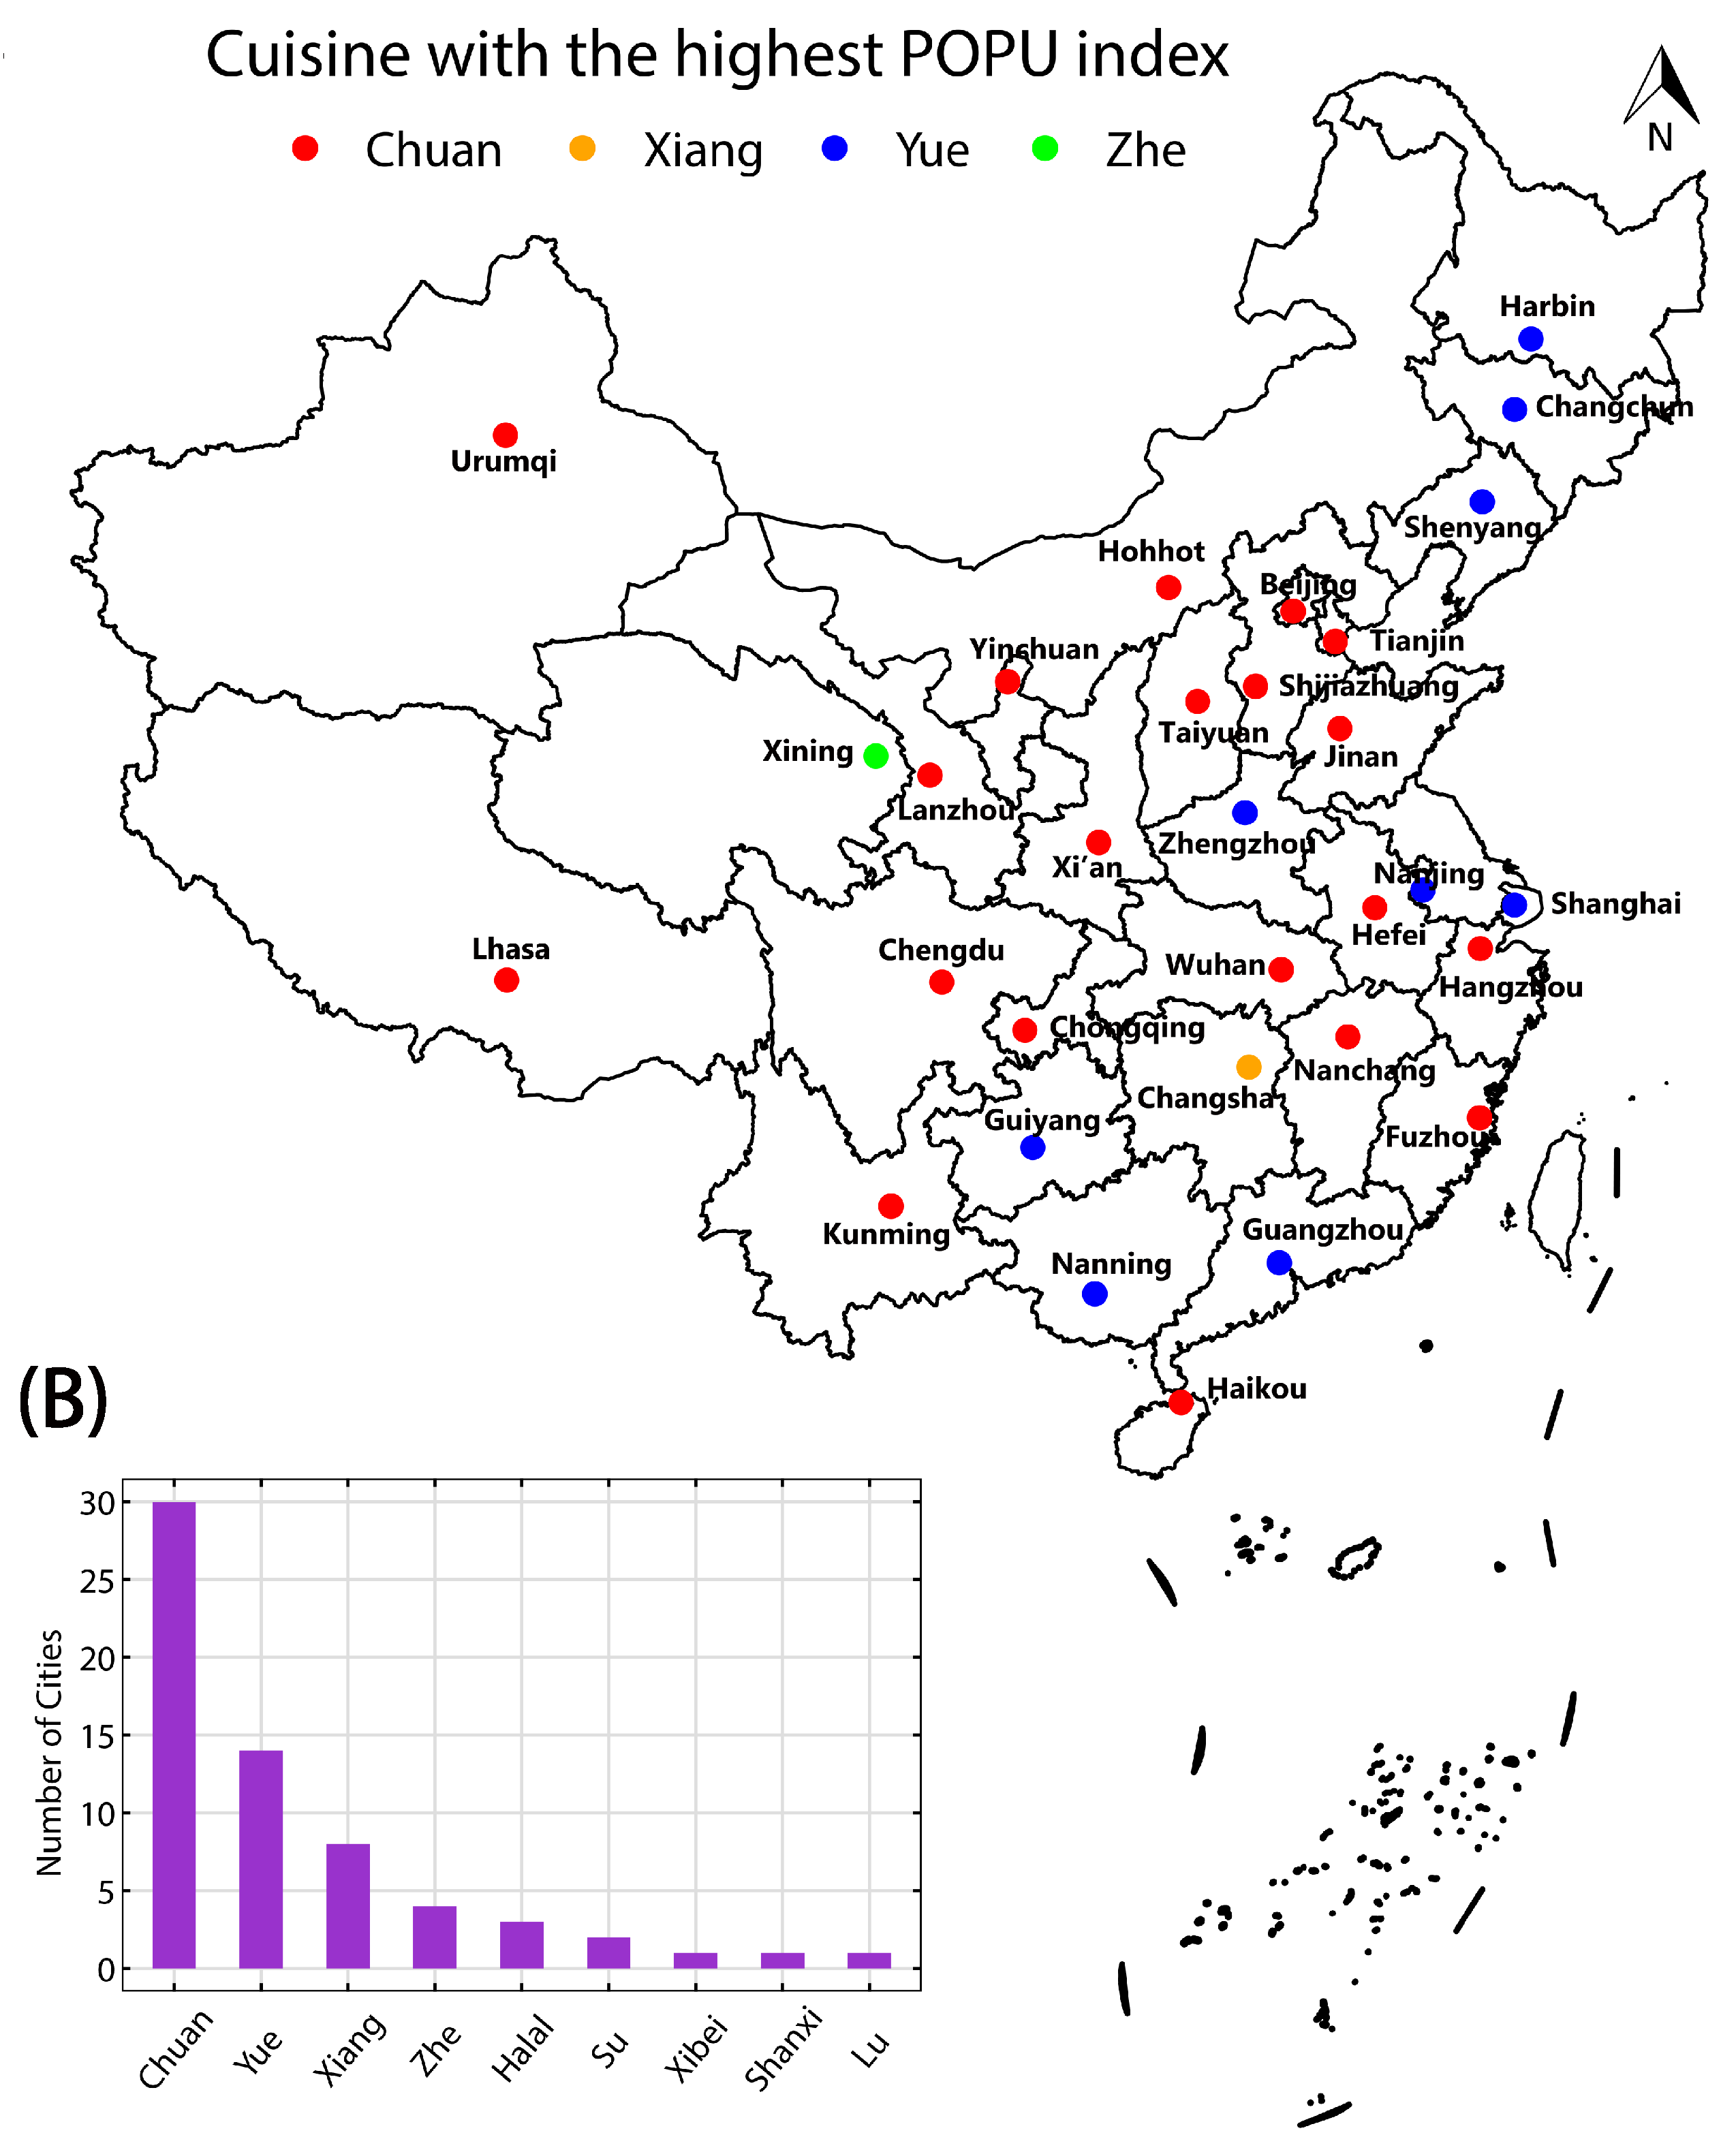
We also notice that certain cuisine types are favored by consumers in many different cities. For example, as shown in Figure 9A, Chuan has the highest popularity index in 20 cities across different parts of China. Yue is ranked 1st in nine cities, which are mainly located in southeastern China. By further summarizing the information in Table 3, we derive the number of cities where each cuisine is popular in the top-tier restaurants (i.e., with index greater than one). As shown in Figure 9B, only nine (out of 19) cuisine types are popular in at least one city, and six of them are among the China’s eight major regional cuisines [48]. Moreover, the distribution is highly skewed towards a few cuisine types such as Chuan, Yue, Xiang, and Zhe.
The results on the popularity index and the cuisines’ geographic prevalence are worth discussing. By examining Table 3, we find that, in cities such as Hangzhou, Hefei, Jinan, Nanchang, Xi’an and Yinchuan, the local cuisine is relatively popular. Most of these cities, as shown in Figure 3C, have a small percentage of non-residents. The dominance of local population in these cities potentially contributes to the popularity of local food. On the other hand, as suggested by a study conducted in west Germany [55], local foods are not always favored, especially for dining out activities. The decreasing relevance of local cuisine in some cities in this research (e.g., Beijing, Changchun, and Tianjin as shown Table 3) signifies the trend of internationalization and diversification.
The other thing worth noting is that some cuisine types, such as Chuan and Yue, are popular in the sense that they not only stand out in most of the cities’ top-tier restaurants, but also have a wide geographic coverage. As suggested by [27], the evolution of Chuan dates back to the ’Yuan’ dynasty. During that time, the government devoted tremendous efforts to attracting migrants to Sichuan. The increasing number of migrants over the years results in a cultural diversity that contributes to the inclusiveness of Chuan cuisine. In other words, domestic migration seems to play a vital role in shaping consumers’ overall preferences for food type and taste.
7. Discussion and Conclusions
People’s dining activities and their perceptions on food are useful indicators of societal well-being. The culinary structure and diversity of cities, as suggested in this research, are not only affected by the local food culture, but also the socioeconomic transformations of cities that lead to the diffusion of various cooking traditions. Despite their great implications for urban development and public health, the culinary scenes of cities are not always easy to capture. This is partly due to the traditional data collection techniques (e.g., surveys) that are resource- and time-consuming. Using a data set captured from one of the largest online review sites in China (www.dianping.com), this study performs an exploratory data analysis to gain insights into the geographic prevalence and mix of regional cuisines in Chinese cities. The study demonstrates the use of social review data as a cost-effective approach of studying urban gastronomy and its relationship with human activities.
Based on the data of millions of restaurants collected in selected cities (i.e., provincial capitals and municipalities under direct supervision of the Chinese central government), we first measure, by each individual city, the diversity of restaurants that serve regional Chinese cuisines using the Shannon entropy. We observe an “east–west” contrast of restaurant diversity, which is in general agreement with the economic divide in China.
To further distinguish cities with different characteristics, we order them by their entropy values in descending order and divide them into three groups. We find that the top three cities in the first group are Beijing, Shanghai and Tianjin, which are three municipalities under direct supervision of the Chinese government in China. The 2016 GDP of these three cities rank 1st, 2nd and 5th, respectively, among all cities included in this study. Economic prosperity serves as a potential driving force of restaurant diversity in these cities. The cities with a low entropy can be divided into two general groups. The first group of cities, such as Chongqing, Chengdu, and Changsha are dominated by restaurants that serve the local cuisine. The other group of cities such as Urumqi, Lhasa, Kunming, Harbin, and Changchun are located in geographically-isolated areas. It is likely that the dominance of local cuisine as well as a city’s location relative to other cities are important factors that shape people’s dining options. The results suggest that the cuisine scope and cuisine diversity across the cities are closely related to their underlying socioeconomic development level.
To understand the culinary structure of cities and their interrelationships, we apply a hierarchical clustering algorithm to examine similarities of consumers’ dining options among these cities from two perspectives: (1) restaurants which serve regional Chinese cuisines, and (2) restaurants that belong to other culinary styles (i.e., types 20 to 25 in Table 1). The results suggest that cities are more characterized by restaurants that serve regional Chinese cuisines than by the ones belonging to other culinary styles. When measuring cities’ similarities based on regional Chinese cuisines, a “step-like shape” of the dendrogram indicates that most of the cities have their own unique characteristics, which are mainly driven by a large market share of the corresponding local Chinese cuisine.
By associating each regional Chinese cuisine to its origin, we introduce a weighted distance measure to quantify the geographic prevalence of each cuisine type. The results suggest that great heterogeneity exists among the regional Chinese cuisines. In particular, Chuan and Xiang, which are famous for their hot and spicy dishes, tend to be widely distributed across the mainland China. These two cuisines are followed by Yue and Zhe, which are well known for their light and sweet tastes. Certain cuisine types, such as Chu, Ji, Yu, Min and Jin, exhibit very strong local characteristics (i.e., with distance values close to zero). The results indicate that the geographic prevalence of regional Chinese cuisines vary significantly from each other.
Finally, we introduce a popularity index () to quantify consumers’ preferences for different regional Chinese cuisines. We find that, among the top-tier restaurants in a city, the local cuisine type is not usually favored, while other cuisines are favored by consumers in many different cities. By deriving the number of cities where each cuisine is overrepresented among the top-tier restaurants, we find that the distribution is highly skewed towards a few cuisine types such as Chuan, Yue, Xiang, and Zhe. These cuisines are popular in the sense that they not only stand out in the cities’ top-tier restaurants, but also have a wide geographic coverage. The findings offer additional insights into consumers’ perceptions on different cuisines and their dining preferences.
This research provides a unique perspective of the geographic prevalence and mix of various cuisines across China using online review data. The implications are manifold. First, the correlation and clustering analyses reveal great heterogeneity among the cities with respect to the diversity and characteristics of these restaurants. What are their social and cultural implications, and how can certain policies be made to guide local agriculture and logistics to align with consumers’ dietary needs? Second, the analyses based on the weighted distance measure and the popularity index highlight notable differences, in terms of both geographic prevalence and consumer ratings, among the China’s eight major regional cuisines. As some cuisine types are very popular while others are not, it would be meaningful to explore the potential driving forces, and engage broad discussions on their implications for food industry and cultural conservation. Moreover, the research findings serve as useful information for investors, food providers, tourists, and migrants when certain business (e.g., what type of restaurants to open?) and everyday decisions (e.g., where and what to eat?) need to be made.
Several research directions can be pursued in future studies. First, the current study includes only 31 cities. Although these cities cover provincial capitals and municipalities under direct supervision of the Chinese central government, they by no means depict a comprehensive picture of consumers’ dining options and experiences in China. In the future, we plan to broaden the scope of this study by incorporating more cities, and examine whether similar findings can be discovered. It would also be meaningful to repeat this study at the provincial level and compare the results under different spatial configurations [56,57]. Second, the conclusions of this research are drawn based on a snapshot the restaurants during the data collection period. How the culinary structures of cities change over time as well as how people create and react to such changes are interesting questions. Answering these questions would provide additional information on the evolution of urban food culture and its implications for economic development and public health. Nevertheless, this study provides a new perspective on food geography research and the methods can be applied to similar datasets to understand the culinary scenes of cities and beyond.
Author Contributions
Y.X., J.Z., Z.F. and S.-L.S. conceived and designed the experiments; J.Z. and Y.X. performed the experiments; Y.X. and J.Z. analyzed the data; Y.X., J.Z. and X.L. wrote the paper.
Acknowledgments
The research was supported in part by National Key R&D plan (2017YFC1405302, 2017YFB0503802), the National Natural Science Foundation of China (Grants 41231171, 41771473), the Fundamental Research Funds for the Central Universities, Guangdong Innovative and Entrepreneurial Research Team Program (2016ZT06D336), the Hui Oi Chow Trust Fund (201502172005), and the Hong Kong Polytechnic University Start-Up Grant under project 1-BE0J.
Conflicts of Interest
The authors declare no conflict of interest.
Appendix A
Appendix A.1.

Table A1.
Percentages of various regional Chinese restaurants in the city.
| City Names | Lu | Chuan | Yue | Min | Su | Zhe | Xiang | Hui | Chu | Jing | Xibei | Dongbei | Jin | Shanxi | Gan | Ji | Halal | Yu | Yungui |
|---|---|---|---|---|---|---|---|---|---|---|---|---|---|---|---|---|---|---|---|
| Beijing | 1.36 | 44.30 | 3.71 | 0.00 | 0.87 | 2.41 | 6.88 | 0.65 | 0.60 | 14.72 | 3.88 | 9.33 | 0.00 | 0.67 | 0.40 | 0.47 | 7.59 | 0.00 | 2.15 |
| Changchun | 0.74 | 50.83 | 1.28 | 0.00 | 0.00 | 1.04 | 1.15 | 0.13 | 0.00 | 0.00 | 0.07 | 39.82 | 0.00 | 0.00 | 0.19 | 0.00 | 4.40 | 0.00 | 0.35 |
| Changsha | 0.56 | 22.93 | 3.97 | 0.00 | 0.00 | 1.69 | 65.97 | 0.09 | 0.00 | 0.31 | 0.18 | 2.57 | 0.00 | 0.00 | 0.89 | 0.00 | 0.68 | 0.00 | 0.15 |
| Chengdu | 0.16 | 90.61 | 2.39 | 0.00 | 0.00 | 1.48 | 1.03 | 0.05 | 0.00 | 0.52 | 0.07 | 1.26 | 0.00 | 0.00 | 0.25 | 0.00 | 1.83 | 0.00 | 0.34 |
| Chongqing | 0.29 | 91.13 | 2.55 | 0.00 | 0.00 | 1.37 | 1.42 | 0.04 | 0.00 | 0.04 | 0.20 | 1.39 | 0.00 | 0.00 | 0.26 | 0.00 | 0.83 | 0.00 | 0.48 |
| Fuzhou | 0.38 | 43.96 | 5.24 | 36.03 | 0.00 | 3.43 | 4.67 | 0.23 | 0.00 | 0.18 | 0.23 | 3.22 | 0.00 | 0.00 | 1.09 | 0.00 | 1.15 | 0.00 | 0.18 |
| Guangzhou | 0.16 | 33.23 | 38.47 | 0.00 | 0.00 | 1.39 | 15.49 | 0.11 | 0.40 | 0.34 | 1.04 | 4.74 | 0.00 | 0.00 | 0.45 | 0.00 | 3.79 | 0.00 | 0.40 |
| Guiyang | 0.35 | 46.50 | 2.63 | 0.00 | 0.00 | 1.31 | 2.90 | 0.06 | 0.00 | 0.00 | 0.09 | 1.92 | 0.00 | 0.00 | 0.48 | 0.00 | 1.22 | 0.00 | 42.54 |
| Haikou | 0.32 | 59.90 | 10.96 | 0.00 | 0.00 | 2.66 | 14.65 | 0.28 | 0.00 | 0.00 | 1.11 | 6.47 | 0.00 | 0.00 | 1.63 | 0.00 | 1.79 | 0.00 | 0.24 |
| Hangzhou | 0.37 | 31.96 | 3.25 | 0.00 | 0.00 | 48.95 | 4.35 | 1.84 | 0.00 | 0.71 | 0.27 | 4.75 | 0.00 | 0.00 | 0.57 | 0.00 | 2.32 | 0.00 | 0.66 |
| Harbin | 0.57 | 43.23 | 1.61 | 0.00 | 0.00 | 1.07 | 0.87 | 0.20 | 0.00 | 0.75 | 0.21 | 46.17 | 0.00 | 0.00 | 0.09 | 0.00 | 4.95 | 0.00 | 0.28 |
| Hefei | 0.30 | 32.09 | 2.96 | 0.00 | 0.00 | 6.33 | 6.28 | 47.17 | 0.00 | 0.30 | 0.14 | 2.44 | 0.00 | 0.00 | 0.18 | 0.00 | 1.59 | 0.00 | 0.21 |
| Hohhot | 0.42 | 40.75 | 1.51 | 0.00 | 0.00 | 1.75 | 1.31 | 0.16 | 0.00 | 0.00 | 29.98 | 13.76 | 0.00 | 0.00 | 0.76 | 0.00 | 9.44 | 0.00 | 0.16 |
| Jinan | 39.56 | 39.08 | 2.45 | 0.00 | 0.00 | 1.75 | 2.31 | 0.19 | 0.00 | 4.71 | 0.47 | 4.25 | 0.00 | 0.00 | 0.25 | 0.00 | 4.82 | 0.00 | 0.16 |
| Kunming | 0.17 | 46.72 | 2.98 | 0.00 | 0.00 | 0.88 | 1.96 | 0.12 | 0.00 | 0.00 | 0.28 | 2.01 | 0.00 | 0.00 | 0.17 | 0.00 | 4.84 | 0.00 | 39.87 |
| Lanzhou | 0.12 | 51.68 | 2.02 | 0.00 | 0.00 | 2.04 | 2.65 | 0.15 | 0.00 | 0.00 | 5.54 | 2.92 | 0.00 | 0.00 | 0.17 | 0.00 | 32.58 | 0.00 | 0.15 |
| Lhasa | 0.89 | 73.10 | 1.62 | 0.00 | 0.00 | 2.91 | 2.99 | 0.24 | 0.00 | 0.00 | 1.05 | 3.96 | 0.00 | 0.00 | 0.16 | 0.00 | 11.71 | 0.00 | 1.37 |
| Nanchang | 0.20 | 28.26 | 3.53 | 0.00 | 0.00 | 4.90 | 5.60 | 0.23 | 0.00 | 0.00 | 0.20 | 2.74 | 0.00 | 0.00 | 51.74 | 0.00 | 2.28 | 0.00 | 0.33 |
| Nanjing | 0.50 | 33.10 | 3.37 | 0.00 | 45.44 | 5.23 | 3.17 | 0.36 | 0.00 | 1.39 | 0.43 | 3.60 | 0.00 | 0.00 | 0.35 | 0.00 | 2.90 | 0.00 | 0.18 |
| Nanning | 0.39 | 52.04 | 19.34 | 0.00 | 0.00 | 5.91 | 13.11 | 0.32 | 0.00 | 0.00 | 0.45 | 4.63 | 0.00 | 0.00 | 0.61 | 0.00 | 2.67 | 0.00 | 0.55 |
| Shanghai | 0.37 | 37.18 | 5.77 | 0.22 | 14.38 | 19.53 | 8.29 | 1.66 | 0.17 | 0.48 | 1.20 | 5.22 | 0.00 | 0.08 | 0.49 | 0.00 | 4.16 | 0.00 | 0.80 |
| Shenyang | 0.48 | 41.33 | 2.43 | 0.00 | 0.00 | 2.74 | 1.67 | 0.14 | 0.00 | 1.24 | 0.35 | 41.56 | 0.00 | 0.00 | 0.31 | 0.00 | 7.22 | 0.00 | 0.52 |
| Shijiazhuang | 0.39 | 52.87 | 1.81 | 0.00 | 0.00 | 3.10 | 2.99 | 0.23 | 0.00 | 2.45 | 0.57 | 8.47 | 0.00 | 0.00 | 0.15 | 20.92 | 5.64 | 0.00 | 0.40 |
| Taiyuan | 0.23 | 48.49 | 3.05 | 0.00 | 0.00 | 3.80 | 4.31 | 0.21 | 0.00 | 0.00 | 0.90 | 5.42 | 0.00 | 29.77 | 0.18 | 0.00 | 3.35 | 0.00 | 0.29 |
| Tianjin | 2.17 | 43.51 | 3.73 | 0.00 | 1.96 | 1.36 | 3.90 | 0.31 | 0.00 | 0.96 | 0.95 | 6.59 | 26.78 | 0.40 | 0.27 | 0.00 | 6.74 | 0.00 | 0.40 |
| Urumqi | 0.19 | 47.66 | 1.94 | 0.00 | 0.00 | 1.97 | 3.79 | 0.03 | 0.00 | 0.00 | 1.05 | 1.92 | 0.00 | 0.00 | 0.07 | 0.00 | 41.25 | 0.00 | 0.12 |
| Wuhan | 0.85 | 39.13 | 4.34 | 0.00 | 0.00 | 2.78 | 7.05 | 0.12 | 40.06 | 0.22 | 0.25 | 2.38 | 0.00 | 0.00 | 1.31 | 0.00 | 1.14 | 0.00 | 0.37 |
| Xi’an | 0.24 | 47.01 | 2.49 | 0.00 | 0.00 | 1.21 | 6.21 | 0.13 | 0.00 | 0.48 | 22.19 | 2.43 | 0.00 | 7.40 | 0.46 | 0.00 | 8.30 | 1.33 | 0.12 |
| Xining | 0.07 | 38.87 | 1.88 | 0.00 | 0.00 | 2.27 | 4.00 | 0.07 | 0.00 | 0.00 | 14.66 | 2.19 | 0.00 | 0.00 | 0.29 | 0.00 | 35.57 | 0.00 | 0.12 |
| Yinchuan | 0.26 | 47.18 | 2.05 | 0.00 | 0.00 | 2.10 | 2.78 | 0.05 | 0.00 | 0.00 | 7.42 | 6.23 | 0.00 | 0.00 | 0.21 | 0.00 | 31.48 | 0.00 | 0.23 |
| Zhengzhou | 0.21 | 41.44 | 2.95 | 0.00 | 0.00 | 2.40 | 3.98 | 0.12 | 0.00 | 1.54 | 0.76 | 2.77 | 0.00 | 0.00 | 0.32 | 0.00 | 12.40 | 30.80 | 0.31 |
Appendix A.2.
Table A2.
Correlations among taste (T), environment (E) and service (S) of restaurants that serve regional Chinese cuisines (i.e., type 1–19) in the 31 cities.
Table A2.
Correlations among taste (T), environment (E) and service (S) of restaurants that serve regional Chinese cuisines (i.e., type 1–19) in the 31 cities.
| City Name | Pair-Wise Correlation | City Name | Pair-Wise Correlation | ||||
|---|---|---|---|---|---|---|---|
| Beijing | 0.998 | 0.998 | 0.999 | Lhasa | 0.999 | 0.999 | 0.999 |
| Changchun | 0.999 | 0.999 | 0.999 | Nanchang | 0.999 | 0.999 | 0.999 |
| Changsha | 0.999 | 0.999 | 0.999 | Nanjing | 0.999 | 0.999 | 0.999 |
| Chengdu | 0.998 | 0.999 | 0.999 | Nanning | 0.999 | 0.999 | 0.999 |
| Chongqing | 0.998 | 0.999 | 0.999 | Shanghai | 0.997 | 0.998 | 0.999 |
| Fuzhou | 0.999 | 0.999 | 0.999 | Shenyang | 0.999 | 0.999 | 0.999 |
| Guangzhou | 0.998 | 0.999 | 0.999 | Shijiazhuang | 0.998 | 0.999 | 1.000 |
| Guiyang | 0.999 | 0.999 | 0.999 | Taiyuan | 0.999 | 0.999 | 0.999 |
| Haikou | 0.999 | 0.999 | 0.999 | Tianjin | 0.999 | 0.999 | 0.999 |
| Hangzhou | 0.998 | 0.998 | 0.999 | Urumqi | 0.999 | 0.999 | 0.999 |
| Harbin | 0.999 | 0.999 | 0.999 | Wuhan | 0.999 | 0.999 | 0.999 |
| Hefei | 0.999 | 0.999 | 1.000 | Xi’an | 0.999 | 0.999 | 0.999 |
| Hohhot | 0.999 | 0.999 | 1.000 | Xining | 0.999 | 0.999 | 1.000 |
| Jinan | 0.999 | 0.999 | 0.999 | Yinchuan | 0.999 | 0.999 | 0.999 |
| Kunming | 0.999 | 0.999 | 0.999 | Zhengzhou | 0.999 | 0.999 | 1.000 |
| Lanzhou | 0.999 | 0.999 | 0.999 | ||||
Appendix A.3.
Table A3.
Mean and median values of T (ratings of taste) of restaurants. For each city, the restaurants are sorted by T and divided into five quantiles, with each quantile accounting for 20 percent of all the restaurants.
Table A3.
Mean and median values of T (ratings of taste) of restaurants. For each city, the restaurants are sorted by T and divided into five quantiles, with each quantile accounting for 20 percent of all the restaurants.
| City Name | Q1 Mean/Median | Q2 Mean/Median | Q3 Mean/Median | Q4 Mean/Median | Q5 Mean/Median |
|---|---|---|---|---|---|
| Beijing | 8.8/8.9 | 7.8/7.7 | 7.3/7.3 | 7.1/7.0 | 6.7/6.8 |
| Changchun | 8.2/8.0 | 7.5/7.5 | 7.2/7.2 | 7.0/7.0 | 6.7/6.8 |
| Changsha | 8.4/8.3 | 7.7/7.7 | 7.4/7.3 | 7.1/7.1 | 6.8/6.9 |
| Chengdu | 8.4/8.3 | 7.6/7.6 | 7.3/7.3 | 7.0/7.0 | 6.7/6.8 |
| Chongqing | 8.3/8.2 | 7.6/7.6 | 7.3/7.3 | 7.1/7.0 | 6.7/6.8 |
| Fuzhou | 8.3/8.2 | 7.6/7.6 | 7.2/7.2 | 7.0/7.0 | 6.7/6.8 |
| Guangzhou | 8.4/8.4 | 7.6/7.6 | 7.2/7.2 | 7.0/7.0 | 6.6/6.7 |
| Guiyang | 8.0/7.8 | 7.4/7.4 | 7.1/7.1 | 6.9/6.9 | 6.6/6.7 |
| Haikou | 8.2/8.0 | 7.6/7.6 | 7.3/7.3 | 7.1/7.1 | 6.7/6.8 |
| Hangzhou | 8.7/8.7 | 7.7/7.7 | 7.3/7.3 | 7.0/7.0 | 6.7/6.8 |
| Harbin | 8.3/8.1 | 7.5/7.5 | 7.2/7.2 | 7.0/7.0 | 6.7/6.8 |
| Hefei | 8.7/8.7 | 7.7/7.7 | 7.4/7.3 | 7.1/7.1 | 6.8/6.8 |
| Hohhot | 8.2/8.0 | 7.6/7.6 | 7.2/7.2 | 7.0/7.0 | 6.8/6.9 |
| Jinan | 8.4/8.4 | 7.6/7.6 | 7.2/7.2 | 7.0/7.0 | 6.7/6.8 |
| Kunming | 8.2/8.1 | 7.5/7.5 | 7.2/7.2 | 7.0/7.0 | 6.7/6.8 |
| Lanzhou | 8.1/7.9 | 7.5/7.5 | 7.2/7.2 | 7.0/7.0 | 6.6/6.8 |
| Lhasa | 7.9/7.7 | 7.4/7.4 | 7.1/7.1 | 7.0/7.0 | 6.6/6.8 |
| Nanchang | 8.4/8.3 | 7.6/7.6 | 7.3/7.3 | 7.0/7.0 | 6.7/6.8 |
| Nanjing | 8.8/8.8 | 7.8/7.7 | 7.4/7.3 | 7.1/7.1 | 6.7/6.8 |
| Nanning | 7.9/7.8 | 7.4/7.3 | 7.1/7.1 | 6.9/6.9 | 6.5/6.4 |
| Shanghai | 8.7/8.7 | 7.7/7.7 | 7.3/7.3 | 7.0/7.0 | 6.6/6.7 |
| Shenyang | 8.6/8.5 | 7.6/7.6 | 7.3/7.3 | 7.0/7.0 | 6.7/6.8 |
| Shijiazhuang | 8.6/8.5 | 7.7/7.7 | 7.4/7.4 | 7.1/7.1 | 6.7/6.8 |
| Taiyuan | 8.3/8.2 | 7.6/7.6 | 7.3/7.3 | 7.0/7.0 | 6.7/6.8 |
| Tianjin | 8.7/8.7 | 7.7/7.7 | 7.3/7.3 | 7.1/7.0 | 6.7/6.8 |
| Urumqi | 8.3/8.3 | 7.6/7.6 | 7.3/7.3 | 7.0/7.0 | 6.7/6.8 |
| Wuhan | 8.7/8.7 | 7.7/7.6 | 7.3/7.3 | 7.0/7.0 | 6.7/6.8 |
| Xi’an | 8.5/8.4 | 7.6/7.6 | 7.3/7.3 | 7.0/7.0 | 6.7/6.8 |
| Xining | 8.0/7.8 | 7.4/7.4 | 7.2/7.2 | 7.0/7.0 | 6.7/6.8 |
| Yinchuan | 8.4/8.3 | 7.6/7.6 | 7.3/7.3 | 7.1/7.1 | 6.7/6.8 |
| Zhengzhou | 8.4/8.4 | 7.7/7.7 | 7.3/7.3 | 7.1/7.0 | 6.7/6.8 |
References
- Morrison, K.T.; Nelson, T.A.; Ostry, A.S. Mapping spatial variation in food consumption. Appl. Geogr. 2011, 31, 1262–1267. [Google Scholar] [CrossRef]
- Wang, Q.; Yue, T.; Wang, C.; Fan, Z.; Liu, X. Spatial-temporal variations of food provision in China. Procedia Environ. Sci. 2012, 13, 1933–1945. [Google Scholar] [CrossRef]
- Neal, Z.P. Culinary deserts, gastronomic oases: A classification of US cities. Urban Stud. 2006, 43, 1–21. [Google Scholar] [CrossRef]
- Liu, X. Featured graphic. Visualizing urban gastronomy in China. Environ. Plan. A 2014, 46, 1012–1013. [Google Scholar] [CrossRef]
- Jalis, M.H.; Che, D.; Markwell, K. Utilising local cuisine to market Malaysia as a tourist destination. Procedia Soc. Behav. Sci. 2014, 144, 102–110. [Google Scholar] [CrossRef]
- Boyne, S.; Hall, D.; Williams, F. Policy, support and promotion for food-related tourism initiatives: A marketing approach to regional development. J. Travel Tour. Mark. 2003, 14, 131–154. [Google Scholar] [CrossRef]
- Rinaldi, C. Food and Gastronomy for Sustainable Place Development: A Multidisciplinary Analysis of Different Theoretical Approaches. Sustainability 2017, 9, 1748. [Google Scholar] [CrossRef]
- Petty, R.D. Obesity and the Role of Food Marketing: A Policy Analysis of Issues and Remedies. J. Public Policy Mark. 2004, 23, 153–169. [Google Scholar]
- Liu, X.; Song, Y.; Wu, K.; Wang, J.; Li, D.; Long, Y. Understanding urban China with open data. Cities 2015, 47, 53–61. [Google Scholar] [CrossRef]
- Cook, I.; Crang, P. The world on a plate: Culinary culture, displacement and geographical knowledges. J. Mat. Cult. 1996, 1, 131–153. [Google Scholar] [CrossRef]
- Bardhi, F.; Ostberg, J.; Bengtsson, A. Negotiating cultural boundaries: Food, travel and consumer identities. Consum. Mark. Cult. 2010, 13, 133–157. [Google Scholar] [CrossRef]
- Askegaard, S.; Kjeldgaard, D. Here, there, and everywhere: Place branding and gastronomical globalization in a macromarketing perspective. J. Macromark. 2007, 27, 138–147. [Google Scholar] [CrossRef]
- Farrer, J. Eating the West and Beating the Rest: Culinary Occidentalism and Urban Soft Power in Asia’s Global Food Cities. Available online: http://icc.fla.sophia.ac.jp/global%20food%20papers/pdf/2_3_FARRER.pdf (accessed on 10 May 2010).
- Caspi, C.E.; Sorensen, G.; Subramanian, S.; Kawachi, I. The local food environment and diet: A systematic review. Health Place 2012, 18, 1172–1187. [Google Scholar] [CrossRef] [PubMed]
- Mak, A.H.; Lumbers, M.; Eves, A. Globalisation and food consumption in tourism. Ann. Tour. Res. 2012, 39, 171–196. [Google Scholar] [CrossRef] [Green Version]
- Carroll, G.R.; Torfason, M.T. Restaurant Organizational Forms and Community in the US in 2005. City Commun. 2011, 10, 1–24. [Google Scholar] [CrossRef]
- Abramson, P.R.; Inglehart, R.F. Value Change in Global Perspective; University of Michigan Press: Ann Arbor, MI, USA, 2009. [Google Scholar]
- Mullins, P.; Natalier, K.; Smith, P.; Smeaton, B. Cities and consumption spaces. Urban Aff. Rev. 1999, 35, 44–71. [Google Scholar] [CrossRef]
- Zukin, S. Urban lifestyles: Diversity and standardisation in spaces of consumption. Urban Stud. 1998, 35, 825–839. [Google Scholar] [CrossRef]
- Park, K. Ethnic Foodscapes: Foreign Cuisines in the United States. Food Cult. Soc. 2017, 20, 365–393. [Google Scholar] [CrossRef]
- Glaeser, E.L.; Kolko, J.; Saiz, A. Consumer city. J. Econ. Geogr. 2001, 1, 27–50. [Google Scholar] [CrossRef]
- Schiff, N. Cities and product variety: Evidence from restaurants. J. Econ. Geogr. 2014, 15, 1085–1123. [Google Scholar] [CrossRef]
- De Irala-Estevez, J.; Groth, M.; Johansson, L.; Oltersdorf, U.; Prättälä, R.; Martínez-González, M.A. A systematic review of socio-economic differences in food habits in Europe: Consumption of fruit and vegetables. Eur. J. Clin. Nutr. 2000, 54, 706. [Google Scholar] [CrossRef]
- Wagner, C.; Singer, P.; Strohmaier, M. The nature and evolution of online food preferences. EPJ Data Sci. 2014, 3, 38. [Google Scholar] [CrossRef]
- Ahn, Y.Y.; Ahnert, S.E.; Bagrow, J.P.; Barabási, A.L. Flavor network and the principles of food pairing. Sci. Rep. 2011, 1. [Google Scholar] [CrossRef] [PubMed]
- Ye, Y.; Li, D.; Liu, X. How block density and typology affect urban vitality: an exploratory analysis in Shenzhen, China. Urban Geogr. 2017, 39, 631–652. [Google Scholar] [CrossRef]
- Zhou, X. Modern Food Culture Geography Research in Sichuan and Chongqing Region. Master’s Thesis, Southwest University, Chongqing, China, 2014. (In Chinese). [Google Scholar]
- Guo, J. The geographical environment factors on Chinese Eight Cuisines Formation. Yinshan Acad. J. 2016. (In Chinese) [Google Scholar] [CrossRef]
- Zhang, M.; Wu, W.; Yao, L.; Bai, Y.; Xiong, G. Transnational practices in urban China: Spatiality and localization of western fast food chains. Habitat Int. 2014, 43, 22–31. [Google Scholar] [CrossRef]
- Web 2.0. Available online: https://en.wikipedia.org/wiki/Web_2.0 (accessed on 2 February 2017).
- Krishnamurthy, B.; Gill, P.; Arlitt, M. A few chirps about twitter. In Proceedings of the First Workshop on Online Social Networks, ACM, Seattle, WA, USA, 17–22 August 2008; pp. 19–24. [Google Scholar]
- Kumar, R.; Novak, J.; Tomkins, A. Structure and Evolution of Online Social Networks. In Link Mining: Models, Algorithms, and Applications; Springer: New York, NY, USA, 2010; pp. 337–357. [Google Scholar]
- Weng, J.; Lim, E.P.; Jiang, J.; He, Q. Twitterrank: Finding topic-sensitive influential twitterers. In Proceedings of the Third ACM International Conference on Web Search and Data Mining, ACM, New York, NY, USA, 3–6 February 2010; pp. 261–270. [Google Scholar]
- Zook, M.; Graham, M.; Shelton, T.; Gorman, S. Volunteered geographic information and crowdsourcing disaster relief: A case study of the Haitian earthquake. World Med. Health Policy 2010, 2, 7–33. [Google Scholar] [CrossRef]
- Goodchild, M.F.; Glennon, J.A. Crowdsourcing geographic information for disaster response: A research frontier. Int. J. Digit. Earth 2010, 3, 231–241. [Google Scholar] [CrossRef]
- De Longueville, B.; Smith, R.S.; Luraschi, G. Omg, from here, I can see the flames!: A use case of mining location based social networks to acquire spatio-temporal data on forest fires. In Proceedings of the 2009 International Workshop on Location Based Social Networks, ACM, Seattle, WA, USA, 3 November 2009; pp. 73–80. [Google Scholar]
- Hawelka, B.; Sitko, I.; Beinat, E.; Sobolevsky, S.; Kazakopoulos, P.; Ratti, C. Geo-located Twitter as proxy for global mobility patterns. Cartogr. Geogr. Inf. Sci. 2014, 41, 260–271. [Google Scholar] [CrossRef] [PubMed]
- Frias-Martinez, V.; Soto, V.; Hohwald, H.; Frias-Martinez, E. Characterizing urban landscapes using geolocated tweets. In Proceedings of the IEEE Privacy, Security, Risk and Trust (PASSAT), 2012 International Conference on and 2012 International Confernece on Social Computing (SocialCom), Washington, DC, USA, 3–5 September 2012; pp. 239–248. [Google Scholar]
- Wakamiya, S.; Lee, R.; Sumiya, K. Urban area characterization based on semantics of crowd activities in twitter. In Proceedings of the International Conference on GeoSpatial Sematics, Brest, France, 12–13 May 2011; Springer: Berlin/Heidelberg, Germany, 2011; pp. 108–123. [Google Scholar]
- Chen, X.; Yang, X. Does food environment influence food choices? A geographical analysis through “tweets”. Appl. Geogr. 2014, 51, 82–89. [Google Scholar] [CrossRef]
- Widener, M.J.; Li, W. Using geolocated Twitter data to monitor the prevalence of healthy and unhealthy food references across the US. Appl. Geogr. 2014, 54, 189–197. [Google Scholar] [CrossRef]
- Abbar, S.; Mejova, Y.; Weber, I. You tweet what you eat: Studying food consumption through twitter. In Proceedings of the 33rd Annual ACM Conference on Human Factors in Computing Systems, ACM, Seoul, Korea, 18–23 April 2015; pp. 3197–3206. [Google Scholar]
- Zhu, Y.X.; Huang, J.; Zhang, Z.K.; Zhang, Q.M.; Zhou, T.; Ahn, Y.Y. Geography and similarity of regional cuisines in China. PLoS ONE 2013, 8, e79161. [Google Scholar] [CrossRef] [PubMed]
- Bessière, J. Local development and heritage: Traditional food and cuisine as tourist attractions in rural areas. Sociol. Rural. 1998, 38, 21–34. [Google Scholar] [CrossRef]
- Zhang, F.; Yuan, N.J.; Zheng, K.; Lian, D.; Xie, X.; Rui, Y. Exploiting dining preference for restaurant recommendation. In Proceedings of the 25th International Conference on World Wide Web, International World Wide Web Conferences Steering Committee, Montreal, QC, Canada, 11–15 April 2016; pp. 725–735. [Google Scholar]
- Chow, I.H.S.; Lau, V.P.; Lo, T.W.C.; Sha, Z.; Yun, H. Service quality in restaurant operations in China: Decision-and experiential-oriented perspectives. Int. J. Hosp. Manag. 2007, 26, 698–710. [Google Scholar] [CrossRef]
- About Dianping. Available online: http://www.dianping.com/aboutus (accessed on 2 February 2017).
- Chinese Cuisine. Available online: https://en.wikipedia.org/wiki/Chinese_cuisine (accessed on 2 February 2017).
- Shannon, C.E. A mathematical theory of communication. ACM Sigmob Mob. Comput. Commun. Rev. 2001, 5, 3–55. [Google Scholar] [CrossRef]
- Chinese Economic Reform. Available online: https://en.wikipedia.org/wiki/Chinese_economic_reform (accessed on 2 February 2017).
- Wang, X.; Cai, D.; Hoogmoed, W.; Oenema, O.; Perdok, U. Developments in conservation tillage in rainfed regions of North China. Soil Tillage Res. 2007, 93, 239–250. [Google Scholar] [CrossRef]
- Simpson, E.H. Measurement of diversity. Nature 1949. [Google Scholar] [CrossRef]
- Han, J.; Pei, J.; Kamber, M. Data Mining: Concepts and Techniques; Elsevier: Boston, MA, USA, 2011. [Google Scholar]
- Curtis, K.R.; McCluskey, J.J.; Wahl, T.I. Consumer preferences for western-style convenience foods in China. China Econ. Rev. 2007, 18, 1–14. [Google Scholar] [CrossRef]
- Möhring, M. Transnational Food Migration and the Internalization of Food Consumption: Ethnic Cuisine in West Germany. In Food and Globalization: Consumption, Markets and Politics in the Modern World; Berg Publisher: Oxford, UK, 2008; Volume 1. [Google Scholar]
- Chen, X. Take the edge off: A hybrid geographic food access measure. Appl. Geogr. 2017, 87, 149–159. [Google Scholar] [CrossRef]
- Fotheringham, A.S.; Wong, D.W. The modifiable areal unit problem in multivariate statistical analysis. Environ. Plan. A 1991, 23, 1025–1044. [Google Scholar] [CrossRef]
Figure 1.
Number of restaurants in each selected city.

Figure 2.
Information of restaurants captured from Dianping (e.g., cuisine type or culinary style, total number of review comments, and rating of taste, environment and service).
Figure 2.
Information of restaurants captured from Dianping (e.g., cuisine type or culinary style, total number of review comments, and rating of taste, environment and service).

Figure 3.
(A) Geographic patterns of diversity by the entropy (for better visualization effect, we assign a color to each province or the municipality by group, which denote the entropy of the corresponding capital city); (B) Entropy of 31 cities.
Figure 3.
(A) Geographic patterns of diversity by the entropy (for better visualization effect, we assign a color to each province or the municipality by group, which denote the entropy of the corresponding capital city); (B) Entropy of 31 cities.

Figure 4.
Percentage of restaurants in each individual city organized by regional Chinese cuisines (type 1 to type 19). The dendrogram illustrates the similarities between cities.
Figure 4.
Percentage of restaurants in each individual city organized by regional Chinese cuisines (type 1 to type 19). The dendrogram illustrates the similarities between cities.
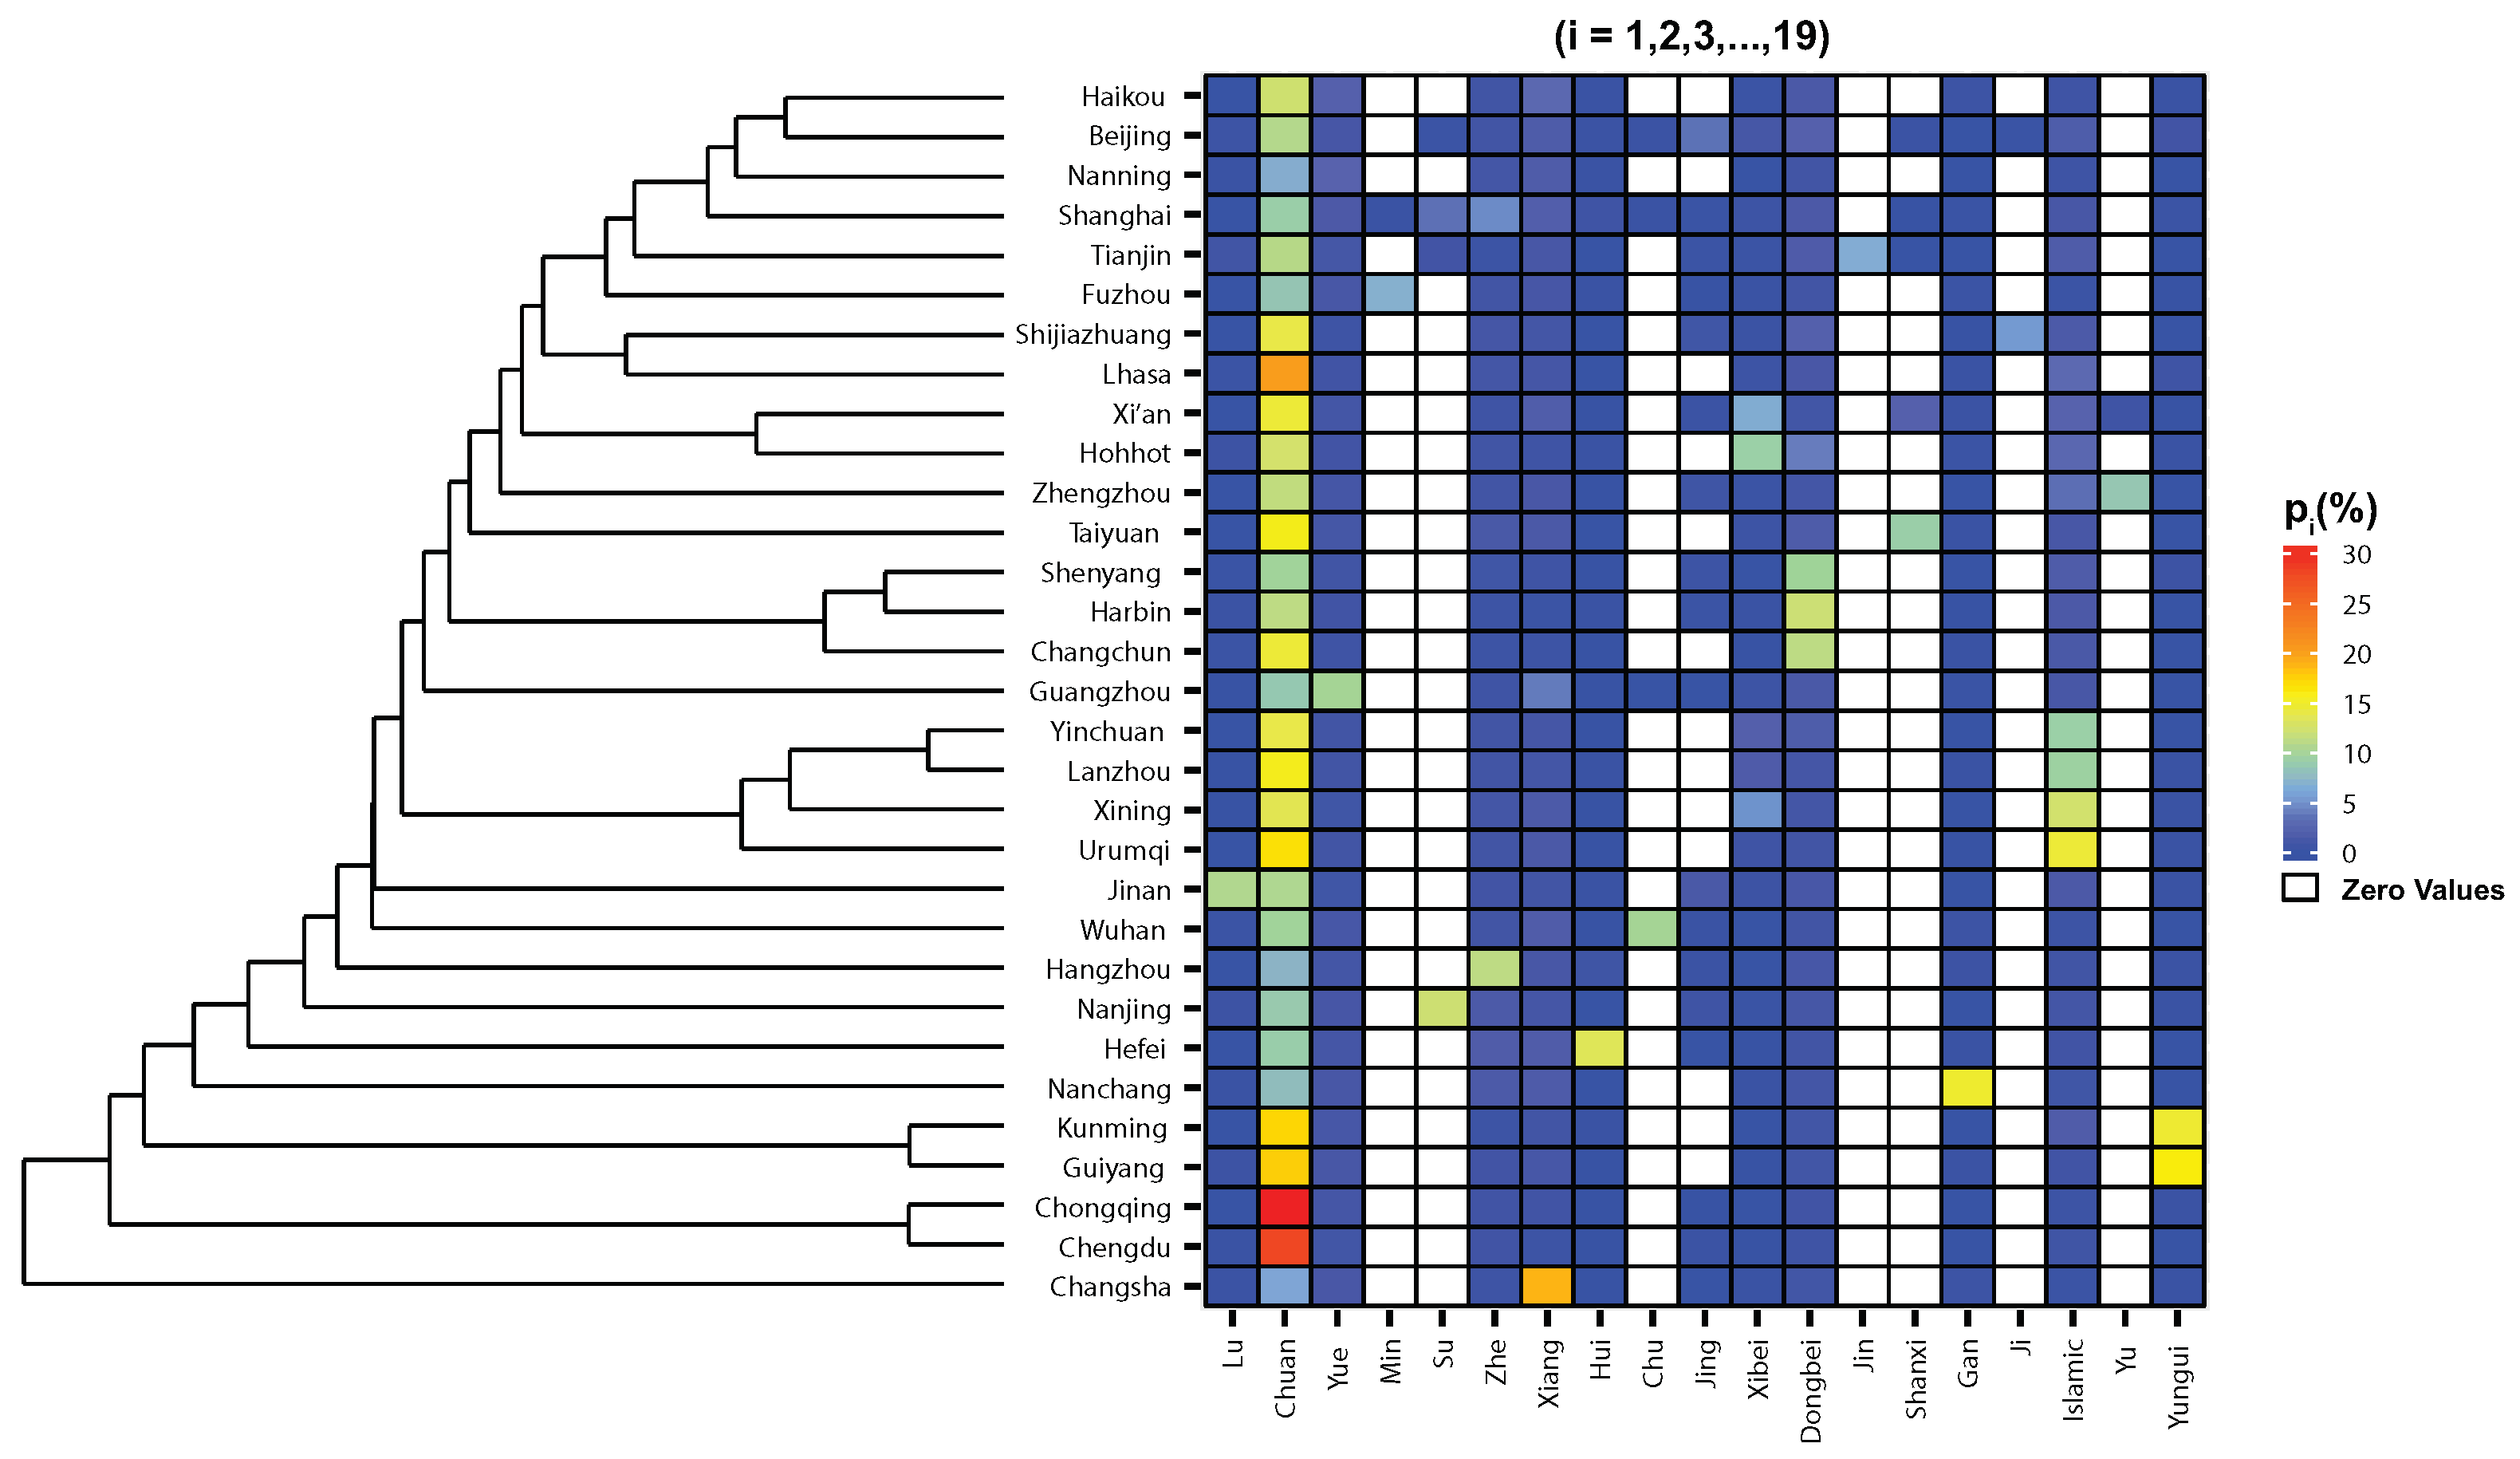
Figure 5.
Scatter plot showing the relationship between cities’ similarities and their geographic distances (from the perspective of regional Chinese cuisines).
Figure 5.
Scatter plot showing the relationship between cities’ similarities and their geographic distances (from the perspective of regional Chinese cuisines).

Figure 6.
Percentage of restaurants in each individual city organized by other culinary styles (type 20 to type 25). The dendrogram illustrates similarities between cities.
Figure 6.
Percentage of restaurants in each individual city organized by other culinary styles (type 20 to type 25). The dendrogram illustrates similarities between cities.

Figure 7.
Scatter plot showing the relationship between cities’ similarities and their geographic distances, (from the perspective of cuisine type 20–25).
Figure 7.
Scatter plot showing the relationship between cities’ similarities and their geographic distances, (from the perspective of cuisine type 20–25).

Figure 8.
Geographic prevalence of regional Chinese cuisines measured as: (A) absolute weighted distance, and (B) normalized weighted distance.
Figure 8.
Geographic prevalence of regional Chinese cuisines measured as: (A) absolute weighted distance, and (B) normalized weighted distance.

Figure 9.
(A) Cuisine with the highest value in each city; (B) The number of cities where a cuisine is overrepresented among the top-tier restaurants (i.e., with index greater than one).
Figure 9.
(A) Cuisine with the highest value in each city; (B) The number of cities where a cuisine is overrepresented among the top-tier restaurants (i.e., with index greater than one).

Table 1.
Major types of regional cuisines and culinary styles after restaurant reclassification.
| Unique Id | Cuisine Type or Culinary Style | Origin of Cuisine (or Major Characteristics) | % of Restaurants |
|---|---|---|---|
| 1 | Lu (鲁) | Shandong province | 0.44 |
| 2 | Chuan (川) | Sichuan province and Chongqing municipality | 13.78 |
| 3 | Yue (粤) | Guangdong province | 1.51 |
| 4 | Min (闽) | Fujian province | 0.17 |
| 5 | Su (苏) | Jiangsu province | 0.88 |
| 6 | Zhe (浙) | Zhejiang province | 1.46 |
| 7 | Xiang (湘) | Hunan province | 1.86 |
| 8 | Hui (徽) | Anhui province | 0.44 |
| 9 | Chu (楚) | Hubei province | 0.45 |
| 10 | Jing (京) | Beijing municipality | 0.57 |
| 11 | Xibei (西北) | Northwest China including Shaanxi (“陕西”) province, Gansu province, Qinghai province, Ningxia, and Xinjiang | 0.72 |
| 12 | Dongbei (东北) | Northeast China including Heilongjiang Province, Jilin Province, Liaoning province, and Inner Mongolia | 2.23 |
| 13 | Jin (津) | Tianjin municipality | 0.30 |
| 14 | Shanxi (山西) | Shanxi province | 0.28 |
| 15 | Gan (赣) | Jiangxi province | 0.35 |
| 16 | Ji (冀) | Hebei province | 0.14 |
| 17 | Islamic (清真) | The cuisine originally comes from other Islamic countries (e.g., Iran) and gradually becomes popular in northwestern China (e.g., Xinjiang, Qinghai and Gansu province). | 1.62 |
| 18 | Yu (豫) | Henan province | 0.31 |
| 19 | Yungui (云贵) | Yunnan province and Guizhou province | 0.71 |
| 20 | Fast Food | Food that is prepared and served quickly | 17.36 |
| 21 | Street Food (小吃) | A generic type which encompasses different types of street food (e.g., noodles, steamed buns, dumplings) | 14.95 |
| 22 | Barbecue | A popular culinary style in China with signature dishes such as grills and barbecues | 5.08 |
| 23 | Dessert/Coffee | Restaurants which mainly serve coffee and desserts (e.g., Starbucks) | 18.78 |
| 24 | Foreign | Cuisine types which do not originate from China (e.g., Japanese Food, South Korean Dish) | 4.58 |
| 25 | Others | Other Chinese cuisine types or culinary styles with each accounting for less than 0.1% of total restaurants. | 11.03 |
Table 2.
Top five types of regional Chinese cuisines (ordered by restaurant number) in each city.
| City Name | Percentage of Restaurants in City (** Indicates Local Cuisine Type) | Total | |||||||||
|---|---|---|---|---|---|---|---|---|---|---|---|
| Cuisine 1 | Cuisine 2 | Cuisine 3 | Cuisine 4 | Cuisine 5 | |||||||
| Beijing | Chuan | 44.3 | Jing ** | 14.7 | Dongbei | 9.3 | Islamic | 7.6 | Xiang | 6.9 | 82.8 |
| Changchun | Chuan | 50.8 | Dongbei ** | 39.8 | Islamic | 4.4 | Yue | 1.3 | Xiang | 1.2 | 97.5 |
| Changsha | Xiang ** | 66.0 | Chuan | 22.9 | Yue | 4.0 | Dongbei | 2.6 | Zhe | 1.7 | 97.1 |
| Chengdu | Chuan ** | 90.6 | Yue | 2.4 | Islamic | 1.8 | Zhe | 1.5 | Dongbei | 1.3 | 97.6 |
| Chongqing | Chuan ** | 91.1 | Yue | 2.5 | Xiang | 1.4 | Dongbei | 1.4 | Zhe | 1.4 | 97.9 |
| Fuzhou | Chuan | 44.0 | Min ** | 36.0 | Yue | 5.2 | Xiang | 4.7 | Zhe | 3.4 | 93.3 |
| Guangzhou | Yue ** | 38.5 | Chuan | 33.2 | Xiang | 15.5 | Dongbei | 4.7 | Islamic | 3.8 | 95.7 |
| Guiyang | Chuan | 46.5 | Yungui ** | 42.5 | Xiang | 2.9 | Yue | 2.6 | Dongbei | 1.9 | 96.5 |
| Haikou | Chuan | 59.9 | Xiang | 14.6 | Yue | 11.0 | Dongbei | 6.5 | Zhe | 2.7 | 94.6 |
| Hangzhou | Zhe ** | 49.0 | Chuan | 32.0 | Dongbei | 4.7 | Xiang | 4.3 | Yue | 3.3 | 93.3 |
| Harbin | Dongbei ** | 46.2 | Chuan | 43.2 | Islamic | 5.0 | Yue | 1.6 | Zhe | 1.1 | 97.0 |
| Hefei | Hui ** | 47.2 | Chuan | 32.1 | Zhe | 6.3 | Xiang | 6.3 | Yue | 3.0 | 94.8 |
| Hohhot | Chuan | 40.7 | Xibei | 30.0 | Dongbei | 13.8 | Islamic | 9.4 | Zhe | 1.7 | 95.7 |
| Jinan | Lu ** | 39.6 | Chuan | 39.1 | Islamic | 4.8 | Jing | 4.7 | Dongbei | 4.2 | 92.4 |
| Kunming | Chuan | 46.7 | Yungui ** | 39.9 | Islamic | 4.8 | Yue | 3.0 | Dongbei | 2.0 | 96.4 |
| Lanzhou | Chuan | 51.7 | Islamic | 32.6 | Xibei ** | 5.5 | Dongbei | 2.9 | Xiang | 2.6 | 95.4 |
| Lhasa | Chuan | 73.1 | Islamic | 11.7 | Dongbei | 4.0 | Xiang | 3.0 | Zhe | 2.9 | 94.7 |
| Nanchang | Gan ** | 51.7 | Chuan | 28.3 | Xiang | 5.6 | Zhe | 4.9 | Yue | 3.5 | 94.0 |
| Nanjing | Su ** | 45.4 | Chuan | 33.1 | Zhe | 5.2 | Dongbei | 3.6 | Yue | 3.4 | 90.7 |
| Nanning | Chuan | 52.0 | Yue | 19.3 | Xiang | 13.1 | Zhe | 5.9 | Dongbei | 4.6 | 95.0 |
| Shanghai | Chuan | 37.2 | Zhe | 19.5 | Su | 14.4 | Xiang | 8.3 | Yue | 5.8 | 85.1 |
| Shenyang | Dongbei ** | 41.6 | Chuan | 41.3 | Islamic | 7.2 | Zhe | 2.7 | Yue | 2.4 | 95.3 |
| Shijiazhuang | Chuan | 52.9 | Ji ** | 20.9 | Dongbei | 8.5 | Islamic | 5.6 | Zhe | 3.1 | 91.0 |
| Taiyuan | Chuan | 48.5 | Shanxi ** | 29.8 | Dongbei | 5.4 | Xiang | 4.3 | Zhe | 3.8 | 91.8 |
| Tianjin | Chuan | 43.5 | Jin ** | 26.8 | Islamic | 6.7 | Dongbei | 6.6 | Xiang | 3.9 | 87.5 |
| Urumqi | Chuan | 47.7 | Islamic ** | 41.3 | Xiang | 3.8 | Zhe | 2.0 | Yue | 1.9 | 96.6 |
| Wuhan | Chu ** | 40.1 | Chuan | 39.1 | Xiang | 7.0 | Yue | 4.3 | Zhe | 2.8 | 93.4 |
| Xi’an | Chuan | 47.0 | Xibei ** | 22.2 | Islamic | 8.3 | Shanxi | 7.4 | Xiang | 6.2 | 91.1 |
| Xining | Chuan | 38.9 | Islamic | 35.6 | Xibei ** | 14.7 | Xiang | 4.0 | Zhe | 2.3 | 95.4 |
| Yinchuan | Chuan | 47.2 | Islamic | 31.5 | Xibei ** | 7.4 | Dongbei | 6.2 | Xiang | 2.8 | 95.1 |
| Zhengzhou | Chuan | 41.4 | Yu ** | 30.8 | Islamic | 12.4 | Xiang | 4.0 | Yue | 3.0 | 91.6 |
Table 3.
Popularity index () of top five regional Chinese cuisines in the 31 cities.
| City Name | Name of Cuisines and Corresponding Index (** Indicates Local Cuisine Type) | |||||||||
|---|---|---|---|---|---|---|---|---|---|---|
| Beijing | Chuan | 1.58 | Xiang | 1.17 | Islamic | 1.06 | Dongbei | 0.77 | Jing ** | 0.47 |
| Changchun | Yue | 1.72 | Chuan | 1.29 | Xiang | 1.14 | Islamic | 0.88 | Dongbei ** | 0.68 |
| Changsha | Xiang ** | 1.10 | Chuan | 0.94 | Yue | 0.90 | Dongbei | 0.61 | Zhe | 0.20 |
| Chengdu | Chuan ** | 1.07 | Yue | 0.71 | Islamic | 0.50 | Dongbei | 0.31 | Zhe | 0.32 |
| Chongqing | Chuan ** | 1.05 | Yue | 0.86 | Xiang | 0.56 | Dongbei | 0.42 | Zhe | 0.28 |
| Fuzhou | Chuan | 1.36 | Yue | 1.25 | Xiang | 1.25 | Min ** | 0.72 | Zhe | 0.55 |
| Guangzhou | Yue ** | 1.31 | Chuan | 1.03 | Xiang | 0.71 | Dongbei | 0.52 | Islamic | 0.40 |
| Guiyang | Yue | 1.34 | Chuan | 1.10 | Yungui ** | 0.99 | Xiang | 0.71 | Dongbei | 0.52 |
| Haikou | Chuan | 1.10 | Yue | 1.05 | Xiang | 1.02 | Dongbei | 0.97 | Zhe | 0.39 |
| Hangzhou | Chuan | 1.15 | Zhe ** | 1.11 | Yue | 1.00 | Dongbei | 0.66 | Xiang | 0.64 |
| Harbin | Yue | 1.74 | Chuan | 1.19 | Islamic | 0.93 | Dongbei ** | 0.88 | Zhe | 0.58 |
| Hefei | Chuan | 1.38 | Hui ** | 0.96 | Yue | 0.77 | Zhe | 0.72 | Xiang | 0.56 |
| Hohhot | Chuan | 1.35 | Xibei | 0.96 | Islamic | 0.74 | Zhe | 0.61 | Dongbei | 0.59 |
| Jinan | Chuan | 1.26 | Lu ** | 1.04 | Jing | 0.87 | Islamic | 0.72 | Dongbei | 0.42 |
| Kunming | Chuan | 1.28 | Yue | 1.12 | Yungui ** | 0.83 | Islamic | 0.66 | Dongbei | 0.47 |
| Lanzhou | Chuan | 1.30 | Xiang | 0.95 | Islamic | 0.77 | Xibei ** | 0.65 | Dongbei | 0.52 |
| Lhasa | Chuan | 1.16 | Xiang | 1.14 | Islamic | 0.69 | Zhe | 0.59 | Dongbei | 0.54 |
| Nanchang | Chuan | 1.40 | Gan ** | 0.99 | Yue | 0.96 | Xiang | 0.74 | Zhe | 0.31 |
| Nanjing | Yue | 1.39 | Chuan | 1.36 | Su ** | 1.01 | Dongbei | 0.61 | Zhe | 0.44 |
| Nanning | Yue | 1.21 | Chuan | 1.07 | Xiang | 1.03 | Dongbei | 0.80 | Zhe | 0.66 |
| Shanghai | Yue | 1.76 | Chuan | 1.37 | Su | 1.34 | Xiang | 0.79 | Zhe | 0.67 |
| Shenyang | Yue | 1.68 | Zhe | 1.30 | Chuan | 1.28 | Dongbei ** | 0.84 | Islamic | 0.66 |
| Shijiazhuang | Chuan | 1.36 | Islamic | 0.88 | Ji ** | 0.75 | Dongbei | 0.75 | Zhe | 0.41 |
| Taiyuan | Chuan | 1.41 | Xiang | 1.05 | Shanxi ** | 0.74 | Dongbei | 0.60 | Zhe | 0.47 |
| Tianjin | Chuan | 1.39 | Islamic | 1.17 | Xiang | 0.98 | Jin ** | 0.88 | Dongbei | 0.67 |
| Urumqi | Chuan | 1.28 | Zhe | 1.16 | Yue | 1.04 | Xiang | 0.91 | Islamic ** | 0.75 |
| Wuhan | Chuan | 1.30 | Yue | 1.13 | Chu ** | 0.94 | Xiang | 0.67 | Zhe | 0.59 |
| Xi’an | Chuan | 1.21 | Xibei ** | 1.09 | Shanxi | 1.04 | Islamic | 0.94 | Xiang | 0.53 |
| Xining | Zhe | 1.56 | Chuan | 1.34 | Xibei ** | 0.99 | Xiang | 0.98 | Islamic | 0.73 |
| Yinchuan | Chuan | 1.41 | Xibei ** | 0.83 | Islamic | 0.72 | Xiang | 0.64 | Dongbei | 0.42 |
| Zhengzhou | Yue | 1.42 | Chuan | 1.33 | Islamic | 1.03 | Xiang | 0.85 | Yu ** | 0.79 |
© 2018 by the authors. Licensee MDPI, Basel, Switzerland. This article is an open access article distributed under the terms and conditions of the Creative Commons Attribution (CC BY) license (http://creativecommons.org/licenses/by/4.0/).
Share and Cite
MDPI and ACS Style
Zhu, J.; Xu, Y.; Fang, Z.; Shaw, S.-L.; Liu, X. Geographic Prevalence and Mix of Regional Cuisines in Chinese Cities. ISPRS Int. J. Geo-Inf. 2018, 7, 183. https://doi.org/10.3390/ijgi7050183
AMA Style
Zhu J, Xu Y, Fang Z, Shaw S-L, Liu X. Geographic Prevalence and Mix of Regional Cuisines in Chinese Cities. ISPRS International Journal of Geo-Information. 2018; 7(5):183. https://doi.org/10.3390/ijgi7050183
Chicago/Turabian StyleZhu, Jingwei, Yang Xu, Zhixiang Fang, Shih-Lung Shaw, and Xingjian Liu. 2018. "Geographic Prevalence and Mix of Regional Cuisines in Chinese Cities" ISPRS International Journal of Geo-Information 7, no. 5: 183. https://doi.org/10.3390/ijgi7050183
Note that from the first issue of 2016, this journal uses article numbers instead of page numbers. See further details here.