Augmented Virtuality for Coastal Management: A Holistic Use of In Situ and Remote Sensing for Large Scale Definition of Coastal Dynamics

 ,
,  , , , and
Abstract
:1. Introduction
2. A Holistic Approach for Coastal Management
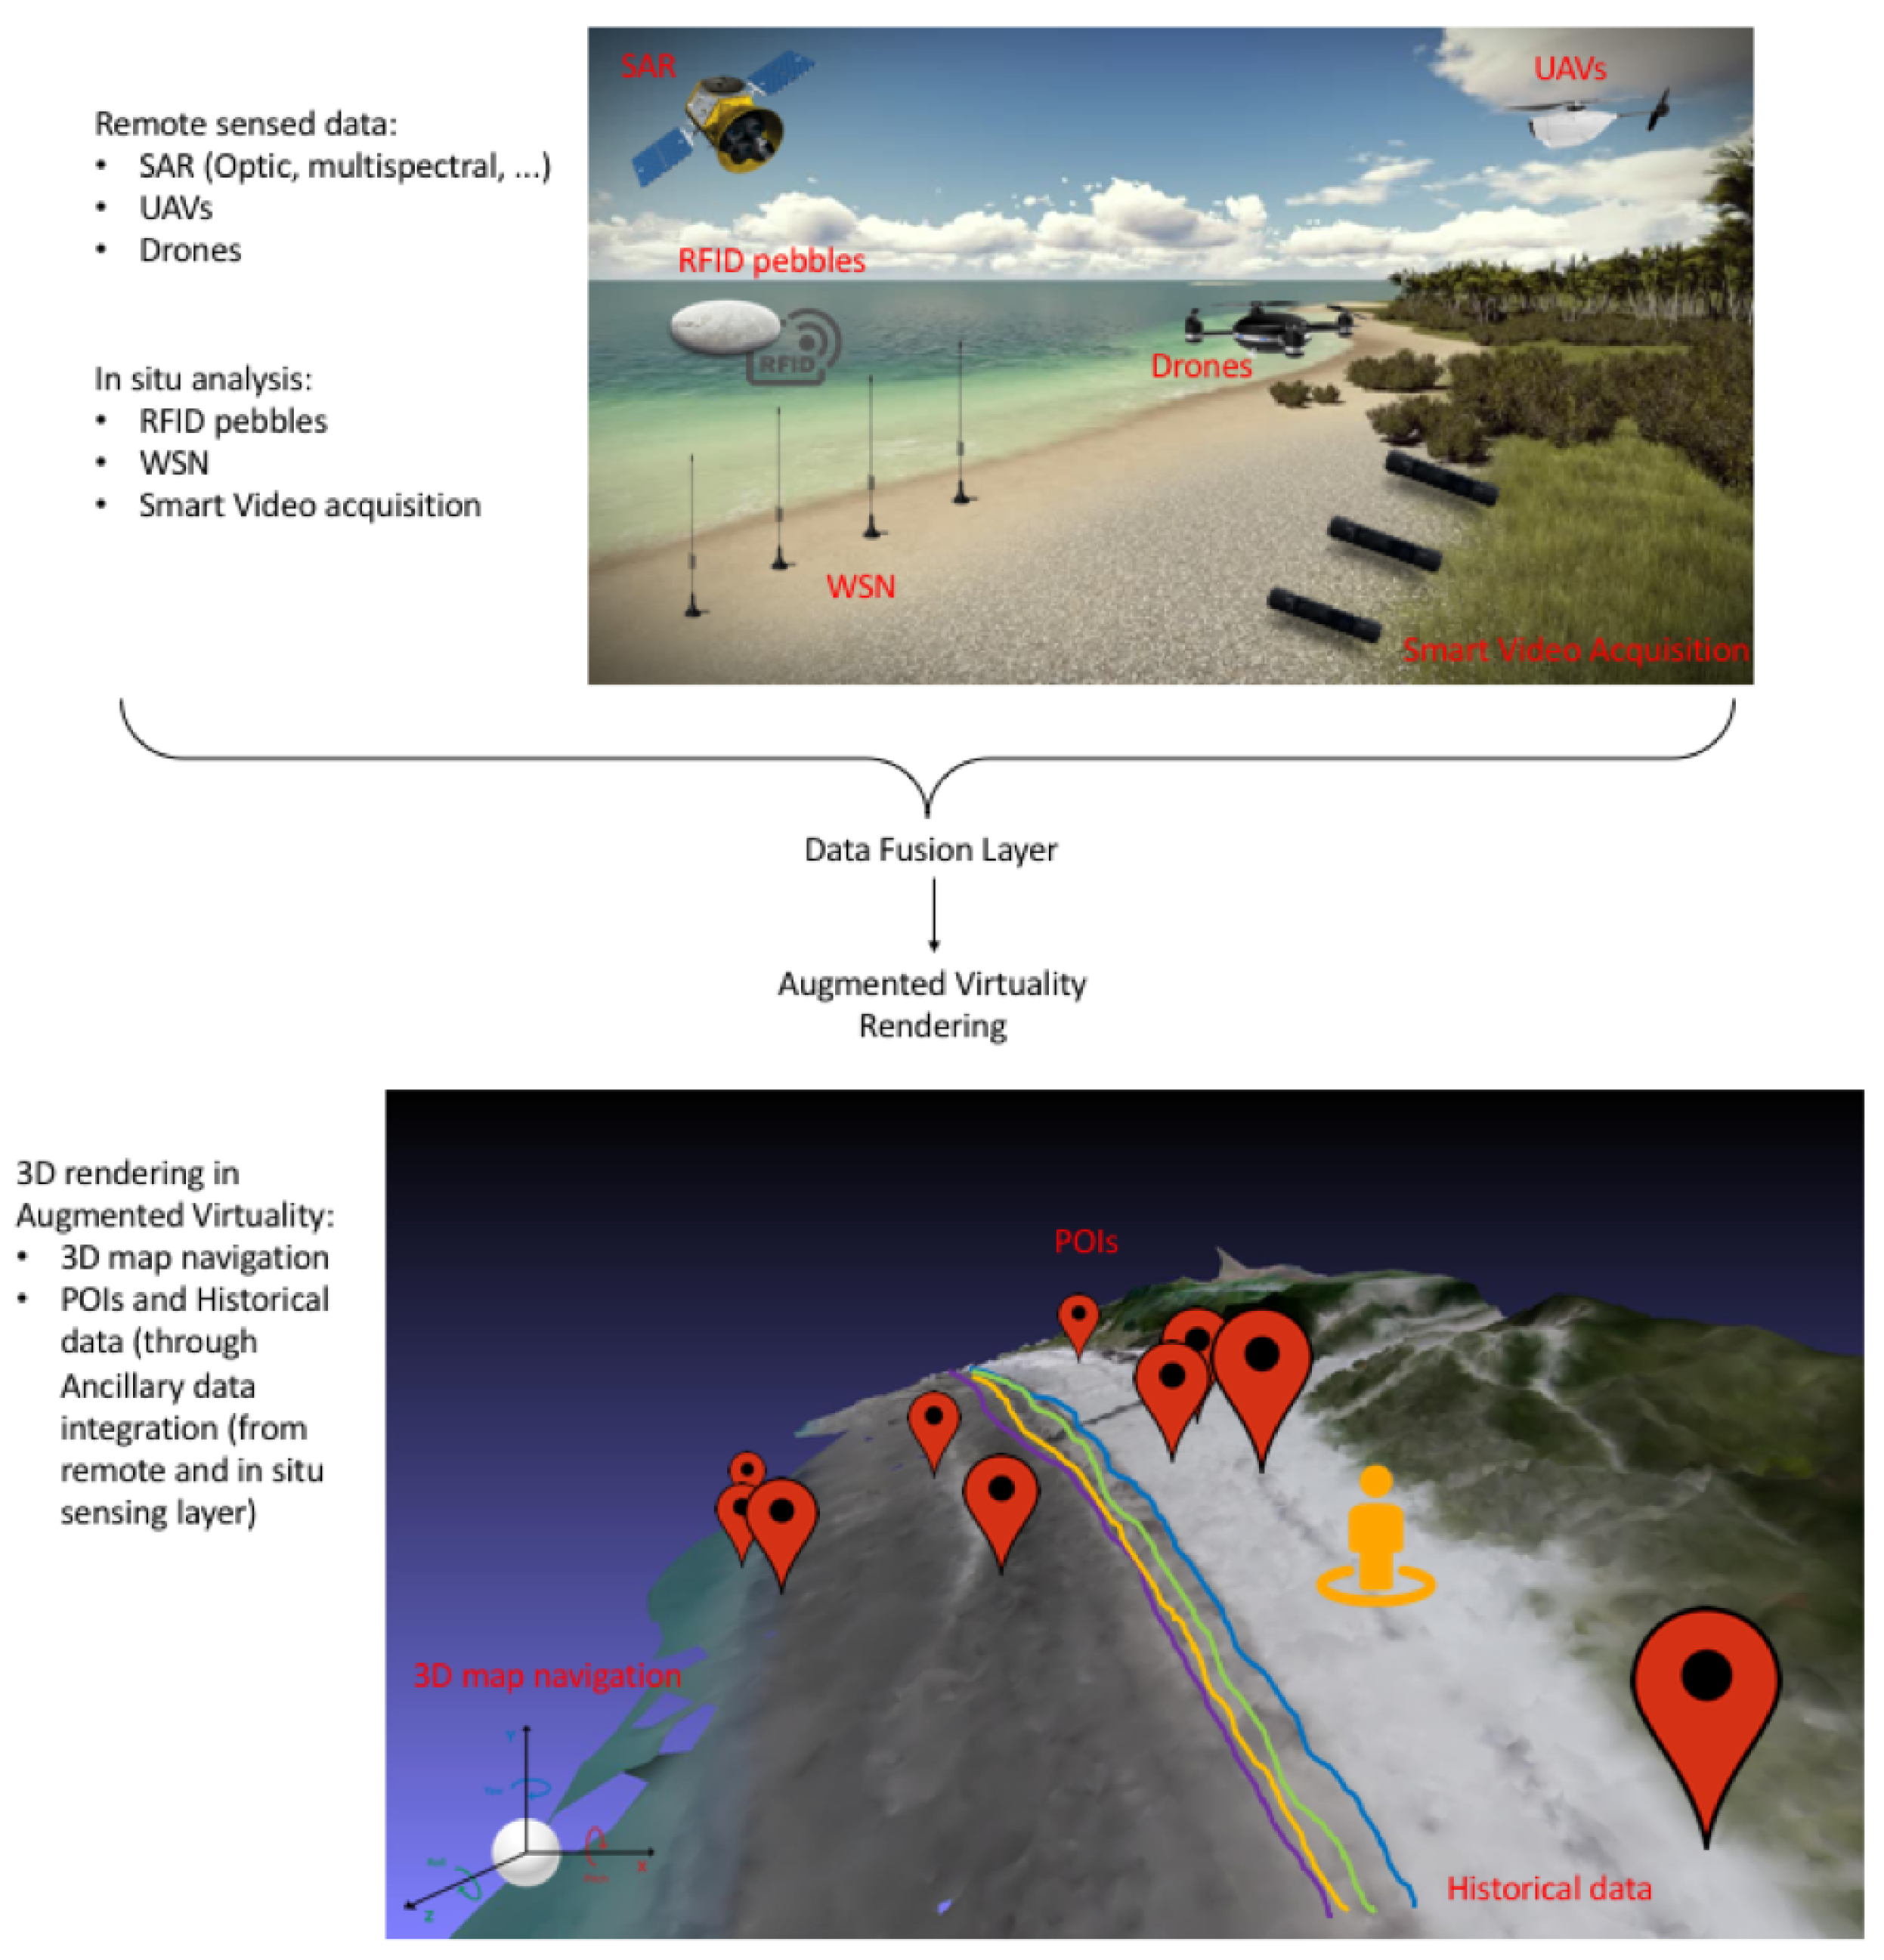
3. Remote Data Acquisition
3.1. Proximal and Distal Remote Sensing
3.2. Underwater Remote Sensing Techniques
- Side Scan Sonar (SSS): this sensor allows for covering wide areas in a brief amount of time, the information that can be extracted from SSS data is a rough bathymetry in addition to the morphology of the sea bottom;
- Bathymetric Multi Beam EchoSounder (MBES): this sensor provides a detailed (measurements of the seabed elevation are determined with a down to centimeter resolution) representation of the sea bottom profile suitable for 3D reconstruction as e.g., Digital Elevation Model (DEM);
- Sub Bottom Profiler (SBP): this sensor is a low frequency sonar that emits acoustic waves capable of penetrating the sea bottom and of interpreting the echo coming from the first meters to discriminate the nature of the different stratigraphic layers.
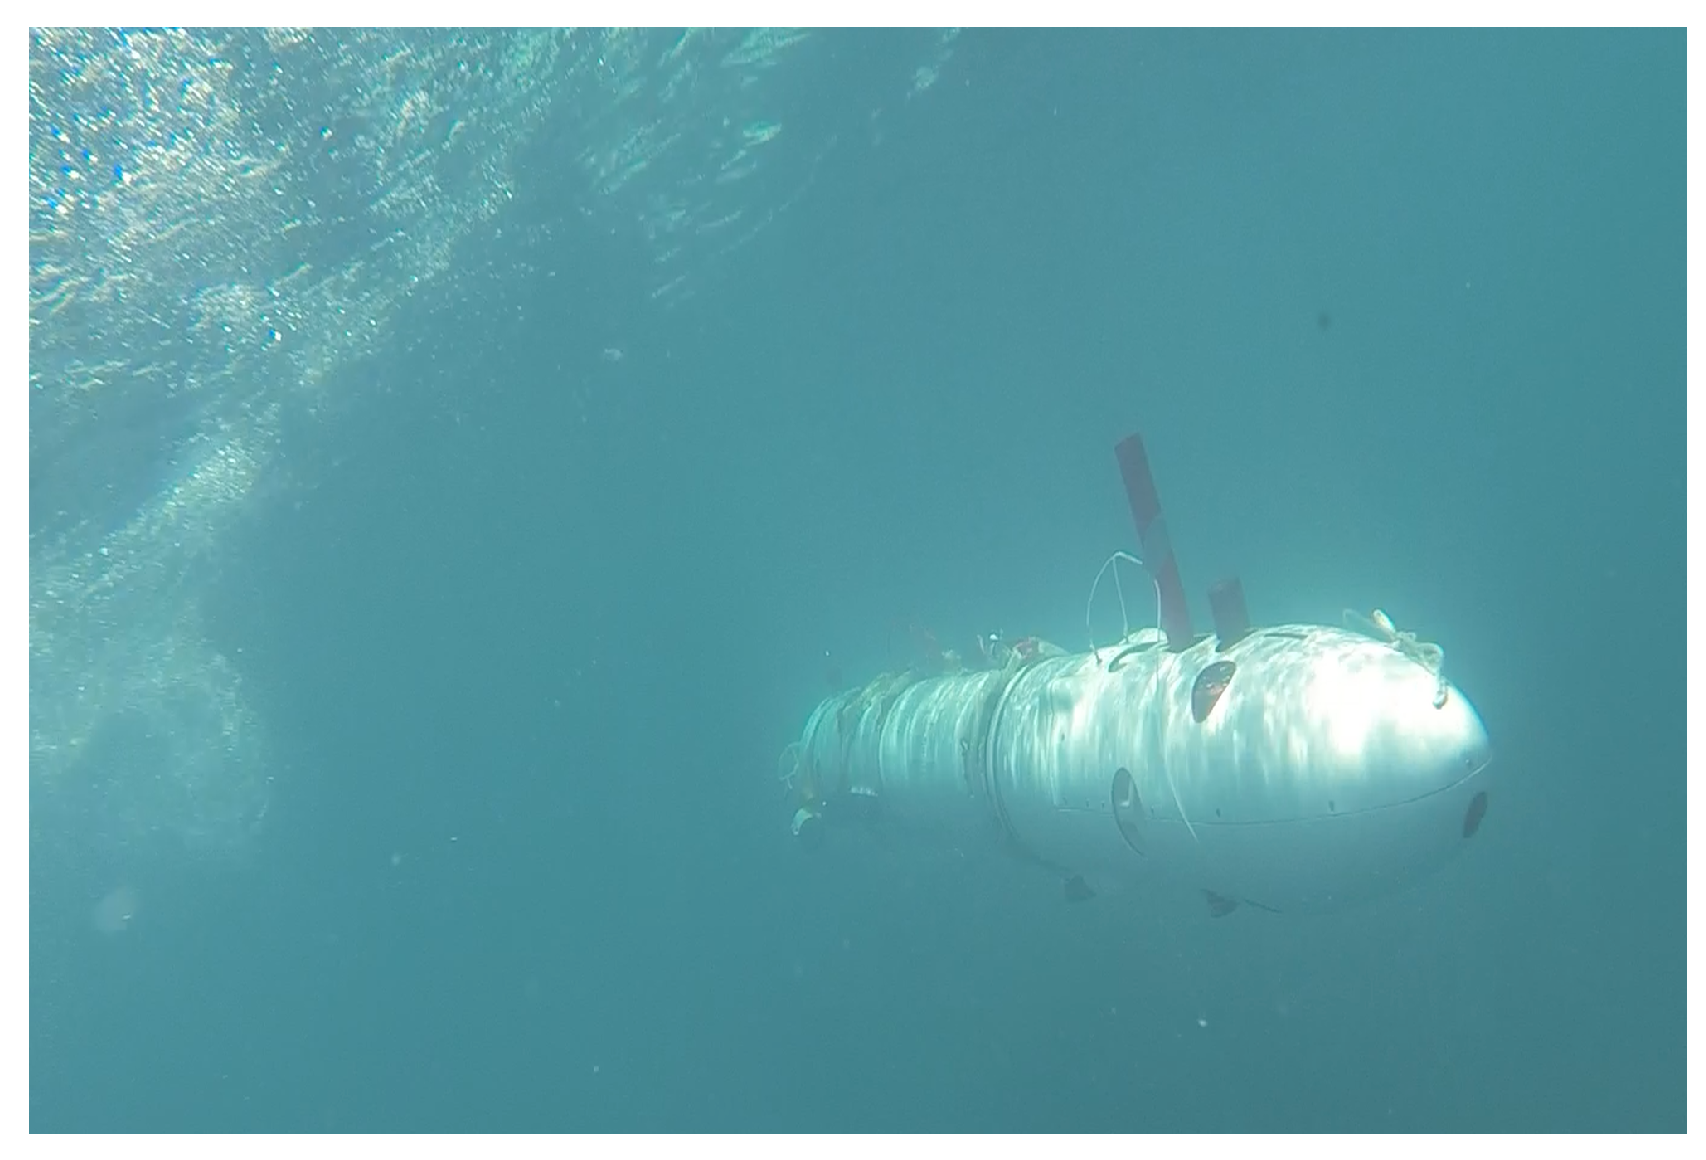
- Estimation based on proprioceptive data: methods, mainly based on the Kalman filter approach, for the fusion of proprioceptive sensor (e.g., DVL—Doppler Velocity Log, AHRS—Attitude and Heading Reference Systems) signals and dynamic evolution knowledge, have been investigated and experimentally validated [58].
- Estimation aided by acoustic systems: strategies based on measurements of relative distance and/or direction of the AUV with respect to a set of a priori known or unknown acoustic nodes [59]. This includes also cooperative localization strategies based on relative measurements between different AUVs and on communication of synthetic navigation data [60].
4. In Situ Sensing
- RFID and tracking technologies,
- Wireless Sensor Networks,
- Video Monitoring.
4.1. RFID and Tracking Technologies
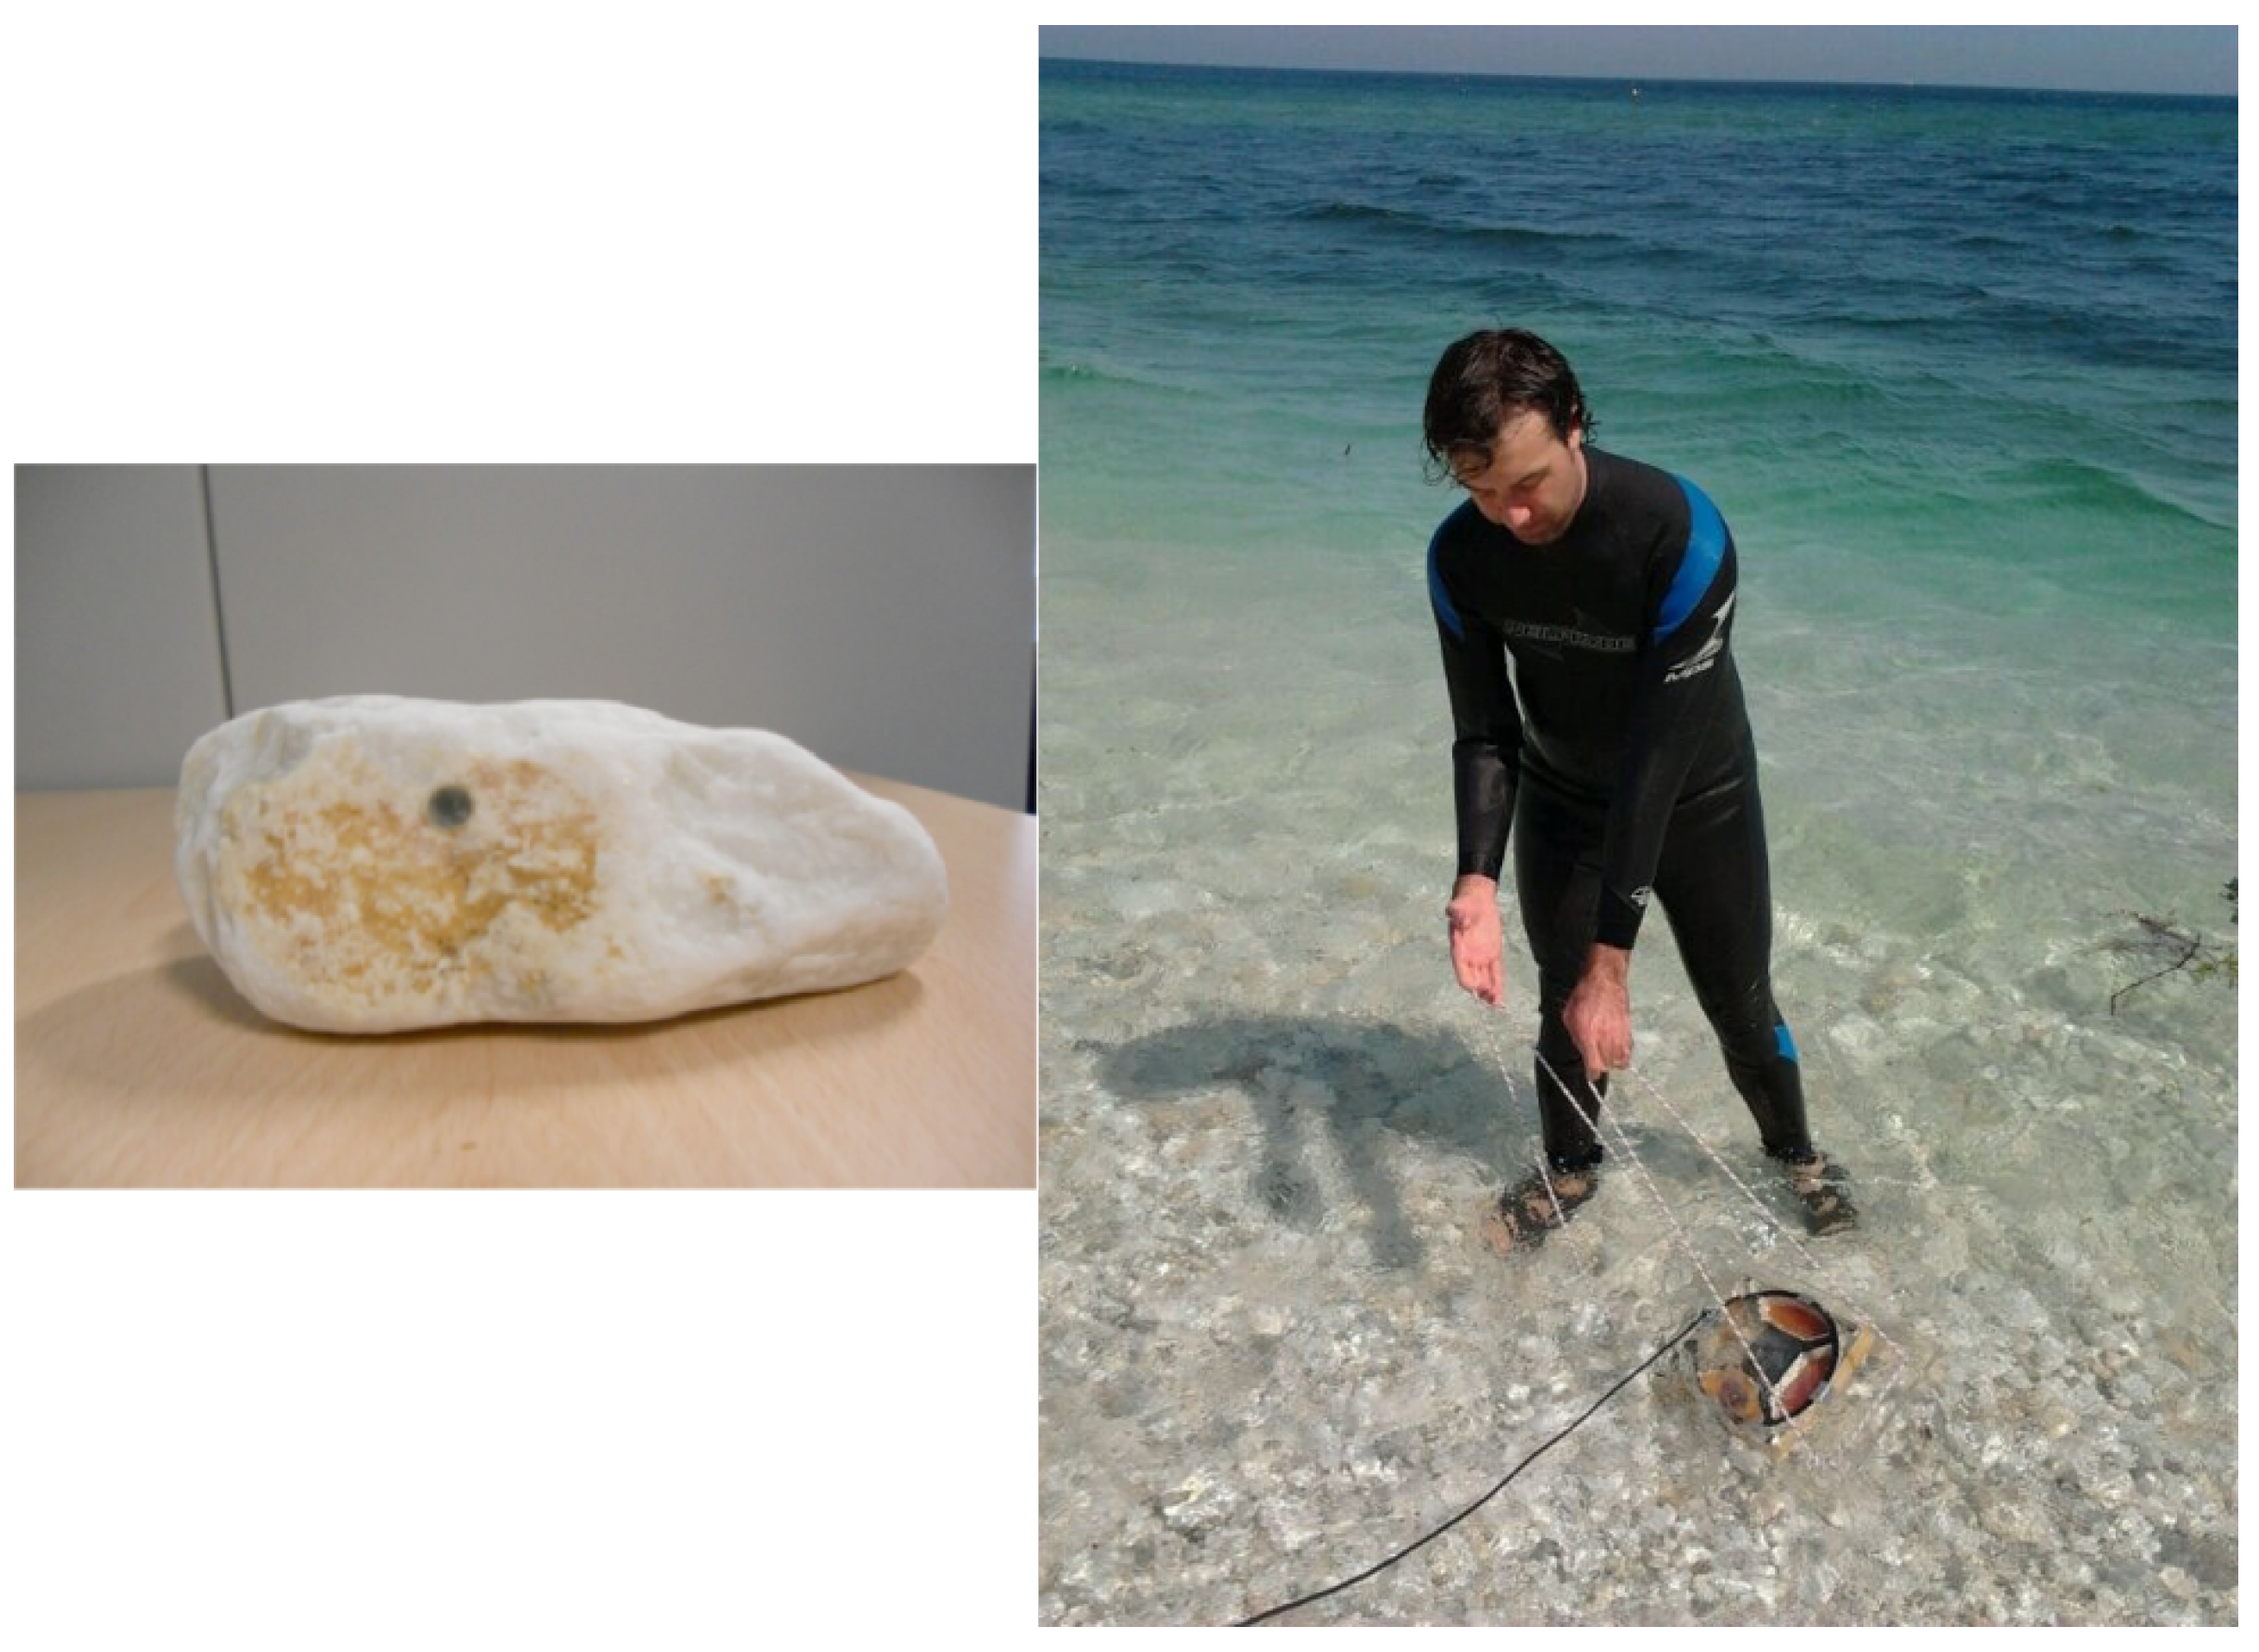
- The tagged pebble (the so-called Smart Pebble) is positioned on the beach in a specific position, according to a pre-defined scheme;
- Following the positioning, the exact position of the Smart Pebble is recorded by means of an Real Time Kinematic - Differential GPS (RTK-DGPS) instrument, whose horizontal and vertical accuracy is about 1 cm, and associated with the ID of the embedded transponder;
- After a pre-defined span of time, the Smart Pebble is localized and identified by reading the ID of the transponder through an ad hoc waterproof RFID reader that is employed as a sort of metal detector to perform a full scanning of the beach;
- The new position of the Smart Pebble is recorded;
- The Smart Pebble can be either left on site to go on with the tracking or recovered to perform morphometric analysis.
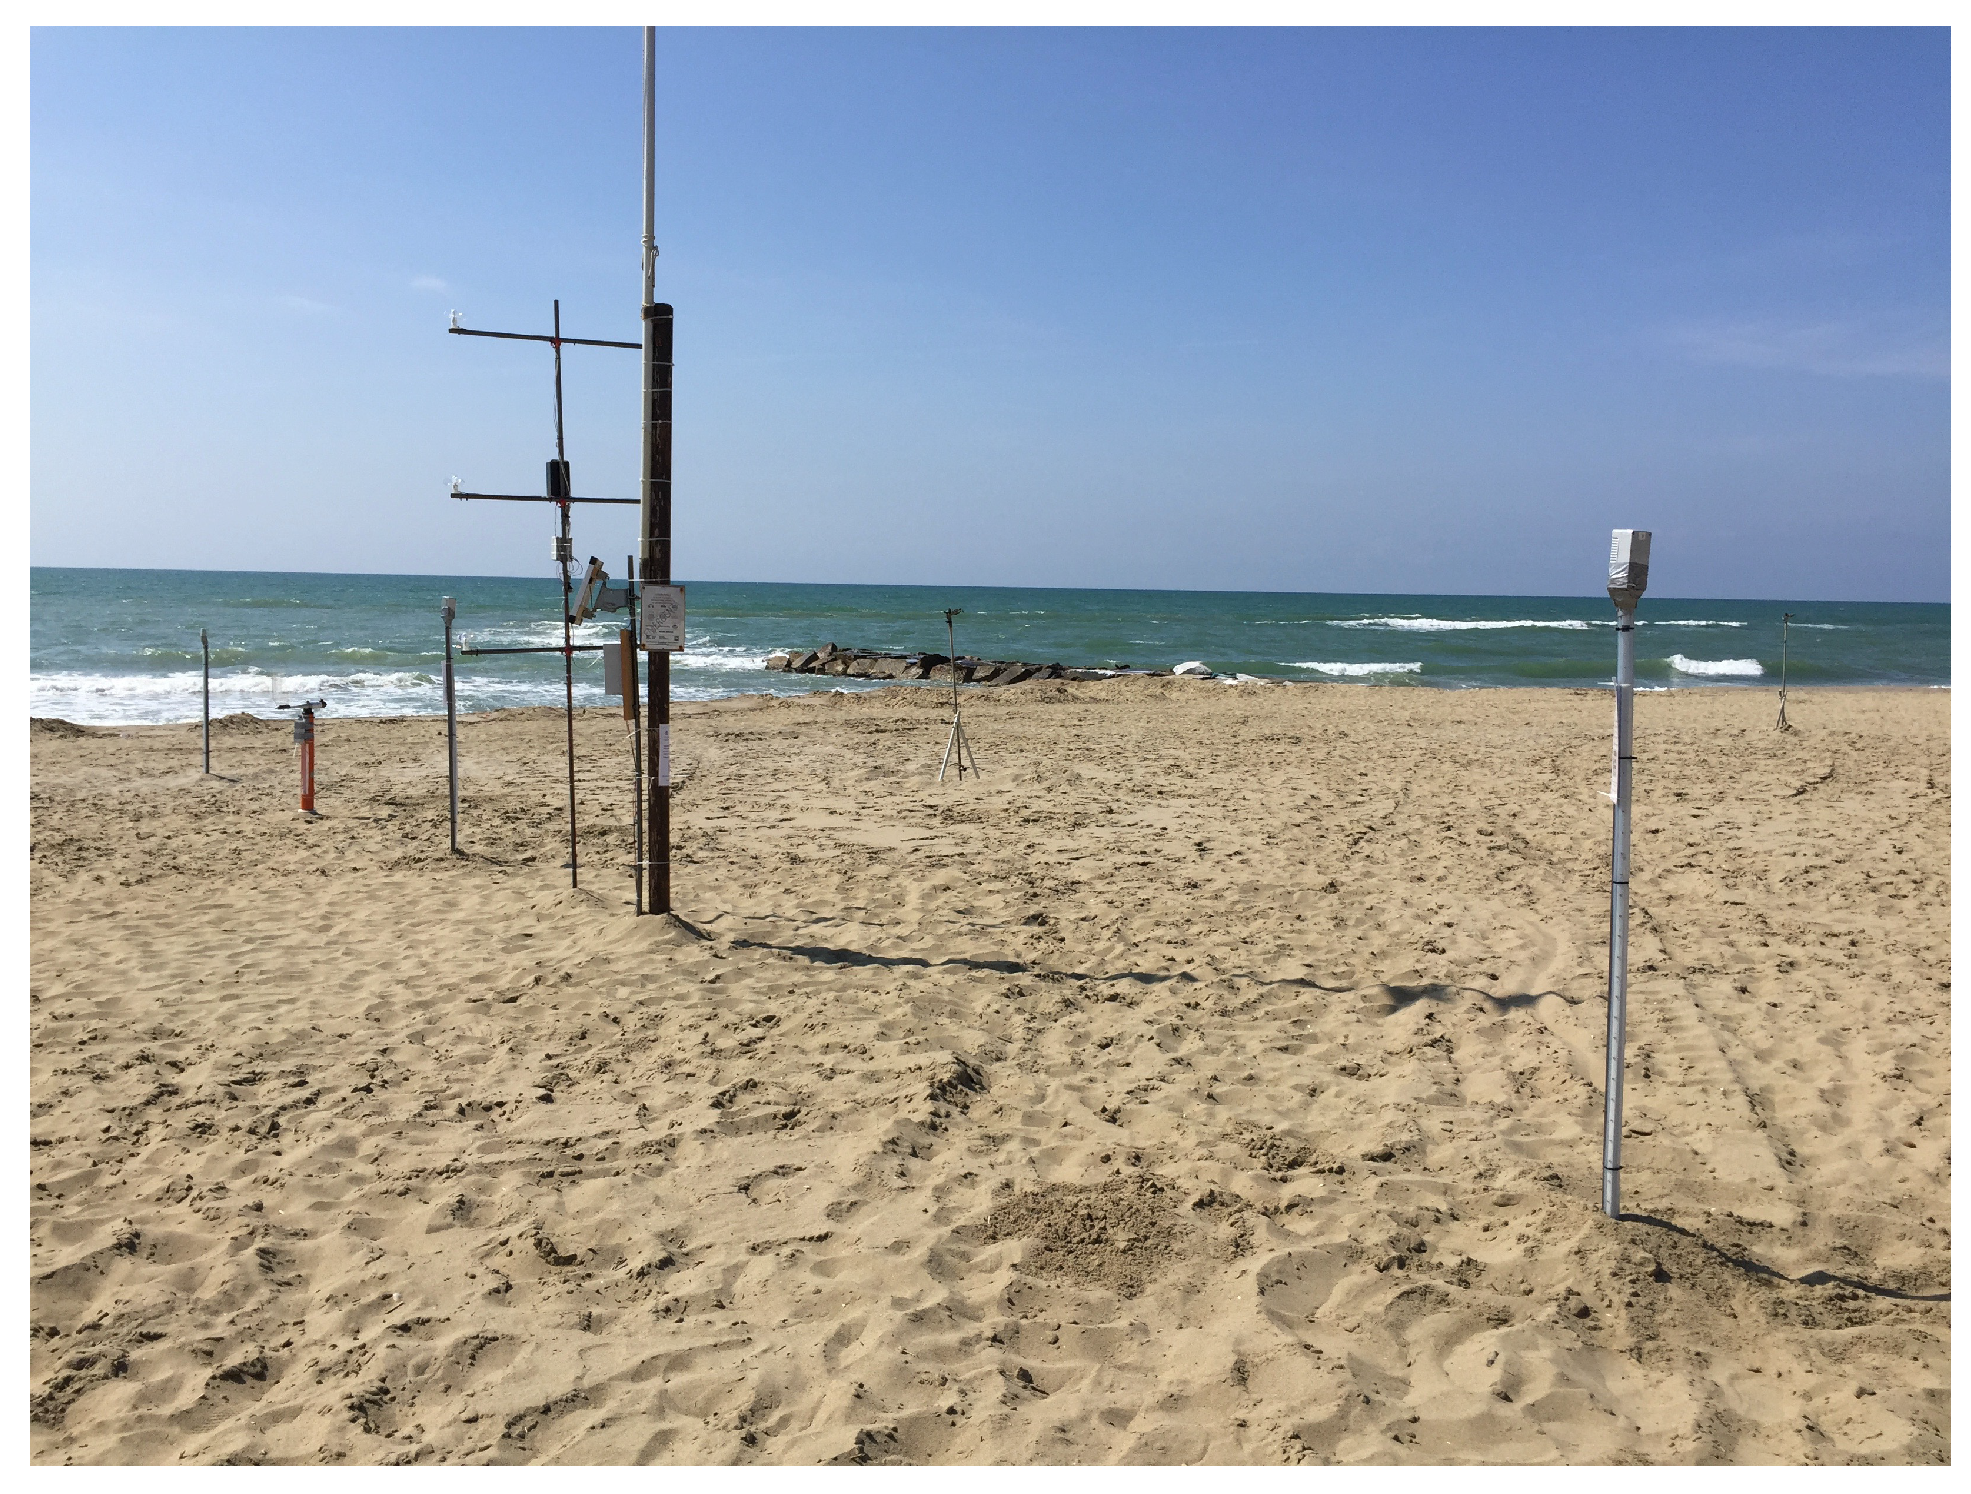
4.2. Wireless Sensor Networks
- Analysis of coastal morphodynamics for sandy beaches;
- Analysis of bedload and suspended sediment transport;
- Monitoring of marine weather and marine parameters;
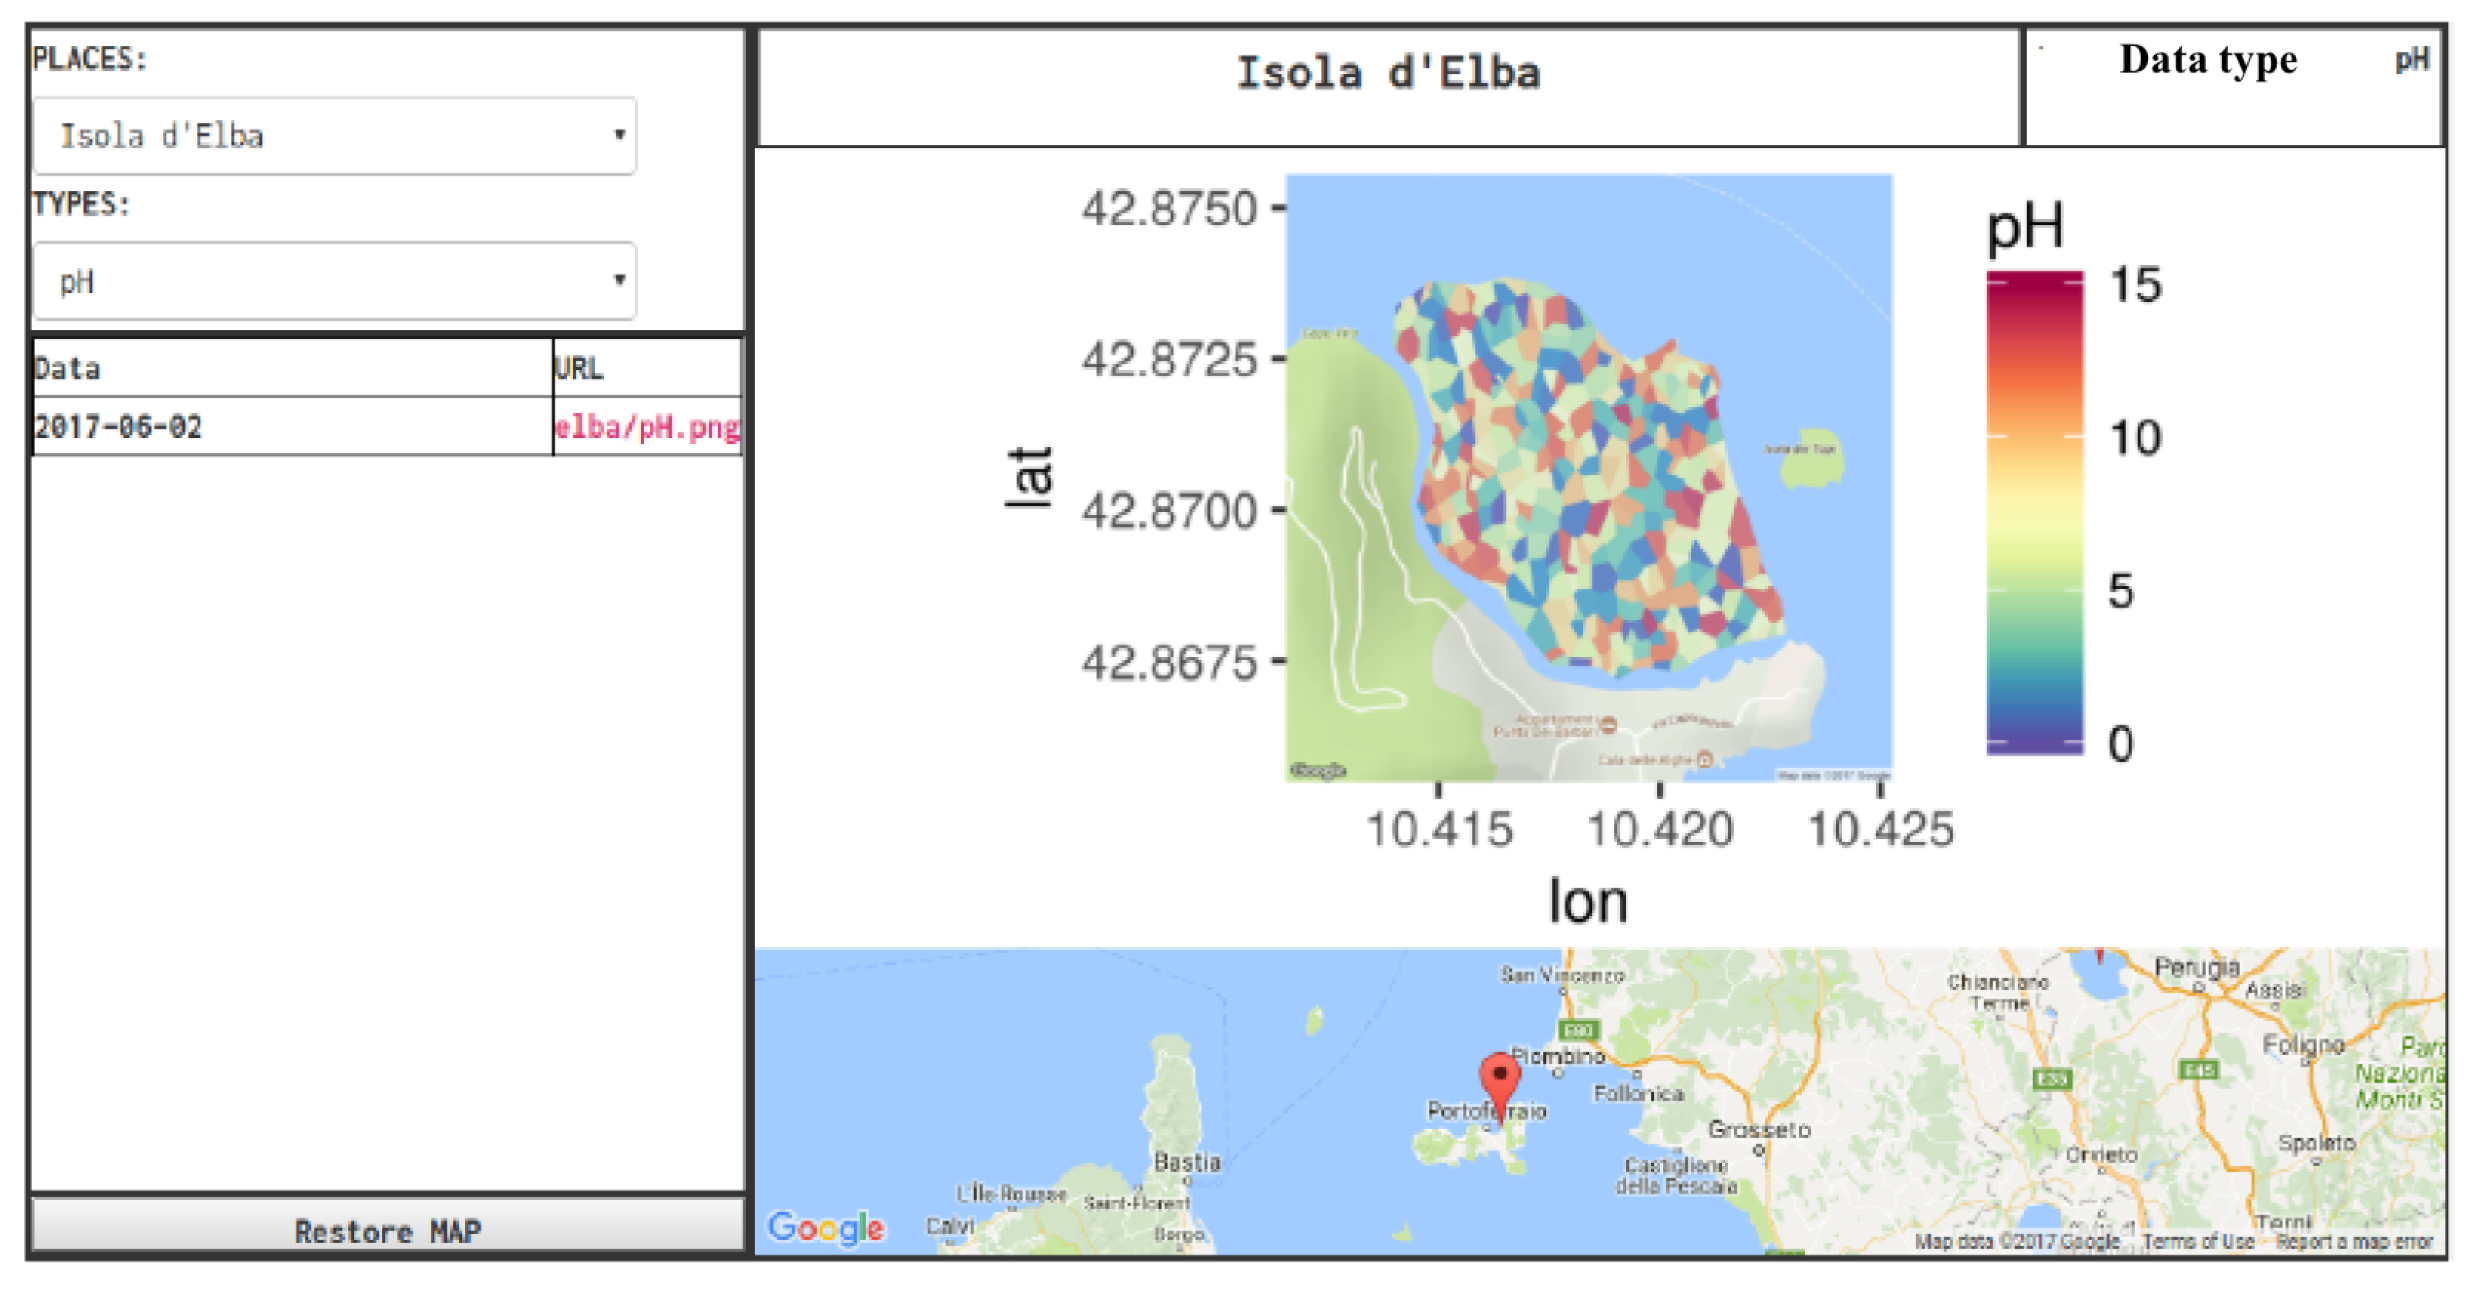
- Monitoring of water quality;
- Measurement of river sediment discharge into the sea.
4.3. Video Monitoring
4.3.1. Acquisition Systems
- The Argus Video system ([A]—http://www.planetargus.com/). The Argus video system is the first system based on video acquisition for coastal monitoring and it is considered a standard. It has been especially implemented for the coastline change detection on a long-term basis exploiting timex images analysis [78,79].The system typically consists of four to five cameras, with a total coverage of 180 degrees of HFOV (Horizontal Field Of View). The snapshot image, time exposure image and the variance image are usually collected every hour, with ten minutes of exposure time for the last two types of data. The accuracy of the measurements on the shoreline evolution has been assessed through comparison with DGPS (Differential Global Positioning System) results, leading to 0.35–2.4 m in cross-shore and 10–20 m in altimetry.
- The EVS Video system system ([B]—Erdman Video Systems—http://video-monitoring.com/). The EVS system is based on high resolution digital camera acquisition and a web-based fruition and manipulation of these resources: in fact, the built-in video server integrated in the system allows to access the camera parameters (pan/tilt/zoom) as well as the image database. An example (installation of Terracina) has been reported in Table 1.
- The Beachkeeper video system ([C]—[80]). The image elaboration system of Beachkeeper is particularly valuable because it exploits the pre-installed webcams along the beaches, while it also consents to retrieve georeferenced and rectified images as well as the timex (mean and variance) images. Giving the variability of the composition of this system, it is hard to provide a general performance reference because any assessment on the accuracy depends on the single sensor characteristics. An example (Pietra Ligure installation) is reported in Table 1.
- The KOSTA Video system ([D]—www.kostasystem.com). KOSTA coastal video monitoring is based on a photogrammetric technique, which allows for transforming 2D image coordinates into the corresponding 3D real world coordinates [81]. This is an important feature because the 3D information provides a description of the acquired scene at a different level, introducing the possibility of performing metric measures on the data.Since 2006, three KOSTA systems have been installed (www.kostasystem.com): depending on the number of sensors, their resolution and their location, the monitored area and the quality of the video images are defined (see Table 1).
- The COSMOS System ([E]—[82]). The COSMOS system is based on the geometric correction of the acquired images followed by the feature extraction (e.g., timex and variance images). Another important characteristic of this system is the fact that it is designed to work with any type of camera, providing to the final users a flexible platform in terms of installation constraints. Various sites, especially in Portugal, employ a COSMOS installation, for various purposes (coastline evolution, beach nourishment evolution, wave breaking patterns, etc.. In order to estimate the accuracy, comparison with 30 Ground Control Points (GCP) is reported.
4.3.2. Shoreline Change Detection for Coastal Monitoring
5. Data Fusion and Augmented Virtuality
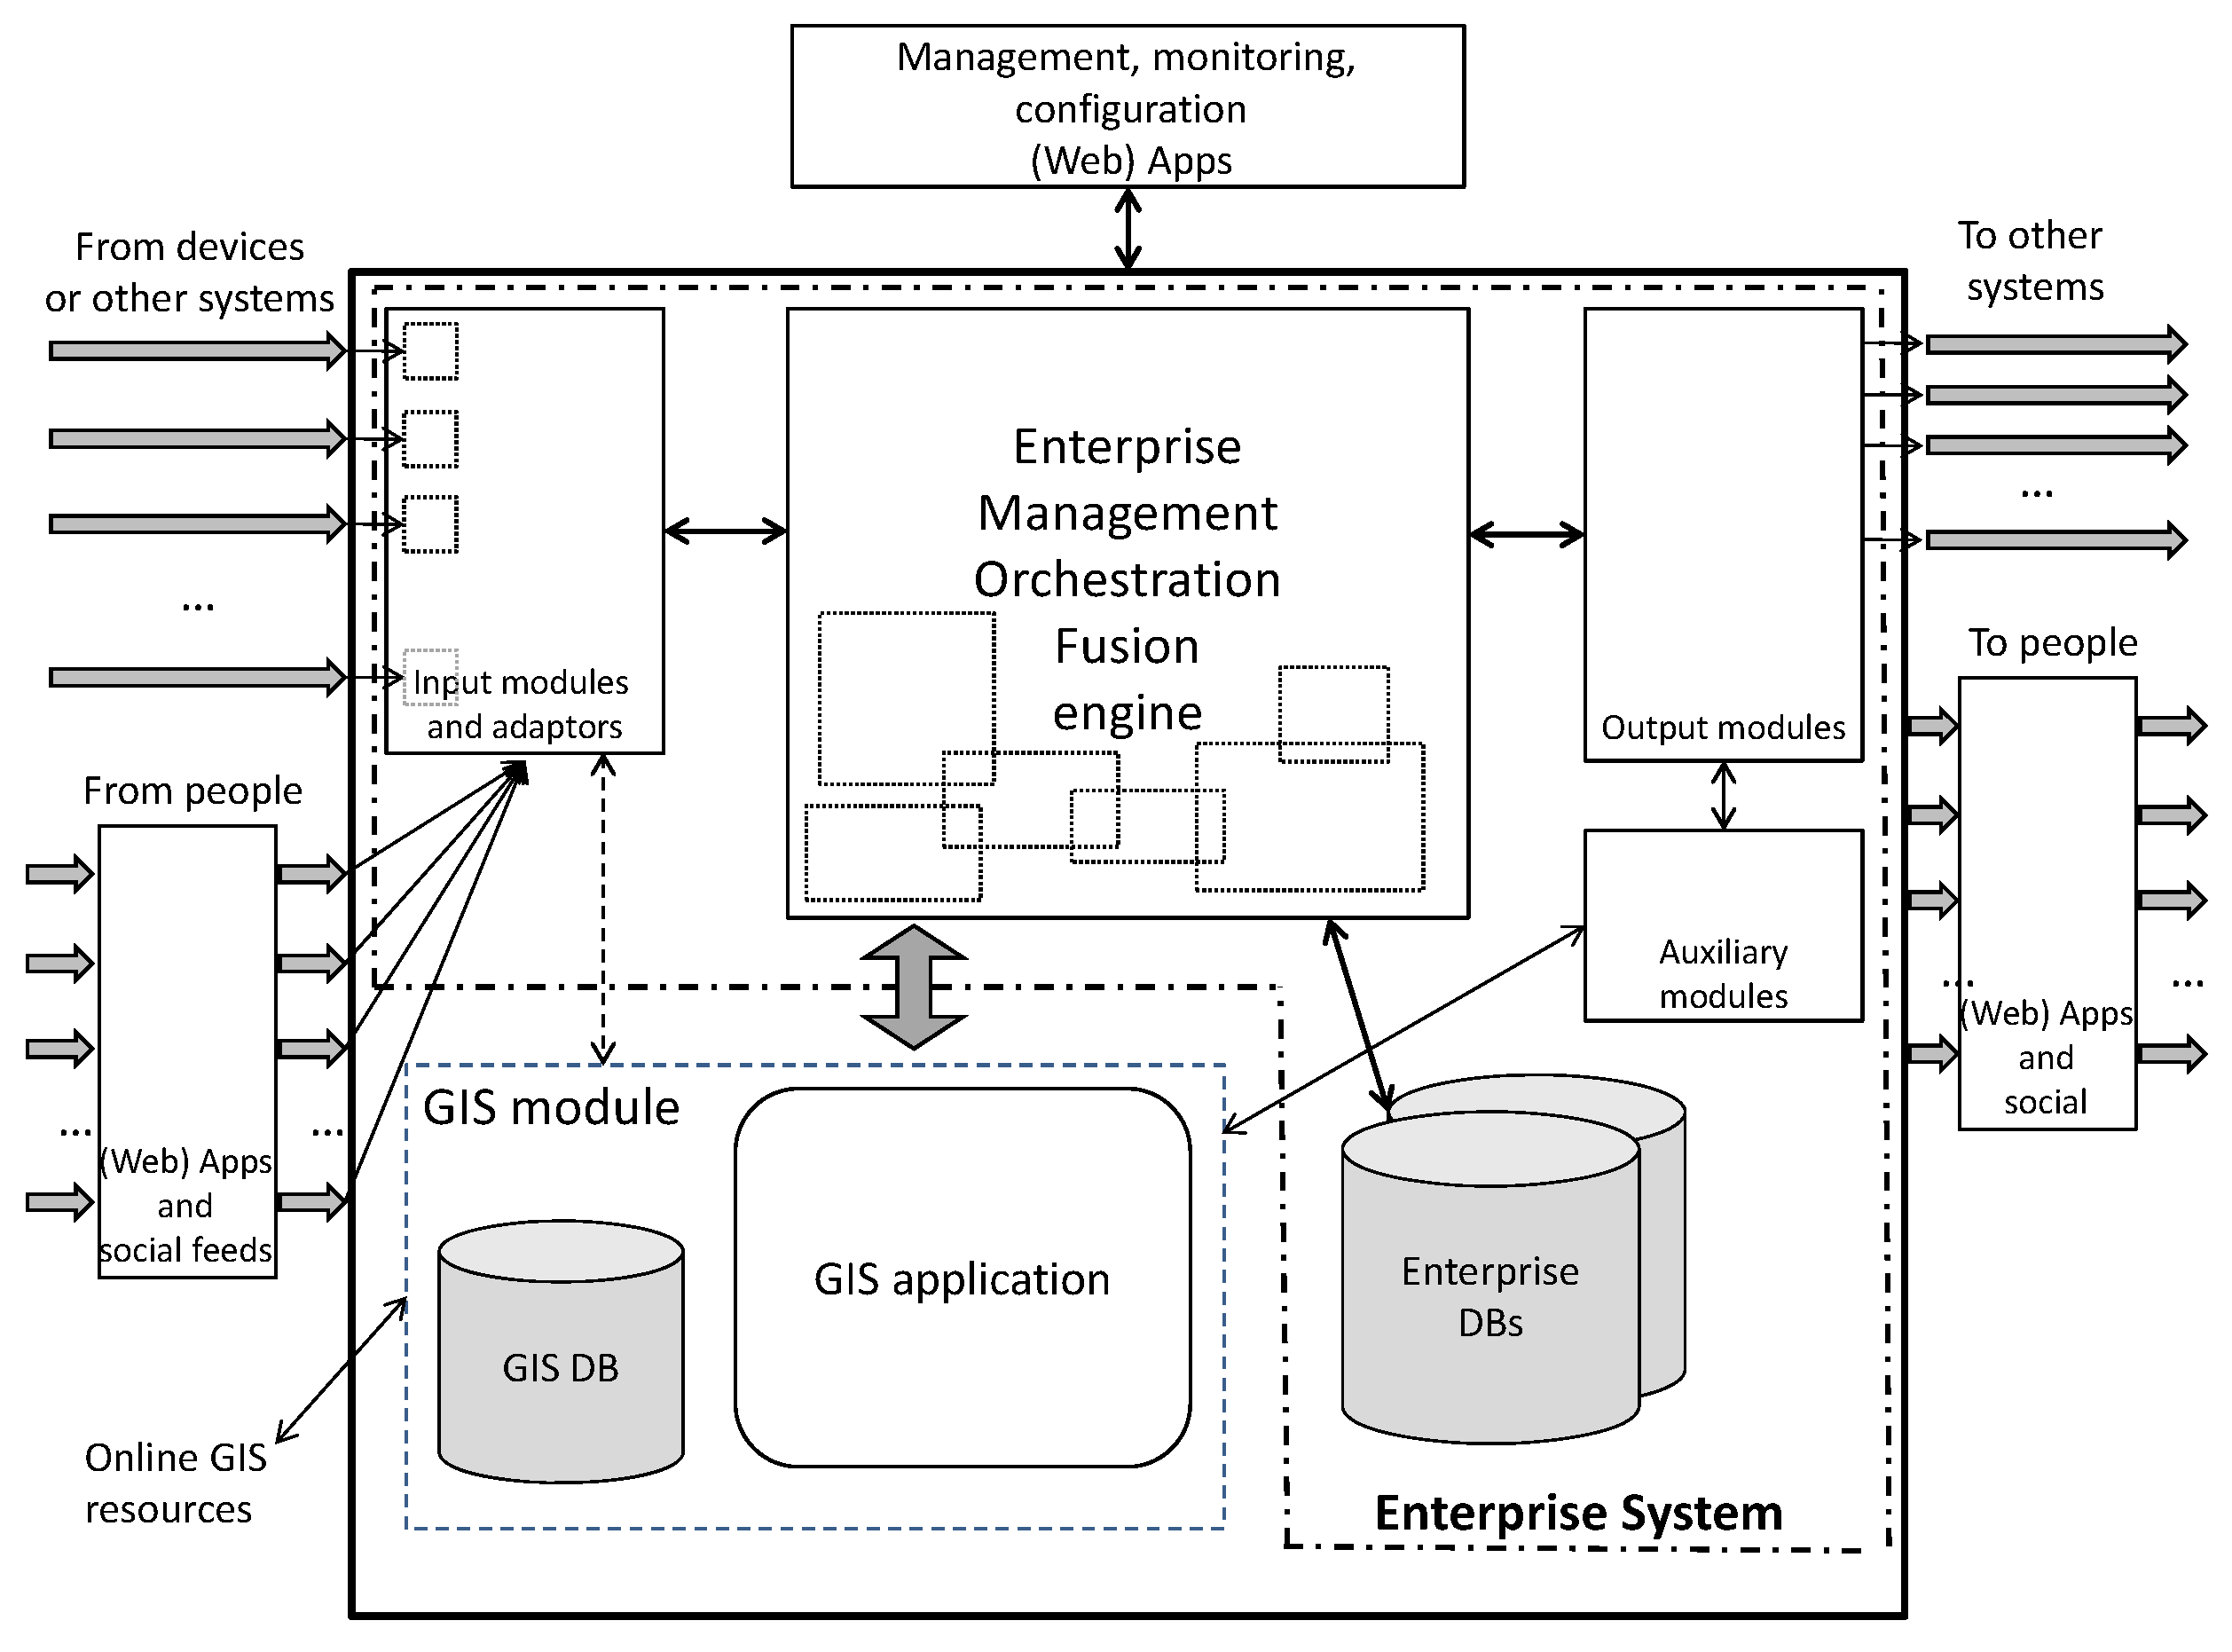
5.1. Overall System Architecture
- Ability to manage (feed (in), storing, elaboration, distribution to users and/or other systems (out) ) of heterogeneous data with high flexibility and interoperability with different systems and technologies;
- Management of data with georeferenced and time-referenced features;
- Advanced capability of data elaboration, fusion, 3D, as well as modularity of the software design in order to effectively re-use software components (i.e., I/O interface, elaboration) across specific data items, from existing libraries and effectively compose them together for fusion and related time/space elaborations.
5.1.1. System Architecture
5.1.2. Black-Box
5.1.3. White-Box
5.2. Augmented Virtuality Visualization
6. Conclusions
Author Contributions
Conflicts of Interest
References
- Bird, E.C.F. Coastline Changes; Wiley & Sons: Hoboken, NJ, USA, 1985. [Google Scholar]
- Masselink, G.; Hughes, M.G.; Knight, J. Introduction to Coastal Processes and Geomorphology; Routledge: Abingdon-on-Thames, UK, 2014. [Google Scholar]
- Bertoni, D.; Sarti, G. On the profile evolution of three artificial pebble beaches at Marina di Pisa, Italy. Geomorphology 2011, 130, 244–254. [Google Scholar] [CrossRef]
- Bruun, P. Sea-level rise as a cause of shore erosion. J. Waterw. Harb. Div. 1962, 88, 117–132. [Google Scholar]
- Leatherman, S.P.; Zhang, K.; Douglas, B.C. Sea level rise shown to drive coastal erosion. Eos 2000, 81, 55–57. [Google Scholar] [CrossRef]
- Nordstrom, K.F.; Jackson, N.L.; Roman, C.T. Facilitating landform migration by removing shore protection structures: Opportunities and constraints. Environ. Sci. Policy 2016, 66, 217–226. [Google Scholar] [CrossRef]
- García-Mora, M.R.; Gallego-Fernández, B.; Williams, A.T.; García-Novo, F. A coastal dune vulnerability classification. A case study of the SW Iberian Peninsula. J. Coast. Res. 2001, 17, 802–811. [Google Scholar]
- Alquini, F.; Bertoni, D.; Sarti, G.; Ciccarelli, D.; Pozzebon, A.; Melo Júnior, J.C.F.; Vieira, C.V. Vulnerability assessment of a coastal dune system at São Francisco do Sul Island (Santa Catarina, Brazil). IOP Conf. Ser. Earth Environ. Sci. 2016, 44, 052028. [Google Scholar] [CrossRef]
- Islam, M.A.; Mitra, D.; Dewan, A.; Akhter, S.H. Coastal multi-hazard vulnerability assessment along the Ganges deltaic coast of Bangladesh—A geospatial approach. Ocean Coast. Manag. 2016, 127, 1–15. [Google Scholar] [CrossRef]
- Jangir, B.; Satyanarayana, A.N.V.; Swati, S.; Jayaram, C.; Chowdary, V.M.; Dadhwal, V.K. Delineation of spatio-temporal changes of shoreline and geomorphological features of Odisha coast of India using remote sensing and GIS techniques. Nat. Hazards 2016, 82, 1437–1455. [Google Scholar] [CrossRef]
- Suhura, S.; Nithyapriya, B.; Revanth Reddy, L.; Philipose, N.; Manisha, M.; Dwarakish, G.S. Coastal Land Use/Land Cover and Shoreline Studies for Dakshina Kannada Coast, Karnataka, India. Water Resour. Manag. 2018, 78, 269–281. [Google Scholar]
- French, P.W. Coastal Defences: Processes, Problems and Solutions; Routledge: Abingdon-on-Thames, UK, 2001. [Google Scholar]
- Bertoni, D.; Alquini, F.; Bini, M.; Ciccarelli, D.; Giaccari, R.; Pozzebon, A.; Ribolini, A.; Sarti, G. A technical solution to assess multiple data collection on beach dunes: The pilot site of migliarino San Rossore regional park (Tuscany, Italy). Atti della Societá Toscana di Scienze Naturali Memorie Serie A 2014, 121, 5–12. [Google Scholar]
- ASFPM Foundation. Holistic Coasts: A Summary Report Based on the 4th Assembly of the Gilbert F; White National Flood Policy Forum Arlington: Arlington, VA, USA, 2013. [Google Scholar]
- Best, M.M.; Favali, P.; Beranzoli, L.; Cannat, M.; Cagatay, M.N.; Danobeitia, J.J.; Grant, F. European multidisciplinary seafloor and water-column observatory (EMSO): Power and Internet to European waters. In Proceedings of the 2014 Oceans-St. John’s, St. John’s, NL, Canada, 14–19 September 2014; pp. 1–7. [Google Scholar]
- Iannaccone, G.; Guardato, S.; Vassallo, M.; Elia, L.; Beranzoli, L. A new multidisciplinary marine monitoring system for the surveillance of volcanic and seismic areas. Seismol. Res. Lett. 2009, 80, 203–213. [Google Scholar] [CrossRef]
- Bio, A.; Bastos, L.; Granja, H.; Pinho, J.L.; Goncalves, J.A.; Henriques, R.; Rodrigues, D. Methods for coastal monitoring and erosion risk assessment: Two Portuguese case studies. Revista de Gestao Costeira Integrada 2015, 15, 47–63. [Google Scholar] [CrossRef]
- Archetti, R.; Zanuttigh, B. Integrated monitoring of the hydro-morphodynamics of a beach protected by low crested detached breakwaters. Coast. Eng. 2010, 57, 879–891. [Google Scholar] [CrossRef]
- Ciampalini, A.; Consoloni, I.; Salvatici, T.; Di Traglia, F.; Fidolini, F.; Sarti, G.; Moretti, S. Characterization of coastal environment by means of hyper- and multispectral techniques. Appl. Geogr. 2015, 57, 120–132. [Google Scholar] [CrossRef]
- Nolet, C.; Poortinga, A.; Roosjen, P.; Bartholomeus, H.; Ruessink, G. Measuring and modeling the effect of surface moisture on the spectral reflectance of coastal beach sands. PLoS ONE 2014, 9, e112151. [Google Scholar] [CrossRef] [PubMed]
- Shi, Z.; Huang, M.X. Evaluating reclamation levels of coastal saline soil using laboratory hyperspectral data. Eurasian Soil Sci. 2007, 40, 1095–1101. [Google Scholar] [CrossRef]
- Gigli, G.; Frodella, W.; Mugnai, F.; Tapete, D.; Cigna, F.; Fanti, R.; Intrieri, E.; Lombardi, L. Instability mechanisms affecting cultural heritage sites in the Maltese Archipelago. Nat. Hazards Earth Syst. Sci. 2012, 12, 1883–1903. [Google Scholar] [CrossRef] [Green Version]
- Intrieri, E.; Di Traglia, F.; Del Ventisette, C.; Gigli, G.; Mugnai, F.; Luzi, G.; Casagli, N. Flank instability of Stromboli volcano (Aeolian Islands, Southern Italy): Intergration of GB-InSAR and geomorphological observations. Geomorphology 2013, 201, 60–69. [Google Scholar] [CrossRef]
- Bardi, F.; Raspini, F.; Ciampalini, A.; Kristensen, L.; Rouyet, L.; Lauknes, T.R.; Frauenfelder, R.; Casagli, N. Space-borne and ground-based InSAR data integration: The Åknes test site. Remote Sens. 2016, 8, 237. [Google Scholar] [CrossRef] [Green Version]
- Casagli, N.; Frodella, W.; Morelli, S.; Tofani, V.; Ciampalini, A.; Intrieri, E.; Raspini, F.; Rossi, G.; Tanteri, L.; Lu, P. Spaceborne, UAV and ground-based remote sensing techniques for landslide mapping, monitoring and early warning. Geoenviron. Disasters 2016, 4, 9. [Google Scholar] [CrossRef]
- Tanteri, L.; Rossi, G.; Tofani, V.; Vannocci, P.; Moretti, S.; Casagli, N. Multitemporal UAV survey for mass movement detection and monitoring. In Proceedings of the Workshop on World Landslide Forum, Ljubljana, Slovenia, 29 May–2 June 2017; pp. 153–161. [Google Scholar]
- Small, C.; Steckler, M.; Seeber, L.; Akhter, S.H.; Goodbred, S., Jr.; Mia, B.; Imam, B. Spectroscopy of sediments in the GangeseBrahmaputra delta: Spectral effects of moisture, grain size and lithology. Remote Sens. Environ. 2009, 113, 342–361. [Google Scholar] [CrossRef]
- Solari, L.; Ciampalini, A.; Raspini, F.; Bianchini, S.; Moretti, S. PSInSAR analysis in the Pisa urban area (Italy): A case study of subsidence related to stratigraphical factors and urbanization. Remote Sens. 2016, 8, 120. [Google Scholar] [CrossRef]
- Holman, R.; Haller, M.C. Remote sensing of the nearshore. Annu. Rev. Mar. Sci. 2013, 5, 95–113. [Google Scholar] [CrossRef] [PubMed]
- Liu, Y.; Islam, M.A.; Gao, J. Quantification of shallow water quality parameters by means of remote sensing. Prog. Phys. Geogr. 2003, 27, 24–43. [Google Scholar] [CrossRef]
- Power, H.E.; Holman, R.A.; Baldock, T.E. Swash zone boundary conditions derived from optical remote sensing of swash zone flow patterns. J. Geophys. Res. 2011, 116, C06007. [Google Scholar] [CrossRef]
- Teodoro, A.; Pais-Barbosa, J.; Goncalves, H.; Veloso-Gomes, F.; Taveira-Pinto, F. Identification of beach hydromorphological patterns/forms through image classification techniques applied to remotely sensed data. Int. J. Remote Sens. 2011, 32, 7399–7422. [Google Scholar] [CrossRef]
- Teodoro, A.; Pais-Barbosa, J.; Veloso-Gomes, F.; Taveire-Pinto, F. Evolution of beach hydromorphological behaviour and classification using image classification techniques. J. Coast. Res. 2009, 56, 1607–1611. [Google Scholar]
- Xu, J.; Zhang, Z.; Zhao, X.; Wen, Q.; Zuo, L.; Wang, X.; Yi, L. Spatial and temporal variations of coastlines in northern China. J. Geogr. Sci. 2014, 24, 18–32. [Google Scholar] [CrossRef]
- Doxaran, D.; Froidenfond, J.M.; Lavander, S.; Castaing, P. Spectral signature of highly turbid waters application with SPOT data to quantify suspended particulate matter concentrations. Remote Sens. Environ. 2002, 81, 149–161. [Google Scholar] [CrossRef]
- Min, J.E.; Ryu, J.H.; Lee, S.; Son, S. Monitoring of suspended sediment variation using Landsat and MODIS in the Seamangeum costal area of Korea. Mar. Pollut. Bull. 2012, 64, 382–390. [Google Scholar] [CrossRef] [PubMed]
- Tang, D.L.; Kawamura, H.; Doan, H.; Takahashi, W. Remote sensing oceanography of a harmful algal bloom off the coast of southeastern Vietnam. J. Geophys. Res. Ocean 2016, 109, C03014. [Google Scholar] [CrossRef]
- Ryu, J.H.; Won, J.S.; Min, K.D. Waterline extraction from Landsat TM data in a tidal flat. A case study in Gomso Bay, Korea. Remote Sens. Environ. 2002, 83, 442–456. [Google Scholar] [CrossRef]
- Kuenzer, C.; van Beijma, S.; Gessner, U.; Dech, S. Land surface and environmental challeges of the Niger Delta, Africa: Remote sensing-based analyses spanning three decades (1986–2013). Appl. Geogr. 2014, 53, 354–368. [Google Scholar] [CrossRef]
- Gosh, M.K.; Kumar, L.; Roy, C. Monitoring the coastline change of Hatia Island in Bangladesh using remote sensing techniques. ISPRS J. Photogramm. Remote Sens. 2015, 101, 137–144. [Google Scholar] [CrossRef]
- Yang, H.; Lee, D.G.; Kim, T.H.; Sumantyo, J.T.S.; Kim, J.H. Semi-automatic coastline extraction method using Synthetic Aperture Radar images. In Proceedings of the 16th International Conference on Advanced Communication Technology, Pyeongchang, Korea, 16–19 February 2014; pp. 678–681. [Google Scholar]
- Baselice, F.; Ferraioli, G. Unsupervised coastal line extraction from SAR images. IEEE Geosci. Remote Sens. Lett. 2013, 10, 1350–1354. [Google Scholar] [CrossRef]
- Fruneau, B.; Achache, L.; Delacourt, C. Observation and modeling of the Saint-Etienne-de-Tine’e Landslide using SAR interferometry. Tectonophysics 1996, 265, 181–190. [Google Scholar] [CrossRef]
- Singhroy, V.; Mattar, K.E.; Gray, A.L. Landslide characterisation in Canada using interferometric SAR and combined SAR and TM images. Adv. Space Res. 1998, 21, 465–476. [Google Scholar] [CrossRef]
- Ferretti, A.; Prati, C.; Rocca, F. Permanent Scatterers in SAR interferometry. IEEE Trans. Geosci. Remote Sens. 2001, 39, 8–20. [Google Scholar] [CrossRef]
- Ferretti, A.; Fumagalli, A.; Novali, F.; Prati, C.; Rocca, F.; Rucci, A. A new algorithm for processing interferometric data-stacks: SqueeSAR. IEEE Trans. Geosci. Remote Sens. 2011, 49, 3460–3470. [Google Scholar] [CrossRef]
- Lanari, R.; Mora, O.; Manunta, M.; Mallorqui, J.J.; Berardino, P.; Sansosti, E. A small baseline approach for investigating deformation on full resolution differential SAR interferograms. IEEE Trans. Geosci. Remote Sens. 2004, 42, 1377–1386. [Google Scholar] [CrossRef]
- Hooper, A.; Zebker, H.A.; Segall, P.; Kampes, B. A new method for measuring deformation on volcanoes and other natural terrains using InSAR persistent scatterers. Geophys. Res. Lett. 2004, 31. [Google Scholar] [CrossRef]
- Sun, H.; Zhang, Q.; Zhao, C.; Yang, C.; Sun, Q.; Chen, W. Monitoring land subsidence in the southern part of the lower Liahoe plain, China with a multi-track PS-InSAR technique. Remote Sens. Environ. 2017, 188, 73–84. [Google Scholar] [CrossRef]
- Notti, D.; Galve, J.P.; Mateos, R.M.; Montserrat, O.; Lamas-Fernandez, F.; Fernandez-Chacon, F.; Roldan-Garcia, F.J.; Perez-Pena, J.V.; Crosetto, M.; Azanon, J.M. Human-induced coastal landslide reactivation. Monitoring by PSInSAR techniques and urban damage survey (SE Spain). Landslides 2015, 12, 1007–1014. [Google Scholar] [CrossRef]
- Mancini, F.; Dubbini, M.; Gattelli, M.; Stecchi, F.; Fabbri, S.; Gabbianelli, G. Using Unmanned Aerial Vehicles (UAV) for High-Resolution Reconstruction of Topography: The Structure from Motion Approach on Coastal Environments. Remote Sens. 2013, 5, 6880–6898. [Google Scholar] [CrossRef] [Green Version]
- Bell, M. Shallow Water Bathymetry Using the REMUS 100 Autonomous Underwater Vehicle (No. DSTO-TR-2916); Defence Science and Technology Organisation Edinburgh (Australia) Maritime Operations Division: Edinburgh, Australia, 2013.
- Shcherbina, A.Y.; Gawarkiewicz, G.G.; Linder, C.A.; Thorrold, S. Mapping bathymetric and hydrographic features of Glover’s Reef, Belize, with a REMUS autonomous underwater vehicle. Limnol. Oceanogr. 2008, 53, 2264–2272. [Google Scholar] [CrossRef]
- Hagen, P.E.; Storkersen, N.; Marthinsen, B.E.; Sten, G.; Vestgard, K. Rapid environmental assessment with autonomous underwater vehicles—Examples from HUGIN operations. J. Mar. Syst. 2008, 69, 137–145. [Google Scholar] [CrossRef]
- Antonelli, G. Underwater robots; Springer International Publishing: Berlin/Heidelberg, Germany, 2014. [Google Scholar]
- Leonard, J.J.; Bahr, A. Autonomous underwater vehicle navigation. In Springer Handbook of Ocean Engineering; Dhanak, M.R., Xiros, N.I., Eds.; Springer International Publishing: Cham, Switzerland, 2016; pp. 341–358. [Google Scholar]
- Kinsey, J.C.; Eustice, R.M.; Whitcomb, L.L. A survey of underwater vehicle navigation: Recent advances and new challenges. In Proceedings of the IFAC Conference of Manoeuvering and Control of Marine Craft, Lisbon, Portugal, 20–22 September 2006; Volume 88, pp. 1–12. [Google Scholar]
- Allotta, B.; Caiti, A.; Costanzi, R.; Fanelli, F.; Fenucci, D.; Meli, E.; Ridolfi, A. A new AUV navigation system exploiting unscented Kalman filter. Ocean Eng. 2016, 113, 121–132. [Google Scholar] [CrossRef]
- Allotta, B.; Bartolini, F.; Caiti, A.; Costanzi, R.; Di Corato, F.; Fenucci, D.; Gelli, J.; Guerrini, P.; Monni, N.; Munaf, A.; et al. Typhoon at commsnet13: Experimental experience on auv navigation and localization. Annu. Rev. Control 2015, 40, 157–171. [Google Scholar] [CrossRef]
- Di Corato, F.; Fenucci, D.; Caiti, A.; Costanzi, R.; Monni, N.; Pugi, L.; Ridolfi, A.; Allotta, B. Toward underwater acoustic-based simultaneous localization and mapping. Experimental results with the Typhoon AUV at CommsNet13 sea trial. In Proceedings of the 2014 Oceans-St. John’s, St. John’s, NL, Canada, 14–19 September 2014; pp. 1–7. [Google Scholar]
- Allotta, B.; Caiti, A.; Costanzi, R.; Fanelli, F.; Meli, E.; Ridolfi, A. Development and Online Validation of an UKF-based Navigation Algorithm for AUVs. IFAC-PapersOnLine 2015, 49, 69–74. [Google Scholar] [CrossRef]
- Duane, D.B. Tracing Sand Movement in the Littoral Zone: Progress in the Radioisotopic Sand Tracer (RIST) Study, July 1968–February 1969 (No. CERC-MISC); Coastal Engineering Research Center: Vicksburg, MS, USA, 1970. [Google Scholar]
- Chapman, D.M.; Smith, A.W. Methodology of a large scale sand tracer experiment. In Proceedings of the Third Australian Conference on Coastal and Ocean Engineering, 1977: The Coast, the Ocean and Man, Melbourne, Australia, 18–21 April 1977; p. 181. [Google Scholar]
- Nicholls, R.J.; Webber, N.B. Aluminum pebble tracer experiments on Hurst Castle Spit. In Proceedings of the Coastal Sediments, New Orleans, LA, USA, 12–13 May 1987; pp. 1563–1577. [Google Scholar]
- Bray, M.J.; Workman, M.; Smith, J.; Pope, D. Field measurements of shingle transport using electronic tracers. In Proceedings of the 31st MAFF Conference of River and Coastal Engineers, Keele, UK, 3–5 July 1996; p. 104. [Google Scholar]
- Yasso, W.E. Formulation and use of fluorescent tracer coatings in sediment transport studies. Sedimentology 1966, 6, 287–301. [Google Scholar] [CrossRef]
- Hassan, M.A.; Schick, A.P.; Laronne, J.B. The recovery of flood-dispersed coarse sediment particles, a three-dimensional magnetic tracing method. Catena Suppl. 1984, 5, 153–162. [Google Scholar]
- Ergenzinger, P.; De Jong, C. Perspectives on Bed Load Measurement; IAHS Publication: London, UK, 2003; pp. 113–125. [Google Scholar]
- Benelli, G.; Pozzebon, A.; Raguseo, G.; Bertoni, D.; Sarti, G. An RFID Based System for the Underwater Tracking of Pebbles on Artificial Coarse Beaches. In Proceedings of the 2009 Third International Conference on Sensor Technologies and Applications, Athens/Glyfada, Greece, 18–23 June 2009; pp. 294–299. [Google Scholar]
- Benelli, G.; Pozzebon, A.G.; Bertoni, D.; Sarti, G. An RFID-Based Toolbox for the Study of Under- and Outside-Water Movement of Pebbles on Coarse-Grained Beaches. IEEE J. Sel. Top. Appl. Earth Obs. Remote Sens. 2012, 5, 1474–1482. [Google Scholar] [CrossRef]
- Benelli, G.; Panzardi, E.; Pozzebon, A.G.; Bertoni, D.; Sarti, G. An analysis on the use of LF RFID for the tracking of different typologies of pebbles on beaches. In Proceedings of the 2011 IEEE International Conference on RFID-Technologies and Applications, Sitges, Spain, 15–16 September 2011; pp. 426–431. [Google Scholar]
- Corke, P.; Wark, T.; Jurdak, R.; Hu, W.; Valencia, P.; Moore, D. Environmental wireless sensor networks. Proc. IEEE 2010, 98, 1903–1917. [Google Scholar] [CrossRef]
- Albaladejo, C.; Sanchez, P.; Iborra, A.; Soto, F.; Lopez, J.A.; Torres, R. Wireless sensor networks for oceanographic monitoring: A systematic review. Sensors 2010, 10, 6948–6968. [Google Scholar] [CrossRef] [PubMed]
- Xu, G.; Shen, W.; Wang, X. Applications of wireless sensor networks in marine environment monitoring: A survey. Sensors 2014, 14, 16932–16954. [Google Scholar] [CrossRef] [PubMed]
- Heidemann, J.; Stojanovic, M.; Zorzi, M. Underwater sensor networks: applications, advances and challenges. Philos. Trans. R. Soc. A Math. Phys. Eng. Sci. 2012, 370, 158–175. [Google Scholar] [CrossRef] [PubMed]
- Pozzebon, A.; Bove, C.; Cappelli, I.; Alquini, F.; Bertoni, D.; Sarti, G. Heterogeneous Wireless Sensor Network for Real Time Remote Monitoring of Sand Dynamics on Coastal Dunes. IOP Conf. Ser. Earth Environ. Sci. 2016, 44, 042030. [Google Scholar] [CrossRef]
- Lippmann, T.C.; Holman, R.A. The spatial and temporal variability of sand bar morphology. J. Geophys. Res. 1990, 95, 11575–11590. [Google Scholar] [CrossRef]
- Kroon, A.; Aarninkhof, S.G.J.; Archetti, R.; Armaroli, C.; Gonzalez, M.; Medri, S.; Osorio, A.; Aagaard, T.; Davidson, M.A.; Holman, R.A.; et al. Application of remote sensing video systems for coastline management problems. Coast. Eng. 2007, 54, 493–505. [Google Scholar] [CrossRef]
- Turner, I.L.; Anderson, D.J. Web-based and ’real-time’ beach management system. Coast. Eng. 2007, 54, 555–565. [Google Scholar] [CrossRef]
- Brignone, M.; Schiaffino, C.F.; Isla, F.I.; Ferrari, M. A system for beach video-monitoring: Beachkeeper plus. Comput. Geosci. 2012, 49, 53–61. [Google Scholar] [CrossRef]
- Trucco, E.; Verri, A. Introductory Techniques for 3-D Computer Vision; Prentice Hall, Inc.: Upper Saddle River, NJ, USA, 1998. [Google Scholar]
- Taborda, R.; Silva, A. COSMOS: A lightweight coastal video monitoring system. Comput. Geosci. 2012, 49, 248–255. [Google Scholar] [CrossRef]
- Chickadel, C.C.; Holman, R.A.; Freilich, M. An optical technique for the measurement of long-shore currents. J. Geophys. Res. Oceans 2003, 108. [Google Scholar] [CrossRef]
- Boak, E.H.; Turner, I.L. Shoreline definition and detection: A review. J. Coast. Res. 2005, 21, 688–703. [Google Scholar] [CrossRef]
- Holland, K.T.; Vinzon, S.B.; Calliari, L.J. A field study of coastal dynamics on a muddy coast offshore of Cassinobeach, Brazil. Cont. Shelf Res. 2009, 29, 503–514. [Google Scholar] [CrossRef]
- Short, A.D.; Trembanis, A.C. Decadal scale patterns in beach oscillation and rotation Narrabeen Beach, Australia—Time series, PCA and wavelet analysis. J. Coast. Res. 2004, 20, 523–532. [Google Scholar] [CrossRef]
- Davidson, M.; Van Koningsveld, M.; de Kruif, A.; Rawson, J.; Holman, R.; Lamberti, A.; Medina, R.; Kroon, A.; Aarninkhof, S. The CoastView project: Developing video-derived Coastal State Indicators in support of coastal zone management. Coast. Eng. 2007, 54, 463–475. [Google Scholar] [CrossRef]
- Lucas, B.D.; Kanade, T. An Iterative Image Registration Technique with an Application to Stereo Vision. In Proceedings of the 7th international joint conference on Artificial intelligence, Vancouver, BC, Canada, 24–28 August 1981; pp. 674–679. [Google Scholar]
- Rusu, R.B.; Cousins, S. 3D is here: Point cloud library (PCL). In Proceedings of the IEEE International Conference on Robotics and automation (ICRA), Shanghai, China, 9–13 May 2011; pp. 1–4. [Google Scholar]
- Hirschmuller, H. Stereo processing by semiglobal matching and mutual information. IEEE Trans. Pattern Anal. Mach. Intell. 2008, 30, 328–341. [Google Scholar] [CrossRef] [PubMed]
- Fielding, R.T. Architectural Styles and the Design of Network-Based Software Architectures. Ph.D. Thesis, University of California, Irvine, CA, USA, 2000. [Google Scholar]
- Adamczyk, P.; Smith, P.; Johnson, R.; Hafiz, M. REST and Web Services: In Theory and in Practice. In REST: From Research to Practice; Springer: Berlin/Heidelberg, Germany, 2011. [Google Scholar]
- Web 2.0 and Service Oriented Architectures (SOA). Available online: https://en.wikipedia.org/wiki/Web_2.0 (accessed on 14 February 2018).
- O’Reilly, T. What Is Web 2.0 Design Patterns and Business Models for the Next Generation of Software. 2005. Available online: http://www.oreilly.com/pub/a/web2/archive/what-is-web-20.html (accessed on 14 February 2018).
- O’Reilly, T.; Battelle, J. Web Squared: Web 2.0 Five Years On. Web 2.0 Summit: San Francisco, CA, 2009. Available online: https://conferences.oreilly.com/web2summit/web2009/public/schedule/detail/10194 (accessed on 14 February 2018).
- Software as a Service (SaaS). Available online: https://en.wikipedia.org/wiki/Software_as_a_service (accessed on 14 February 2018).
- Java Enterprise Edition (EE). Available online: http://www.oracle.com/technetwork/java/javaee/overview/index.html (accessed on 10 March 2018).
- Oracle Documentation. Java Native Interface (JNI). Available online: https://docs.oracle.com/javase/8/docs/technotes/guides/jni/c (accessed on 14 February 2018).
- Oracle Documentation. Building RESTful Web Services with JAX-RS. Available online: https://docs.oracle.com/javaee/7/tutorial/jaxrs.htm (accessed on 14 February 2018).
- Oracle Documentation. Java Architecture for XML Binding (JAXB). Available online: https://docs.oracle.com/javaee/7/tutorial/jaxrs-advanced007.htm (accessed on 14 February 2018).
- Oracle Documentation. Enterprise Beans. Available online: https://docs.oracle.com/javaee/7/tutorial/partentbeans.htm#BNBLR (accessed on 14 February 2018).
- Holz, D.; Holzer, S.; Rusu, R.B.; Behnke, S. Real-time plane segmentation using RGB-D cameras. In Robot Soccer World Cup; Springer: Berlin/Heidelberg, Germany, 2011; pp. 306–317. [Google Scholar]
- Schnabel, R.; Wahl, R.; Klein, R. Efficient RANSAC for point-cloud shape detection. Comput. Graph. Forum 2007, 26, 214–226. [Google Scholar] [CrossRef]
- Kao, J.Y.; Tian, D.; Mansour, H.; Vetro, A.; Ortega, A. Moving object segmentation using depth and optical flow in car driving sequences. In Proceedings of the 2016 IEEE International Conference on Image Processing (ICIP), Phoenix, AZ, USA, 25–28 September 2016; pp. 11–15. [Google Scholar]
- Lin, H.; Shi, Z.; Zou, Z. Maritime Semantic Labeling of Optical Remote Sensing Images with Multi-Scale Fully Convolutional Network. Remote Sens. 2017, 9, 480. [Google Scholar] [CrossRef]


| Acquisition System | Sensor(s) | Range | Frame Rate | Type of Processed Data | Resolution | Accuracy |
|---|---|---|---|---|---|---|
| ARGUS | From 4 to 5 RGB cameras | From 40 m up to 2.5 km | 1 h (10 min exposure for timex and variance images) | Snapshot- timex- variance images + rectified image | (referred to the rectified image)—0.1 m (x,z), 0.5 m (y) at 100 m from the station/0.5 m (x,z), 12.5 m (y) at 1 km from the station | (Estimated with DGPS w.r.t. GCP), 0.35–2.4 m in cross range, 10–20 m in vertical range |
| EVS (ex. Terracina installation) | From 4 to 5 RGB cameras | n.a. | 5 timex images per day | Snapshot- timex- variance images + rectified image | (referred to the rectified image)—1.2 m in cross range—14 m in along range | n.a. |
| BeachKeeper (ex. Pietra Ligure installation) | One webcamera | n.a. | 25 images/30 s | Snapshot- timex- variance images + rectified image | depends on the single sensor resolution characteristics | (Estimated with DGPS w.r.t. GCP)—0.15–0.5 m in cross range—0.55–2.9 m in along range |
| KOSTA (ex. Bakio installation) | 5 RGB cameras (16 mm lens + 4 with 12 mm lens) | n.a. | 1 hour (10 min exposure for timex and variance images) | Snapshot- timex- variance images + rectified image | (referred to the rectified image)—0.4 m in cross range—5 m in along range at 1 km from the station | n.a. |
| COSMOS (ex. Norte Beach, Nazaré installation) | One MOTOBIX camera at 3.1 Mpx | n.a. | n.a. | Snapshot- timex- variance images + rectified image | (referred to the rectified image)—0.1 m–10 m in cross range—<2 m in along range at 1 km from the station | (Estimated with DGPS w.r.t. GCP)—rms = 1.18 m in cross range—rms = 9.93 m in along range |
| CosMan (if ZEDcam is employed) | 4Mpx, 1/3” RGB Stereo module | From 0.5 m up to 20 m (Depth range with 12 cm of baseline) | From 15 up to 100 fps | Disparity- depth image + 3D point cloud | From WVGA up to 2.2 K—depth resolution is the same as the video resolution | n.a. |
| CosMan (if arbitrary RGB sensor is used with arbitrary baseline) | Arbitrary resolution and focal length | From 5 m up to 1 km (Depth range with ≥90 cm and ≤1.5 m of baseline) | From 15 up to 30 fps | Disparity- depth image + 3D point cloud | Depth resolution is the same as the video resolution | n.a. |
| Data | Details | Format | Notes |
|---|---|---|---|
| Waves | period, direction, height | record | Numeric + vector, spot (pos), continuous (time) |
| Granulometry | various parameters on samples | record | Numeric + vector, spot (pos), spot/periodic (time) |
| Pebble movement | displacement per pebble vs. previous position | record | Vector, zone + spot (pos), spot + delta (time) |
| Pebble abrasion | size and weight changes per pebble | record | Numeric + vector, zone (pos), spot + delta (time) |
| Topographic profile | height from shoreline to first dune on shore-orthogonal lines | record | Numeric, spot (pos), spot (time) |
| Topographic shape | height profiles | shape | Shape file, zone (pos), spot (time) |
| Maps | vector maps of specific zones | map | Vector pdf, zone (pos), spot (time) |
| Map shapefile | specific studies | shape | shapefile, zone (pos), spot (time) |
| Weather | wind direction and speed, temperature, rain | record | Number + vector, spot (pos), continuous (time) |
| Coastline | photo mosaics, tables, polygons | shape record | Numeric + images, zone(pos), spot(time) |
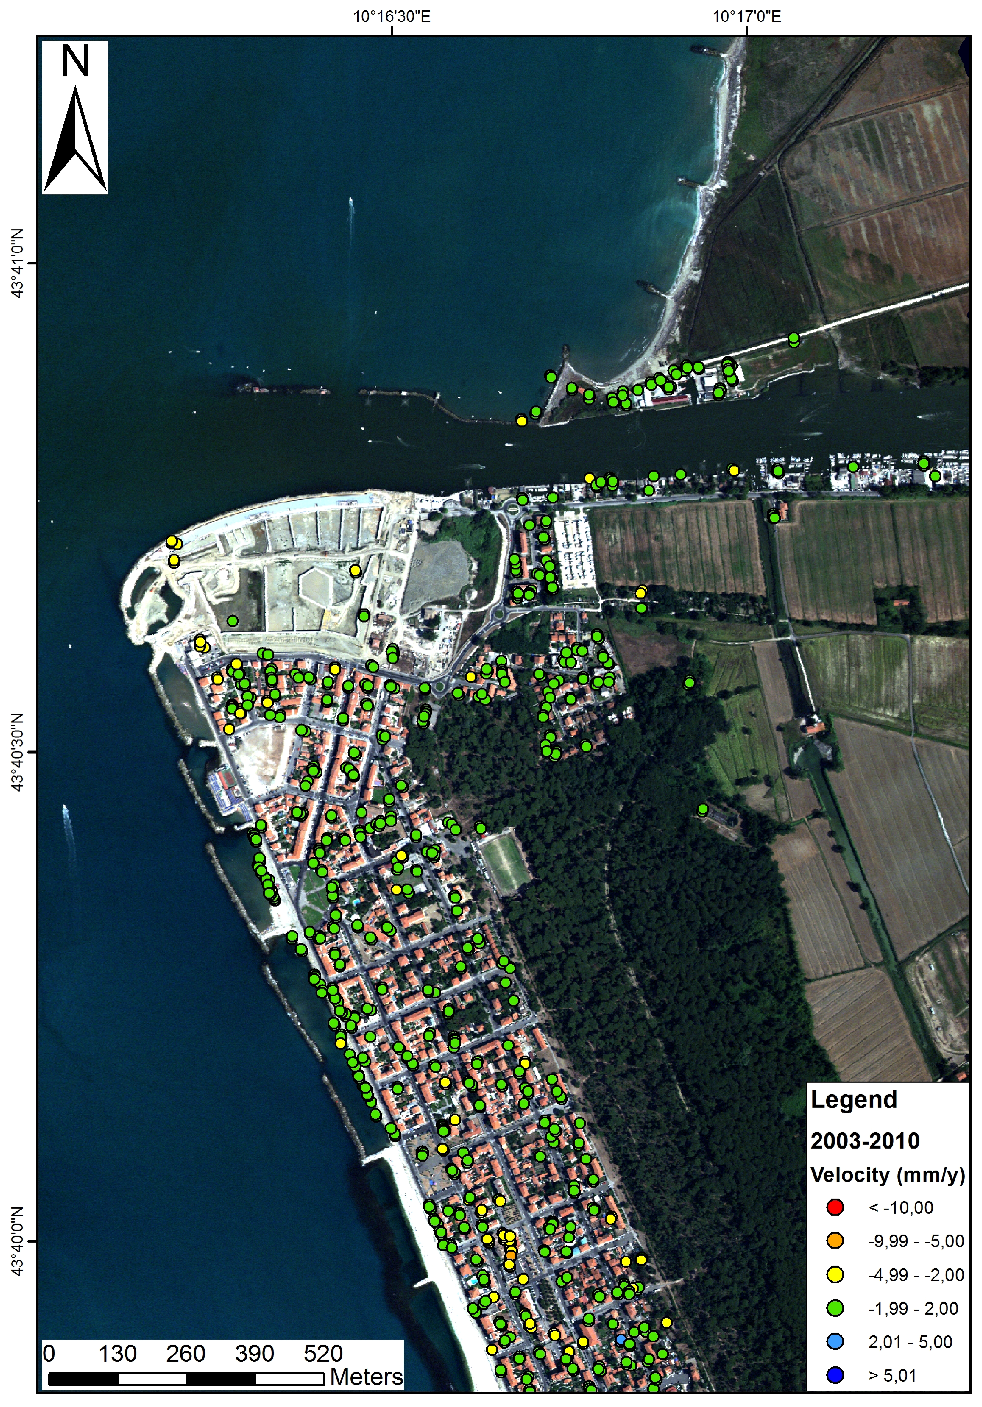
| LiDAR | Specific zones (year 2010) | asc | Lidar format, zone (pos), spot (time) |
© 2018 by the authors. Licensee MDPI, Basel, Switzerland. This article is an open access article distributed under the terms and conditions of the Creative Commons Attribution (CC BY) license (http://creativecommons.org/licenses/by/4.0/).
Share and Cite
Bartolini, S.; Mecocci, A.; Pozzebon, A.; Zoppetti, C.; Bertoni, D.; Sarti, G.; Caiti, A.; Costanzi, R.; Catani, F.; Ciampalini, A.; et al. Augmented Virtuality for Coastal Management: A Holistic Use of In Situ and Remote Sensing for Large Scale Definition of Coastal Dynamics. ISPRS Int. J. Geo-Inf. 2018, 7, 92. https://doi.org/10.3390/ijgi7030092
Bartolini S, Mecocci A, Pozzebon A, Zoppetti C, Bertoni D, Sarti G, Caiti A, Costanzi R, Catani F, Ciampalini A, et al. Augmented Virtuality for Coastal Management: A Holistic Use of In Situ and Remote Sensing for Large Scale Definition of Coastal Dynamics. ISPRS International Journal of Geo-Information. 2018; 7(3):92. https://doi.org/10.3390/ijgi7030092
Chicago/Turabian StyleBartolini, Sandro, Alessandro Mecocci, Alessandro Pozzebon, Claudia Zoppetti, Duccio Bertoni, Giovanni Sarti, Andrea Caiti, Riccardo Costanzi, Filippo Catani, Andrea Ciampalini, and et al. 2018. "Augmented Virtuality for Coastal Management: A Holistic Use of In Situ and Remote Sensing for Large Scale Definition of Coastal Dynamics" ISPRS International Journal of Geo-Information 7, no. 3: 92. https://doi.org/10.3390/ijgi7030092