Roadblocks Hindering the Reuse of Open Geodata in Colombia and Spain: A Data User’s Perspective


1
Institute of New Imaging Technologies, Universitat Jaume I, 12071 Castellón de la Plana, Spain
2
Institute for Geoinformatics, University of Muenster, 48161 Muenster, Germany
*
Author to whom correspondence should be addressed.
ISPRS Int. J. Geo-Inf. 2018, 7(1), 6; https://doi.org/10.3390/ijgi7010006
Submission received: 13 October 2017
/
Revised: 13 December 2017
/
Accepted: 23 December 2017
/
Published: 27 December 2017
Abstract
:Open data initiatives are playing an important role in current city governments. Despite more data being made open, few studies have looked into barriers to open geographic data reuse from a data consumer’s perspective. This article suggests a taxonomy of these barriers for Colombia and Spain, based on a literature review, an online questionnaire, and workshops conducted in four cities of these two countries. The taxonomy highlights that issues such as outdated data, low integration of data producers, published data being difficult to access, misinterpretation and misuse of released data and their terms of use are the most relevant from the data consumer’s point of view. The article ends with some recommendations to open data providers and research as regards steps to make open geographic data more usable in the countries analyzed.
1. Introduction
Open data holds the promise of “dramatically reduc[ing] the time and money citizens need to invest to understand what government is doing and to hold it to account” [1]. The word “open” can be interpreted in many ways (for a recent review, see [2]), but throughout this article it is used in line with the Open Definition: “Open means anyone can freely access, use, modify, and share for any purpose” [3]. Providing datasets freely for access and re-use has received the increasing attention of public bodies and society who see it as a means to improve governance and stimulate knowledge-driven economic growth [4]. The concept of open data is now entering the mainstream, with 51 countries (i.e., about 25% of all countries in the world) having an open government data (OGD) initiative according to [1]. For the purpose of this paper, we use Kučera et al. [5], Attard et al. [6]’s OGD definition, as a specific subset of data which lies at the intersection of two domains: open data and government data. Empowering citizens to take full advantage of available open data, is a promising way to foster innovation and citizens-centric solutions for cities (see [7]).
The geographic community has carried out considerable effort from international to the local level, developing and implementing an integrated way to promote the sharing process of geographic data. Local Spatial Data Infrastructures (SDI) were since 1992 [8] a way to tackle issues such as standardization, integration, and accessibility shaping a framework that combines institutional arrangements, several technologies, and new policies around geodata. SDIs have been only attractive for limited and specialized geographic communities, and as discussed in [9], could benefit from existing trends (one of these being open, distributed and linked data).
Opening up data is valuable, but using available open data to provide useful services to citizens is equally important. According to Andrus Ansip, Vice-President of the Digital Single Market of the European Commission, “Data should be able to flow freely between locations, across borders, and within a single data space. In Europe, data flow and data access are often held up by localization rules or other technical and legal barriers. If we want our data economy to produce growth and jobs, data needs to be used. However, to be used, it also needs to be available and analyzed” [10]. Along the same lines, Janssen et al. [11] stated: “Open data on its own has little intrinsic value; the value is created by its use. Supporting use should not be viewed as secondary to publicizing data”. Previous work has investigated various aspects of Open Government data initiatives. These aspects include a business model for Open Government data (OGD) [12], a measurement framework to quantitatively assess the quality of OGD [13], an index to measure the maturity of e-government openness [14], the use of semantic application programming interfaces as a way of improving access to OGD [15], and the motivations of citizens to participate in OGD projects [16], to name but a few. Complementary to these, this work takes a user-centric view, and investigates barriers faced by people when interacting with existing open data portals. The novel contributions of this article are as follows:
- Users’ reuse barriers in Colombia and Spain. While the literature has listed some challenges with respect to open data and open data portals (e.g., in [11,17]), asking users what actually hinders them has been less often undertaken. Some studies come close to what the current article tries to achieve, but differ substantially either in their method or scope. For example, Lourenço [17] did an analysis of open data portals from an ’ordinary citizens’ point of view’, but his analysis did not rely on inputs from actual citizens. Horrigan and Rainie [18] survey Americans’ views, Beno et al. [19] analyzed the Austrian context, and Schmidt et al. [20] aimed at being global (with participants from over 80 countries), but this article aims at being local and geographic focused—with a focus on Colombia and Spain—and gathers its empirical evidence through both surveys and workshops. This work took four cities within two countries as use cases.
- An empirical evidence to validate barriers identified previously in the literature. The empirical evidence is no basis for a validation of barriers from the literature in general. Rather the light shed in the paper contributes to make some conclusions as regards to the four cities examined, namely Bogotá (Colombia), Medellín (Colombia), Cali (Colombia) and València (Spain). In particular, currency, accessibility, terms of use, and data quality were recurrently mentioned by the participants as obstacles. This suggests that these four barriers still deserve close attention from research, and data producers (at least in the cities examined).
The barriers were compiled using three sources: a review of the existing literature on open data, an online survey with 195 participants, and a set of workshops with a total of 155 participants. The participants were developers, analysts, journalists, students, open data experts, professors, politicians, and users with geographic background from cities in Colombia and Spain. The main data users’ barriers identified were categorized into six groups: (1) currency; (2) discoverability; (3) accessibility; (4) terms of use; (5) usability, and (6) data quality. The remainder of the paper is organized as follows. Section 2 reviews related work on Open Government, barriers from a data producer perspective, as well as open geodata reuse issues. The research method used in this work to compile and validate barriers to open data reuse from a data consumer’s perspective is described in Section 3. Section 4 lists the main findings from literature review, the survey conducted, and a set of participatory workshops. This section also introduces a data user’s taxonomy using a fishbone diagram. Section 5 discusses the results obtained, and the paper ends in Section 6 with recommendations for data authorities of the cities surveyed.
2. Related Work
This section points to concepts from previous work taken into consideration for this research. It touches upon Open Government data, the value of open data reuse, as well as the relevant role of open geodata reuse and the implications to include data users’ perspective at a local level.
2.1. Open Government Data
Defined by Kučera et al. [5] as government-related data that is created and published in the way that meets with the Open Definition [3]. OGD is seen as a current trend and a key factor in cities with intersection with Open Data initiatives. Ubaldi [4] defined OGD as the combination of government data (as any data and information produced or commissioned by public bodies) and Open Data (data which can be freely used, reused, and distributed by anyone). Meanwhile, in order to understand the different meanings of OGD from bureaucratic, political, technological, and economic perspectives, Gonzalez-Zapata and Heeks [21] used the definition of Yu and Robinson [22] through three main foundations—open, government, and data, illustrating three intersection points to determine what OGD means. The result of this combination is government data, open data, and Open Government (actions and government decision-making process should be transparent, collaborative, and participative).
In general, local and national administrations, civil society organizations, the private sector, and overall several stakeholders are taking advantage of the intersection among open and government data. The impact of this combination can be positive in many ways. For instance, the continuous online access to government data is positively associated with knowledge absorption according to Lee et al. [23], who indicated that government data openness could positively affect the formation of knowledge bases in a country; therefore, the level of knowledge base even positively affects the global competitiveness.
However, not only the level of knowledge has been identified. When Open Government initiatives are on the table of public agencies, the expectations to improve the governance processes are certainly high. Moreover, increasing transparency, expanding the public engagement, and improving responsiveness and accountability are the desired goals of most governments. However, determining whether the Open Government initiative is effective or successful could be a challenge for many public agencies. The ambitious aims and expectations of these sorts of initiatives could lead to some failed activities that yield some immediate success but then run the risk of losing steam over time. Identifying the participant, their roles, and including them in the current Open Government initiatives and the way that data is released is illustrated by Williamson and Eisen [24] as the key to successful Open Government initiatives. Through a rubric of six questions, Williamson states that even high accessibility levels and well-publicized data are not enough to transform the government processes if people or participants do not have channels to influence it.
Due to the major role of participants, a better understanding of citizens’ motivators for engaging in Open Governments actions could guide the current initiatives to get the expected outcomes. Wijnhoven et al. [16] demonstrated that when citizens feel that their contribution is significant, they are more open for contributing in Open Government projects. Besides, Wijnhoven [16] found that there is no evidence to suggest that socio-economic factors could affect the participation in those Open Government projects, whereby projects that appear to be well-implemented have a better reaction from citizens than others that only focus their attention on some stakeholders. In the same direction, a well-detailed description and the way in which data is shared could have a positive impact on the participation of citizens. Afful-Dadzie and Afful-Dadzie [25] collected the preferences of media practitioners in five countries in Africa, and observed that online journalists see metadata as the most important factor in a functioning OGD, followed by data format and data quality.
In particular, there are some factors that can influence the level of success of the implementation of Open Government initiatives, especially for authorities that require a solution beyond the current administration. Wang and Lo [26] looked into some of those factors in Taiwan; their study disclosed that perceived benefits, organizational readiness, and external pressures have a positive effect on OGD adoption. On the contrary, perceived barriers seemed not to have any significant effect on OGD initiatives adoption.
Overall, the participation and interaction with the general public, the identification of their needs, and the sustainability of OGD actions are a particular focus of the current studies. Beyond accessibility, the scope is now moving to determine factors and barriers to using or reusing the available public sector data (e.g., crime rates, gas emission, mobility, air quality, or security). Since many available datasets and likewise many cities are in the middle of the implementation stage of open data government initiatives, the aim of authorities is to motivate users to reuse the published data and create a new bunch of services, generating value for data-opening projects. Local experiences of cities, local needs, and kinds of data could bring a differential factor in the way to reuse the available OGD. In the following sections, we will discuss why the reuse of open geographic data is becoming necessary in current open data initiatives and why barriers from a data users’ perspective are preventing full advantage being taken of the data release process in which many cities are involved.
2.2. Why is the Reuse of OGD Necessary?
Beyond access to OGD, the creation of value is perhaps the most interesting part of open data systems, in which economics, social, and political benefits are being established in local governments. Official entities are trying to increase the transparency of their processes and empower their citizens by publishing a vast list of relevant data. Ubaldi [4] provide a work about OGD, in which a list of commonly recognized main beneficiaries of OGD can be found, where the wider economy, the private sector, and the public service marketplace provide the opportunity to increase the innovation expected by official authorities. Access to data by itself does not offer new services or make a difference with other private data provider companies, per se. New value-added services must come in addition to data to bring more opportunities to developer companies to pursue the commercial exploration of OGD. This commercial approach and a new bunch of value-added services are possible when data is reused [27].
Assuming that greater openness automatically creates value [4], which is a common mistake in many governments. The OGD systems should include the value chain as part of the initiatives, where conditions to develop value-added services and indicators to measure the impact of released data are included as a relevant part of the systems. Local governments and cities overall have an essential role to play in the value chain. Combining published data with data user communities, local authorities are not only playing the role of providers; they also become a partner, facilitator, convener, and enabler of easy reuse. At the same time, empowering the data user communities that have to tackle local issues and deal with reuse barriers on a daily basis, the local level could be the key to transforming the current actions into concrete results. This integrated scenario is only possible when data authorities behind open data initiatives incorporate the reuse as part of their priorities.
Although OGD is a common topic in local governments, most of them have not understood the benefits and value of open data, but mainly the expected benefits for cities’ stakeholders. Yang et al. [28] illustrated that data authorities should not only consider data users as the general public, but also their internal departments and other agencies could be beneficial to make the data more reusable and discoverable. OGD actually offers an opportunity for local agencies to carefully survey and identify what datasets they have, which are the most used ones, and what they can share with other departments to improve internal collaboration. Thus, local governments need to educate and empower not only the general public; the first step should be to promote the open data initiatives inside their departments. Yang et al. [28] presented the concept labeled interagency as a foundation of OGD which is the positive impact on cross-boundary information sharing among cities’ agencies, where the continuous information sharing is a spiral process to reinforce the communication and at the same time reinforce the OGD initiatives.
2.3. Does Geographic Data Has a Role to Play in Open Data Times in Cities?
In a value chain where data user needs are fundamental and cities are a relevant piece of the OGD initiatives, the kind of data also has a role to play. Considering the foundations of OGD developed by Yu and Robinson [22] (data, government, and open), data is also a large concept that could be considered from a specific point of view to identify data users’ requirements. The nature of data can influence future barriers, needs, and strategies of OGD initiatives. Based on the concept of Yu and Robinson [22]—the intersection of data seen as geographic data (data with a spatial or geographic component), government initiatives, and the definition of open—could be more efficient and interesting in light of city data users’ requirements. However, is geographic data a relevant type of data that might bring more effective benefits in local government, and why can the reuse of this kind of data support authorities in their engagement strategy?
According to the Reusing Open Data report of the European Data Portal (EDP) [27], geographic data (25.8%) is the second category only surpassed by the statistical (27%) category that is most reused and also consulted by companies (among 128 domains mentioned) that try to generate revenue from open data reuse in EU member states. This report [27] also illustrates a strong correlation among open data categories, where “region & cities”, “transport”, “environment”, and “population & society” suggest a trend of organizations using those categories together.
Geographic data is considered to be one of the most economically relevant data domains for its high demand from re-users across the EU, according to the analytic report of EDP [29]. In [30], the impact of current open data was analyzed using 19 use cases around the world. Three involved the geospatial sector, with public authorities in Denmark, Great Britain, United States. Additionally, more use cases geographically related in Singapore, and Uruguay where the impact is assessed in terms of improving services, economic growth, and data-driven engagement. Geographic data has specific characteristics that also demand specific needs from data users; therefore, the identification of those requirements might contribute to improving the OGD initiatives in cities.
In general, there is a great deal of published work regarding the reuse of open data and why it is one of the challenges for current initiatives. Barry and Bannister [31] have selected the occurrences of some themes surrounding open data, mentioning that data sharing and reuse are two themes with a high number of occurrences, demonstrating a focus on making the most of the resource of public sector information. Literature has analyzed economics [12,32,33], technical, institutional [28,34], political and policy [35,36] factors that influence the value chain of open data, suggesting that theoretical benefits have not been seen as cities’ stakeholders expected [6,11,27,31,34,37].
Regarding the overlay of initiatives between national and local efforts, both working to improve their Open Government’s efforts, in many cases datasets are offered on several websites [28] in a fragmented way, which is in some cases difficult to find. Adequate metadata are also necessary to improve data reuse [11].
2.4. Barriers to Open Government Data Reuse
Much published work is related to open data and desired benefits that this trend might bring to governments and its stakeholders. There are several authors [11,19,31,34,37,38,39] who have worked on open data barriers from different perspectives; most of the work done has been focused on national governments, OGD initiatives applied for data producers, integrators, or suppliers. Beyond promoting a sustainable reuse of Open Government data in cities, a constant and circular reuse should be considered in OGD initiatives.
In Janssen et al. [11], a set of benefits, adoption barriers, and five myths of open data initiatives are defined; most of them are still present in current initiatives. For instance, myth number five is about open data and the incorrect interpretation that will result as Open Government. In Section 2.1 it was explained that releasing open data is only the first stage in getting the expected benefits of Open Government, especially collaboration and participation. The process can only start when the published data is used. Janssen also suggested a set of adoption barriers from a national government perspective; however, at the local level, barriers, data user communities, and even the expected benefits may vary. Likely, national and local levels are both pursuing the improvement of accessibility, legal issues, and technical integration concerns, but the contact with data users could be easier at the city level. Factors such as reuse, feedback, channels to influence, and integration requirements create a solid way to work towards the benefits mentioned.
Barry and Bannister [31] also worked on the definition of open data barriers when the data is published from a data integrator perspective. They took Ireland as a use case, creating a detailed comparison among the current literature about open data barriers, and proposed a new barrier schema as a taxonomy of release barriers from senior managers in this country.
Yang et al. [28] suggested factors that could reduce the possible impact of published data, using several authorities in Taiwan as a use case. Thus, their work presents those factors as barriers from data producer perspective and at the national level. Another related paper about barriers—but at a local level—was published by Conradie and Choenni [37]. They found that the ways in which data is stored, obtained, and used by local departments are crucial indicators of open data release. Conradie and Choenni [37] suggest taking small incremental steps to explore and learn about the data release, avoiding releasing data for political or internal purposes.
In the literature, there are also some reports created by the European Commission and its project EDP; the initial and related report taken into account is the reuse of open data [27] from a business perspective. This report presents a study of several companies—most of them from the private sector—around their business model built using open data. It lists a set of factors that European countries or corporations should consider to promote the reuse of open data. Internal and external barriers that do not allow the standardization and automatization of open data are defined, and at the same time, some recommendations for the public and private sectors are illustrated.
Another report related to the last one by the European Commission is the fifth analytic report of the EDP [29], where barriers are seen as a core of the problem to reusing open data, basically from two perspectives: data producers or suppliers and data consumers. However, this report is based on the same findings as the reuse and maturity level report [40] that the European Commission studied as well. The description of the barriers are listed according to the national level in the EU28+ countries of Europe and their open data initiatives.
2.5. Geographic Data Reuse Barriers and the Importance of Data Users’ Perspective
The above-mentioned report [29] showed an insight that is relevant to this research—the role of the geospatial domain in the open data movement. Presenting some barriers from a data producer perspective, the authors discuss why geospatial data plays a major role in an open data strategy for any country.
Many of the identified barriers to improving the reuse level of OGD has been already tackled from the geographical community several years ago before the open data movement has started being recognized by public administrations and research field. In cities but especially in countries issues like standardization, accessibility or integration of several data sources has been a constant headache for many geographic institutions. Since 1993, the term SDI was coined by the U.S. National Research Council to define a framework of technologies, policies, and institutional arrangements working together to facilitate the creation, sharing, and use of geospatial data and related information resources across an information-sharing community [8,41]. Such a framework can be implemented at local, national, regional or even international levels to allow different stakeholders have the effective and easy access to official, high data quality, and standard geographic information. Taking into account the important role of cities, Harvey and Tulloch [42] presented a typology of local-government data sharing arrangements in the US in times where the local SDI was moving to a second generation. Authors [42] suggested that political, institutional and economic factors need be considered in local governments to guarantee the effectiveness of the sharing-data process and likewise a continuous reuse of geodata in cites.
Janssen et al. [11] suggested the creation of open data infrastructure as a possible way to guarantee a constant support around all political, institutional and even technical issues that are involved in the sharing data process. At the same time, current local SDI projects have a significant challenge regarding the way that geographic data user communities are using and re-using the available data, leading both projects with a common problem, which could be tacked working together. Both in local open data initiatives and local SDI, the role of data user is fundamental, a better understanding of their needs or requirements could be the key factor to refine the current initiatives and find the way to be more effective.
There are few authors consider a data user’s perspective at the local level. In Zuiderwijk et al. [43] work a particular emphasis on the components of the open data ecosystem where users’ pathways reveal the direction of how open data can be used, then the initiative can use this direction to move towards data users’ requirements. Based on the work’s conclusions, three aspects are especially salient: (1) More and clear information related to license or terms of use. Data re-users get confused more often than data producers think (despite the fact that the terms of use are included in most of the open data portals). Additionally, most of them are difficult to read; (2) More statistical and geographic context. This means that raw data is important and is considered to be a requirement to consider published data as open [44]; however, it is necessary to include statistical and spatial relationships to guide users to understand what this data is about. Including comparison with other regions, or neighborhoods with different geographic features, a comparison during the time or even with the inclusion of basic statistics, published data can reach more users’ attention offering an enriched perspective, than only a list of downloads. Finally, (3) Feedback for both data providers and data users; providing ways to discuss, both sides can learn and enhance the value of available data. This component is likely one of the most forgotten resource in current open data initiatives, where the feedback resource is limited to email contact or a questionnaire to end-users to express some issue. Only few open data portals have a proper systematic way to discuss issues, use cases, best practices or suggestions from end-users, and also show updated data or features to their community.
2.6. Summary
To summarize, previous work—using interviews, surveys, workshops, or sets of references—has identified a set of barriers mostly from a data producer point of view, where national authorities are having the main role of open data initiatives. Regarding the reuse of open data, there is not too much work done; we found only four related references, none of them have considered the possible potential of geographic data, or the role that cities can play. The number of articles that examine reuse obstacles from a data user’s perspective is also limited. As a contribution of this work to address this gap, we presented a taxonomy of barriers experienced by data users in four cities.
3. Research Method
Many authors [4,31,37,43,45] have mentioned that the potential value of open data is in its use. The re-usability and discoverability levels of open data at local levels are critical factors to truly make an impact through the city stakeholders. The main research question addressed in this article is: what barriers prevent open data reuse by data consumers? This research took place from August 2016 until May 2017 based on multiple use cases and a combination of structured online survey and hands-on activities (i.e., participatory workshops). The research covers data consumers’ barriers from three angles: a literature review, a structured online survey (what people say), and outcomes from a set of participatory workshops (what people do). The identified barriers from these three angles are summarized using a taxonomy. This taxonomy presents six obstacles to the reuse of open geographic data in cities. It can be used to inform data authorities about weaknesses of current city open data systems, thereby enabling them to design better and more effective strategies to improve the reuse of their data. This taxonomy is presented in Section 4.4.
This research took four use cases, with local authorities in the three principal cities in Colombia (Bogotá, Medellín, Cali) and the third main city of Spain (València). Initially this research studied the current status of their open data initiatives, considering that cities have different Open Government data approaches [19,24]. To enrich the discussion and reduce a possible bias of the findings considering only one city, the selected cities have distinct progress and perspectives from legal, technical, institutional, political, and awareness points of view (see Table 1). Beno et al. [19] worked in the delimitation of barriers to use open data in Austria at a national level, and claimed that “caution must be applied as the findings might not be transferable to other countries”, because there may be differences in terms of maturity of their open data “culture” and the datasets that official authorities offer. The available datasets in each city have an important role to understand possible frictions to use or reuse the data in each city. All selected cities have their own data portals. Valencia and Medellin have a central portal called “Transparency and open data portal” [46] and “OpenData Alcaldía de Medellín” [47] respectively, with considerable number of web services, mostly are geo-services, related to several city domains, such as mobility, education, environmental, urban planning, demographic and culture. In general topics that each local authority considered relevant to users and the city. Another aspect that also contribute to the diversity of the selected cities is the current role of the local authorities contacted in terms of open data “culture” in each city. Initially, both Bogotá and Cali were contacted by the local SDIs, whose principal objective is to facilitate the production of and access to geographic information in the city, thus placing the importance of open geographic data considerably high. On the other hand, in Medellín and València the authorities contacted were the City Halls, where the open data initiative is assessed and created in terms of Open Government; therefore, geographic information is taken as another type of data, and its relevance is moderately less than in Bogotá and Cali.
The combination of local official authorities, data user communities, and open data experts allow this research to take a bottom-top view of the open data schema to understand what the data users’ requirements are and their contributions to improving the reuse of open geographic data in cities. As it was mentioned by Nugroho et al. [35], a better relationship between local data authorities and data user communities stimulates the provision of data and increases the involvement of data users.
The local authorities contacted were, Bogotá SDI (Infraestructura de Datos Espaciales para el Distrito Capital - IDECA [48]), Cali SDI (Infraestructura de Datos Espaciales de Santiago de Cali - IDESC [49]), City Hall of Medellín [50] and City Hall of València [51].
The next two subsections provide some background information about the online survey and the conducted participatory workshops. Figure 1 displays an overview of the steps that this research took to collect the barriers identified and understand each open data initiative in the selected cities.
3.1. Literature Review
A literature review of open data barriers was conducted by collecting journals, conference papers, and governmental or non-governmental reports in several databases: Science Direct (eight papers related), Scopus (four papers related), and Emerald Insights (eight papers related). The words used to find related articles were, ‘barriers in open data’, ‘barriers in Open Government data’ and ‘barriers in Open Government’. Only papers that addressed barriers, challenges, issues to reuse, adoption, and releasing data were taken into account. Additionally, use was made of the cited references in papers where barriers were identified in order to enrich the discussion and literature review. The number of articles was filtered by year, choosing only articles from the last five years (2012 to present) in order to have a current approach, and only journals related to governments, open data, geography and economics were taken into account. The literature review was classified in two groups: barriers from data producers’ and users’ perspectives. In total, 12 relevant papers were selected and related to barriers to reuse. The relevance of those papers was determined by scanning and manually reviewing their title and abstract. These related papers can be found in Table 2 and Table 3 in Section 4.
3.2. Online Survey
Taking into consideration the potential data users’ barriers obtained in the literature review (Section 3.1), and considering that citizens access to data through the official open data portals, an online survey was designed with the public Google Forms web application. The survey aim was to know the barriers, errors, or problems that users have encountered while using cities’ open data portals and its shared datasets, especially geographic data web services. The questionnaire was released in three different languages (Spanish, English, and Portuguese) to gather more responses from several cities. The survey was a modular form with seven sections, including general information about the respondents (working country, city and age), their work (employment role and industry), perception of open data, possible barriers faced, most-used features in well-known cities’ open data portals, and finally method(s) used to find open data in a city—especially geographic data. The survey took about five minutes to complete, and was anonymous (i.e., no information about the name of the participant or email was collected). Participation in the survey was voluntary, and it was not necessary to answer all questions. The Appendix A presents the questions formulated in the survey. For this research, only questions related to reuse barriers and most used features in cities’ open data portals were included in the analysis (see Section 4.2).
The survey was launched in August 2016 and remained active until December 2016. The survey was shared in several ways: (1) Through social networks (e.g., Facebook, Twitter, Linkedin); (2) E-mail lists, and (3) Several open data and smart cities events during spring–winter 2016 (e.g., International Open Data Conference 2016 [52], Open Cities Summit 2016 [53], Inspire 2016 [54], Geo Mundus Conference 2016 [55], Data Latam 2016 [56], Esri User Conference 2016 [57], Esri Spain User Conference [58] and Esri Colombian User Conference 2016 [59]). The survey received replies from data users from cities in South America and Europe, but especially cities in Colombia and Spain (see Figure 2).
Overall, a total of 195 participants completed the survey. However, some of them did not completely answer the questions; therefore, some questions have a smaller sample. Only responses that were fully completed were considered. Concerning the employment role (n = 195), 25% (48) of participants saw themselves as geographic data analysts, and 19% (n = 37) as part of academia (e.g., professor, researcher, or student). It could be argued that the high prevalence of participants with a geographical background and from academia was due to the way that survey was promoted with university colleagues that helped to distribute the survey and organizations that work with geographic data. Regarding managers and project leaders, about 18% of participants (a third of respondents) were part of this group of open data users. About 17% (n = 33) saw themselves in multiple roles, as developer and analyst at the same time. Finally over 21% of participants were developers of any type of application, exclusive geographic developers, or had a different role (see Figure 3).
3.3. Participatory Workshops
Having responses from an online survey is not sufficient to understand the whole picture of open data users’ issues regarding use or reuse. To shed some additional light on users’ barriers, participatory workshops were conducted with participants from different backgrounds. The participatory workshops were called Open Data for Open Cities. Figure 4 shows that the participants in these participatory activities were developers, entrepreneurs, analysts, journalists, professors, researchers, open data experts, or data authorities who also consider themselves as data users [43]. During this stage the workshops aim was to observe, confirm the mentioned barriers in the survey, allowing to data users to express their concerns to effectively use or reuse of the available datasets in each city through the open data portals that they consider relevant for their external application or analysis. Bringing together the data user profiles that have been working in the same city give this research a broad view of the current data user barriers at a local level. To consider the cities with the most collaboration (see Figure 2), this research has chosen the aforementioned cities (see Section 3) for the workshops. Likewise, two more workshops were conducted in Castellón de la Plana, Spain and Wageningen, The Netherlands with students of a Master’s Geographic Information Science (GIScience) (33 participants) and open data experts (11 participants) in order to have better insight into barriers faced by geographic data users.
The participatory workshops lasted approximately four hours, split into two-hour sessions. The initial session was about finding suitable city open data in the official or well-know open data portal, using the main data domains defined by the contacted data authorities (e.g., mobility, education, urban planning, air pollution, crime, and others) depending on the priority of each city (see Table 1). Participants were required to create groups with three members at most, then choose one category which they found more interesting or related to their work. Once the groups were created and the category was selected, participants were required to think about a general idea, analysis, or application that included published data of each city. During the mentioned first session participants were looking and evaluating datasets and its properties to use or reuse for external projects. During this activity, participants were able to bring their own laptops or use computers provided by the organizers with access to the Internet. Details of this research were not included at the beginning of the activity in order to reduce a possible bias presenting the initially identified barriers in literature or the online survey. Participants were able to use any search method that they considered appropriate to find the open data in each city (e.g., search engines like Google, official open data portals, or any web portal). The second session was a discussion, where participants could express all the found barriers to reuse, their requirements, or common issues when they need to include open data in their work. Local authorities were also part of this discussion, but only obstacles from a data user point of view were collected.
Table 1 illustrates the general aspects of each selected city, such as population, context, current data policy regulation, main data thematics, terms of use, and identified users. In addition to the workshops mentioned above, there were two participatory workshops in different cities with other kinds of participants.
During the workshop, a follow-up questionnaire was administered regarding methods used to find data, barriers found, and users’ suggestions to overcome the obstacles found. Participants’ personal information such as name, email, and organization were collected in analog form, but not in a way that would identify them personally. This information was used to share the workshop report with participants to explore the results and insights collected. Participation in those workshops was also voluntary.
4. Findings
In the previous section, the method used in this research was presented as involving three sources: the literature, the online survey, and the participatory workshops. This section elaborates on findings, taking the same sources into consideration. Section 4.1 presents findings from the literature review, Section 4.2 shows the results of the online survey, and Section 4.3 synthesizes what people did and discussed during the participatory workshops in selected cities.
4.1. Findings from Literature
Much of the documentation that this research has reviewed referred to three aspects. (1) Benefits of Open Government implementations, through several countries, explaining the ways to reach the economic, social, or political benefits of releasing government data; (2) Regarding barriers, challenges, or issues in the literature, there are mainly two categories of open data barriers: from data producer or data user perspectives; (3) Most of the published papers discuss national governments, but the local governments are briefly mentioned in addition to the possible barriers from the data user point of view. The key findings from previous work are mentioned next.
Martin and Foulonneau [38] demonstrated through local and national cases that the sustainability of the open data initiatives needs to be considered regarding risks, challenges, and limitations, having in mind the evolution of the stakeholders involved (re-users, data creators, and national aggregators). Related to the role of users in open data systems, Janssen et al. [11] suggest that feedback and insights from this point of view must be considered in order to continuously improve. Janssen also established a list of adoption barriers of open data, presenting “Use and Participation” as part of those obstacles in the open data implementation process. Barry [31] and Conradie [37] consider the process of releasing open data as the center of attention in Open Government initiatives; they examined the barriers to open data release at national and local levels from the perspective of senior managers and six local public sector organizations.
Wang and Lo [26] examined three factors that influence the adoption of OGD, where perceived benefits of OGD are more significant than other determinants of OGD; however, looking into the perceived barriers in this work, the participants mentioned data findability, personal privacy, data layout, and licenses as potential barriers of OGD adoption in their organizations. However, not only the official governments have been consulted, in Schmidt et al. [20], global environmental data research and data infrastructure communities were considered in a survey to highlight users’ perceptions in terms of open data, and also barriers to share data. The survey revealed that “paying for data”, “varying degrees of data quality in different datasets”, and “varying standards in how data is gathered” are seen as the most significant burdens. Attard et al. [6] presented a systematic review of OGD initiatives describing 15 challenges where citizen participation is an essential factor to promote innovation among developers and other stakeholders. However, a number of barriers prevent public participation—most of them are included as cultural challenges in this work.
In terms of the private sector or organizations that have the skill to transform open data in a new bunch of innovative services is likewise a relevant group of users considered in the literature. Although Beno et al. [19] mentioned that the barriers faced by the private sector have not been sufficiently studied, the EDP project performed a study with 76 organizations across Europe [27] to understand how they use open data and what business models have been developed based on the reuse of the available data, finding that there is a mismatch between the available data sets that public organizations are releasing and the data sets that are most reused. Meanwhile, another report also from the European Data Portal project [29] presents a set of barriers faced by open data suppliers and users considering the study above in EU28+ countries. For open data publishers, the most frequently encountered obstacles are financial and legal; however, for re-users of open data, lack of awareness and low availability are the barriers most mentioned in this report. An important remark of this report is that geographical data is counted as a technical barrier; according to Carrara et al. [29], a significant part of all information used and published by public administrations and exchanged with citizens has a spatial component. Thus, aspects such as different standards, level of geographic knowledge, lack of metadata, and even file size are significant barriers that prevent users and publishers from efficiently working with geospatial data.
Notwithstanding that the benefits of open and government data have been mentioned in most of the literature, there is also some work that has been done analyzing determinants of the success or failure of open data projects, especially involving government authorities. Yang et al. [28] illustrated through four perspectives of the impact of open data initiatives in Taiwan that legislation and policy have the most significant impact. Additionally, Keefe et al. [62] used a case study of an e-Government project to explore the key factors of an open data project’s success. Revealing that the development of a management and measurement framework of all the objectives and aims can bring some success, at the same time the lack of clarity about aims and specific objectives from the side of partners could affect the project development. In Bargh et al. [63] work, the definition of Semi-Open Data paradigm is presented to define and frame initiatives and efforts that publish data but do not entirely accomplish the open data requirements. The authors presented a method to assess the level of implementation of the semi-open data in organizations, acknowledge their effort and guide them to reach the open data requirements. In fact, public agencies like Great Britain’s Ordnance Survey from geospatial services sector, got realistic economic benefits partially releasing data, developing a mixed- cost model, with some free data and also some paid data [30].
To review the barriers found in the literature and categorize what barriers belong to the data producer’s perspective and what barriers belong to the data user’s point of view, Table 2 illustrates authors, types of barriers, and the geographic context that proves that most of the work done has not considered the local level. Additionally, Table 3 presents the references where data users’ barriers were included. Finally, because most of the obstacles cited were not mentioned in the same way and there was no generic categorization found, Table 4 summarizes the number of occurrences to determine what barriers have been most analyzed. There are five relevant findings listed regarding the literature, as follows:
- Seven relevant categories of barriers considering the data producer’s point of view were most mentioned in the literature:
- Technical
- Organizational
- Legal and Policy
- Data quality
- Financial issues
- Cultural
- Use and Participation
- It seems that Use and Participation barriers are still not significant barriers; only two authors mentioned the user perception and active participation as an important issue to release or use open data.
- Regarding the previously mentioned barriers experienced by data users, the categories that were not included are as follows:
- Standardization: Included as another category where fragmentation of data, lack of interoperability, and many standards in how data is gathered are seen as issues from data re-users.
- Accessibility: It is seen as heterogeneity of formats and lack of access to re-users.
- Discoverability: Defined as how easy it is to find the data that is required. Related to other barriers such as standardization of data quality (metadata) but categorized as a remaining challenge by users.
- Categories such as legal, financial, and technical were also mentioned from a data user point of view, but were less cited.
- Data quality is still a significant burden from data producer and user perspectives.
4.2. Findings from the Online Survey
The participants were asked several questions. However, for this article, we have considered questions related to barriers regarding the reuse of open geodata in cities. The first question was: From your experience with cities’ open data portals, what do you consider to be barriers when using those portals? Using a Likert scale [64] with three options (Major barrier, Moderate barrier, Not a barrier) respondents provided their option regarding barriers listed (see Figure 5). Overall, the top five obstacles considered by respondents as the most significant obstacles for the whole sample are lack of update on published data with 68.04% (Update data) and low integration of data sources with 53.09% (Standardization). Barriers related to Accessibility such as low relevance to access for re-users and Published data is hard to access with 47.94% and 47.42%, respectively. Finally, there was Discoverability barriers related to time spent searching for data with 43% (see Figure 5).
We now turn to the top five barriers mentioned by data users in the selected cities. Table 5 shows that Lack of updated data and low integration among data producers are the major barriers mentioned by data users in each city except Bogotá, where time spent finding data was the second major burden. A possible explanation is that data users in Bogotá (46 respondents, 23%) did not mention integration as a problem, possibly due to the existence and continuous progress of their local SDI (IDECA), which integrates more than 73 local entities (see Table 5). Misunderstanding the reuse of available data and the terms of use were also relevant burdens chosen by respondents in all cities. Although in the whole sample those barriers are not considered within the top five concerns, the users of cities show a significant concern with understanding how the data can be used, and under what terms of use they are available. Finally, access to data through URL to establish a direct connection to available data in external applications or analysis processes (probably to get updated data) was chosen as another relevant barrier for data users in Bogotá, Medellín, and València.
Regarding the low relevance of URL to access data, we also gathered users’ opinions about the format or service they consider most useful for their work. This was achieved through the question what format do you consider most useful for your work? (see Appendix A) in the survey. We found that for 186 respondents, the shapefile (80.11%) is the most useful format, secondly the downloadable formats like .zip (64.52%) and CSV (58.60%) in third place. This can explain that despite the effort in open data initiatives to promote formats like RDF or access through services like REST or JSON, users still consider most useful having the data in their own computers and manipulate as they want. This result may be due to the fact that in our sample 25% were geographical data analysts (probably a cultural aspect could have had an influence, since shapefile is a well-known format by this community, see Figure 3). Others typical geospatial services, such as OGC (WMS, WFS, WMTS), KML and GeoJSON were mentioned by the participants, but had a lower percentage of occurrence (54.30%, 50.0%, and 46.24% respectively). The surprising finding was that typical machine-readable formats, such as RDF, REST even JSON have been mentioned as less useful for our respondents (see Figure 6).
The third considered question related to barriers was: From your experience, which was the most common error/barrier you have faced (not have faced) when searching or using data from city open data portals? It was an open question, and respondents were able to enter barriers from their own standpoint. The aim of this question was to identify any barriers that were not categorized or included in the question mentioned above but which are still an issue from the data users’ point of view. This question was answered by only 164 people. Some participants’ answers were not related to barriers or were challenging to interpret, and were excluded from the analysis, leaving a total of 151 valid responses for this question. Since most of the replies were in Spanish, it was necessary to translate to English, then group by categories and summarize the occurrences along the replies.
Table 6 illustrates the number of occurrences and the frequency of all barriers mentioned by data users, clustered by the categories as stated earlier. Currency is disclosed as the most mentioned category, related to available data, but not updated, 24% ( 36 occurrences) were reported for data users. This means that users not only expect a vast list of data from data providers, but the possibility of having access to current data is also a constant user requirement. Barriers related to categories such as Usability (15%, 22 occurrences), Data Quality (14%, 21 occurrences), and Standardization (13%, 20 occurrences) are also described by users as the most common errors when the available data is being used or searched. It was surprising that in this question Legal and Policy (3%, 5 occurrences) and Awareness (3%, 5 occurrences) were categories with fewer occurrences. It could be argued that current cities’ open data portals have unclear and complicated licensing schema (where sometimes it is better not to use the available data to avoid any legal trouble, as also mentioned by Beno et al. [19]).
Taking into account the responses to both questions, Table 7 summarizes the most mentioned categories. Barriers related to Currency and Usability are two significant obstacles that are not considered in the literature (see Section 4.1); however, in this Section they are validated as one of the main requirements from a data user point of view.
4.3. Findings from Participatory Workshops
During this activity, over 113 data users in selected cities (see Figure 1) discussed the data reuse and filled out over 46 follow-up questionnaires, where we asked participants about found reuse barriers and suggestions to overcome them. Since most of the replies in the questionnaires were in Spanish, it was also necessary to translate to English. Data users mentioned over 60 barriers grouped and filtered by six categories mentioned above during this activity. Table 8 groups these issues described in the selected cites; Accessibility, Usability, Data Quality, and Currency were the most frequently pointed out categories.
The lack of a relationship (direct or indirect) among the available datasets, defined as non-existent geographic or statistical context, was expressed as one the aspects to improve the usability and discoverability by data users, most of them economic analysts in the city of Medellín, geographical analysts and professors in urban planning in the city of València, and entrepreneurs who were looking for open geographic data to establish a new way to understand the education rates and their relationship with cultural indicators in city of Bogotá. In terms of accessibility barriers, two points of view have been described: user accessibility (in terms of an analyst, for whom a download option is necessary to have full control of the datasets) and re-user accessibility (in terms of developers or data enrichers, where automatic and machine access is the most relevant way to connect for their applications) [4]. Barriers related to this category were mentioned in all cities, but having most of the mentions in Cali, where GIScience master students cited the need to download the data in a suitable format to develop analysis processes concerning mobility and safety issues inside the city. Analysts have claimed, for instance, the following: “there is no download option”, “lack of mobility data”, “data only for visualization but not able to download”, and “many data related to events in the city but not suitable for analysis”.
Other accessibility barriers were mentioned by data users in València, Medellín and Bogotá; the data download option was sometimes complicated and included web log-in. Often the available data was not in a suitable format to reuse (e.g., PDF). Having data in pdf format not only restricts the automatic extraction that results in low reuse level, it is also considered to be poor open data [29,65]. Regarding data quality, “gaps of data”, “duplication of data”, “no-clear metadata”, and “no spatial resolution for local analysis” were mentioned by the journalists and analysts in each city—especially in València, where the generalization level of available data (data at regional or national scales not suitable for local analysis—e.g., air pollution). The level of updated metadata was also considered by participants as an obstacle to understanding how the published data was gathered. Technical issues which were less mentioned but also cited by developers complaining that there is not enough information to understand how to use or apply the development resource. The multi-language option in some portals is not entirely supported according to València data users. Lastly, regarding terms of use, Bogotá’s users mentioned a misunderstanding over the policy of available data.
A frequent issue mentioned by entrepreneurs and managers throughout the workshops was related to commercial use allowed in published data. This activity found a lack of clear terms of reuse in selected cities; some of them have created a specific license to use their data (e.g., IDECA in Bogotá), and other cities only have open data portal terms of use or they do not have a clear reuse policy. In general, after the set of participatory workshops and the interaction with data users from several backgrounds, Accessibility, Usability, and Currency categories have been reinforced as constant concerns from a data user point of view. Terms of use were less mentioned by data users, though this does not mean that licenses of available data are well-defined for re-users (i.e., developers). Many data users did not consider the available data “fully reusable” once the data was found in the cities’ open data portals.
4.4. Data Users’ Barriers Taxonomy
A total of six categories have been identified and validated during this research considering the data users’ barriers from literature review, using a online survey, and validating through a set of participatory workshops; each category corresponds to barriers mentioned and identified from a data user’s perspective. Figure 7 is a fishbone diagram that represents the categories and barriers that prevent the reuse of open geographic data in cities, based on the opinions from data users of selected cities.
- Currency: The lack of updated data in the local open data initiatives was considered by data users as the major barrier to reusing the available data. Outdated data and services or broken links were mentioned in both online survey and workshops as most disappointing when analysts, entrepreneurs, geospatial developers, journalists, and other data users need to include data in their processes or external applications. Having updated data is a common requirement for all kind of open data, regarding geodata, data users mentioned currency also due to the difference among the available data by paid versus the available data accessible through geo-portals. Considering that there is much work to do to get full accessibility to updated data. A possible precedent associated to this issue if the way that some geographical authorities found having a mixed-open data model, releasing only a certain among of data but keeping the most updated as a premium service [30].
- Accessibility: Although all selected cities have their own data portal initiatives, with several available data sets, accessibility barriers were mentioned over and over again by the data user communities. The most mentioned obstacles were the nonexistent or difficult way to download data for users that need full access to make a local analysis Section 4.2. As well as the low relevance of the developers’ resources for re-users that need to link the published data in external applications. However, the URL access was not the only concern; in cases where the API resources were included, the lack of documentation and guidelines to use was also cited by re-users. Ultimately, there was a lack of datasets with specific geographic component (e.g., air quality, local mobility, education, and urbanization) that was not accessible through current cities open data portals.
- Data Quality: This category is a large topic and was mentioned by the literature review (see Section 4.1) and is included in the empirical analysis that this research carries out. However, the criteria of data quality from a data user point of view could be more specific. Based on the findings of this study, the lack of metadata (especially for geographic data) was one of the major barriers mentioned by re-users. Attribute-inconsistent or gaps in published data is also a relevant feature to improve. According to data users, the possibility of predicting published data that are not complete or data which has specific characteristics (e.g., local reference system) might help them to save time. Generalization of data was cited for many users when they found relevant data which was not appropriate for local analysis or development. As an example of this issue, users mentioned an environmental use case that could be considers as an accessibility issue—the air quality data found in most of the selected cities have a regional or national scale. As another example data users in Valencia mentioned that education rates were published only in a regional or national scale which not contribute at all to analyze the local issues. Once cities become involved in open data initiatives, they need to consider extracting, processing, and integrating the correct information for the city’s needs, not only integrating any open data from several national or local departments with any local propose.
- Usability: Further barriers—especially in the participatory workshops—were related to the lack of reuse examples. Many city portals limit their actions to publishing data, but there are no examples or use cases that users can use as a guideline to understand how the data is applied or how it could be integrated with other applications. Based on the data user’s opinions, many open data portals are a vast list of data, but there is no context to understand how data could be relevant to the city. Likewise, besides the data category, there is no relationship among the available services. This lack of context creates a misunderstanding of data and misuses about how data can be applied or reused.
- Discoverability: This research identified that although all selected cities have an ongoing open data project, when users need to find the required data they search in several websites but not in the local open data initiative. Using search engines (e.g., Google, Yahoo, Bing) or in the best case the open data national initiative websites, when users were asked to find specific data such as bike routes in their city, they encountered several issues in obtaining the required data. In some occasions, users went to the data authorities’ website to find the current open data initiative, but most of them did not have the expected emphasis on the initiative. It seems that the lack of open data centralization could be a relevant usability barrier from data users’ point of view. Another mentioned obstacle was the low integration between city departments regarding the data release process—especially in Cali and València. Data users claimed that the existence of several city department websites—sometimes all of them offering a different kind of data about the same topic—could confuse and reduce the reliability of the releasing process. This minor integration could result in a significant amount of time required to find relevant or useful data.
- Terms of Use: The least-pronounced but still a common category barrier among three data sources used in this research was legal and policy concerns. Many data user communities manifested a significant misunderstanding of the terms of use or reuse of available data. Most of the open data policies around cities depend on national legal implementation; many countries have been involved in their own open data policy, and the transition to the local level could affect the way that the published data is being reused. Currently, to have a successful national open data initiative, cities have a determinant role to play in this value chain [29]. Having a consistent, clear, and integrated open data policy could attend to re-users to understand what kind of use is allowed and how they should include the published data in their external process or applications. Regarding terms of use in cities’ open data, portals are not clear and easy to read, and the reliability to reuse could be affected. As was mentioned by Beno et al. [19], potential users may feel misled when they find that available data have legal restrictions. Some entrepreneurs in the participatory workshop in Bogotá referred to the need to include whether commercial use is included or not to avoid future legal issues. This research notes that many of the terms of use available in cities’ open data portals are related to websites or portals rather than data per se. Having specific terms of reuse and use for published data might avoid any misunderstanding.
5. Discussion
Previous studies have considered open data initiatives at the national level as the scale to shape the possible benefits and implementation obstacles of open data when it is reused, considering the data release process as the core of the open data systems. This research takes another perspective, where data user needs are the basis for improving the reuse of open data. The study includes open geographic data as a type of data, local level as the scale of study, and data users with different backgrounds playing the main role. Section 5.1 summarizes barriers mentioned by data users from four cities with open initiatives with different approaches. Section 5.2 presents some remarks about the role of local data user communities and how data authorities are facing similar issues regarding license, identification process of data users, and their needs and current user engagement strategy.
5.1. Summary of Barriers
As mentioned earlier, most of the barriers to open data reuse from the literature were determined from the data producer perspective. In Section 4.1, we found that most of the authors directed their efforts towards analyzing the possible benefits, adoption barriers, implementation limitations, and determinants to having successful or failed open data initiatives. None of the references mentioned in that section has considered the role geographic data could play in the strategies of local open data initiatives to tackle OGD challenges. At the same time, the context used in the work illustrated that national efforts and the data releasing process have an important role.
In Table 3, we listed some work done taking the data user viewpoint into consideration and presenting possible obstacles that could prevent taking the full advantage of open data: Discoverability, Accessibility, and Standardization were the categories less identified. Most of the barriers related to these categories were confirmed during our online survey (see Section 4.2). Beyond these, we extended the barriers mentioned above, and found that Currency, Usability, and Data quality are additional, relevant concerns of data user communities when the open geodata is being searched or reused at a local level. These barriers were highlighted in the participatory workshops where geographic data was the most requested kind of data by users, however, also was the most criticized along the activity. Out of date web services, lack or gaps of metadata, data available without any quality control, lack of standardization of the reference systems (some services even had custom reference systems) contribute to making the task of reusing the data more difficult.
Most of the discussion in the literature is centered on accessibility issues, and indeed most of the official organizations at national or local levels take the data release process as the primary task. Data users are currently demanding to have not only accessibility [4,27]—they want to go beyond access. According to our findings (presented in Section 4.2), a constant concern in data user communities is the currency of published data. The “lack of updated published data” was selected as a significant burden for 68.04% of 195 participants in our survey. Furthermore, “misinterpretation and misuse of data” were also considered by data users as an obstacle to the efficient reuse of published data. Data catalogs with large lists of data with neither statistical nor geographical relationship or context may confuse data users and make them spend too much time searching for the relevant data.
Two of eight OGD principles are related the format that data is released and the way that data should be open to public in a machine-readable format which is also non-proprietary. This research found for the sample considered (see Section 3.2) the shapefile as most useful format (see Figure 6). The respondents consider typical geographic services like OGC services, KML, GeoJSON as more valuable than the promoted open data formats like RDF. A possible reason to explain this result could be data ambiguity existing in local open government initiatives, where format like RDF have an inadequate description, and also in the geographic community do not have a significant representation or use in the analysis process.
In [19], the lack of harmonization between portals was considered a severe burden that makes data users confused about similar available data in different portals. This research has confirmed this finding and group under the usability category barriers mentioned by data users (in all selected cities) such as “data difficult to understand”, “no relationship among published data”, or “no applications to validate the usability of available data” (see Table 8). The quality of data is also a constant burden for data user communities—in particular for data users included in this research. Although this category is already considered in the literature from a data producer perspective, it is still an aspect of improving an open data chain [40]. According to our survey and workshop participants, having data with issues like “no metadata”, “published data not geo-referenced”, or “not enough or clear metadata” considerably reduce the data source reliability, and thus the open data initiative effectiveness. Data which is not machine-readable (e.g., PDF) was another barrier mentioned in our workshops in selected cities—especially in Cali and Medellín. At the same time, issues like “data only for visualization” or “no download option” were mentioned by users that require the full control of data for local analysis. As a concrete example of this situation in València and Bogotá, the local road layers were required to create a mobility analysis. However, data users cited that there was no option to download and only visualization was possible through geo-portals.
To conclude, we revisit the research question presented in Section 3 (What barriers prevent open data reuse by data consumers?) and summarize the discussion in this paper with the following observations. We identified and explored 19 barriers, categorized them into six categories (see Section 4.4). We identified the most mentioned concerns and requirements from data users in four cities—particularly those that work daily with open geographic data. Currency was the most mentioned concern by data users from different backgrounds. Accessibility and Data quality were also highly mentioned during this research. Usability, Discoverability, and Terms of use were also included in this taxonomy of reuse barriers, having the low integration of city departments, misunderstanding of terms of use, and no geographical or statistical relationship as constant issues faced by data users in selected cities.
5.2. The Role of Cities and Their Data User Communities
The open data chain [66] is presented by the European Commission in its strategy as an interaction between official departments and open data stakeholders. Carrara et al. [27] illustrated how raw data is transformed into economic value considering the creation of data until the aggregated services. At the same time, this report categorized the roles of open data stakeholders into four types of actors: Suppliers and Aggregators in charge of the creation and aggregation process, and Developers and Enrichers generating analysis and a new bunch of data services or products. Ubaldi [4] presented a similar scheme, but included one additional step, named “final data use” as the last stage to promote the sustainability of the public data creation process. Correspondingly, Ubaldi also suggested the identification of an “ecosystem of users” that responds to specific user demands to promote the creation of value. In terms of open data ecosystems, Zuiderwijk et al. [43] proposed the essential elements of a multidimensional system where the feedback from data users in one of the key elements. Likewise, Janssen et al. [11] suggest that open data systems must consider the data users’ feedback, mentioning that “there is no insight into users’ perspective and users’ needs”.
Data user communities and their feedback is becoming more important in the current open data value chain, but the geographic context where those users are involved is also important. Indeed, cities have a relevant role to play here. During this research, several cities were considered to compare the current actions of local authorities in charge of leading the open data initiative and their data user communities. In Table 1, several aspects regarding open data in those cities are compared. The initial element was about what open data thematic is of their interest; all cities have mentioned thematics like mobility, urban planning, economic development, or security. Medellín mentioned that data urban planning around a sustainable and smart city strategy are of interest to them. This is an interesting claim. According to [29], open data could enable the reinforcement or implementation of a smart city initiative, as a more “connected” city and the development of new services related to sensors around the city could result in an important amount of data that users can use to enhance the quality of life in the city.
In relation to terms of reuse, Medellín and València have adopted a creative commons license (Attribution 4.0 International CC-BY 4.0) for their published data (see Table 1); however, it seems that this does not guarantee the prevention of any misunderstanding from a data user point of view (approximately 68% chose this as one of the major and moderate barriers in this city; see Figure 5). Cali does not have any defined open data terms of use, but the local authority follows and has a coordination mechanism in place at the national level. Likewise, 46% of their respondents mentioned “the understanding of terms of use” as a barrier. Only Bogotá—which has a local authority in charge of the open data initiative and at the same time is the Local SDI (IDECA)—has their own license (IDECA License), a kind of barrier for their users that get confused when they need to understand what use or reuse is allowed. Fifty-two percent of their participants in our survey chose “understanding terms of use” as the third barrier to use of the open data portal in Bogotá.
According to the open data value chain [29,66], developers have an important role in any open data initiatives. At the same time, they have the skills to enrich and transform the available services into new kinds of innovate services or applications that show the real potential of open data [6]. Thirty percent of our respondents were developers (see Figure 3). However, València does not consider it relevant to collect any entities or organizations who have used the available datasets. In Medellín, Bogotá, and Cali, the identification of those stakeholders is quite poor (see Table 1). Nonetheless, València , Medellín, and Bogotá users have chosen the low relevance of the URL access to data as a major obstacle and in the set of workshops, “API documentation”, “JSON files with issues”, and others were among the technical barriers most mentioned.
Finally, the internal departments in each city were also compared in this research. We found that the barrier “varying and low integration of data sources or data producers” not chosen as a major burden only in Bogotá. In other selected cities, this obstacle had an important percentage (68% for Medellín, 54% for Cali, and 53% for València). A possible explanation of this result could be the work-done of IDECA, who is a well-known authority among their data users (especially who work with geographic data), and the integration of the spatial information of more than 70 local entities. Although Cali also has a local SDI and was the authority contacted, this SDI is in an initial phase and Cali data users are only getting used to knowing what IDESC is doing and what kind of data it is publishing.
6. Limitations and Final Recommendations
This last section discusses possible ways of to using the observations made during this research. Limitations of the research are presented in Section 6.1 before the article ends with a set of recommendations in Section 6.2.
6.1. Limitations
During this research, we identified a set of barriers (see Section 4.4) from a data users point of view. Using three data sources, we aimed to identify what obstacles data users in cities face when they are looking for data, but especially when they want to reuse and incorporate the available data from a city in their projects, analysis, or external applications. In Section 2.2, we illustrated the consideration of geographic data in open and government initiatives due to its relevance to the reuse of available data according to the Reuse of Open Data report of European Data Portal [27]. We gathered opinions, requirements, and barriers to the reuse of open data in cities through participatory workshops, and contacted over 100 people from different backgrounds.
Most of our respondents and participants had a geographical background or had worked with spatial data. Therefore, there are possible limitations that need to be acknowledged. A possible bias of the identified barriers could be that they are not applicable to other open data users from backgrounds like journalists, analysts, or developers who work with any kind of data, but might be interested in open data. We have delimited the barriers according to the respondents and participants of four cities, especially in Spanish language, with the data user communities of each city. We thus encourage the use of those conclusions with caution, as these barriers might not apply to other cities.
During this research, we found that there are some significant differences among the open data initiatives led by data authorities which are in charge of the spatial data integration in the city and entities who consider the open data initiative as another project of Open Government. For example, Bogotá has IDECA, who is the data authority that is currently leading the open data initiative while at the same time it is the local SDI. In Medellín or València, the open data leadership is in the charge of city halls, such as “Alcaldia de Medellín” or “Ayuntamiento de València”. An explanation of the differences is barely possible at this point, since this necessitates information about the open data agendas and working processes of the different institutions represented. An extension of this study could thus investigate the actual interplay between the strategy of the local SDI/open data initiatives and the way that data is being released, searched, and used.
6.2. Recommendations
Based on the findings of this research and the data users’ opinions collected during the participatory workshops, there are some suggestions that local data authorities might apply to engage and integrate their data communities into current open data initiatives.
Identifying data user groups: We have noted that most of the local authorities still need to clearly identify their data user groups. Some universities have been contacted and are working in some activities (e.g., hackathons or workshops) along the open data strategy. Other cities have identified development companies or organizations that continuously work with open data; however, the identification of those users, their needs, or their requirements are not part of the strategy. All data authorities have an interest in engaging more users and adjusting their strategy to data users’ requirements (see Table 1). Data users should be integrated during the whole open data initiative, not just included as the last step of the strategy. The current research has listed barriers which inform data authorities about aspects to focus on while working towards higher integration of users’ wishes in their strategies.
Continuous services tracking: Other suggestions that were also mentioned in the literature [37,43] is related to the analysis and continued tracking of the available services. The accessibility and data quality concerns mentioned by data users in participatory workshops (see Table 8) might be tackled by understanding what the top five most requested services are, what services users want to download, and what services need more accurate and complete metadata. In general, this continuous tracking might yield an improvement of the published services.
Notification of further released data: In cities such as València and Bogotá, data users have mentioned the need to know through an automatic service what services or new data have been released. Data producers can put more efforts to including notifications or alerts regarding the state of available services—especially services that have been identified as the most frequently used. At the same time, syndications like Really Simple Syndication (RSS) can also be used for future services or data that will be included as part of open city data.
Clear and straightforward terms of use or license: During the survey and set of workshops the terms of use were mentioned for data users as one of the obstacles to reusing the current data in cities. This barrier reduced the reliability of the open data in the selected cities. We consider that creating a simple and specific set of terms with natural language will help to reduce any misunderstanding regarding the utilization allowed of the available data.
More examples or basic reuse kit: Regarding usability barriers, data users cited that the lack of examples and basic guidelines to use and enrichment of the available data have a negative impact on the reuse level. Creating guidelines (as suggested in [67]) to reuse and explore the essential technical elements as part of the local open data initiative might have a positive effect and reduce the misunderstandings of published data. This research suggests that data producers should not limit their work to the provision of an extended list of available datasets. Creating a basic reuse kit that includes, for example, a guideline to downloading, connecting, enriching, and displaying released data could help newcomers and other re-users to understand how the city’s open datasets could be used in a meaningful way.
From a research point of view, we have analyzed different local open data initiatives in two countries, we found that some cities the local authorities that lead the open data movement is the local SDI, framing the data user engagement based on the SDI approach, where geographic data and standardization issues are the priority task. However in cities where the open data initiative is leading by open government offices inside city hall, the strategy and the way that data is released could have different impact in data users communities. Comparing current open data strategies and SDIs projects along cities, there are similarities between the two approaches. For instance, SDIs had to face standardization barriers in the past; through geo-viewers they also wanted to tackle accessibility issues, and they also faced barriers related to providing high data quality services. In this sense, we suggest that more research explores the role of local SDIs in open data times so that lessons learned from years of work on SDIs could flow into current open data projects.
Acknowledgments
The authors of this research gratefully acknowledge funding from the European Commission within the Marie Skłodowska-Curie Actions, International Training Networks (ITN), European Joint Doctorates (EJD). The funding period is 1 January 2015–31 December 2018, Grant Agreement number 642332—GEO-C—H2020-MSCA-ITN-2014. Sergio Trilles has been funded by the postdoctoral programme Vali+d (GVA) (grant number APOSTD/2016/058). We are grateful to Medellín, Cali and València city Halls (Alcaldía de Medellín, Alcaldía de Cali and Ayuntamiento de València), IDESC, IDECA and Las Naves (València Innovation Authority) who shared their experience with open data initiatives and support in this research. The authors thank Roberto Henriques from NOVA University in Lisbon who assisted in proofreading of the article.
Author Contributions
The introduction, literature review and findings sections were developed jointly by A.D. and F.B. Survey, participatory workshops, cities selection, authorities and data users communities were designed and performed by F.B., J.H., A.D. and F.B. conceived jointly the idea and research method. Discussion and recommendations were developed jointly by A.D. and F.B., S.T. contributed in the creation of tables and format of the paper.
Conflicts of Interest
The authors declare no conflict of interest.
Abbreviations
The following abbreviations are used in this article:
| SDI | Spatial Data Infrastructure |
| OGD | Open Government Data |
| IDECA | Infraestructura de Datos Espaciales para el Distrito Capital |
| IDESC | Infraestructura de Datos Espaciales de Santiago de Cali |
| EDP | European Data Portal |
| API | Application Programming Interface |
| RSS | Really Simple Syndication |
| INSPIRE | Infrastructure for Spatial Information in Europe |
Appendix A. Online Survey Questions
This appendix illustrate the questions and sections included in the online survey that was publicly shared. The following format was used to guide respondents through the survey’s sections.
- 1.
- Personal information: Tell us a little about yourself. We will not share or publish this information.
- (a)
- Which country are you currently working? Open Question.
- (b)
- Which city/cities are you working or using geographical data? Open Question.
- (c)
- How old are you? Open Question.
- 2.
- Your work: In this section we are interested in aspects of your work and your experience level in the sector or industry to which you belong or have belonged to in the past. You can mention the elements that are the most relevant.
- (a)
- What is your employment role? Multiple choice: Geographical apps developer, Geographical data analyst, Developer and analyst, Data Science analyst, Manager—Project leader, Researcher-Student-Teacher, Other.
- (b)
- In which industry do you work? Multiple choice: Local Government, National Government, Education, Non- profit, Media, Startup—Entrepreneurship, Business, Other.
- (c)
- How much experience do you have in the industry? Multiple choice: Less than 1 year, 2 to 6 years, 7 to 10 years, 11 to 20 years, More than 20 years.
- 3.
- City Open Data: It is important for us to know your opinion about open data available in the cities. In particular geographic data. In this section we will ask you about your reasons for use this data and your knowledge of those current initiatives.
- (a)
- Please indicate the level of importance for each option when using city open data? Multiple choice grid, with Very important, Neutral and Not important as choices: Geographic information accessibility, High-quality geographic information, Scalability and ease of project maintenance, City innovation improvement, Transparency and collaboration improvement, Economic benefits for the city, Academic and research improvement
- (b)
- Do you know or use the cities’ open data portals? Multiple choice with yes or not as choices.
- 4.
- Cities’ open data portals: Please provide specifics on data portals, adding a URL where possible. If your previous answer was Yes, please specify which city open data portals you know or have used.
- 5.
- Barriers and features: We would like to know the barriers, errors, and problems that you have encountered while using cities’ open data portals. Also, we would like to know the features and aspects that you consider positive and that should be kept within these initiatives.
- (a)
- Which functionalities do you think are not useful in city open data portals? Open Question.
- (b)
- From your experience with city open data portals, what do you consider to be barriers when using those portals? Multiple choice grid with Not a barrier, Moderate barrier and Major barrier as choices: Published data is hard to access, Misinterpretation and misuse of data, Time spent searching for data, Understanding how to re-use the data, Understanding terms of use, Nonexistence or low relevance of URL to access to data, Technology used for publishing data, Varying and low integration of data sources or data producers, Lack of updates of published data.
- (c)
- From your experience, which was the most common error/barrier you have faced (not have faced) when searching or using data from city open data portals? Open Question.
- (d)
- Which of following do you think are the most needed features of city open data portals? Multiple choice grid with Highly necessary, Neither necessary nor unnecessary and Unnecessary as choices: Filters for advanced search, URL to Access data, URL to Access data, Data Categories, Table view and graphs, Terms of use and re-use, Details on how the data has been produced, Viewers and interface to explore the data, Feedback from other users.
- (e)
- Which of following functionalities, is your frequency of use in cities’ open data portals? Multiple choice grid with Every time, Occasionally/Sometimes, and Never as choices: Filters for advanced search, Access data URL, Data Categories, Table view and graphs, Terms of use and re-use, How the data has been produced? Viewers and interface to explore the data, Viewers and interface to explore the data, Feedback from others users.
- 6.
- City open data portals usability: We’d like to know about the level of use of city open data portals and the available geographic data. In this Section, we will ask your frequency of use and we want to determine the usability level of those portals.
- (a)
- When you need to use city geographical information which portals do you normally use? Multiple choice grid with Often, Sometimes and Not used as choices: Government data portals. (National), Government data portals. (City-Local), Private repositories, Pay or collect data, International repositories, Other.
- (b)
- Indicate your agreement level regarding these statements on current city open data portals: Multiple choice grid with Agree, Neither agree or disagree and Disagree as choices. I would like to use these portals frequently, I found the portals unnecessarily complex, These portals were easy to use, I would need the support of a technical person to be able to use the portals, I found the various functions in the portals were well integrated, There was too much inconsistency in the portals, I would imagine that most people would learn to use the portals very quickly, I found the portals very cumbersome to use, I felt very confident using the portals, I needed to learn a lot of things before I could get going with the portals.
- 7.
- Searching for geographical data: We’d like to know which criteria and formats you use when searching and choosing geographical data.
- (a)
- Tell us about your data quality criteria when choosing available data in city open data portals? Multiple choice grid with Desirable, Neutral and Undesirable as choices. Accuracy: data/metadata record correctly described, Completeness: the number of completed fields in a data/metadata record, Consistency: discrepancy between data published and entire data catalogs, Currency: data or metadata is up date, Technical accessibility, Openness.
- (b)
- Which of the following are main features that you consider when choosing available data in city open data portals. Multiple choice grid with Definitely consider, Might or might not consider and Would not consider as choices. Data quality, how data was produced, Geometry (Point, Lines, Polygons, raster, other), Lack of information (Incomplete fields), Terms of use and re-use, Technology used for the publication process, Creation/Publication date, Author (Public agency, Private), Cost, Openness.
- (c)
- What of the following output formats do you consider most useful for your work? Multiple choice grid with Strong useful, Neutral and Not useful as choices. KML, OGC Standard (WMS, WFS, WMTS), REST, CSV, Shapefile, GeoJSON, JSON, RDF, XML, Download files (i.e., Zip).
- (d)
- If you had the chance to improve city open data portals, which are the improvements/features or tools will you would add and why? Open Question.
- (e)
- In your industry, how do you think we might increase the usage of geographical data on current city open data portals? Open Question.
References
- The World Wide Web Foundation. Open Data Barometer—Global Report, 3rd ed.; The World Wide Web Foundation: Geneva, Switzerland, 2015; pp. 1–47. [Google Scholar]
- Pomerantz, J.; Peek, R. Fifty shades of open. First Monday 2016, 21. [Google Scholar] [CrossRef]
- The Open Definition. Available online: http://opendefinition.org/ (accessed on 25 December 2017).
- Ubaldi, B. Open Government Data: Towards Empirical Analysis of Open Government Data Initiatives; OECD Working Papers on Public Governance; OECD Publishing: Paris, France, 2013; p. 61. [Google Scholar]
- Kučera, J.; Chlapek, D.; Nečaský, M. Open Government Data Catalogs. In Technology-Enabled Innovation for Democracy, Government and Governance; Springer: Berlin, Germany, 2013; Volume 8061, pp. 152–166. [Google Scholar]
- Attard, J.; Orlandi, F.; Scerri, S.; Auer, S. A systematic review of open government data initiatives. Gov. Inf. Q. 2015, 32, 399–418. [Google Scholar] [CrossRef]
- Degbelo, A.; Granell, C.; Trilles, S.; Bhattacharya, D.; Casteleyn, S.; Kray, C. Opening up Smart Cities: Citizen-Centric Challenges and Opportunities from GIScience. ISPRS Int. J. Geo-Inf. 2016, 5, 16. [Google Scholar] [CrossRef]
- Nebert, D.D. Developing Spatial Data Infrastructures: The SDI Cookbook. 2014, pp. 1–128. Available online: http://gsdiassociation.org/images/publications/cookbooks/SDI_Cookbook_from_Wiki_2012_update.pdf (accessed on 25 December 2017).
- Diaz, L.; Remke, A.; Kauppinen, T.; Degbelo, A.; Foerster, T.; Stasch, C.; Rieke, M.; Schaeffer, B.; Baranski, B.; Bröring, A.; et al. Future SDI—Impulses from Geoinformatics research and IT trends. Int. J. Spat. Data Infrastruct. Res. 2012, 7, 378–410. [Google Scholar]
- European Commission. Commission Outlines Next Steps Towards a European Data Economy. Available online: http://europa.eu/rapid/press-release_IP-17-5_en.htm (accessed on 25 December 2017).
- Janssen, M.; Charalabidis, Y.; Zuiderwijk, A. Benefits, Adoption Barriers and Myths of Open Data and Open Government. J. Inf. Syst. Manag. 2012, 29, 258–268. [Google Scholar] [CrossRef]
- Ahmadi Zeleti, F.; Ojo, A.; Curry, E. Exploring the economic value of open government data. Gov. Inf. Q. 2016, 33, 535–551. [Google Scholar] [CrossRef]
- Vetrò, A.; Canova, L.; Torchiano, M.; Minotas, C.O.; Iemma, R.; Morando, F. Open data quality measurement framework: Definition and application to Open Government Data. Gov. Inf. Q. 2016, 33, 325–337. [Google Scholar] [CrossRef]
- Veljković, N.; Bogdanović-Dinić, S.; Stoimenov, L. Benchmarking open government: An open data perspective. Gov. Inf. Q. 2014, 31, 278–290. [Google Scholar] [CrossRef]
- Degbelo, A.; Trilles, S.; Kray, C.; Bhattacharya, D.; Schiestel, N.; Wissing, J.; Granell, C. Designing semantic APIs for open government data. JeDEM 2016, 8, 21–58. [Google Scholar]
- Wijnhoven, F.; Ehrenhard, M.; Kuhn, J. Open government objectives and participation motivations. Gov. Inf. Q. 2015, 32, 30–42. [Google Scholar] [CrossRef]
- Lourenço, R.P. An analysis of open government portals: A perspective of transparency for accountability. Gov. Inf. Q. 2015, 32, 323–332. [Google Scholar] [CrossRef]
- Horrigan, J.B.; Rainie, L. Americans’ Views on Open Government Data; Pew Research Center: Washington, DC, USA, 2015. [Google Scholar]
- Beno, M.; Figl, K.; Umbrich, J.; Polleres, A. Open Data Hopes and Fears Determining the barriers of Open Data. In Proceedings of the E-Democracy and Open Government (CeDEM), Krems, Austria, 17–19 May 2017; pp. 69–81. [Google Scholar]
- Schmidt, B.; Gemeinholzer, B.; Treloar, A.; Seeger, B.; Gemeinholzer, B.; Bendix, J. Open Data in Global Environmental Research: The Belmont Forum’s Open Data Survey. PLoS ONE 2016, 11, e0146695. [Google Scholar] [CrossRef] [PubMed]
- Gonzalez-Zapata, F.; Heeks, R. The multiple meanings of open government data: Understanding different stakeholders and their perspectives. Gov. Inf. Q. 2015, 32, 441–452. [Google Scholar] [CrossRef]
- Yu, H.; Robinson, D.G. The New Ambiguity of ‘Open Government’. SSRN Electron. J. 2012, 59. [Google Scholar] [CrossRef]
- Lee, J.N.; Ham, J.; Choi, B. Effect of government data openness on a knowledge-based economy. Procedia Comput. Sci. 2016, 91, 158–167. [Google Scholar] [CrossRef]
- Williamson, V.; Eisen, N. The Impact of Open Government: Assessing the Evidence; Brookings Institution: Washington, DC, USA, 2016; pp. 1–30. [Google Scholar]
- Afful-Dadzie, E.; Afful-Dadzie, A. Open Government Data in Africa: A preference elicitation analysis of media practitioners. Gov. Inf. Q. 2017, 34, 244–255. [Google Scholar] [CrossRef]
- Wang, H.J.; Lo, J. Adoption of open government data among government agencies. Gov. Inf. Q. 2016, 33, 80–88. [Google Scholar] [CrossRef]
- Carrara, W.; Vollers, H.; Berends, J. Re-Using Open Data; Technical Report; European Data Portal: Paris, France, 2017. [Google Scholar]
- Yang, T.M.; Lo, J.; Shiang, J. To open or not to open? Determinants of open government data. J. Inf. Sci. 2015, 41, 596–612. [Google Scholar] [CrossRef]
- Carrara, W.; Vollers, H.; Berends, J. Analytical Report 5: Barriers in Working with Open Data; Technical Report; European Data Portal: Paris, France, 2017. [Google Scholar]
- Young, A.; Verhulst, S. The Global Impact of Open Data: Key Findings from Detailed Case Studies around the World; O’Reilly Media, Inc.: Sebastopol, CA, USA, 2016; pp. 215–230, 337–360, 381–396. [Google Scholar]
- Barry, E.; Bannister, F. Barriers to open data release: A view from the top. Inf. Polity 2014, 19, 129–152. [Google Scholar]
- Johnson, P.A.; Sieber, R.; Scassa, T.; Stephens, M.; Robinson, P. The Cost(s) of Geospatial Open Data. Trans. GIS 2017, 21, 434–445. [Google Scholar] [CrossRef]
- Jetzek, T.; Avital, M.; Bjorn-Andersen, N. The Value of Open Government Data. 2012, p. 12. Available online: http://openarchive.cbs.dk/handle/10398/8621 (accessed on 25 December 2017).
- Cranefield, J.; Robertson, O.; Oliver, G. Value in the mash: Exploring the benefits, barriers and enablers of open data apps. In Proceedings of the 22nd European Conference on Information Systems, ECIS, Tel Aviv, Israel, 9–14 June 2014; pp. 1–15. [Google Scholar]
- Nugroho, R.P.; Zuiderwijk, A.; Janssen, M.; de Jong, M. A comparison of national open data policies: Lessons learned. Transform. Gov. People Process Policy 2015, 9, 286–308. [Google Scholar] [CrossRef]
- Jetzek, T.; Avital, M.; Bjorn-Andersen, N. Generating Value from Open Government Data. In Proceedings of the International Conference on Information Systems, Milan, Italy, 15–18 December 2013; pp. 1737–1756. [Google Scholar]
- Conradie, P.; Choenni, S. On the barriers for local government releasing open data. Gov. Inf. Q. 2014, 31, S10–S17. [Google Scholar] [CrossRef]
- Martin, S.; Foulonneau, M. Open Data: Barriers, Risks and Opportunities. In Proceedings of the 13th European Conference on eGovernment, Como, Italy, 13–14 June 2013; pp. 301–309. [Google Scholar]
- Europe, Access Info and Foundation, Open Knowledge. Beyond Access: Open Government Data and the ’Right to Reuse’. October 2011, p. 103. Available online: https://www.access-info.org/wp-content/uploads/Beyond_Access_7_January_2011_web.pdf (accessed on 25 December 2017).
- Carrara, W.; Nieuwenhuis, M.; Vollers, H. Open Data Maturity in Europe 2016; European Commission, Technical Report; European Data Portal: Paris, France, 2016. [Google Scholar]
- Environmental Systems Research Institute. Spatial Data Infrastructure A Collaborative Network; Esri: Redlands, CA, USA, 2010; p. 8. [Google Scholar]
- Harvey, F.; Tulloch, D. Local-government data sharing: Evaluating the foundations of spatial data infrastructures. Int. J. Geogr. Inf. Sci. 2006, 20, 743–768. [Google Scholar] [CrossRef]
- Zuiderwijk, A.; Janssen, M.; Davis, C. Innovation with open data: Essential elements of open data ecosystems. Inf. Polity 2014, 19, 17–33. [Google Scholar]
- Sunlight Foundation. Ten Principles For Opening Up Government Information; Sunlight Foundation: Washington, DC, USA, 2010. [Google Scholar]
- Open Data Institute. The Value of Open Data; Open Data Institute: London, UK, 2015. [Google Scholar]
- Valencia Transparency and Open Data portal. Available online: http://gobiernoabierto.valencia.es/en/data (accessed on 11 November 2017).
- Medellin Open Data portal. Available online: https://geomedellin-m-medellin.opendata.arcgis.com/ (accessed on 11 November 2017).
- Infraestructura de Datos Espaciales para el Distrito Capital—IDECA. Available online: https://www.ideca.gov.co/ (accessed on 11 July 2017).
- Infraestructura de Datos Espaciales de Santiago de Cali—IDESC. Available online: http://www.cali.gov.co/planeacion/publicaciones/3560/idesc/ (accessed on 14 July 2017).
- City Hall of Medellin. Available online: https://www.medellin.gov.co/irj/portal/medellin (accessed on 14 July 2017).
- City Hall of València. Available online: http://gobiernoabierto.valencia.es/en/ (accessed on 14 July 2017).
- International Open Data Conference 2016. Available online: http://opendatacon.org/ (accessed on 14 July 2017).
- Open Cities Summit 2016. Available online: http://opencitiessummit.org/ (accessed on 14 July 2017).
- Inspire Conference 2016. Available online: http://inspire.ec.europa.eu/ (accessed on 14 July 2017).
- Geo Mundus Conference 2016. Available online: http://geomundus.org (accessed on 14 July 2017).
- Data Latam Conference 2016. Available online: http://www.datalatam.com/ (accessed on 14 July 2017).
- Esri User Conference 2016. Available online: http://www.esri.com/about/events/uc (accessed on 14 July 2017).
- Esri Spain User Conference 2016. Available online: http://conferencia.esri.es/ (accessed on 14 July 2017).
- Esri Colombian User Conference 2016. Available online: http://esri.co/esri/ (accessed on 14 July 2017).
- Zuiderwijk, A.; Janssen, M.; Choenni, S.; Meijer, R.; Alibaks, R.S. Socio-technical Impediments of Open Data. Electron. J. e-Gov. 2012, 10, 156–172. [Google Scholar]
- Janev, V.; Mijović, V.; Paunović, D.; Milošević, U. Modeling, Fusion and Exploration of Regional Statistics and Indicators with Linked Data Tools; Springer: Cham, Switzerland, 2014; pp. 208–221. [Google Scholar]
- Keefe, T.; Bikfalvi, A.; Beer, M.; la Rosa, J. A Case Study Analysis of Factors Determining Success or Failure for Participants in Collaborative Innovation Projects in e-Government. In Proceedings of the 13th European Conference on Egovernment, Como, Italy, 13–14 June 2013; pp. 276–282. [Google Scholar]
- Bargh, M.S.; Choenni, S.; Meijer, R. Meeting Open Data Halfway. In Proceedings of the 9th International Conference on Theory and Practice of Electronic Governance, Hammamet, Tunisia, 1–3 March 2016; pp. 199–206. [Google Scholar]
- Nemoto, T.; Beglar, D. Likert-Scale Questionnaires; JALT Publications: Tokyo, Japan, 2014. [Google Scholar]
- The World Wide Web Foundation. Open Data Barometer Global Report, 4th ed. 2017, p. 36. Available online: http://opendatabarometer.org/4thedition/report/ (accessed on 27 December 2017).
- European Commision. Elements of a Data Value Chain Strategy; European Commission. Technical Report; Digital Single Market: Brussels, Belgium, 2013. [Google Scholar]
- Degbelo, A.; Bhattacharya, D.; Granell, C.; Trilles, S. Toolkits for Smarter Cities: A Brief Assessment. In Ubiquitous Computing and Ambient Intelligence, Proceedings of the 10th International Conference, UCAmI 2016, San Bartolome de Tirajana, Gran Canaria, Spain, 29 November–2 December 2016, Part II; Garcia, C.R., Caballero-Gil, P., Burmester, M., Quesada-Arencibia, A., Eds.; Springer International Publishing: Cham, Switzerland, 2016; pp. 431–436. [Google Scholar]
Figure 1.
Workflow used. Literature review, identifying initial barriers and perceptions, then a publicly shared online survey (n = 195 valid responses). Using the preliminary results, four cities were selected and the identified barriers were contrasted with the participatory workshop in each city.
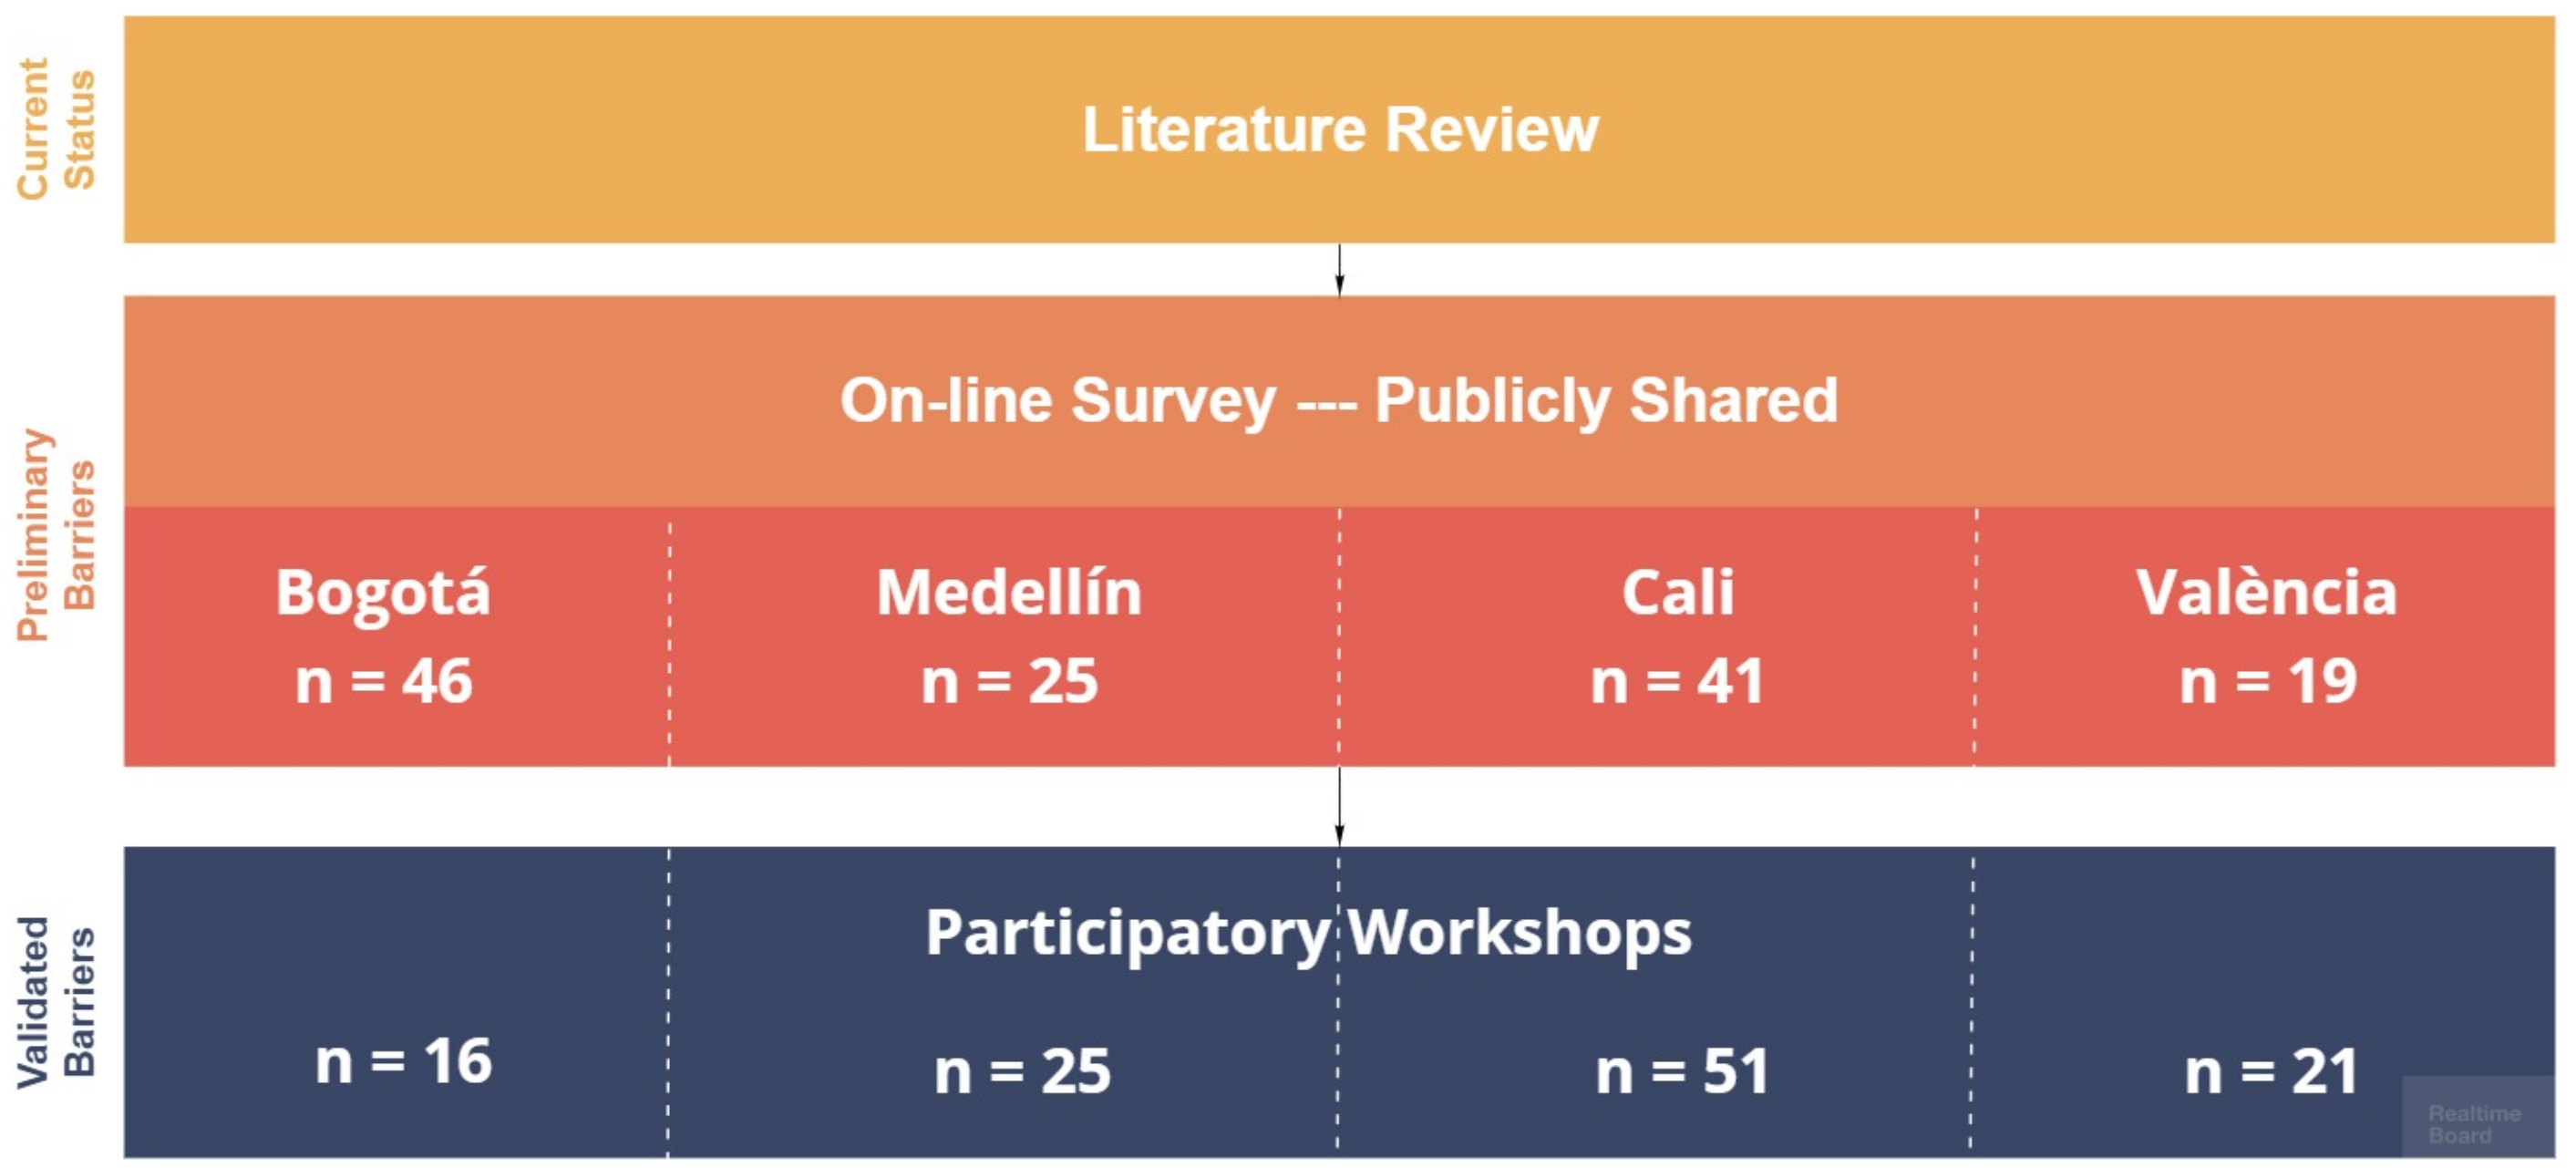
Figure 2.
Online survey responses.

Figure 3.
Employment role of respondents.

Figure 4.
Workshop participant roles. There were 56 from academia, 49 analysts, 20 managers or project leaders, 11 developers, 3 Open data experts and 16 counted as others that include politicians, journalists, entrepreneurs and others roles. In total there were 155 workshop participants.
Figure 4.
Workshop participant roles. There were 56 from academia, 49 analysts, 20 managers or project leaders, 11 developers, 3 Open data experts and 16 counted as others that include politicians, journalists, entrepreneurs and others roles. In total there were 155 workshop participants.

Figure 5.
Barriers mentioned by respondents. Lack of updates of published data, varying and low integration of data sources, and low accessibility were considered to be major barriers (n = 195).
Figure 5.
Barriers mentioned by respondents. Lack of updates of published data, varying and low integration of data sources, and low accessibility were considered to be major barriers (n = 195).

Figure 6.
Formats or services mentioned by respondents as most useful for their work. Shapefile, .zip and CSV are considered strong useful (n = 186).
Figure 6.
Formats or services mentioned by respondents as most useful for their work. Shapefile, .zip and CSV are considered strong useful (n = 186).
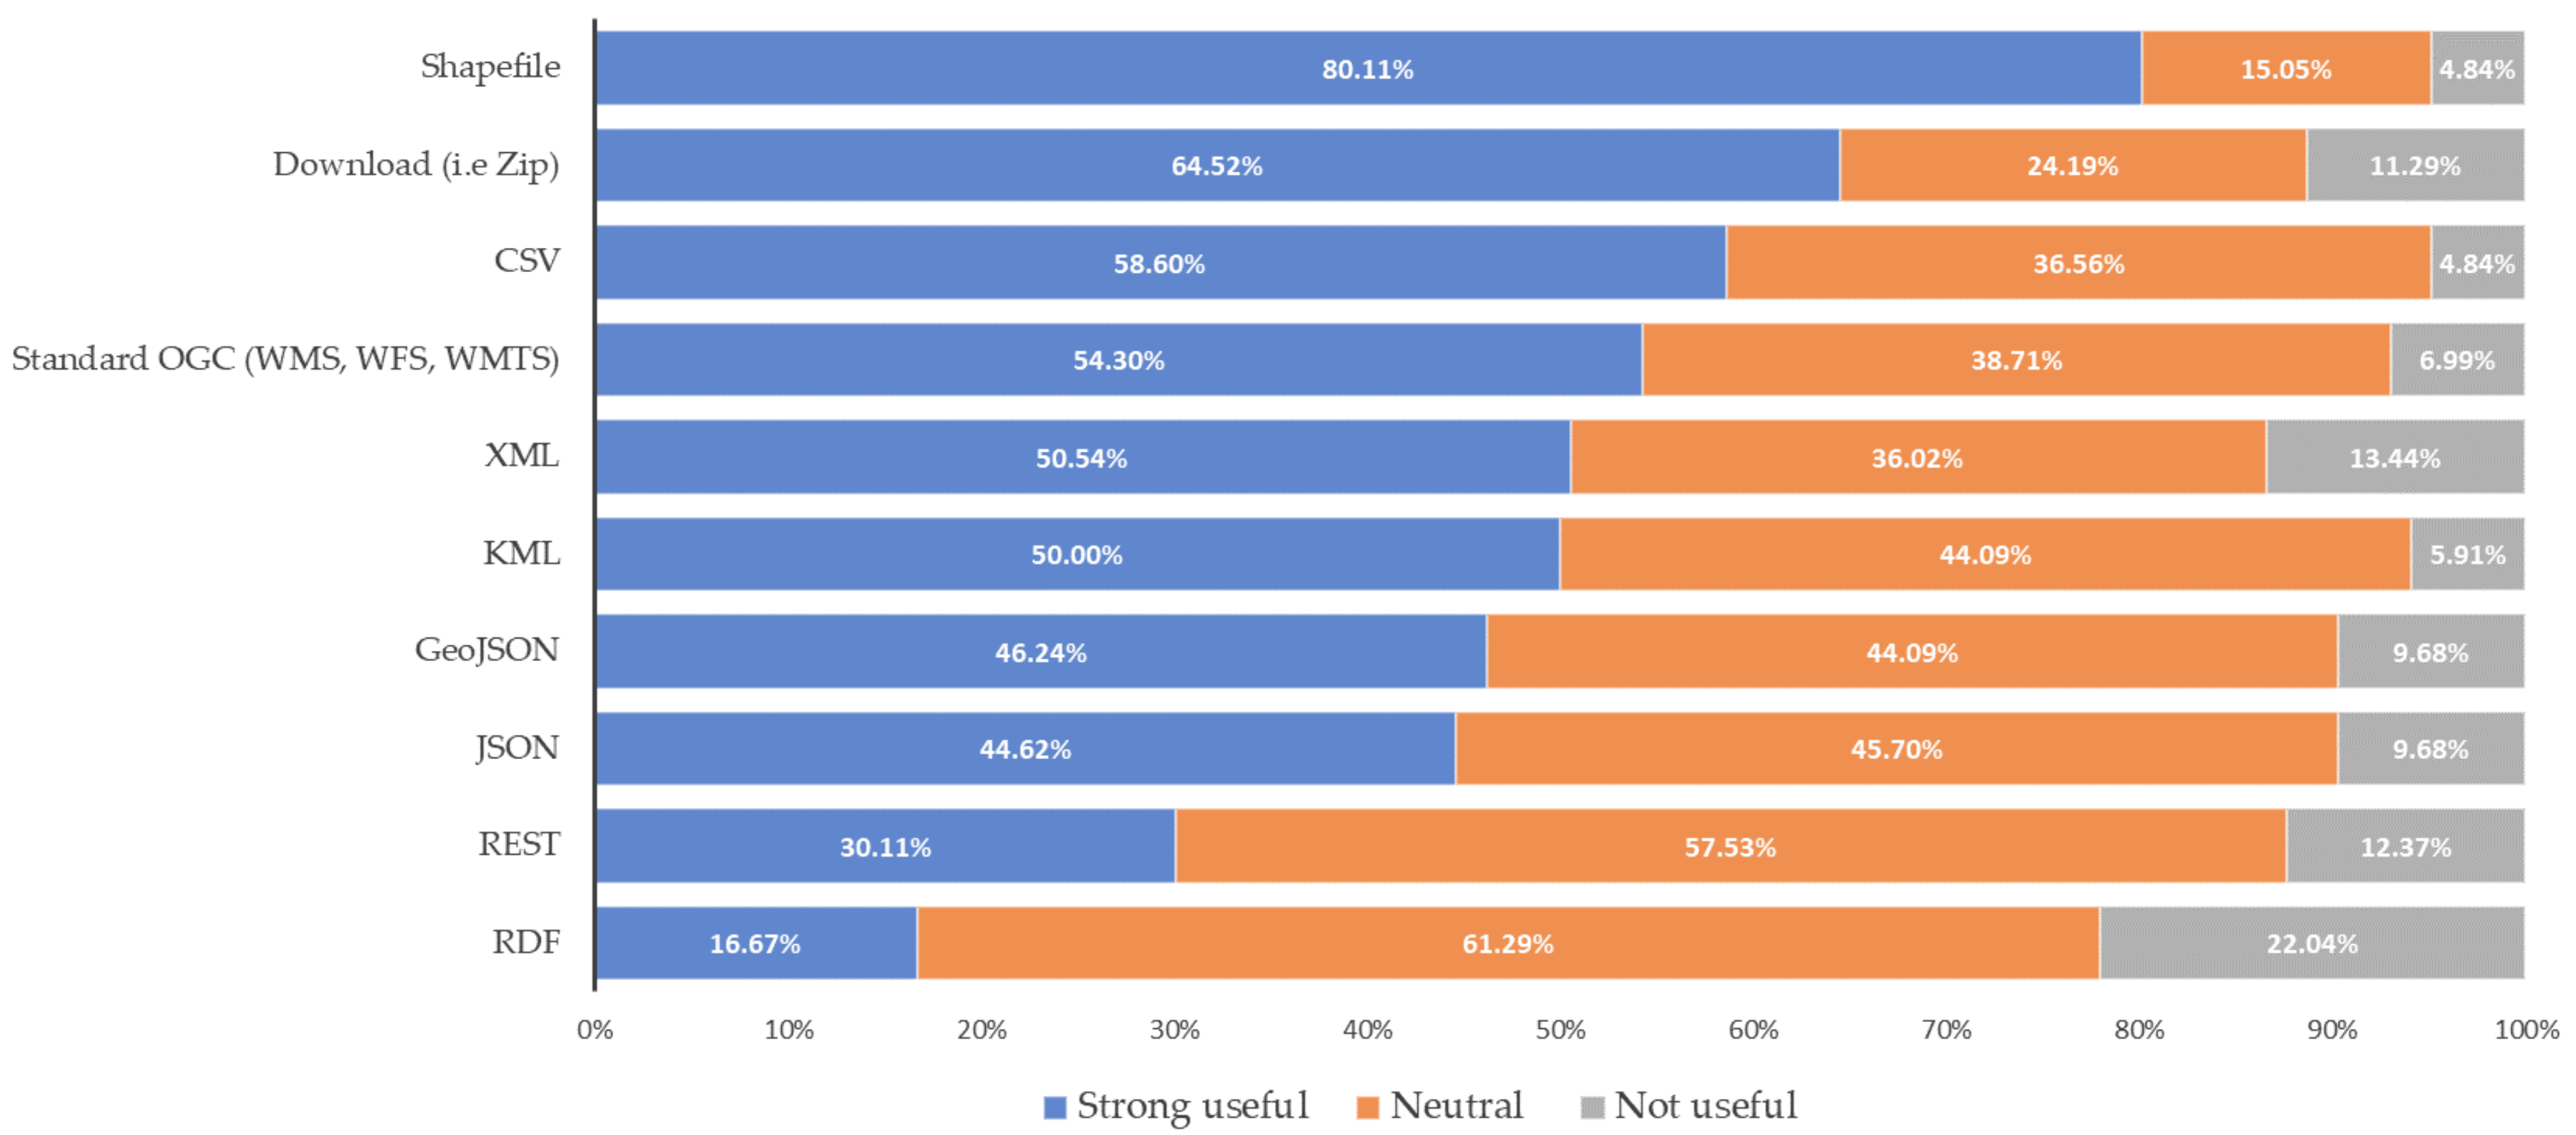
Figure 7.
Fishbone diagram of barriers identified from a data user point of view.
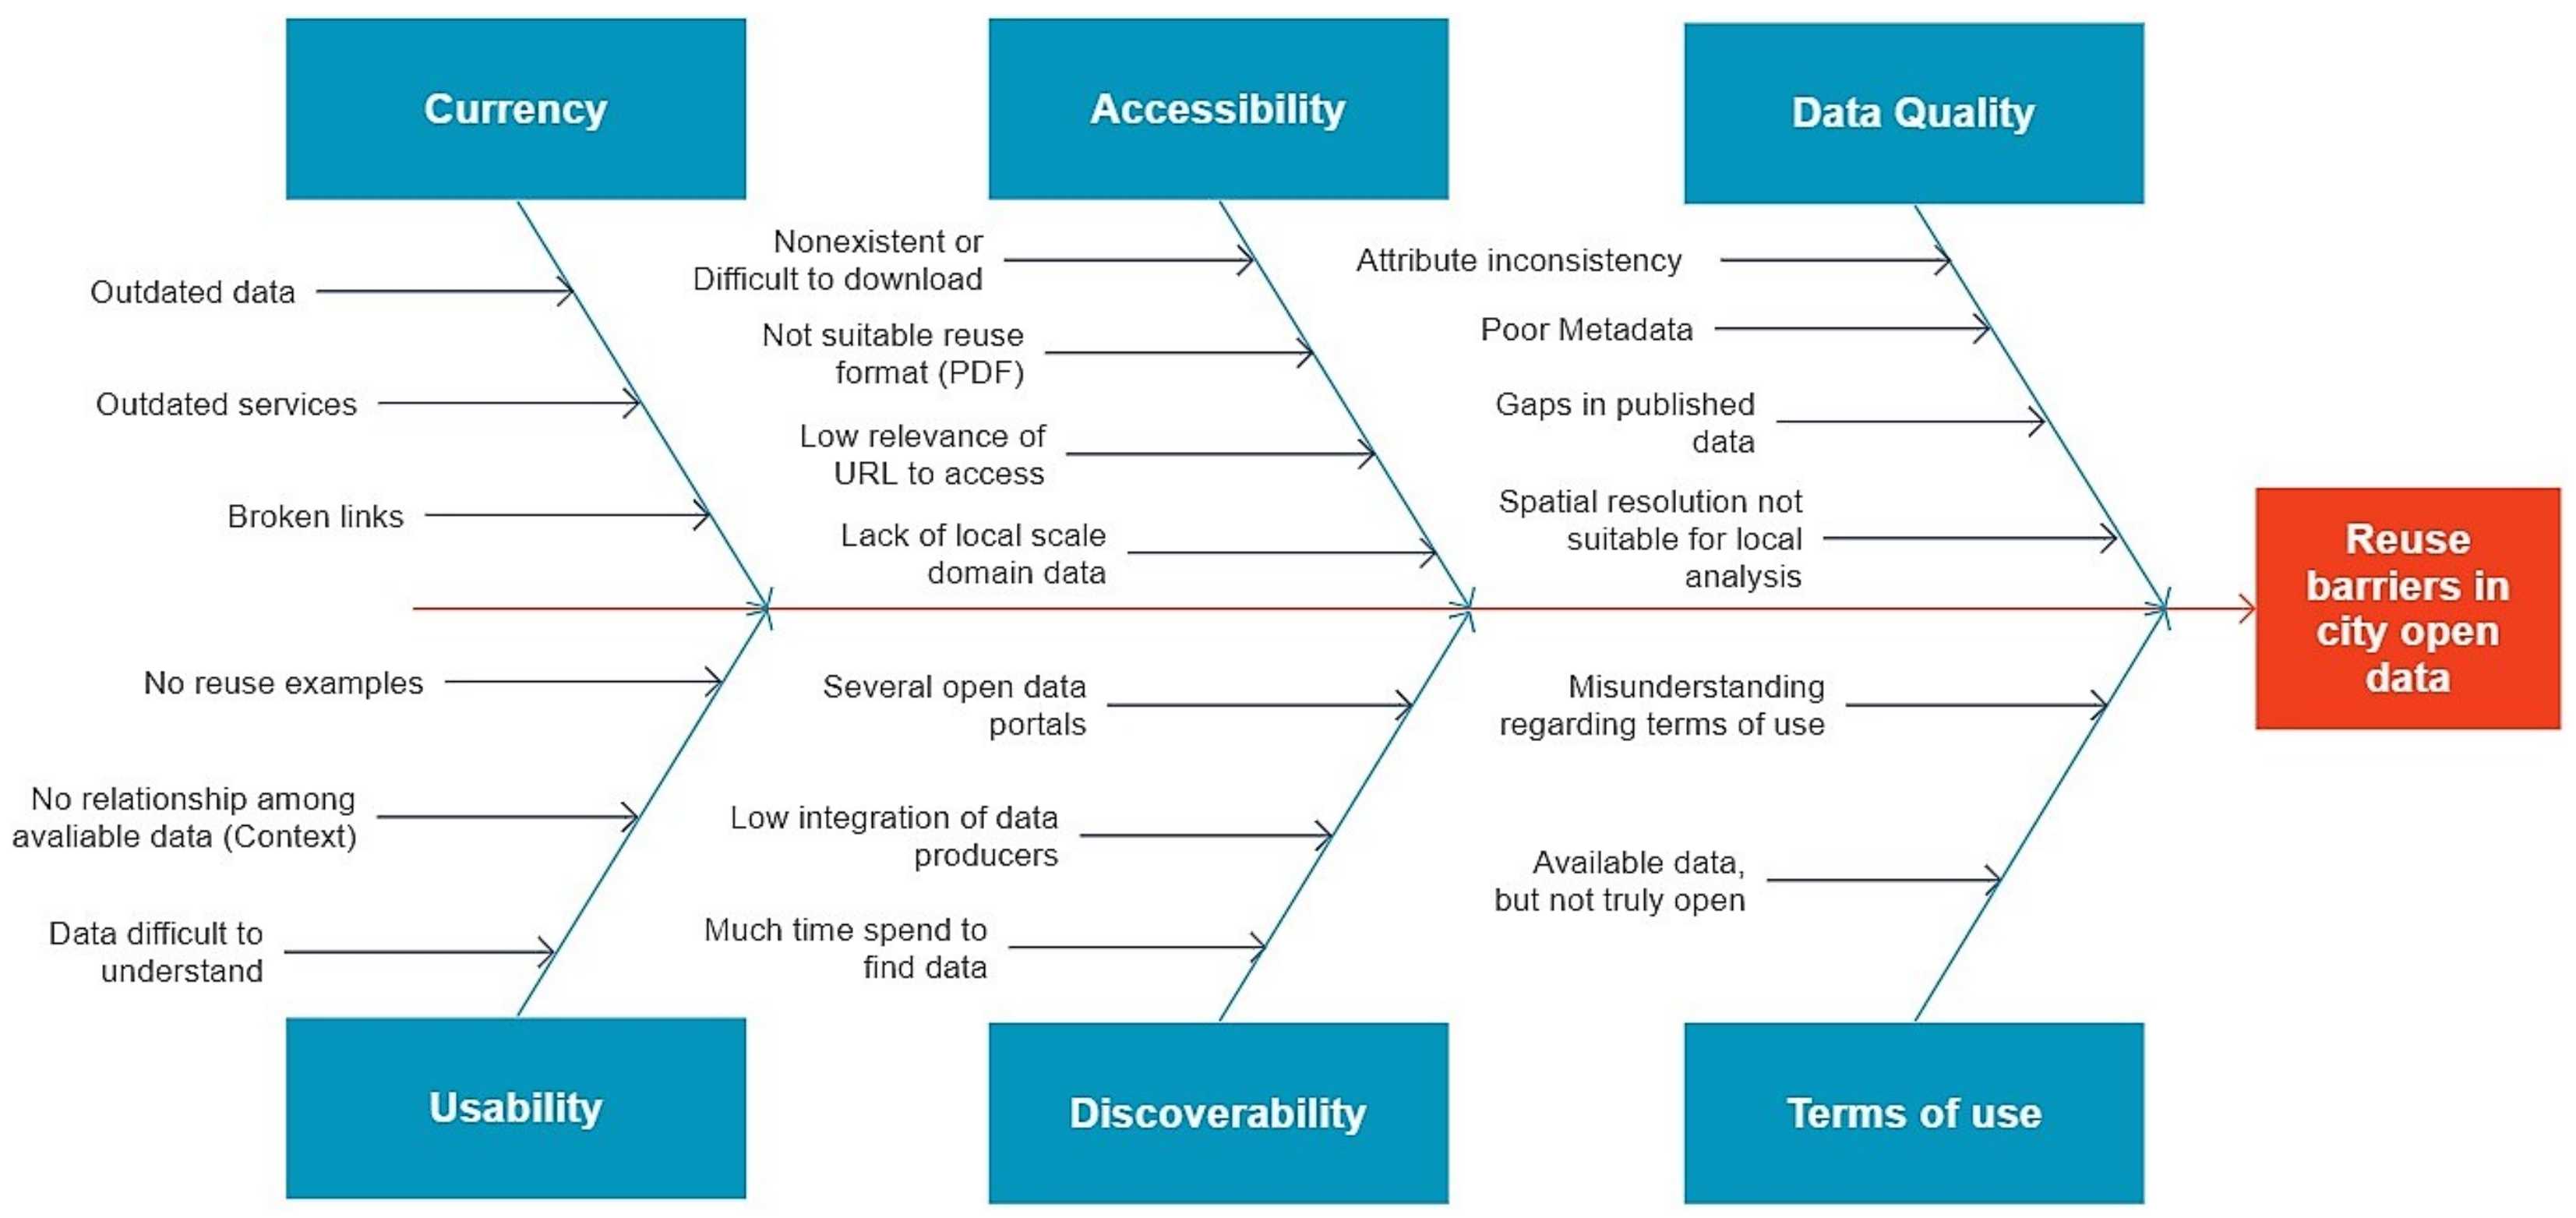

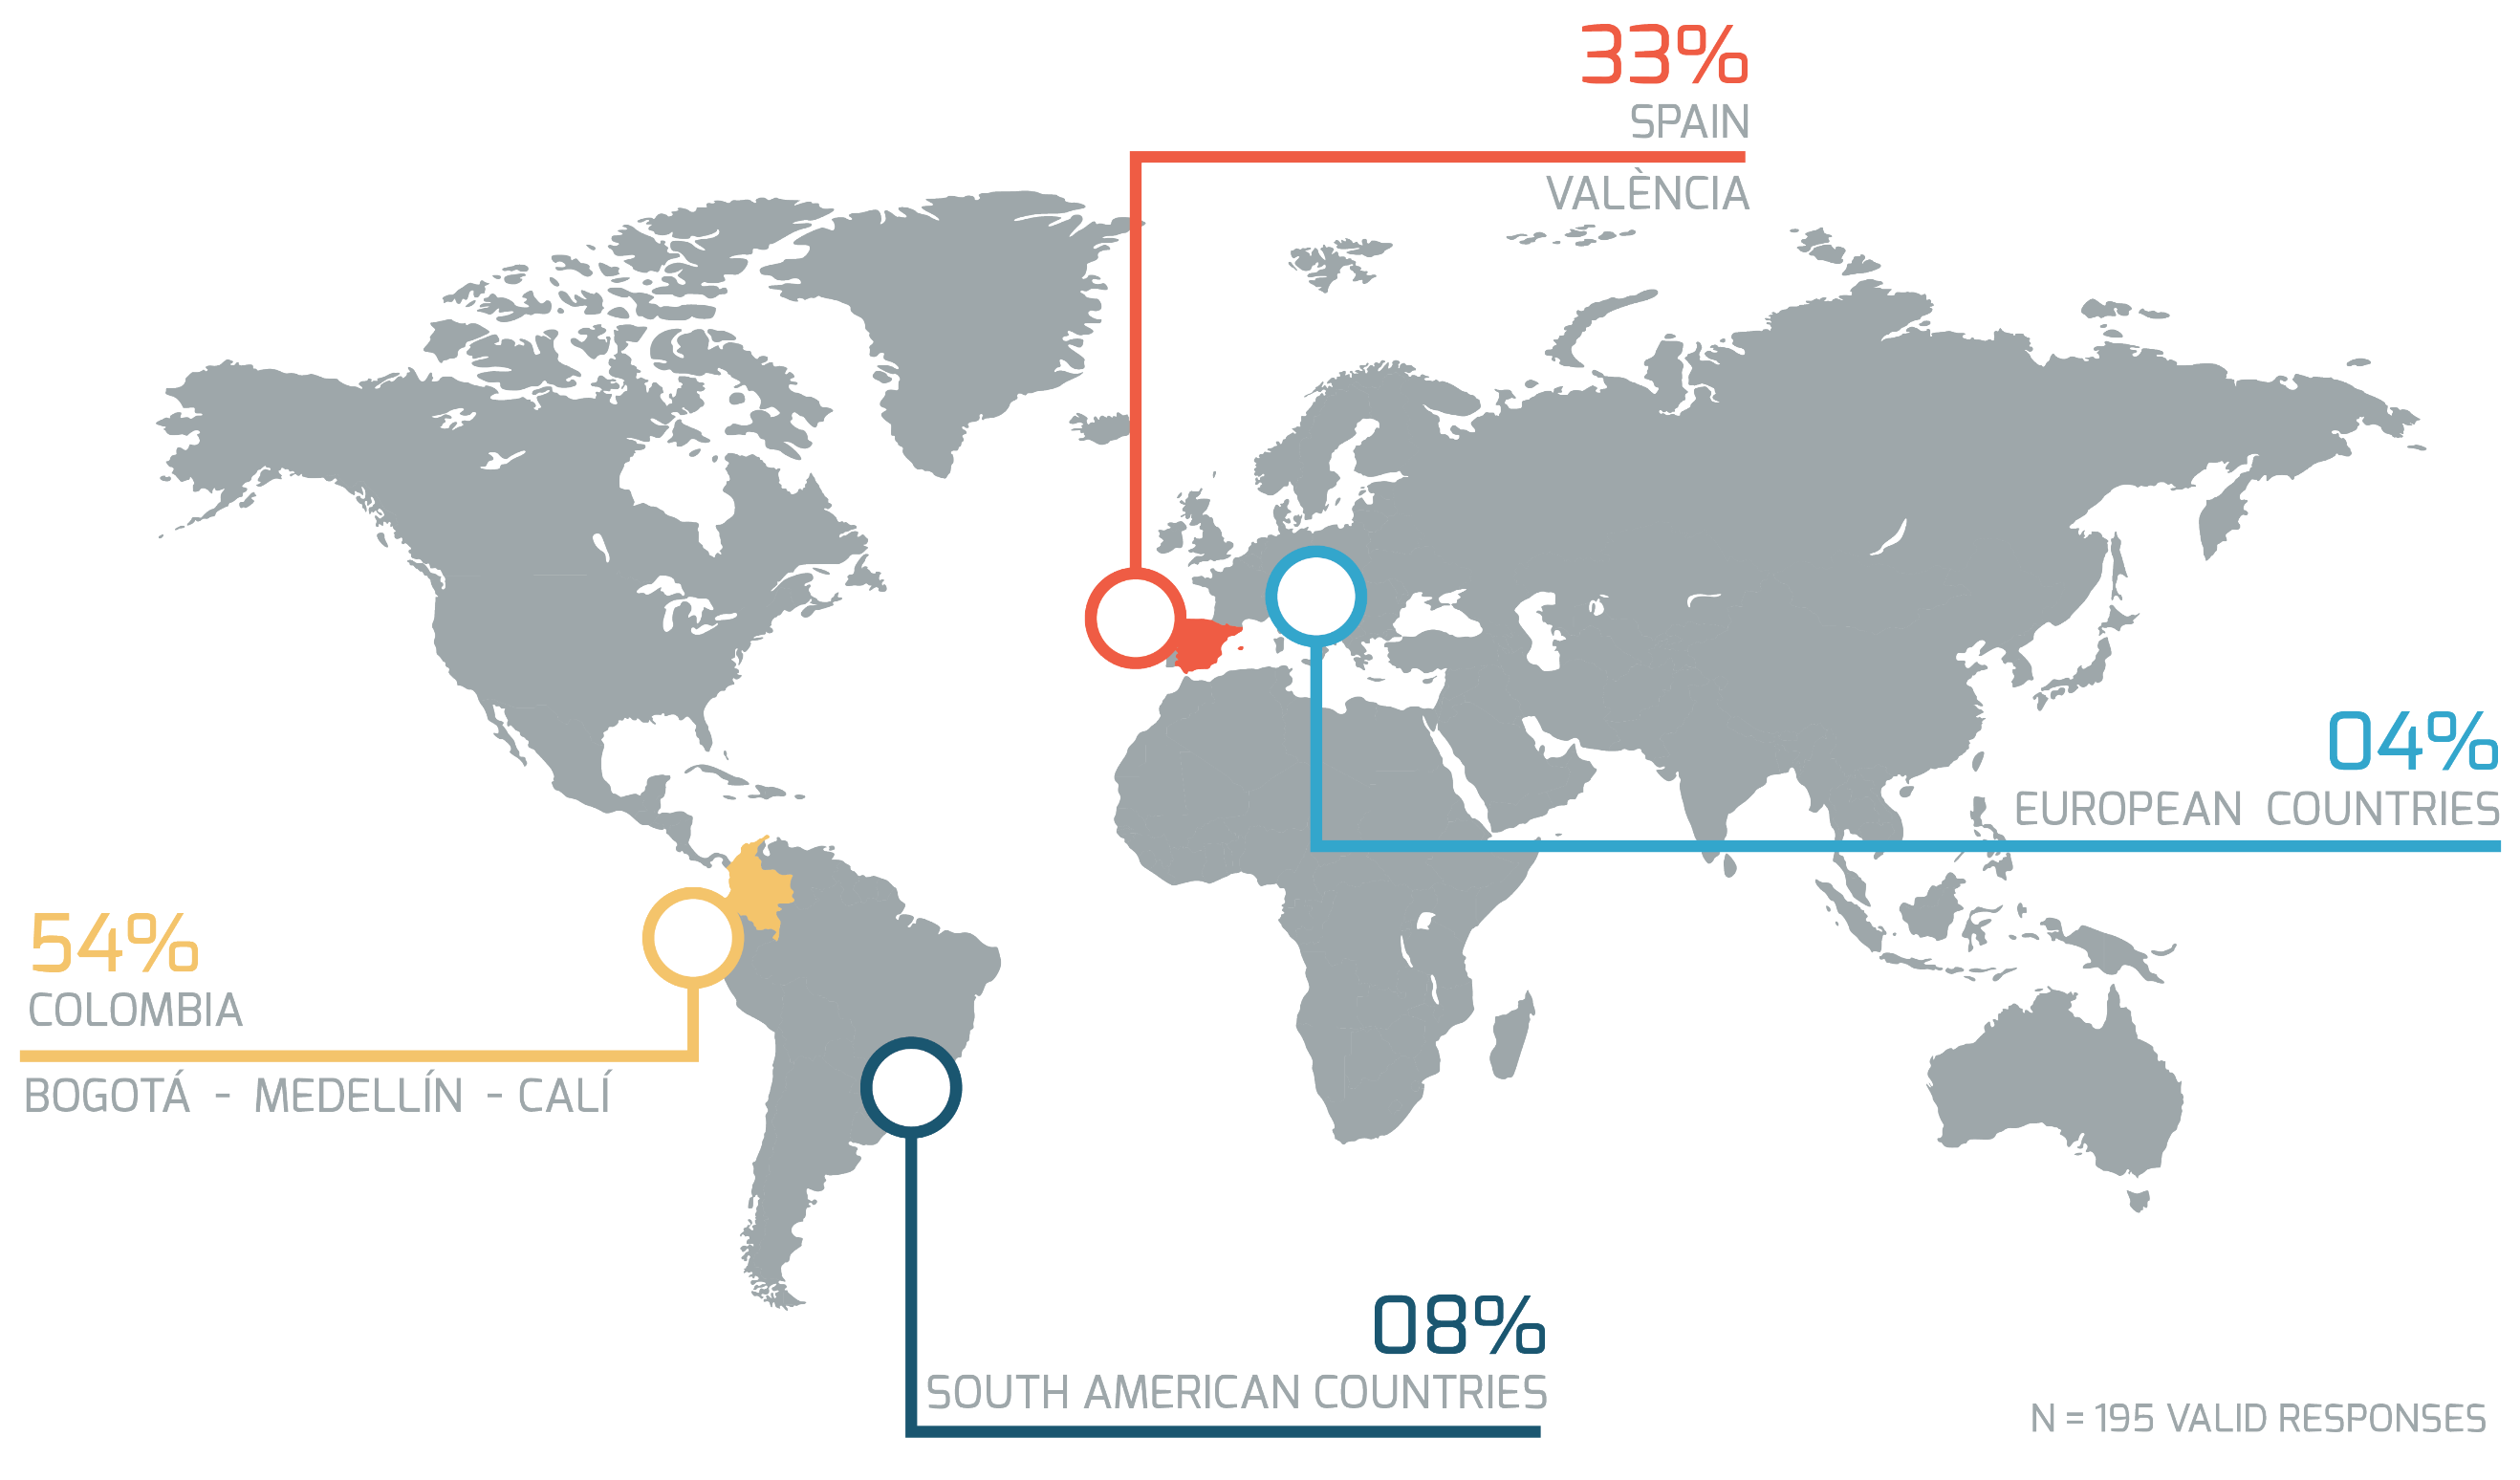
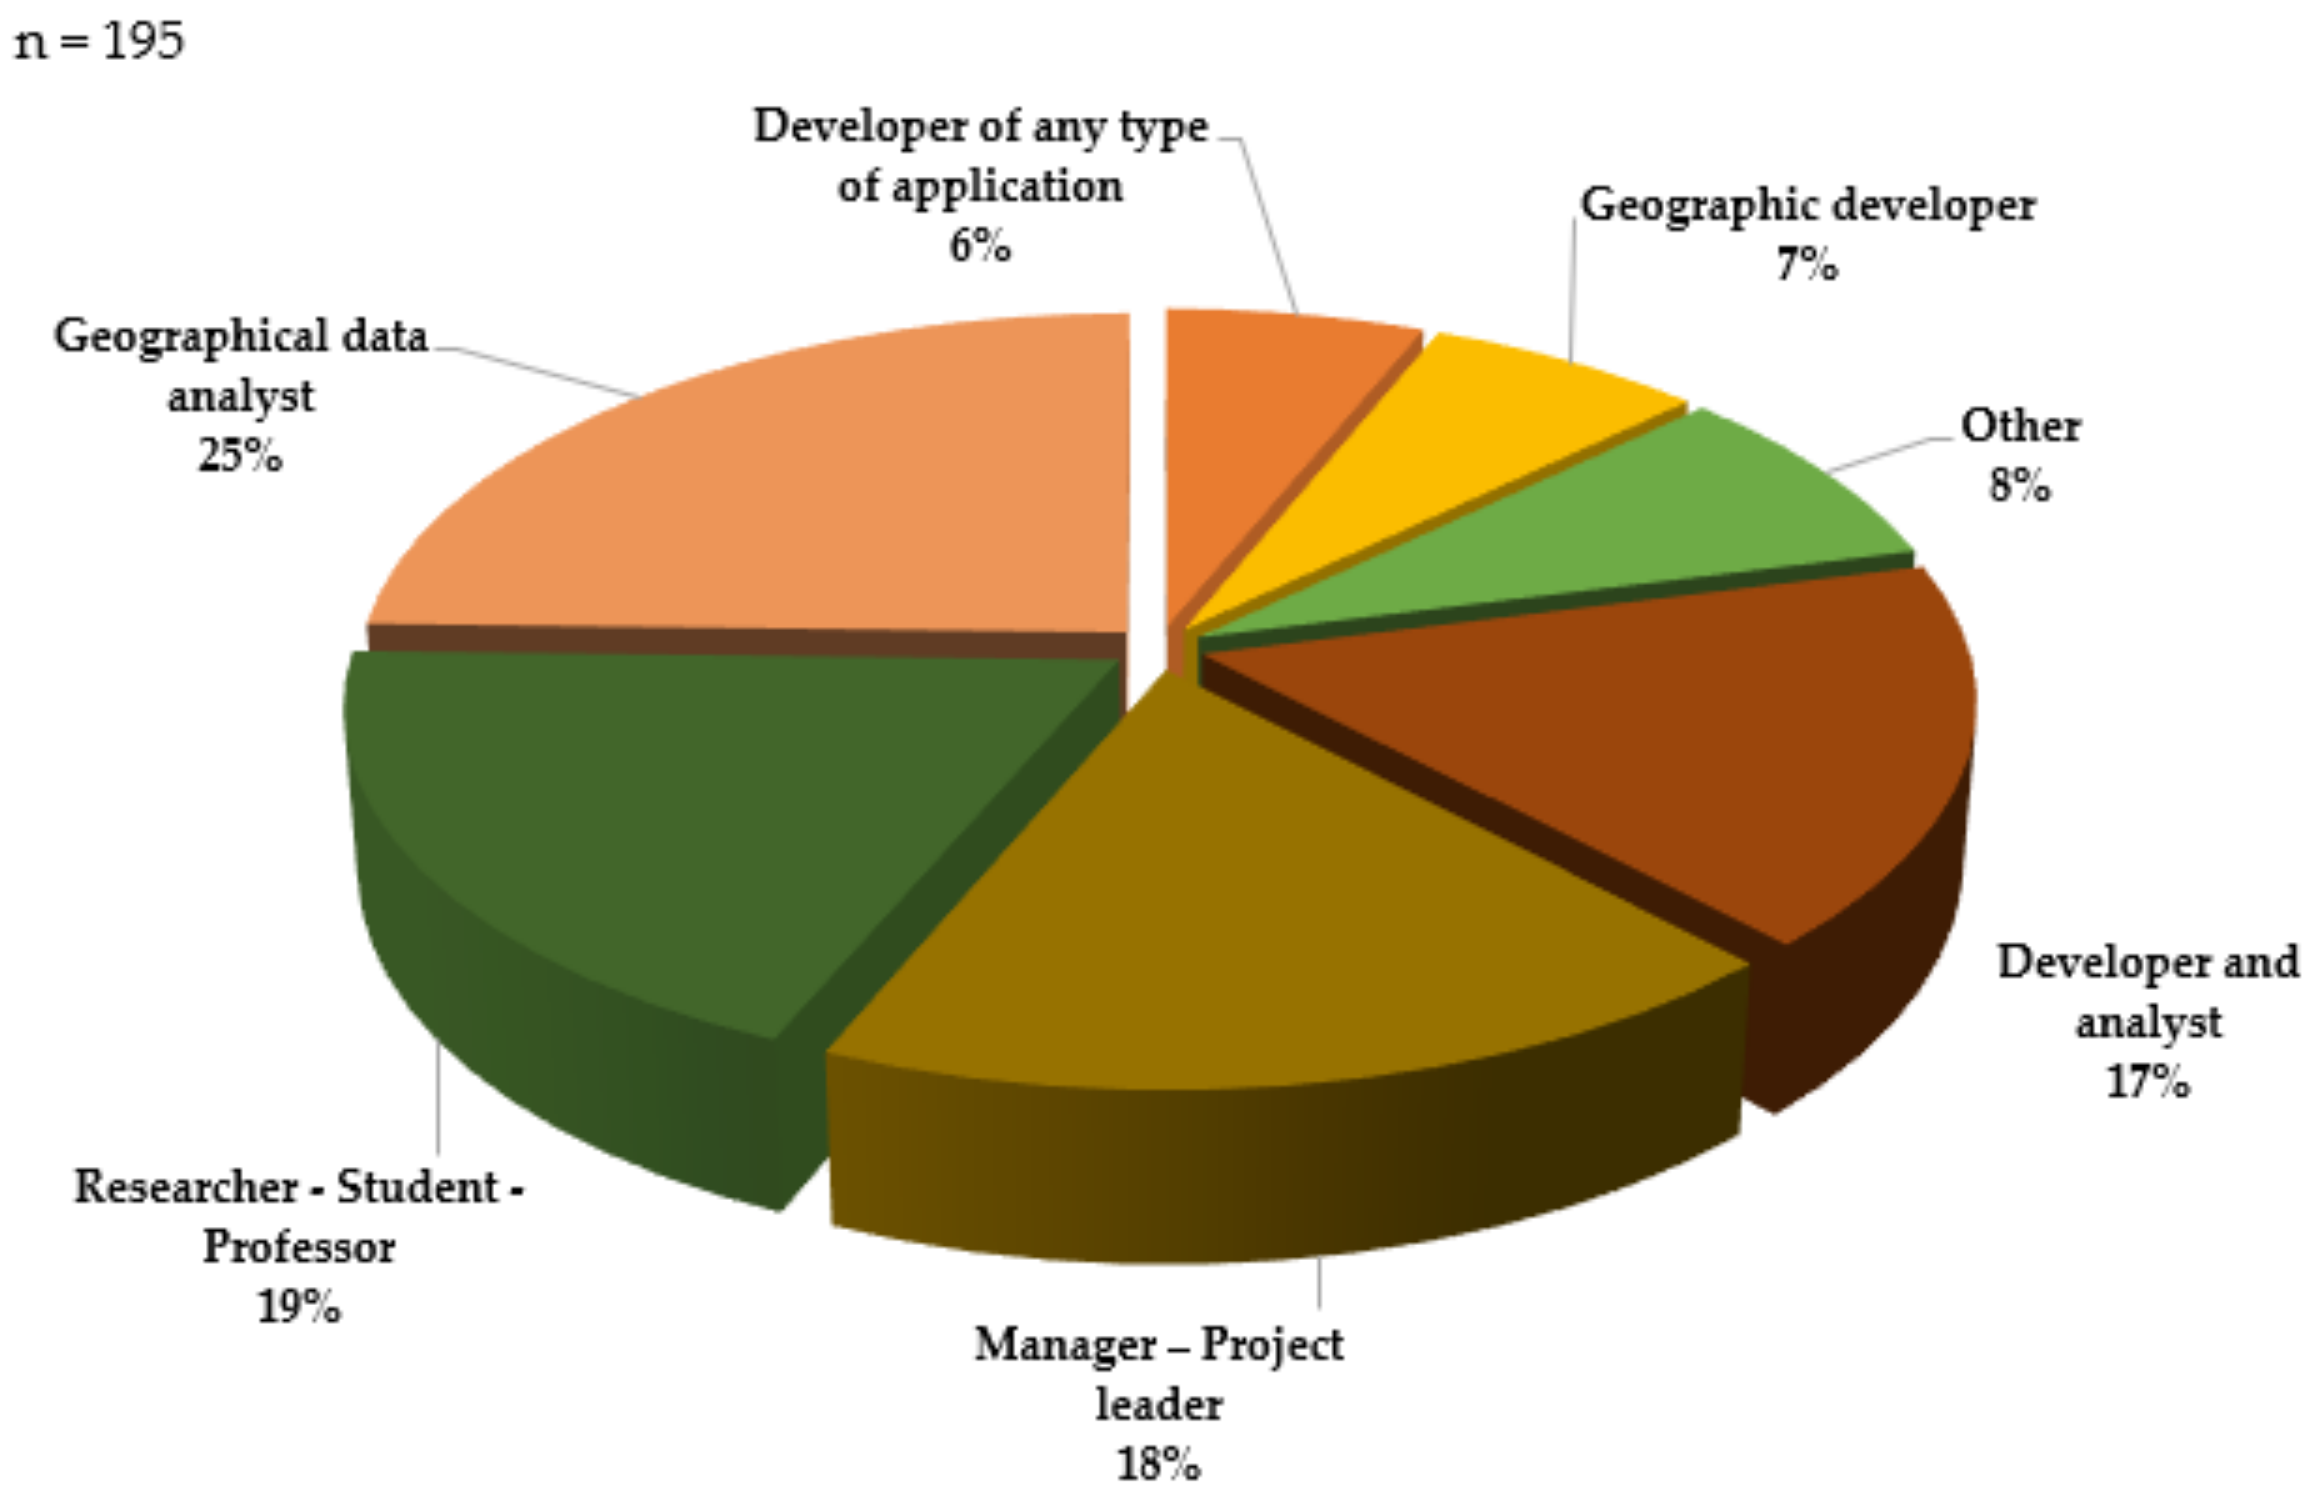
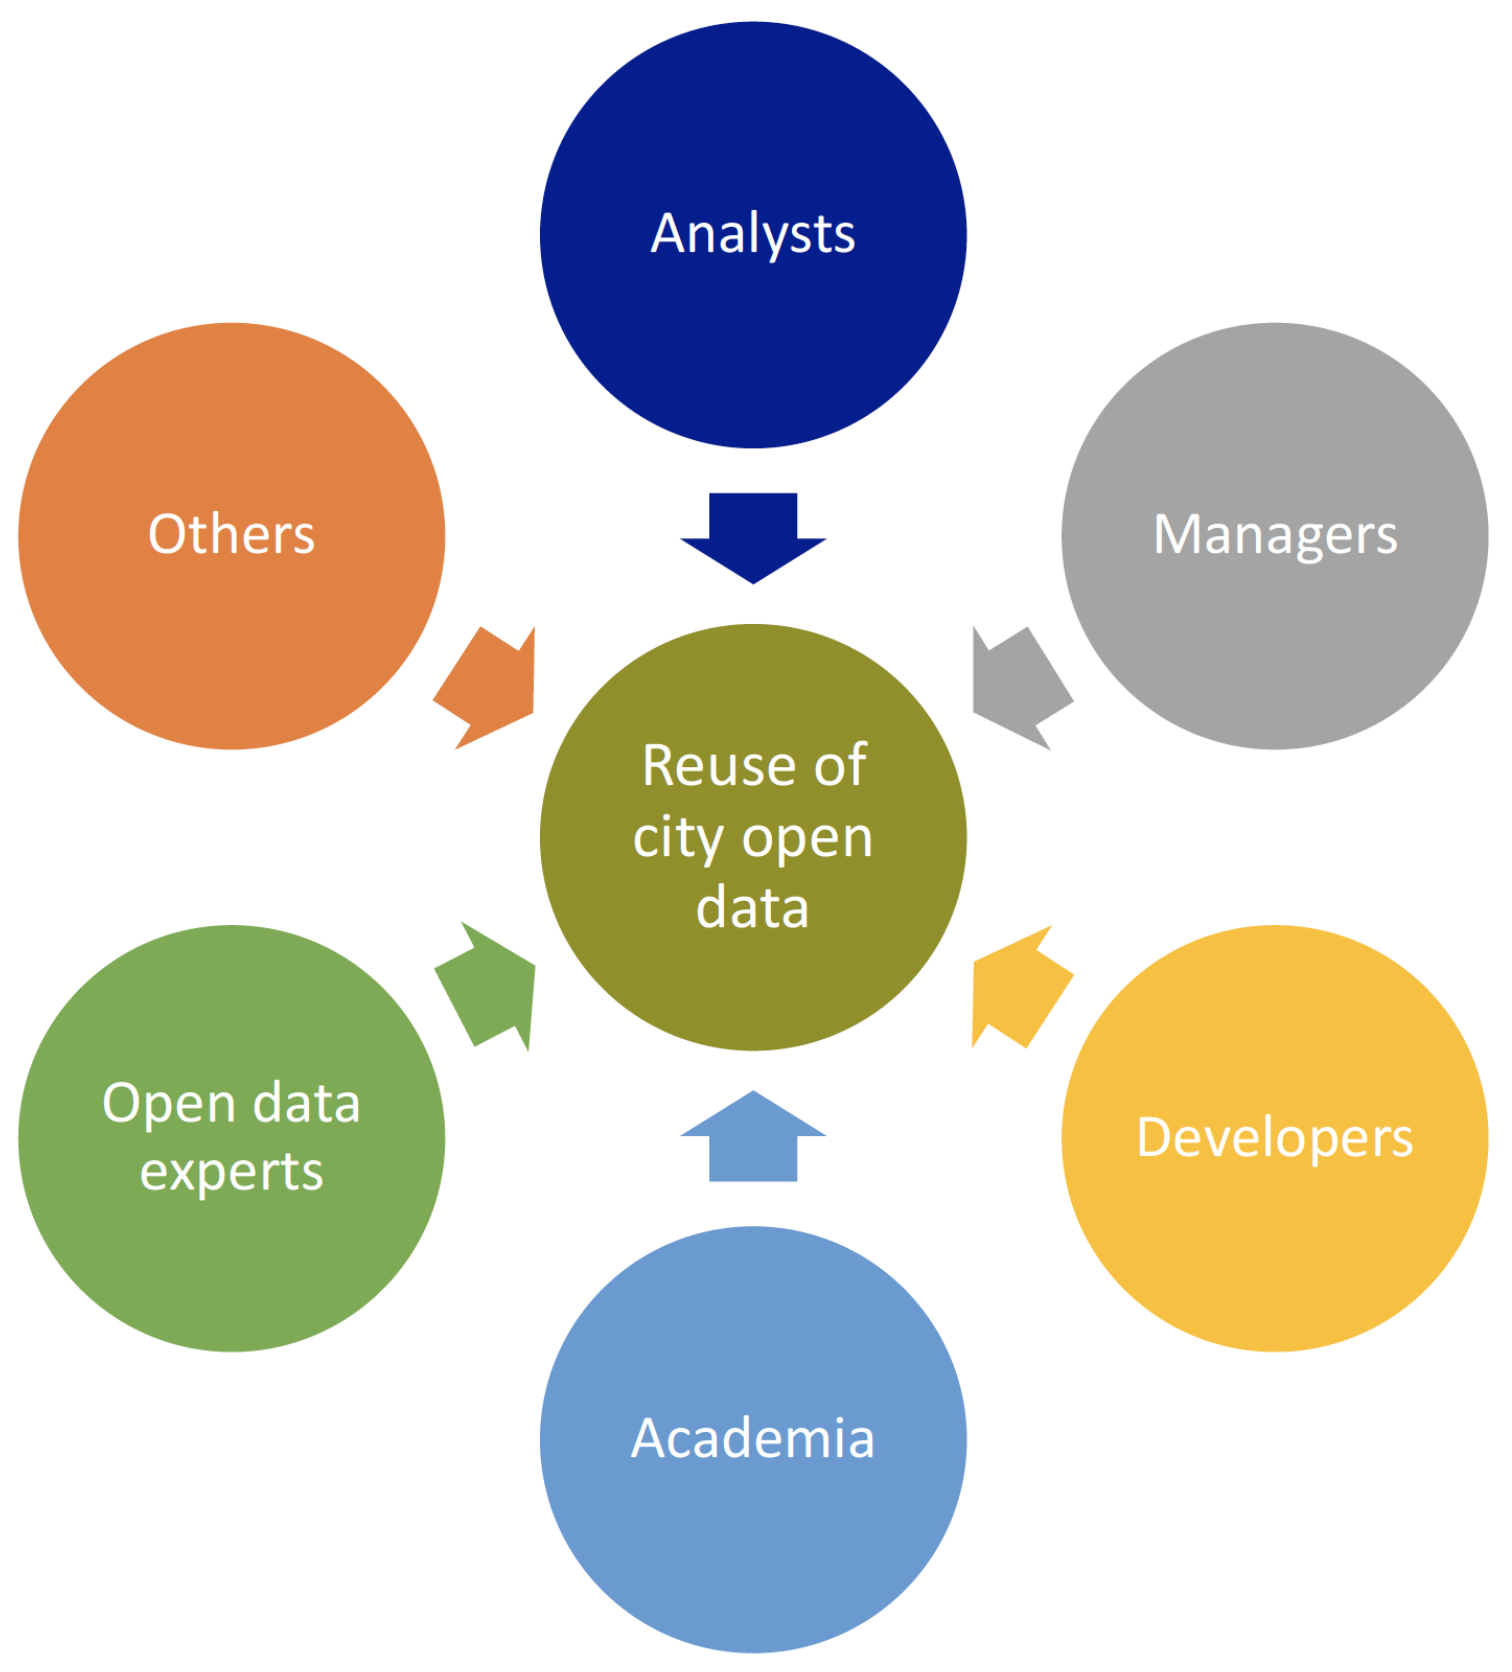
Table 1.
General aspects of selected cities data authorities. IDECA: Infraestructura de Datos Espaciales para el Distrito Capital; IDESC: Infraestructura de datos espaciales de Santiago de Cali; SDI: spatial data infrastructure.
Table 1.
General aspects of selected cities data authorities. IDECA: Infraestructura de Datos Espaciales para el Distrito Capital; IDESC: Infraestructura de datos espaciales de Santiago de Cali; SDI: spatial data infrastructure.
| Bogotá | Medellín | Cali | València | |
|---|---|---|---|---|
| Country | Colombia | Colombia | Colombia | Spain |
| Population | 8.080.734 inhabitants (2017) | 2.508.452 inhabitants (2017) | 2.420.013 inhabitants (2017) | 790.201 inhabitants (2016) |
| Context | The most populated and capital of Colombia | The second most populated city of Colombia | The third most populated city of Colombia | The third most populated city of Spain |
| Autority(ies) Contacted | SDI Bogotá (IDECA) | Medellín City Hall and Ruta N | Cali City Hall and SDI Cali (IDESC) | València City Hall and Las Naves |
| Main Open Data Theme of Interest | Urban Planning, Economic Development, and Infrastructure | Security, Environment and Urban Planning around a sustainable smart city strategy | Mobility, Security, and Health | Environment, Transport, Society, and Wellbeing are the themes more used and consulted of the Open Data catalogue |
| License or Terms of Use of Open Data | IDECA license | License Attribution-Share Alike 4.0 International | No open data license, only IDESC web site terms of use | All the datasets offered by the City of València, unless otherwise indicated, are published under the terms of the Creative Commons license-Recognition (CC-By 4.0) |
| Open Data Portal or Official Portal | IDECA website | GeoMedellin Website | IDESC website | València Open data website |
| Current Engagement Activities | Strategies implementation to facilitate the discovery, use, and reuse of available open data | Engagement activities with the community and identified users. Creation of the platform of open data, dynamic visualizations, and analysis with the data of the different dependencies of the Mayor’s Office of Medellín | Create channels of communication with citizen initiatives related to open data in the city. Promote the publication of open data of utility by the agencies of the Mayor of Cali. Promotional events for the open data available in Cali | The position of the City Council in relation to Open Government is that the technologies serve for the citizens to have more knowledge of municipal action and to make possible participation and collaboration with the management of the city; actively listen to citizens in social networks or any other media. They also work on the creation and application of standards as well as the use of transmedia to bring important issues to citizens |
| Developer Companies Identified as Open Data Users | A few companies identified. Note that this identification is not done periodically | There was one company identified | There were three companies identified | The policy of the City Council in Open Government, does not see as relevant to collect data of entities or individuals who have used the datasets |
| Universities or Colleges Identified as Open Data Users | There were several universities identified | There are several universities identified | There were several universities identified | Public Valencian universities collaborate with the city council in organizing activities and events on open data |
| Internal and Official Authorities Identified as Open Data users | There are 73 local entities integrated and identified | City Hall, Metropolitan and regional authority | Utilities, Transportation, Urban planing and Environmental, and Economical authorities | Representatives of the regional government have collaborated in some of the events of the Open Government Chair with the Polytechnic University of València, and both policies—local and regional |
| Urban Observatories or Analysis Groups Identified as Open Data Users | Several urban observatories were identified | Only one Urban observatory was identified | Several urban observatories were identified | N/A |
| Others Identified Open Data Users | Several cities stakeholders considered relevant | Several cities stakeholders considered relevant | Several cities stakeholders considered relevant | N/A |
Table 2.
This table represents the type of barriers to release data considering national or local use cases of open data initiatives, mentioned by each author. Due to there is no standard classification, barriers columns illustrate the barriers mentioned in each work, and at the same time the geographic context used for the use case. Note that mostly the national level is considered.
| Author(s) | Barriers | Geographic Context | ||||||
|---|---|---|---|---|---|---|---|---|
| Yang et al. [28] | Technological | Organizational | Legal and policy | New York State | ||||
| Janssen et al. [11] | Institutional | Task complexity | Use and Participation | Legislation | Information quality | Technical | The Netherlands | |
| Martin and Foulonneau [38] | Governance | Economic issues | Licenses and legal frameworks | Data characteristics | Metadata | Access | Skills | Rennes, France, Berlin, Germany, and UK |
| Barry and Bannister [31] | Economic | Technical | Cultural | Legal | Administrative | Risk related | Ireland | |
| Conradie and Choenni [37] | Fear of false conclusions | Financial effects | Opaque ownership and unknown data locations | Priority (i.e., local government has more important things to do first) | Rotterdam | |||
| Wang and Lo [26] | Data findbility and collecttion | Data layout and format selection | Personal privacy | Data licensing | Data Description | Taiwan | ||
| Attard et al. [6] | Technical | Policy/Legal | Economic/Financial Budget | Cultural | N/A | |||
| Schmidt et al. [20] | Desire to publish results before releasing data | Legal constraints | Loss of credit or recognition | Misinterpretation or misuse | Loss of control over intellectual property | Organizational constraints | N/A | |
| Carrara et al. [27] | Poor quality Open Data | A lack of standardization or heterogeneity | Difficulties in obtaining the data with the right information (metadata) for the purpose of its usability | European National level | ||||
| Carrara et al. [29] | Political | Legal | Technical | Financial | Others | European National level | ||
Table 3.
This table represent the mentioned barriers by some authors to release and reuse open data, considering the perspective of data users.
Table 3.
This table represent the mentioned barriers by some authors to release and reuse open data, considering the perspective of data users.
| Author(s) | Barriers | |||||
|---|---|---|---|---|---|---|
| Carrara et al. [27] | Low quality of Open Data | Lack of standardization | Availablity of open data, poor discoverability | Incorrect metadata | ||
| Carrara et al. [29] | Little awareness | Low availability | Legal | Technical | Financial | |
| Zuiderwijk et al. [60] | Fragmentation of data | Lack of access to data | Lack of interoperability | Difficulties in processing the data | ||
| Janev et al. [61] | Lack of standard procedures for querying government portals | The low quality of metadata | Low reliability and incompleteness of public datasets | The heterogeneity of formats used to publish open data | ||
| Schmidt et al. [20] | Paying for data | Varying degrees of data quality in different datasets | Varying standard in how data has been gathered | Varying data formats | ||
Table 4.
The highlighted rows correspond to data users’ barriers mentioned in the literature. The remaining rows were barriers mentioned as data producers’ barriers.
Table 4.
The highlighted rows correspond to data users’ barriers mentioned in the literature. The remaining rows were barriers mentioned as data producers’ barriers.
| Category | Occurrences |
|---|---|
| Data quality | 5 |
| Standardization | 5 |
| Accessibility | 3 |
| Awareness (cultural) | 2 |
| Technical | 2 |
| Financial | 2 |
| Discoverability | 1 |
| Legal and policy | 1 |
Table 5.
Top five of barriers mentioned by data users along the online survey first question, for the entire sample and also group by each selected city.
Table 5.
Top five of barriers mentioned by data users along the online survey first question, for the entire sample and also group by each selected city.
| Category | Barriers Most Mentioned in Online Survey | Percentage | n |
|---|---|---|---|
| Entire survey | Lack of updates of published data | 68% | 195 |
| Varying and low integration of data sources or data producers | 53% | ||
| Nonexistence or low relevance of URL to access to data | 48% | ||
| Published data is hard to access | 47% | ||
| Time spent searching for data | 43% | ||
| Bogotá | Lack of updates of published data | 74% | 46 |
| Time spent searching for data | 54% | ||
| Understanding terms of use | 52% | ||
| Nonexistence or low relevance of URL to access to data | 48% | ||
| Published data is hard to access | 46% | ||
| Medellín | Varying and low integration of data sources or data producers | 68% | 25 |
| Lack of updates of published data | 64% | ||
| Nonexistence or low relevance of URL to access to data | 60% | ||
| Time spent searching for data | 44% | ||
| Misinterpretation and misuse of data | 44% | ||
| Cali | Lack of updates of published data | 71% | 41 |
| Misinterpretation and misuse of data | 71% | ||
| Varying and low integration of data sources or data producers | 54% | ||
| Published data is hard to access | 54% | ||
| Understanding terms of use | 46% | ||
| València | Understanding terms of use | 68% | 19 |
| Lack of updates of published data | 63% | ||
| Varying and low integration of data sources or data producers | 53% | ||
| Misinterpretation and misuse of data | 47% | ||
| Nonexistence or low relevance of URL to access to data | 37% |
Table 6.
Number of occurrences of the mentioned barriers by data users in the open question regarding the most common error/barrier when searching or using data from cities’ open data portals.
Table 6.
Number of occurrences of the mentioned barriers by data users in the open question regarding the most common error/barrier when searching or using data from cities’ open data portals.
| Barrier Category | Occurrences | Percentage |
|---|---|---|
| Currency | 36 | 24% |
| Usability | 22 | 15% |
| Data Quality | 21 | 14% |
| Standardization | 20 | 13% |
| Accessibility | 16 | 11% |
| Technical | 16 | 11% |
| Discoverability | 10 | 7% |
| Legal and Policy | 5 | 3% |
| Awareness | 5 | 3% |
Table 7.
Summary of most mentioned category barriers by data users along the used questions in the online survey.
Table 7.
Summary of most mentioned category barriers by data users along the used questions in the online survey.
| Category | Example of Barrier |
|---|---|
| Currency | Lack of updates of published data |
| Accessibility | Varying and low integration of data producers. Nonexistence or low relevance of URL to access to data. |
| Discoverability | Published data is hard to access. Time spent searching for data |
| Usability | Misinterpretation and misuse of data |
| Data Quality | Data catalogs with poor descriptions |
| Standardization | Many formats, difficulty in searching the data |
Table 8.
Most mentioned barriers by data users in selected cities in the participatory workshops.
| Category | Cali | València | Medellín | Bogotá |
|---|---|---|---|---|
| Usability | Data difficult to understand | No suitable for reuse data format | Misunderstanding of available data | No relationship among published datasets |
| No applications to validate the reuse of data | No categories for available data | No apparent usability of available datasets | ||
| No relationship among the datasets available | No relationship among available datasets | There are no examples of reuse | ||
| Reduced usability | ||||
| Accessibility | No download option | Only one dataset for education | No downloaded option | |
| Official data web sites have no data | No transportation data is available | No georeferenced data available | Available data in PDF format | |
| Lack of data for transportation | Lack of important attributes | Lack of accessibility for some datasets | ||
| Lack of accessibility | Reduced discoverability, to find data it was necessary to spend a great deal of time | Data in PDF format | ||
| More marketing of current initiatives | ||||
| Information related to events, but no data related | ||||
| Data only for visualization, not downloadable option | ||||
| Data Quality | No metadata | Not enough metadata | No suitable format for open data | Duplication of data |
| Gaps in available data | Generalization of data, only for regional or national approach, Not local level | Attribute inconsistency | ||
| No georeferenced data | Gaps in published data | |||
| No raw data, the available data is processed | No updated metadata | |||
| No metadata is related to the data source | Generalization of data, Nor for local reuse | |||
| Processed data | Published data not georeferenced | |||
| Technical | No API documentation or examples | No advanced search option | Some web sites based on Flash technology | |
| Language issues among datasets | User authentication for some portals | |||
| No advanced searching options to find datasets | ||||
| JSON file with issues | ||||
| Legal and Policy | Misunderstanding regarding terms of use | |||
| License not clear | ||||
| Available data, but no open | ||||
| The terms of reuse are not clear | ||||
| Lot of available data, but not truly open | ||||
| Currency | Not up to date data | Some datasets are not up to date | Not up to date data | Data not up to date |
| No up to date apps in official websites |
© 2017 by the authors. Licensee MDPI, Basel, Switzerland. This article is an open access article distributed under the terms and conditions of the Creative Commons Attribution (CC BY) license (http://creativecommons.org/licenses/by/4.0/).
Share and Cite
MDPI and ACS Style
Benitez-Paez, F.; Degbelo, A.; Trilles, S.; Huerta, J. Roadblocks Hindering the Reuse of Open Geodata in Colombia and Spain: A Data User’s Perspective. ISPRS Int. J. Geo-Inf. 2018, 7, 6. https://doi.org/10.3390/ijgi7010006
AMA Style
Benitez-Paez F, Degbelo A, Trilles S, Huerta J. Roadblocks Hindering the Reuse of Open Geodata in Colombia and Spain: A Data User’s Perspective. ISPRS International Journal of Geo-Information. 2018; 7(1):6. https://doi.org/10.3390/ijgi7010006
Chicago/Turabian StyleBenitez-Paez, Fernando, Auriol Degbelo, Sergio Trilles, and Joaquin Huerta. 2018. "Roadblocks Hindering the Reuse of Open Geodata in Colombia and Spain: A Data User’s Perspective" ISPRS International Journal of Geo-Information 7, no. 1: 6. https://doi.org/10.3390/ijgi7010006
Note that from the first issue of 2016, this journal uses article numbers instead of page numbers. See further details here.