Robust Indoor Mobile Localization with a Semantic Augmented Route Network Graph


State Key Laboratory of Information Engineering in Surveying, Mapping and Remote Sensing (LIESMARS), Wuhan University, 129 Luoyu Road, Wuhan 430079, China
*
Authors to whom correspondence should be addressed.
ISPRS Int. J. Geo-Inf. 2017, 6(7), 221; https://doi.org/10.3390/ijgi6070221
Submission received: 9 May 2017
/
Revised: 13 July 2017
/
Accepted: 17 July 2017
/
Published: 19 July 2017
(This article belongs to the Special Issue 3D Indoor Modelling and Navigation)
Abstract
:In recent years, using smartphones to determine pedestrian locations in indoor environments is an extensively promising technique for improving context-aware applications. However, the applicability and accuracy of the conventional approaches are still limited due to infrastructure-dependence, and there is seldom consideration of the semantic information inherently existing in maps. In this paper, a semantically-constrained low-complexity sensor fusion approach is proposed for the estimation of the user trajectory within the framework of the smartphone-based indoor pedestrian localization, which takes into account the semantic information of indoor space and its compatibility with user motions. The user trajectory is established by pedestrian dead reckoning (PDR) from the mobile inertial sensors, in which the proposed semantic augmented route network graph with adaptive edge length is utilized to provide semantic constraint for the trajectory calibration using a particle filter algorithm. The merit of the proposed method is that it not only exploits the knowledge of the indoor space topology, but also exhausts the rich semantic information and the user motion in a specific indoor space for PDR accumulation error elimination, and can extend the applicability for diverse pedestrian step length modes. Two experiments are conducted in the real indoor environment to verify of the proposed approach. The results confirmed that the proposed method can achieve highly acceptable pedestrian localization results using only the accelerometer and gyroscope embedded in the phones, while maintaining an enhanced accuracy of 1.23 m, with the indoor semantic information attached to each pedestrian’s motion.
1. Introduction
In the past few years, the range of location-based services has been progressively extended from outdoor to indoor environments, as well as to applications such as path finding, emergency planning, and object tracking. This implies a demand for more accurate and robust indoor and outdoor localization and tracking technology on mobile devices. The outdoor localization services can be provided by GPS with a reliable accuracy, but in indoor spaces which are GPS-denied, alternative technology needs to be explored. Many existing indoor localization methods rely on dedicated infrastructure such as Wi-Fi access points [1], ultrasonic networks [2], synthetic aperture radar (SAR) [3], Bluetooth [4], ultra-wideband (UWB) [5,6], or magnetic fields [7]. However, this is often expensive and labor-intensive for large-scale deployment and suffers from discontinuous tracking during pedestrian movement. Moreover, the computational complexity involved in the algorithms is another challenge when applied to resource-limited smartphones.
Recently, the pedestrian dead reckoning (PDR) approach has become a promising solution to indoor localization; it estimates the distance and heading measurements of every step from the accelerometer and gyroscope embedded in smartphones to obtain a continuous trajectory. However, the error accumulation caused by low-cost sensors makes the PDR method alone unable to achieve acceptable accuracy. To solve this problem, many combination approaches are explored. Some of the approaches rely on frequent external position fixes (e.g., Wi-Fi access points) [8]. Some exploit the compatibility of human motion patterns and map information to determine the possible trajectory [9]. Others use sensor fusion methods such as Kalman filters [10] or particle filters [11] to account for the measurement uncertainty.
Among these approaches, combing the particle filter algorithm and map constraints to estimate the appropriate PDR result has been widely used for its effectiveness and ease of use. In these approaches, non-wall-crossing constraint is often used to eliminate invalid particles in position updating iterations [12,13,14]. However, in such cases, the map information is often insufficiently used, resulting in poor convergence. To exploit deeper map information, there are also methods that utilize the indoor skeleton map (e.g., Voronoi graph) to recover the indoor topological structure for indoor localization [15,16,17], which can achieve a lower complexity while maintaining an accuracy of a few meters. However, the fixed edge length assumption (e.g., equal to the average pedestrian step length) and the constraint of the pedestrian position to be at the nodes of the graph of these methods may not be applicable for diverse pedestrian step lengths. Moreover, the conventional approaches estimated the localization result using only the geometric coordinates, while the semantic location—which can provide potential compatibility of user locations with the indoor structure—is ignored. Goodchild [18] argued that human cognition is based on named places rather than the geometrical space of latitude and longitude. Therefore, the semantic accuracy should be considered as an important component of indoor localization, rather than purely providing sub-meter accuracy.
In this paper, an adaptive smartphone-based semantically-constrained indoor localization method is proposed, overcoming the inferiority of infrastructure-dependence and pure geometric-dependence problem. Differing from the previous methods which totally rely on the geometric constraints of maps, the semantic information (which comply with the human cognition of indoor space and imply the indoor space occupancy) is incorporated into the proposed semantic augmented route network graph. By constructing each node with the indoor landmark (e.g., corners, doors, stairs) and each edge with the routes between the landmarks, the semantic augmented route network graph was then input as a prior map for the trajectory calibration using a particle filter algorithm, providing geometric (location, length of edges), topological (connectivity and orientation), and semantic information (human cognition). In this way, the rich semantic information can be exploited to avoid the localization errors caused by purely depending on geometric coordinates in the conventional methods. Furthermore, in order to be applicable to diverse user step lengths, the adaptive edge lengths of the proposed route network graph are adopted according to the user motion and space continuity. Based on the semantic constraints and conformance information imposed by the constructed graph, an enhanced particle filter is adopted to simultaneously calibrate the PDR trajectory whenever it is estimated from the smartphone sensor, which can achieve a high-accuracy pedestrian trajectory estimation in terms of both semantic and geometric accuracy.
The remainder of this paper is organized as follows. Section 2 briefly reviews related works. Section 3 explicitly introduces the proposed method, including the definition and extraction of the semantically-augmented route network graph based on a prior floorplan, the PDR algorithm that tracks the user trajectory from the smartphone inertial sensors, and the graph match-based particle filter. The experimental results and comparisons are presented in Section 4. Finally, the conclusions are drawn in Section 5.
2. Related Works
Nowadays, the most prominent techniques for indoor localization have been built upon positioning hardware, including wireless modules (e.g., Wi-Fi, Bluetooth, ultra-wideband (UWB)) and motion sensors (e.g., accelerometers, gyroscopes, and compasses) [19]. The methodology involved can be categorized into triangulation, fingerprinting, and PDR. The triangulation technique estimates the location of a target using the distances or angles between the target and beacons. The fingerprinting approach computes the location on demand by matching the online signal fingerprints with those collected and stored in the database in the offline phase. Although the used methodologies vary, both methods have in common that they rely on wireless signals that share time-varying and multipath characteristics, and require intensive human labor in calibration and maintenance. In contrast, the PDR algorithm—advanced by lightweight micro-electro-mechanical systems (MEMS) sensors—has become a practical indoor localization approach with handheld devices [20]. However, the low-cost nature of the sensors can cause significant drift and bias in long-term tracking tasks. In order to solve this problem, many efforts have been devoted to body-fixed sensors (e.g., foot-mounting [21,22,23] and waist-mounting [24]), or to furnishing the intrinsic algorithms (step detection and heading estimation) that directly affect the localization result, regardless of the different smartphone placements and user motions [25,26,27,28,29].
Although achievements have been made, the PDR method alone still cannot provide reliable long-term pedestrian tracking. Therefore, many prior attempts focus on combining multiple methods to compensate each other’s drawbacks. Lee et al. [30] combined PDR with Wi-Fi by using the absolute localization provided by Wi-Fi to determine the initial position as well as fix the long-time accumulation drift of PDR. Similarly, Jin et al. [31] proposed to reduce the uncertainty of the PDR result based on sparse and partial locations sampled from the available wireless signals. In addition to this, this map information and particle filter are often combined with PDR to enhance the accuracy by implying possible routes and barriers, thus eliminating invalid particles [8,32]. Bojja et al. [33] extended the particle filter to three dimensions and combined it with collision detection techniques to navigate and localize vehicles in a parking garage. Other probabilistic approaches, such as the Kalman filter [10] and conditional random field (CRF) [34], are often used instead of a particle filter to reckon the appropriate localization.
To improve the localization accuracy, incorporating contextual information derived from a map has become a significant research aspect. Specifically, the map information includes coarse information such as the corridors and the boundaries of rooms, and high-level information such as the geometric, topological, and semantic relationships, as well as the landmarks that depict the interior structures of a room [12]. In terms of the level to which a map is exploited, the methods can be classified as landmark matching, trajectory matching, and graph matching methods. Landmarks are distinguished features or unique signatures that can be easily observed in the environment, including seed landmarks (e.g., elevators and staircases) and organic ones (e.g., magnetic anomaly spots) [12]. Wang et al. [13] detected landmarks with a smartphone by recognizing the measurement fluctuation in the accelerometer when the user enters an elevator, the sudden rise in the gyroscope when turning a corridor corner, or the unusual reading in the magnetometer when passing a magnetic anomaly spot. Combined with map information, the user trajectory determined by PDR can be recalibrated when sensing a landmark. Chen et al. [10] incorporated the user motion state (e.g., going up elevators, walking, stationary) into classifying the landmarks, and combined this with PDR to achieve a more robust localization performance. However, this method does not consider the topological information.
In contrast, trajectory matching aims to obtain a globally optimal estimation by taking into account the geometric structures, such as the straight corridors. Bao et al. [14] computed the geometric similarity between a trace of the user trajectory and the map (the length of the straight line and the angle of turning) to reference the latest corner, and hence eliminated the error caused by gyroscope noise. Khan et al. [32] defined pathways (e.g., hallways) and barriers (e.g., walls) that the user can traverse and cannot pass, respectively. Combined with the particle filter, PDR, and Wi-Fi scans, these methods can achieve zero-effort calibration for Wi-Fi fingerprinting. However, this method may fail when the constraints are sparse.
Studies have suggested that graph models can be used in indoor localization by providing the necessary geometric (e.g., space layout) as well as non-geometric cues (e.g., landmarks) when people navigate in space [15]. Jensen et al. [15] and Bercer and Dürr [35] extended this from outdoor to indoor localization by constructing indoor location models. The location model representing the indoor topology at different levels offers a uniform data management infrastructure for different positioning technologies. Based on this, Park and Teller [9] decoded the user trajectory with a sequence of low-level motions (e.g., standing still, walking straight, going upstairs, turning left, etc.) estimated by the smartphone’s inertial sensors. Then, the indoor locations are determined with respect to a discrete route map by constructing a hidden Markov model (HMM state model). Zhou et al. [16] adopted the same idea of examining the conformance between an activity sequence and a prior route-based graph. Wasiq et al. [36] used motion information from accelerometer and directions from magnetometer and gyroscope to achieve localization in sparse Wi-Fi environments. Similar to our method, Hilsenbeck et al. [17] undertook data fusion of a pedometer and Wi-Fi in a graph-based representation of the indoor environment. Compared with the previous graph-based localization method, our proposed method has the advantage of constructing the graph with adaptive sample rate of varying edge length to allow multiple step length modes and promoting semantic accuracy in addition to pure geometric accuracy.
3. Methodology
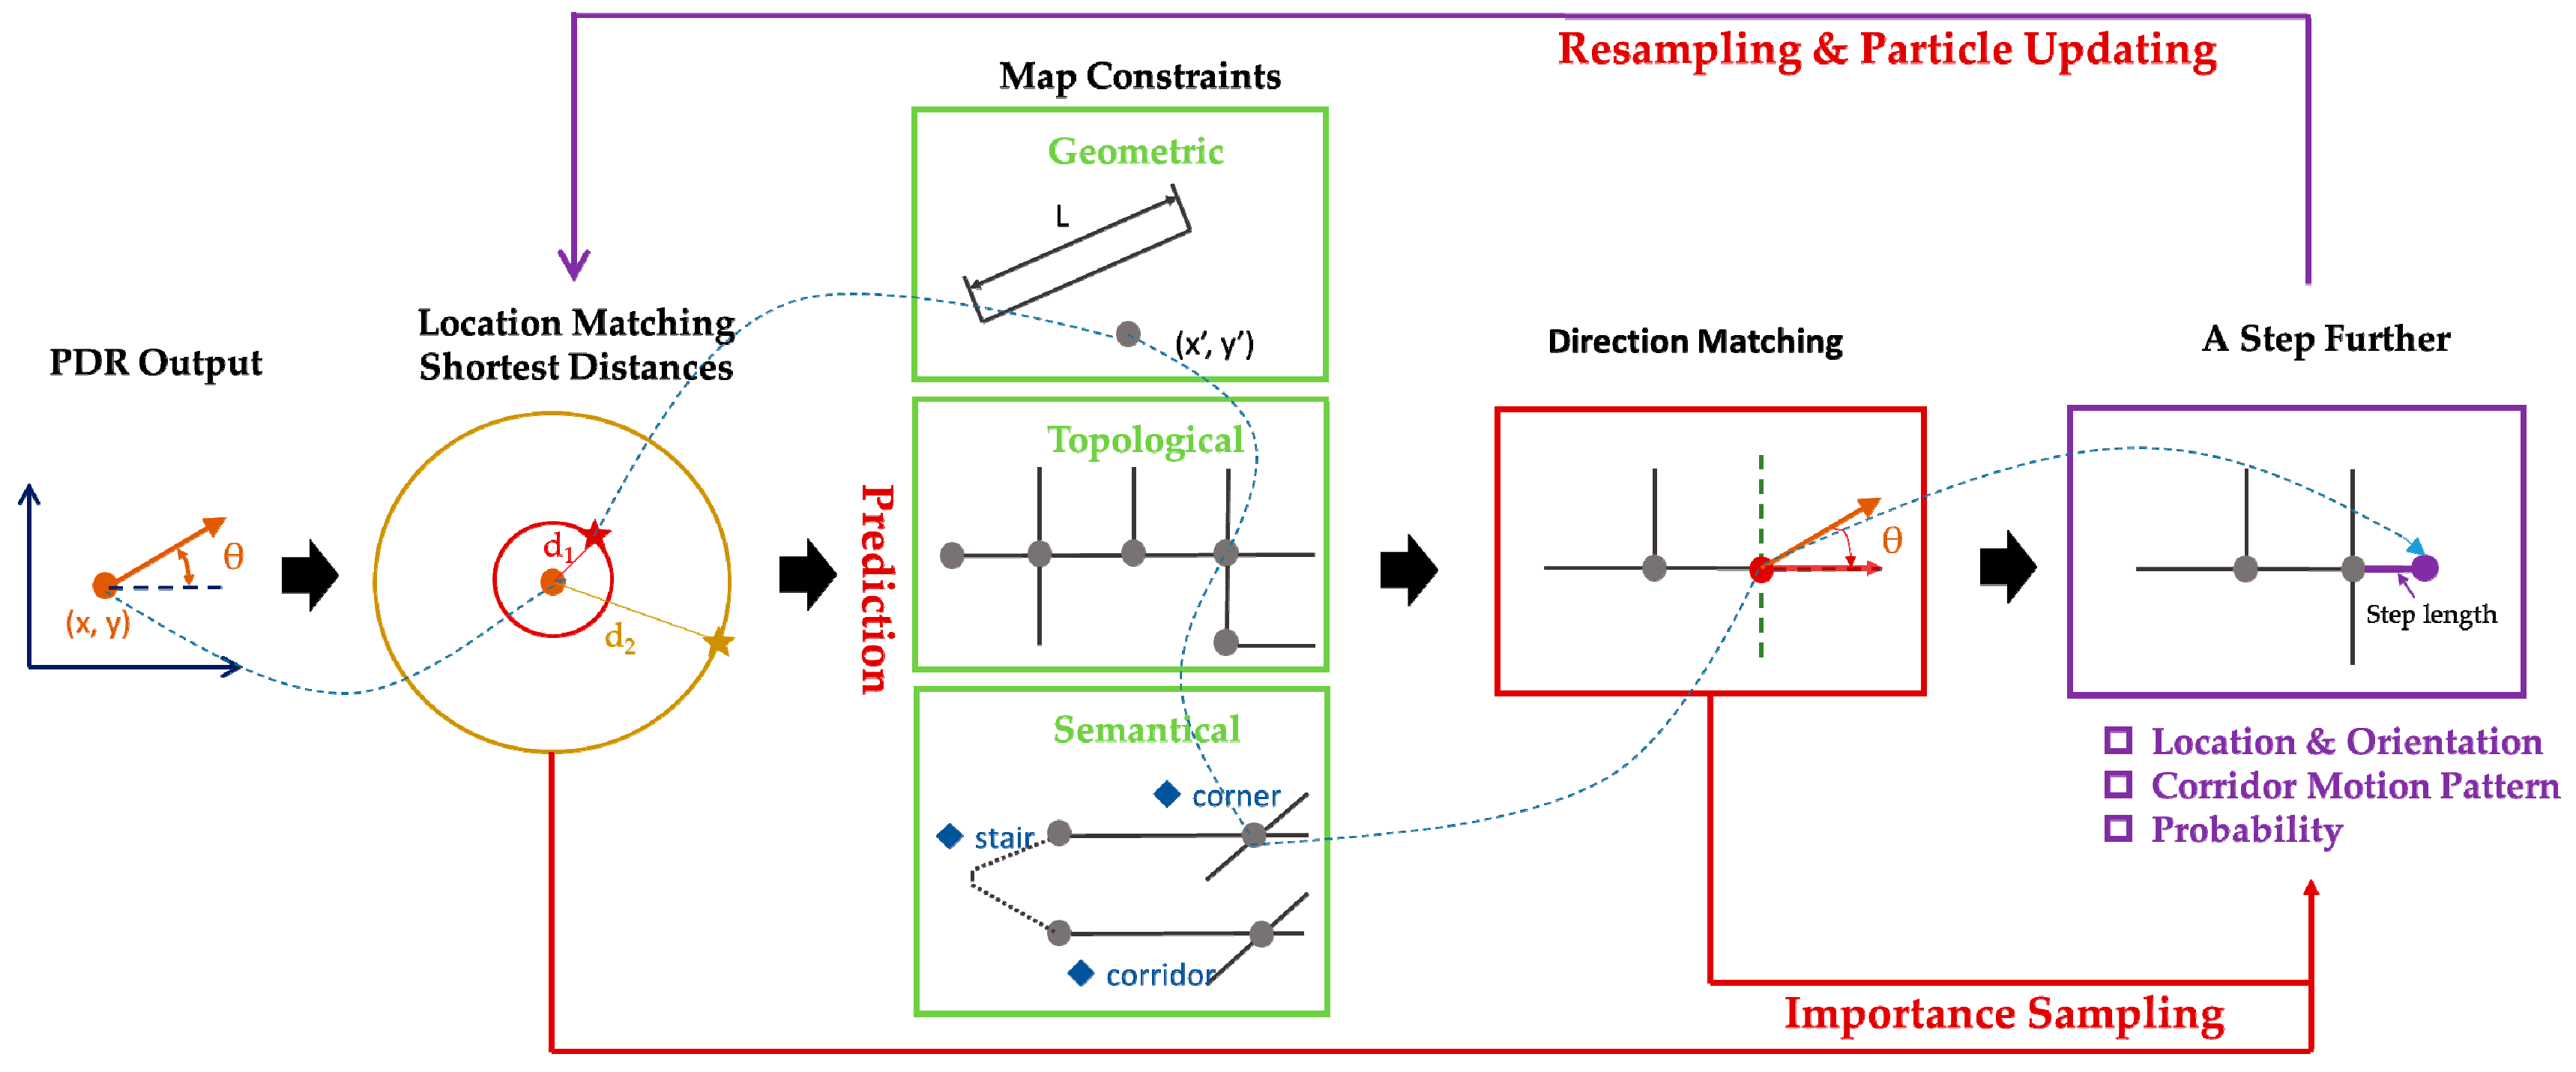
In this section, we discuss the proposed localization method that uses map information and mobile phone inertial sensors to obtain a precise user trajectory in an indoor environment. Figure 1 depicts the framework of the proposed method.
3.1. PDR Trajectory Estimation
The coarse user trajectory is first referenced by the PDR algorithm through step detection, step length estimation, and heading estimation. In our work, the initial location is assumed to be provided by the user.
3.1.1. Step Detection
Based on the repetitive pattern of the accelerometer when the user walks, we apply the two threshold peak detection algorithms to identify true peaks (steps) and eliminate false ones. The two thresholds, and , are defined as:
- : minimum acceleration magnitude that determines a peak; and
- : minimum time duration between two steps.
The former declares that only the peak magnitudes that exceed the threshold can be regarded as true steps. While the latter provides the constraint that two consecutive peaks must surpass the time threshold . The two thresholds can eliminate false steps that are caused by noise or random user movement. This is illustrated in Figure 2, which is a truncated waveform from a yaw acceleration signal when the user traverses through space with the smartphone held in hand. The false peaks occur frequently as a lower peak near the true one, either in small or large magnitude. The small magnitude false peaks are removed for violating the threshold when executing peak detection. The large ones are eliminated for not satisfying the frequency regulation , which is in accordance with human step modes. As a consequence, when applying the two threshold peak detection algorithm to the yaw acceleration signals collected by the smartphones, the true user steps can be accurately detected. Note that these two thresholds are not uniform for all situations, and they vary according to the user, the environment, and the footwear. As a consequence, a training process of the user holding the smartphone and walking for a certain distance is needed to approximate the most appropriate value.
3.1.2. Step Length Estimation
Many algorithms are available to model step length by exploiting the walking frequency, the walking velocity, or the acceleration. We adopt the Weinberg model [20] to calculate the step length:
where and are the maximum and minimum values of the yaw acceleration samples, respectively. is a constant determined by training. Our approach takes as the initial value. Since step length exhibits variation even with the same individual in the same walk, we add a random error (uniformly distributed in the range of ±10%) to the stride length.
3.1.3. Orientation Estimation
Orientation estimation (the forward direction of the user) has been a difficult component in PDR systems because the user direction may not align with the direction of the smartphone (e.g., a user puts the phone vertically in a pocket or rotates it randomly when holding it in the hand). Most of the existing approaches using non-fixed smartphone inertial sensors either assume that the heading misalignment remains constant during the walking process and compromise the value to obtain the right direction afterwards, or assert map knowledge and other information to recalibrate the error. Similarly, we use the graph matching method discussed in the next section to calibrate the bias between user direction and smartphone direction, and focus on the accurate estimation of device orientation from the inertial sensors.
Our work assumes that the smartphone is held in the hand with it pointing in the forward direction. Then, the angular rate reading from the gyroscope is used to calculate the orientation quaternion at each step. The orientation quaternion (including the Euler rotation vector roll-pitch-yaw between two successive epochs and a scalar component) from the gyroscope is then utilized to approximate the orientation update. The orientation update model from the device frame to the navigation frame can be interpreted as:
where is the rotational quaternion between the two epochs and , is the sampling period (the sampling rate of gyroscope in our case), and and are the orientation quaternions of epoch and , respectively.
The mathematical derivation of the quaternion update can be expressed as follows:
- Initialization: the magnitude of the angle rotated within one sample time:where is the angular rate returned by the gyroscope at time stamps k, and is the time duration of one sampling.
- Quaternion update: calculate the rotation of one sample time from the device frame to the navigation frame:where:We rewrite the factor as:Consequently, Equation (4) can be rewritten as:
- Rotation matrix calculation: given the orientation quaternion , the rotation matrix from the device frame to the navigation frame at timestamp can be expressed as:
- Angle calculation: the angle at timestamp can be extracted from the rotation matrix as:
Figure 3 is an example of walking a rectangular route with four 90° turns, finally returning to the starting point. The orientation change truth of straight walking are treated as 0° and turn as 90°. Three kinds of headings are exploited to describe the heading. The first one is the orientation change during one step (Figure 3a). The second is the accumulated heading, which depicts the heading estimation with respect to the magnetic north (the starting orientation) (Figure 3b). The third is the orientation change accumulated over three steps (Figure 3c). In Figure 3a, it can be observed that the straight walking route shows slight fluctuation (noise) with a range less than 10°, and the four turns are clearly identified and demonstrated. The accumulated heading in Figure 3b explicitly shows the heading pattern, which verifies that the slight noise in straight walking has no negative impact on the heading result. Although the accumulated heading differs from the true orientation, it can be calibrated in the following steps. The orientation change over three steps are used for turn detection, which are described in the next section.
3.1.4. Turn Detection
Turns are an important indicator for connecting two user motions and space structures. We exploit a sliding window algorithm to infer the user’s possible turns (as shown in Figure 3). It can be seen in Figure 3a,b that it is difficult to detect the turns using the first two methods in; the first is susceptible to different participants, and the second can rarely observe a step when a turn is taken within several steps. While (c) models a step, it is usually conducted in three steps, which is the most appropriate way for turn detection. As a consequence, we deem a turn as detected if it exceeds the threshold (40° in our training) and the last three headings are not a turn.
where is the heading angle at the end of the sliding window and is the heading angle at the start of the sliding window. Taking Figure 3b as an example, the first detected turn over the sliding window is (we set the threshold to be 70°). In a real situation, the turning events are not necessarily limited to standard right-angle turns, as U-turns and slightly curved turns may also exist. The former can be solved analogously by setting a higher threshold, and the latter can be incorporated into the route structure.
3.2. Semantic Augmented Route Network Graph Generation
In this part, we describe the construction of semantic augmented route network graph. As users tend to follow a dedicated path to a destination instead of randomly walking in the indoor space, we assume that the semantic augmented route network contains all possible user paths. For example, if you want to walk from room 79 to room 48 (in Figure 4), you must walk through door 79, take the path along the corridor to the north, and pass door 79 to get to the destination. During the process, the route network not only imposes constraints, including (a) geometric constraints (i.e., the explicit walking distances and turn angles); (b) topological constraints (i.e., the spatial layout and path continuity); and (c) semantic constraints (i.e., the agreement of the space type and motion type), but also implies a hypothesis about which path the user is likely to use. In this way, we extract the semantic augmented route network from the floorplan as a node-edge abstraction of the indoor space, where the nodes model the predefined locations (landmarks, e.g., corners, doors, and points of interest), and the edges represent the connections that make it possible to move through these locations. Considering the semantic information and the user motion modes, the result is a route network that contains edges for traveling along the corridors and for entering the rooms on both sides, and nodes as landmarks that calibrate the biased trajectory and provide semantic labels, as shown in Figure 4.
The proposed semantic augmented route network has the following properties:
- Semi-metrical. We remove the irrelevant degrees of freedom by extracting a one-dimensional skeleton from the floorplan, while keeping the necessary metrical information for localization by labeling the length of the corridors and representing the rooms as abutting points with range buffers. In this way, the computational complexity is reduced.
- Motion-associated. Given the spatial relationships between indoor entities (e.g., rooms, corridors, and corners) and the user’s activity events (e.g., turning left and turning right), we can narrow the user path to the specific route in the graph or recalibrate the biased trajectory by recognizing the events. The adaptive edge length also extends the graph to be applicable to multiple user modes.
- Semantically-augmented. The route network represents the connectivity and accessibility of indoor space by defining the transition probabilities between connected nodes, and the semantic information attached to each node and edge provide extra semantic accuracy to the calibration result.
3.2.1. Indoor Structure Adaptive Extraction
Previous works have suggested that localization accuracy depends on the sample rate of the graph model, by either adopting a uniform sample size or assuming that the edge length is roughly equal to the average pedestrian step length [17]. However, the uniform sample size approach usually suffers from an under- or over-estimation problem, and the step length varies according to height, gender, and even the environment, making it unsuitable for practical use. Our proposed method adapts the sample size to the structure of the space while taking the smoothness and continuity of user motion into consideration. This is achieved by representing the points as the features indicating the doors of a room or the corners to take a turn, and the edges as the middle skeleton of the corridors connecting all the feature points. In order to precisely describe how the semantic augmented route network is applied to the MM process, we take the example of the corridor region on floor 2 to further explain the data structure of the graph (see Figure 5 and Table 1).
For corridors and doors, the neighbor direction indicates whether the corresponding direction has a neighbor or not. The neighbors refer to the neighbor indexes in four directions, if it has the neighbors. The neighbor distance means the distance from the node to its neighbors in the corresponding directions. For areas (consisting of rooms and open areas), neighbors refers to the number of doors sharing the same space, and the neighbor directions are the corresponding door directions. The neighbor distances represent the range of the area with minimum and maximum coordinates. For stairs, the neighbor direction is the start and end point, and the neighbor distance is the height of one step. Specifically, the start and endpoint are represented with a portal that connects the two regions. Doors are the most common portal type, while the neighbor distance is the step length buffer (defined as 1 m).
3.2.2. User Motion Compatible Context
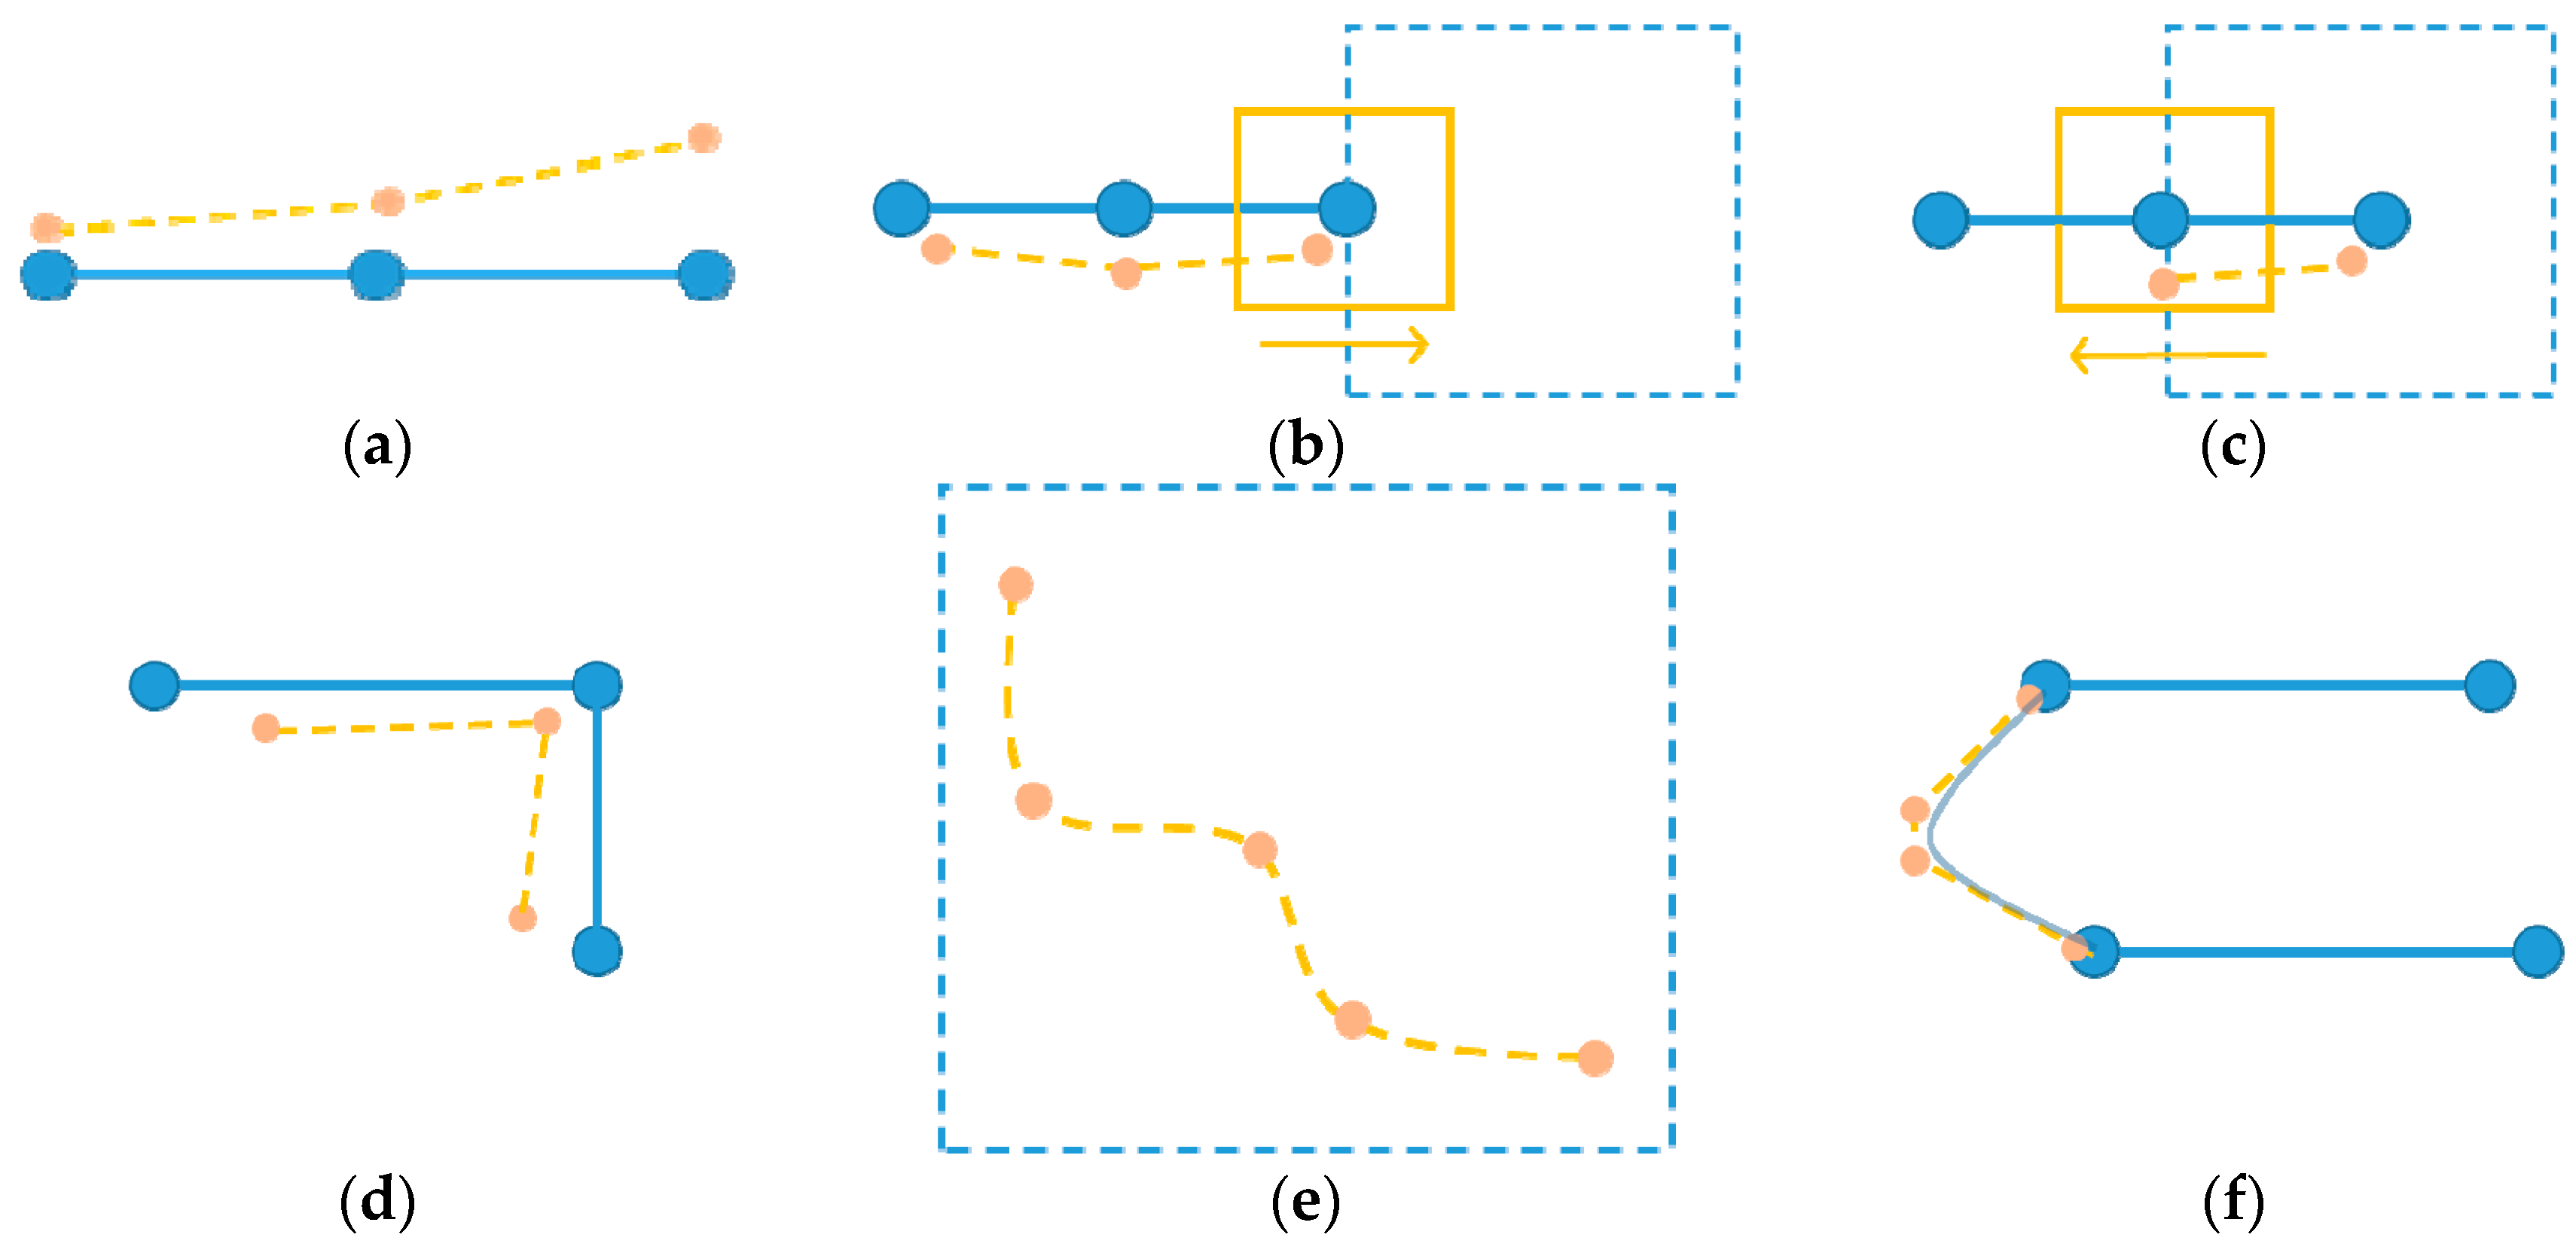
Since the graph intrinsically contains all possible user paths in the indoor space, the user motion is semantically compatible with the route network graph. The possible user motion models in indoor spaces can be summarized as follows (see Figure 6):
1. Walk along the corridor (M1)
The user walks approximately along a straight line. The turning angle is set to zero. The total distance traveled can be estimated by recognizing and counting the user steps. A slightly curved path can also be viewed as straight-line walk in our case, because the graph depicts the long corridors as sections, and the angles between these sections have been implicitly considered.
2. Walk from corridor to area (M2)
An area and a corridor are usually connected with a portal. We utilize a 1 m × 1 m square buffer centered with the portal to determine whether the user encountered the portal. Once the user entered the buffer, the buffer analysis is triggered to relocate his/her position as the portal. This motion can either contain a turn or not.
3. Walk from area to corridor (M3)
The opposite motion to M2.
4. Turn at a corner (M4)
Turning happens when the direction obviously changes over a short period of time. It can be regarded as pure heading change while staying on the route graph node with no transition move between edges. Each turn observation is quantized to a multiple of .
5. Walk in an open area (M5)
Since few constraints exist in open areas, we model the walk as the PDR trajectory result and calibrate the route when encountering doors. Since PDR can perform well in short-time tracking, it has no negative effect on the overall localization result. An open area may share more than one door. In this situation, the locations of the doors and the range of the room are combined to determine whether the user walks out of the open area.
6. Go upstairs and downstairs (M6)
Going upstairs and downstairs are marked by a vertical ascent or descent in height. This typically involves straight walking and turn motions in terms of horizontal movement. Since the detailed structures of stairs such as the tread numbers and the spiral directions are usually not available in the floorplan, we simplify the process as three parts. Firstly, the walk along the direction given by the start portal with the step length is the horizontal width of one individual stair, and the height movement increase or decrease is the vertical height of each stair. Secondly, a U-turn follows at the spiral of the stairs. Finally, the last half walk is the same as the first half, but with the opposite direction.
7. Stand still (M7)
Standing still involves little or no motion; for example, standing for a while or sitting in an office, classroom, library, etc. Detection of standing can be used to pause the movements by counting no steps.
As the user motion has a compatibility with the space usage, as described above, we can explicitly formulate the relationship between the space type (labeled by the localization semantic), the user motion, and the corresponding algorithms used to detect and distinguish them (see Table 2).
3.3. Graph Matching-Based Particle Filter
In this section, we discuss how the aforementioned context-related motion is associated with the particle filter to infer pedestrian locations. The particle filter is a Monte Carlo implementation of a recursive Bayesian filter, which depends on neither linear nor unimodal distributions. The key idea of the particle filter is to make use of importance sampling and resampling technique to provide samples over a set of particles from a sequence of distributions defined upon state spaces [37]. The main parts of the particle filter algorithm during one iteration include:
- Prediction: for each particle, the new state is predicted by sampling from the state transition probability distribution, given its current state:where and are the respective particle states at times and . represents the control information; for example, the map knowledge of the environment.
- Importance sampling: for any measurement, update each particle’s importance weight according to the measurement likelihood function, given its new state:where and are the respective importance weights at the current and previous timestamps, and denotes the current measurement.
- Resampling and particle updating: resampling is carried out when the effective sample size falls below a specified threshold (50% of the particle number in our case). Therefore, high weights are duplicated and low ones are eliminated. Resampling the particles to obtain equally-weighted particles by duplicating only the particles with qualified weights:where is the number of particles with qualified weights and is the resampled particles.
Note that the above equations can be applied to particle filter procedures with occasion-specific mathematical models or probability distributions. Therefore, the particle filter can be directly extended to incorporate map knowledge and related motion information into the pedestrian tracking problem. In addition, for each particle, Equations (12) and (13) are calculated iteratively, and hence the complexity of the algorithm can be evaluated by ( is the number of particles) [17]. As a result, the number of particles necessary for reliable target tracking is a critical factor with respect to the computational complexity. Our proposed method reduces the number of particles needed by adopting the discrete representation of the indoor floorplan. The following part depicts the method in detail.
3.3.1. Context-Augmented State Space
Previous approaches concerning the graph-based particle filter have typically been performed on a continuous map with walkable areas and barriers. The state space is thus an coordinate representation of the particle location over the entire space. For the purpose of reducing the computational complexity on smartphones, our approach relies on an abstract semantic augmented route network consisting of potential motion-changing nodes and walkable edges. To augment contextual information to the location reference process, the state space is extended to include the structure and connectivity knowledge as follows:
- Three-dimensional coordinate of particles ;
- Start node and end node ;
- Orientation deviation from last time ; and
- Pedestrian step length .
Given the input heading and step length observations, the human movement is modeled and sampled by moving along the predefined connected edges on the graph. Therefore, each location estimation output by PDR is matched to the most appropriate node or edge in the route network. In this way, the state space is limited to the restricted region regarding only the semi-metric route graph, thus reducing the number of particles needed. Furthermore, the inclusion of the heading and step length in the state space means that the bias is instantaneously corrected at the completion of each step, therefore avoiding error accumulation in PDR and leading to accurate and complexity-reduced location estimation.
3.3.2. PDR-Based Particle Filter Model
We construct the PDR-based particle filter model by assuming that the motion follows the pattern of the transitions along edges in the graph, which is explained in Figure 7. The state update is triggered each time PDR outputs the motion estimation (heading and step length), which makes the filter run at the step frequency. Whenever a step is detected, the particle samples a new state from the state transition probability distribution, given the old state , the measured displacement (step length), and the current orientation estimate . A user path must be continuous, as transitions are allowed only to nearby states that can be reached in one step. Correspondingly, we rewrite Equation (12) for our proposed approach as:
This equation can be directly related to the importance sampling equation . As explained in Figure 7, the displacement probability and the orientation probability are independent of each other. Therefore, is made up of two parts: the distance observation probability distribution and the angle observation probability distribution.
- Orientation: calculate all the edges connected with the current node with respect to their respective directions relative to the particle’s orientation:
- Location: calculate the nearest node in the graph to the new location calculated by the sampled edge and the particle’s displacement:
The above steps decide the transition along the edges. If a transition is sampled, the particle moves to the node at the other end of the edge or stays somewhere between two nodes (the user locations are not restricted to nodes). Therefore, the likelihood function in our case is derived from the joint measurement probability of two independent measurements: the edge (the orientation is determined) and the displacement (the transition along the given edge):
Inspired by the above decomposition, the transition probability can be estimated by considering the directional information from the motion observation. It is approximated by a Gaussian distribution with a mean of the difference between the observed orientation change and the direction turn defined in the graph between two states , and a standard deviation of the gyroscope measurement error:
where , and the standard deviation defines the degree to which the angle mismatch between the true heading and the semantically-augmented route network is allowed (we set it to 15°). is the number of neighbors that is connected with .
Given that the motion direction is fixed by the orientation measurement, the displacement probability can be estimated under the assumption of taking a straight-line walk along the edge on the graph. Specifically, it determines whether the user remains on the current edge or moves to the next one when a new stride is taken.
If , the particles move out of the current edge and transfer to the next abutting one according to the observed orientation.
For orientation sampling, we approximate these results using a Gaussian distribution around the measured absolute orientation :
where is the standard deviation learned from the errors by the built-in inertial measurement of the gyroscope.
For the step length errors, we approximate these results using a Gaussian distribution around the measured displacement :
where the standard deviation is learned from experiments with the user step length models.
4. Experimental Evaluation
In order to evaluate the performance of the proposed model, two sets of experiments were conducted in the indoor space to verify its applicability to a complex environment and diverse users, respectively.
4.1. Experimental Setup
The two experiments were performed in the building of the State Key Laboratory of Information Engineering in Survey, Mapping and Remote Sensing (LIESMARS) at Wuhan University. This is a four-level office environment consisting of typical indoor structure, including individual offices, corridors, stairs, halls, and walls. Each level has an area of about 38 m × 51 m. The experiments were conducted on the first and second floors of the building, which are connected by stairs to the south. The participants of the experiments were asked to hold their smartphones in hand and behave as usual when walking in the space. At the same time, the sensor readings were recorded and processed to determine the user location. The smartphone used in the experiments was the Xiaomi 2 smartphone (Xiaomi Inc., Beijing, China) running the Android 4.4 operating system. To obtain the ground truth at the sampling time of the tracking system, we marked the ground with a 1 m grid on the pre-specified route and used a camera to record the walking process. We then manually measured the locations of each step of the pedestrians. In order to verify the proposed semantic augmented route network localization approach, we first evaluated the performance of the approach in the complex indoor environment by conducting two experiments containing all kinds of scenarios of people traversing the indoor space. We then invited six volunteers to walk along a predefined route and recorded their trajectory while, in the meantime, exploring whether the proposed method is robust to diverse users and brings additional improvement to the tracking performance.
4.2. Applicability in a Complicated Indoor Environment
In a real-world setting, users usually carry their smartphones as they walk through various sections of an indoor space. Moreover, they are likely to walk, stop, or go upstairs or downstairs; for example, walking between locations of interest or dwelling at certain locations for a significant length of time. Our experiment was aimed at emulating these practical scenarios in an office environment, considering all the contexts defined before in our model. Therefore, the following two routes were designed as the ground truth for verifying the performance of our approach, which are the combination of all possible user movement modes, such as walking along the corridor, walking in the open area, going in and out of the rooms, and going up and down stairs. Scenario (1): A enters the building from the front gate and walks through the open area and corridor to go to their seat and then comes out of the office to the lobby; Scenario (2): B walks upstairs from the first floor to the second floor and walks around the lobby to the office door.
The PDR result is first calculated and the semantic augmented route is performed simultaneously to calibrate its result. The result of PDR and the semantically-calibrated approach are as follows:
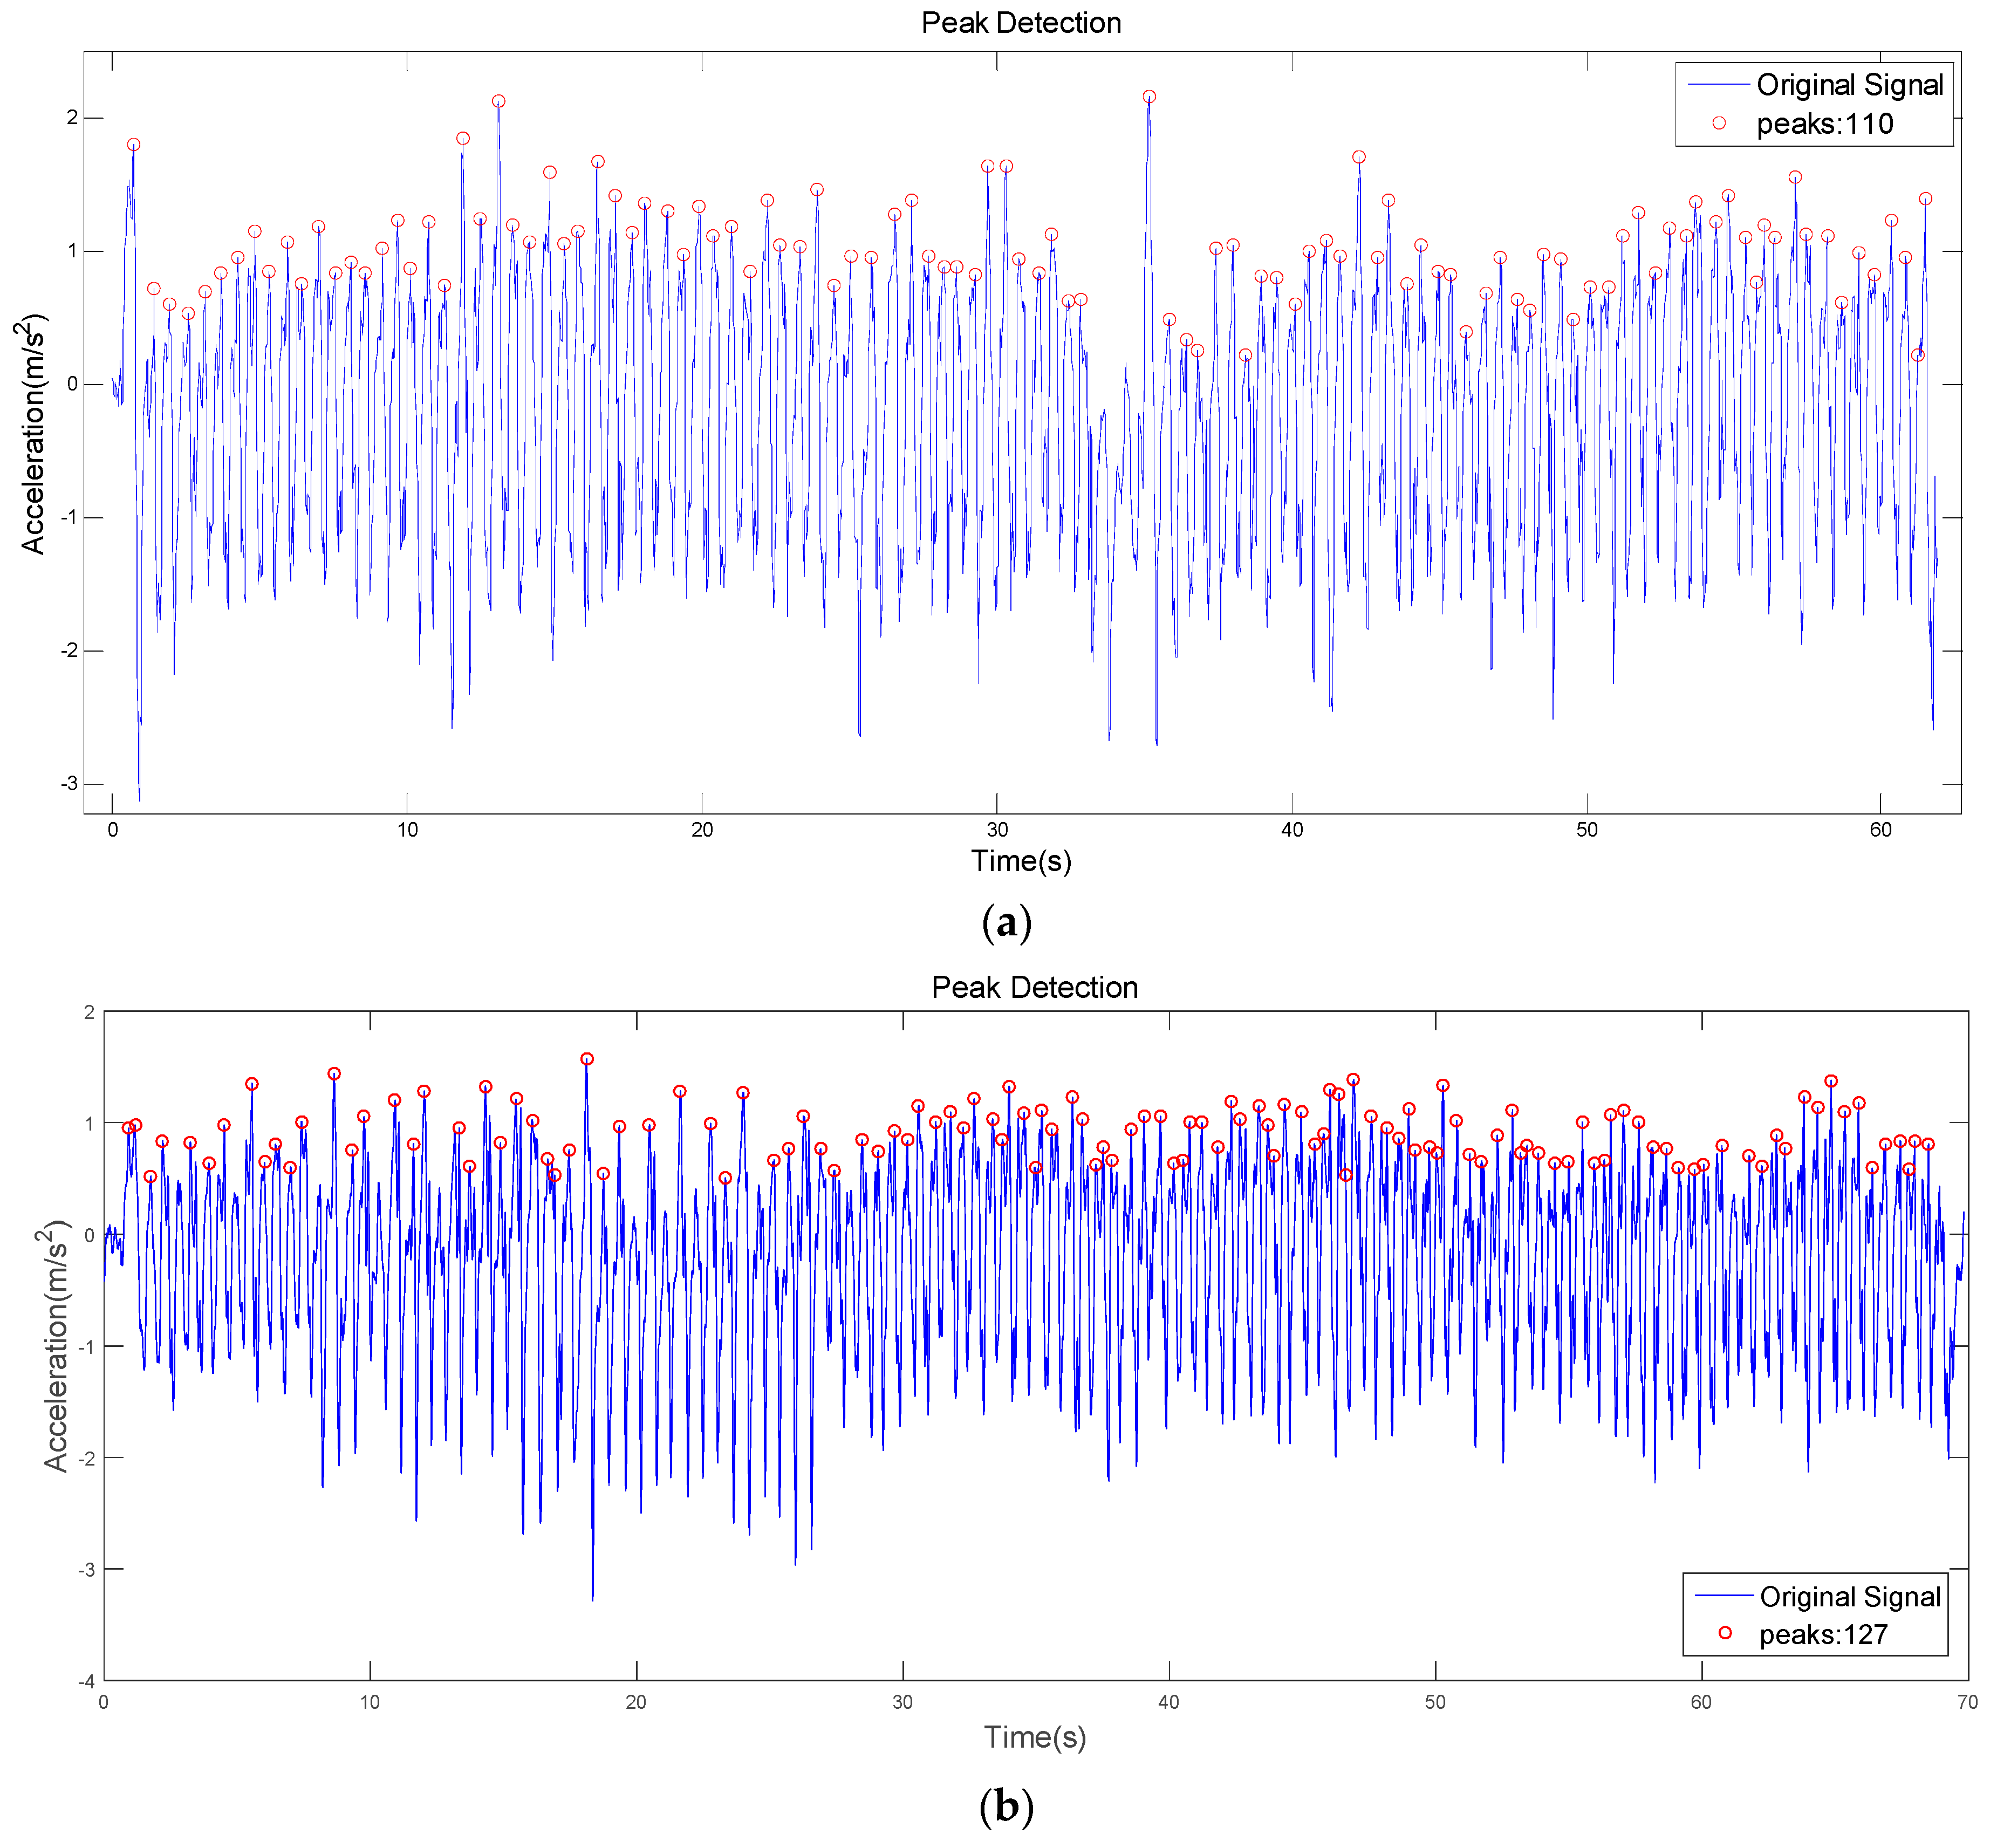
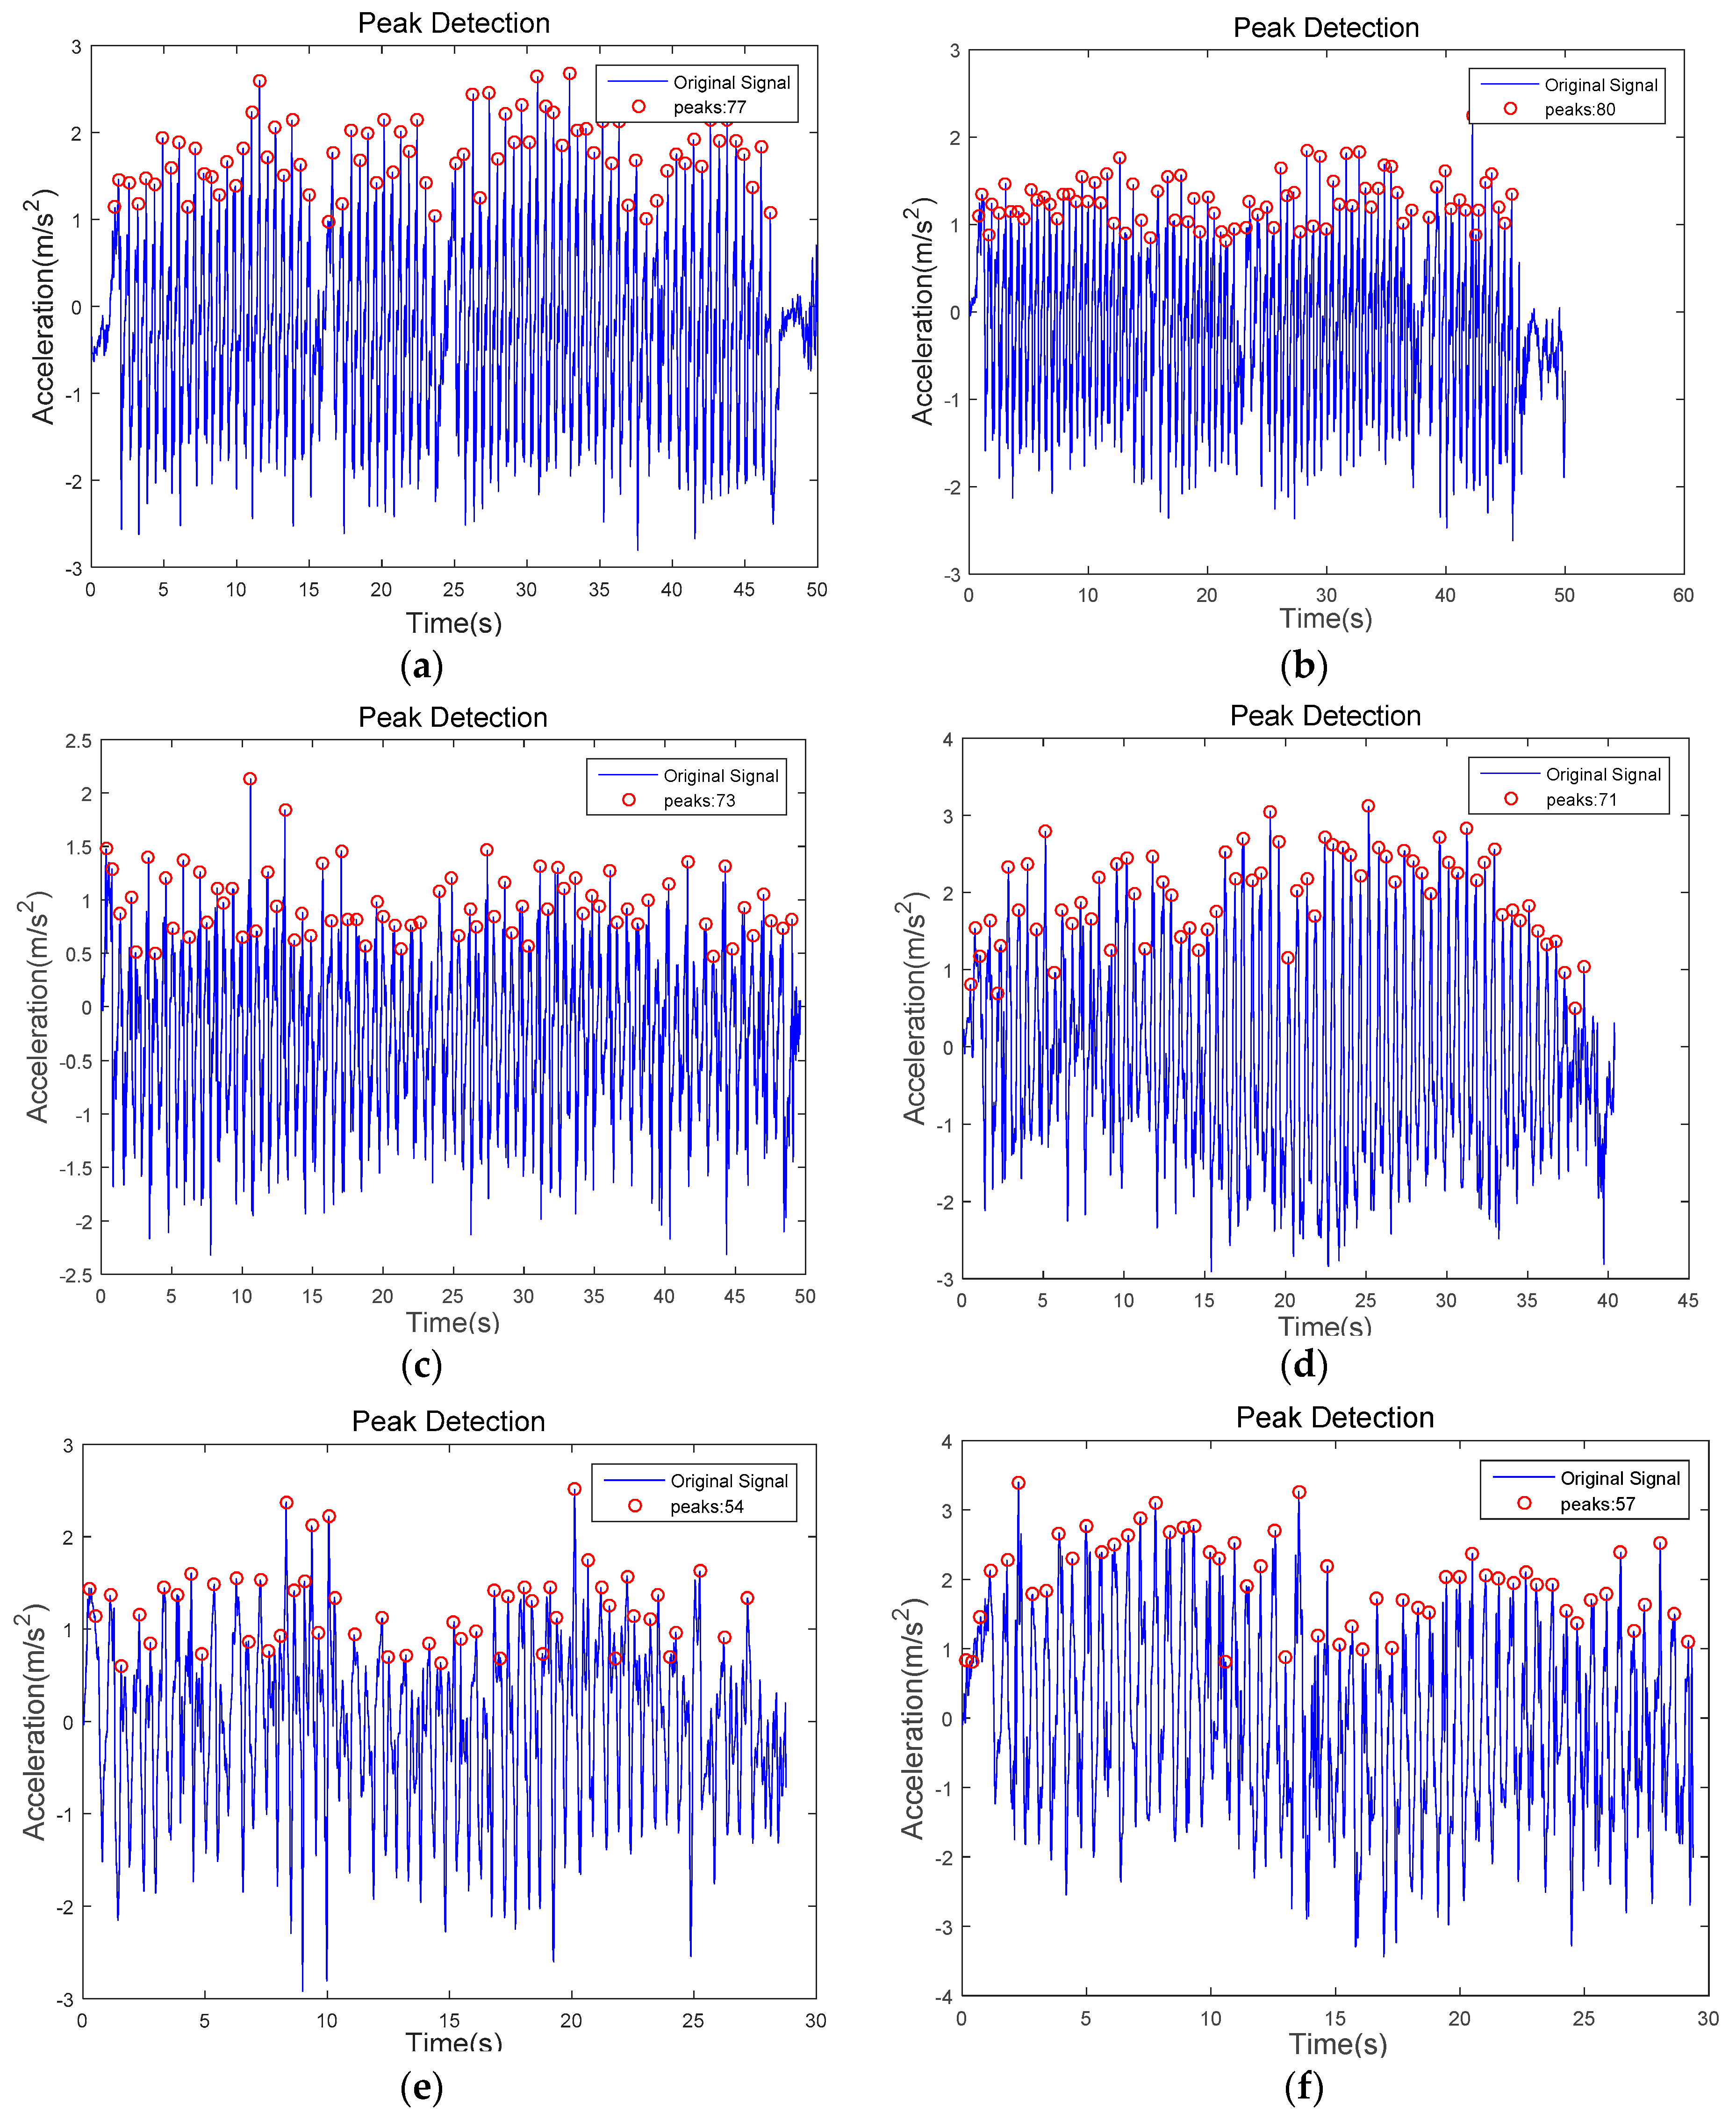
Figure 8 shows the result of the peak detection algorithm in PDR. In scenario one, the result reveals 107 steps, whereas 110 true steps were taken. In scenario two, the result shows 126 steps, while 127 true steps were taken. It can be seen that the different motions, such as taking a pause, turning left, or going upstairs, have no negative impact on the detection result. In summary, the peak detection algorithm achieves an average accuracy of 97.86%. It can be seen that all of the algorithms have a median error rate of less than 3%, and are more inclined to undercount than overcount. We attribute this to the fact that the algorithms are unlikely to find multiple cycles where only one exists, but may only find one cycle when multiple cycles exist. This is particularly likely to happen at the start and end of a walk, where the steps typically have different properties (lower energy, longer duration, etc.).
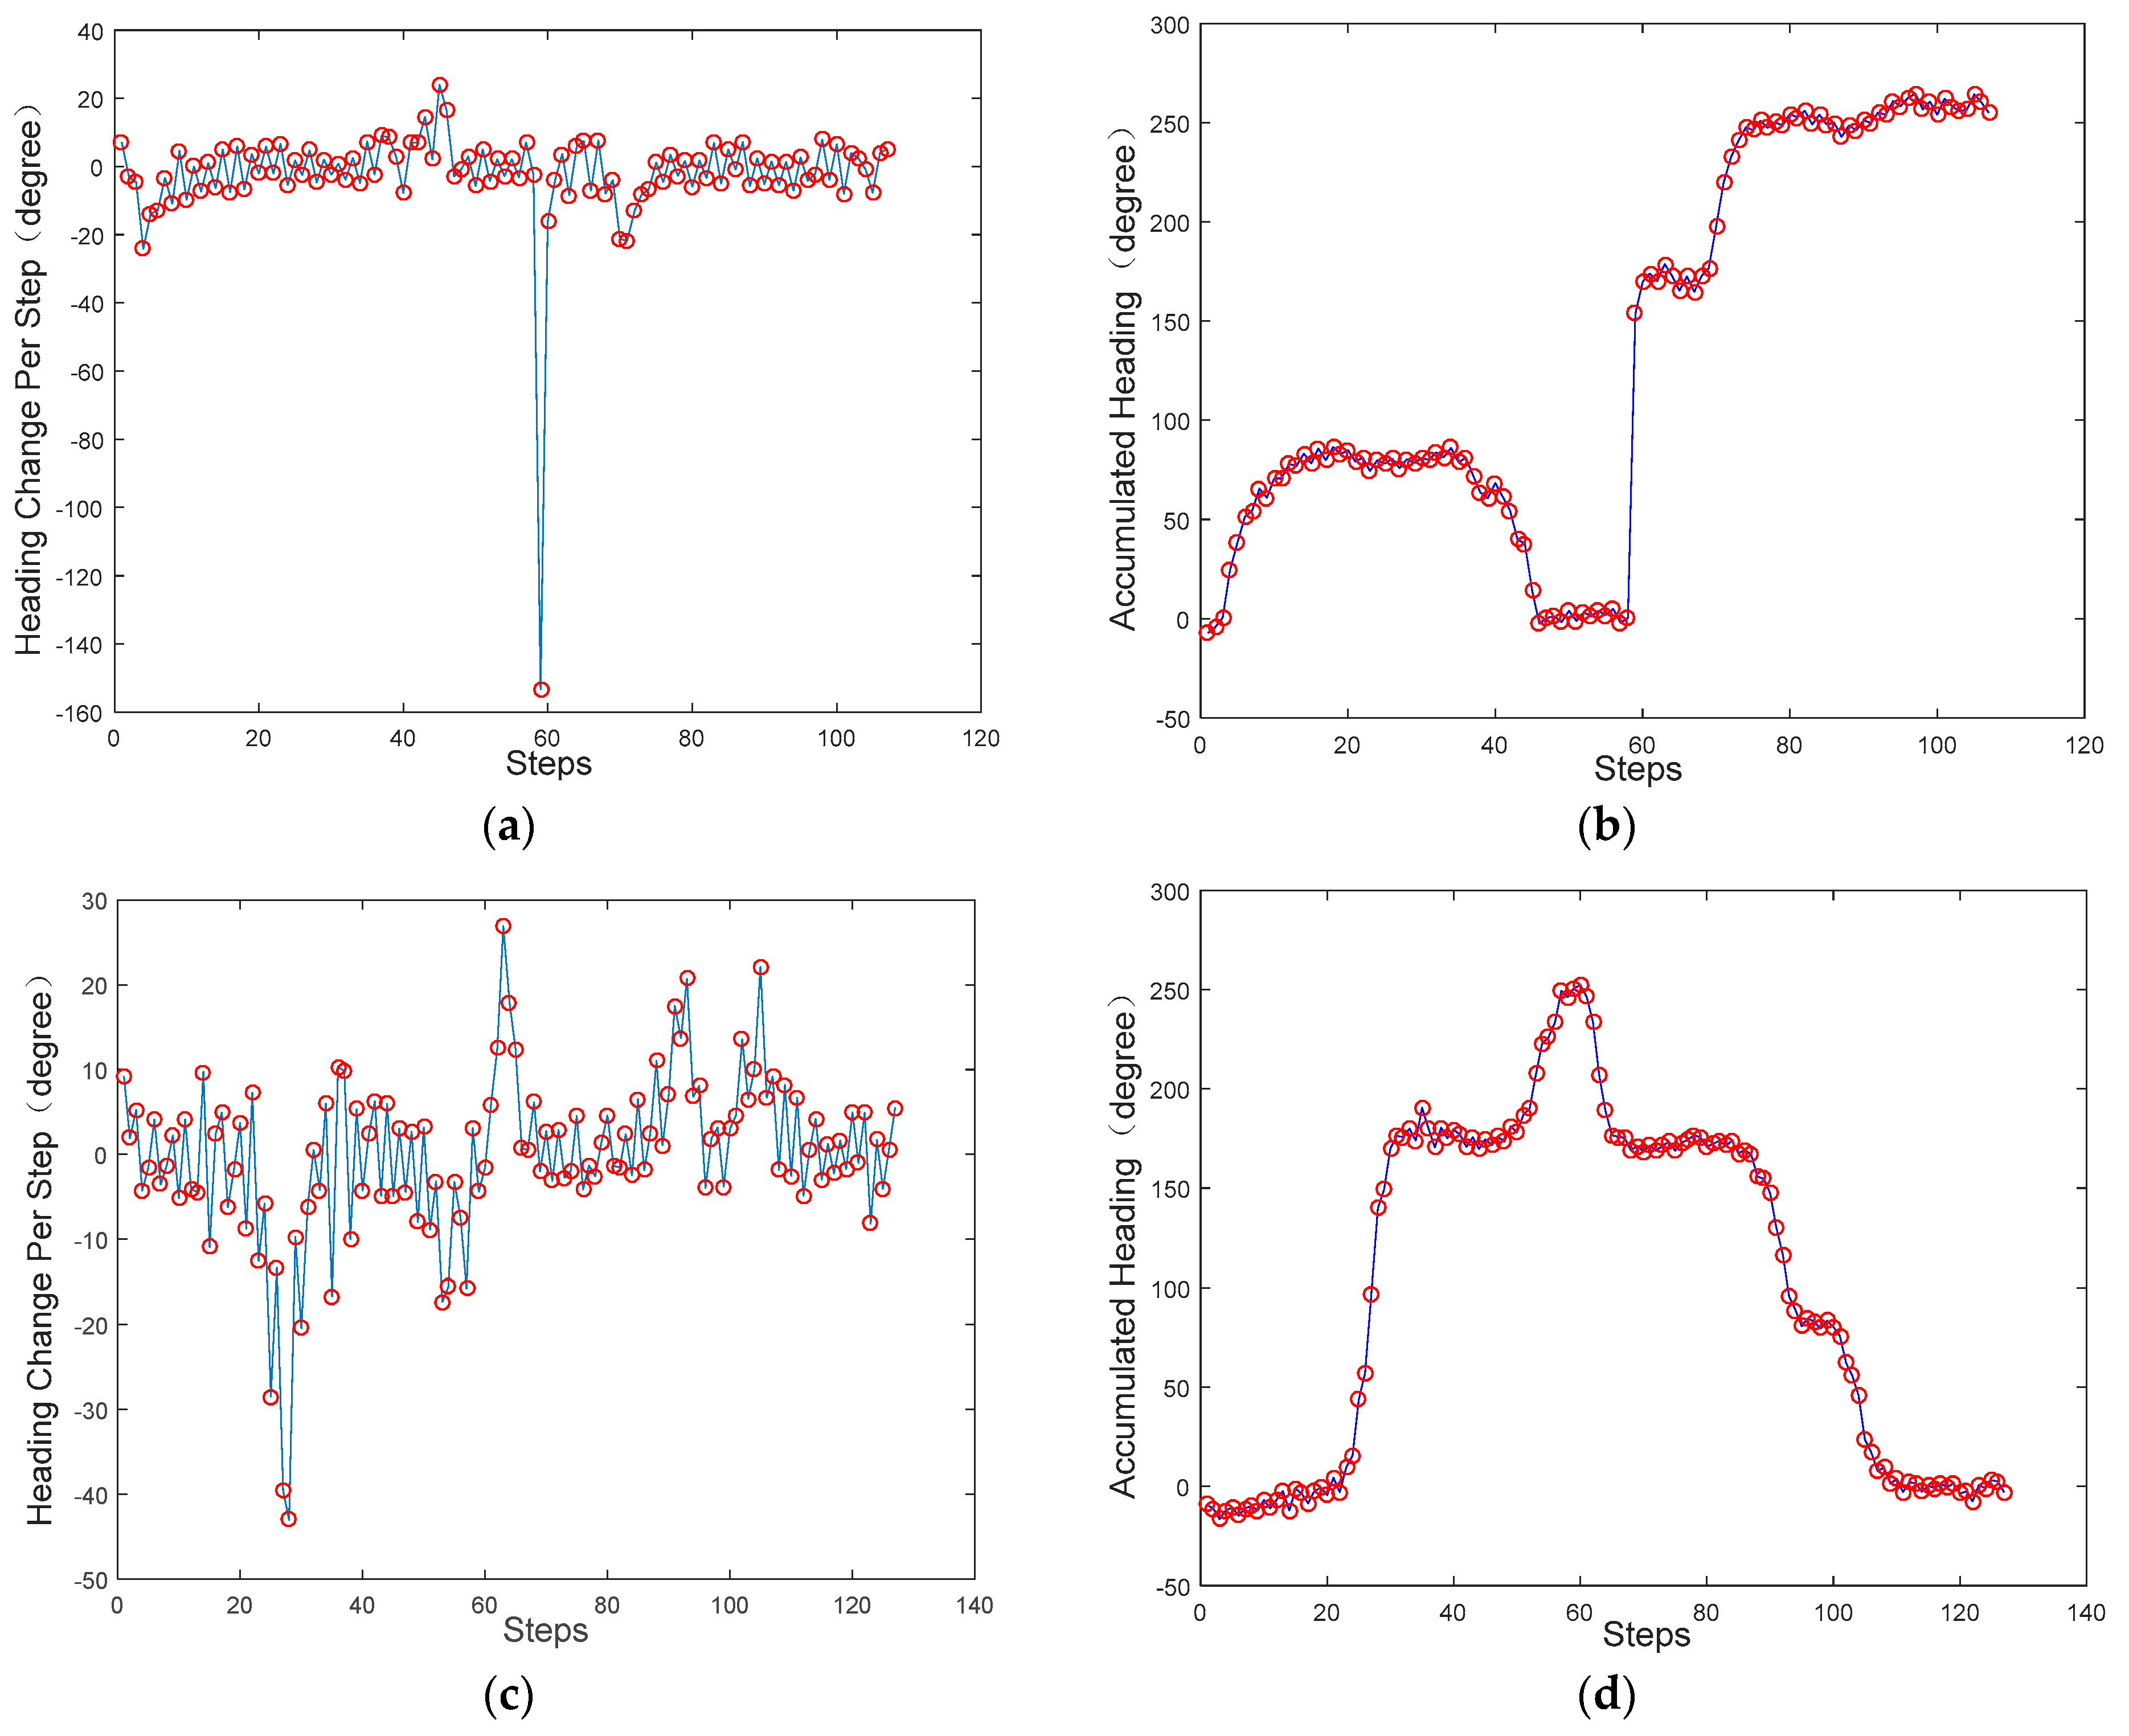
Figure 9 demonstrates the heading estimation result of PDR. Figure 9a,b are the orientation change during one step and the overall heading estimation of scenario one, respectively. Figure 9c,d are the corresponding results of scenario two. North is defined as the reference direction (0°), and the angle increases gradually clockwise. As a result, it can be inferred from the figure that A starts their route facing west, takes a slight turn to the north, walks for a while towards the north, then turns slightly back to the west, walks for a second before a sharp U-turn to the east, and then keeps this direction until the end. Similarly, B starts their route facing south, and after a second of straight walking, they then make a U-turn to the north for a while, which is followed by three consecutive turns to the east, to the south, and finally to the west. The turns can be easily detected during the process. It can be seen that although random noise exists in the estimated orientation change during one step, the accumulated heading can achieve an acceptable estimation result.
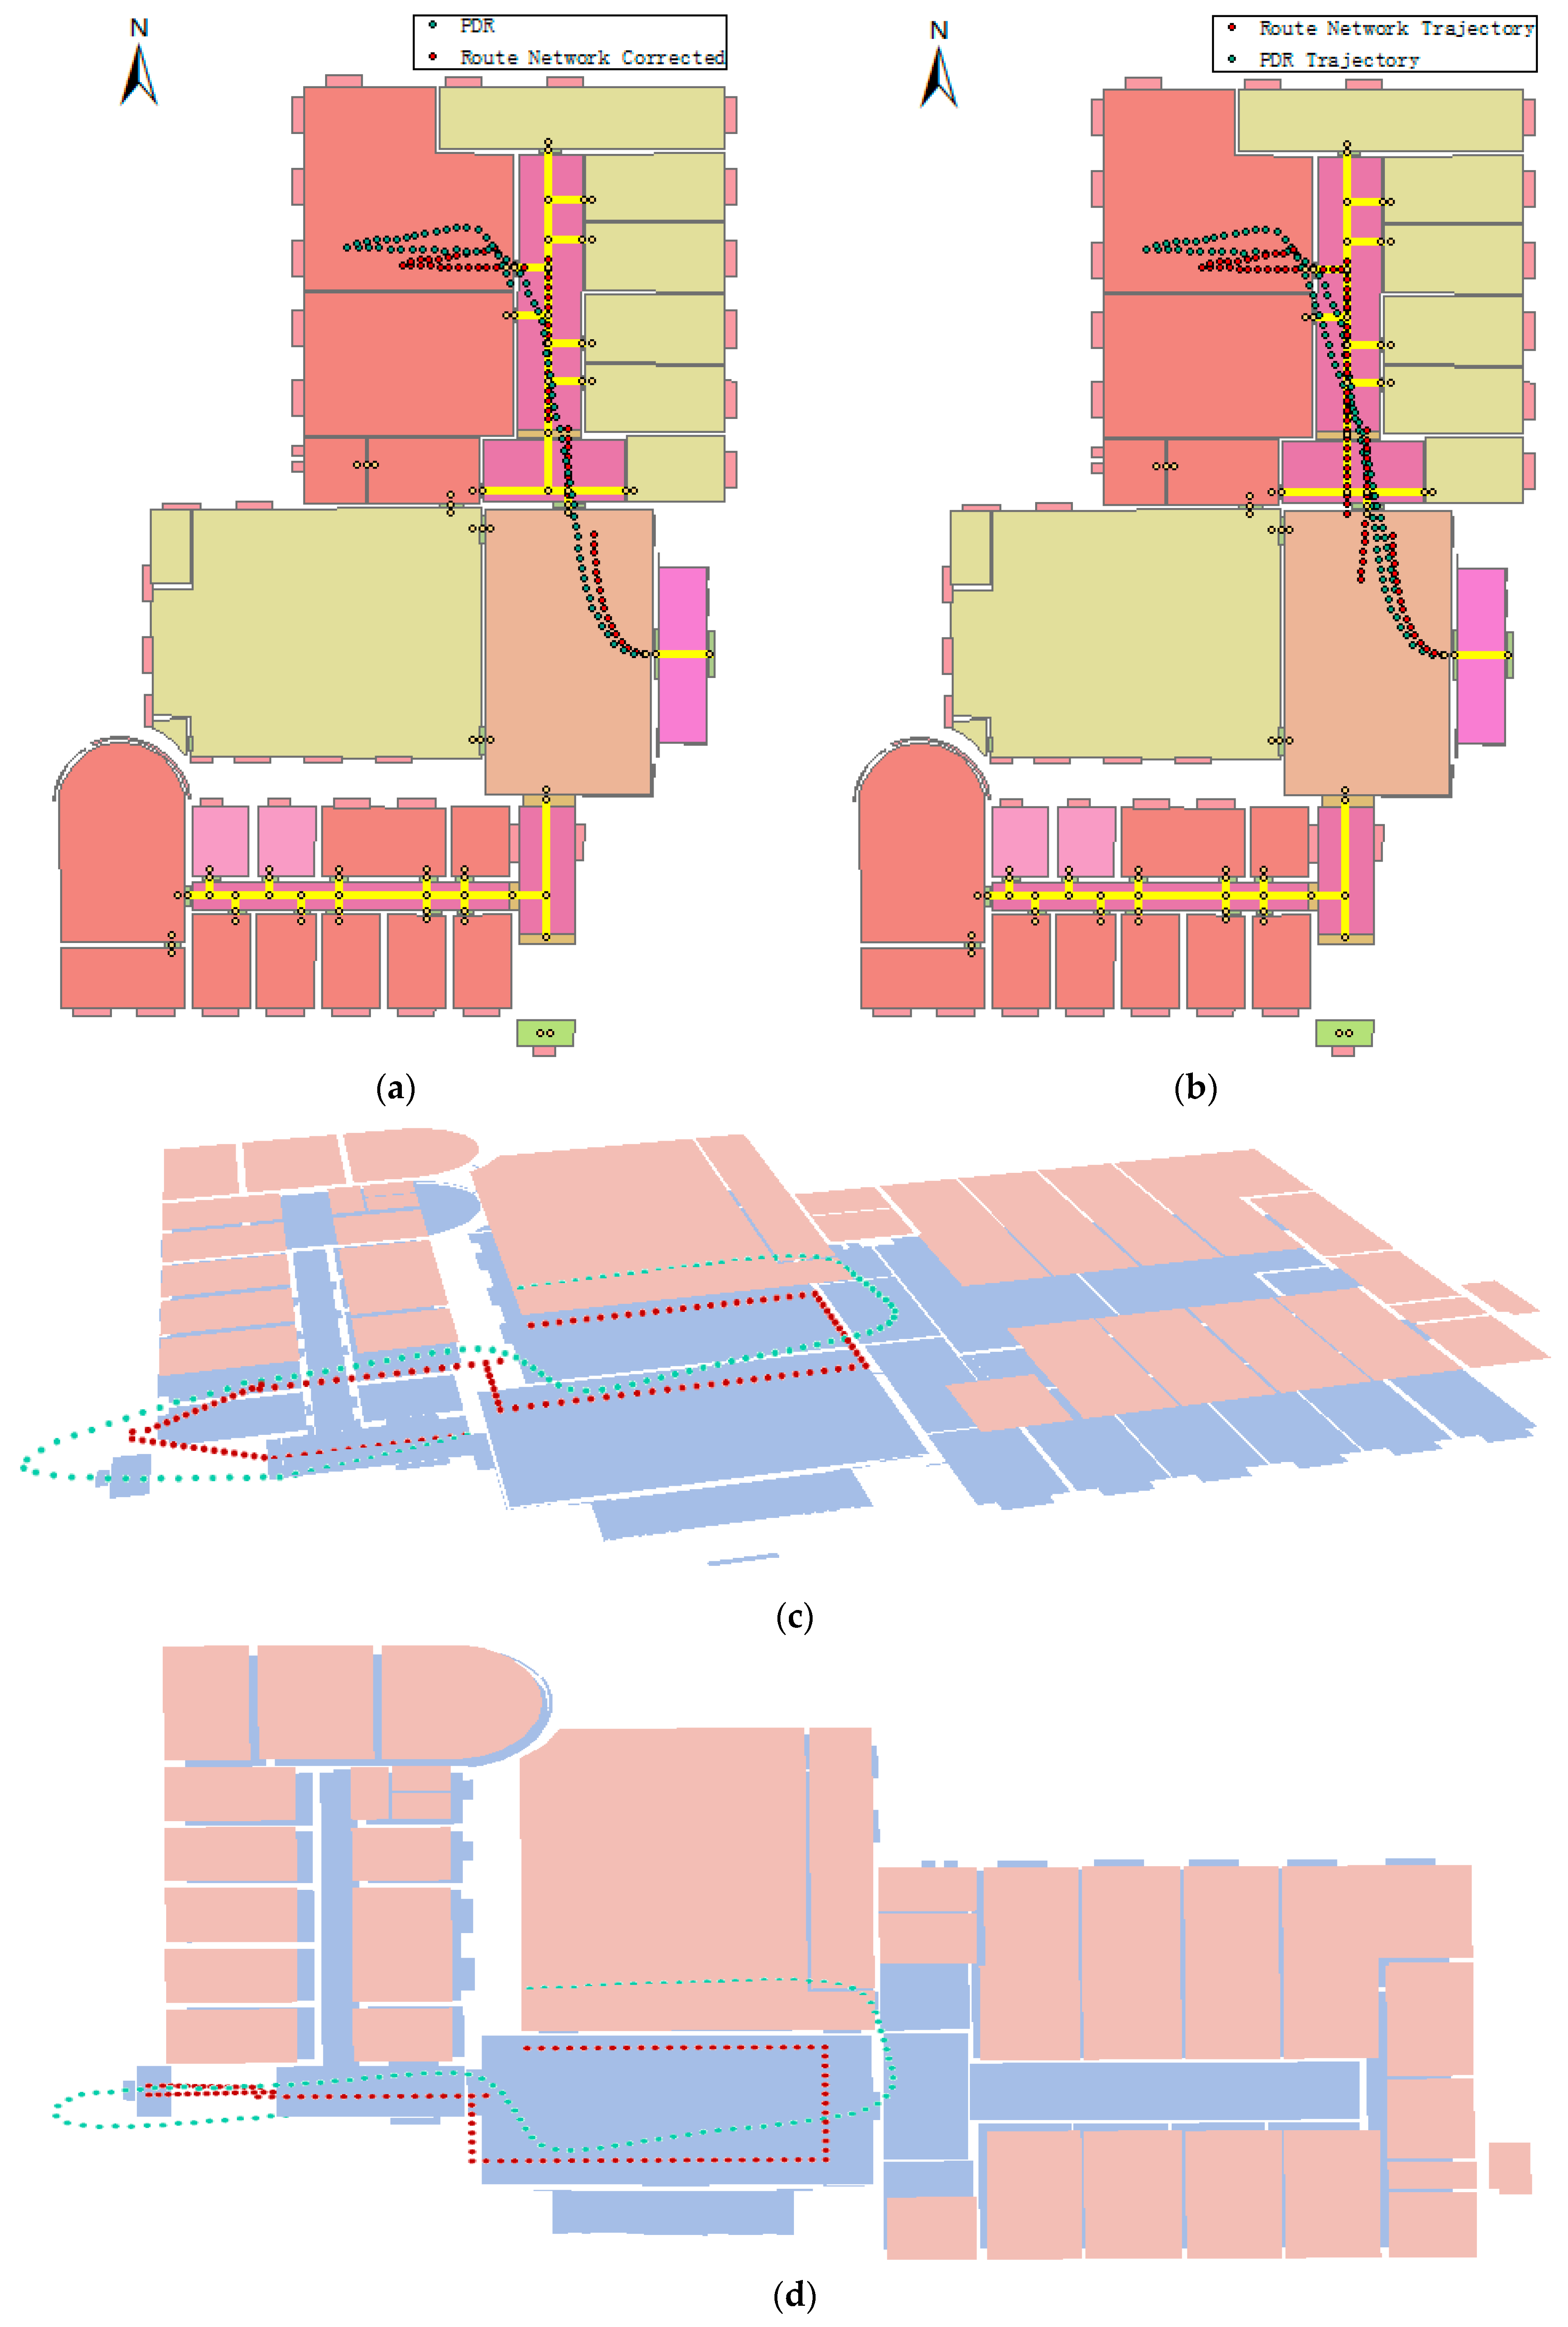
Figure 10 shows the trajectories of the PDR and the semantically-augmented route network corrected path. In the first experiment, the mean localization errors of the PDR and route network graph-based MM were 1.76 m and 1.12 m, respectively. The adoption of the semantically-augmented route network therefore increased the accuracy by 36.4%. The PDR can provide a relatively accurate initial result (Figure 10a), but encounters orientation bias when coming out of the office after several minutes (Figure 10b). The semantically-augmented route network graph-based MM constrains the route to the predefined edge on the graph, and thus corrects the orientation bias. The output route is not continuous due to the map being predefined as discontinuous. This could be improved by either fixing the semantic augmented route network nodes or interpolating in the route to obtain a continuous route. In the second experiment, the mean localization errors of the PDR and route network-based MM are 2.68 m and 1.34 m, respectively. The accuracy is therefore increased by 50% when considering the map information. Figure 10c,d are the side-look and overlook graphs of route two. It can be seen that the single PDR algorithm has a step length problem when going upstairs, and the accumulated heading error leads the user trajectory to wall-crossing paths and wrong rooms, while the semantic augmented route network corrected method conforms well to the indoor graph and can achieve an average enhanced tracking accuracy of 1.23 m. The results show that our approach can accurately track the pedestrian trajectory in terms of a complicated combination of indoor user movement.
4.3. Applicability for Diverse Users
In this experiment, we evaluate that the proposed approach can achieve satisfactory localization result even to diverse users with different heights and step lengths. Six volunteers, including two female and four male, were involved in our experiment. Their detailed information can be seen in Table 3. The volunteers were asked to hold the smartphone and walk along a predefined rectangular route in the lobby of the third floor of the LIESMARS building, whose total length is 40.85 m. The true steps and smartphone sensor data of their walk were recorded at the same time. We first estimated their PDR trajectory, and then applied the proposed calibration algorithm to demonstrate its validation to diverse users and improve the localization accuracy with pedestrian invariant property.
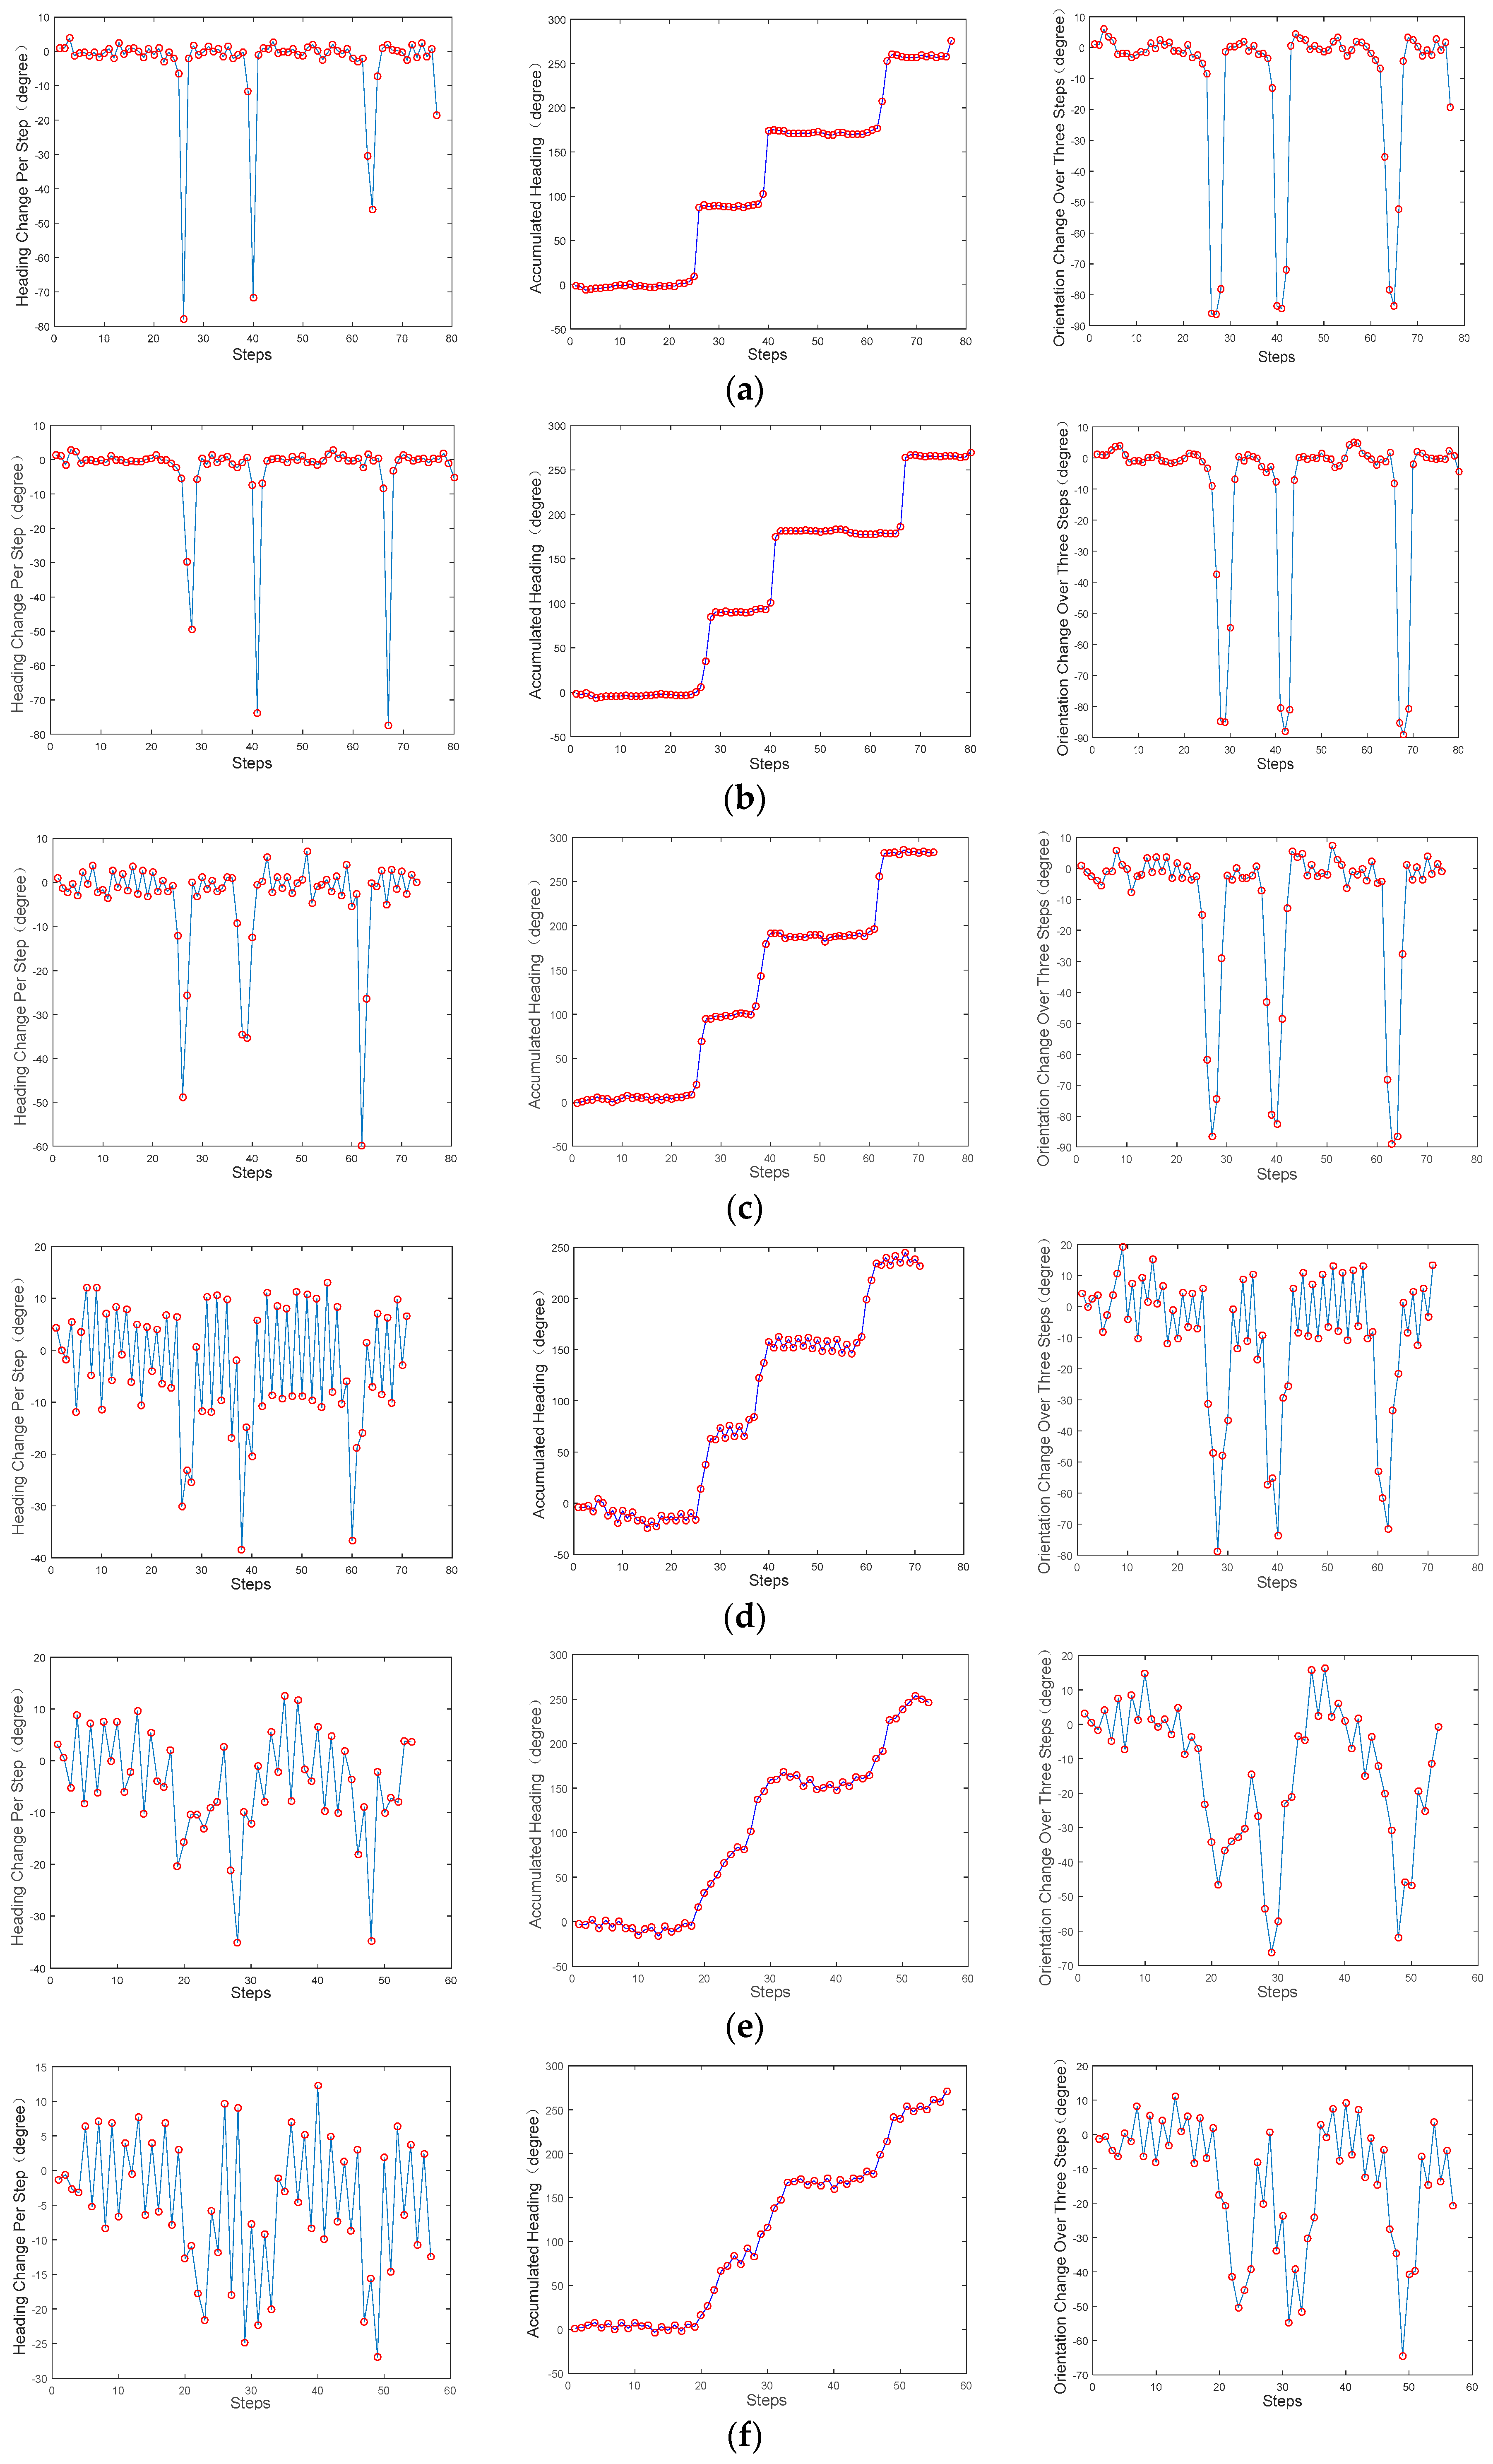
The PDR results of six volunteers are demonstrated in Figure 11 and Figure 12. Specifically, Figure 11 shows the number of steps detected for each volunteer. Their true steps were 77, 80, 74, 70, 54, and 57, respectively. Consequently, the average accuracy for step detection was 99.54%. Figure 12 demonstrates the heading estimation result of six volunteers. Three kinds of headings were recorded in the experiments. The first is the estimated heading changes during one step, the second is the estimated heading relative to the start orientation, and the last is the local heading change accumulation in three steps. The direct way for turn detection is to either employ the first or the second heading. However, the threshold for both headings are difficult to quantify, as the first is susceptible to different participants and the second can rarely observe a step when a turn is taken within several steps. For that reason, we chose the local heading accumulation in three steps for turn detection, since a turn is usually taken within three steps. A turn is detected if it exceeds the threshold (40° in our case) and the last three headings are not a turn. It can be observed in Figure 12 that three turns can be clearly detected for each volunteer.
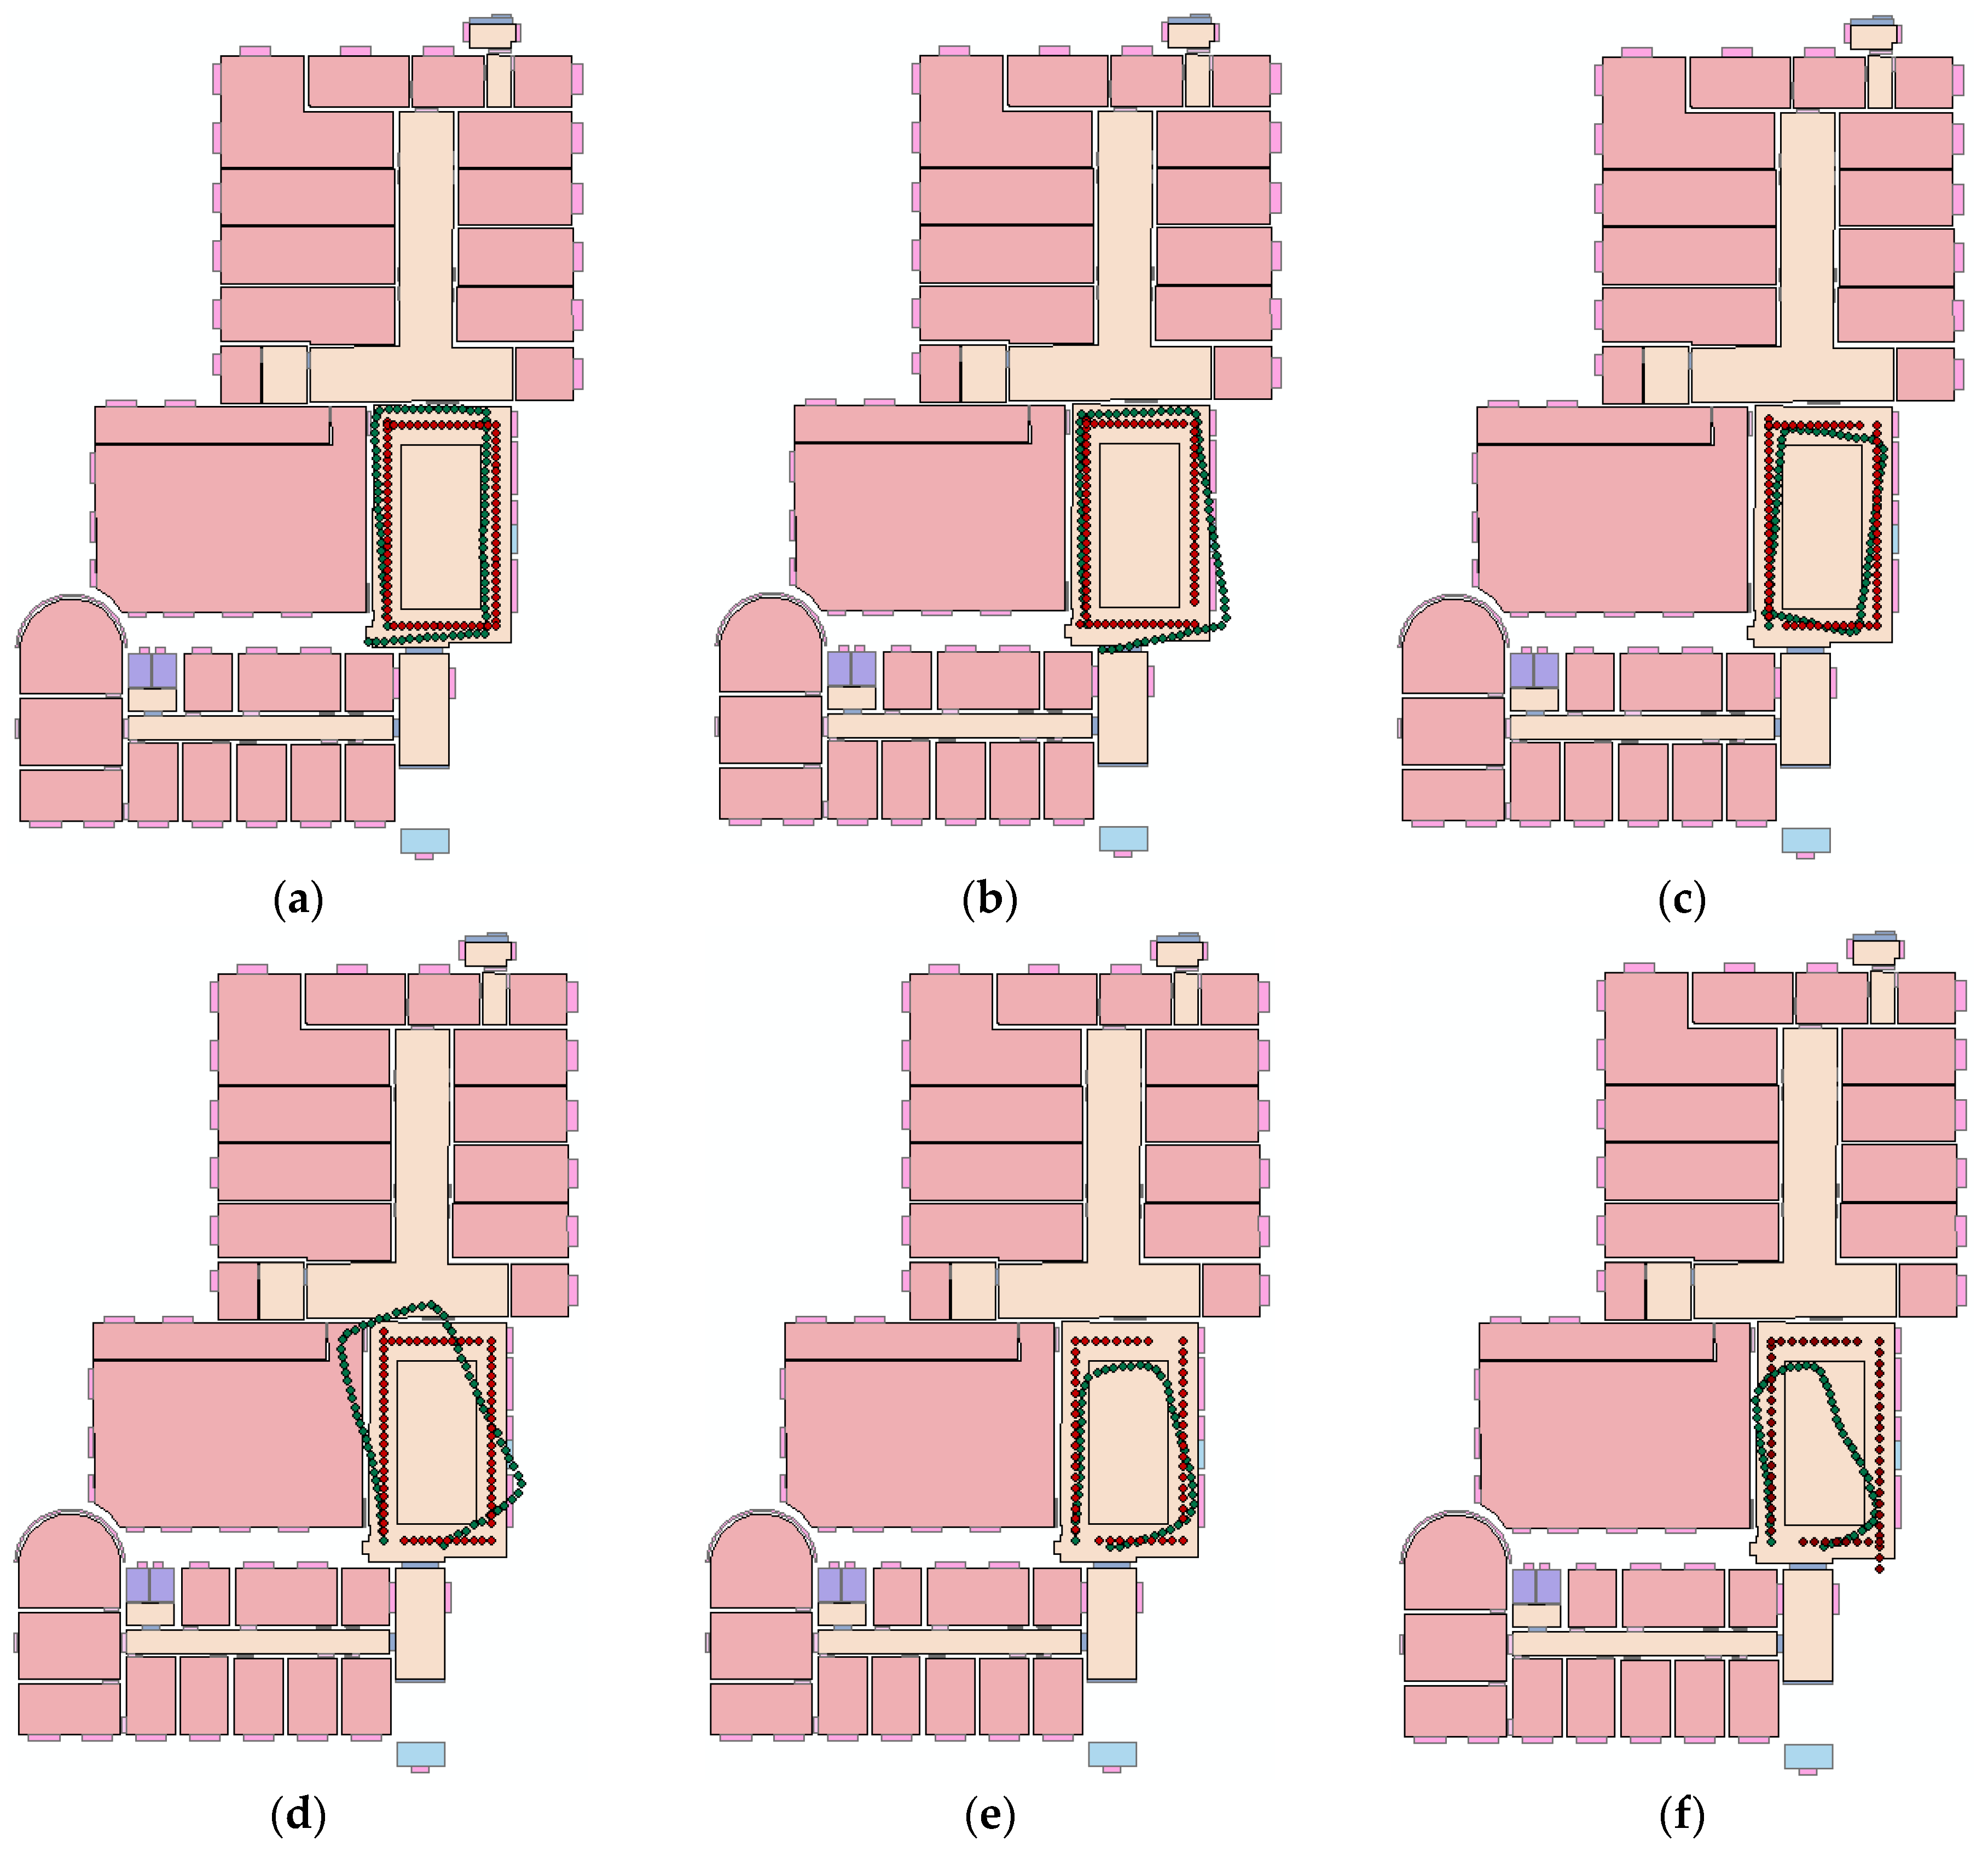
After obtaining the PDR estimation of each trajectory, the proposed semantic augmented route network graph-based localization algorithm was applied simultaneously to calibrate the trajectory. The corresponding results are demonstrated in Figure 13. The green line is the original PDR estimation, and the red line is the calibrated result. It can be obviously observed that the route estimated by the proposed method approaches the truth of the rectangular route around the lobby and adaptively updates location when encountering corners, without orientation bias and accumulation error. As a consequence, it can be concluded that the proposed work has the property of being scalable to different people with different walking information, and can improve the localization accuracy by introducing semantic constraints.
4.4. Computation Performance
This experiment was undertaken to verify the efficiency of the proposed method by evaluating the average time required to complete a single update step for a single particle in the semantic augmented route network graph based filter. In the proposed method, the semantic augmented route network graph replaces the continuous indoor space with 237 feature points, reducing the state space of the particle filter from two dimensions to one dimension and thus accelerating the time required for the conversion of the particles. Compared with the traditional methods that demand almost 100 particles to obtain an acceptable result [17], the proposed method can achieve a comparable result with only 20 particles, which indicates that the continuous filter case needs to apply the resampling five times more than our solution, resulting in additional time consumption. The time required for a single particle to complement a single update at a different indoor place on the ThinkPad X240 personal computer (Lenovo Group Ltd., Beijing, China) is demonstrated in Table 4. The places to be evaluated are the corridors, the stairs, the rooms, and the related user motions as defined in Section 3.3. This is a normalized average obtained by running the filtering for the same route 10 times offline. The result reveals that the time consumption for all the places is less than 1 ms, and the method fulfills the requirement of low computational complexity.
5. Conclusions and Future Work
In this work, we have proposed a semantically-augmented route network-based pedestrian indoor localization approach using smartphones. Differing from the previous localization algorithms, the proposed method exploits the topological and semantic information of the indoor environment, as well as the compatibility of human motion and indoor structure to assist with and calibrate the pedestrian trajectory. The context-enhanced particle filter which integrates the route network graph and the PDR output is performed at a step frequency to sample the most appropriate indoor locations and orientations. The effectiveness and efficiency of the method were confirmed in two sets of experiments involving typical user movements in an indoor space of different users. The experimental results showed that an impressive improvement in localization accuracy is achieved when incorporating the semantic augmented route network graph. In conclusion, the proposed approach can achieve high-accuracy localization of about 1 m while maintaining low computational complexity, with only mobile phone inertial sensors and map information.
In our future work, we will exploit the specific patterns of smartphone sensors (e.g., accelerometer) in dedicated locations and user activity to identify landmarks for the initial location determination of PDR; for example, use of the accelerometer to distinguish user activities such as sitting, walking, or going upstairs, and to extend the limitation of holding the smartphone in hand to flexible placement. Since the proposed method is easily extensible with other methods, this information could be incorporated to achieve an even higher accuracy. Additionally, Wi-Fi signal could also be combined with the proposed method to provide an absolute location correction source for the tracking.
Acknowledgments
The authors would like to thank the editors and anonymous reviewers for their careful reading and helpful suggestions. This research is supported by LIESMARS Special Research Funding, the Double First-Class Talent Project of Wuhan University (413100012) and the Independent Research Project (413000030).
Author Contributions
Yan Zhou conceived and designed the study, performed the experiments, and wrote the paper; Xianwei Zheng, Hanjiang Xiong and Ruizhi Chen supervised the work and revised the paper.
Conflicts of Interest
The authors declare no conflict of interest.
References
- Kothari, N.; Kannan, B.; Dias, M.B. Robust indoor localization on a commercial smart phone. Proced. Comput. Sci. 2012, 10, 1114–1120. [Google Scholar] [CrossRef]
- Jia, R.; Jin, M.; Zou, H.; Yesilata, Y.; Xie, L.; Spanos, C. MapSentinel: Can the knowledge of Space use improve indoor tracking further? Sensors 2016, 16, 472. [Google Scholar] [CrossRef] [PubMed]
- Kumar, S.; Gil, S.; Katabi, D.; Rus, D. Accurate indoor localization with zero start-up cost. In Proceedings of the 20th Annual International Conference on Mobile Computing and Networking, Maui, HI, USA, 7–11 September 2014; pp. 483–494. [Google Scholar]
- Zhang, Y.; Yang, J.; Li, Y.; Qi, L.; Naser, E.S. Smartphone-based indoor localization with bluetooth low energy beacons. Sensors 2016, 16, 596. [Google Scholar] [CrossRef] [PubMed]
- Benjamin, K.; Pat, P.; Prabal, D. SurePoint: Exploiting ultra wideband flooding and diversity to provide robust, scalable, high-fidelity indoor localization. In Proceedings of the 14th ACM Conference on Embedded Network Sensor Systems CD-ROM, Stanford, CA, USA, 14–16 November 2016; pp. 137–149. [Google Scholar]
- Monica, S.; Ferrari, G. A swarm-based approach to real-time 3D indoor localization: Experimental performance analysis. Appl. Soft Comput. 2016, 43, 489–497. [Google Scholar] [CrossRef]
- Pasku, V.; Angelis, D.A.; Dionigi, M.; Angelis, D.G.; Moschitta, A.; Carbone, P. A positioning system based on low-frequency magnetic fields. IEEE Trans. Ind. Electron. 2016, 63, 2457–2468. [Google Scholar] [CrossRef]
- Wang, J.; Hu, A.D.; Liu, C.; Li, X. A floor-map-aided WIFI/pseudo-odometry integration algorithm for an indoor positioning system. Sensors 2015, 15, 7096–7124. [Google Scholar] [CrossRef] [PubMed]
- Park, J.G.; Teller, S. Motion Compatibility for Indoor Localization. Available online: http://hdl.handle.net/1721.1/89075 (accessed on 26 August 2014).
- Chen, Z.; Zou, H.; Jiang, H.; Zhu, Q.; Soh, Y.C.; Xie, L. Fusion of WiFi, smartphone sensors and landmarks using the kalman filter for indoor localization. Sensors 2015, 15, 715–732. [Google Scholar] [CrossRef] [PubMed]
- Pinto, A.M.; Moreira, A.P.; Costa, P.G. A localization method based on map-matching and particle swarm optimization. J. Intell. Robot. Syst. 2015, 77, 313–326. [Google Scholar] [CrossRef]
- Shang, J.; Gu, F.; Hu, X.; Kealy, A. APFiLoc: An infrastructure-free indoor localization method fusing smartphone inertial sensors, landmarkds and map information. Sensors 2015, 15, 27251–27272. [Google Scholar] [CrossRef] [PubMed]
- Wang, H.; Sen, S.; Elgohary, A.; Farid, M.; Youssef, M.; Choudhury, R.R. No need to war-drive: Unsupervised indoor localization. In Proceedings of the 10th International Conference on Mobile Systems, Applications, and Services, Low Wood Bay, Windermere, UK, 25–29 June 2012. [Google Scholar]
- Bao, H.; Wong, W.C. A novel map-based dead-reckoning algorithm for indoor localization. J. Sens. Actuator Netw. 2014, 3, 44–63. [Google Scholar] [CrossRef]
- Jensen, C.S.; Lu, H.; Yang, B. Graph model based indoor tracking. In Proceedings of the 10th International Conference on Mobile Data Management: Systems, Services and Middleware, Taipei, Taiwan, 18–20 May 2009; pp. 122–131. [Google Scholar]
- Zhou, B.; Li, Q.; Mao, Q.; Tu, W.; Zhang, X. Activity sequence-based indoor pedestrian localization using smartphones. IEEE Trans. Hum.-Mach. Syst. 2015, 45, 562–574. [Google Scholar] [CrossRef]
- Hilsenbeck, S.; Bobkov, D.; Schroth, G.; Huitl, R.; Steinbach, E. Graph-based data fusion of pedometer and WiFi measurements for mobile indoor positioning. In Proceedings of the 2014 ACM International Joint Conference on Pervasive and Ubiquitous Computing, Seattle, WA, USA, 13–17 September 2014. [Google Scholar]
- Goodchild, M.F. Space, place and health. Ann. GIS 2014, 21, 97–100. [Google Scholar] [CrossRef]
- Lymberopoulos, D.; Liu, J.; Yang, X.; Choudhury, R.R.; Handziski, V.; Sen, S. A realistic evaluation and comparison of indoor location technologies: Experiences and lessons learned. In Proceedings of the 14th International Conference on Information Processing in Sensor Networks, Seattle, WA, USA, 14–16 April 2015. [Google Scholar]
- Harle, R. A survey of indoor inertial positioning systems for pedestrians. IEEE Commun. Surv. Tutor. 2013, 15, 1281–1293. [Google Scholar] [CrossRef]
- Bird, J.; Arden, D. Indoor navigation with foot-mounted strapdown inertial navigation and magnetic sensors. IEEE Wirel. Commun. 2011, 18, 28–35. [Google Scholar] [CrossRef]
- Aggarwal, P.; Thomas, D.; Ojeda, L.; Borenstein, J. Map matching and heuristic elimination of gyro drift for personal navigation systems in GPS-denied conditions. Meas. Sci.Technol. 2011, 22, 025205. [Google Scholar] [CrossRef]
- Xu, Z.; Wei, J.; Zhang, B.; Yang, W. A robust method to detect zero velocity for improved 3D personal navigation using inertial sensors. Sensors 2015, 15, 7708–7727. [Google Scholar] [CrossRef] [PubMed]
- Lan, K.C.; Shih, W.Y. On calibrating the sensor errors of a PDR-based indoor localization system. Sensors 2013, 13, 4781–4810. [Google Scholar] [CrossRef] [PubMed]
- Zhang, H.; Yan, W.; Shen, Q.; Chang, H. A handheld inertial pedestrian navigation system with accurate step modes and device poses recognition. IEEE Sens. J. 2015, 15, 1421–1429. [Google Scholar] [CrossRef]
- Li, F.; Zhao, C.; Ding, G.; Gong, J.; Liu, C.; Zhao, F. A reliable and accurate indoor localization method using phone inertial sensors. In Proceedings of the 2012 ACM Conference on Ubiquitous Computing, Pittsburgh, PA, USA, 5–8 September 2012. [Google Scholar]
- Lee, H.H.; Choi, S.; Lee, M.J. Step detection robust against the dynamics of smartphones. Sensors 2015, 15, 27230–27250. [Google Scholar] [CrossRef] [PubMed]
- Diaz, E.M.; Gonzalez, A.L.M. Step detector and step length estimator for an inertial pocket navigation system. In Proceedings of the Indoor Positioning and Indoor Navigation (IPIN), Busan, Korea, 27–30 October 2014. [Google Scholar]
- Xiao, Z.; Wen, H.; Markham, A.; Trigoni, N. Robust pedestrian dead reckoning (R-PDR) for arbitrary mobile device placement. In Proceedings of the Indoor Positioning and Indoor Navigation (IPIN), Busan, Korea, 27–30 October 2014. [Google Scholar]
- Lee, D.L.; Chen, Q. A model-based wifi localization method. In Proceedings of the 2nd International Conference on Scalable Information Systems, Suzhou, China, 6−8 June 2007. [Google Scholar]
- Jin, Y.; Soh, W.; Motani, M.; Wong, W. A robust indoor pedestrian tracking system with sparse infrastructure support. IEEE Trans. Mob. Comput. 2013, 12, 1392–1403. [Google Scholar] [CrossRef]
- Khan, M.I.; Syrjarinne, J. Investigating effective methods for integration of building’s map with low cost inertial sensors and wifi-based positioning. In Proceedings of the Indoor Positioning and Indoor Navigation, Montbeliard, France, 28–31 October 2013; pp. 1–8. [Google Scholar]
- Bojja, J.; Jaakkola, M.K.; Collin, J.; Takala, J. Indoor localization methods using dead reckoning and 3D map matching. J. Signal Process. Syst. 2014, 76, 301–312. [Google Scholar] [CrossRef]
- Xiao, Z.; Wen, H.; Markham, A.; Trigoni, N. Lightweight map matching for indoor localisation using conditional random fields. In Proceedings of the 13th International Symposium on Information Processing in Sensor Networks, Berlin, Germany, 13–16 April 2014. [Google Scholar]
- Becker, C.; Dürr, F. On location models for ubiquitous computing. Pers. Ubiquitous Comput. 2005, 9, 20–31. [Google Scholar] [CrossRef]
- Waqar, W.; Chen, Y.; Vardy, A. Smartphone positioning in sparse Wi-Fi environments. Comput. Commun. 2016, 73, 108–117. [Google Scholar] [CrossRef]
- Johansen, A.M. SMCTC: Sequencial monte carlo in C++. J. Stat. Softw. 2009, 30, 1–41. [Google Scholar] [CrossRef]
Figure 1.
Overview of the framework of the semantic augmented route network-based indoor localization method proposed in this paper. PDR: pedestrian dead reckoning.
Figure 1.
Overview of the framework of the semantic augmented route network-based indoor localization method proposed in this paper. PDR: pedestrian dead reckoning.
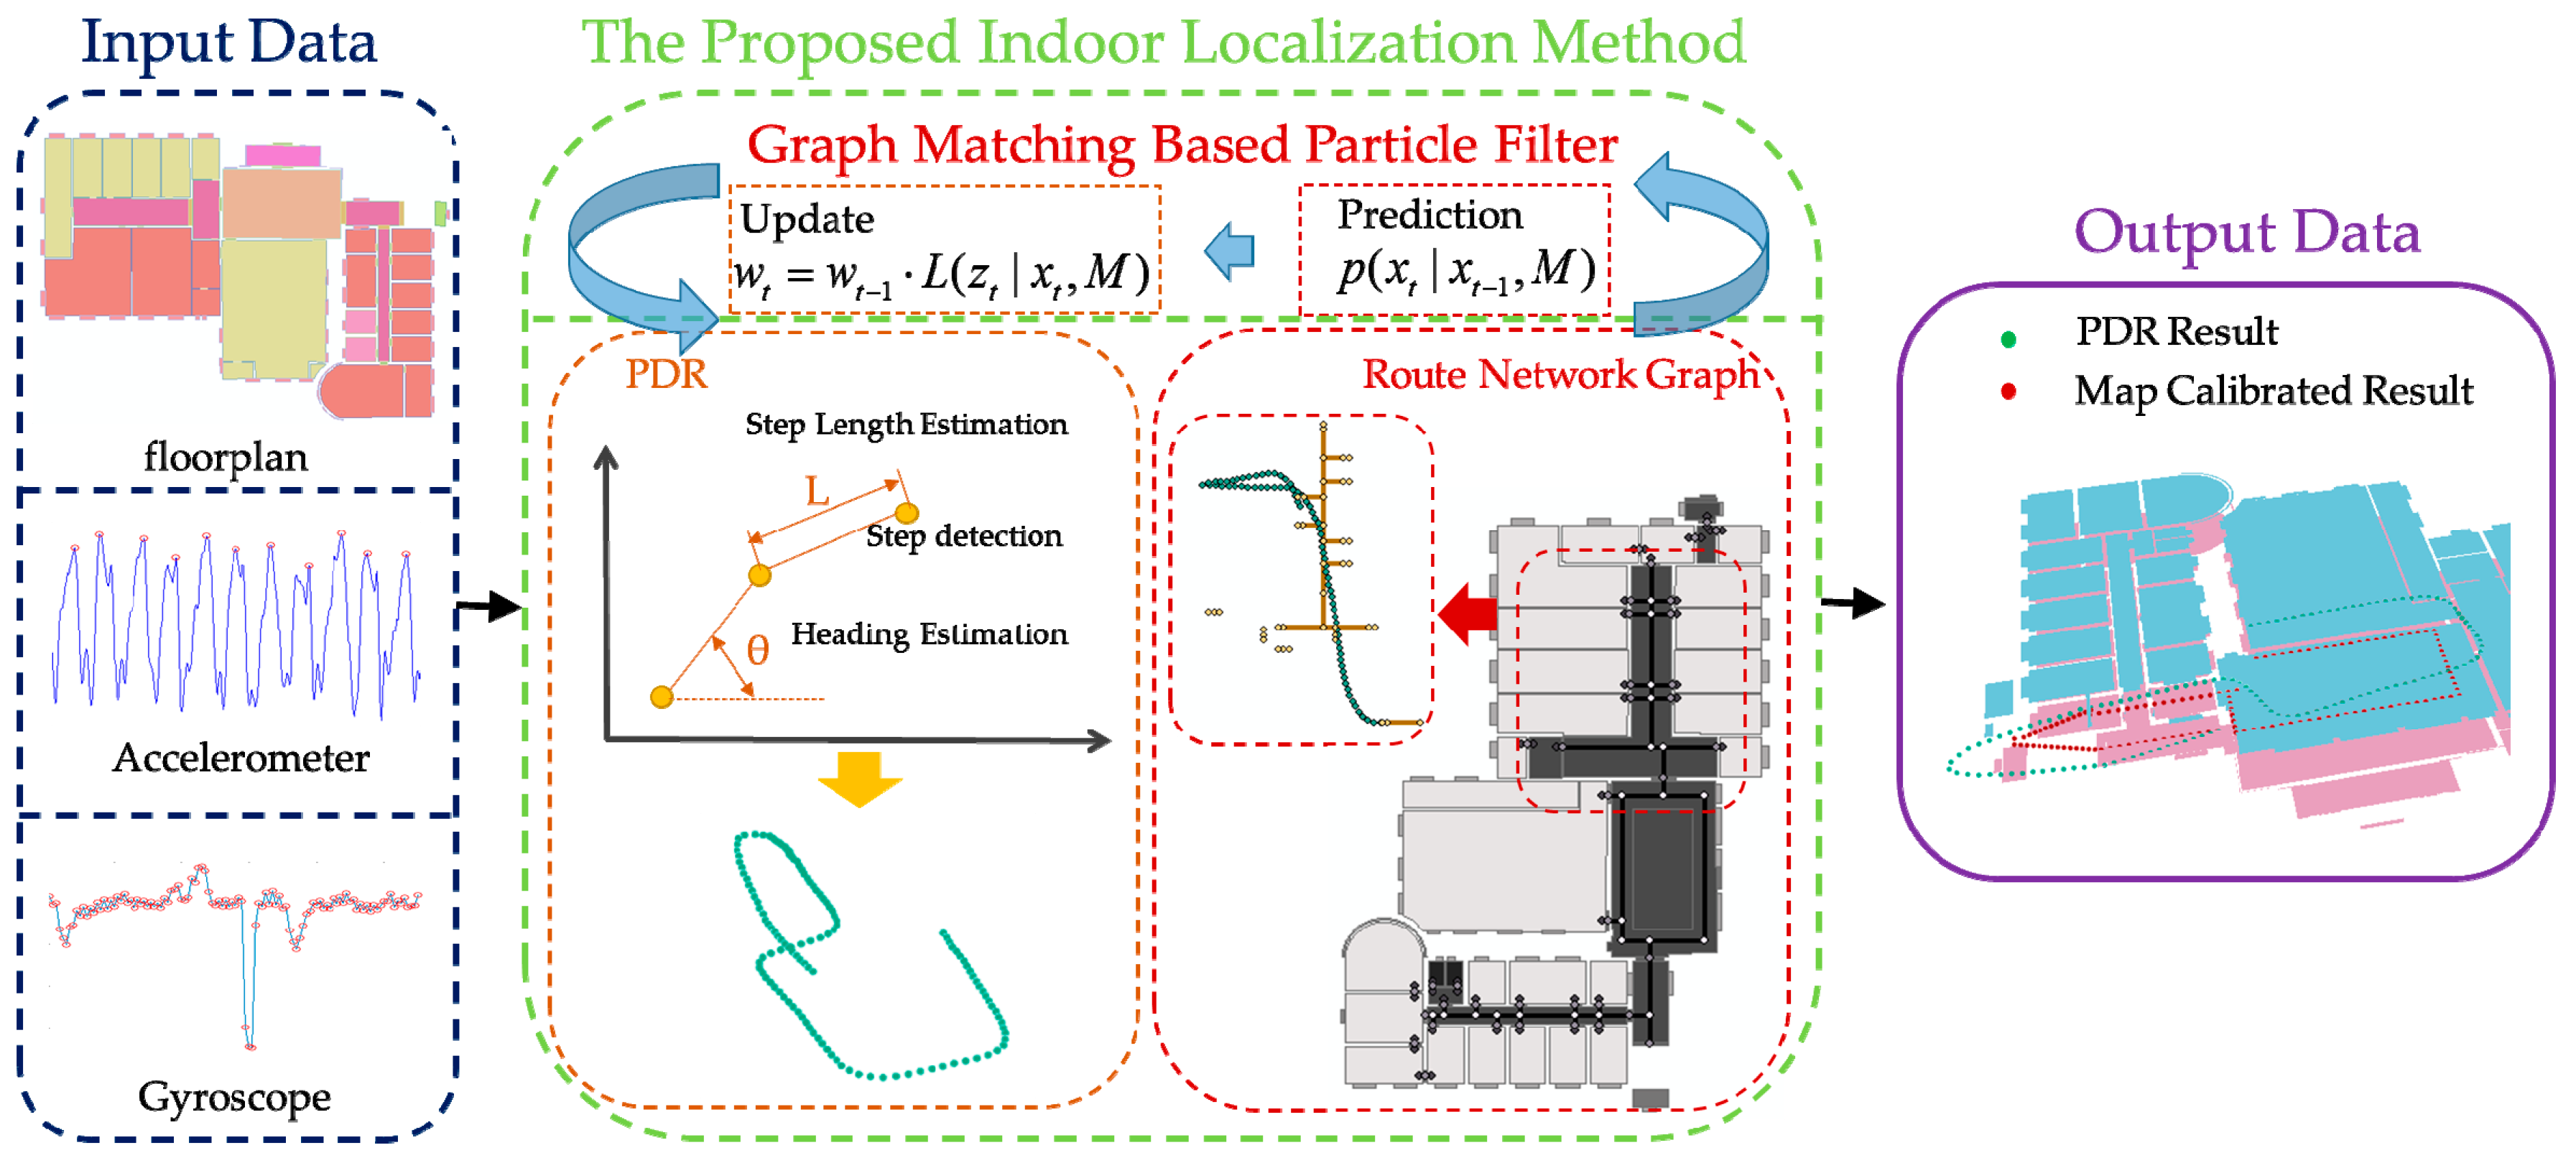
Figure 2.
An example of peak detection on yaw acceleration waveforms: the and thresholds are shown in the orange and green dashed lines, respectively. The red circles show the detected true steps. The peak labeled by an orange circle is identified as false because it is too small in magnitude, while the green one conforms to the magnitude requirement, but is too short in time duration.
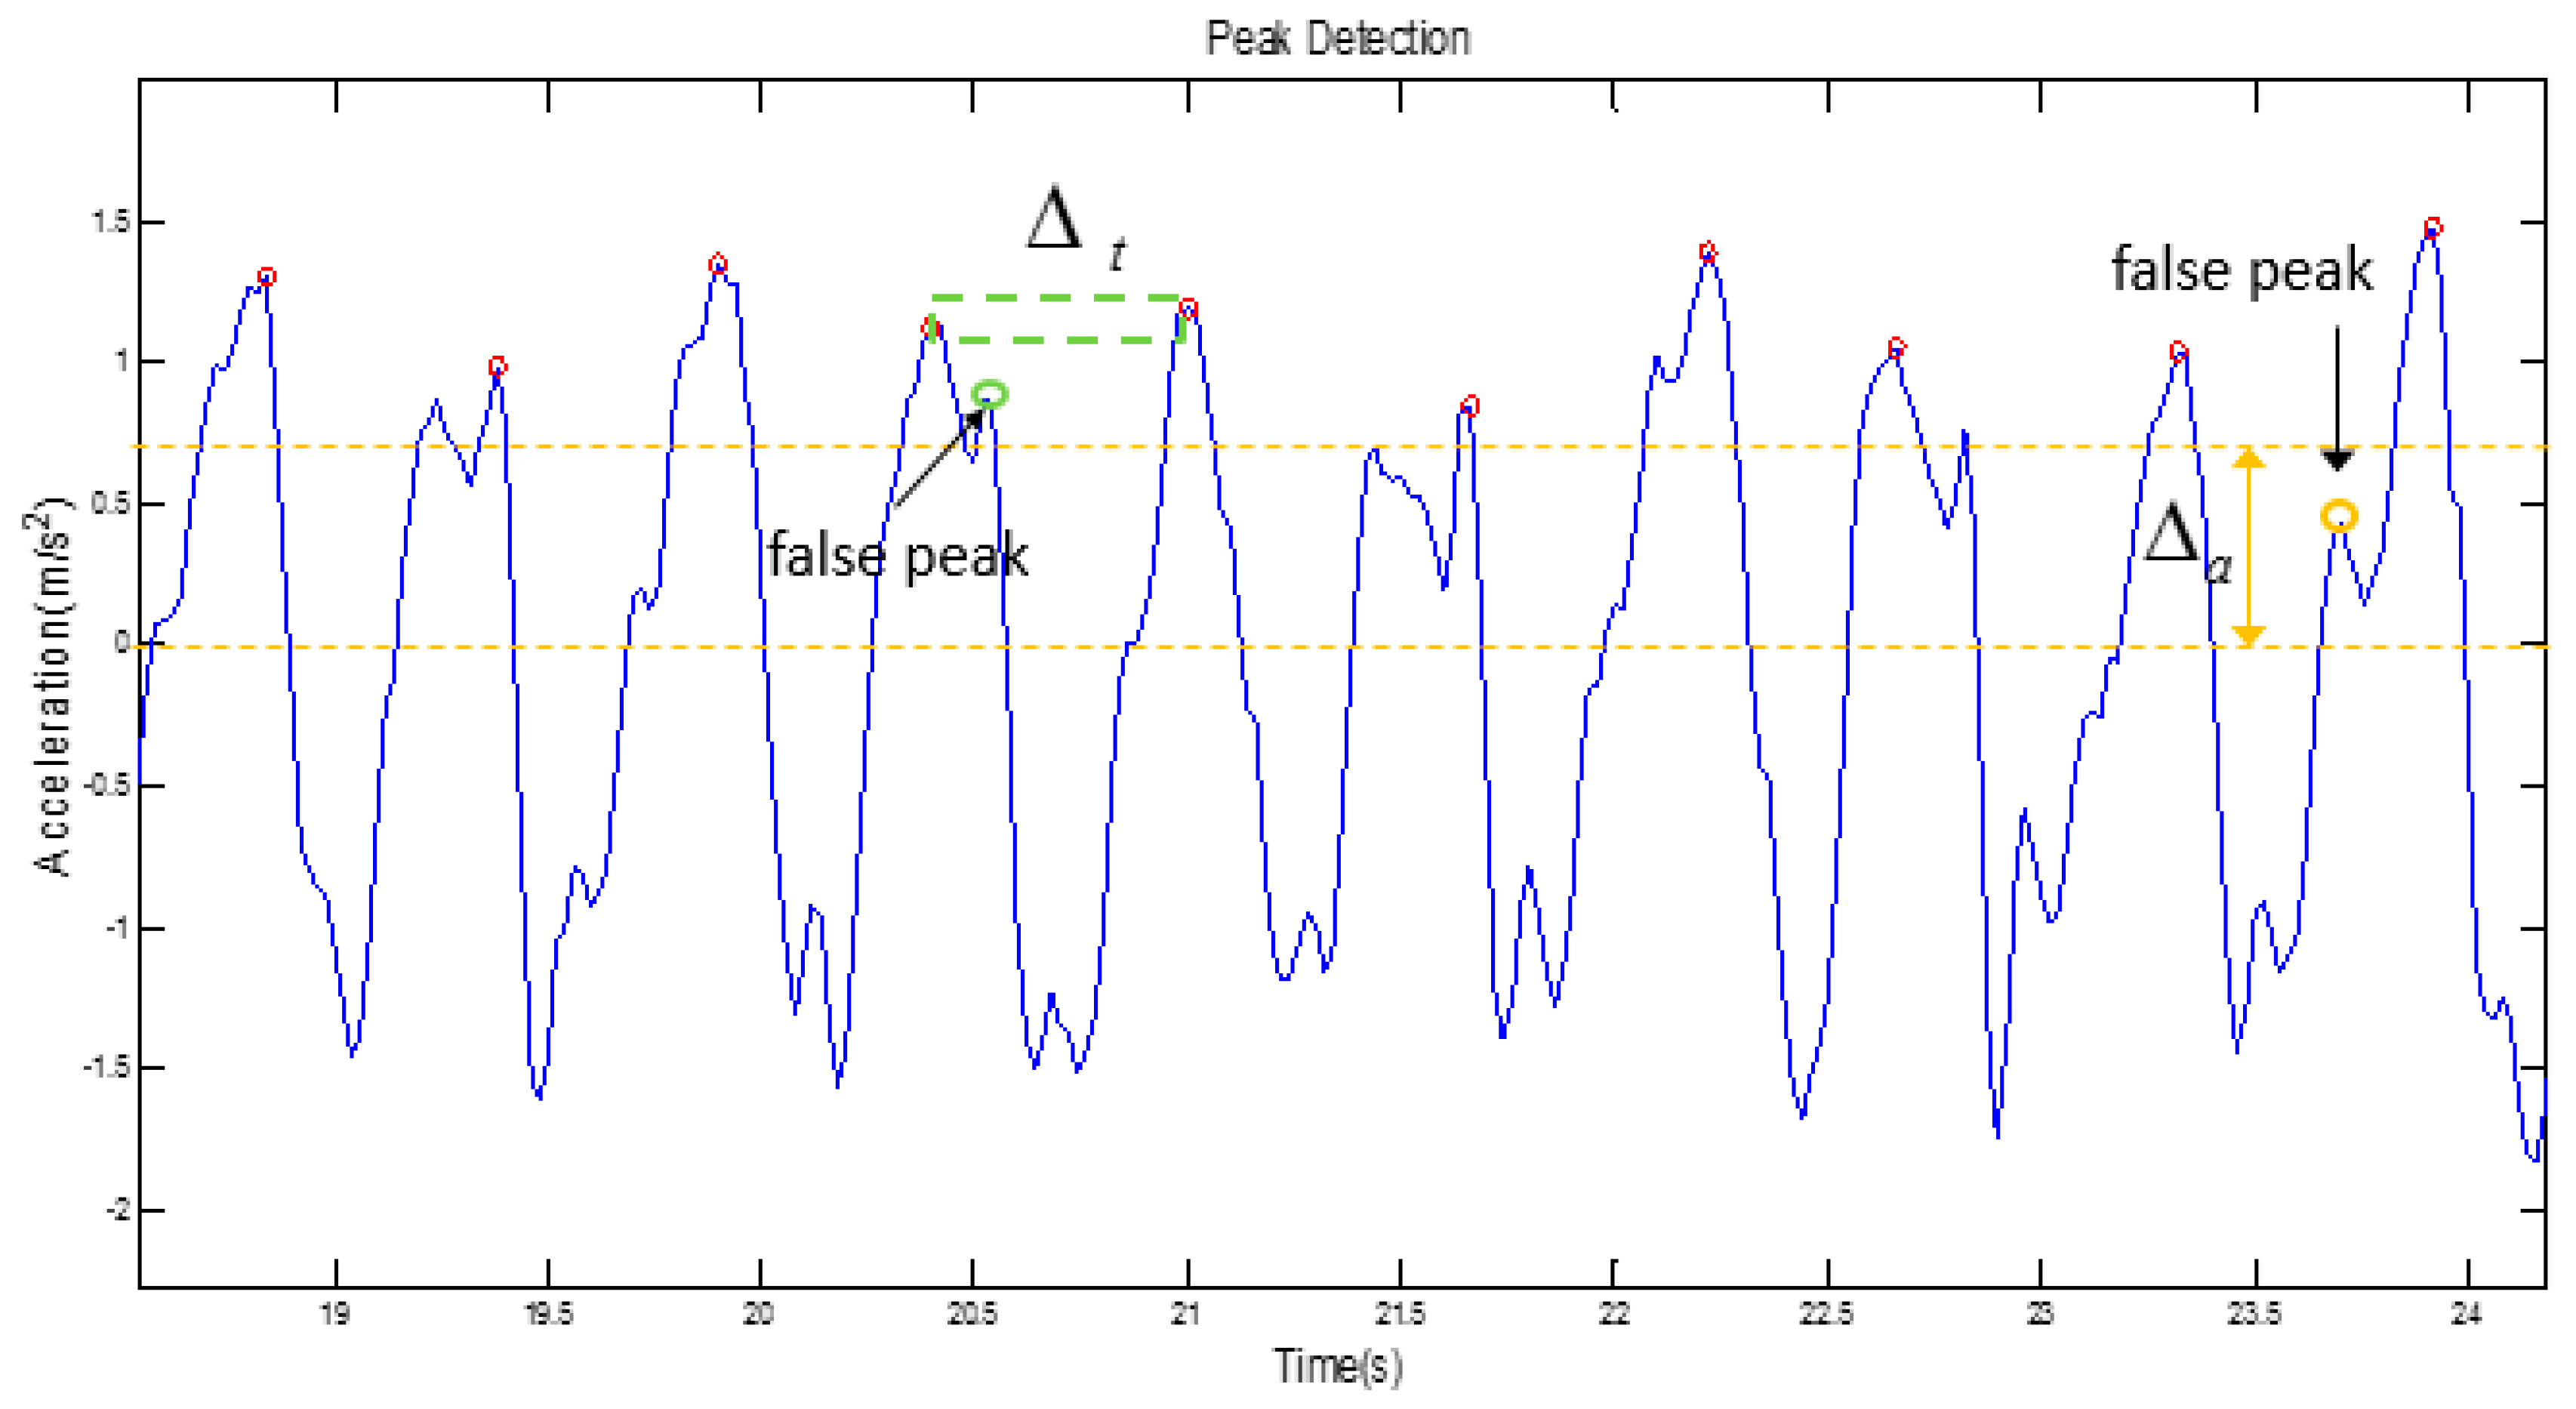
Figure 3.
Orientation estimation result from the gyroscope: (a) orientation change during every step; (b) accumulated heading estimation with respect to the starting orientation (magnetic north); and (c) orientation change over three steps.
Figure 3.
Orientation estimation result from the gyroscope: (a) orientation change during every step; (b) accumulated heading estimation with respect to the starting orientation (magnetic north); and (c) orientation change over three steps.
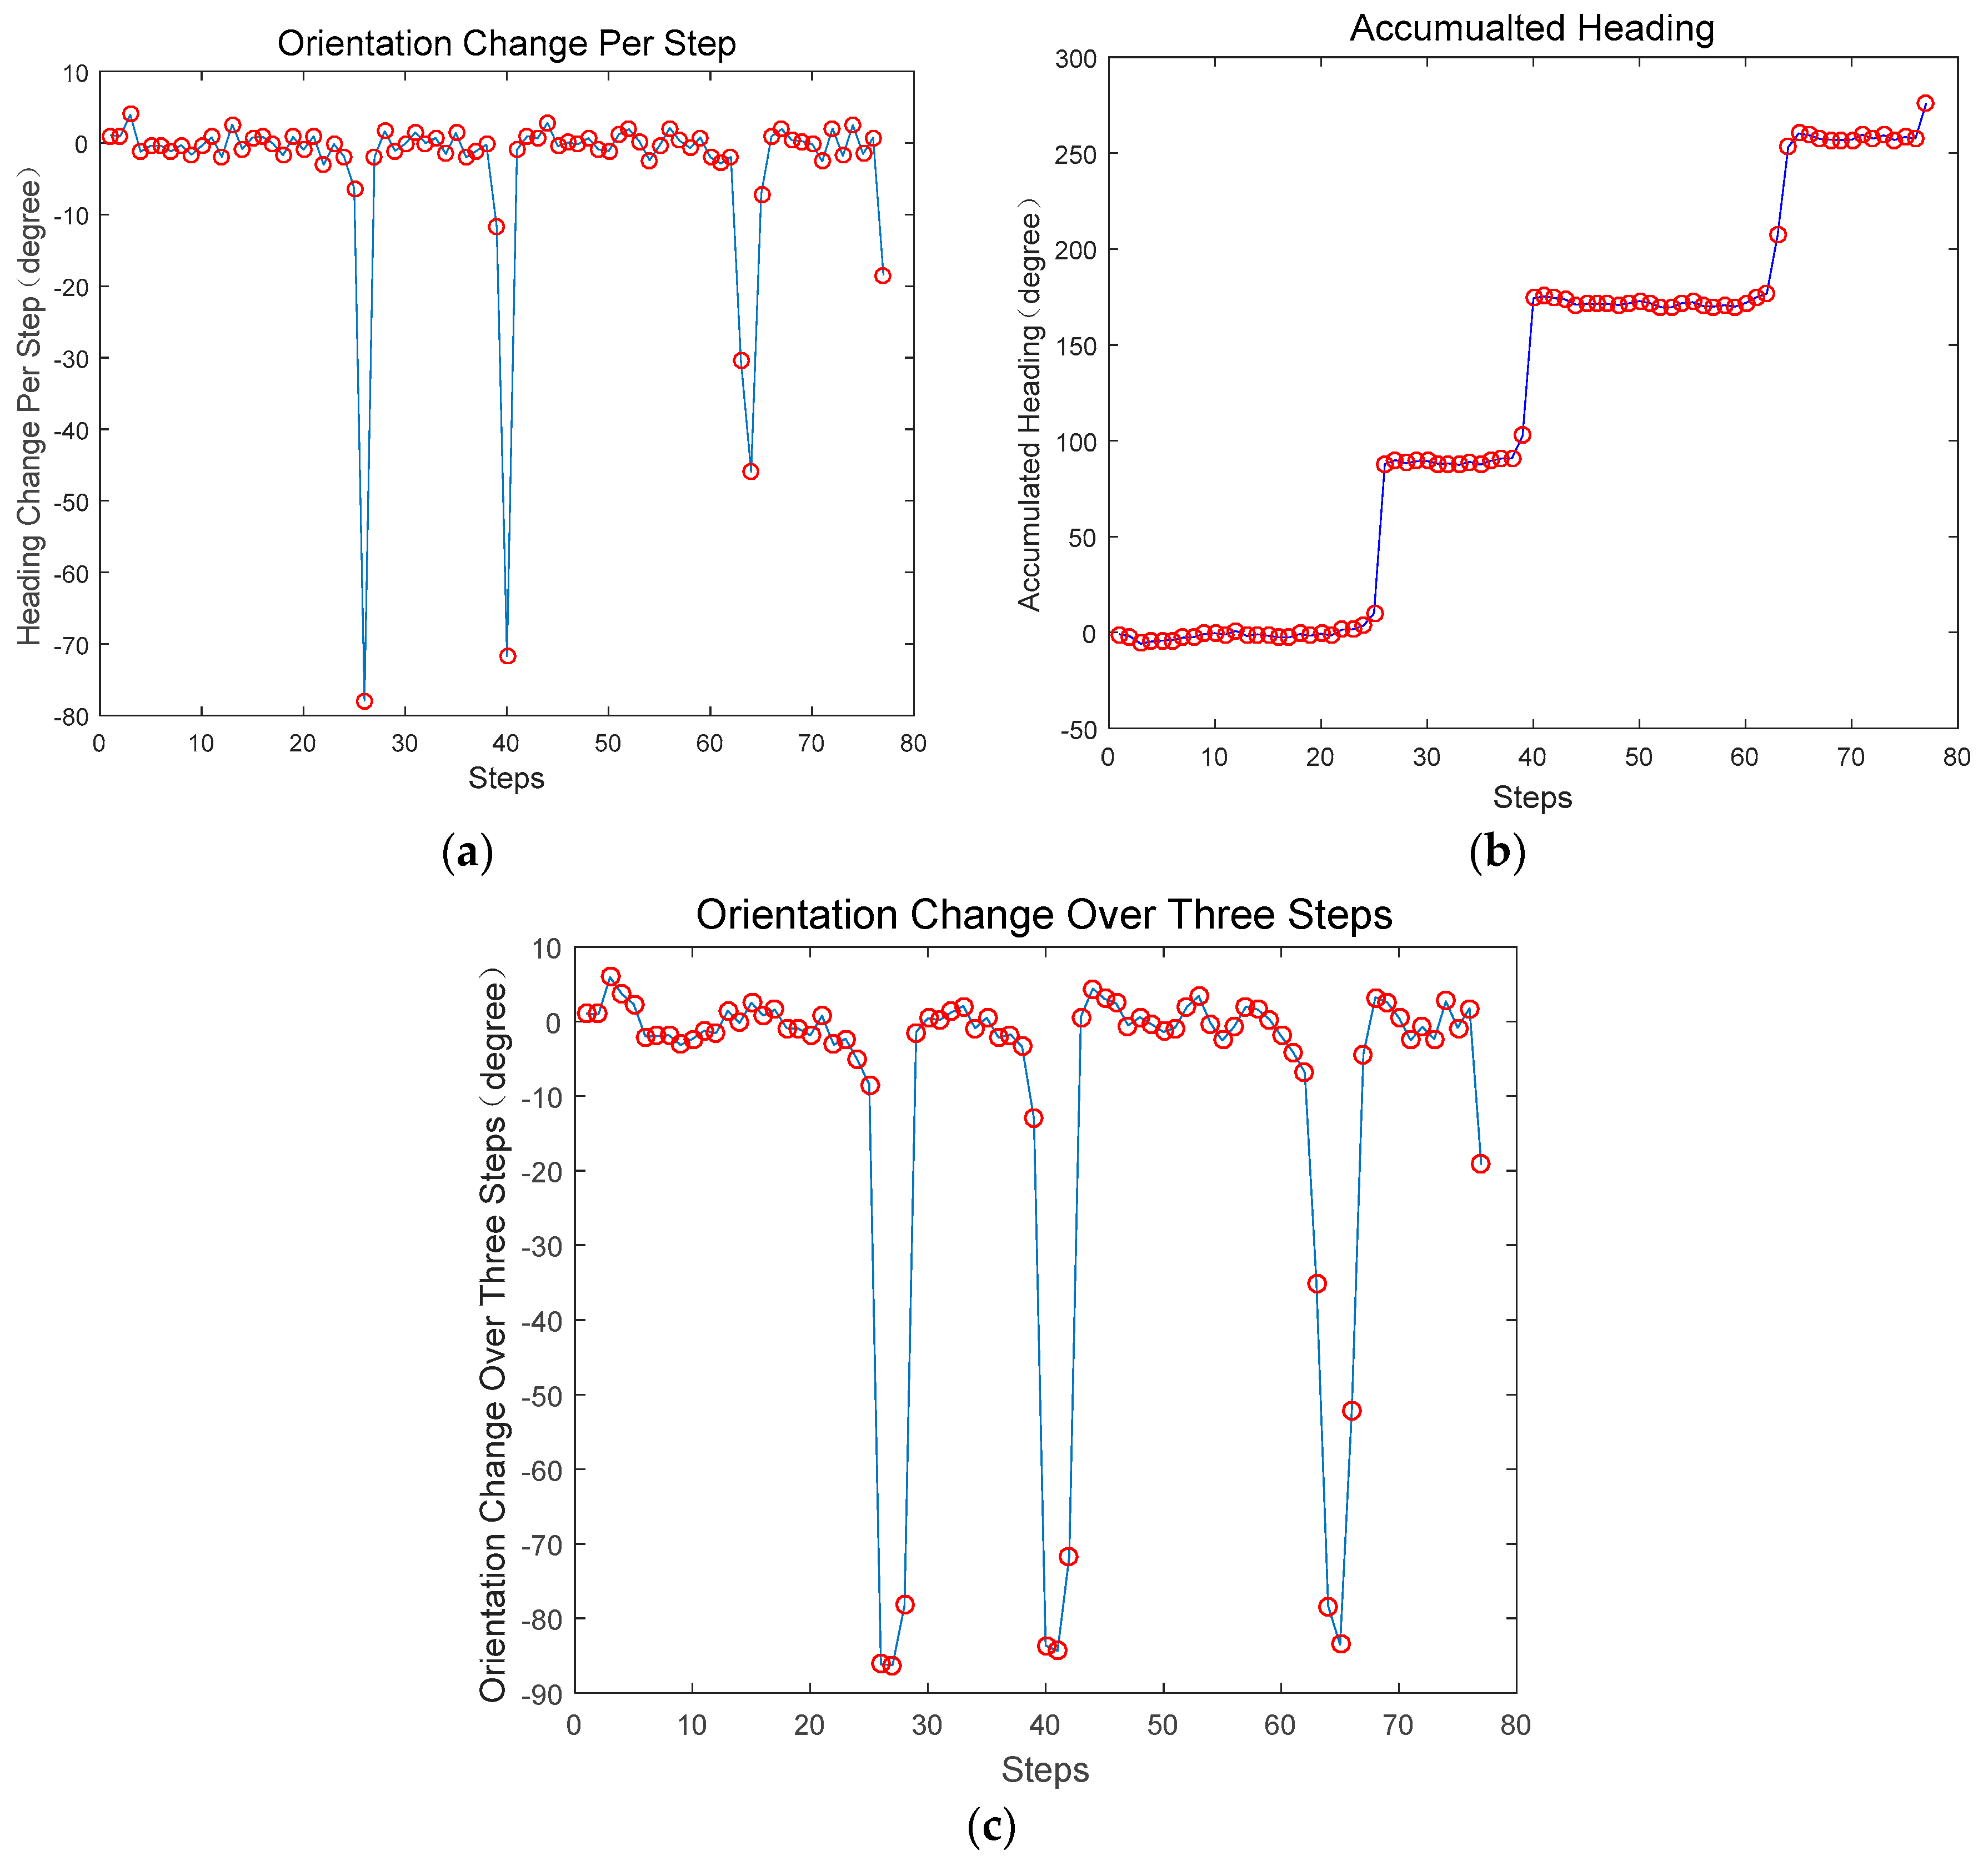
Figure 4.
The route network extracted from a floorplan: (a) the second floor; and (b) the third floor. The corridors (represented with the red lines) are the middle skeleton lines with orientation constraint. The rooms (brown points) are represented by points with range buffers. The open areas (multiple brown points) are the same as the rooms, while implicitly having an orientation constraint of eight neighbors. The stairs connect two floors with a range of the starting point and the end point corresponding to the two floors. The yellow points on the edges define the locations facing a choice of turning into the room or walking along the corridor. The red points represent the doors connecting the rooms and the corridors or transitions connecting two floors.
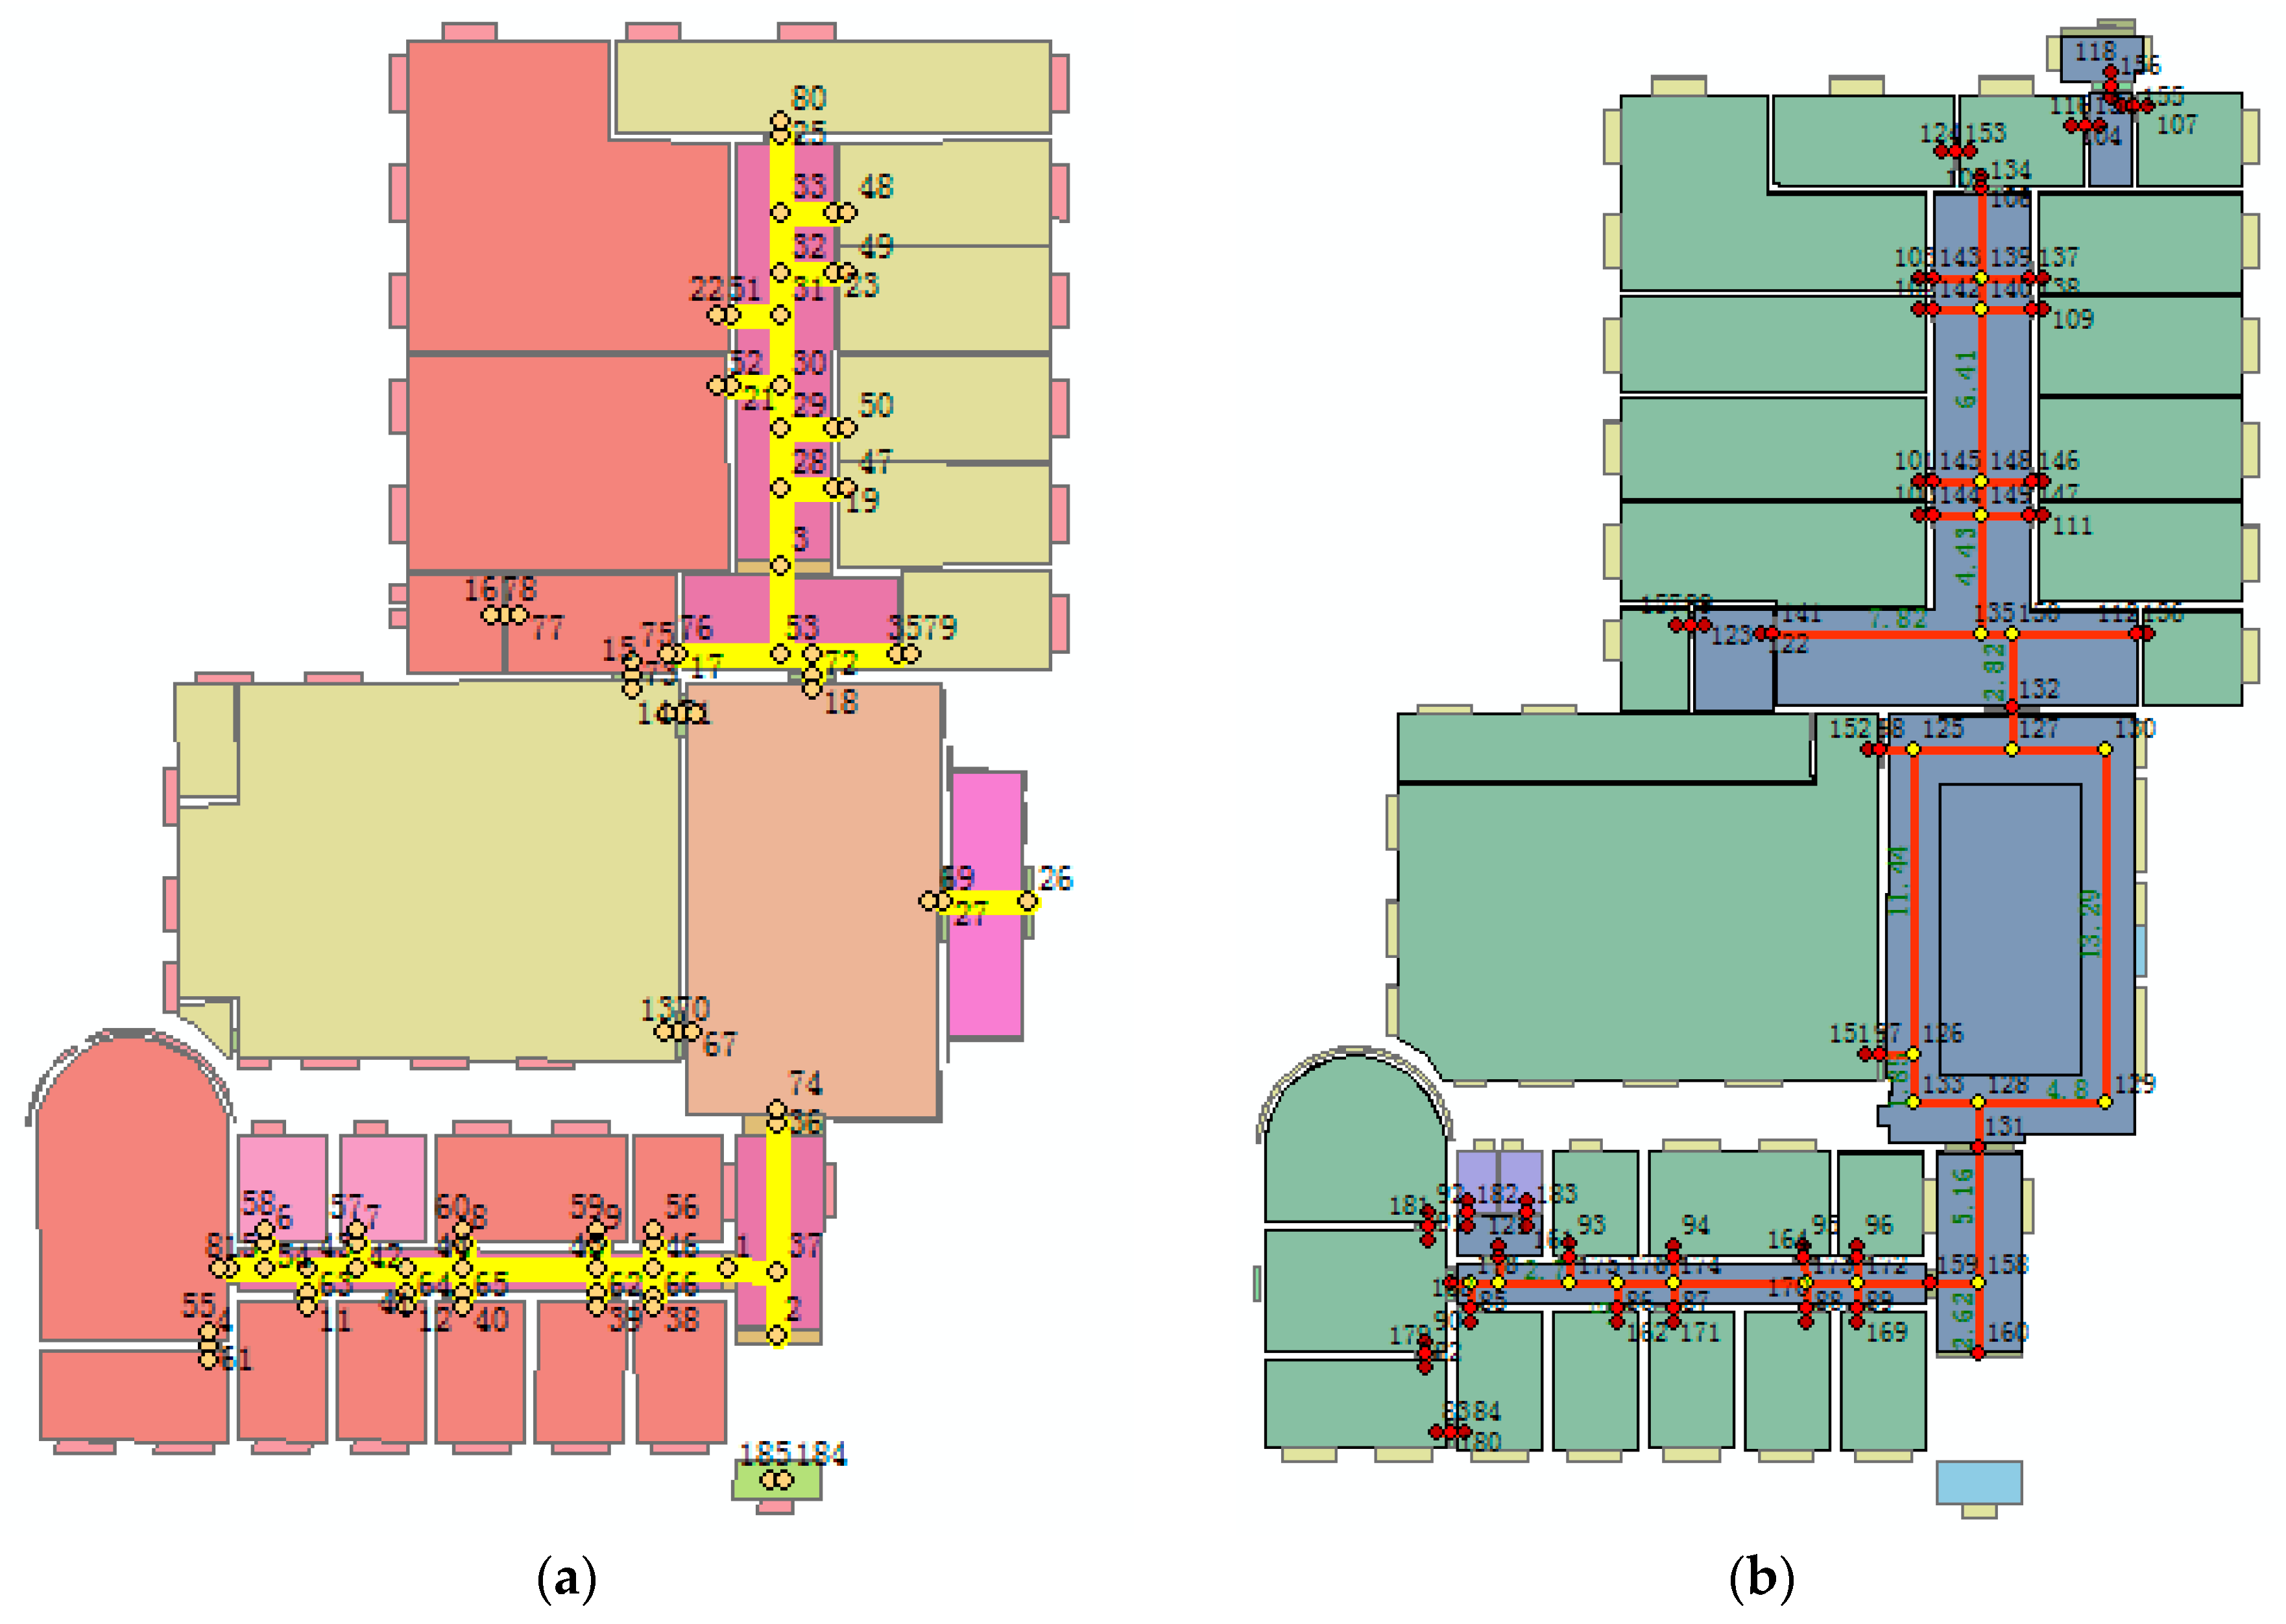
Figure 5.
The semantic augmented route network graph in the corridor region. The red line is the corridor skeleton indicating the potential user path. The yellow points segment the corridor line by connecting it with the possible turns into a room. The red points represent doors connecting two regions. The brown points indicate two-dimensional areas such as rooms or larger open areas. The numbers indicate the length of the lines.
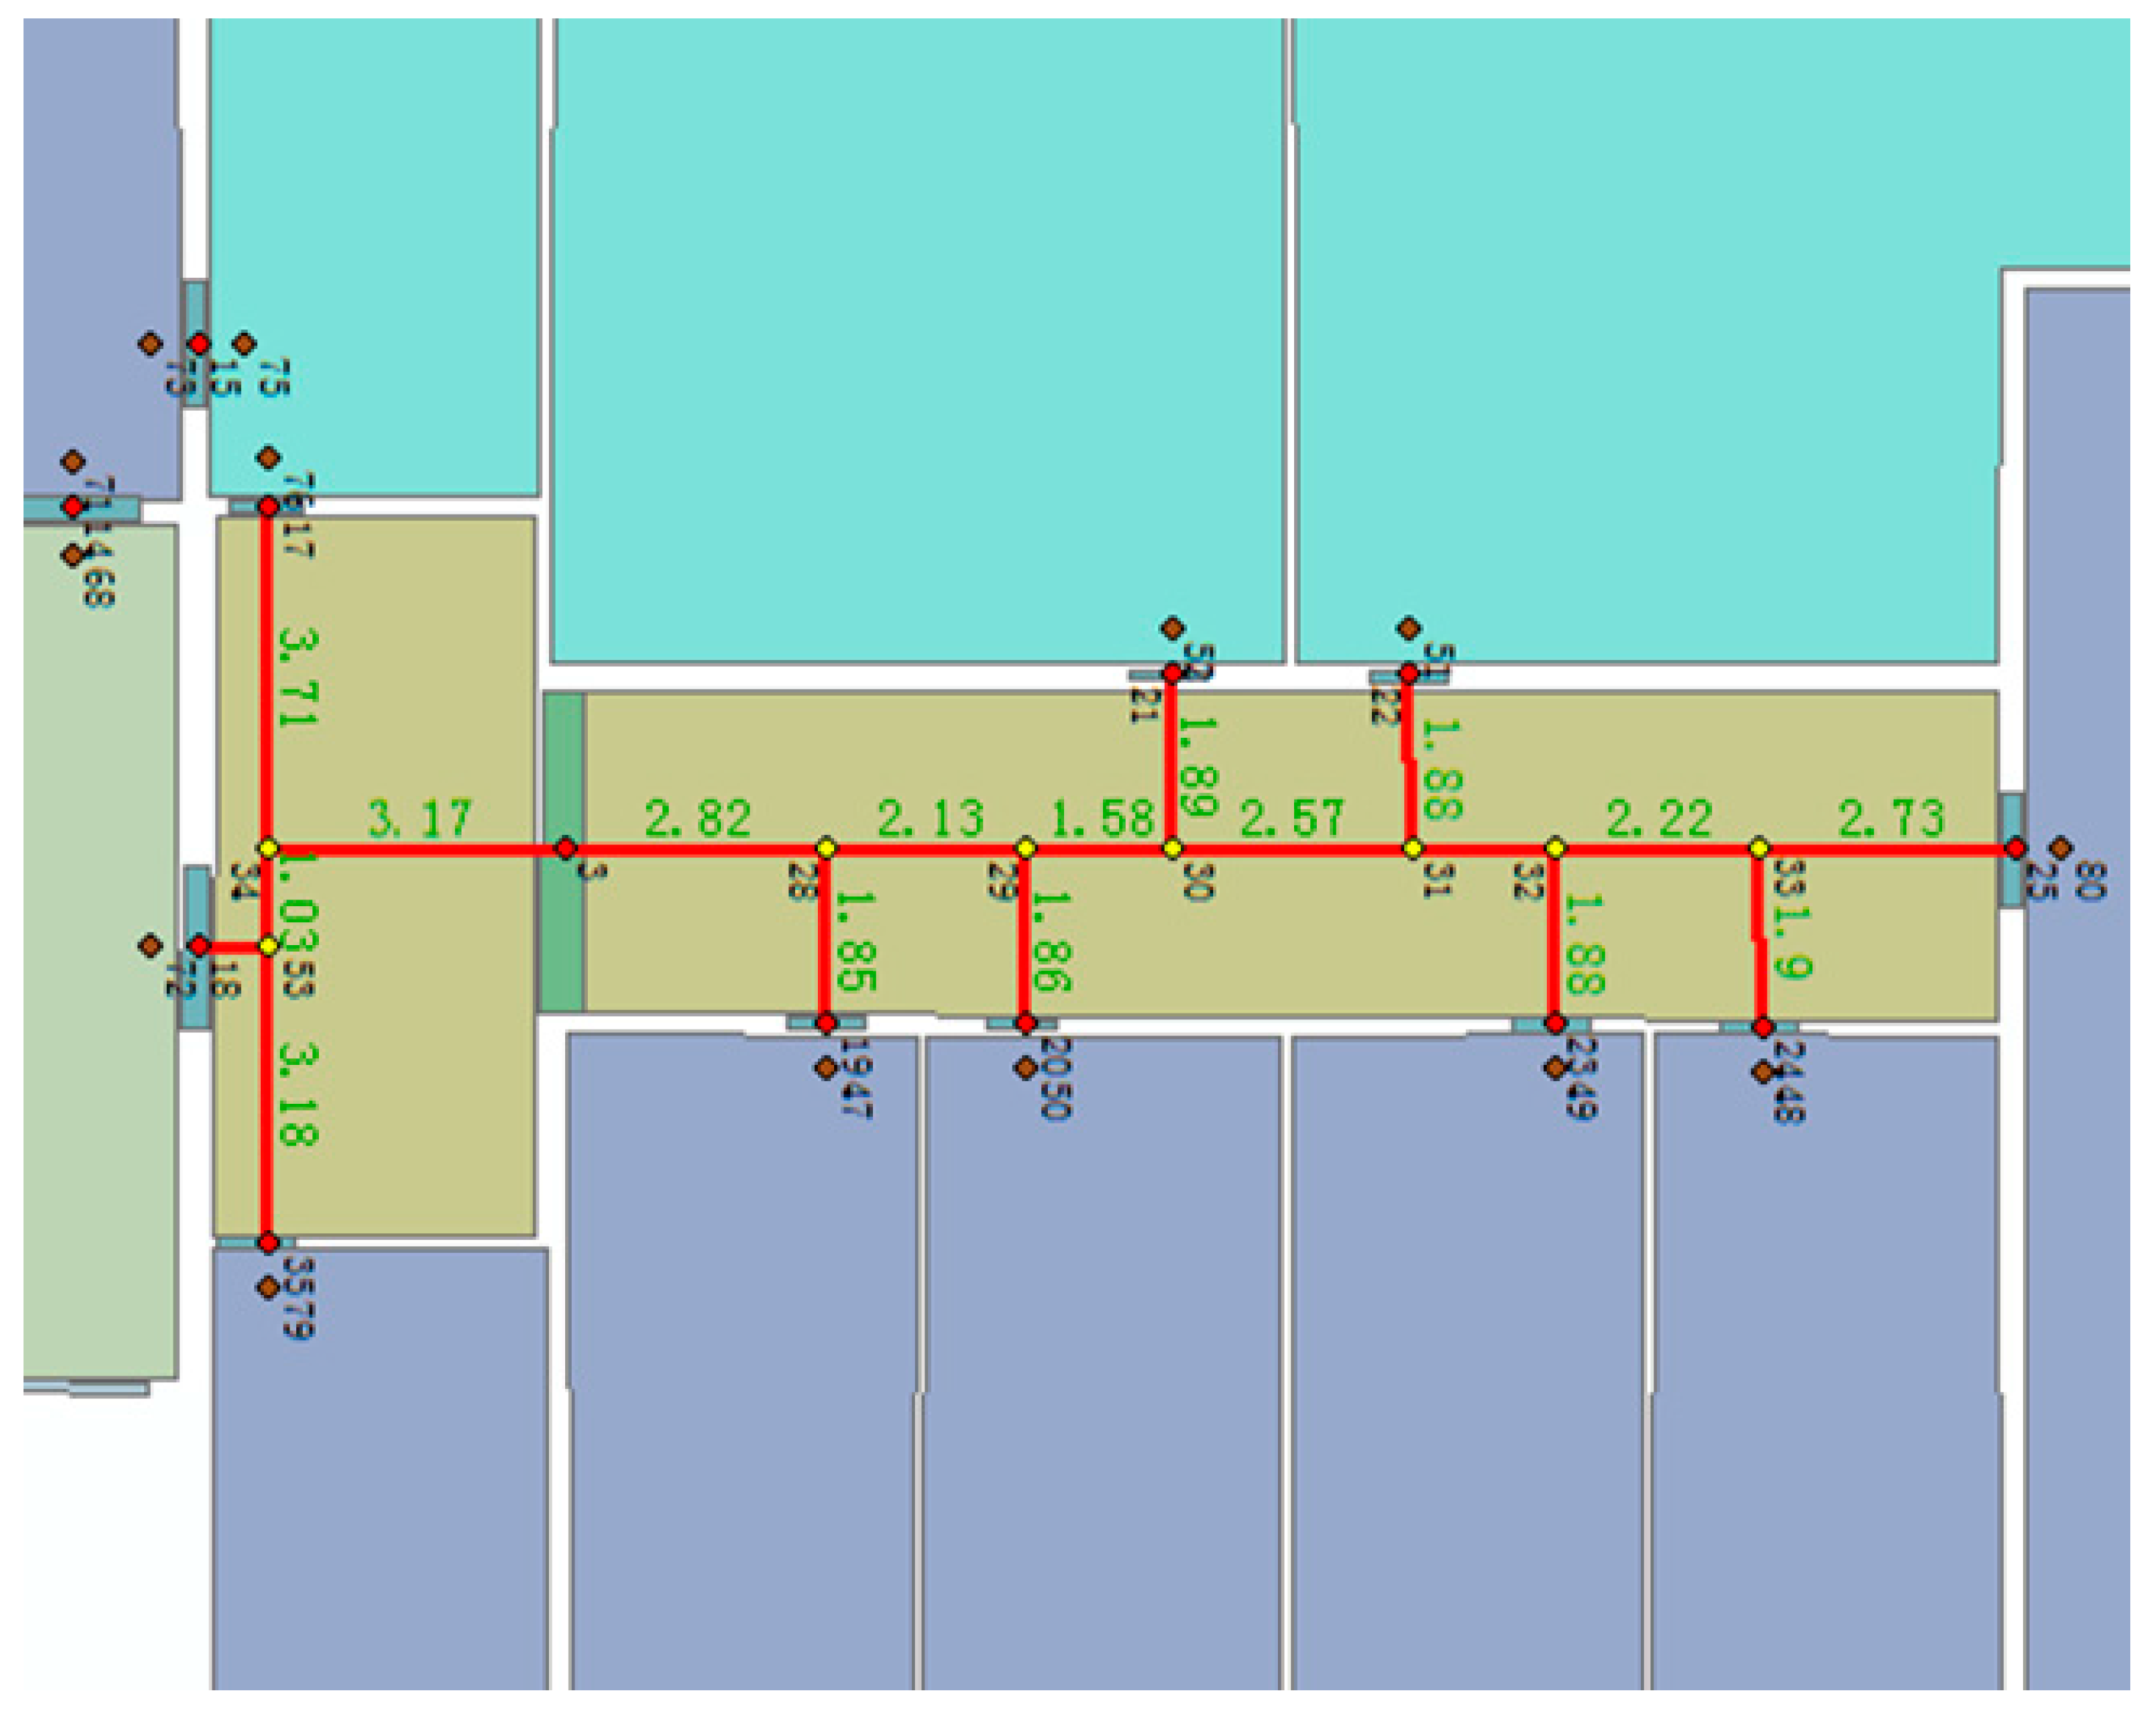
Figure 6.
User motion: (a) corresponds to M1, (b) corresponds to M2, (c) corresponds to M3, (d) corresponds to M4, (e) corresponds to M5, (f) corresponds to M6. The blue line roughly depicts the space structure, and the dashed yellow line simulates the real user walk through the spaces.
Figure 6.
User motion: (a) corresponds to M1, (b) corresponds to M2, (c) corresponds to M3, (d) corresponds to M4, (e) corresponds to M5, (f) corresponds to M6. The blue line roughly depicts the space structure, and the dashed yellow line simulates the real user walk through the spaces.

Figure 7.
The graph matching-based particle filter during one iteration.

Figure 8.
Peak detection of PDR: (a) the red circles indicate individual steps in scenario 1; and (b) the red circles indicate individual steps in scenario 2.
Figure 8.
Peak detection of PDR: (a) the red circles indicate individual steps in scenario 1; and (b) the red circles indicate individual steps in scenario 2.

Figure 9.
Orientation estimation result of PDR: (a) the orientation changes relative to the last step; (b) the overall heading estimation relative to the starting time; (a) and (b) are the result for scenario 1; (c) and (d) are the corresponding results of scenario 2.
Figure 9.
Orientation estimation result of PDR: (a) the orientation changes relative to the last step; (b) the overall heading estimation relative to the starting time; (a) and (b) are the result for scenario 1; (c) and (d) are the corresponding results of scenario 2.

Figure 10.
Localization result: (a) the first half trajectory of experiment 1; (b) the whole trajectory of experiment 1; (c) the side-look graph of going upstairs in experiment 2; (d) the overlook graph of the trajectory when walking in the lobby in experiment 2.
Figure 10.
Localization result: (a) the first half trajectory of experiment 1; (b) the whole trajectory of experiment 1; (c) the side-look graph of going upstairs in experiment 2; (d) the overlook graph of the trajectory when walking in the lobby in experiment 2.

Figure 11.
Step detection result of six volunteers: (a–f) are the detected steps for each volunteer, (a) F1 (Zhu); (b) F2 (Zhou); (c) M1 (Guo); (d) M2 (Liu); (e) M3 (Liu); (f) M4 (He).
Figure 11.
Step detection result of six volunteers: (a–f) are the detected steps for each volunteer, (a) F1 (Zhu); (b) F2 (Zhou); (c) M1 (Guo); (d) M2 (Liu); (e) M3 (Liu); (f) M4 (He).

Figure 12.
Heading estimation of six participants. The first column is the heading change relative to the last time stamp. The second column is the heading change relative to the start orientation. The third column is the third turn. (a) F1(Zhu); (b) F2(Zhou); (c) M1(Guo); (d) M2(Ma); (e) M3(Liu); (f) M4(He).

Figure 13.
The route of six participants. Green indicates the PDR results and red shows the calibrated results. (a) F1(Zhou); (b) F2(Zhu); (c) M1(Guo); (d) M2(Ma); (e) M3(Liu); (f) M4(He).
Figure 13.
The route of six participants. Green indicates the PDR results and red shows the calibrated results. (a) F1(Zhou); (b) F2(Zhu); (c) M1(Guo); (d) M2(Ma); (e) M3(Liu); (f) M4(He).


Table 1.
Example of the data structure of the corresponding graph in Figure 5.
Table 1.
Example of the data structure of the corresponding graph in Figure 5.
| Type | Index | X_cor | Y_cor | Z_cor | Neighbors | Neighbor Direction N, S, W, E | Neighbor Distance dN, dS, dW, dE |
|---|---|---|---|---|---|---|---|
| Corridor | 28 | −8.87 | 15.03 | 1.39 | 3, 29, 19 | 1, 1, 0, 1 | d28,29, d28,3, 0, d28,19 |
| Area | 47 | −6.52 | 15.03 | 1.39 | 0 | Door direction | Room range |
| Stair | 1.39 | Start and end point | Height of one step | ||||
| Door | 19 | −7.02 | 15.03 | 1.39 | 28, 47 | 0, 0, 1, 1 | 0, 0, d19,28, d19,47 |
Table 2.
The relationship between space type, user motion, and the corresponding algorithms.
| Localization Semantic | User Motion | Algorithm |
|---|---|---|
| Corridor | M1, M2, M3, M4 | Turning detection, buffer analysis |
| Open area | M3, M5 | Turning detection, buffer analysis, range constraint |
| Stair | M6 | Buffer analysis |
| Door | M2, M3 | Turning detection, buffer analysis |
Table 3.
The height and step length of six participants.
| Participant | F1 (Zhu) | F2 (Zhou) | M1 (Guo) | M2 (Ma) | M3 (Liu) | M4 (He) |
|---|---|---|---|---|---|---|
| Height (cm) | 165 | 165 | 174 | 170 | 175 | 172 |
| Step Length (cm) | 51 | 53 | 55 | 58 | 75 | 72 |
Table 4.
The time of a single update step for a single particle in different indoor places (unit: ms).
Table 4.
The time of a single update step for a single particle in different indoor places (unit: ms).
| M1 | M2 | M3 | M4 | M5 | M6 |
|---|---|---|---|---|---|
| 0.32 | 0.77 | 0.36 | 0.42 | 0.36 | 0.47 |
The first row represents the user motions defined in Section 3.3. The second row represents the time consumption for each motion (milliseconds).
© 2017 by the authors. Licensee MDPI, Basel, Switzerland. This article is an open access article distributed under the terms and conditions of the Creative Commons Attribution (CC BY) license (http://creativecommons.org/licenses/by/4.0/).
Share and Cite
MDPI and ACS Style
Zhou, Y.; Zheng, X.; Xiong, H.; Chen, R. Robust Indoor Mobile Localization with a Semantic Augmented Route Network Graph. ISPRS Int. J. Geo-Inf. 2017, 6, 221. https://doi.org/10.3390/ijgi6070221
AMA Style
Zhou Y, Zheng X, Xiong H, Chen R. Robust Indoor Mobile Localization with a Semantic Augmented Route Network Graph. ISPRS International Journal of Geo-Information. 2017; 6(7):221. https://doi.org/10.3390/ijgi6070221
Chicago/Turabian StyleZhou, Yan, Xianwei Zheng, Hanjiang Xiong, and Ruizhi Chen. 2017. "Robust Indoor Mobile Localization with a Semantic Augmented Route Network Graph" ISPRS International Journal of Geo-Information 6, no. 7: 221. https://doi.org/10.3390/ijgi6070221
Note that from the first issue of 2016, this journal uses article numbers instead of page numbers. See further details here.