1. Introduction
In recent years, there has been an increased availability of a wide variety of forms of monitoring data, ranging from Earth Observation data mainly derived from satellite imagery, to simulations and forecasts resulting from crop models, sensory data obtained through advanced sensor networks, and user-collected data. This availability offers a wealth of actionable information to better streamline and improve agricultural practices [
1]. Agricultural monitoring systems are aimed at supporting stakeholders in decision-making processes in the field. To achieve this, they need to be able to make sense of and properly handle a broad variety of data sets, products and resources ranging from fine-grained, parcel-level observations gathered by farmers themselves, to course-grained, aggregate and regional data (e.g., satellite imagery, data from meteorological stations), to scientific simulations for estimating crop yields and risks. When properly managed and disseminated, these bits and pieces altogether yield relevant information for distinct types of stakeholders (i.e., farmers, local and regional authorities, agro-service providers, and agro-businesses) through the information and service value chain for agriculture sustainable practices and monitoring.
Related literature has broadly recognized the key role of Earth observation (EO) and space technology in the agriculture sector. They can increase the efficiency, productivity and sustainability of the agriculture sector since farmers and stakeholders have access to timely information for their crop yield estimation and predictions, pest and disease control, farmland management, and other cultivation and management tasks through the crop life cycle [
2]. Indeed, the spectrum of technology-based interventions applied to the agriculture sector goes well beyond EO technology alone. Current agriculture systems use and/or combine different types of technology ranging from hardware deployments, and robotics and remote sensing instruments and technology, to distributed computing, and web-based and mobile-based software applications [
3,
4,
5]. Cloud computing platforms are being used for computational efficiency in generating customized data products based on remote sensing imagery [
6,
7,
8] or running crop models, while mobile technology [
9,
10] and Internet of things [
11] deployments are increasingly being introduced into precision agriculture to gather in-situ data streams with high spatio-temporal coverage.
In this varied technology-driven landscape, geographic information systems (GIS), and geospatial and web mapping technologies play a central role in farming and agriculture systems. Initially used extensively as desktop- and web-based applications for supporting farmland management and planning [
12,
13] and for crop yield estimation, prediction, and damage assessment through thematic maps [
14], recent developments of geospatial technology have opened the door to a new breed of spatial applications featuring real-time processing of large and varied data sources, integrated workflows, and highly interactive map-based interfaces. For example, existing open source geospatial libraries and tools such as web mapping tools, geo-statistical modeling software, and geoprocessing capabilities, can be combined to build up monitoring systems adapted to different environmental and agricultural scenarios [
5,
15]. Nevertheless, the degree of functional and technical sophistication increases as the resulting applications and systems make use of various software components and libraries; this unavoidably poses significant challenges [
16] with respect to: (1) the handling and integration of multi-scale data sources to (2) present information to decision makers in a way which is useful, understandable and user friendly.
The first issue of multi-scale data integration is being fueled by the current revolution in EO and space technology which has occurred over the past years [
17]. A huge set of remote-sensed satellite imagery that covers any place at any time is being produced for the purpose of agriculture monitoring and management, among other application domains. This results in vast amounts of EO data at different scales, granularity, and temporal resolutions. Approaches for materializing agricultural systems capable of making sense of this plethora of heterogeneous data sources are in part feasible thanks to the latest advances in web services and the application of open geospatial standards and service specifications to the agriculture sector (e.g., [
18,
19]). Combined with traditional types of geospatial web services (e.g., Web Map Services, Web Feature Services), Sensor Web Enablement and Web Processing Service specifications are jointly used to, on one hand, model and fetch any type of observations (e.g., weather parameters, in-situ observations, sensor-based measurements), and, on the other, process them in combination with contextual geospatial data (land use data, etc.) leading to useful data products and thematic maps for crop management [
20,
21]. In practice, these standardized, geospatial data models and service specifications are increasingly coupled with RESTful-based service-oriented architectures, which have become the de facto form of implementation of web-based systems, as the complexity of the client-server communication is drastically reduced [
22].
With respect to the second issue, the delivery and presentation of information, geoportals have traditionally had a relevant role in the GIS/spatial data infrastructure (SDI) community to deliver useful, understandable and actionable information to decision-makers [
23,
24]. From the user’s perspective, geoportals can be regarded as the visible face of back-end service-oriented systems. Recent developments of agriculture-related applications rely in geoportals to deliver required information to end users. For example, CropSpace [
25,
26] is a service-oriented web application to access, analyze, and visualize agriculture information for the continental United States. It takes the form of a one-stop geoportal to give access to a wealth of data products and thematic maps derived from the cropland data layer (a crop-specific land cover classification product from the US Department of Agriculture (USDA) National Agricultural Statistics Service (NASS),
https://www.fort.usgs.gov/sites/case-studies/us-department-agriculture-national-agricultural-statistics-service-cropland-data.). VegSpace [
27,
28] is a web service-based geoportal for monitoring vegetation conditions. As with CropSpace, it follows the same architectural principles (service-oriented architecture) and implementation strategy (i.e., open geospatial services) to process different vegetation indices for viewing, analysis and dissemination of resulting products and thematic maps. In a similar vein, CropWatch [
29], China’s global crop monitoring portal, uses remote sensing data combined with field data to determine key crop production indicators and to produce thematic maps at regional scale. On the other side, the application of management-oriented models for monitoring crop conditions and forecasting yields has been an integral part of agricultural monitoring systems for decision-making processes and, hence, in counterpart geoportals too. Crop models vary in scope, focus, and needed computational resources, depending ultimately on the particular crop scenario they are dealing with. Therefore, the way models are used and coupled in geoportals necessarily yield different levels of integration and interactivity with targeted users. AgriSuit [
30] for example is a web-based framework for multi-criteria assessment of agricultural land suitability which may be of interest to a wide range of stakeholders.
It is plausible to state that there are on-going service-oriented developments and web-based geoportals enabling the rapid access, processing and dissemination of remotely-sensed and modeling-based data for facilitating agricultural monitoring and management. Even though each type of crop requires customized data products and models, and is constrained to local environmental conditions, a common design and engineering pattern comes out in which a set of web services and tools are integrated and combined to produce specific data products and maps being accessed and presented to end users through web-based geoportals. Despite these advances, Chen et al. [
31] recently called for investigating better methods and tools to deliver geospatial knowledge and actionable information from imagery and other data sources. The authors also provided their scientific vision in form of a research agenda, which included, among other themes, the need for “dynamic monitoring and the prediction of future trends, and [
the shift] from traditional desktop solutions to cloud platforms using web services” ([
31] p. 16). The authors also underlined that “there is an immense challenge to provide spatial data infrastructures and related services”([
31] p. 16) to build systems and applications to deliver actionable and understandable information to meet the needs of stakeholders. In this paper we contribute to the above scientific vision and issues through the design and development of a regional geoportal for rice monitoring in the realm of the Earth obseRvation Model-based ricE information Service (ERMES) project.
The project is aimed at addressing the key challenges of collecting, combining, managing and visualizing a multitude of varied data for the rice sector in a comprehensive way [
32]. The proposed ERMES system accounts holistically for the rice monitoring process at regional and local scales through diverse software components, services and tools to accelerate the process of integrating various data sets, processing them, creating customized data products, and delivering them to different stakeholders in a timely manner.
In what follows we give an overview of the ecosystem of ERMES tools and services, showing the role of the regional geoportal, a service-oriented application specifically focused on the rice crop—one of the world’s “big three” staple foods—monitoring process in a European context. Being the focus of the paper, we subsequently introduce all the facets of the regional geoportal and its main components and modules, both on the server and client sides, and point out architectural, design and implementation considerations (
Section 3). In
Section 4, we present examples of the regional geoportal, which is currently in operational use in Europe’s three largest rice-producing countries, Italy, Greece and Spain, as well as being in demonstration phase in two African countries. Finally, in
Section 5, we summarize the main contributions of this article.
2. Overview of the ERMES Project
2.1. Downstream Services for Rice Cultivation Management and Monitoring
ERMES (Earth obseRvation Model-based ricE information Service,
http://www.ermes-fp7space.eu/) is an FP7 Project funded by the European Commission whose main objective is to prototype downstream services for regional and local scales based on the assimilation of EO products, field and in-situ data, and modeling solutions. Both scales are aimed at assisting local farmers and regional authorities in rice cultivation management and monitoring activities, respectively. These two groups of stakeholders have different needs and interests. Whereas regional stakeholders require systems for rice monitoring, crop mapping, yield estimation, and risk forecast at a regional coverage to produce, for instance, informational bulletins, local farmers are keen on obtaining valuable, timely information on rice cultivation and management activities at the parcel scale such as yield variability, risk alert, and crop damage.
The downstream service for the local scale, the Local Rice Service (LRS), encompasses the data products, modeling solutions, field data, and meteorological data processed at parcel level which are being delivered to local farmers through convenient dissemination tools. Data products for LRS are high resolution seasonal and constant patterns maps, risk maps, and plant development stage maps. Similarly, the Regional Rice Service (RRS) involves the data products derived from satellite images and modeling solutions, and meteorological data processed at regional scale, and delivers them to stakeholders through customized dissemination tools too. In contrast to LRS, where data products are developed to support rice management activities, data products at the regional scale are more oriented towards rice monitoring activities: rice coverage maps, normalized difference vegetation index (NDVI) maps, leaf area index (LAI) maps, phenology maps, meteorological variables maps, and yield risk forecast maps.
This dichotomy of scales—local and regional—and hence the variety of types of data sources, data granularity, data resolution, data fusion and capturing strategies, posed a serious challenge in the design of the ERMES system. In addition, the previously mentioned EO products, field and in-situ data, and model outputs, needed to be rapidly and properly disseminated in order to be useful to end users. From the outset of the project, a “one-size-fits-all” application was not a reasonable option, because of the particular requirements for data integration, analysis, and visualization at these two scales. We therefore opted for designing and developing a set of tools, where each tool is independent but complementary to each other to meet the requirements of both local and regional stakeholders of the rice sector. Furthermore, LRS and RRS are regarded as a combination of various ERMES tools to turn data into advice on how to manage and monitor rice crops better.
2.2. The Ecosystem of ERMES Tools
Several software tools and services have been developed for LRS and RRS. One of the main aims of the project has been the development of automated EO data processing chains to produce personalized data products for stakeholders of the rice sector. New remote sensing analysis algorithms have been developed and encapsulated as reusable software libraries. MODIStsp is an example of a new R package to automatically create raster time series derived from moderate resolution imaging spectroradiometer (MODIS) land products [
33]. Another key tool of the project has been the adaptation of the Water Accounting Rice Model (WARM) modeling solution [
34] for forecasting at local and regional scale. Based on meetings and discussions with stakeholders, we learned that risk and yield forecasts have been proven to be extremely valuable for stakeholders, alerting them in advance about potentially high levels of risks (see [
32] for detailed user assessment activities). Furthermore, integrating forecasts, as result of the modeling solution, with other types of data and sources (field data, EO-derived data products etc.), and making them available in a timely manner is critical to better supporting stakeholders in the management and monitoring of rice crops.
The previously mentioned ERMES tools are key contributions for the two downstream services. Despite their importance, they proved to be, in a practical sense, insufficient on their own to deliver outputs to stakeholders in a easy, accessible and timely manner. Stakeholders, especially non-technologically literate users like local farmers, demand simple and easy-to-use tools to access and visualize maps, products, and data about their parcels or areas of interest. We thus needed to promote robust and flexible tools for reaching, producing impact, and positively affecting stakeholders’ daily activities and practices. Lowering entry barriers is an important factor to encourage the use of a new technology or system [
35], and thus specific ERMES tools were developed to facilitate access and dissemination of the outputs produced by the earlier described tools both at regional and local scale.
User interaction and dissemination tools developed for supporting LRS include the AgriNotebook app [
36], for easing crop and agri-managerial data collection and recording in the field, and the local geoportal, for browsing and visualizing different types of data products at local scale. For the former, field data gathering is important to capture all the nuances of rice cultivation and managerial activities while being in the field, which otherwise are not possible to capture via remote sensing. The AgriNotebook app provides a simple and uniform way to collect information at field scale about agro-practices and crop problems. Contextualized, fine-grained observations gathered by local farmers at parcel level are extremely valuable for diverse reasons. First, these in-situ observations help the crop modeling solution to improve accuracy of crop damage, yield forecasts, and risk alerts at parcel level. Second, farmers benefit from the shared field information, for example for detection of a spreading plague, as farmers can share their observations and make them available to others. Third, as the AgriNotebook app allows recording of all relevant information of the rice cultivation workflow; these observations collected on a regular basis form a “notebook of agricultural tasks” made up of chronological-ordered cultivation practices and activities. Farmers can export their own observations, for example to support legally required reporting of crop cultivation practices. Further details on the scope and technical realization of the AgriNotebook app can be found in [
36].
The local geoportal allows local farmers to visualize, interpret and compare in-situ data, sensor data, scientific simulations and satellite-derived data at the parcel level. The in-situ data consists of the information collected using the AgriNotebook app, along with guest and shared observations. Sensor data mainly consist of processing meteorological data from local weather stations (e.g., rainfall, humidity, temperature, wind speed, solar radiation). These types of data products can be overviewed and compared with historical and basic statistical data. Moreover, results of scientific simulations can also be consulted through the local geoportal (e.g., yield prediction, forecast risk, stage development phases) and received as an alert by email. Finally, local farmers can view the results of the processing chains of satellite images for various purposes, such as rice coverage and field variability.
The dissemination tool developed for the RRS is the regional geoportal. It is a web-based portal developed along the same principles as the local geoportal, but targeting regional authorities and agro-business to help in planning, policy-making, and monitoring of large areas. Technically, the regional geoportal shares components and technology with the local geoportal, but the scope, functionality and subtleties regarding the handling of the involved data sources, make it a quite interesting contribution on its own to the integration, management, and near real-time delivery and presentation of diverse EO products, model outputs, and geospatial data resources on the web.
The regional geoportal is the focus of this paper. The rest of the paper describes its conceptual architecture and implementation, paying special attention to the way the regional geoportal transforms and presents data products in a useful manner to stakeholders. The regional geoportal has been operative since the 2016 rice season to support regional users in three European countries: Italy, Greece and Spain.
3. The Regional Geoportal for Rice Monitoring
The regional geoportal is the visible face of the RRS, one of the two downstream services developed in the ERMES project. The scope and role of geoportals in general have been widely discussed in the literature [
23,
24]. Tait ([
23] p. 34) defined geoportal as “a web site that presents an entry point to geographic content on the web or, more simply, a web site where geographic content can be discovered”. Maguire et al. [
24] described geoportal as a gate through which searching and discovery of geospatial content and services such as directories, search tools, community information, support resources, data and applications will become possible. As such, the regional geoportal acts as an entry point to browse, access, and visualize a large array of data products, along with specific features to extract valuable bits of information from such products, and summarize and visualize them to meet stakeholders needs. One of the key aspects of the regional geoportal compared to traditional geoportals is the (quasi-)streaming support: the ability to shorten as much as possible the process of transforming recently-acquired satellite data and other data resources into convenient data products ready to be delivered to stakeholders. As soon as new data products are generated, they are smoothly made available through the regional geoportal in near real-time. This requires having a series of automated components in place to support the continuous flow of incoming data, which are explained in
Section 3.2.
Another defining characteristic of the regional geoportal is the simple and focused user interface. Taking into account the spectrum of targeted users, we intentionally did not seek to export the traditional GIS interfaces, often full of never-used features, into a web-based tool. Indeed, regional stakeholders are experts in the rice sector; they do figure out data products and know how to interpret the temporal trends of a phenomena or variable, yet they are often not expert GIS users, accustomed to fully-fledged desktop-based GIS interfaces. To conveniently support them, while at the same time allowing efficient use of the tool, our challenge for designing the user interface of the regional geoportal was to offer access to all features over data products in two clicks. Streamlining the direct use and user experience in this way came at the expense of avoiding common GIS functions available in desktop environments and other web geoportals. One take-away lesson is that a user usually evaluates what (s)he sees on the screen, i.e., (s)he is not interested in the technical and scientific novelty and complexity behind the user interface. That is why the success for a geoportal application (or any application in general) depends on offering the right set, no more no less, of much-needed features to users. We revisit this key aspect in
Section 3.3.
3.1. Overall Conceptual Architecture
Before explaining the design and implementation details of the regional geoportal, we first review the overall conceptual architecture of the ecosystem of ERMES tools, and point out where the regional geoportal resides.
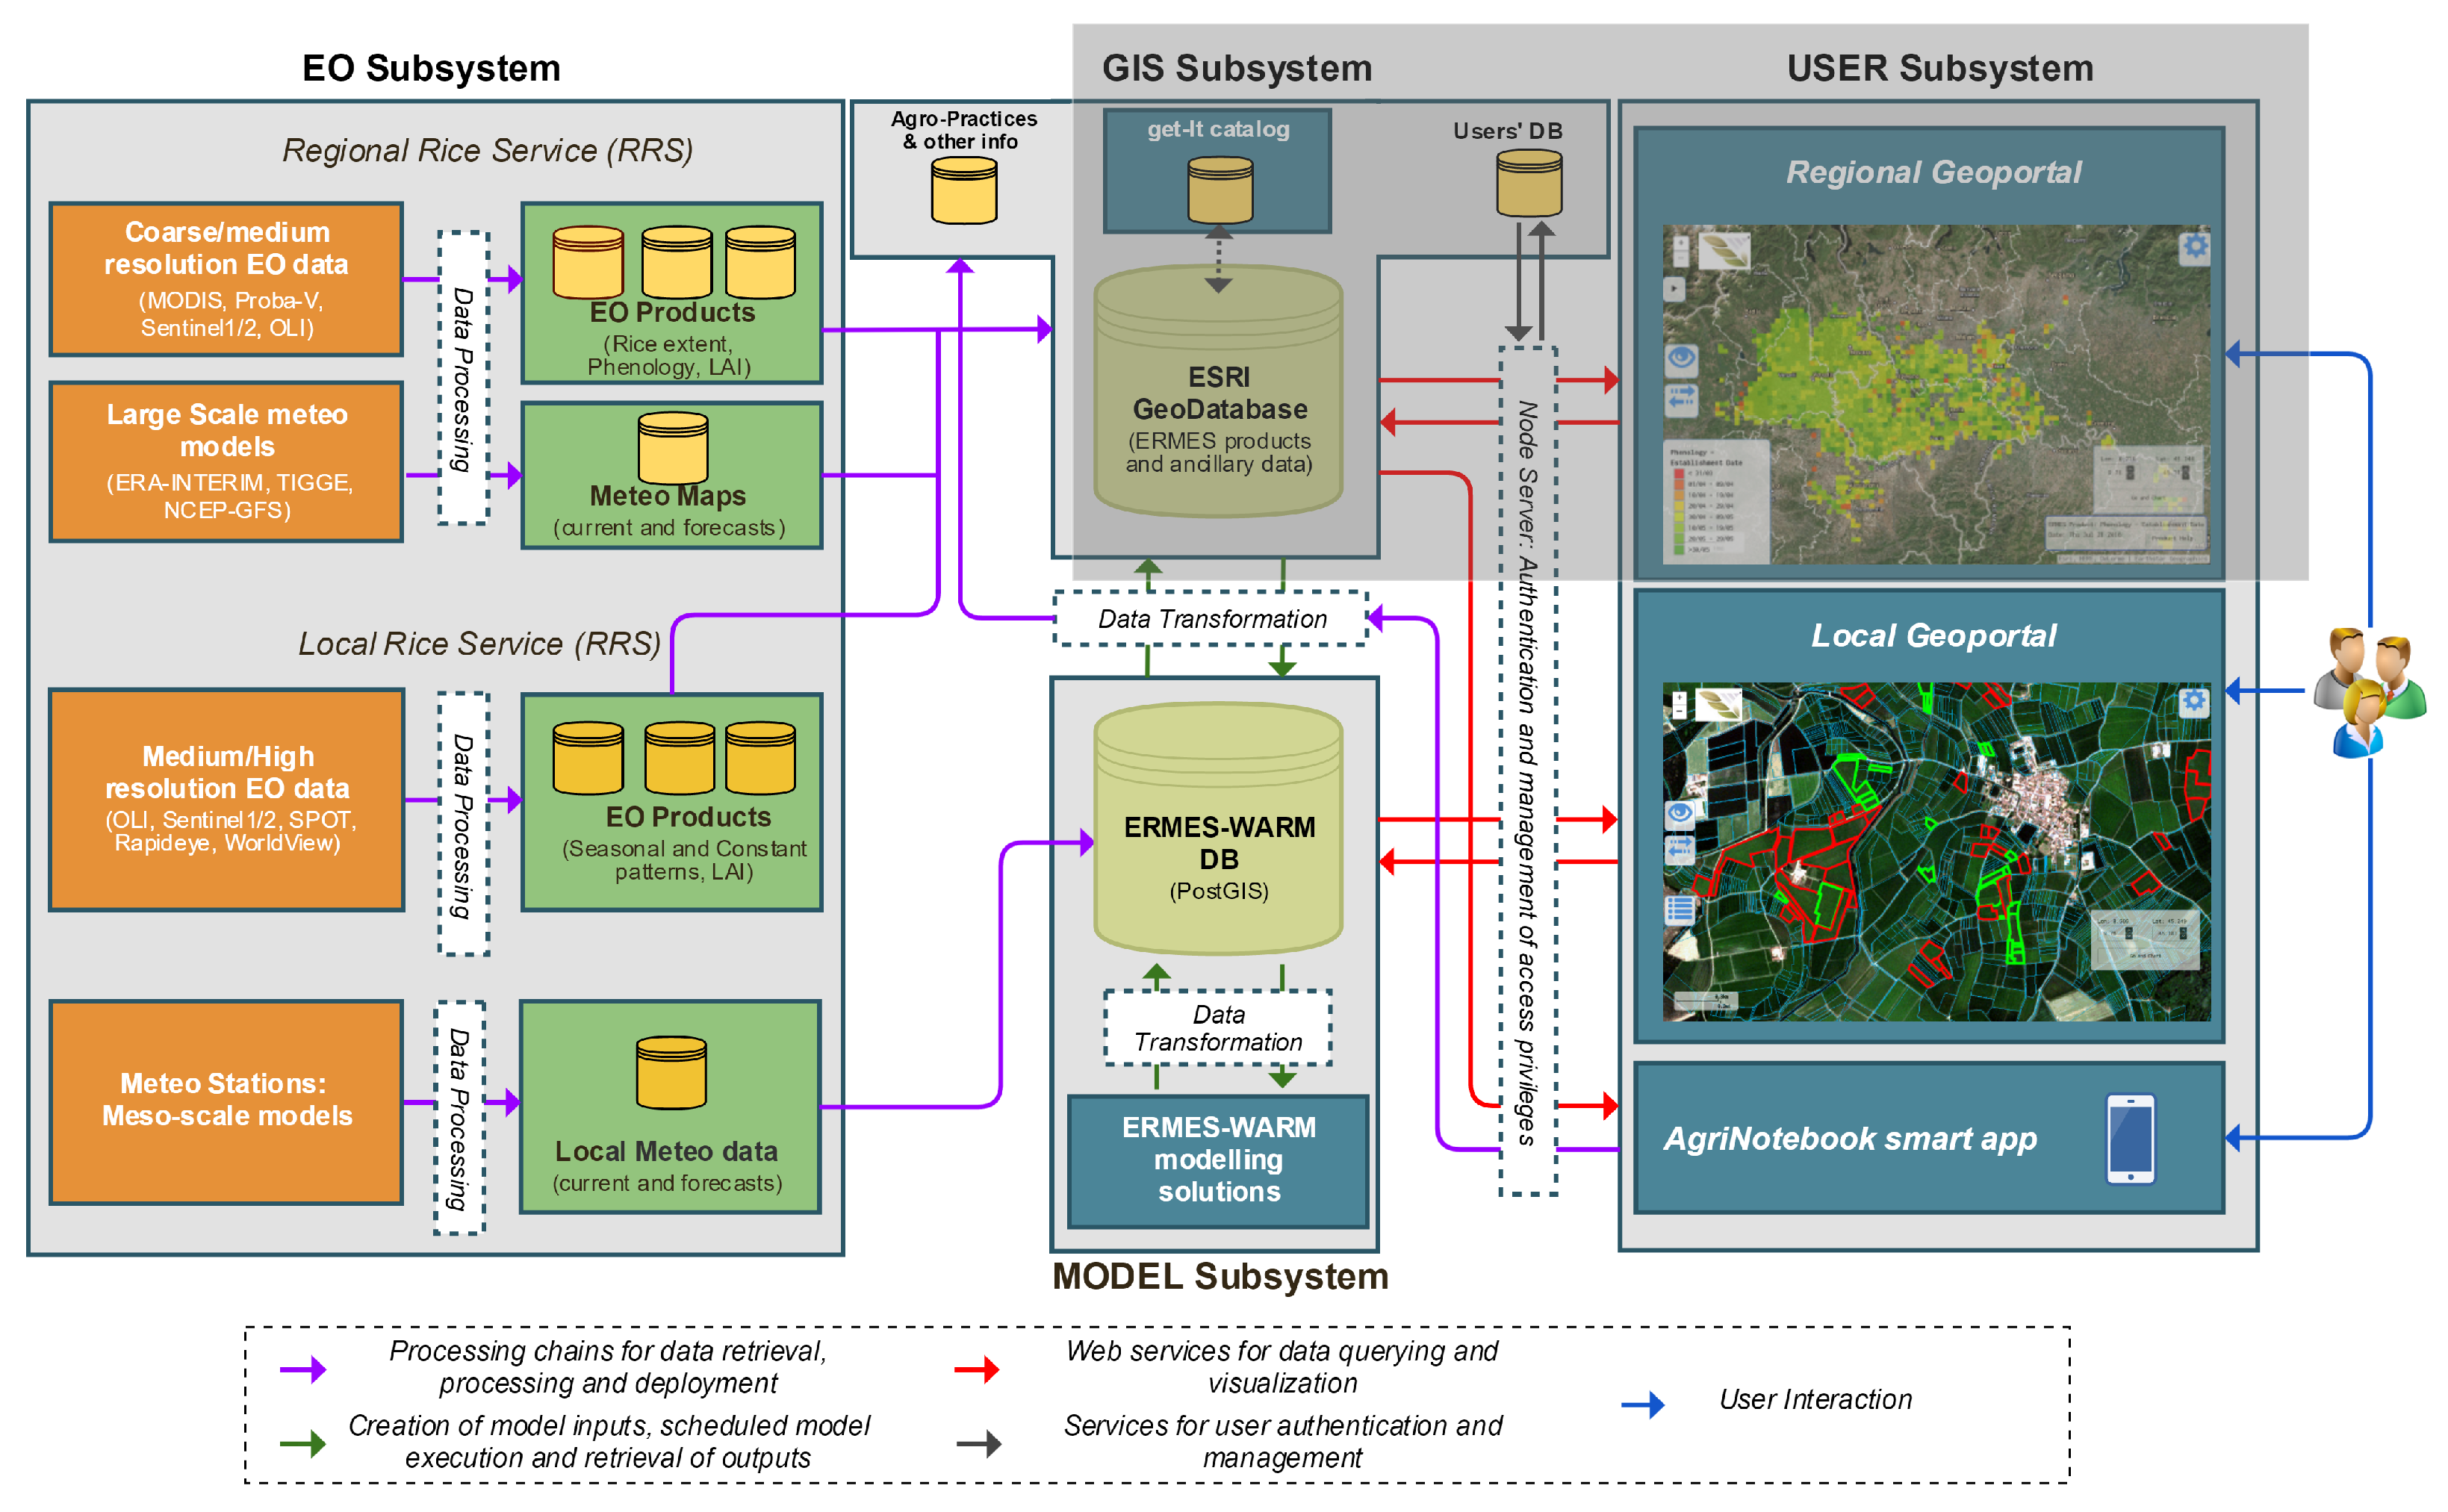
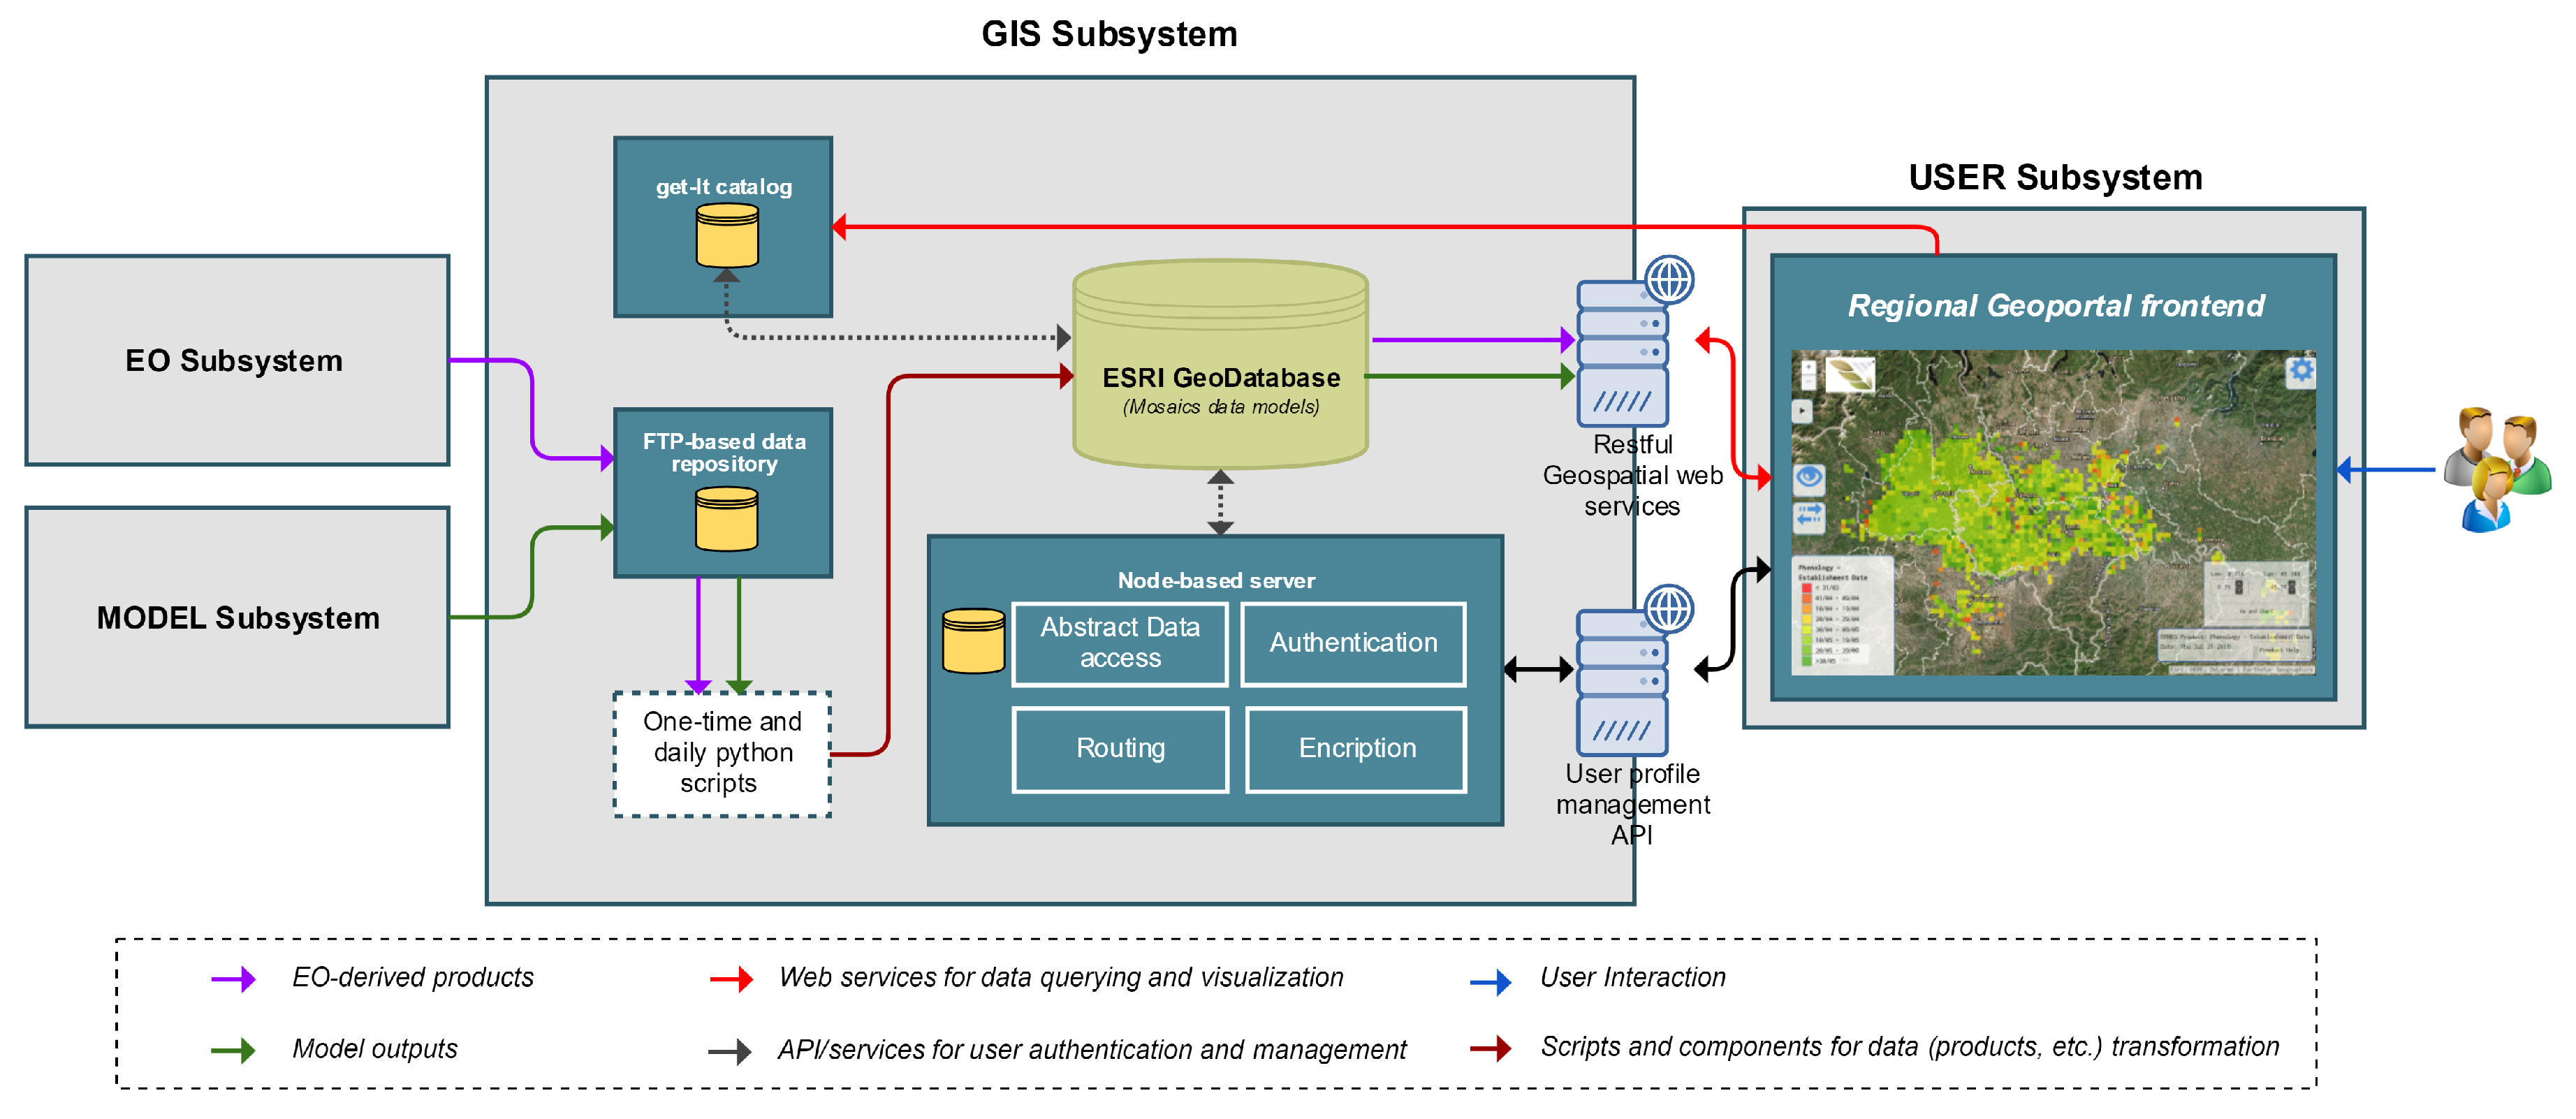
Figure 1 shows the conceptual architecture that contains four subsystems, as follows [
32]:
The Earth observation (EO) subsystem encapsulates all the required activities to acquire EO and remote sensing data, processes them into ERMES data products, and validates resulting products to support sustainable rice cultivation practices and management;
The model subsystem encapsulates the scientific crop modeling solutions and the required data management activities to run models at regional and local scales;
The GIS subsystem comprises all the required geospatial data management, processing scripts and web services, along with user management services to enable the development of a range of dissemination tools and client applications;
The user subsystem refers to client applications (i.e., front-end geoportals and data collection tool) that let end users interact with the capabilities of the ERMES system.
The four subsystems were designed to work and scale independently. As such, communication interfaces were chosen to mitigate dependence between subsystems and foster encapsulation and isolation. Nevertheless, we decided to set up distinct types of communication interfaces depending on the subsystems involved. The rationale to do so was based on maximizing performance for exchanging data between subsystems, since near real-time streaming was a defining feature of the ERMES system.
RESTful service endpoints were used between the GIS and user subsystems. Built on the principles of service-oriented architecture, this configuration allowed us to create as many types of client applications (as part of the user subsystem) as needed by keeping the communication interface with the GIS subsystem invariable. In the particular case of the regional geoportal, the size of exchanged data between GIS and user subsystems permitted the use of RESTful communication interfaces. For other subsystems, though, transferring huge data files posed serious limitations to using hypertext transfer protocol (HTTP)-based light-weight interfaces. Very-high resolution (VHR) data products at local scale, for instance, are of considerable size (the order of gigabytes), which forced us to use a robust communication protocols instead. Therefore, we set up a ftp-based data repository as a communication interface to bridge the EO and model subsystems with the GIS subsystem. In summary, it seems unrealistic to assume that every subsystem and data source fits into a single communication interface. Because of the particular requirements of the overall ERMES system and the heterogeneity of sources and data used, we therefore opted for multiple communication interfaces where appropriate.
The GIS and user subsystems are relevant for the regional geoportal (see
Figure 1). Indeed, the GIS subsystem contains the server-side of the regional (and local) geoportal (
Section 3.2), while the front-end part of the regional geoportal (
Section 3.3) belongs to the user subsystem. For the GIS subsystem, the EO and model subsystems are seen as black boxes providing an array of (incoming) data products to the GIS subsystem. Here, we assumed that the GIS subsystem gets a continuous flow of data products coming from these two subsystems. How such products are transformed and generated is beyond the scope of the paper (see [
37,
38] for detailed processing chains for the creation of the expected ERMES data products). The point is that the GIS subsystem acts as a data integration hub to conveniently disseminate and deliver varied and relevant data products to stakeholders.
3.2. Server-Side Components and Implementation
Like most service-oriented developments, e.g., [
25,
26,
29,
39], the regional geoportal involves a web client tool, and a series of components, data models and web services at the server side (
Figure 2). The internal details of the server-side components are explained next.
3.2.1. Data Organization: Mosaic Data Models
Data organization is an important aspect of building up the spatial data content repository of the GIS subsystem, and today’s best known GIS systems, QGIS (
http://www.qgis.org) and ESRI ArcGIS (
https://www.arcgis.com/) are both capable of working with a variety of underlying storage technologies, both open source and commercial.
For the former, PostgreSQL with the PostGIS extension is a representative example for raster and vector data storage, while commercial examples include back-end databases systems (with or without spatial extensions) such as the Oracle, Microsoft SQL Server, and ESRI geodatabases. In particular, ESRI’s geodatabase technology supports working as a proprietary file-based system or against existing back-end databases systems such as Oracle, SQL Server or PostgreSQL/PostGIS. As the model and EO subsystems communicate with the GIS subsystem via an ftp-based data repository, incoming data sets and products are organized in a well-defined folder structure, which fits pretty well with the file-based system capabilities of the ESRI file geodatabase (
http://desktop.arcgis.com/en/arcmap/10.3/manage-data/administer-file-gdbs/file-geodatabases.htm). This technology is therefore an excellent candidate for building a geospatial database, which logically links to the ERMES data products physically stored in the ftp-based data repository.
The folder structure and file-naming convention of data products stored in the ftp-based repository are key to enabling a smooth, automated data flow from data providers to dissemination tools. The root folder is divided into five main sub-folders in which data products related to each country are stored (see
Table 1). For example, sub-folder “IT/IT_EP_L4_LAI/2016/OLI/” contains time series of LAI maps for 2016 derived from the sensor OLI (Landsat Operational Land Imager). Each contained file is named as “IT_LAI_OLI_2016_145.tif”, where 145 corresponds to the day of year (DOY) of production. As such, folders and products names follow an strict naming convention which permit relying on scripts to automating data flow processing.
Time-series data products are central to the regional geoportal. Data products related to phenology, LAI, and NDVI are in fact a series of raster files covering the same area over a period of time. In order to account for this repetitive pattern, we explored diverse data models optimized for handling sets of raster data files as a whole. Experiments pointed out that ESRI’s mosaic data model was a very convenient schema for our purpose. In short, a mosaic data model can be seen as a catalog of related raster data files. A mosaic was originally designed to combine raster files that slightly spatially overlap in order to create a greater coverage area than that of the individual raster files, producing a mosaicked map as a result of combining the coverage area of the contained raster files. Even though such default behavior does not meet our requirements, the mosaic data model can also be used for temporally combining raster files that cover the same area but differ in the acquisition date (temporal dimension), which is the scenario of the regional geoportal.
The simplification of development and maintenance tasks is a key aspect in the organization of geodatabases and mosaics. We followed a hierarchical structure to relate geodatabases, mosaics and counterpart web services. We created a single geodatabase per country and year (i.e., crop season). For instance, one geodatabase contains all data products and resources related to the Italian study area for the 2016 season. The same occurs for the Spanish and Greek areas. For each geodatabase, we defined mosaic data models per type of data product. Yet each type of data product (e.g., LAI, NDVI) may have more than one data series associated. For instance, the NDVI data product has two data series, one for the current season (e.g., year 2016) and another for long-term average data (e.g., years 2003–2015). However, other data products have three data series. Weather parameter products are organized into three mosaics: current seasonal data, long-term average data, and one-week forecast. The benefit of designing mosaic data models at finer granularity are two-fold. First, web service development and updating, as explained later on, is significantly simplified as each mosaic is associated with only one web service. Second, potential problems and issues are isolated to pairs of mosaic-service, resulting in simplified and more selective maintenance operations and scripts for efficiently updating and keeping mosaics and services synchronized.
3.2.2. Data Access and Retrieval: Geospatial Web Services
Geospatial web services allow client applications to discover, access, and visualize spatial data, an essential tenet in spatial data infrastructures [
40,
41]. Geospatial web services are the visible part of the GIS subsystem with respect to the front-end of the regional geoportal (i.e., user subsystem). The types of services we used were map service, feature service, and image service. Image services are extensively used to publish ERMES data products, because they are specially designed for supporting temporal series of raster data files organized as mosaics, which are our data model of choice, as described earlier (see
Section 3.2.1). In short, image services deliver maps to client applications for analysis and/or visualization. For the regional geoportal, our discussion is mostly focused on data visualization, even though we mention below temporal queries to process multiple mosaics to return arrays of data series for charting.
Public instances of image services are publicly available in the services directory web page, which is an entry point for discovery of all services deployed in the GIS subsystem. Services are running on ArcGIS for Server and follow the ArcGIS Server Representational State Transfer application programming interface (REST API) specification (
http://resources.arcgis.com/en/help/rest/apiref/). For visualization, data products are rendered at the server side and delivered to client applications as image maps. This means that users cannot perform any image analysis on the client side. Alternatively, the regional geoportal provides a direct link to the online catalog (
http://get-it.ermes-fp7space.eu/), one of the ERMES tools, to get further meta data information about the data product that’s being visualized. Through the catalog tool, users can download each data product in multiple formats, and even the source data for analysis in their local GIS environments.
Image services are also used for light-weight analysis. Instead of getting rendered images, image services are queried to get arrays of data series (actual pixel value), which are inputted in the front-end application of the regional geoportal to generate on the fly temporal profiles of data products as visual charts (see
Section 3.3 for technical realization of temporal profile charts and
Section 4 for examples). Temporal profile charts are useful for users to compare the current trend of a phenomenon (temperature, solar radiation, NDVI, etc.) to its long-term average data. In case of daily generated data like weather parameter products, each query may process at the end of a season 700+ raster files. Such temporal queries benefit from the underlying mosaic data model to efficiently traverse hundreds of raster files to get the corresponding pixel value for each raster file contained in the mosaic.
3.2.3. Data Processing: Scripts for Deployment of Data Flows
Data products are generated at different rates. Weather parameter maps (e.g., air temperature, solar radiation) and risk maps derived from models are generated on a daily basis. NDVI or LAI maps roughly follow a weekly pattern, while other types of maps are created once or twice a year (e.g., rice crop maps) or at specific periods of the season (e.g., phenology maps). This irregular temporal pattern for incoming data products poses a challenge in order to deliver data in near real-time to end users. As soon as new data come in, it should immediately be made available through the regional geoportal. Data processing scripts are therefore needed to convert a series of data products into mosaic data models, and then into the counterpart web-based image services in an automated manner.
These data processing scripts reside in the GIS subsystem and are developed in Python scripting for ArcGIS, which is a python library to programmatically access and manipulate resources and entities deployed on ArcGIS Server instances. File geodatabases and mosaic data models can be fully managed via dedicated python scripts. Furthermore, a series of scripts were developed to automate the data repository-mosaic-service pipeline, i.e., to improve the data flow from the ftp-based data repository, to mosaics and to services. In particular, we created two types of scripts. One-time scripts are executed once at the beginning of the season and are tasked with the creation of instances of file geodatabases for each study area, the creation of instances of mosaic data models for all required data products, and populating only those mosaics that correspond to long-term average data, which thereafter do not change anymore. Counterpart image services for each mosaic data set are also instantiated via scripting.
While one-time scripts allowed us to build the required infrastructure for the data repository-mosaics-services pipeline to function, mosaic data models needed to be updated on a regular basis (depending on the incoming rate for each data products) during a season. The second type of scripts are executed on a daily basis during the season, and are synchronized with the arrival of data products in the ftp-based data repository. These daily scripts thus scan any incoming data from the ftp-based data repository, and update mosaic data models accordingly with new arrivals. Counterpart image services get automatically synchronized as the mosaic data models change. Ensuring the rapid update of the mosaic data models is thus fundamental to accelerate the delivery of new data products to stakeholders in a timely manner.
3.2.4. Data Management: User Profiles Service
Within the GIS subsystem, there exist other components and tools that provide additional services to enable a smooth delivery of data products to individual users. A central component shared by the local and regional geoportals and the AgriNotebook app is the user profile management service. It is a server-side service (within the GIS subsystem, see
Figure 2) that centralizes user authentication, security and user profile management. As such, it exposes convenient public methods based on a RESTful communication interface to interact with all ERMES client applications. While user profiles for the regional scenario are relatively simple and only store basic information (e.g., study area, user name, contact information), they get more complex for local scenarios, as local user profiles need to store additional information (e.g., list of parcels for each individual, certain field information such as last position).
In order for the user profile management service to stay synchronized, support concurrency, and scale up properly, the technology of choice was Node.js [
42]. One of the most relevant features of Node.js is the way in which multiple requests are handled. Other alternatives use concurrency models based on threads, making development and maintenance tasks more time consuming, cumbersome, and complex, as the developer is directly tasked with the management of concurrent processes. In contrast, Node.js uses an asynchronous model that ensures that many connections at the same time will be properly handled.
Even though it seems to play a secondary role in the GIS subsystem, the user profile management service is vital to securely supporting communications between client applications in the user subsystem and the geospatial web services in the GIS subsystem. That is why, despite the inherent advantages of Node.js described earlier, we integrated third-party libraries and modules into Node.js to ensure that exchanged information is handled in a safe way by all client applications:
A routing module simplifies the mapping of public service endpoints to actual resources stored in the server. The Express.js library [
43] has been integrated into Node.js to ease routing.
The data access module is used to agnostically connect the back-end database for user data with the Node.js server. In order to abstract from the current implementation of the user database (PostgreSQL), we rely on the Sequelize library [
44]. In Sequelize, data access and manipulation queries are encoded in object relation mapping (ORM), which can be mapped to distinct implementations of database languages. As Sequelize makes use of JavaScript promises, it natively supports asynchronous and unblocking create, read, update and delete (CRUD) operations against back-end databases.
The user/password management module aims to carry out user authorization and authentication processes. The Passport library [
45] alleviates this by implementing different strategies that notably simplify the development of security tasks.
Encryption module adds a greater level of privacy by encrypting sensitive user information. We used the JavaScript implementation of Bcrypt [
46] for Node.js, which comes with a password hashing function for data encryption. Privacy is not a secondary aspect in the ERMES system, especially at local level where personal information about farmers and their parcels are transferred between the user and GIS subsystems.
3.3. Client-Side Components and Implementation
The server-side components and services provide data storage, transformation and dissemination processes to deliver products to users. However, a crucial aspect is the way such data products are prompted and presented to end users. One of the challenges of the ERMES project was to come up with a simple yet effective user interface to turn the wealth of data products into useful visualizations targeting distinct types of stakeholders. Two main requirements drove our design and implementation strategies with respect to the user interface of the regional geoportal. On one side, as already pointed out in
Section 2, the audience of the regional geoportal mostly includes public authorities (e.g., regions, municipalities, environmental protection agencies, etc.) in charge of monitoring the agricultural system, developing, supporting and implementing agro-policies, and providing information (e.g., bulletins) to local farmers concerning, for example, potential risks or best-practices for cultivation. These types of users are domain experts but often do not posses the required skills to be considered advanced users of traditional desktop-based GIS interfaces. We sought to distinguish essential and dispensable features, in order to offer a minimalist, clean but fully functional application user interface according to end users’ needs. We hereby strived to make all functionality available in two clicks. The second requirement was standardization, in terms of using widely-used web and geospatial technologies and data formats, so that the regional geoportal exhibits maximum cross-platform and -browser compatibility (e.g., desktop, mobile devices).
The essential features of the front-end of the regional geoportal application were designed as independent modules, fostering software encapsulation and independence. Each single module supports a feature. Rice monitoring is the overall aim of the regional geoportal, which is implemented through the following modules:
Product visualization: allows visualizing data products in the form of raster maps. Based on a thematic and temporal selection (e.g., NDVI, 7 January), the client application queries the corresponding geospatial web service (and mosaic) to obtain the requested map. Users are also provided with a time slider control to easily analyze changes in multi-temporal products. Using this control, for example, the series of NDVI raster images of the current season can be automatically displayed on a time-step basis.
Product comparison: a couple of screen-split features allow comparing different products. By comparing in Swipe mode, the resulting visualization is dynamic in the sense that a movable vertical bar appears to support interaction; users can shift it right or left to inspect visible changes of two products on the same area. This feature is helpful to check the temporal evolution of a product, for example comparing two NDVI maps taken in January and May, or to interpret the interaction between different products at the same location. Technically, the Swipe mode feature is based on the ESRI SwipeLayer widget (
https://developers.arcgis.com/javascript/3/jssamples/widgetswipe.html). The other way to compare two products is the
Split mode. In this case, the screen is split in two, and in each area an independent instance of the regional geoportal is launched, allowing the user to independently browse and interact with each instance.
Data charting: allows generating and visualizing graphs showing time series of a selected parameter (e.g., NDVI, LAI, air temperature) for a selected point. When a user selects a point on a NDVI raster image, a line chart is shown, covering the entire temporal series for that point. Long-term average data series of the same parameter are also shown, allowing visual detection of anomalies. For the case of meteo data products, one-week forecast data is also shown and highlighted. We used the Dygraph library [
47] to generate temporal profile charts by leveraging the HTML5 Canvas object [
48].
Exporting and downloading: a snapshot of the current map view in the regional geoportal can be exported as a PDF file including its map legend and general information about the ERMES project. Raw data series of temporal charts can also be downloaded in comma-separated value (CSV) format for further statistical analysis, and graphic charts can be exported and downloaded as image files in PNG (Portable Network Graphics) format for subsequent reporting and documentation (e.g., to include them in bulletins).
Other features are not directly related to rice monitoring tasks but make users’ life easier. Multilingual support (English, Spanish, Italian and Greek) was a necessity to attract regional and local users who often only speak their mother tongue. Map navigation is enhanced by a self-developed Locator widget that given a pair of coordinates jumps to the exact map location, and saves them. Users can thus restore the previously saved coordinates, for example to inspect the same location while visualizing distinct data products.
The front-end of the regional geoportal is an integrator of web technologies. Some of them are well-established web standards, while others are third-party JavaScript libraries for specific purposes. The couple JavaScript/HTML5 was the preferred choice for client side development (see
Table 2), but JavaScript was also employed in the server side for building the Node.js server (
Section 3.2.4).
4. Results: Case Studies
The regional geoportal was incrementally implemented to run pre-operationally during the 2015 rice growing season. We showcased it to end-users in a series of presential workshops in the three countries, to continue refining and tuning preliminary data products, services and interactiveness of the regional geoportal. The whole ERMES system, including the regional geoportal, was fully operational and tested during 2016 for monitoring the European rice growing season. Next, we highlight some significant products and results disseminated through the regional geoportal for monitoring the rice season at regional scale in the three study areas during 2016, paying special attention to how end users used and benefited from it.
4.1. Study Areas
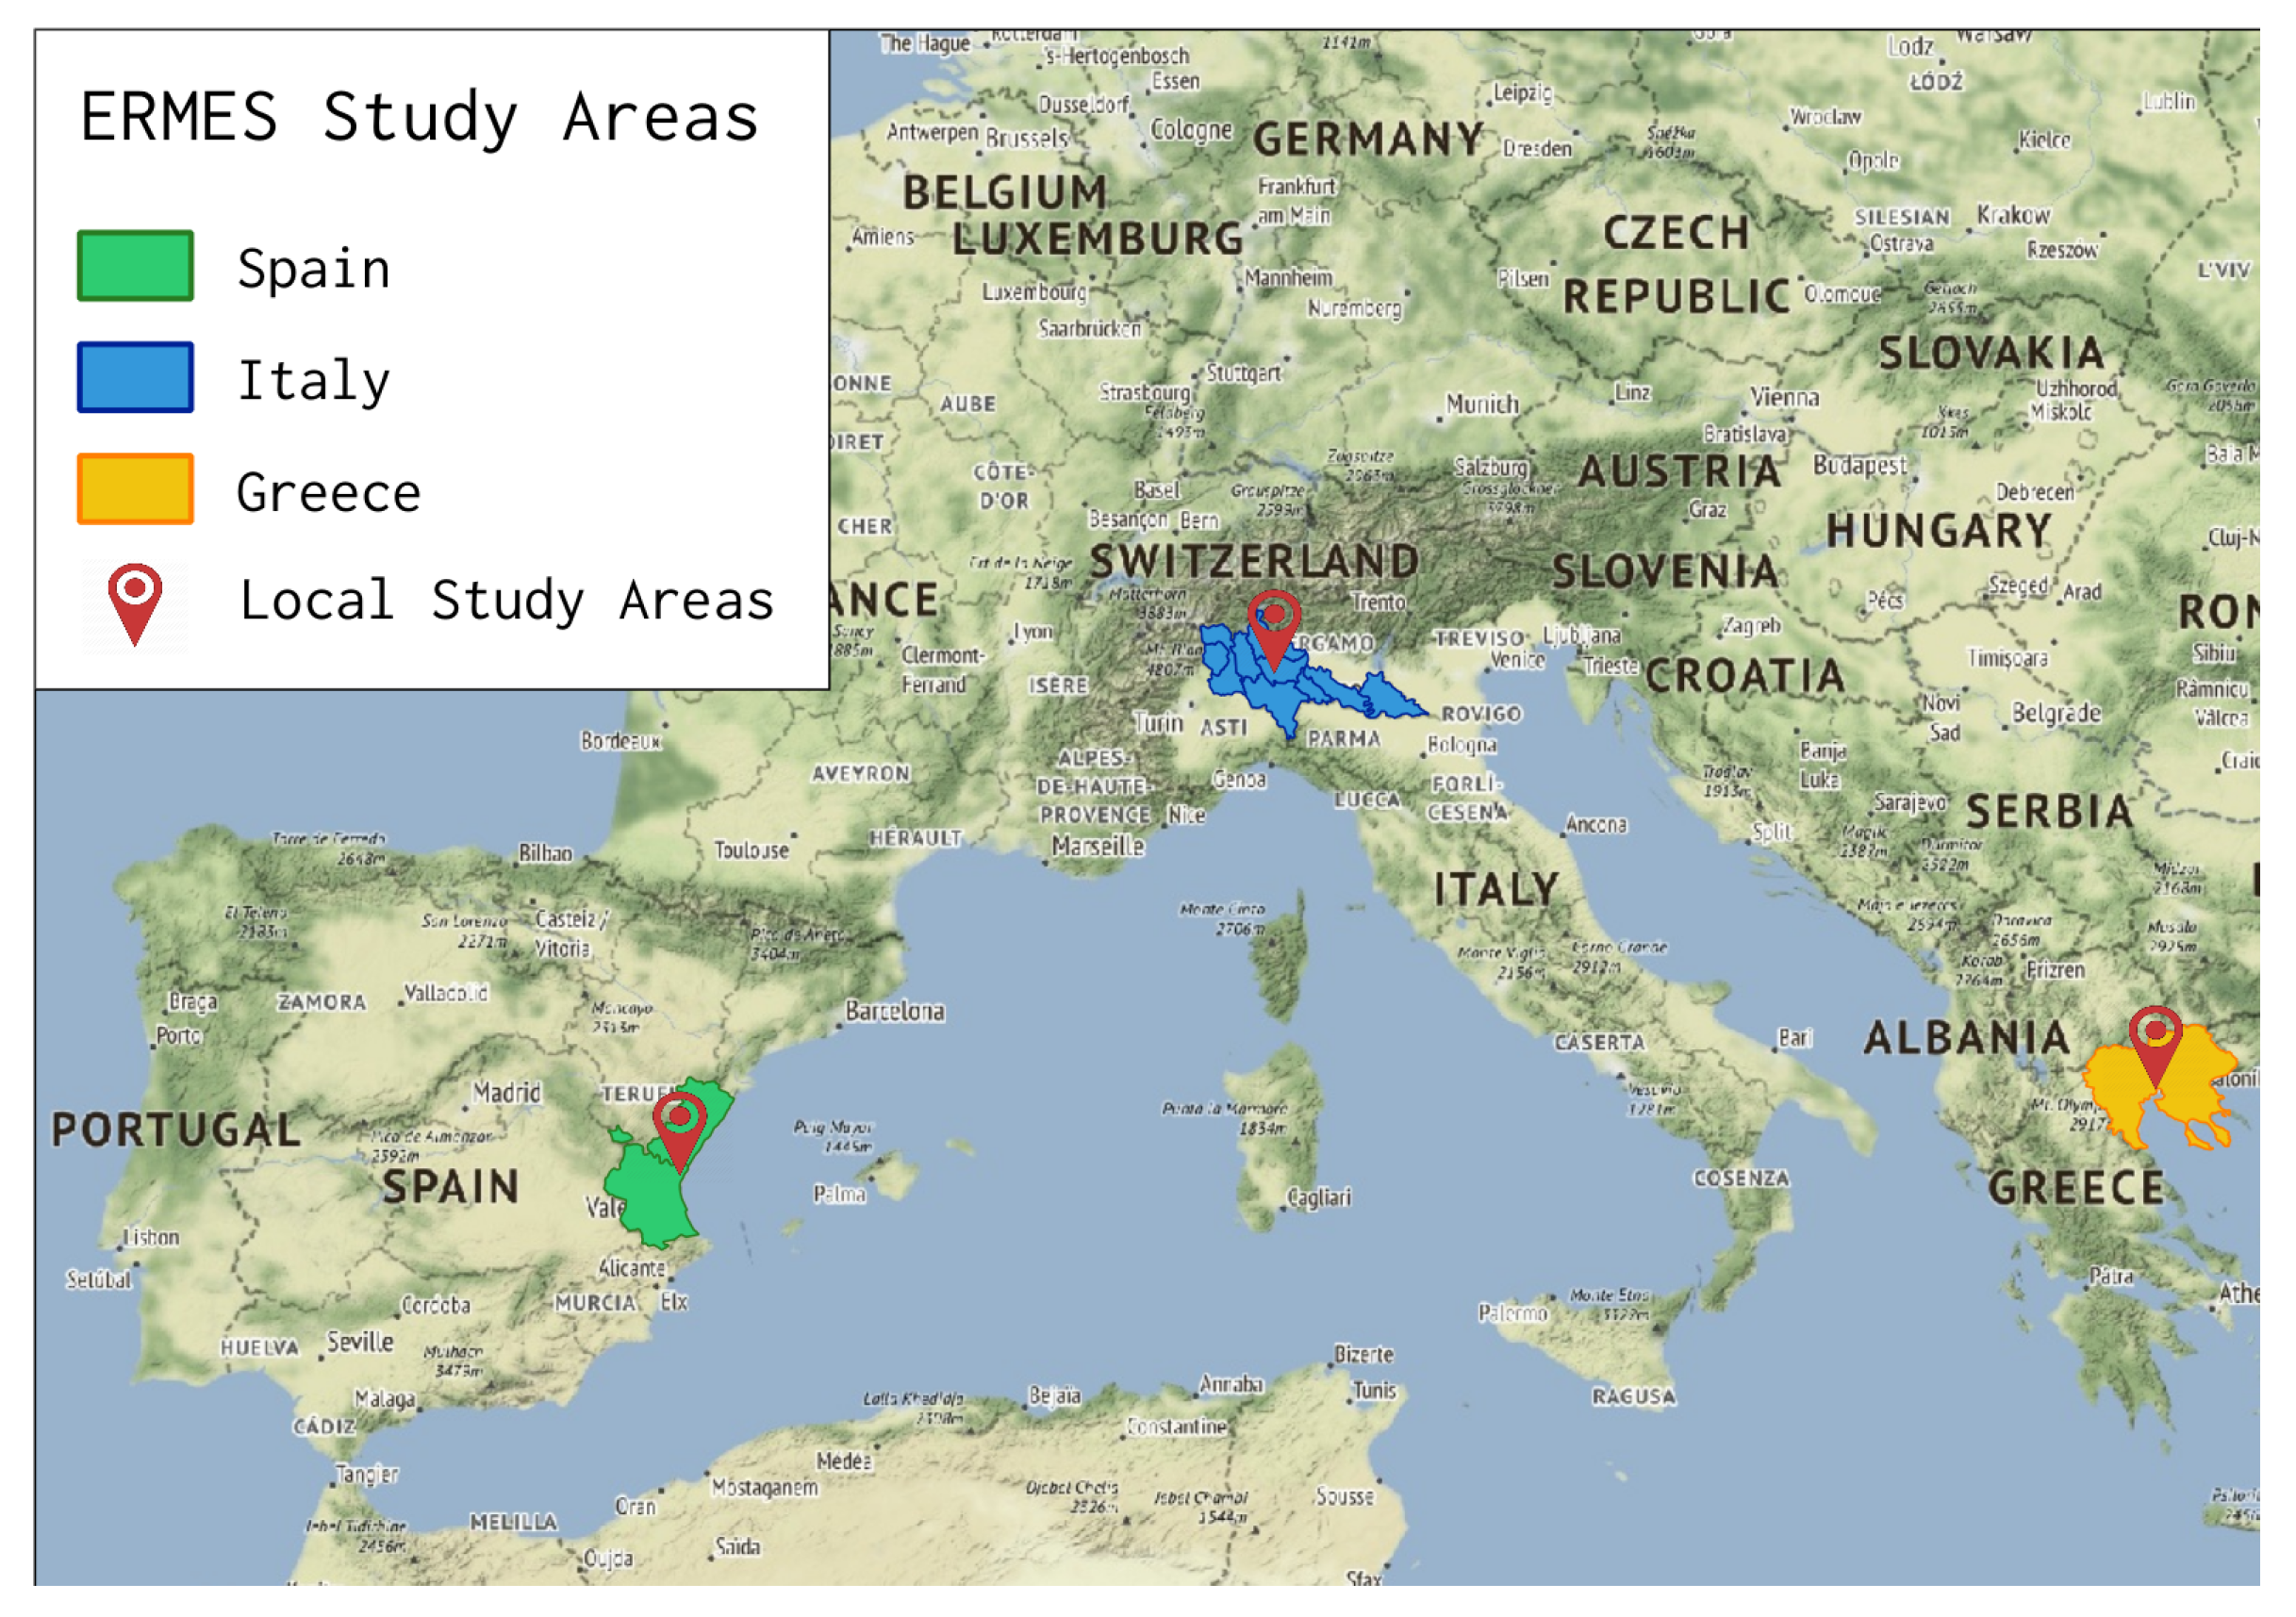
ERMES study areas were selected in three Mediterranean countries, responsible for about 85% of total European rice production: Italy (51.9%), Spain (26.1%) and Greece (7.0%) [
49]. In each country, both a regional and a local study area were defined (
Figure 3). We refer here to the regional study areas.
The Italian study area corresponds to the rice district of Lombardy and Piedmont, located in the Po River alluvial plain between the Provinces of Milano, Pavia, Vercelli and Novara. Rice cultivation in the area covers about 200,000 ha, accounting for 90% of Italian and 45% of European rice production. The Greek study area includes the two main rice cultivation districts of the country, Thessaloniki (180,000 ha) and Serres (4000 ha), adding up to almost 75% of Greek rice-cultivated surface. The Spanish study area is situated at the east Mediterranean coast, and comprises two of the largest rice districts of Spain, namely the Natural Park of Albufera (near Valencia), and the Ebro river delta, adding up to about 35,700 ha of rice cultivated area (about one-third of total Spanish rice area).
4.2. The Regional Geoportal at Work
As described in previous sections, the regional geoportal allows visualization of data products and maps related to rice crop distribution, phenology dynamics, LAI/NDVI development, daily weather variables and forecasts, and risk of rice blast infection occurrence with Pyricularia oryza, one of the rice pathogens in Europe with the most impact. Temporal profile charts allow users to visualize time series of selected variables on a specific point (location), and compare them with long-term averages to better identify if anomalous situations are occurring during the crop season.
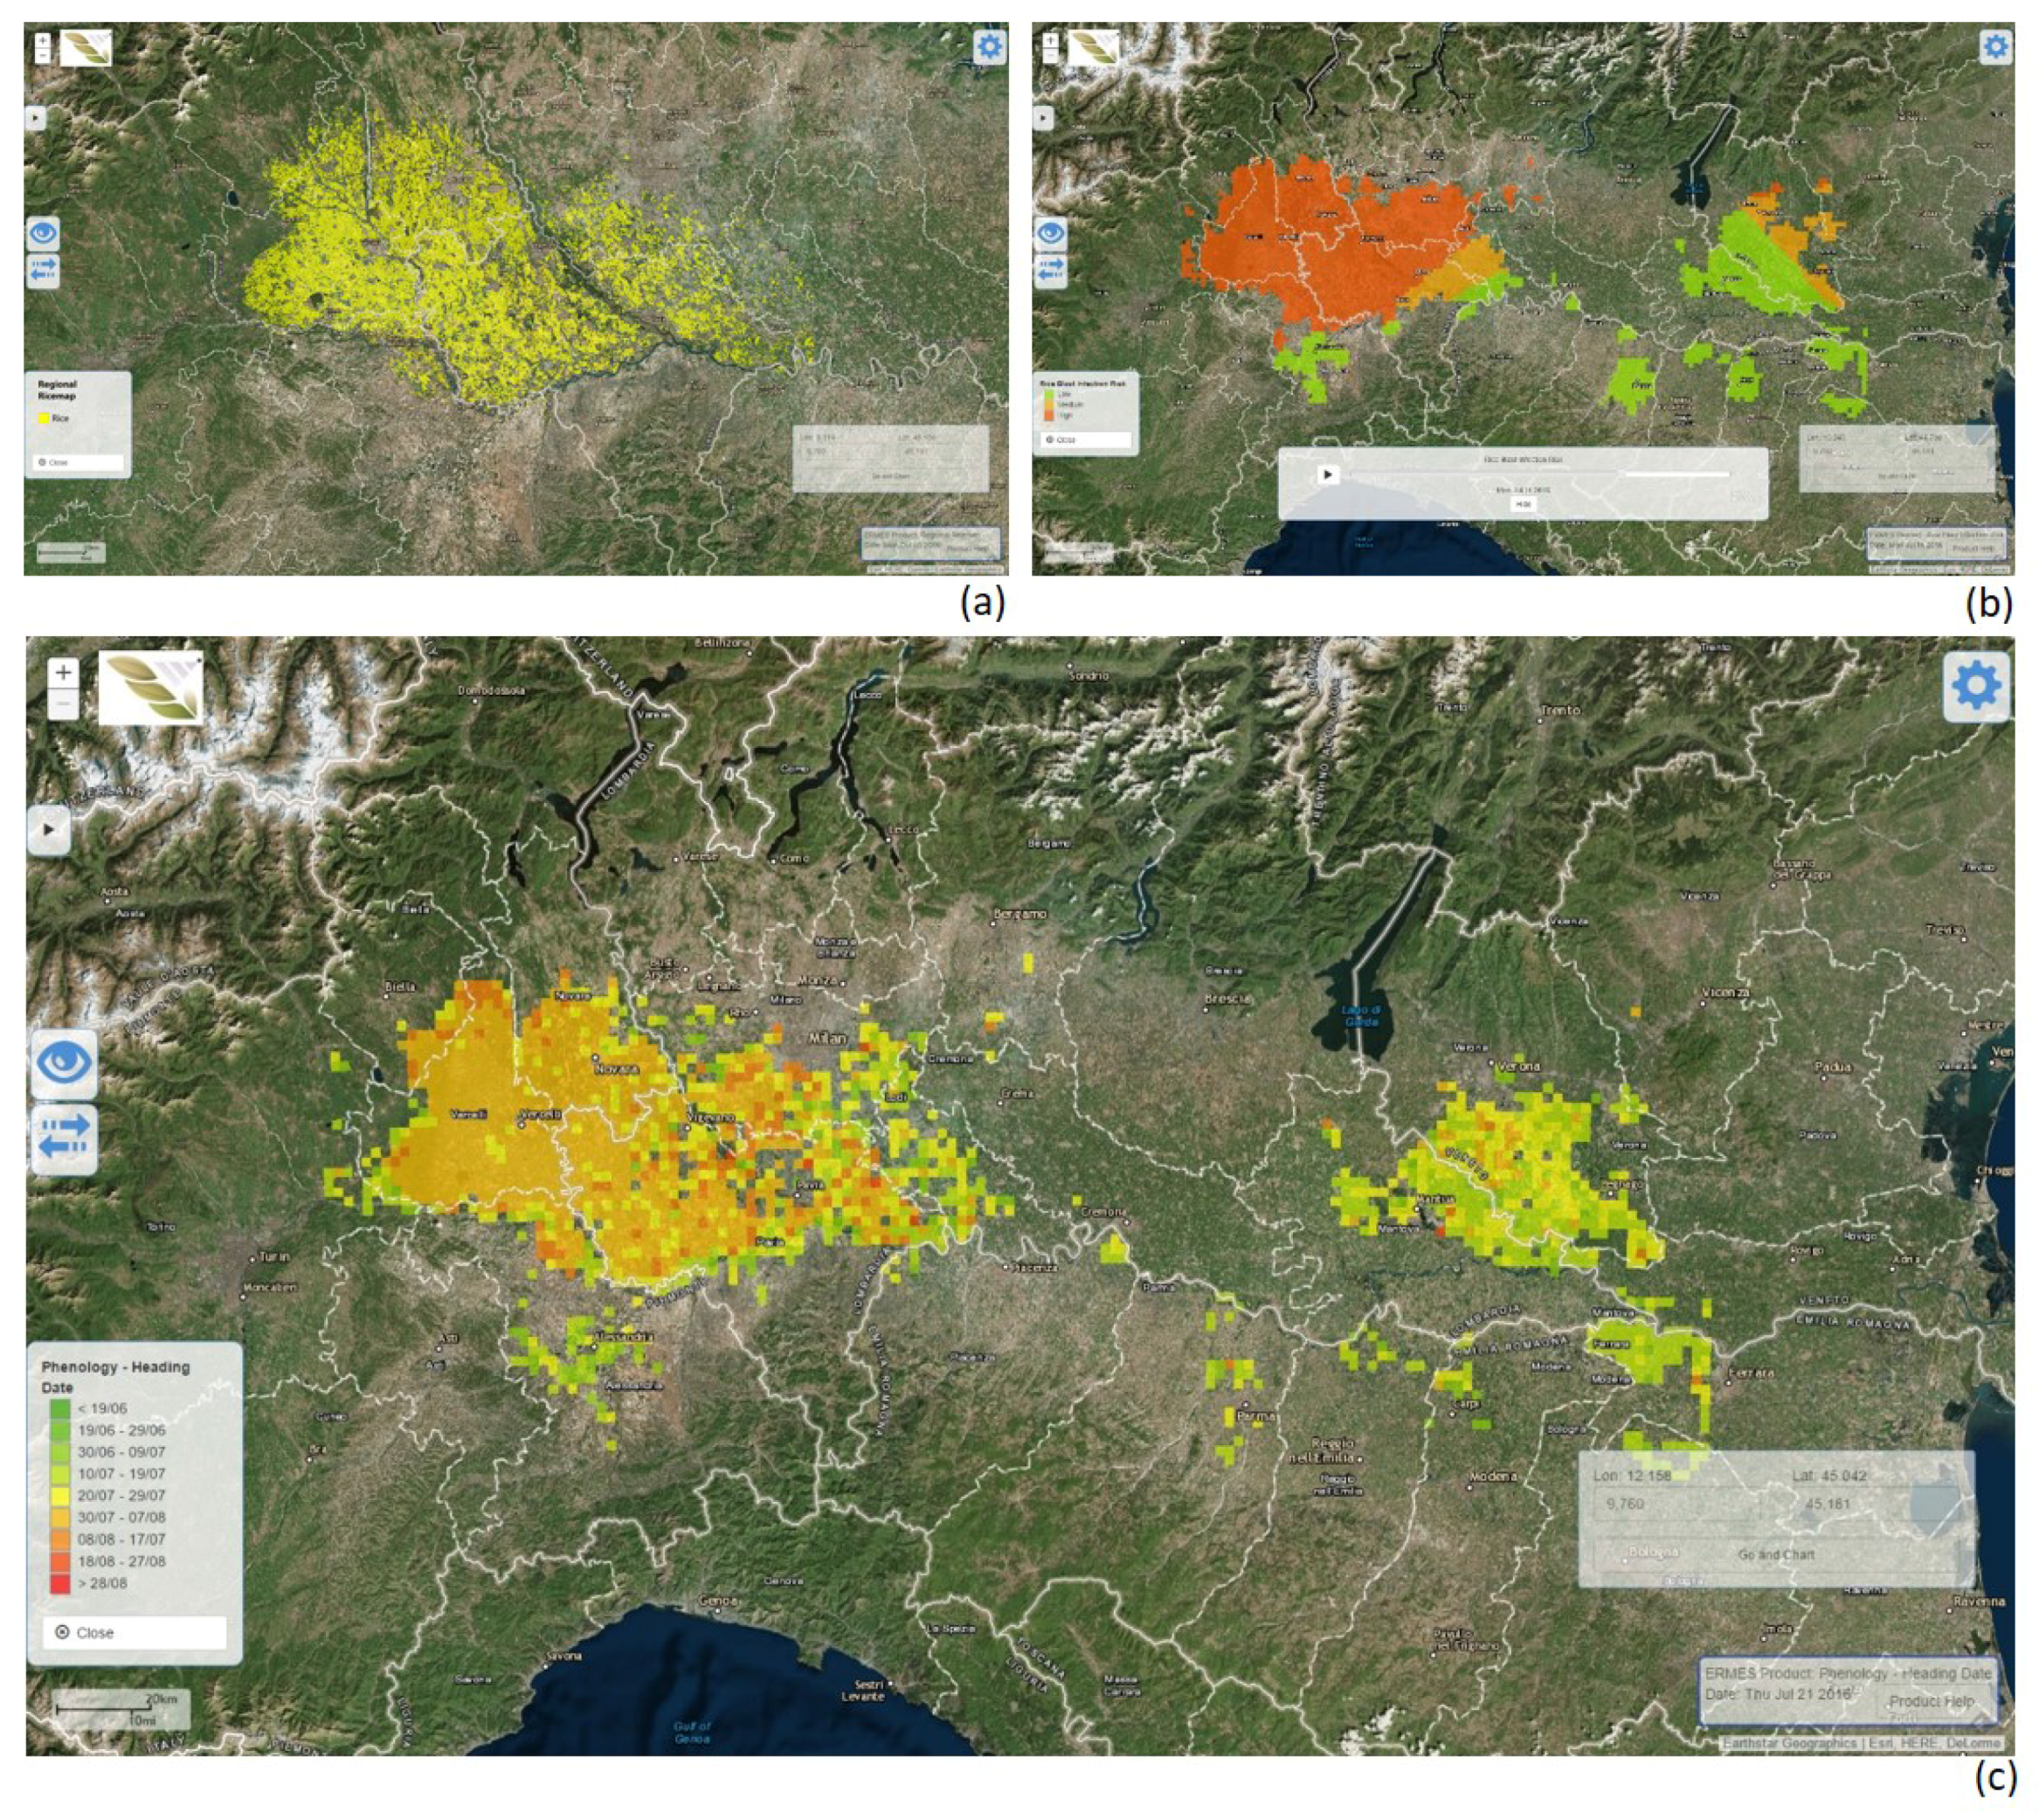
Examples of maps disseminated through the regional geoportal are shown in
Figure 4. These examples represent a small portion of the variety of information that can be retrieved and visualized through the regional geoportal. For a detailed list of regional data products and their characteristics refer to Busetto et al. [
32]. Rice crop maps (
Figure 4a) allow users to understand the spatial distribution of the rice cultivation area during a season. Regional authorities find them extremely useful to obtain estimates well before the statistics compiled from farmers’ declarations for the Europe’s Common Agricultural Policy (CAP) subsidies get officially published. Sowing dates maps (
Figure 4c) make it possible to infer cultivated variety (long or short cycle) and potential problems in the current season (e.g., delays in sowing due to adverse meteorological conditions).
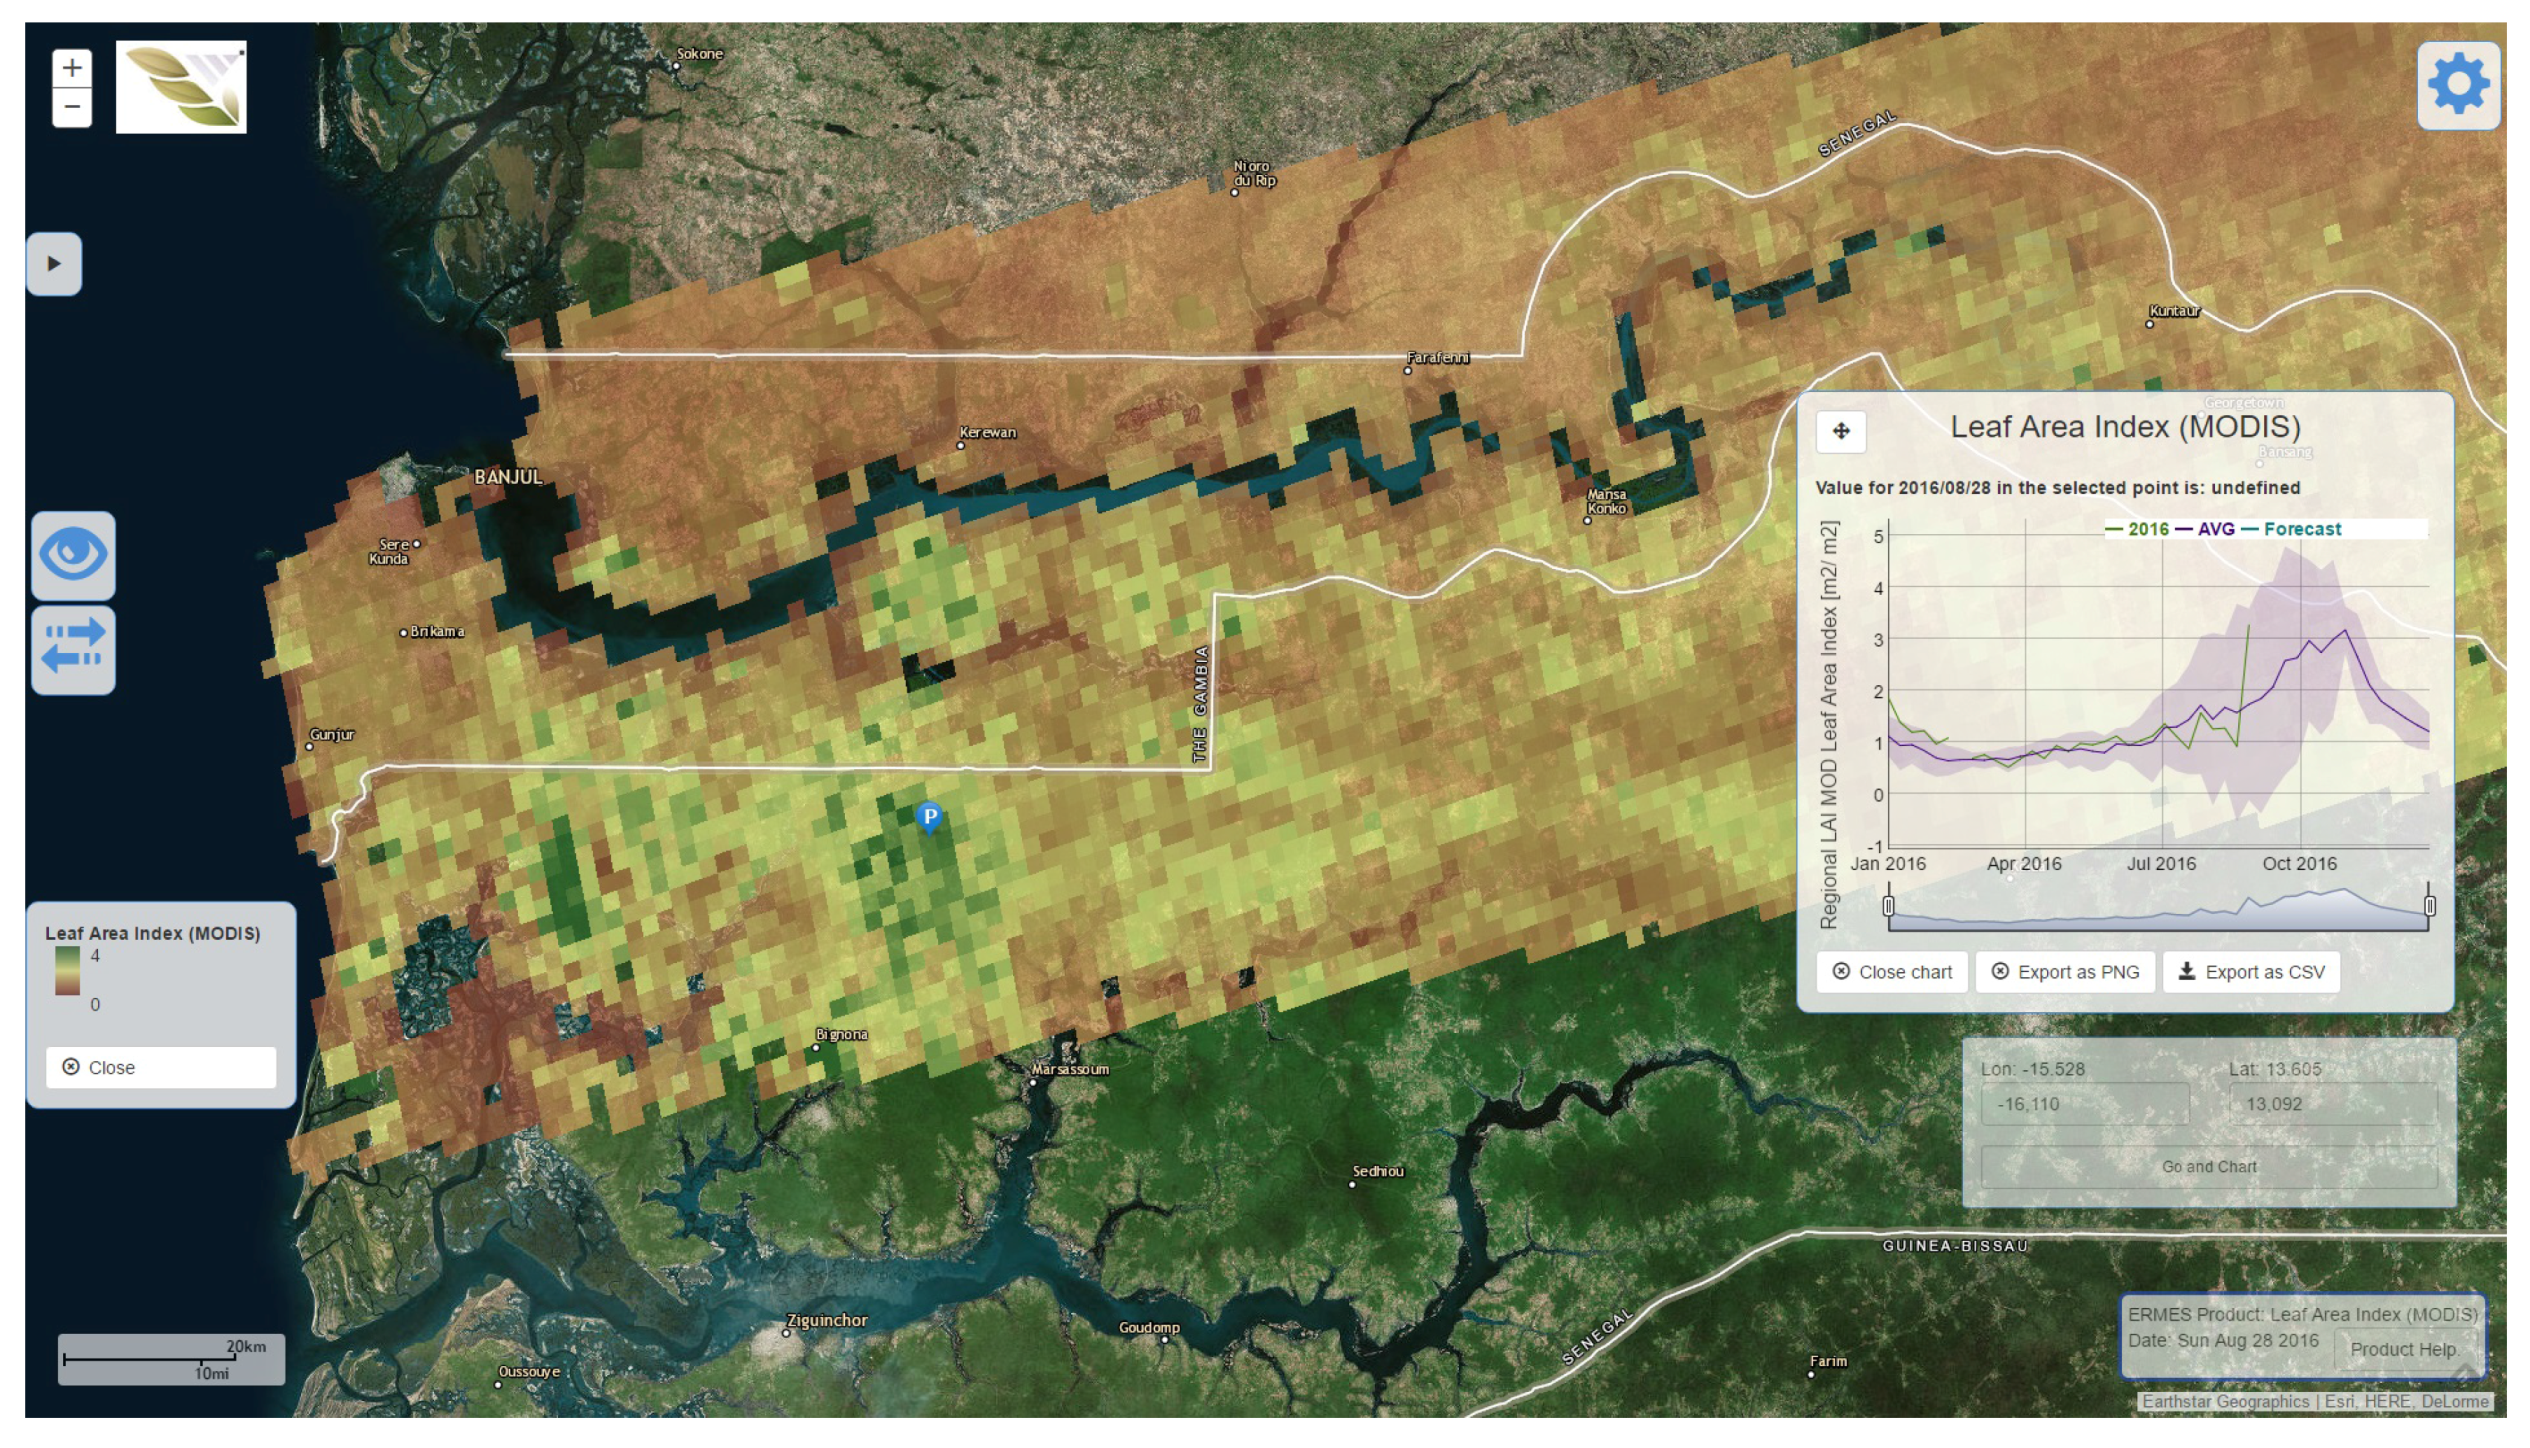
The regional geoportal is in operational use for three European countries. Technologically speaking it is the same piece of software, but configured differently and interacting with distinct geospatial services behind the scenes depending on the study areas (see
Section 3.2.1 and
Section 3.2.2). Customized settings (e.g., available products, geospatial service end points, default bounding box, etc.) are specified through a configuration file. This approach allows for easy addition of new study areas, i.e., by extending the configuration file and providing the geospatial services for the new area. As such, the regional geoportal was extended to cover two African countries: Gambia and Senegal (
Figure 5), exposing NDVI, LAI, phenology, and weather data products for these two African countries.
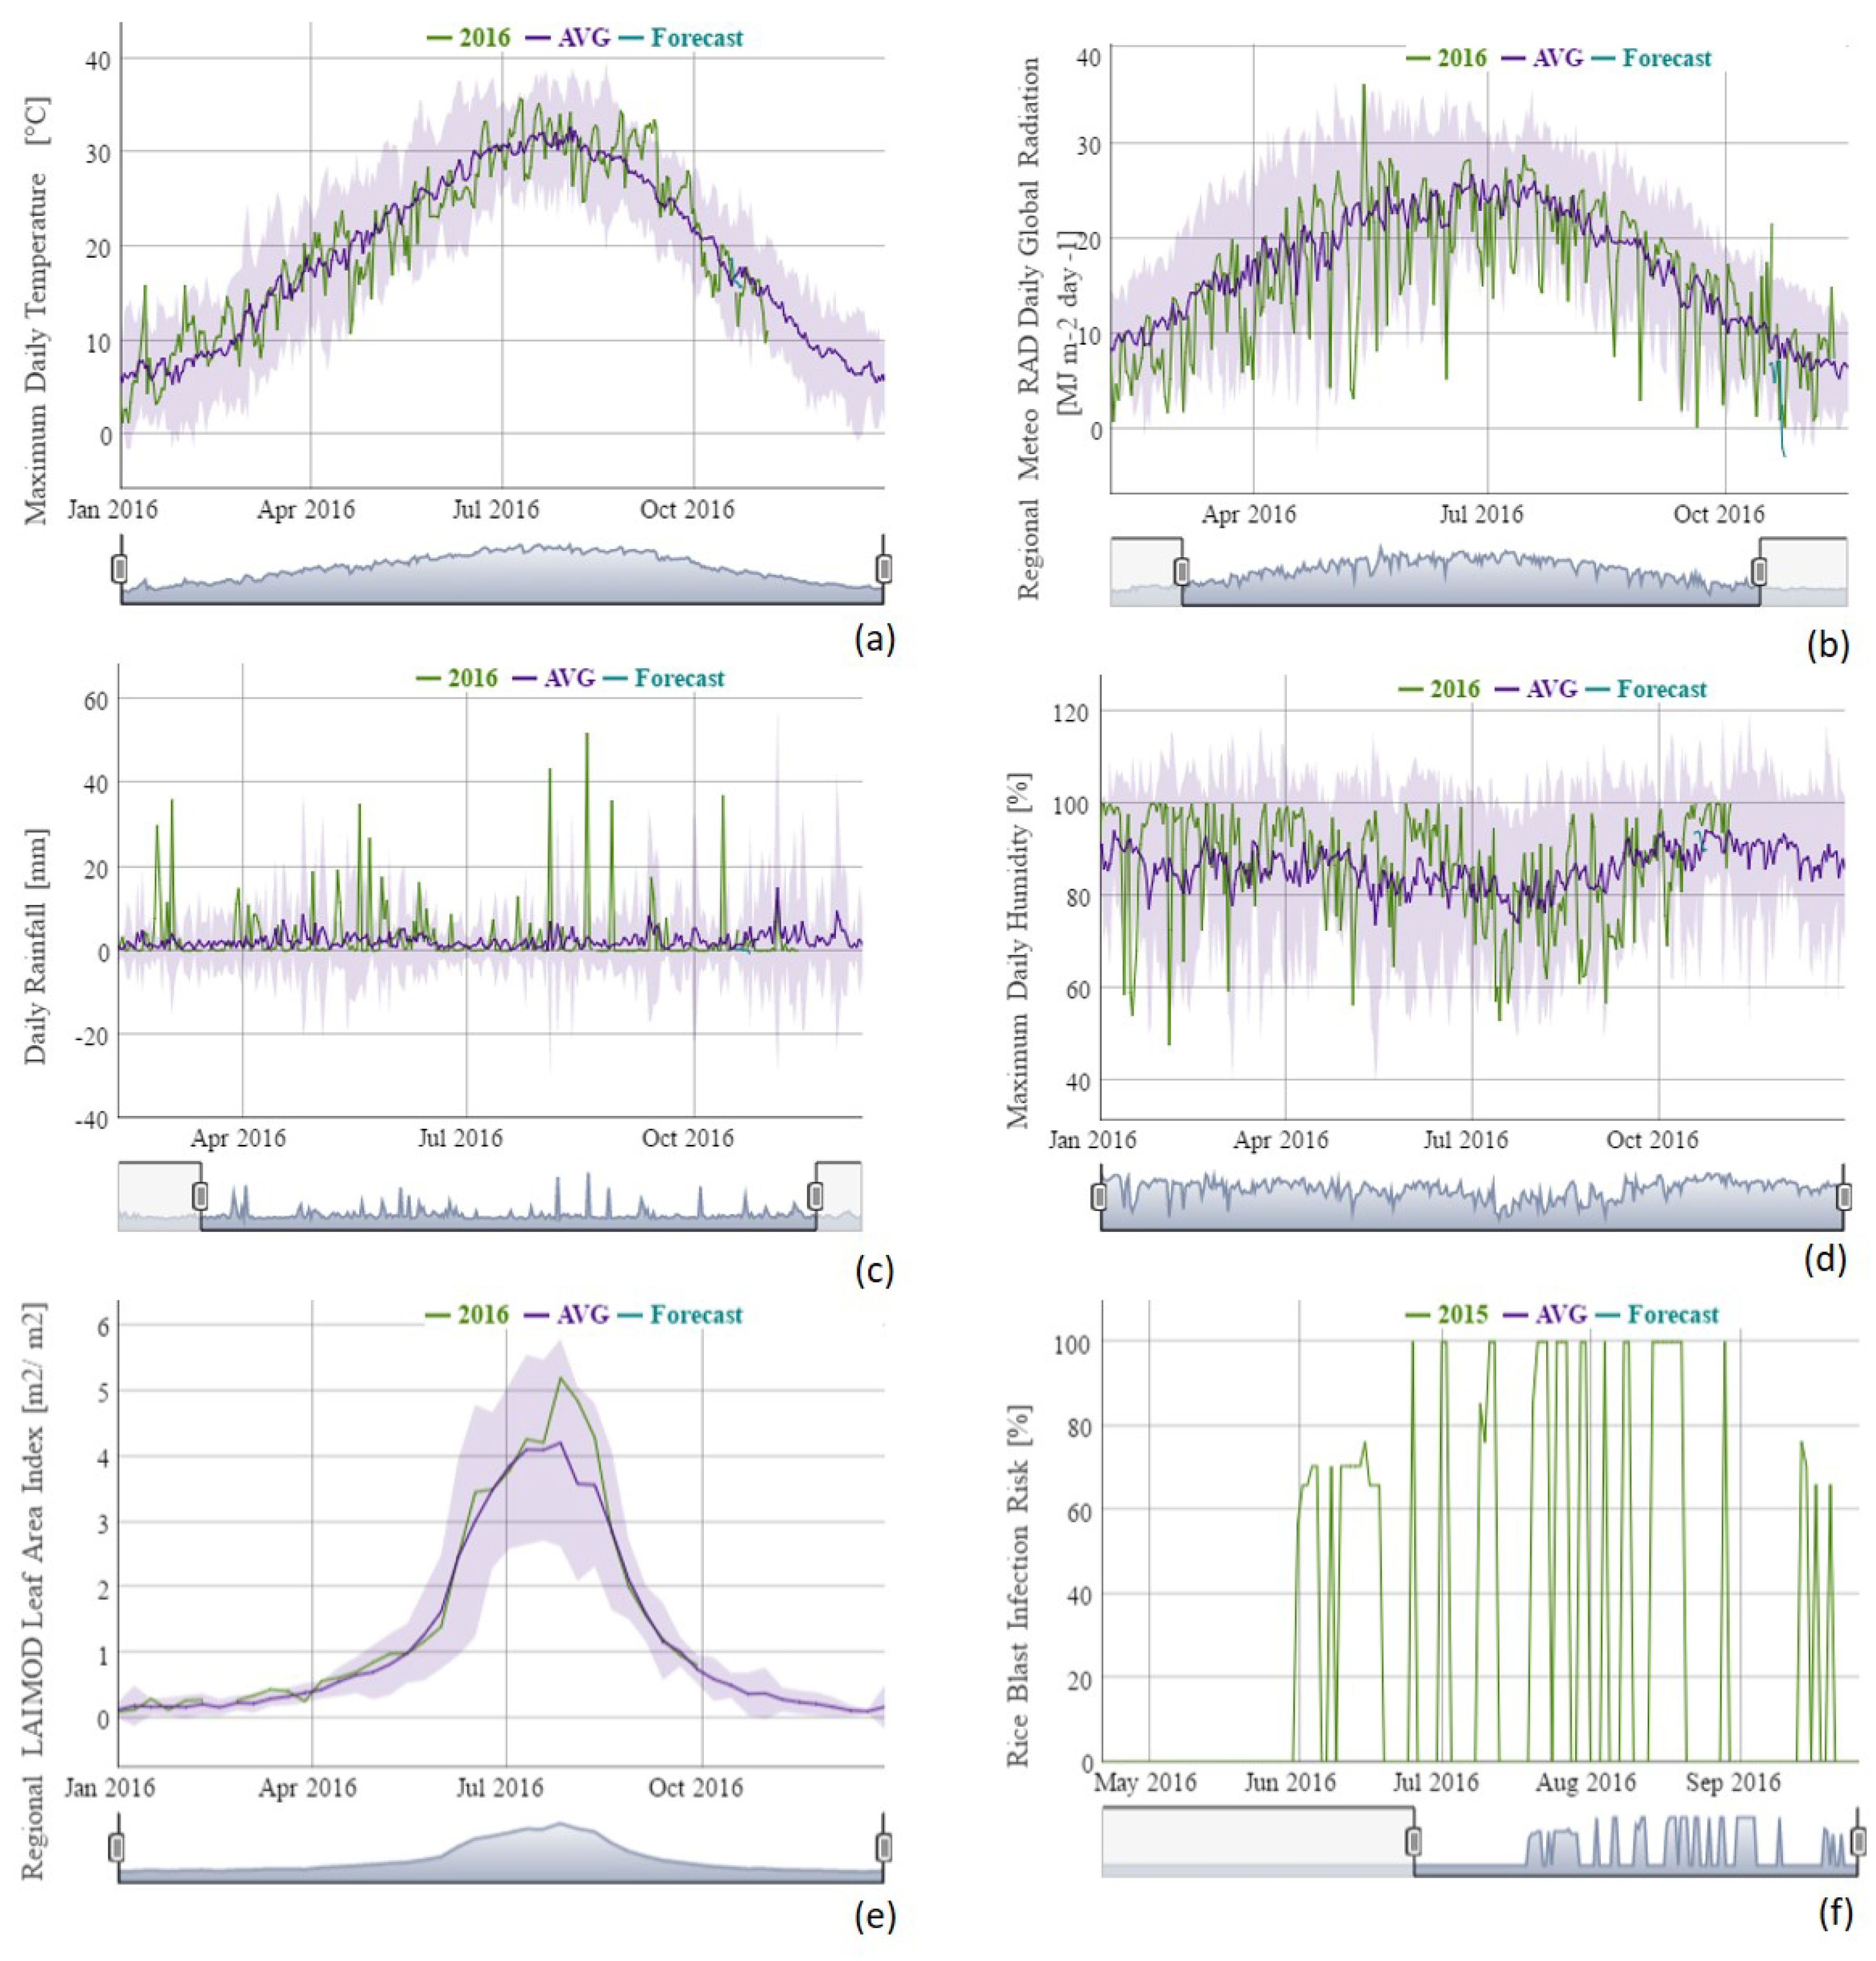
The range of temporal profile charts associated to data products is shown in
Figure 6. When a data product is active, i.e. is selected by the user and displayed as an overlay map, a click on it pops up the associated temporal profile chart. For example, daily maps of potential risk of rice blast infection (
Figure 4b) allow identification of high-, medium- and low-risk areas for a given day. If a user clicks on a position of the risk map, risk estimations are visualized over a temporal axis for the actual season, allowing experts to draw insights on potential production losses over a longer period (
Figure 6f).
Data products along with rendered images and raw data from charts can be downloaded and used as input data for additional (local) analysis or for value-added services. An example of the latter is a dedicated service developed for the plant-health service of the Lombardy Region (Italy) to produce daily bulletins of current and forecast rice blast infection risk, which are direct outputs from the regional geoportal, aggregated at municipality level. These informational bulletins are publicly available in the organization’s website (
https://goo.gl/IszwQ4) for stakeholders and farmers.
Time series weather parameters such as maximum air temperature (
Figure 6a), solar radiation (
Figure 6b), rainfall (
Figure 6c), and maximum relative humidity (
Figure 6d) allow experts to monitor meteorological conditions for rice growth, and compare them to long-term averages, to easily detect anomalies potentially impacting crop evolution. In addition to long-term average data series and +/− one standard deviation (gray area), temporal profile charts for weather parameters come with a third data series representing one-week forecast measurements (obtained from local weather services and processed through meso-scale models), which may be useful for users to schedule or prepare potential actions in advance. Finally, along with weather parameters, users have one additional means to monitor the evolution of rice growth, namely using the leaf area index charts (
Figure 6e).
As described in
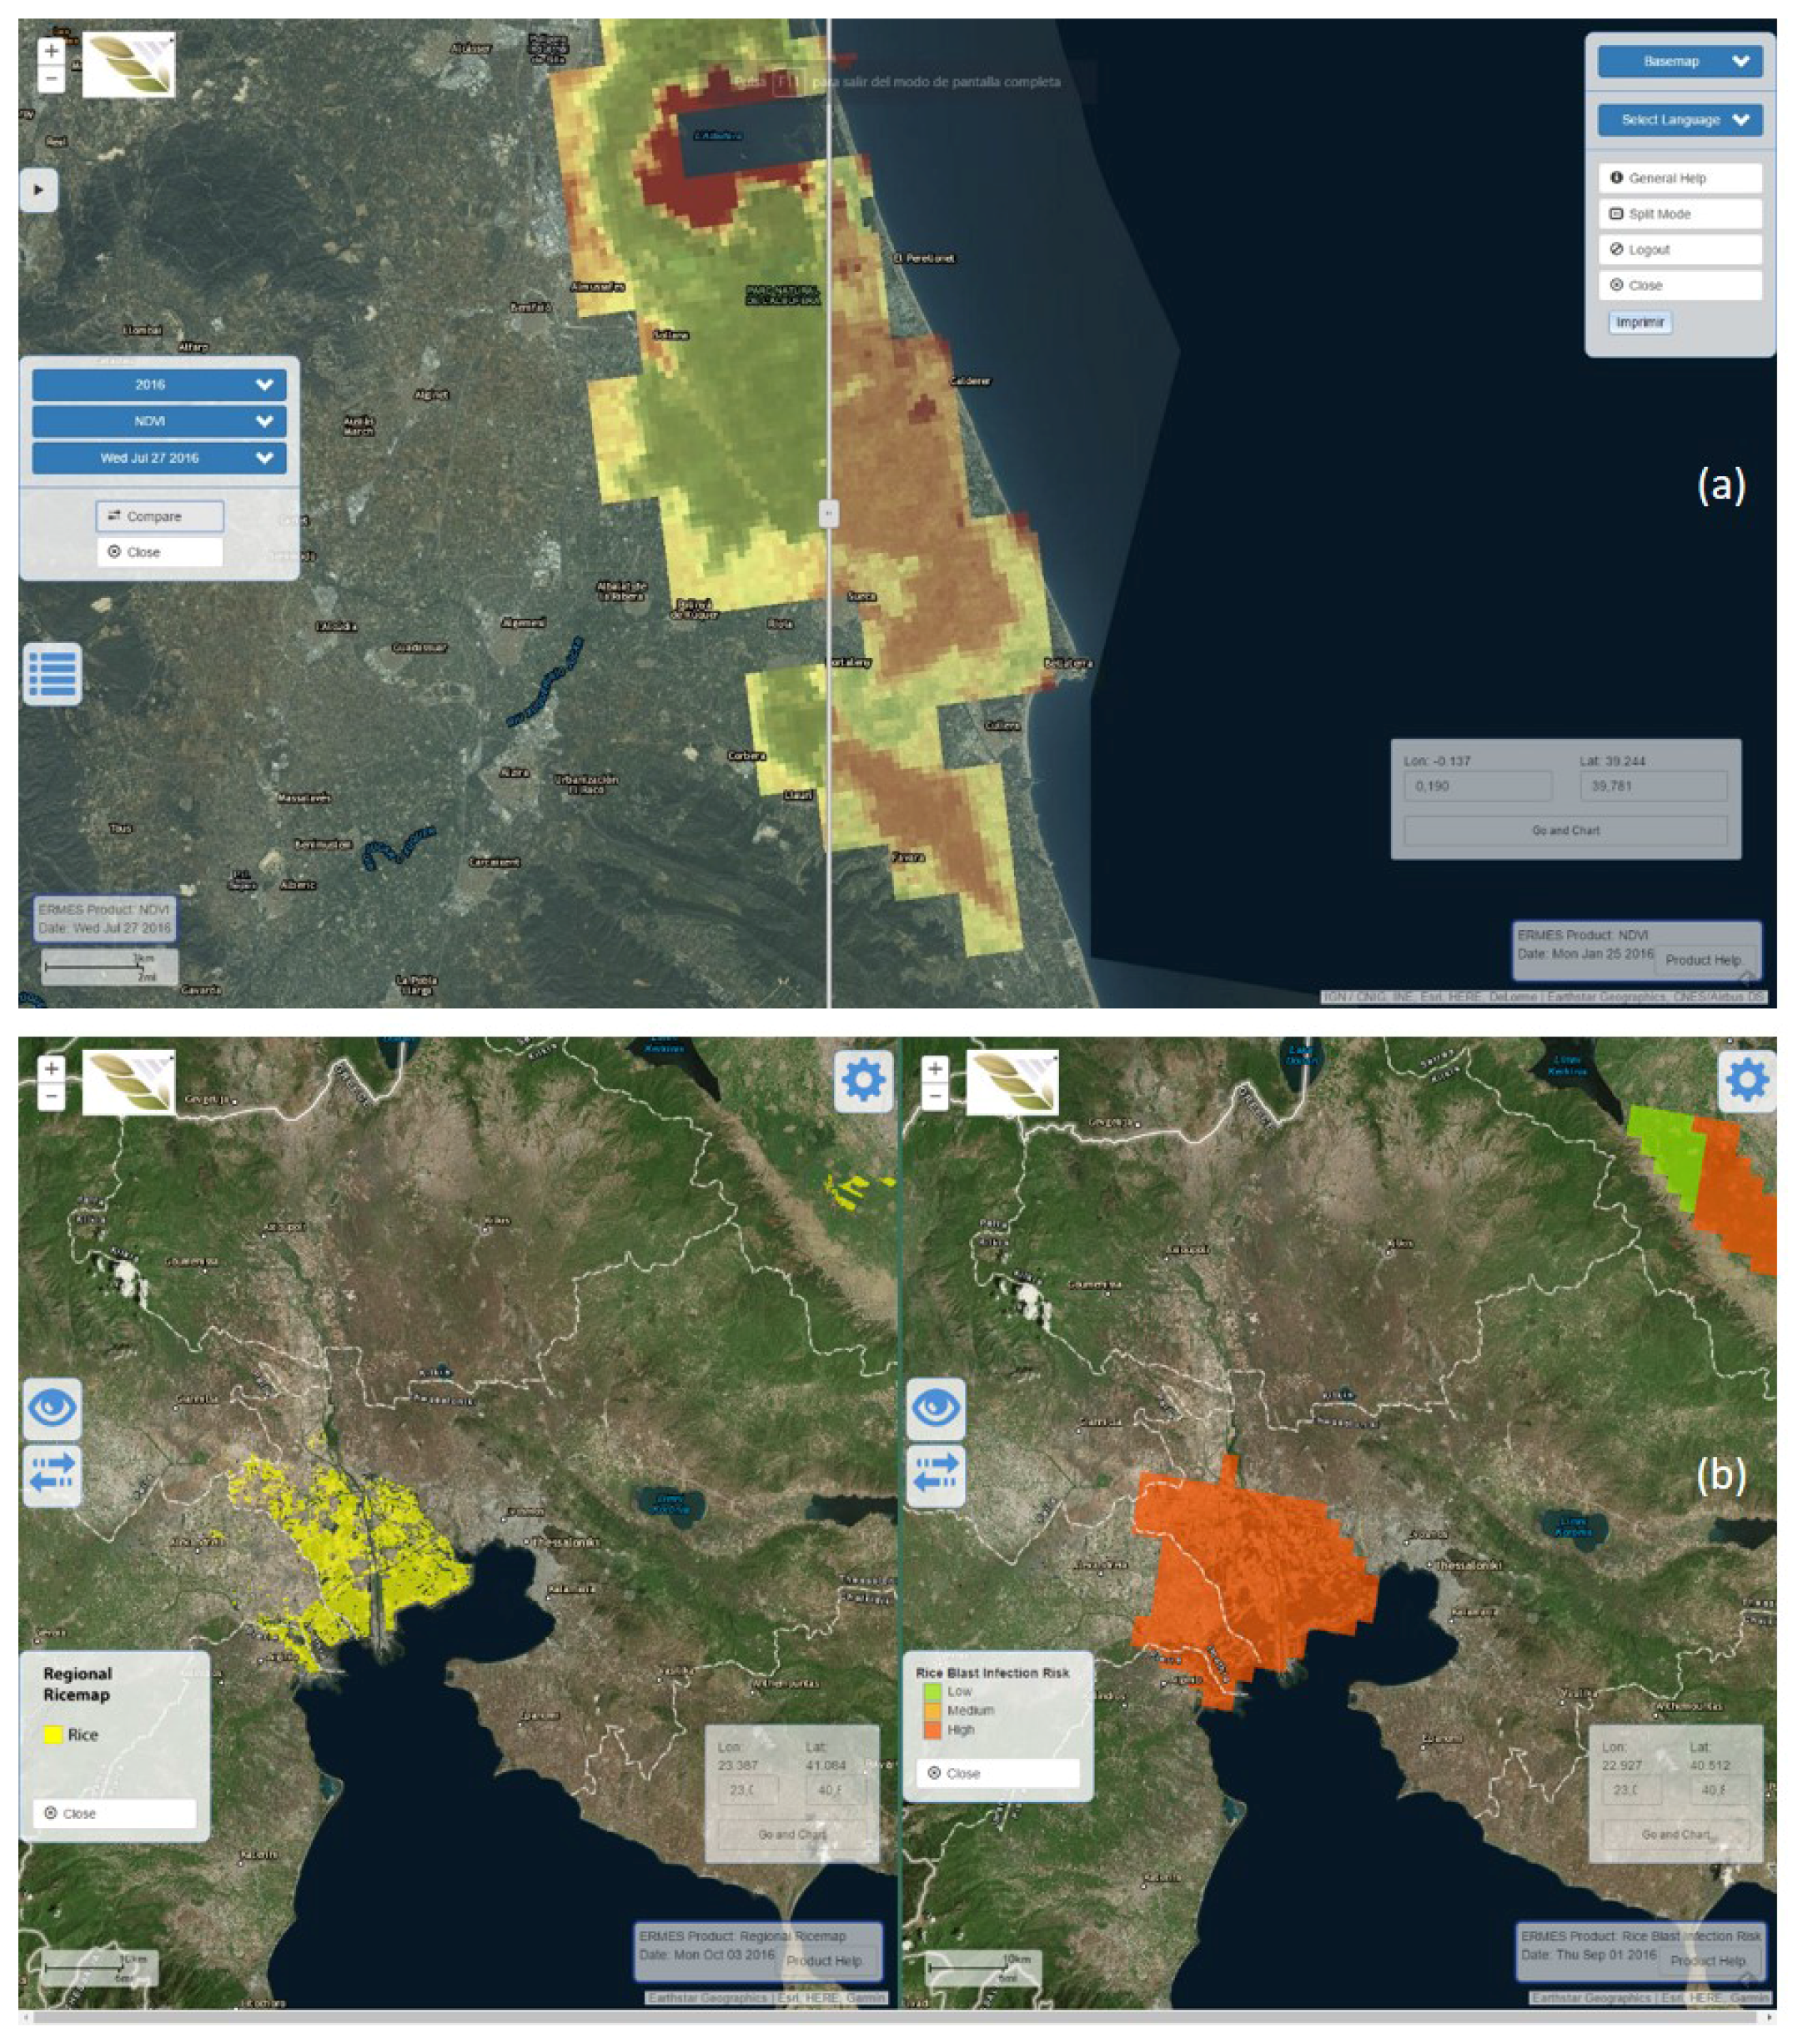
Section 3.3, the regional geoportal provides two ways to easily compare two products. In the Swipe mode (
Figure 7a), two NDVI maps at distinct acquisition dates of the Spanish study area are compared. Users can overlay any pair of data products regardless of their type and acquisition date if both cover the same geographic area. Unlike the Swipe mode, product comparison through the Split mode (
Figure 7b) is more flexible as a user can visualize maps with distinct spatial coverage area, since two independent instances of the regional geoportal are launched.
Finally, it is important to point out the ease-of-use and quasi-direct access to all functionality in the regional geoportal. A uniform and simple interaction model favors that end users get accustomed to the regional geoportal very quickly. As the user takes actions (e.g., visualizing a data product), additional functionality becomes available (e.g., charting temporal profile of this product) only if relevant, thereby not overwhelming the user with extra choices. Most importantly, functionality is immediately available: selecting a data product at a particular date (“eye” symbol), comparing products (“two arrows” symbol), and general settings (“gear wheel” button). Once a product is visualized, clicking on any point of the map brings up the associated temporal profile chart for that product, along with a time slider for temporally browsing through the product, and a link to download the raw data of the product via the on-line catalog tool. The comparing feature lets the user select products to compare in a similar manner, splitting the screen and yielding the same functionality as for single products. Finally, the general settings menu allows to changing of the general settings, such as language and basemap settings or the contextual help menu. It was decided to group these less used functionalities in order not to overload the map with buttons.
5. Conclusions and Future Work
We have described the overall system architecture and the ecosystem of tools that shape downstream services for rice monitoring developed in the realm of the ERMES project. We put the focus on the regional geoportal, specifically designed and implemented to smoothly deliver data products to users in a timely manner for rice monitoring/management applications. Within the overall ERMES system, it plays the role of a data dissemination and presentation tool that bridges the gap between data collection, processing and provision at different levels of spatial and temporal granularity. It gives easy access to vast amounts of data products being generated on a daily basis. A remarkable feature is the ability to shorten as much as possible the process of delivering recently-acquired satellite data and other data resources as convenient data products to stakeholders. The regional geoportal has a simple but consistent and uniform interface that makes it easy to use by stakeholders.
From a implementation point of view, the regional geoportal heavily relies on a service-oriented architecture to realize geospatial data-centered web services that make use of web standards and JavaScript technology at the client and server side. It was operationally tested during 2015 and 2016, demonstrating its robustness and flexibility address unforeseen situations thanks to the redundant and complementary nature of its data sources (VHR images from Synthetic aperture radar (SAR) and optical sensors) and products (e.g., LAI and meteo maps). During these two years, regular meetings, conversations, and ad hoc demonstrations allowed us to engage with different ERMES end-users and stakeholders, including public authorities and insurance companies. Based on stakeholders’ experience and feedback, the regional geoportal was primarily used as a tool to perform expert-based crop monitoring, and as the basis for producing customized added-value information, such as biotic risk and yield forecast bulletins.
Although the regional geoportal was mainly focused on the European rice crop, its conceptual architecture, methods and technologies can be exploited for other crop types and in other areas of the world. Because the conceptual architecture is decoupled from its physical implementation, it allowed us to meet the required flexibility to tailor the implementation to the scale and complexity of the particular use case scenario. As such, the regional geoportal is being showcased as a country-level monitoring system in West African developing countries (Senegal, Gambia) where accurate information on crop status and dynamics are even more needed due to food security issues. This demonstrates the feasibility and usefulness of the whole ERMES system, and particularly of the regional geoportal, for crop mapping and near real-time monitoring. In response to the open call from the International Society for Photogrammetry and Remote Sensing (ISPRS) community [
31], the regional geoportal can be regarded as an integration tool made up of data, technology and communities of stakeholders, seeking to quickly deliver actionable and understandable information to meet the needs of stakeholders in the rice sector.


 ,
, 


