
Multi-Feature Joint Sparse Model for the Classification of Mangrove Remote Sensing Images

1
College of Computer Science & Technology, Huaqiao University, Xiamen 361021, China
2
College of Mechanical Engineering and Automation, Huaqiao University, Xiamen 361021, China
3
Department of Computer Science and Information Engineering, National Quemoy University, Kinmen 89250, Taiwan
*
Author to whom correspondence should be addressed.
ISPRS Int. J. Geo-Inf. 2017, 6(6), 177; https://doi.org/10.3390/ijgi6060177
Submission received: 28 March 2017
/
Revised: 27 May 2017
/
Accepted: 18 June 2017
/
Published: 20 June 2017
(This article belongs to the Special Issue Advanced Geo-Information Technologies for Anticipatory Computing)
Abstract
:Mangroves are valuable contributors to coastal ecosystems, and remote sensing is an indispensable way to obtain knowledge of the dynamics of mangrove ecosystems. Due to the similar spectral features between mangroves and other land cover types, challenges are posed since the accuracy is sometimes unsatisfactory in distinguishing mangroves from other land cover types with traditional classification methods. In this paper, we propose a classification method named the multi-feature joint sparse algorithm (MF-SRU), in which spectral, topographic, and textural features are integrated as the decision-making features, and sparse representation of both center pixels and their eight neighborhood pixels is proposed to represent the spatial correlation of neighboring pixels, which can make good use of the spatial correlation of adjacent pixels. Experiments are performed on Landsat Thematic Mapper multispectral remote sensing imagery in the Zhangjiang estuary in Southeastern China, and the results show that the proposed method can effectively improve the extraction accuracy of mangroves.
1. Introduction
Remote sensing technology has been widely used in various fields, such as military, agriculture, forestry, environmental monitoring, geology, and so on [1]. With the rapid development of remote sensing technology, the spectral resolution, temporal resolution, and spatial resolution of remote sensing images have been greatly improved. Mangroves [2,3] are a precious type of woody plant which grow in tropical and subtropical coastal areas. Due to the continuous expansion of human habitats, the area of mangroves is decreasing. The detection and analysis of the distribution of mangroves are important for their protection. Due to their special growth environment, remote sensing technology now gives people a new way to map and monitor the dynamic change of mangroves. Classification is the core issue in the application of mangrove remote sensing images. In classification, there are two main methods: supervised and unsupervised [4]. Remote sensing image classification methods are mainly based on supervised methods, such as support vector machine (SVM) [5], maximum likelihood method (ML) [6], and so on. In addition, a number of algorithms also have been proposed for classification, such as the object-based remote sensing image analysis approach [7,8].
Due to the similar spectral features between mangroves and other vegetation, such as agricultural land and forests, the phenomena of the “same object with the different spectrums” and “different objects with the same spectrum” are widespread in spectral images. As a result, misclassification and leakage points are common, which leads to a low classification accuracy. It is significant to find new ways to improve the classification accuracy of mangroves.
In recent years, sparse representation theory has aroused great concern. Wright et al. [9] first proposed sparse representation classification (SRC) for face recognition applications. Recently, sparse representation has been widely used in remote sensing image classification [10,11]. In classification, SRC assumes that a pixel can be compactly represented by a few number of atoms (columns) in an over-complete dictionary (redundant set) [12,13]. Since the remote sensing image usually has many homogeneous regions, and its neighboring pixels around the regions are made up of the same material [14], combining the spatial information of the four nearest neighbors, Chen et al. [15] proposed a joint sparse representation classification (JSRC) method.
In this paper, we propose a multi-feature joint sparse method for the classification of mangrove remote sensing images, which is nested somewhere between pixel-based and object-based approaches. In this approach, in addition to spectral features, both geographical features and image features are integrated as the decision-making features. The proposed sparse model considers not only the test pixel, but also the similarity between the test pixel and the neighboring pixels. Finally, the experiments are performed on Landsat Thematic Mapper (TM) multispectral remote sensing imagery in the Zhangjiang estuary of Southeastern China. The results show that the proposed method can effectively improve the classification accuracy of mangrove remote sensing imagery.
The rest of this paper is arranged as follows: Section 2 introduces the sparse representation theory; the multi-feature joint sparse model for classification algorithm is presented in Section 3; the experimental results are given in Section 4; and finally, the conclusions are summarized in Section 5.
2. Sparse Representation Classification
According to the basic theory of sparse representation, each pixel in the remote sensing image can be represented by a linear combination of a few atoms in an over-complete dictionary. Let be a B-dimensional target pixel which belongs to class i, and be an over-complete dictionary which is consists of all the training samples of a total of N classes. The target pixel can be represented as:
where is the sparse coefficient matrix. For dictionary D, the sparse coefficient matrix in Equation (1) can be recovered by the following optimization problem:
where is the sub-dictionary of the over-complete dictionary associated with class i and the is the sparse coefficient vector of class i. is norm that represents the number of non-zero elements. L denotes the sparseness. Considering the possible errors in the entire dataset, the norm problem can be solved approximately by the following equation:
Equation (3) is an non-deterministic polynomial hard (NP-hard) problem (a certain number of operations can be used to solve the problem that can be solved in polynomial time), and we usually find an approximate solution with some methods. At present, the common methods include base pursuit (BP) [16], orthogonal matching pursuit (OMP) [17], simultaneous orthogonal matching pursuit (SOMP) [18], and so on. Once the sparse coefficient vector is obtained, we can label the target pixel by the minimal reconstructed residual. Equation (4) shows this:
where denotes the reconstructed residual corresponding to the class .
3. Multi-Feature Joint Sparse Model for Classification
3.1. Feature Selection
Spectral features, geographical features, and image texture features are integrated to be the decision-making features, which have been proven to be efficient for the classification of remote sensing images [19]. The proposed method selects 12 features for each sample, which are composed of the spectra of the TM image: band 1–band 5 and band 7, normalized difference vegetation index (NDVI), digital elevation model (DEM), and four texture features based on the Gray-level co-occurrence matrix (GLCM).
Mangroves have a special growth environment that is mainly distributed in intertidal zones, which are constrained by topographic factors [20,21]. According to the integrated visual interpretation of the field investigations, Google Earth, the TM, and the ASTER DEM images, we found that mangroves were not distributed above 8 m elevation in the study areas. Therefore, the digital elevation model (DEM) can be used to exclude non-mangrove pixels that have similar spectral attributes with mangrove pixels, but were above the elevation limiting line.
NDVI represents the vegetation coverage index. The introduction of NDVI is also helpful to distinguish between green vegetation and non-green vegetation. Deering [22] proposed the NDVI, and it is defined as the ratio of the subtraction and addition of two bands, the near-infrared band and the red band, within visible light:
where NIR denotes the reflection intensity of the near-infrared band and R denotes the reflection intensity of the red band. When the vegetation coverage of the pixel is larger, the NDVI is higher.
Texture contains important information about the structural arrangement of the surface and its relationship to the surrounding environment. Leen-Kiat Soh et al. formulated 10 features of GLCM in [23]. The mean feature reflects the degree of rules of the image texture; the variance feature describes non-homogeneous characteristics of the image, which means the variance characteristic statistic value is small for the homogeneous region; the dissimilarity feature reveals the total amount of local gray scale changes in images; the second moment feature represents the roughness of the texture [24]. When mangroves are evenly distributed, their texture is fine and smooth, and their texture structure changes little, while other green vegetation is coarse and rippled which lacks continuity on the image texture, and the local change of texture structure is relatively large. This paper takes four of the features (mean, variance, dissimilarity, and second moment) to be the texture features, which are experimentally proven to be useful for mangrove classification. The gray-level co-occurrence matrix (GLCM) of NDVI was generated by ENVI 4.5. ENVI is a software application used to process and analyze geospatial imagery. It was developed by Exelis Visual Information Solutions (Exelis VIS) which is located in Boulder, Colorado, USA.
In the texture calculation, we use a 3 × 3 moving window and take the average value of the four directions (0°, 45°, 90°, 135°).
3.2. Joint Sparse Model Classification
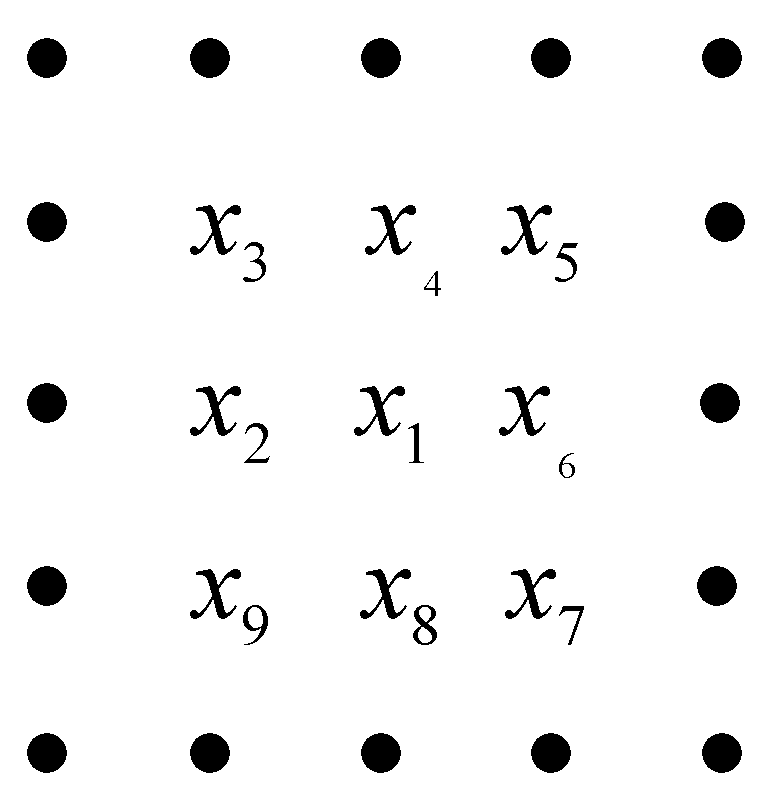
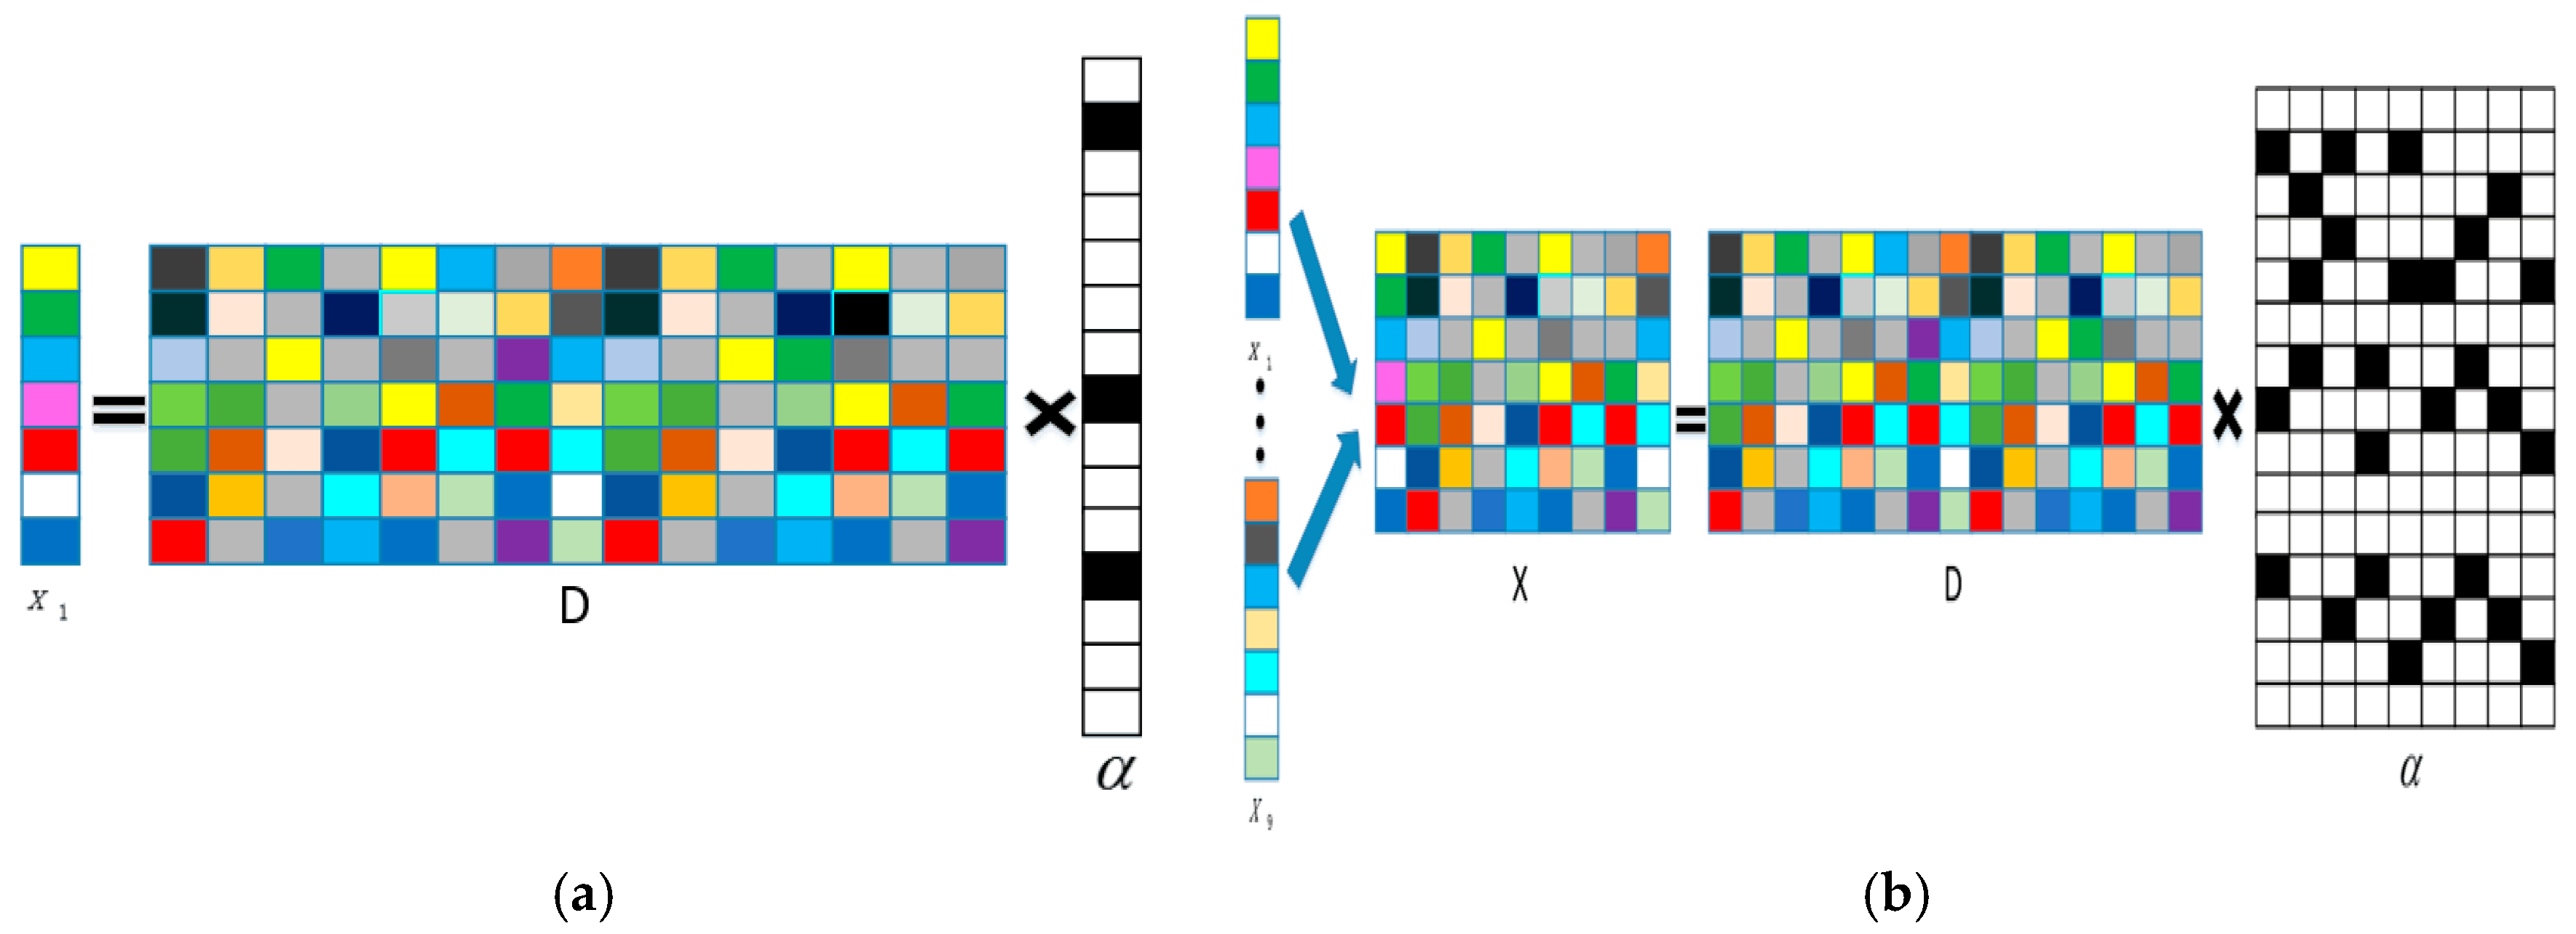
The traditional sparse model considers only the features of each pixel itself, while ignoring the spatial correlation between neighboring pixels. In the remote sensing image, neighboring pixels usually belong to the same materials [25]. Hence, the joint sparse model considers the sparse representation of both target pixels and their eight neighborhood pixels, as shown in Figure 1. The joint pixel matrix can be expressed as , where the first pixel is the target pixel, and the rest of the columns are the neighboring pixels around the target pixel. The comparison between sparse and joint sparse is shown in Figure 2. Figure 2a shows the sparse model, and Figure 2b shows the joint sparse model. The joint pixel can be linearly represented by the over-complete dictionary:
where T are neighbors in the spatial domain. For a given training sample dictionary D, the sparse coefficient matrix can be calculated though the following constraint problem:
where represents the numbers of non-zero rows of . The solution of norm is an NP-hard problem. Due to the sparseness of , the above problem can be solved approximately by Equation (8):
where denotes the Frobenius norm. In this paper, we use the simultaneous orthogonal matching pursuit (SOMP) to solve Equation (8). When the sparse coefficient matrix is recovered, we can label the target pixel by the minimal reconstructed residual, shown by Equation (9):
where denotes the portion of the recovered sparse coefficient matrix associated with class .
3.3. The Procedure of the Multi-Feature Joint Sparse Model
Under the constraint of the multi-feature joint sparse model, the classification result of the proposed algorithm will achieve the best classification results when the sparsity L is set as one. The K-SVD (K-Singular Value Decomposition) algorithm [26] is used to train the sample data of each category in the proposed method. K-SVD is an iteration algorithm that alternates between sparse coding based on the current dictionary and a process of updating the dictionary atoms to find a better dictionary. It is found that, when the sub-dictionary size of each class is set as 100 and the number of training iterations for each class sample is set as 50, the algorithm can obtain the optimal dictionary. The computational complexity of the multi-feature joint sparse model algorithm (MF-SRU) method depends on the processing of dictionary training and the calculating of the sparse coefficient. In this case, the maximal complexity of training the dictionary is almost approaching into the O(n3), and the calculating complexity of the sparse coefficient is O(B × n × T) (B: feature dimension, n: the number of samples, T: the number of neighborhood pixels). Normally, B and T are smaller than the n value. Therefore, the maximal complexity with the proposed method is considered as O(n3). The specific steps of the MF-SRU method are described in Algorithm 1.
| Algorithm 1: MF-SRU |
| Input: the set of labeled pixels , number of classes N, sparsity level L, the sub-dictionary size K, and the number of iterations to train each class sample T0. Output: matrix, which records the labels of the all pixels. (1) Use K-SVD algorithm to learn the dictionary For each pixel in the mangrove remote sensing image: (2) Construct the joint pixel , where is the target pixel at the center of the eight-pixel neighborhood; (3) Use the SOMP algorithm to obtain the sparsity representation coefficients of pixel by Equation (8); (4) Compare the reconstructed residual to classify the labels by Equation (9); (5) Continue to the next test pixel; End For |
4. Experimental Results and Analysis
In this section, we evaluate the effectiveness of the proposed algorithm by the following experiments. The remote sensing data used in this experiments are derived from the LANDSAT 5 TM on 25 September 2006, which is the sampling of the Zhangjiangkou Mangrove Nature Reserve in Fujian province. The mangrove area is one of the national key nature reserves, and the location is 22°53′45″~23°56′00″ N; 117°24′07″~117°30′00″ E, with a total area of 2360 hectares. According to field investigation in the study area, the land cover types are defined as seven categories. Table 1 lists the seven land cover types and their descriptions.
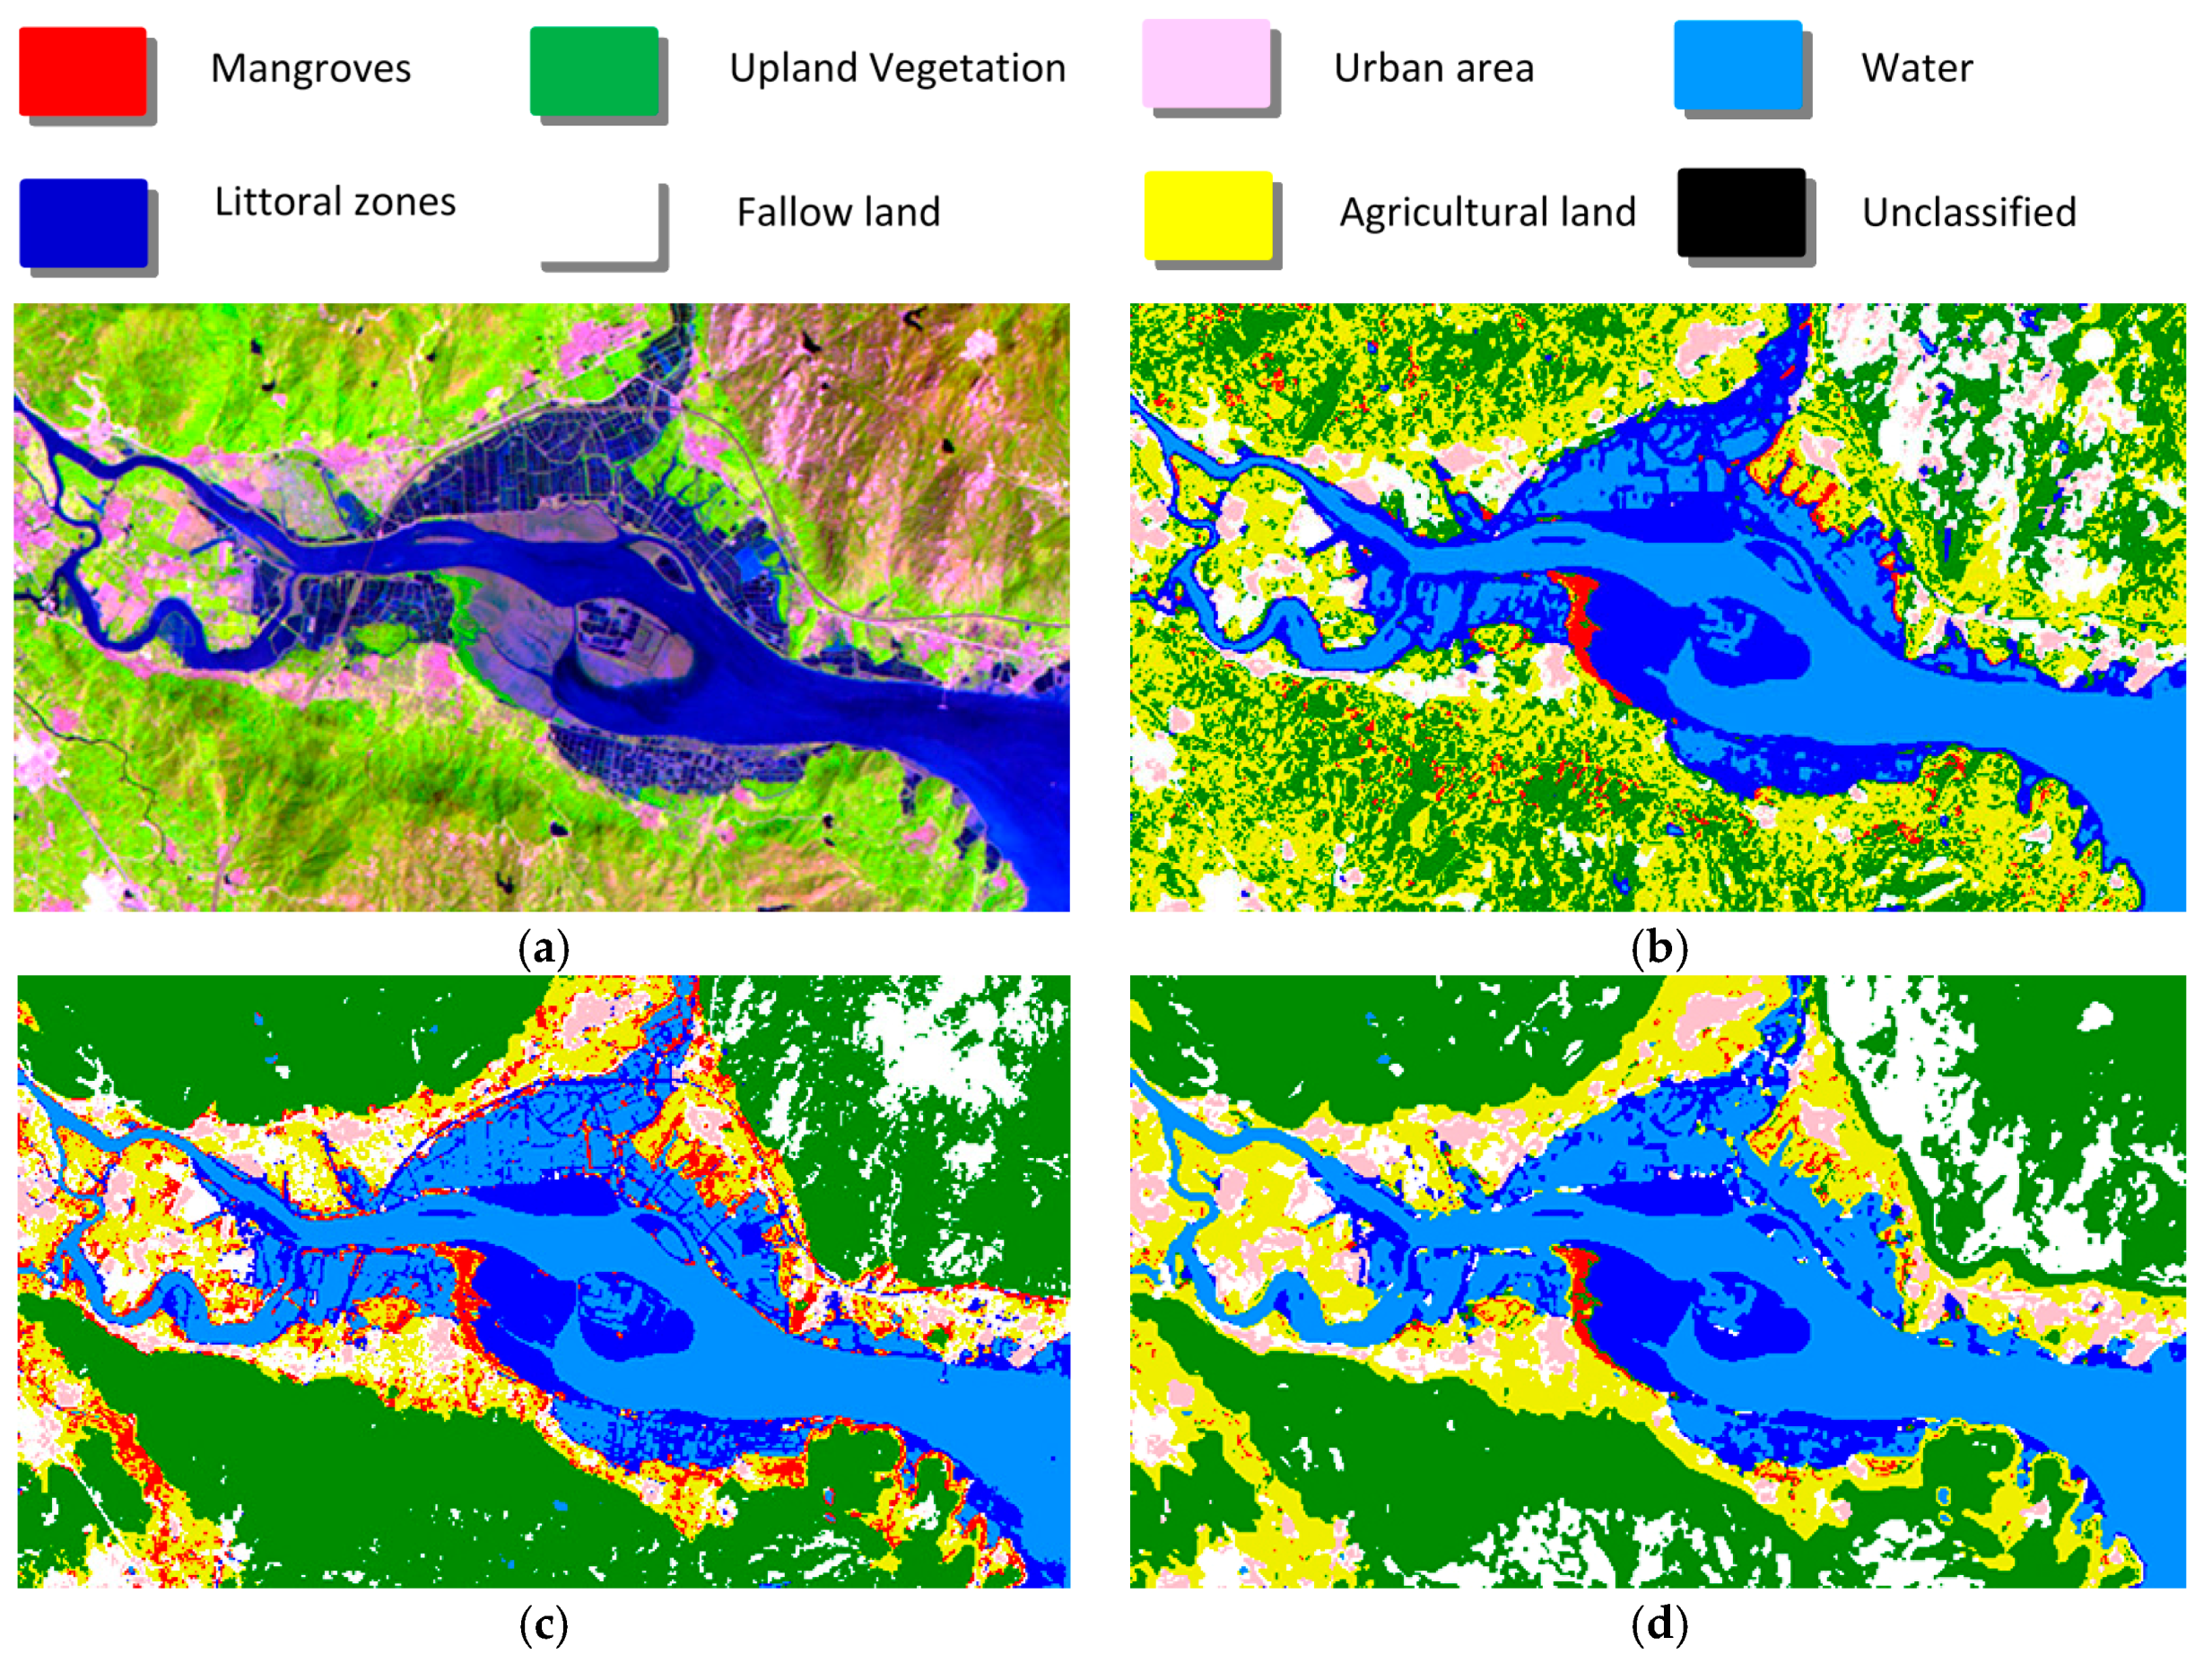
In the experiments, 100 points of each land cover type are selected randomly to be the labeled training samples and the K-SVD algorithm is used to train each class sample. All the experiments are conducted by using MATLAB R2013a on a 3.30 GHz machine with 8 GB RAM. The false color composite of the Zhangjiangkou Mangrove Nature Reserve TM image is shown in Figure 3a. Figure 3b–d show the classification results of different algorithms, Figure 3b shows the joint sparse representation model algorithm based on spectrum features (SRU); Figure 3c shows the multi-feature support vector machine (MF-SVM); Figure 3d shows the multi-feature joint sparse model algorithm (MF-SRU).
After investigating and interpreting, we found that all three methods can obtain better classification results for water and littoral zones. For the other five land cover categories, SRU and MF-SVM have heavy misclassification and leakage points. All three methods are able to identify the major mangrove areas, but a large number of samples of agricultural land and upland vegetation are wrongly identified as mangroves in SRU and MF-SVM. It seems that MF-SRU is more capable of differentiating the mangroves from other classes, and it can achieve better results visually.
A confusion matrix is a very effective way to assess the accuracy, in that the accuracy of each category is plainly described along with both the errors of inclusion (commission errors) and errors of exclusion (omission errors) presented in the classification. We use a confusion matrix, the overall accuracy, and the kappa coefficient to evaluate the classification performance of the algorithms. By field sampling and high-resolution imagery, we take 200 samples randomly for each land cover category as the ground truth samples to build the confusion matrices. The confusion matrices for classification results of the three algorithms are listed in Table 2. Overall accuracy, kappa coefficients, and the commission and omission errors are shown in Table 3 and Table 4.
The similarity of spectral features among the upland vegetation, agricultural land, and mangroves leads to serious misclassification and leakage points. Both Figure 3 and Table 2 show that multi-feature fusion can greatly reduce the misidentification phenomenon of mangroves. Table 3 shows that the proposed MF-SRU method yields the best overall accuracy and kappa coefficient. Relative to the sparse representation classification algorithm based on spectral feature, MF-SRU classification accuracy and the kappa coefficient were increased by 9% and 0.1 respectively, which means DEM, GLCM textures, and NDVI features could result in better classification. Additionally, compared with the traditional remote sensing image classification algorithm, SVM, based on a multi-feature model (MF-SVM), the overall accuracy and kappa coefficient of the proposed method were increased by 1%, which means the SRU algorithm could result in better classification. Table 4 shows that the MF-SRU algorithm yields the lowest mangrove commission and omission errors. In other words, it has the highest recognition rate and the lowest error rate of mangroves. Relative to the SRU algorithm, the MF-SRU method’s mangrove commission and omission errors were reduced by 1.5%, and compared with MF-SVM, the proposed method’s mangrove commission and omission errors were reduced by 13.5% and 0.5%, respectively. The experiment proves that the proposed method can improve the extraction accuracy of mangroves effectively.
5. Conclusions
This paper has presented a multi-feature joint sparse model (MF-SRU) method for remote sensing images. The MF-SRU optimization problem is solved by the simultaneous orthogonal matching pursuit (SOMP) algorithm. Some of the advantages of the proposed MF-SRU method are as follows: First, the model considers the spectral features, NDVI, DEM, and texture features of each pixel; second, the classifier based on joint sparse representation takes full account of the spatial similarity of neighboring pixels. The experimental results show that the proposed method can achieve a competitive classification effect, while in the future work, the proposed MF-SRU algorithm could still be further improved in some aspects; for example, assigning a different weight of different neighboring pixels according to the similarity between the test pixel and the neighboring pixels, learning a more compact dictionary, and designing a fast sparse representation classification method to reduce the computational complexity.
Author Contributions
Y.-M.L. conceived and designed the experiments; Y.O. performed the experiments; Y.-M.L. and H.-M.F. analyzed the data; Y.-M.L. contributed reagents/materials/ analysis tools; Y.-M.L. and Y.O. wrote the paper; all authors discussed the results and revised the manuscript.
Conflicts of Interest
The authors declare no conflict of interest.
References
- Manolakis, D.; Shaw, G. Detection algorithms for hyperspectral imaging applications. IEEE Signal Process. Mag. 2002, 19, 29–43. [Google Scholar] [CrossRef]
- Giri, C.; Ochieng, E.; Tieszen, L.L.; Zhu, Z.; Singh, A.; Loveland, T.; Masek, J.; Duke, N. Status and distribution of mangrove forests of the world using earth observation satellite data. Glob. Ecol. Biogeogr. 2011, 20, 154–159. [Google Scholar] [CrossRef]
- Rahman, M.M.; Ullah, M.R.; Lan, M.; Sumantyo, J.T.; Kuze, H.; Tateishi, R. Comparison of landsat image classification methods for detecting mangrove forests in sundarbans. Int. J. Remote Sens. 2013, 34, 1041–1056. [Google Scholar] [CrossRef]
- Zhao, C.; Qian, L. Comparison of remote sensing image supervision classification and unsupervised classification. J. Henan Univ. Nat. Sci. 2004, 34, 90–93. [Google Scholar]
- Gotsis, P.K.; Chamis, C.C.; Minnetyan, L. Classification of hyperspectral remote sensing images with support vector machines. IEEE Trans. Geosci. Remote Sens. 2004, 42, 1778–1790. [Google Scholar]
- Sisodia, P.S.; Tiwari, V.; Kumar, A. Analysis of Supervised Maximum Likelihood Classification for remote sensing image. In Proceedings of the IEEE Recent Advances and Innovations in Engineering, Jaipur, India, 9–11 May 2014; pp. 1–4. [Google Scholar]
- Darwish, A.; Leukert, K.; Reinhardt, W. Image Segmentation for the Purpose of Object-Based Classification. In Proceedings of the 2003 IEEE International Geoscience and Remote Sensing Symposium (IGARSS’03), Toulouse, France, 21–25 July 2003; pp. 2039–2041. [Google Scholar]
- Heumann, B.W. An object-based classification of mangroves using a hybrid decision tree—Support vector machine approach. Remote Sens. 2011, 3, 2440–2460. [Google Scholar] [CrossRef]
- Wright, J.; Yang, A.Y.; Ganesh, A.; Sastry, S.; Ma, Y. Robust face recognition via sparse representation. IEEE Trans. Pattern Anal. Mach. Intell. 2009, 31, 210–227. [Google Scholar] [CrossRef] [PubMed]
- Qian, Y.; Ye, M.; Zhou, J. Hyperspectral image classification based on structured sparse logistic regression and three-dimensional wavelet texture features. IEEE Trans. Geosci. Remote Sens. 2013, 51, 2276–2291. [Google Scholar] [CrossRef]
- Li, C.; Ma, Y.; Mei, X.; Ma, J. Hyperspectral image classification with robust sparse representation. IEEE Geosci. Remote Sens. Lett. 2016, 13, 641–645. [Google Scholar] [CrossRef]
- Yokoya, N.; Iwasaki, A. Object detection based on sparse representation and hough voting for optical remote sensing imagery. IEEE J. Sel. Top. Appl. Earth Obs. Remote Sens. 2015, 8, 2053–2062. [Google Scholar] [CrossRef]
- Zhang, E.; Zhang, X.; Liu, H.; Jiao, L. Fast multifeature joint sparse representation for hyperspectral image classification. IEEE Geosci. Remote Sens. Lett. 2015, 12, 1397–1401. [Google Scholar] [CrossRef]
- Wang, Z.; Liu, J.; Xue, J.H. Joint sparse model-based discriminative K-SVD for hyperspectral image classification. Signal Process. 2016, 133, 144–155. [Google Scholar] [CrossRef]
- Chen, Y.; Nasrabadi, N.M.; Tran, T.D. Hyperspectral image classification using dictionary-based sparse representation. IEEE Trans. Geosci. Remote Sens. 2011, 49, 3973–3985. [Google Scholar] [CrossRef]
- Chen, S.S.; Donoho, D.L.; Saunders, M.A. Atomic decomposition by basis pursuit. SIAM Rev. 2001, 43, 129–159. [Google Scholar] [CrossRef]
- Tropp, J.; Gilbert, A. Signal recovery from random measurements via orthogonal matching pursuit. IEEE Trans. Inf. Theory 2007, 53, 4655–4666. [Google Scholar] [CrossRef]
- Tropp, J.A.; Gilbert, A.C.; Strauss, M.J. Algorithms for simultaneous sparse approximation. Part I: Greedy pursuit. Signal Process 2006, 86, 572–588. [Google Scholar] [CrossRef]
- Liu, K.; Li, X.; Shi, X.; Wang, S. Monitoring mangrove forest changes using remote sensing and GIS data with decision-tree learning. Wetlands 2008, 28, 336–346. [Google Scholar] [CrossRef]
- Liao, B.W.; Zhang, Q.M. Area, Distribution and Species Composition of Mangroves in China. Wetl. Sci. 2014, 12, 435–440. [Google Scholar]
- Adame, M.F.; Neil, D.; Wright, S.F.; Lovelock, C.E. Sedimentation within and among mangrove forests along a gradient of geomorphological settings. Estuar. Coast. Shelf Sci. 2010, 86, 21–30. [Google Scholar] [CrossRef]
- Deering, D.W. Rangeland Reflectance Characteristics Measured by Aircraft and Spacecraft Sensors; Texas A & M University: College Station, TX, USA, 1978. [Google Scholar]
- Soh, L.-K.; Tsatsoulis, C. Texture analysis of SAR sea ice imagery using gray level co-occurrence matrices. IEEE Trans. Geosci. Remote Sens. 1999, 37, 780–795. [Google Scholar] [CrossRef]
- Tetuko, J. Analysis of co-occurrence and discrete wavelet transform textures for differentiation of forest and non-forest vegetation in very-high-resolution optical-sensor imagery. Int. J. Remote Sens. 2008, 29, 3417–3456. [Google Scholar]
- Soltani-Farani, A.; Rabiee, H. When pixels team up: Spatially weighted sparse coding for hyperspectral image classification. IEEE Geosci. Remote Sens. Lett. 2015, 12, 107–111. [Google Scholar] [CrossRef]
- Aharon, M.; Elad, M.; Bruckstein, A. K-SVD: An algorithm for designing overcomplete dictionaries for sparse representation. IEEE Trans. Signal Process. 2006, 54, 4311–4322. [Google Scholar] [CrossRef]
Figure 1.
Contextual information.

Figure 2.
(a) Sparse model; (b) joint sparse model.

Figure 3.
(a) TM Red Green Blue (RGB) (bands 5, 4, and 3) remote sensing image in the Zhangjiang estuary of Southeastern China on 25 September 2006. Classified images derived from (b) SRU, (c) MF-SVM, and (d) MF-SRU.
Figure 3.
(a) TM Red Green Blue (RGB) (bands 5, 4, and 3) remote sensing image in the Zhangjiang estuary of Southeastern China on 25 September 2006. Classified images derived from (b) SRU, (c) MF-SVM, and (d) MF-SRU.


Table 1.
Land-cover types in classification.
| Class Name | Land-Cover Class | Description |
|---|---|---|
| C1 | Mangroves | Mangrove forests |
| C2 | Upland vegetation | Deciduous or evergreen forest land, orchards, and tree groves |
| C3 | Urban areas | Residential, commercial, industrial and other developed land |
| C4 | Water | Permanent open water, lakes reservoirs, bays, and estuaries |
| C5 | Littoral zone | Land in the intertidal zone or the transitional zone |
| C6 | Fallow land | Fields no longer under cultivation |
| C7 | Agricultural land | Crop fields, paddy fields, and grasslands |
Table 2.
Comparison of the confusion matrices.
| Class | SRU | MF-SVM | MF-SRU | |||||||||||||||||||||
|---|---|---|---|---|---|---|---|---|---|---|---|---|---|---|---|---|---|---|---|---|---|---|---|---|
| C1 | C2 | C3 | C4 | C5 | C6 | C7 | Total | C1 | C2 | C3 | C4 | C5 | C6 | C7 | Total | C1 | C2 | C3 | C4 | C5 | C6 | C7 | Total | |
| C1 | 180 | 20 | 0 | 0 | 0 | 0 | 19 | 219 | 182 | 0 | 0 | 0 | 0 | 0 | 63 | 245 | 183 | 0 | 0 | 0 | 0 | 0 | 36 | 219 |
| C2 | 5 | 102 | 0 | 0 | 0 | 5 | 41 | 153 | 0 | 194 | 0 | 0 | 0 | 31 | 0 | 225 | 2 | 192 | 0 | 8 | 0 | 30 | 0 | 232 |
| C3 | 0 | 12 | 192 | 0 | 0 | 14 | 0 | 218 | 0 | 0 | 170 | 0 | 0 | 15 | 0 | 185 | 0 | 0 | 192 | 0 | 0 | 9 | 0 | 201 |
| C4 | 0 | 0 | 0 | 198 | 5 | 0 | 0 | 203 | 0 | 0 | 0 | 200 | 3 | 0 | 0 | 203 | 0 | 0 | 0 | 192 | 5 | 0 | 31 | 228 |
| C5 | 1 | 0 | 0 | 2 | 195 | 0 | 25 | 223 | 0 | 0 | 0 | 0 | 197 | 0 | 2 | 199 | 0 | 0 | 0 | 0 | 195 | 0 | 1 | 196 |
| C6 | 0 | 2 | 8 | 0 | 0 | 140 | 0 | 150 | 0 | 6 | 28 | 0 | 0 | 154 | 0 | 188 | 0 | 8 | 8 | 0 | 0 | 161 | 0 | 177 |
| C7 | 14 | 64 | 0 | 0 | 0 | 41 | 115 | 234 | 18 | 0 | 2 | 0 | 0 | 0 | 135 | 155 | 15 | 0 | 0 | 0 | 0 | 0 | 132 | 147 |
| Total | 200 | 200 | 200 | 200 | 200 | 200 | 200 | 1400 | 200 | 200 | 200 | 200 | 200 | 200 | 200 | 1400 | 200 | 200 | 200 | 200 | 200 | 200 | 200 | 1400 |
Table 3.
Comparison of the overall accuracy and kappa coefficients.
| SRU | MF-SVM | MF-SRU | |
|---|---|---|---|
| Overall/% | 80.1 | 88.0 | 89.1 |
| Kappa | 0.768 | 0.860 | 0.873 |
Table 4.
Comparison of commission and omission errors.
| SRU | MF-SVM | MF-SRU | ||||
|---|---|---|---|---|---|---|
| Class | Com/% | Omi/% | Com/% | Omi/% | Com/% | Omi/% |
| C1 | 19.5 | 10.0 | 31.5 | 9.0 | 18.0 | 8.5 |
| C2 | 25.5 | 49.0 | 15.5 | 3.0 | 20.0 | 4.0 |
| C3 | 13.0 | 4.0 | 7.5 | 15.0 | 4.5 | 4.0 |
| C4 | 2.5 | 1.0 | 1.5 | 0.0 | 18.0 | 4.0 |
| C5 | 14.0 | 2.5 | 1.0 | 1.5 | 0.5 | 2.5 |
| C6 | 5.0 | 30.0 | 17.0 | 23.0 | 8.0 | 19.5 |
| C7 | 59.5 | 42.5 | 10.0 | 32.5 | 7.5 | 34.0 |
© 2017 by the authors. Licensee MDPI, Basel, Switzerland. This article is an open access article distributed under the terms and conditions of the Creative Commons Attribution (CC BY) license (http://creativecommons.org/licenses/by/4.0/).
Share and Cite
MDPI and ACS Style
Luo, Y.-M.; Ouyang, Y.; Zhang, R.-C.; Feng, H.-M. Multi-Feature Joint Sparse Model for the Classification of Mangrove Remote Sensing Images. ISPRS Int. J. Geo-Inf. 2017, 6, 177. https://doi.org/10.3390/ijgi6060177
AMA Style
Luo Y-M, Ouyang Y, Zhang R-C, Feng H-M. Multi-Feature Joint Sparse Model for the Classification of Mangrove Remote Sensing Images. ISPRS International Journal of Geo-Information. 2017; 6(6):177. https://doi.org/10.3390/ijgi6060177
Chicago/Turabian StyleLuo, Yan-Min, Yi Ouyang, Ren-Cheng Zhang, and Hsuan-Ming Feng. 2017. "Multi-Feature Joint Sparse Model for the Classification of Mangrove Remote Sensing Images" ISPRS International Journal of Geo-Information 6, no. 6: 177. https://doi.org/10.3390/ijgi6060177
Note that from the first issue of 2016, this journal uses article numbers instead of page numbers. See further details here.