
Investigation on the Expansion of Urban Construction Land Use Based on the CART-CA Model
by
Yongxiang Yao
1,2,3, 
Jia Li
1,2,3,*,
Xingguo Zhang
4,
Ping Duan
1,2,3,
Shuang Li
4 and
Quanli Xu
1,2,3 1
School of Tourism and Geographical Science, Yunnan Normal University, Kunming 650500, China
2
Key Laboratory of Remote Sensing of Resources and Environment of Yunnan Province, Kunming 650500, China
3
Geospatial Information Technology Engineering Research Center of Yunnan Province, Kunming 650500, China
4
School of Geographic Sciences, Xinyang Normal University, 237 Nanhu Road, Xinyang 464000, China
*
Author to whom correspondence should be addressed.
ISPRS Int. J. Geo-Inf. 2017, 6(5), 149; https://doi.org/10.3390/ijgi6050149
Submission received: 21 January 2017
/
Revised: 18 April 2017
/
Accepted: 3 May 2017
/
Published: 11 May 2017
Abstract
:Change in urban construction land use is an important factor when studying urban expansion. Many scholars have combined cellular automata (CA) with data mining algorithms to perform relevant simulation studies. However, the parameters for rule extraction are difficult to determine and the rules are simplex, and together, these factors tend to introduce excessive fitting problems and low modeling accuracy. In this paper, we propose a method to extract the transformation rules for a CA model based on the Classification and Regression Tree (CART). In this method, CART is used to extract the transformation rules for the CA. This method first adopts the CART decision tree using the bootstrap algorithm to mine the rules from the urban land use while considering the factors that impact the geographic spatial variables in the CART regression procedure. The weights of individual impact factors are calculated to generate a logistic regression function that reflects the change in urban construction land use. Finally, a CA model is constructed to simulate and predict urban construction land expansion. The urban area of Xinyang City in China is used as an example for this experimental research. After removing the spatial invariant region, the overall simulation accuracy is 81.38% and the kappa coefficient is 0.73. The results indicate that by using the CART decision tree to train the impact factor weights and extract the rules, it can effectively increase the simulation accuracy of the CA model. From convenience and accuracy perspectives for rule extraction, the structure of the CART decision tree is clear, and it is very suitable for obtaining the cellular rules. The CART-CA model has a relatively high simulation accuracy in modeling urban construction land use expansion, it provides reliable results, and is suitable for use as a scientific reference for urban construction land use expansion.
1. Introduction
The cellular automata (CA) model is a grid dynamics model that uses completely discrete state, time, and space variables as well as local spatial interaction and temporal causality [1]. The CA model is advantageous for simulating the evolution of urban land use [2].
Early CA models mainly adopted the multi-criterion method to simulate land use changes. The main approaches included Markov China, multi-criteria decision making and grayscale, and knowledge discovery of rough sets. These transformation methods are mainly expressed using mathematical formulas, but determination of the parameters for the formulas is very difficult [3]. Currently, Chinese and international scholars use artificial intelligence (AI) methods such as the ant colony algorithm, the support vector machine, and the neural network algorithm [4,5,6,7,8,9,10], to define the transformation rules of a model. These artificial intelligence algorithms can macroscopically reflect the interactive relationships among the structure, function, and behavior of the land use system. However, the model parameters are difficult to determine when extracting the impact factor rules, and the obtained parameters are generally static, which increases the uncertainty of the factors when using the model for global simulations and affects the accuracy of the simulation. On the other hand, the traditional techniques of statistical analysis, such as linear regression, logistic regression, and logarithmic linear regression [11,12,13,14], also have wide applications in the study of urban expansion. The logistic regression has advantages regarding the aspects of the dependent variable and independent variable, and we can obtain the importance of different impacting factors. However, the traditional logistic regression is prone to the problem of over fitting. By summarizing the problems above, we introduce the Classification and Regression Tree (CART) algorithm in this paper [15]. The CART decision tree has a clear structure, fast operation speed, and convenient processing of spatial data. By combining it with the logistic regression and cellular automaton model, we can fairly well consider the impacting factors that affect the change of land use. The model is trained to generate a concise binary tree, retain the optimum classification tree after pruning, and obtain the impact factor weights to construct the logistic regression function. The CA model with the CART decision tree extracts the rules in a reasonable fashion and can improve the accuracy of the simulations of the CA model. In this paper, we adopt the CART mining technique and optimize the extraction rules for the CA model to improve simulation accuracy.
In this study, the urban area of Xinyang City was selected as the study area for this experimental research and the CART algorithm was adopted to construct and optimize the CA model for simulating and predicting urban construction land use expansion. Based on the results of the experiments to validate this technique, the CART-CA model is relatively accurate when simulating urban construction land use expansion in Xinyang City.
2. CART-CA Model
2.1. CART Decision Tree Based on the Bootstrap Algorithm
Transformation rule extraction for a CA model is the key component that allows the model to predict and simulate the evolution of urban construction land use accurately. However, when the model defines the transformation rules, the parameters are not easy to establish, creating challenges for extracting the rules. The CART decision tree can simply and rapidly train the weights of different spatial variables by constructing a binary tree. The earlier work of Burrows et al. (1995), Razi et al. (2005), and later, Westreich et al. (2010) and Yadav (2012), etc. [16,17,18,19], all adopted the CART decision tree algorithm for simulation and prediction purposes and achieved relatively good results. Consequently, in this paper, the CART decision tree is introduced for rule extraction for the CA model.
The CART decision tree algorithm was first proposed by Breiman et al. in 1984 [20]. Through cyclic analysis of training data that consist of measurement variables and objective variables, the algorithm uses a dyadic recursive partitioning scheme and applies the Gini coefficient to divide the current sample set into two subsets. Each generated non-leaf node has two branches, forming a binary decision tree. Meanwhile, the bootstrap algorithm is used during the training process of the CART decision tree algorithm to optimize its classification accuracy.
The bootstrap algorithm establishes a series of decision trees, and the established decision trees focus on the training data that were classified erroneously or misclassified [21]. Using this feature of the bootstrap method, different decision trees are established to determine the weights of the individual impact factors obtained by the CART decision tree, which are then used as the coefficients of a logistic regression function to fully consider the spatial features of urban construction land use. These relatively complex spatial variables include policy adjustments, local Gross Domestic Product (GDP), traffic conditions, natural conditions, and the influence of regional centers, all of which can affect the simulation of changes in urban construction land use. During the CART decision tree training process, to increase the accuracy of the transformation rules and consider the regional features or research area, the sample training process fully considers the spatial characteristics of the training data [22]. For example, the degree of transportation development from the suburban area to the urban center is an important factor that affects the change of land use in this area [23], and the spatial variables of the locations of government institutions should be carefully observed. In this paper, however, considering the data from the perspective of the research area characteristics, the difficulty of data acquisition and the impacting factors selected by previous studies [23], we selected the following factors to analyze the significance of different impact factors. We obtain the impacting coefficients for the factors and then, retain only the factors with large correlations; factors with small correlations are excluded (such as water bodies). Consequently, the training data include the following spatial variables: the distance to the city center, the distance to a highway road, the distance to a national highway, the distance to a district center, the distance to a provincial road, the distance to a town center, and the distance to a county road. We apply stratified random sampling to select 20% of the sampling points from the cellular areas transformed to urban land use and the cellular areas that may be transformed to urban cellular areas but have not yet been transformed. We calculate the distance from each sampling point (cellular) to the spatial impacting factor, derive n spatial variables (cellular properties), and, eventually, obtain the weights of the logistic regression function, , by training the CART decision tree:
here, is the attribute value of the kth spatial variable at position (i, j), obtained from the grid calculation.
The CART decision tree divides the m-dimensional cellular space into non-overlapping rectangles in a recursive manner [24]. Let be the attribute value of the kth spatial variable at position (i, j) and let k represent the spatial variable belonging to that position. The procedure is as follows:
Step 1: Select an independent variable . Then, select a value of that divides the m-dimensional space into two parts. All the points in one part satisfy < , and all the points in the other part satisfy > . Non-continuous variables have only two possible values for the attribute value, i.e., they are either equal or not equal to .
Step 2: Regression treatment. For the two parts derived above, reselect an attribute based on the procedure in Step 1 to further perform the partition until the entire m-dimensional space has been completely partitioned.
Step 3: Complete the establishment of the binary tree and judge the classification results of the binary tree (xij1, xij2, xij3, …, xijk) using the impurity measurement method. The smaller the Gini Coefficient index is, the better the classification results are.
Step 4: Conduct a post-cut of the established binary tree to eliminate useless nodes and retain the optimum tree. Then, assign the derived to , which is used as the weight of the kth spatial influence factor.
Step 5: Next, use the bootstrap algorithm to generate n trees for the training. It is necessary to repeat the preceding four steps and train the values of the individual impacting factors, , to construct the functional relationship. We use Z to express the impact factors of different spatial variables. Z is given by the following:
where Z represents the influence of all types of spatial variables in the classification rules of CART extraction on the change in urban construction land use, is a regression constant, is the coefficient for the relationship of the logistic regression function, and is the value of the kth impacting factors for the cell at location ij.
Step 6: In this study, we assigned the weight of different spatial impact factors from the training of the CART decision tree to the logistic regression function. The global development probability that a cell representing non-urban construction land use will be converted to urban construction land use under the action of different impacting factors, , is expressed as described in [25]:
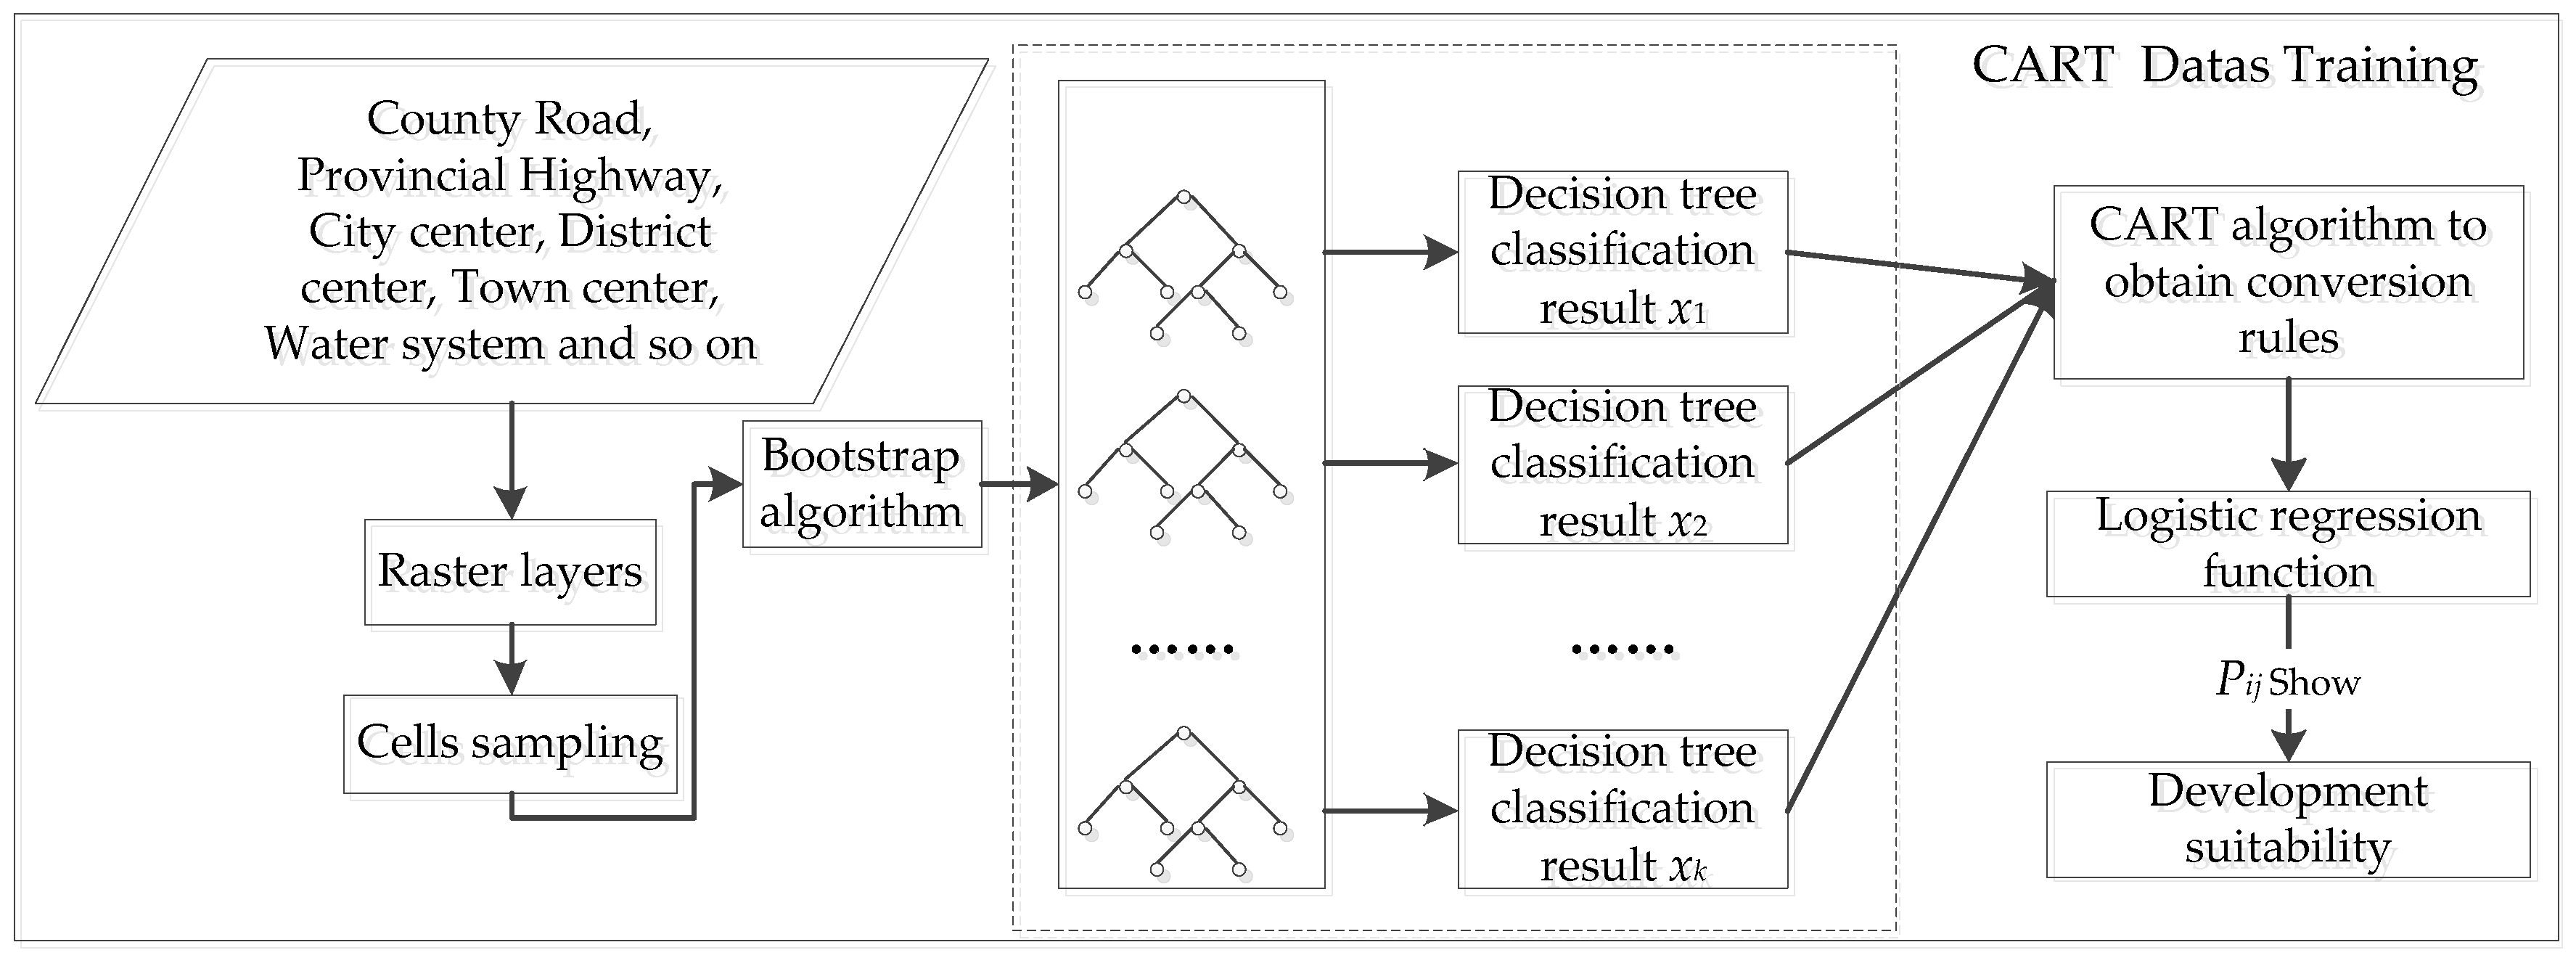
where is the probability of the cell located at position ij in the lattice space being converted to an urban construction land use state, and its magnitude is between 0 and 1. Z represents the influence of all types of spatial variables in the extraction rules of the CART decision tree on the change in urban construction land use. As shown in Figure 1, the results obtained after the final training of the CART decision tree shows the suitability of land for urban development.
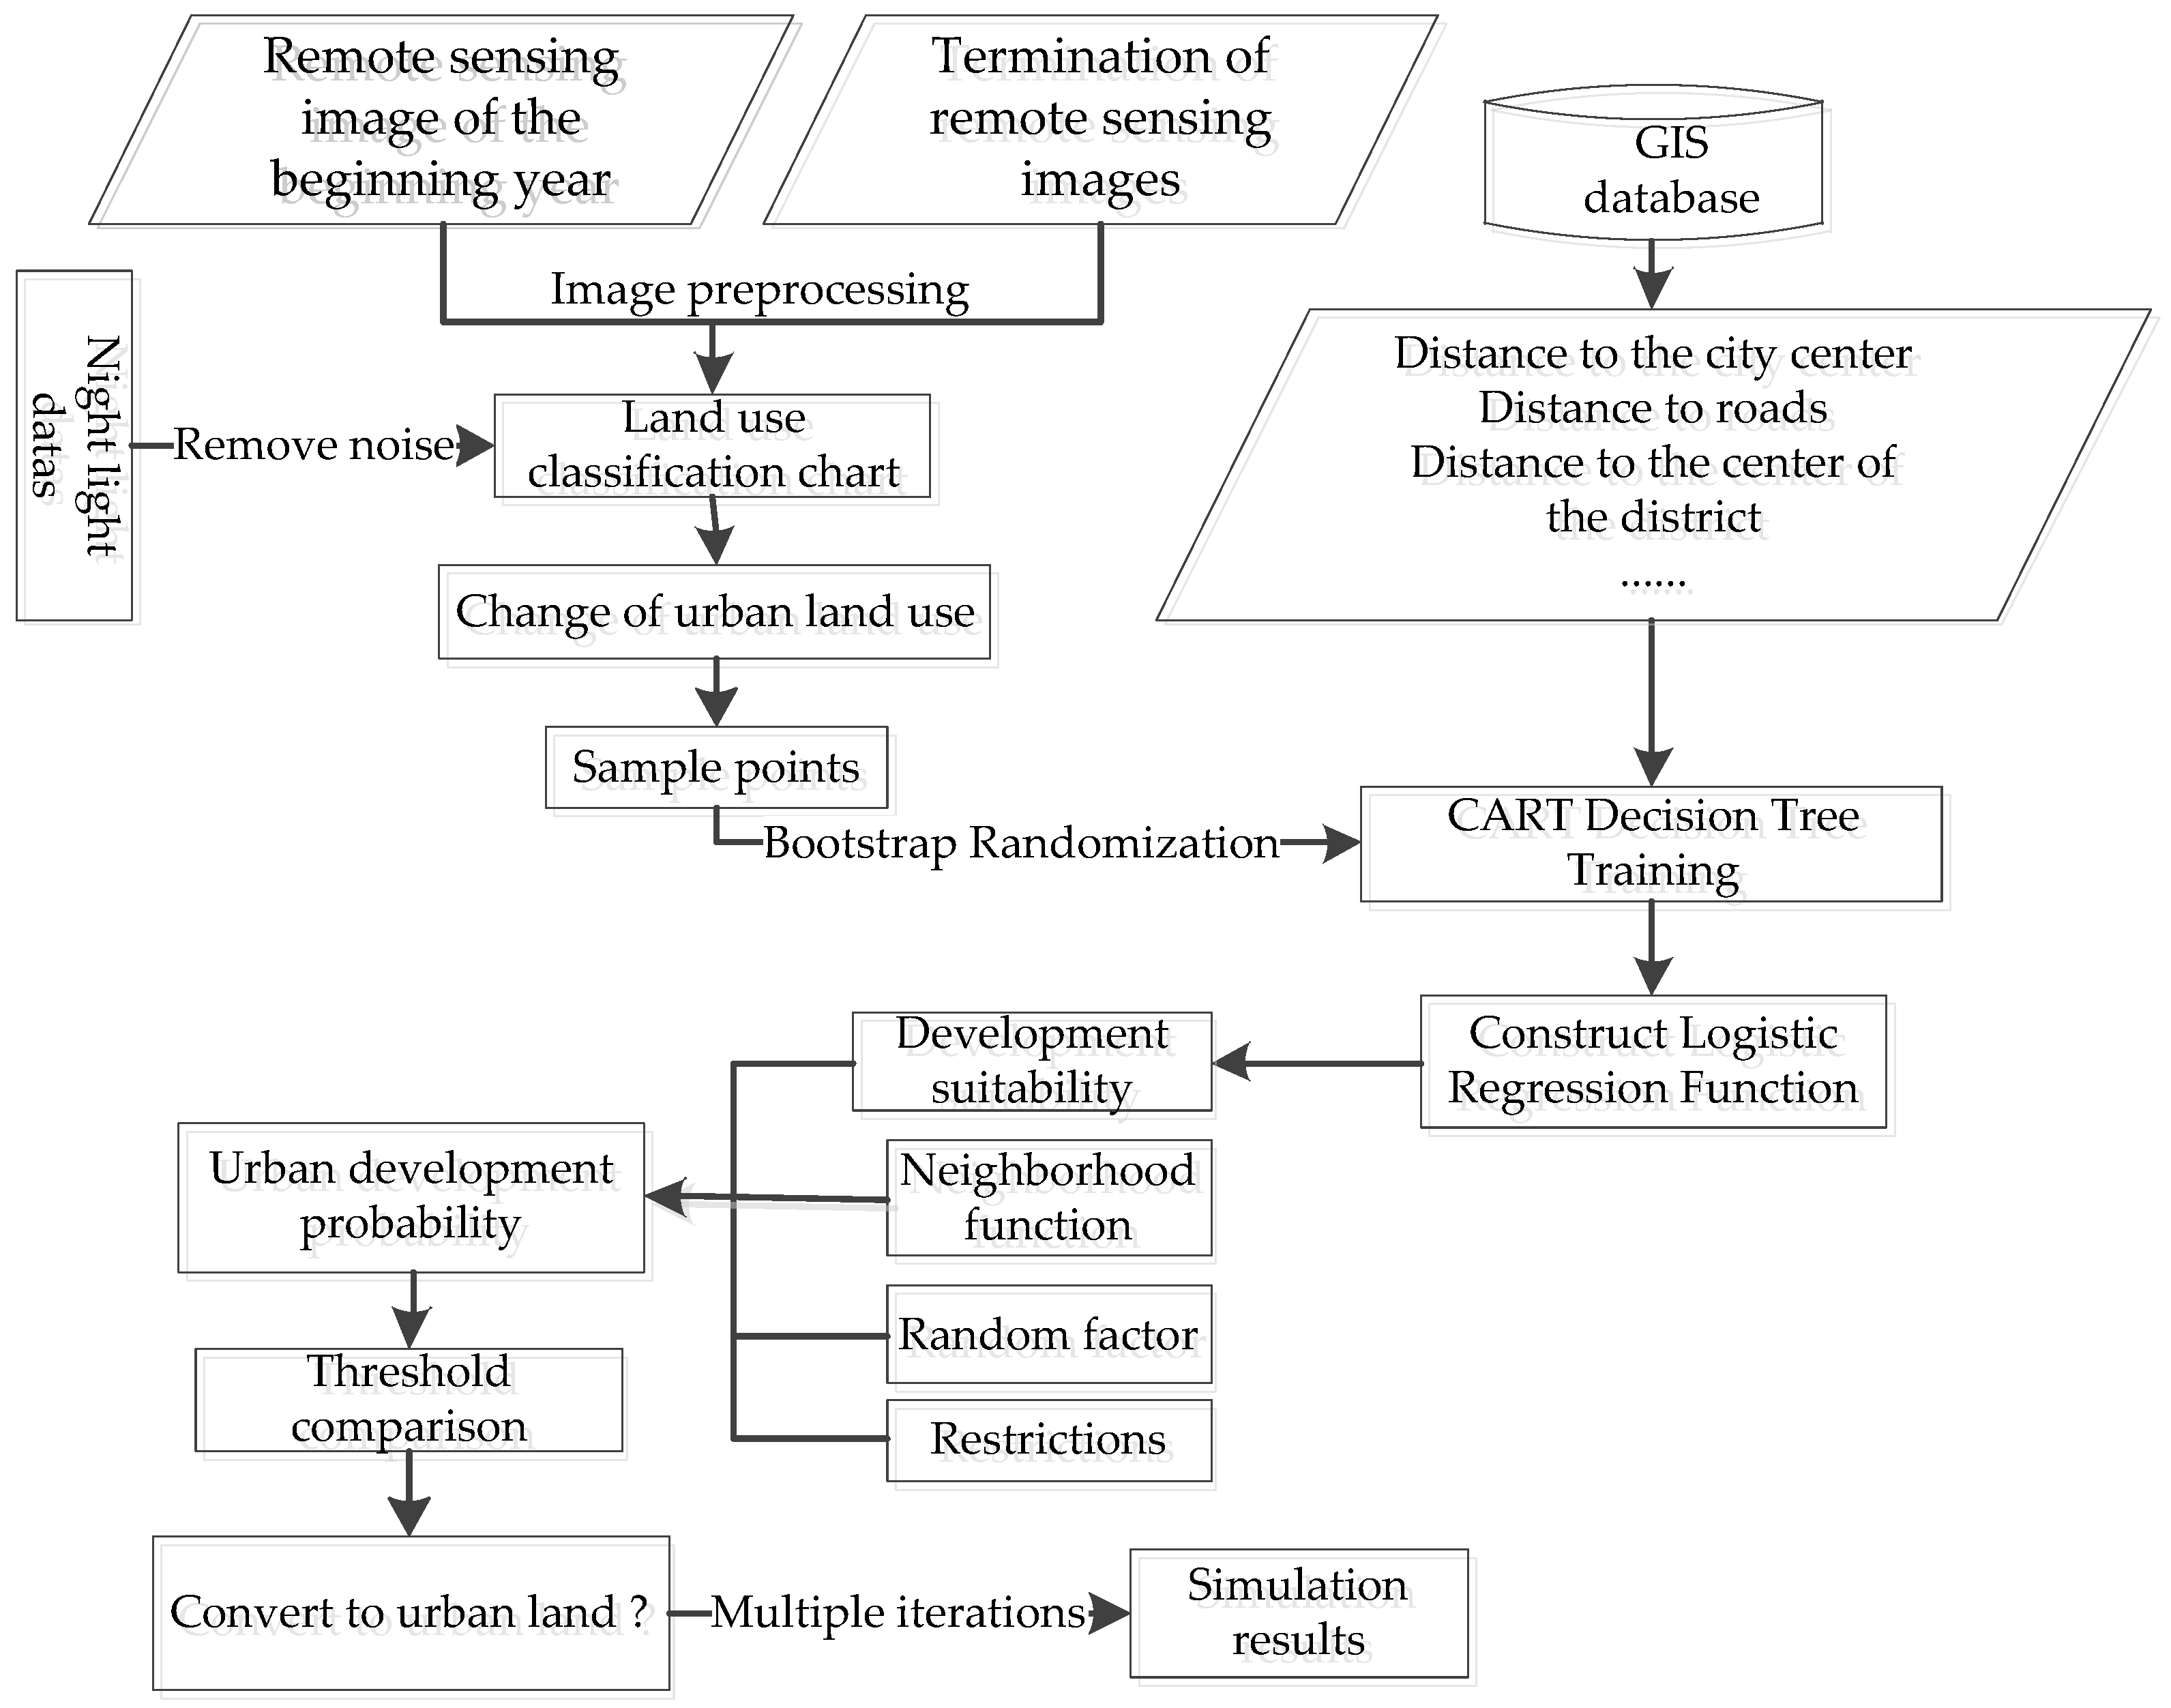
Figure 1 shows the detailed training process of the CART decision tree. We first preprocess the screened spatial impacting factors and then calculate the influence of distance on different impacting factors. Meanwhile, we conduct the cellular sampling. Then, we establish k decision trees through the Bootstrap algorithm and split the binary tree into single trees to retain the training results of the optimum binary tree as the weights of the spatial factors. Finally, we use the coefficients of the impact factors obtained through CART training as the weights of the logistic regression function when constructing the logistic regression equation to complete the data rule extraction.
2.2. CA Model
The core of the CA model is to determine the state change at time t by defining the transformation rules, namely, the state of a certain cell at time (t + 1), which is determined by both its state and its neighboring cells’ states at time t [26], as shown in Equation (4):
where S is the set of all the possible states in the CA; is the transformation rule; and is the neighboring region of a certain cell.
A CA model’s transformation rules usually include development suitability, random factors, and constraint conditions. Referring to the studies of Li et al. (2014) [27], we fully consider the influence of changes in land use types on the relevant neighborhood areas; therefore, we introduce the neighborhood function into the CA model to further improve the model. Consequently, the CA model in this paper is composed of four parts: (1) development suitability, (2) a neighborhood function, (3) random factors, and (4) constraint conditions.
2.2.1. Development Adaptability
Determining development suitability (i.e., the global probability of development) is the key task when constructing transformation rules in the CA model. Development suitability measures how suitable a cell of non-urban construction land use is for conversion to urban construction land use under the joint impact of multiple geographic factors (e.g., transportation factors, location factors, natural factors, and socio-economic factors). In this paper, a logistic function constructed by the training data from the CART decision tree is used to express development suitability:
where is the probability that the cell located at position ij in the lattice space will be converted to a state of urban construction land use, and its magnitude is between 0 and 1. Z represents the influence of all types of spatial variables in the extraction rules of the CART decision tree on changes in urban construction land use.
2.2.2. Moore Neighborhood
When determining whether a cell will experience a state conversion in land use type, the conversion probability is influenced by the cell’s relevant neighborhood domain. To determine the degree of influence of the neighborhood domain on the cell, we use the Moore neighborhood to reflect whether a certain cell will change to a construction land use type in the CA model [28,29], as shown by Equation (6):
where represents the effective value of a 3 × 3 neighborhood on the cell at time t and at position ij, is a conditional function; and is the current state of the cell. When the cell is already in an urban construction land use state, is 1; otherwise, it is 0.
2.2.3. Random Factor
The spatial changes that affect the simulations of changes in urban construction land use are relatively complex. Moreover, conventional spatial variables such as natural disasters, policy adjustment, local GDP, and climate change, are very difficult to represent as influence factors in the model. Therefore, an arbitrary term (a random factor) is introduced into the CART-CA model to account for unanticipated combined effects on the actual situation. The mathematical expression of this random factor (RA) follows [30]:
where RA is a random factor; is a random number between 0 and 1, and is the parameter that controls the arbitrary variable (i.e., it is defined to be a positive integer between 1 and 10).
2.2.4. Constraint Conditions
The change simulation in urban construction land use fully considers objective spatial constraint conditions such as restricted-development units (e.g., bodies of water, mountains, parks, and high-quality farmlands). Therefore, the spatial constraint conditions that the cell must meet to transform into an urban construction land use state are expressed as follows:
where is used to express whether the cell at position ij at time t can be converted into an urban construction land use state, and represents the current state of the cell. We can determine whether development occurs based on the cell’s attribute value because some cells cannot be developed. The state value of a restricted-development area is defined as 0, and the state value of a non-restricted-development area is defined as 1.
Using these four parts, the transformation rule of the CART-CA model is constructed to determine the specific development probability that a cell at position ij will be converted to urban construction land use at time (t + 1), :
Whether the cell is actually converted to urban construction land use is determined by the following condition:
where is a defined threshold at which the land use changes to urban construction land use. When the value of is greater than or equal to the threshold value and the cell at position ij is in a non-urban construction land use state, then the cell is converted to the urban construction land use state; otherwise, the cell’s state does not change.
2.3. Fulfillment of the CART-CA Model
We used the CART-CA model to perform a simulation of urban construction land use expansion. The main research ideas were as follows: (1) we determined the factors that affect changes in urban construction land use (including both natural and socio-economic factors); (2) based on the analysis of existing data, we adopted the CART decision tree to train the weight of impacting factors and construct the logistic regression function; (3) combined with the logistic regression function obtained by the CART training, we constructed a CA model to predict variations in urban construction land use; (4) we simulated and predicted changes in urban construction land use; and (5) we conducted an evaluation of the accuracy of the simulation results.
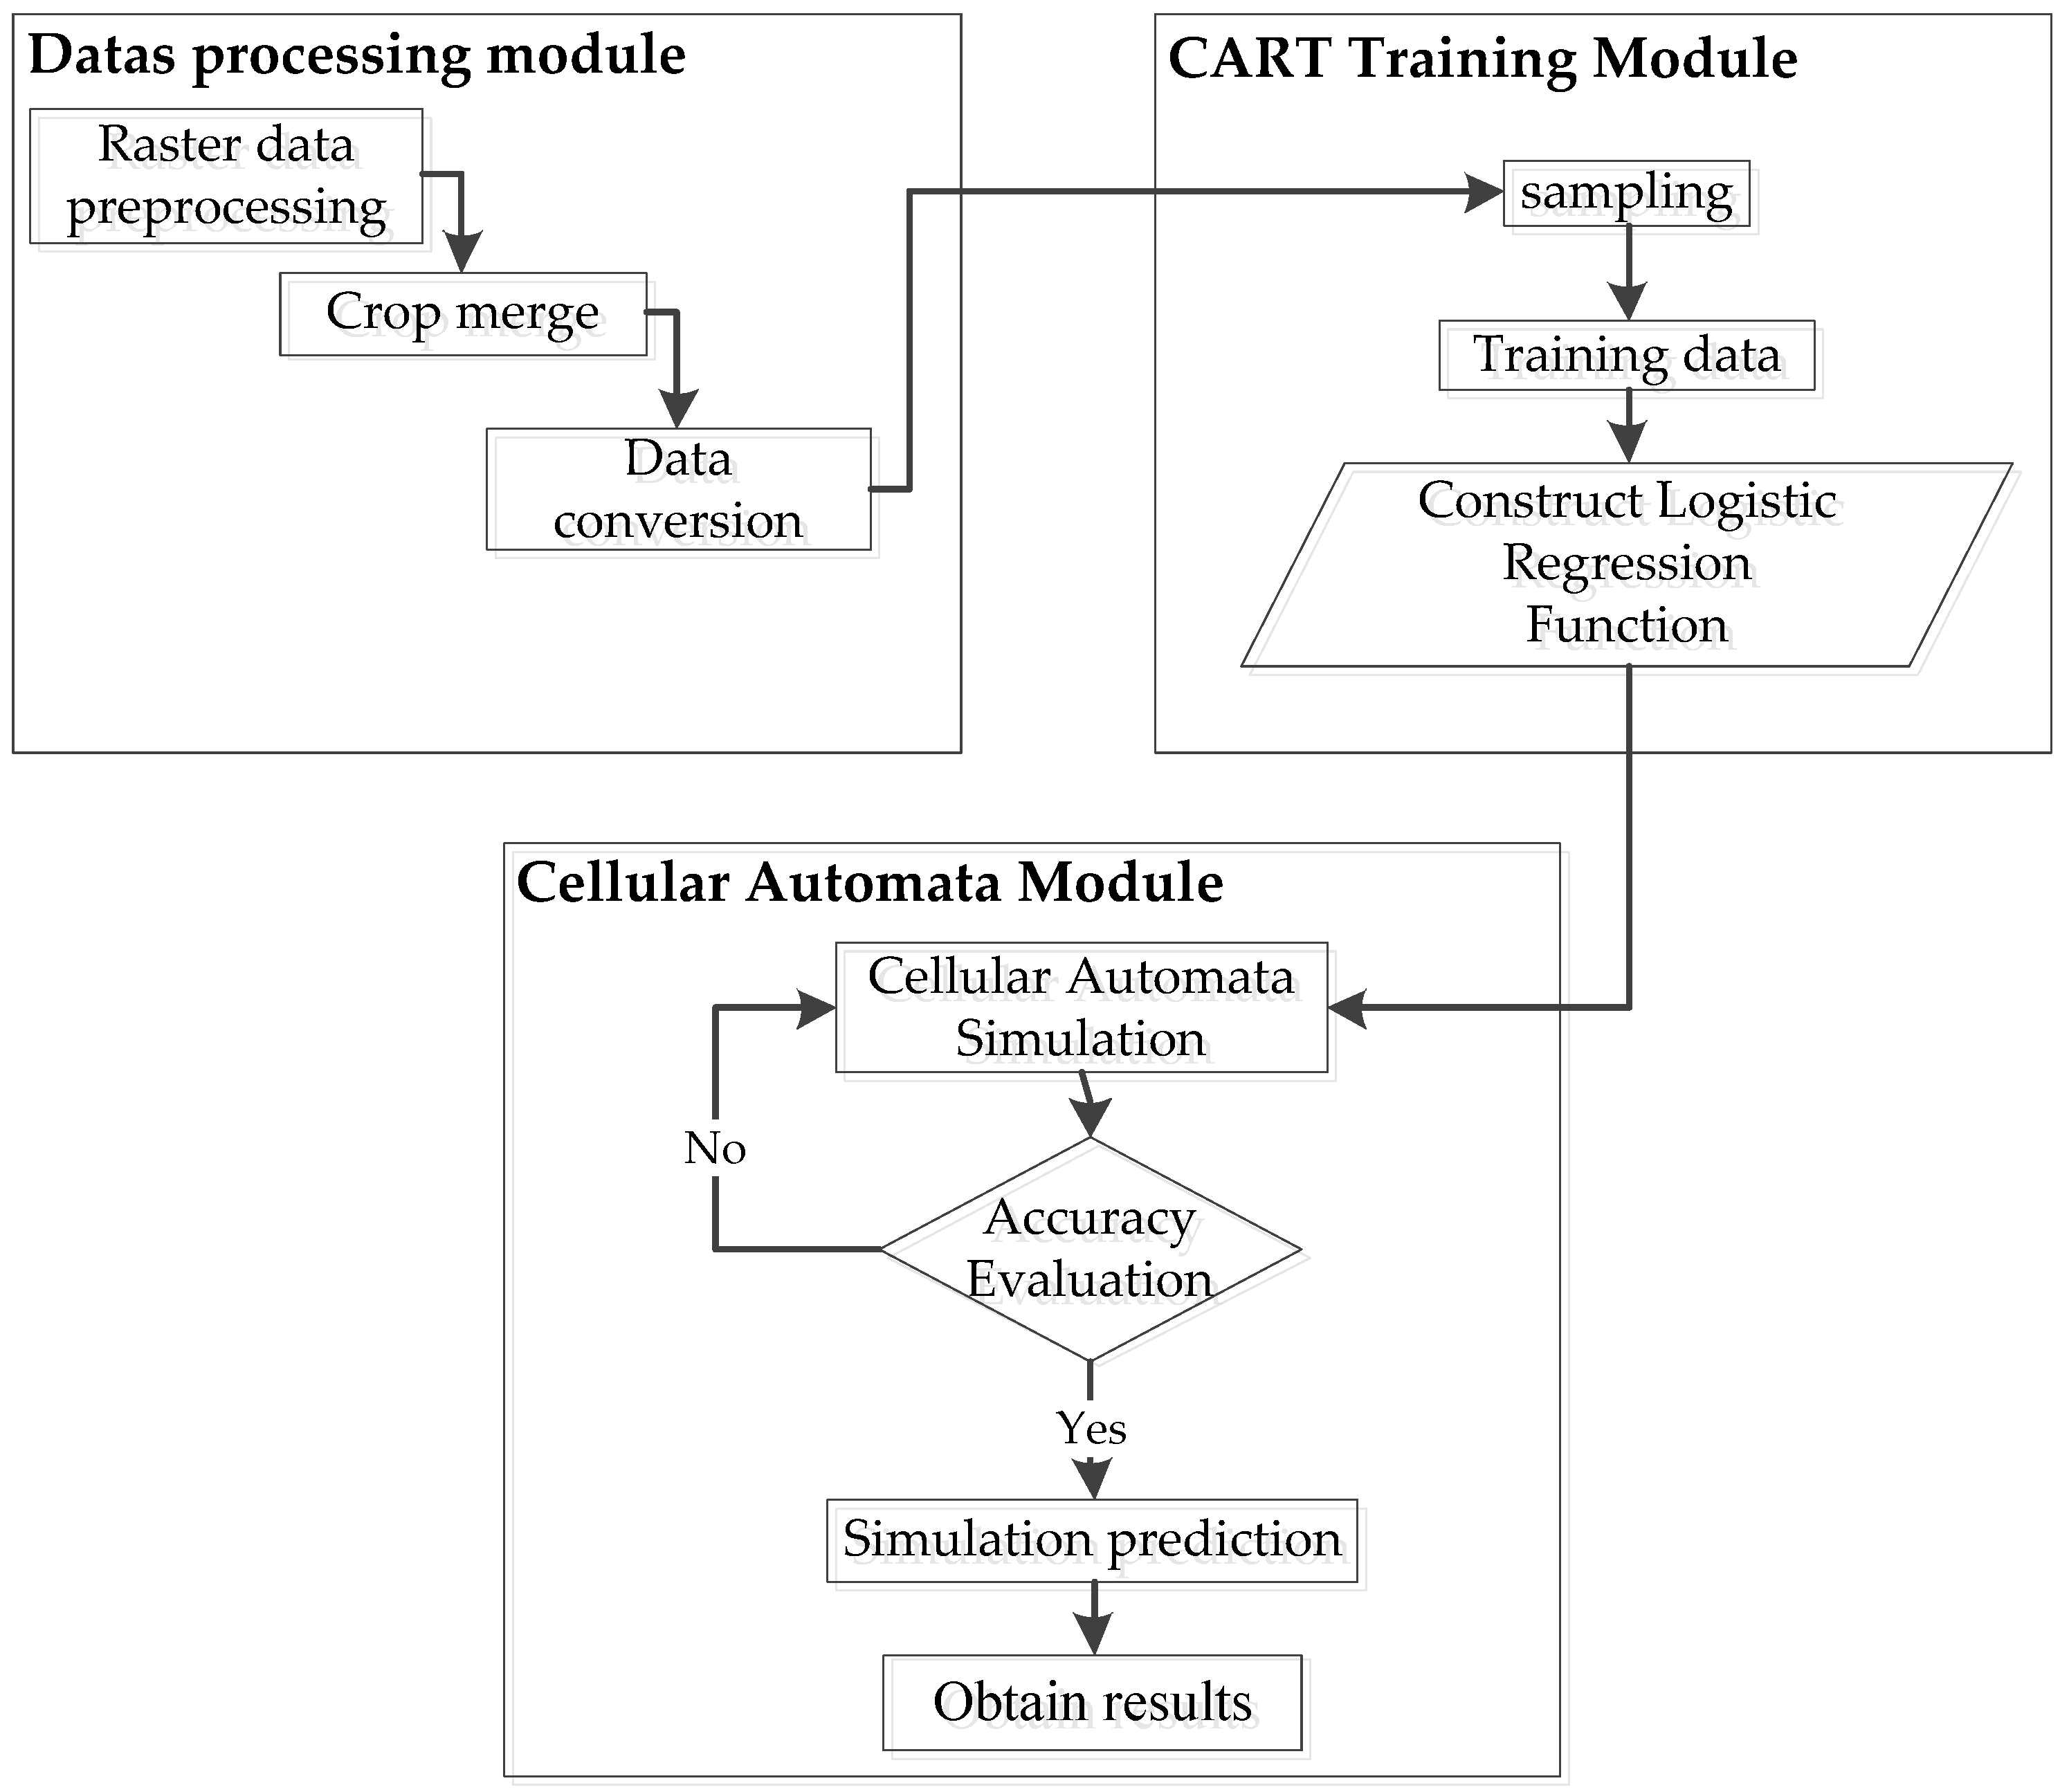
In this paper, the CART-CA model architecture is divided into three modules: the data processing module, the CART decision tree module, and the CA module. The data processing module performs the initial data preprocessing, clips and merges the lattice data, and performs initial classification [31]. The CART training module samples the data, completes the data preprocessing, extracts the impact factor rules, and generates the functional relations of the logistic regression. The CA module includes the definition and fulfillment of the different compositional parts in the CA model, i.e., data processing, simulation, accuracy evaluation, prediction analysis, and the results. Figure 2 shows the overall architecture of the CART-CA model.
3. Model Application in Urban Land Use
3.1. Research Area
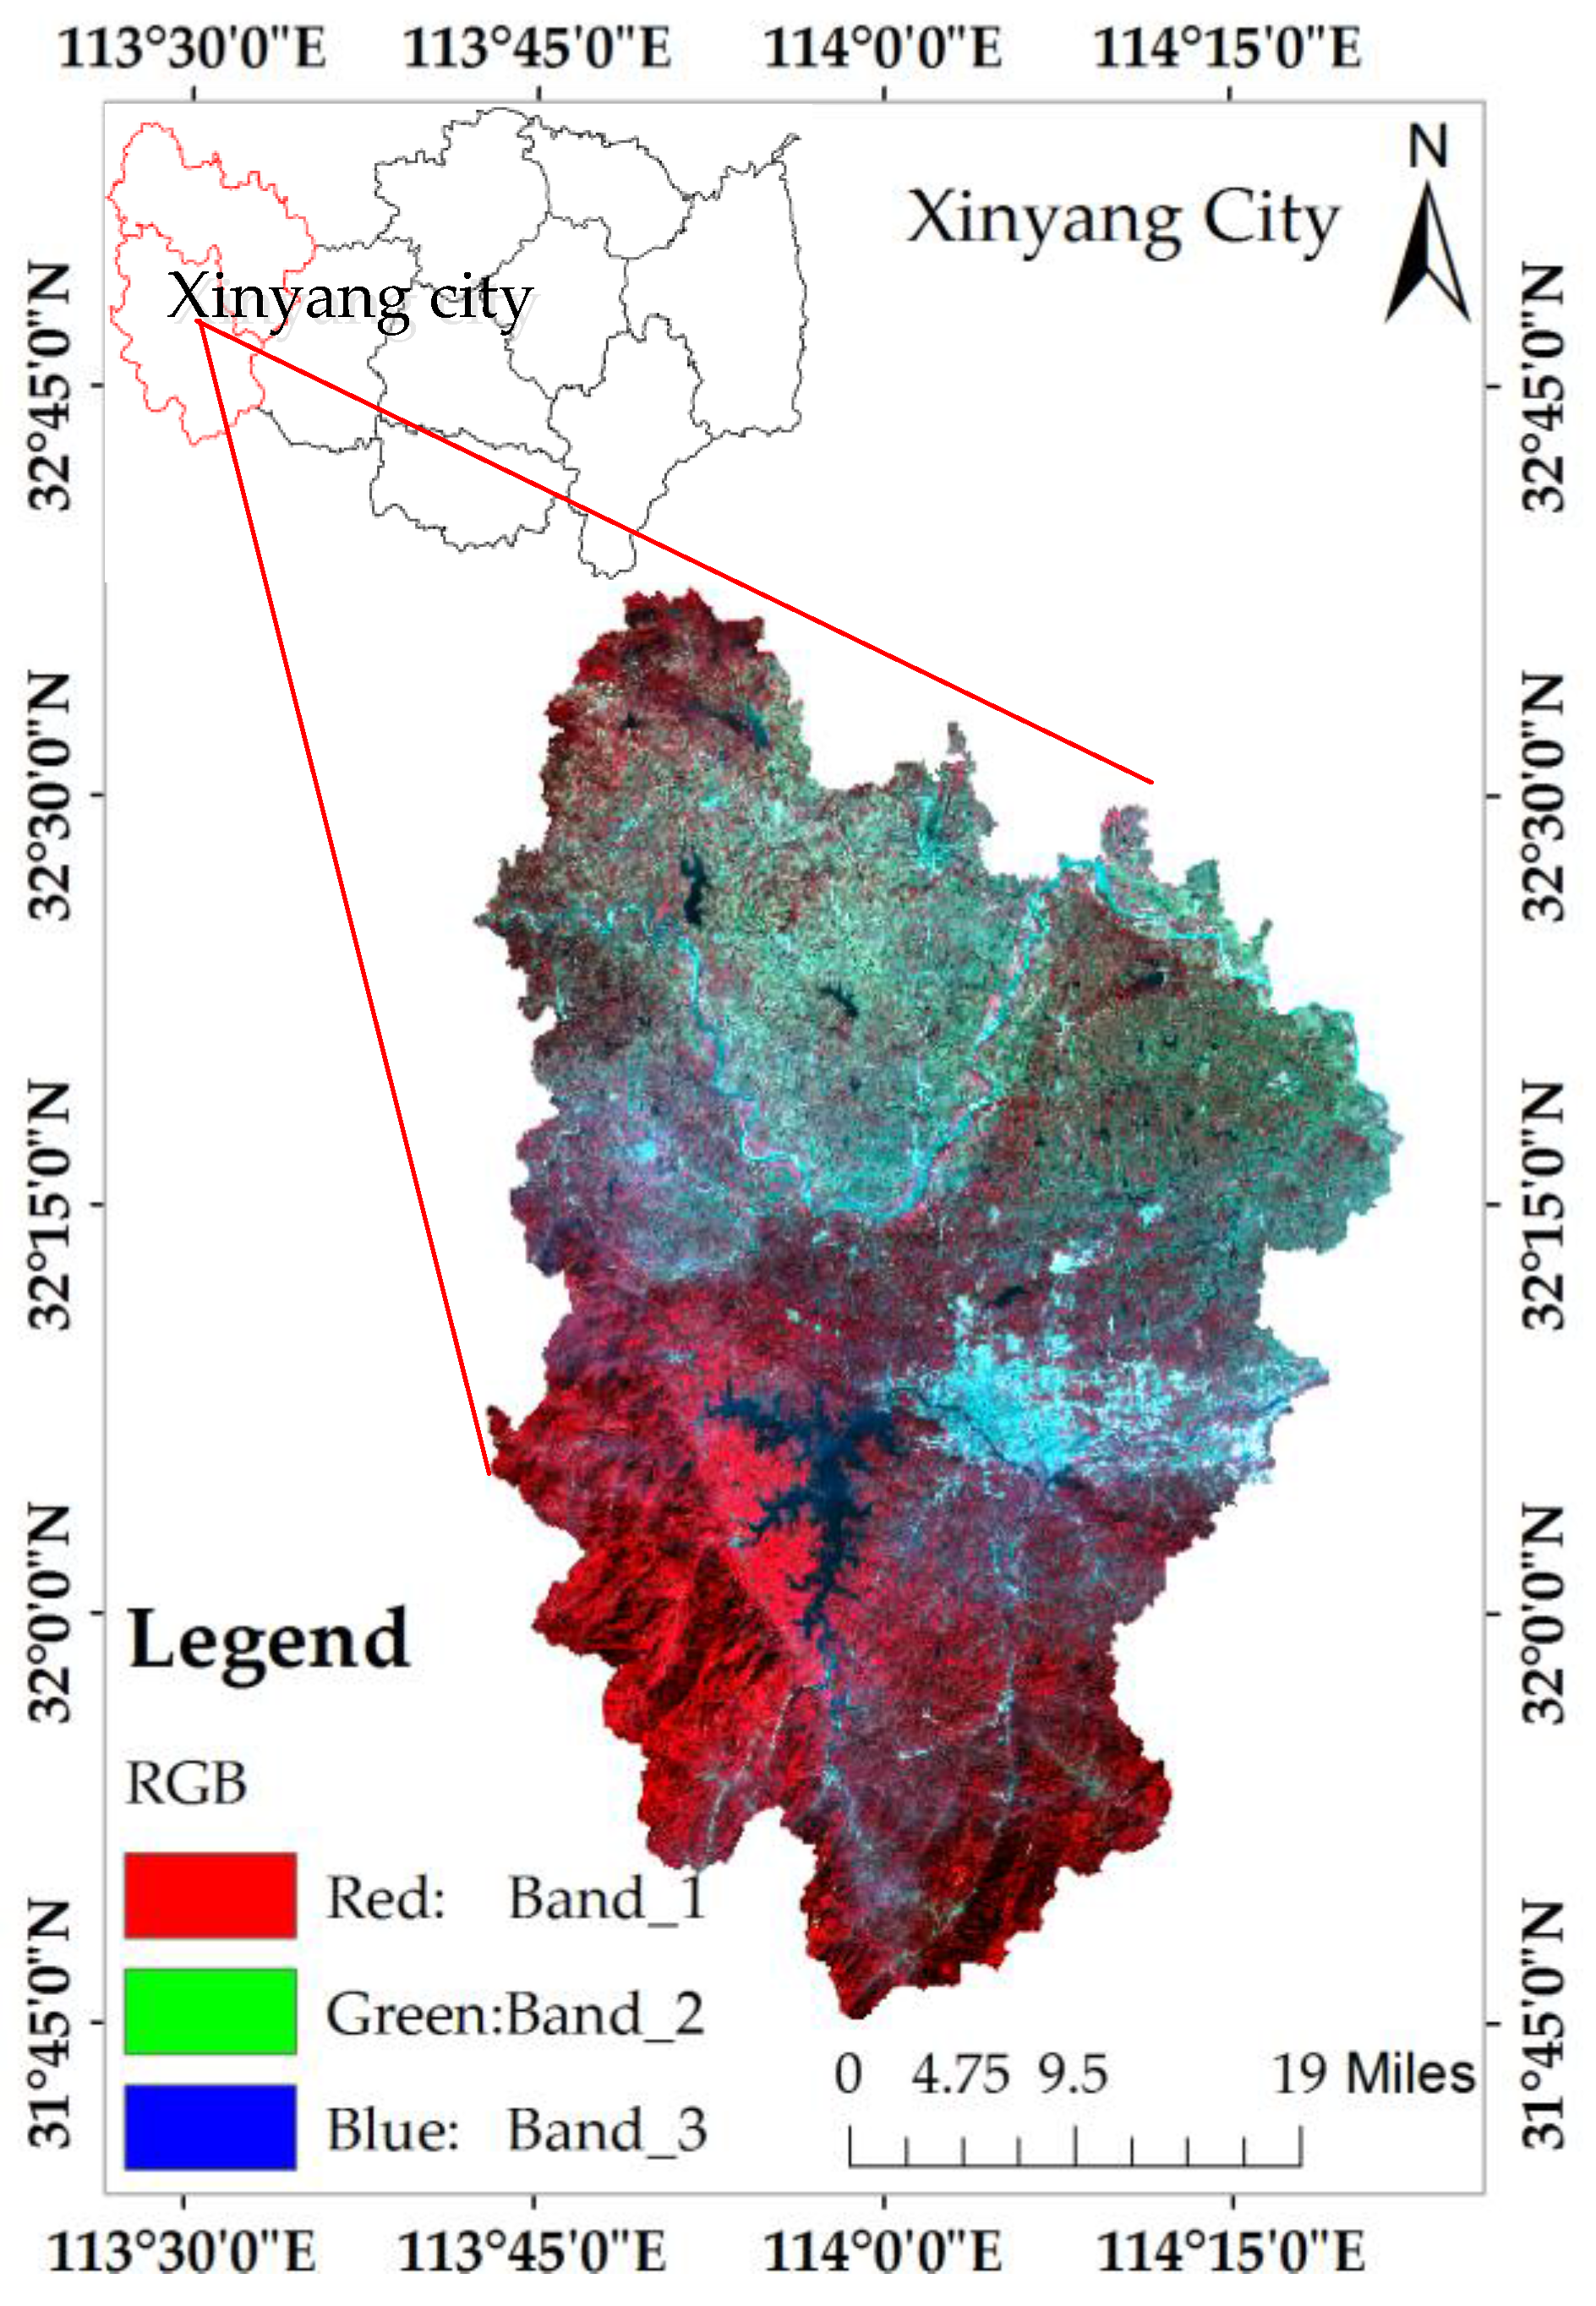
Xinyang City, Henan Province is rated one of the top ten best cities to live in China. Its total land area is 18,925 km2, of which the municipal district is 3691 km2. For this study, we selected the municipal district of Xinyang City (namely, the main city areas of the Shihe District and Pingqiao District), located at a longitude of 114°07′ E and a latitude of 32°13′ N. The study area is shown in Figure 3.The research area is an overlapped area including the Wuhan economic circle, the Wanjiang City zone, and the Central Plains Economic Region. Xinyang City is an important research example because of its critical location.
3.2. Data Source
The basic data for the model was sourced from Landsat remotely sensed satellite image data (The thematic mapper(TM)data were Landsat 5 images in 2008, Landsat 8 images were used in 2014) (satellites orbits 123/037 and 123/038, respectively) with a spatial resolution of the images of 30 m × 30 m and from a map of the administrative boundaries of Xinyang City, a road map of Xinyang City, a map of the distribution of the administrative centers, and a map of the distribution of the river systems in Xinyang City.
After obtaining the relevant research data, the data was preprocessed using the following steps: First, the TM data from both periods was classified into construction land and non-construction land use. After adopting a normal supervised classification method, many noisy points remain in the construction land use data (e.g., river systems, forest land/shrub, and bare land), and the classification error was relatively large. To improve the classification accuracy for construction land use, we added the Operational Linescan System (OLS) nighttime light data to the classification process to improve the accuracy. Changes in the light intensity of pixels in the OLS nighttime light data over time can represent changes in urban construction land use [32,33]. The OLS nighttime light data intuitively reflects the intensity of human activity [34] and can be used to effectively extract changes in the urban construction land use of a given area. Next, we input all the data into the CART decision tree for training.
3.3. Simulation of the CART-CA Model
3.3.1. Transformation Rules of the CART-CA Model
(1) Overall Development Probability
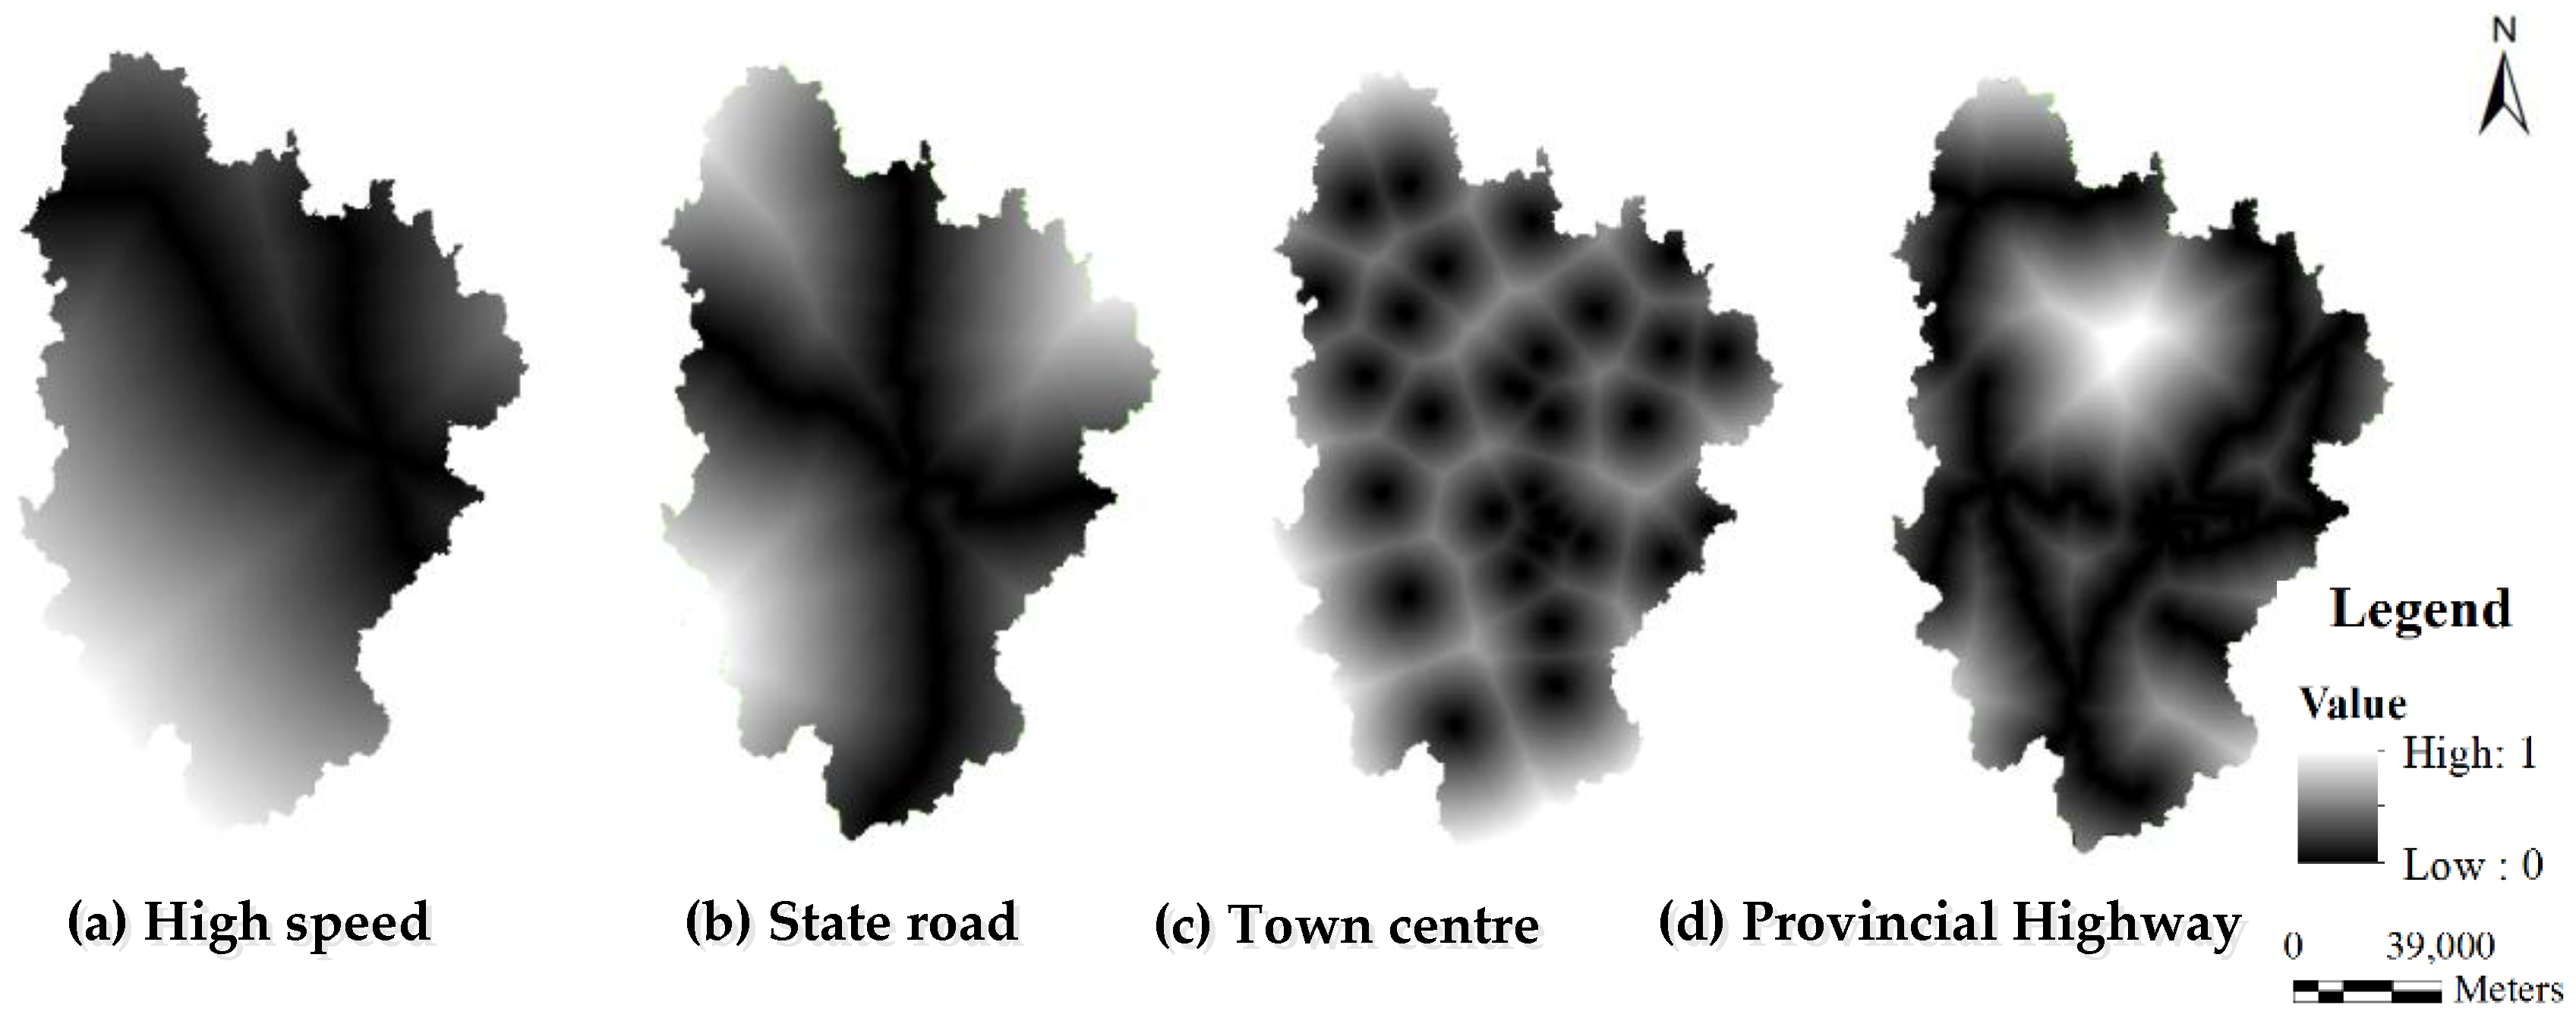
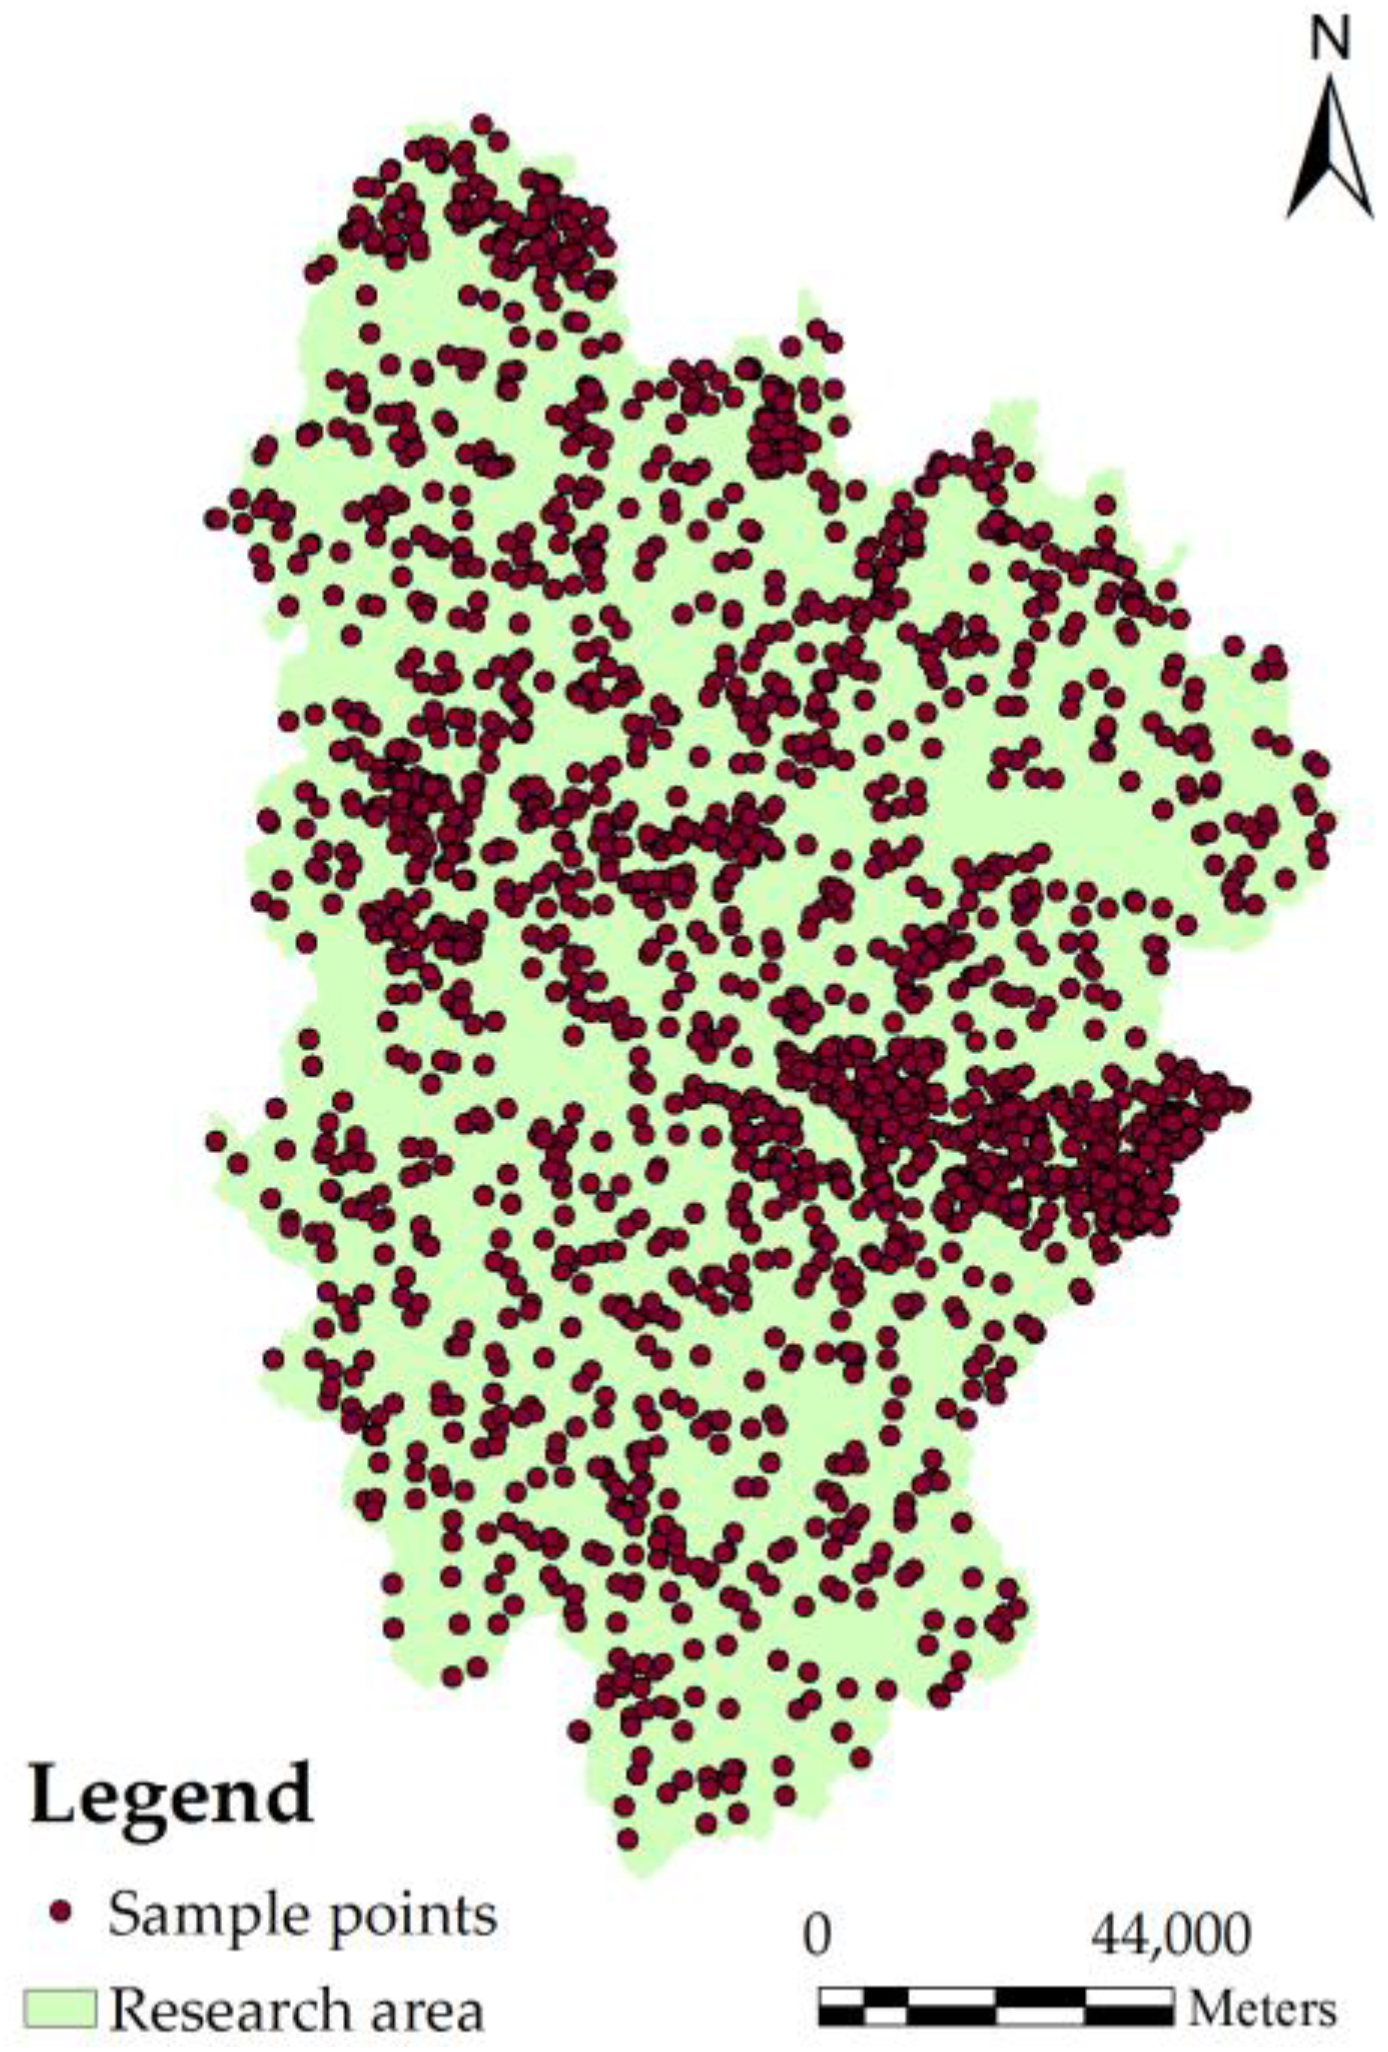
In this paper, because we consider the influences of the spatial characteristics of cells, we used the spatial variables of highway, national highway, provincial road, county road, urban center, district center, and town center as the impact factors for rule extraction using the CART decision tree. The impact factors are shown in Figure 4.We selected the image classification data of the TM urban construction land use in the research area (Xinyang City) during 2008 as the initial simulation data for the model. In the data processing module, the image classification data are first converted to text files and then used in the training module of the CART decision tree for sampling. The sampling results are shown in Figure 5.We derived the weights of different spatial variables and compared and analyzed the weights of the derived impacting factors. Based on the weights of the acquired impacting factors, we constructed the logistic regression function shown in Table 1.
In Table 1, X1 represents the distance to an urban center, X2 represents the distance to a highway road, X3 represents the distance to a national highway, X4 represents the distance to a district center, X5 represents the distance to a provincial road, X6 represents the distance to a town center, and X7 represents the distance to a county road.
As Table 1 shows, from 2008 to 2014, variable X6 (the distance to a town center) has the largest influence on urban development changes in Xinyang City, followed by the influence of county-level roads X7; the influences of the other factors have a smaller proportional effect. In the main research area, five streets in the Pingqiao District and eight streets in the Shihe District are densely distributed in the city center, which further increases the weight of these impact factors.
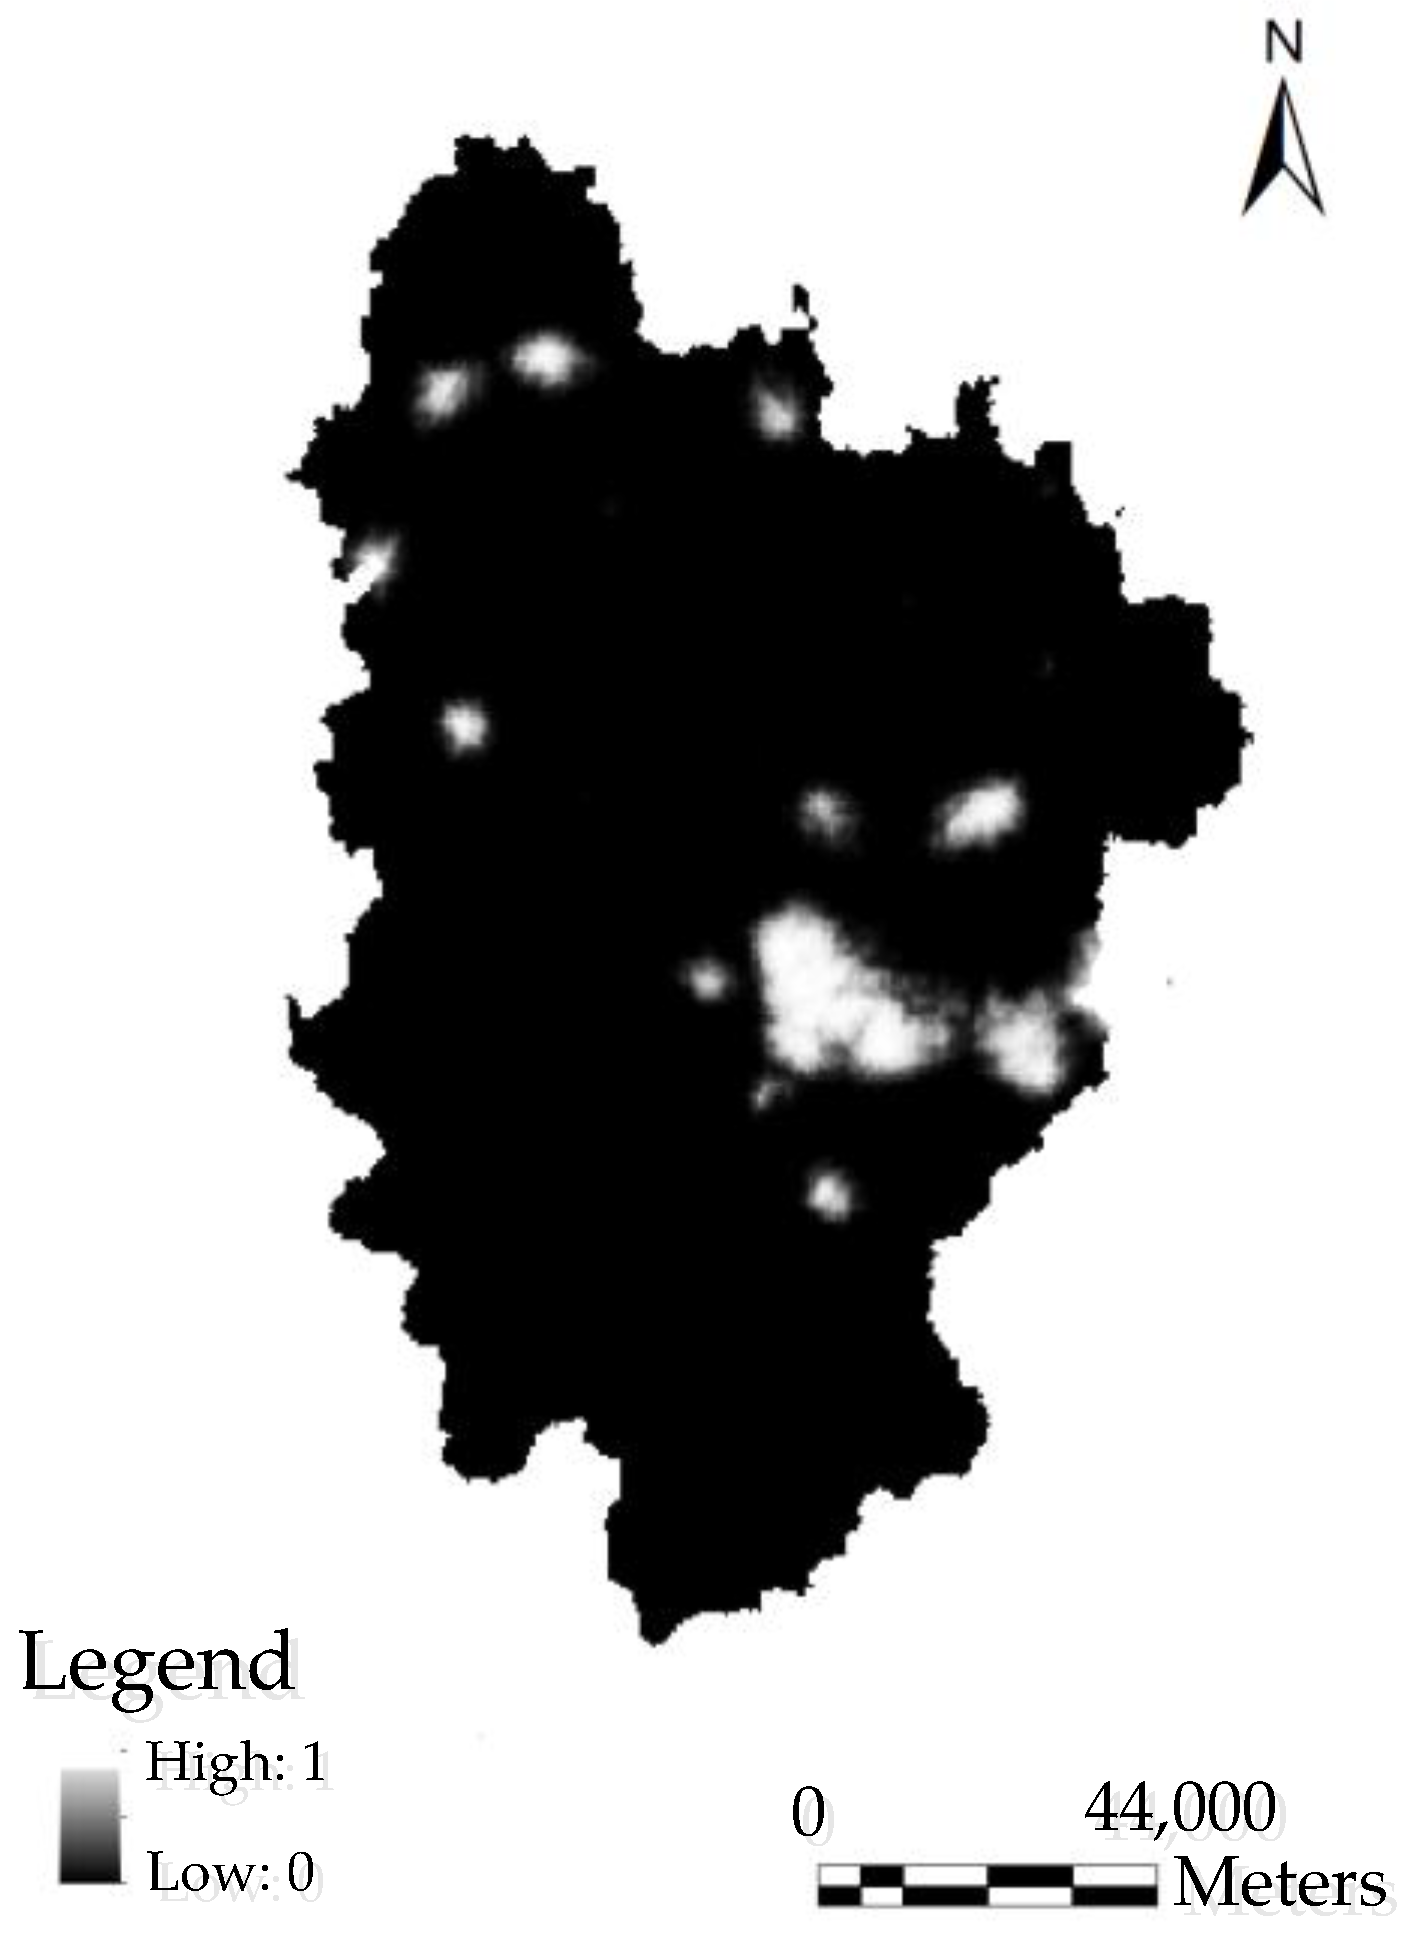
Based on the weights of the impact factors obtained from training the CART decision tree, we constructed the logistic regression function relationship and introduced the grid data (in tif file format) into the CA model. This data was used to determine the development suitability of the cellular automaton model (namely, the global development probability) during the model simulation, as shown in Figure 6.
(2) Cellular Transformation Rules
The CART-CA model established in this paper consists of four parts: development suitability, ; Moore neighborhood, ; a random term, RA; and a constraint condition, . The development suitability is expressed through the logistic regression function constructed by the weights of the impact factors mined by the CART decision tree. The random term RA uses the random function. Through multiple tests, we found that the best simulation was obtained when the random factor was 0.7 [35]. Because of the abundant river system resources in Xinyang City, this paper treats the river system as the model’s constraint factor. The attribute value of a lattice cell is set to either 0 or 1; where a 0 means that the cell cannot be converted to construction land use, and a 1 means the cell can be converted to construction land use. The probability that the cell will be converted from non-urban construction land use to urban construction land use at a certain time, , follows [36]:
Based on existing studies [37] and repeated tests of the model, the conversion threshold was set at 0.2. In other words, when the value of P is greater than 0.2, the value of a cell is 1, and it is converted to urban construction land use; otherwise, the cell’s value is 0, and it is not converted to urban construction land use. The specific process is shown in Figure 7.
3.3.2. Results
In the CART-CA model, we use the logistic regression algorithm constructed by the CART decision tree to calculate the transformation probability of urban construction land use. On this basis, we combined the random factors, constraint condition, and cellular neighborhood function to calculate the development probability for the transformation of a cellular area to urban construction land use and achieve a dynamic simulation. The original Landsat image data is used as a reference to highlight the authenticity and scientific soundness of the simulated results, shown in Figure 8a,b. The result can directly reflect the real changes of city construction land in Xinyang City in 2008 and 2014, respectively. The simulation uses the urban construction land use in Xinyang City during 2008 as the initial data (as shown in Figure 8c), and it simulates the urban construction land use in 2014 using the CART-CA model (as shown in Figure 8e). The red areas in Figure 8d,f denote regions transformed from non-urban construction land use to urban construction land use and light-green denotes non-urban construction land use. During the simulation process, we performed dynamic calculations to determine the number of cellular areas that transformed into urban construction land use in the study area for each iteration of the simulation. The prediction uses the urban construction land use in Xinyang City during 2014 as the initial data (as shown in Figure 8d) and combines the variation trends of land use in Xinyang City to predict the distribution of urban construction land use in Xinyang City in 2020 using the CART-CA model (as shown in Figure 8f).
3.3.3. Assessing Accuracy
The complicated changes in urban construction land use are subject to influence from many uncertain factors; therefore, in the accuracy assessment, the model could not accurately simulate the actual situation. From the existing research [38,39], the actual construction land and model simulated land use change matrix were first calculated in 2014 (Table 2). As can be seen from the confusion matrix, the accuracy rate of urban construction land was 78.09%, 89.63% for the simulation accuracy rate of non-urban construction land, the overall accuracy reached 85.98%, and the Kappa coefficient was 0.734.
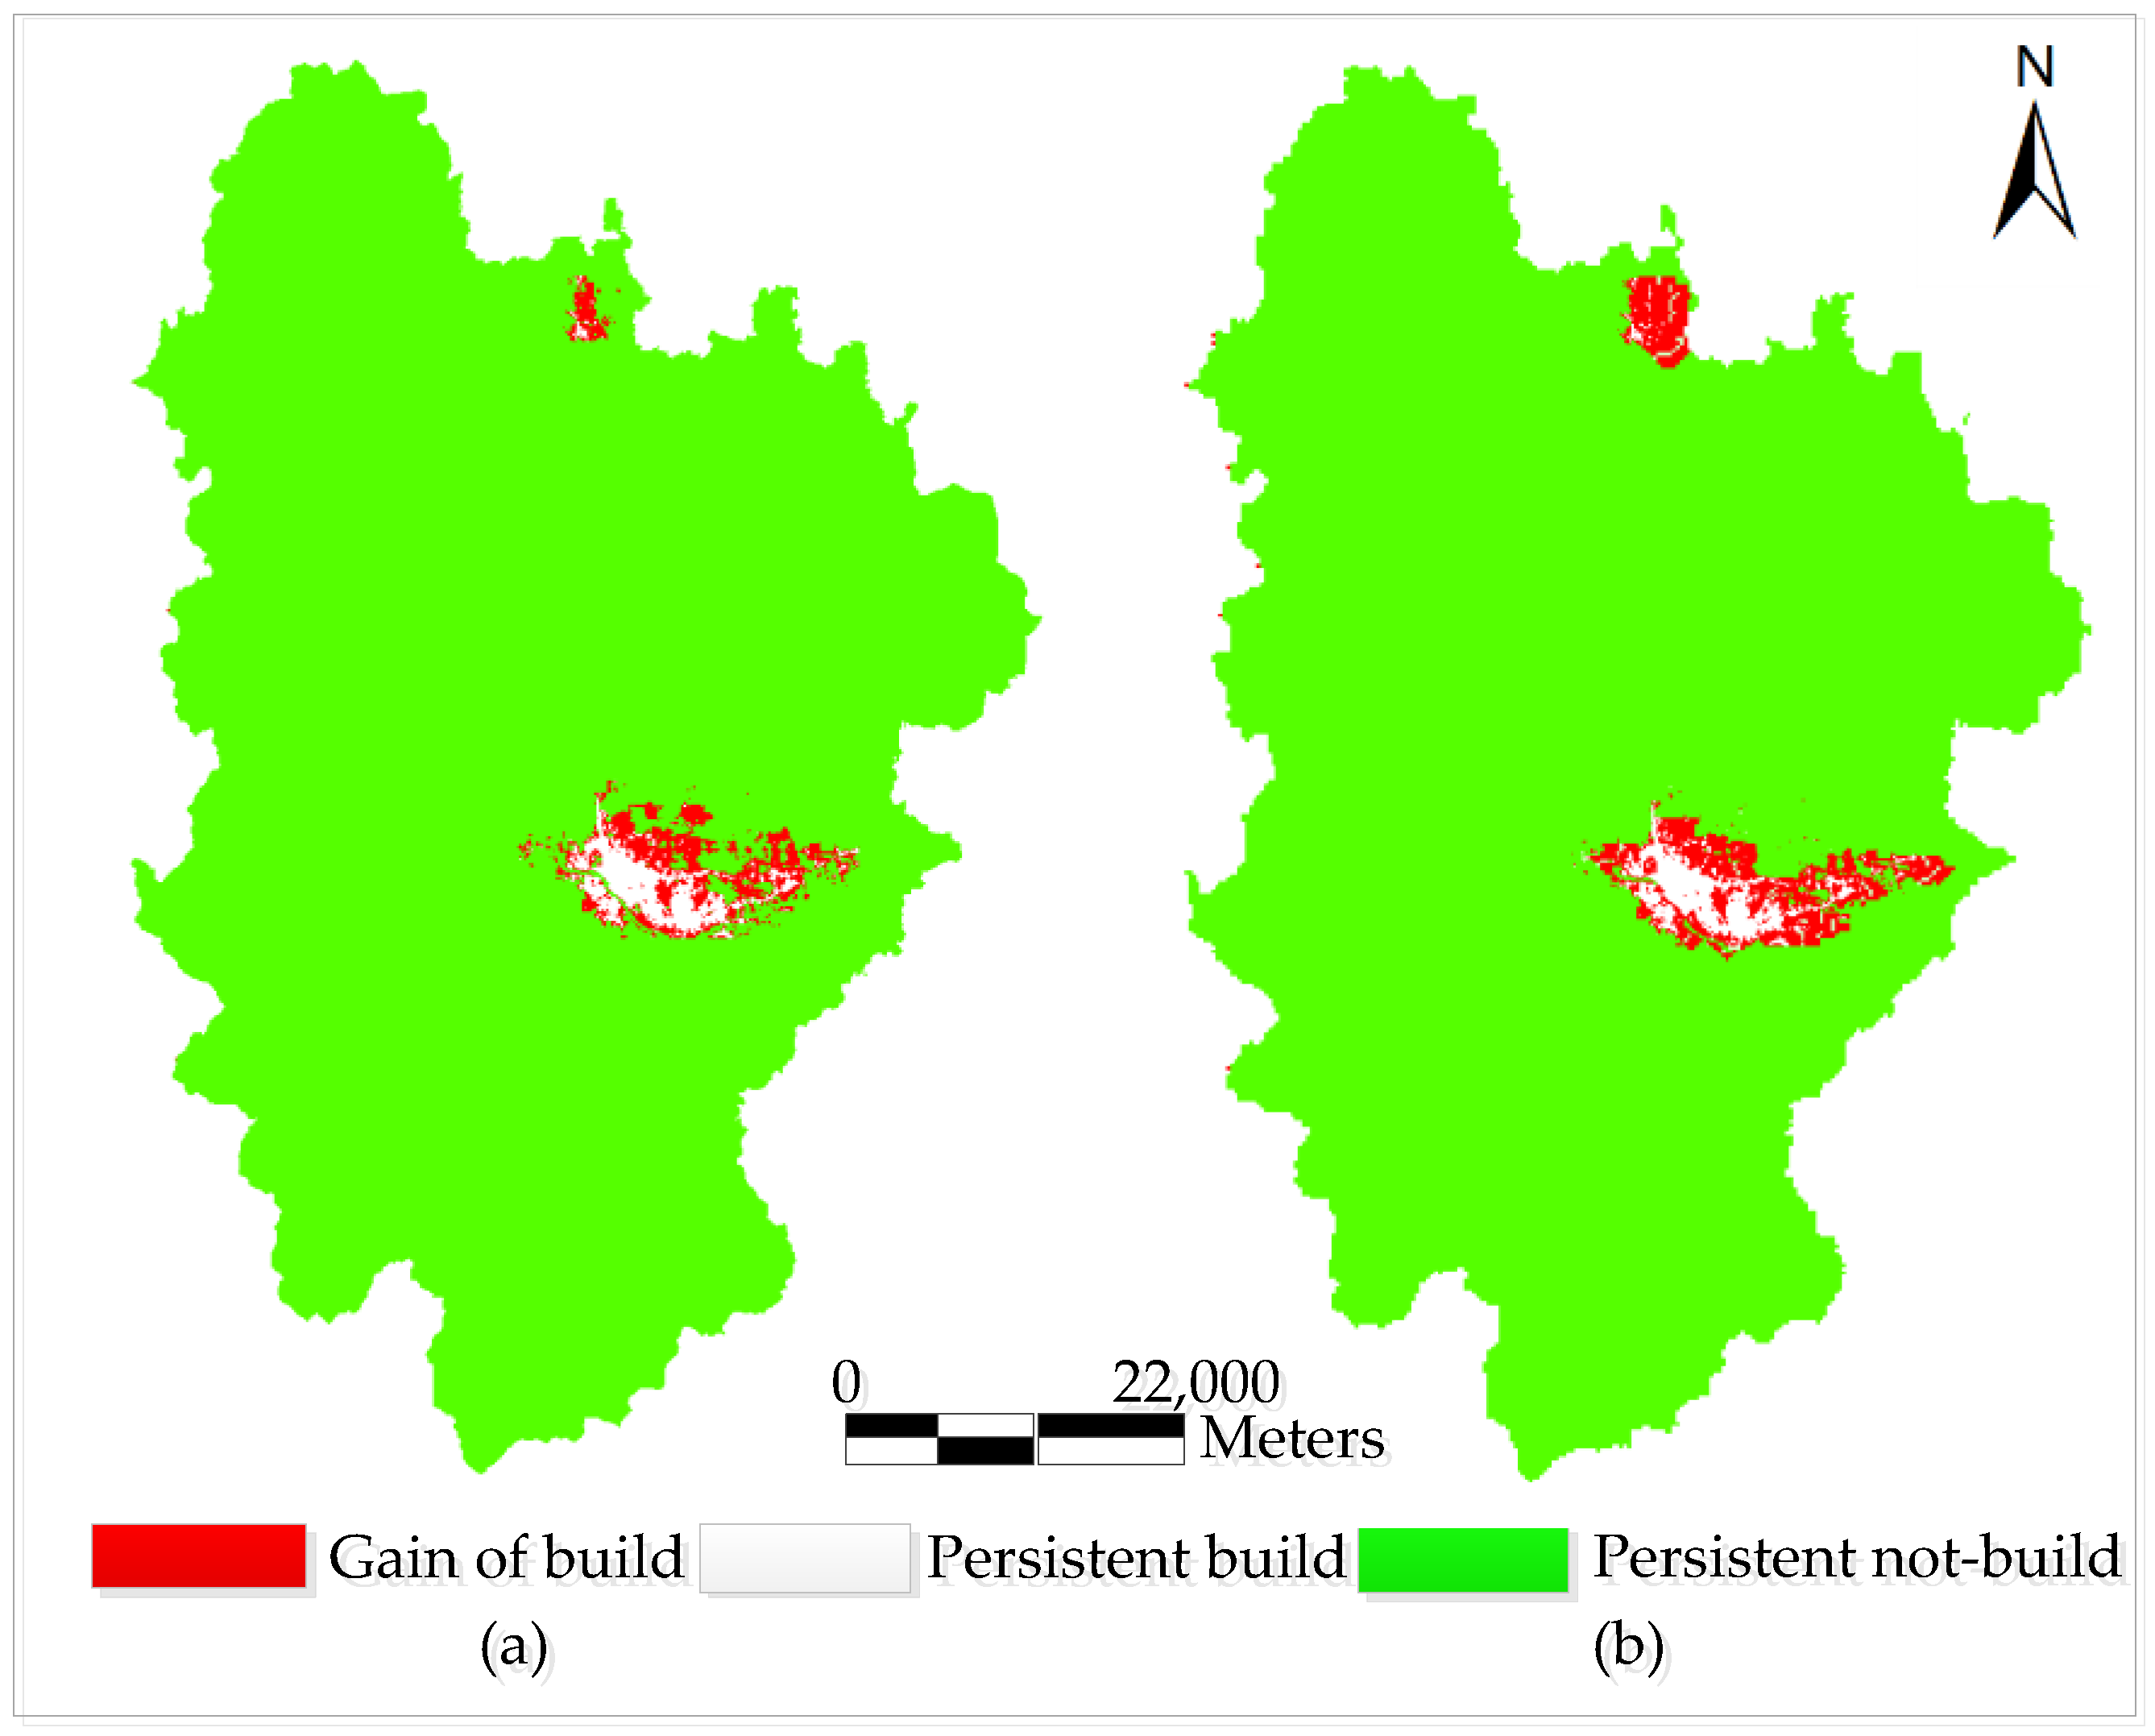
However, in the accuracy assessment, it is not appropriate that only the confusion matrix and the global accuracy are considered to evaluate the accuracy. Pontius et al. [40] significantly improved the accuracy evaluation using the pixel resolution and independent variables evaluation, and ruled out the area of land type unchanged, which makes a more scientifically accurate evaluation. In this study, the methods from Pontius et al. are applied to the land uses in Xinyang City. Experimental results show that the expansion of the urban construction land is Xinyang City is mainly in the main city zone, while the land changes in the surrounding suburbs are not obvious. On the other hand, the inherent urban construction land and the inherent non-urban construction land have little change over a large region, which can exclude the hypothesis that unutilized land is better for accuracy verification. As shown in Figure 9.
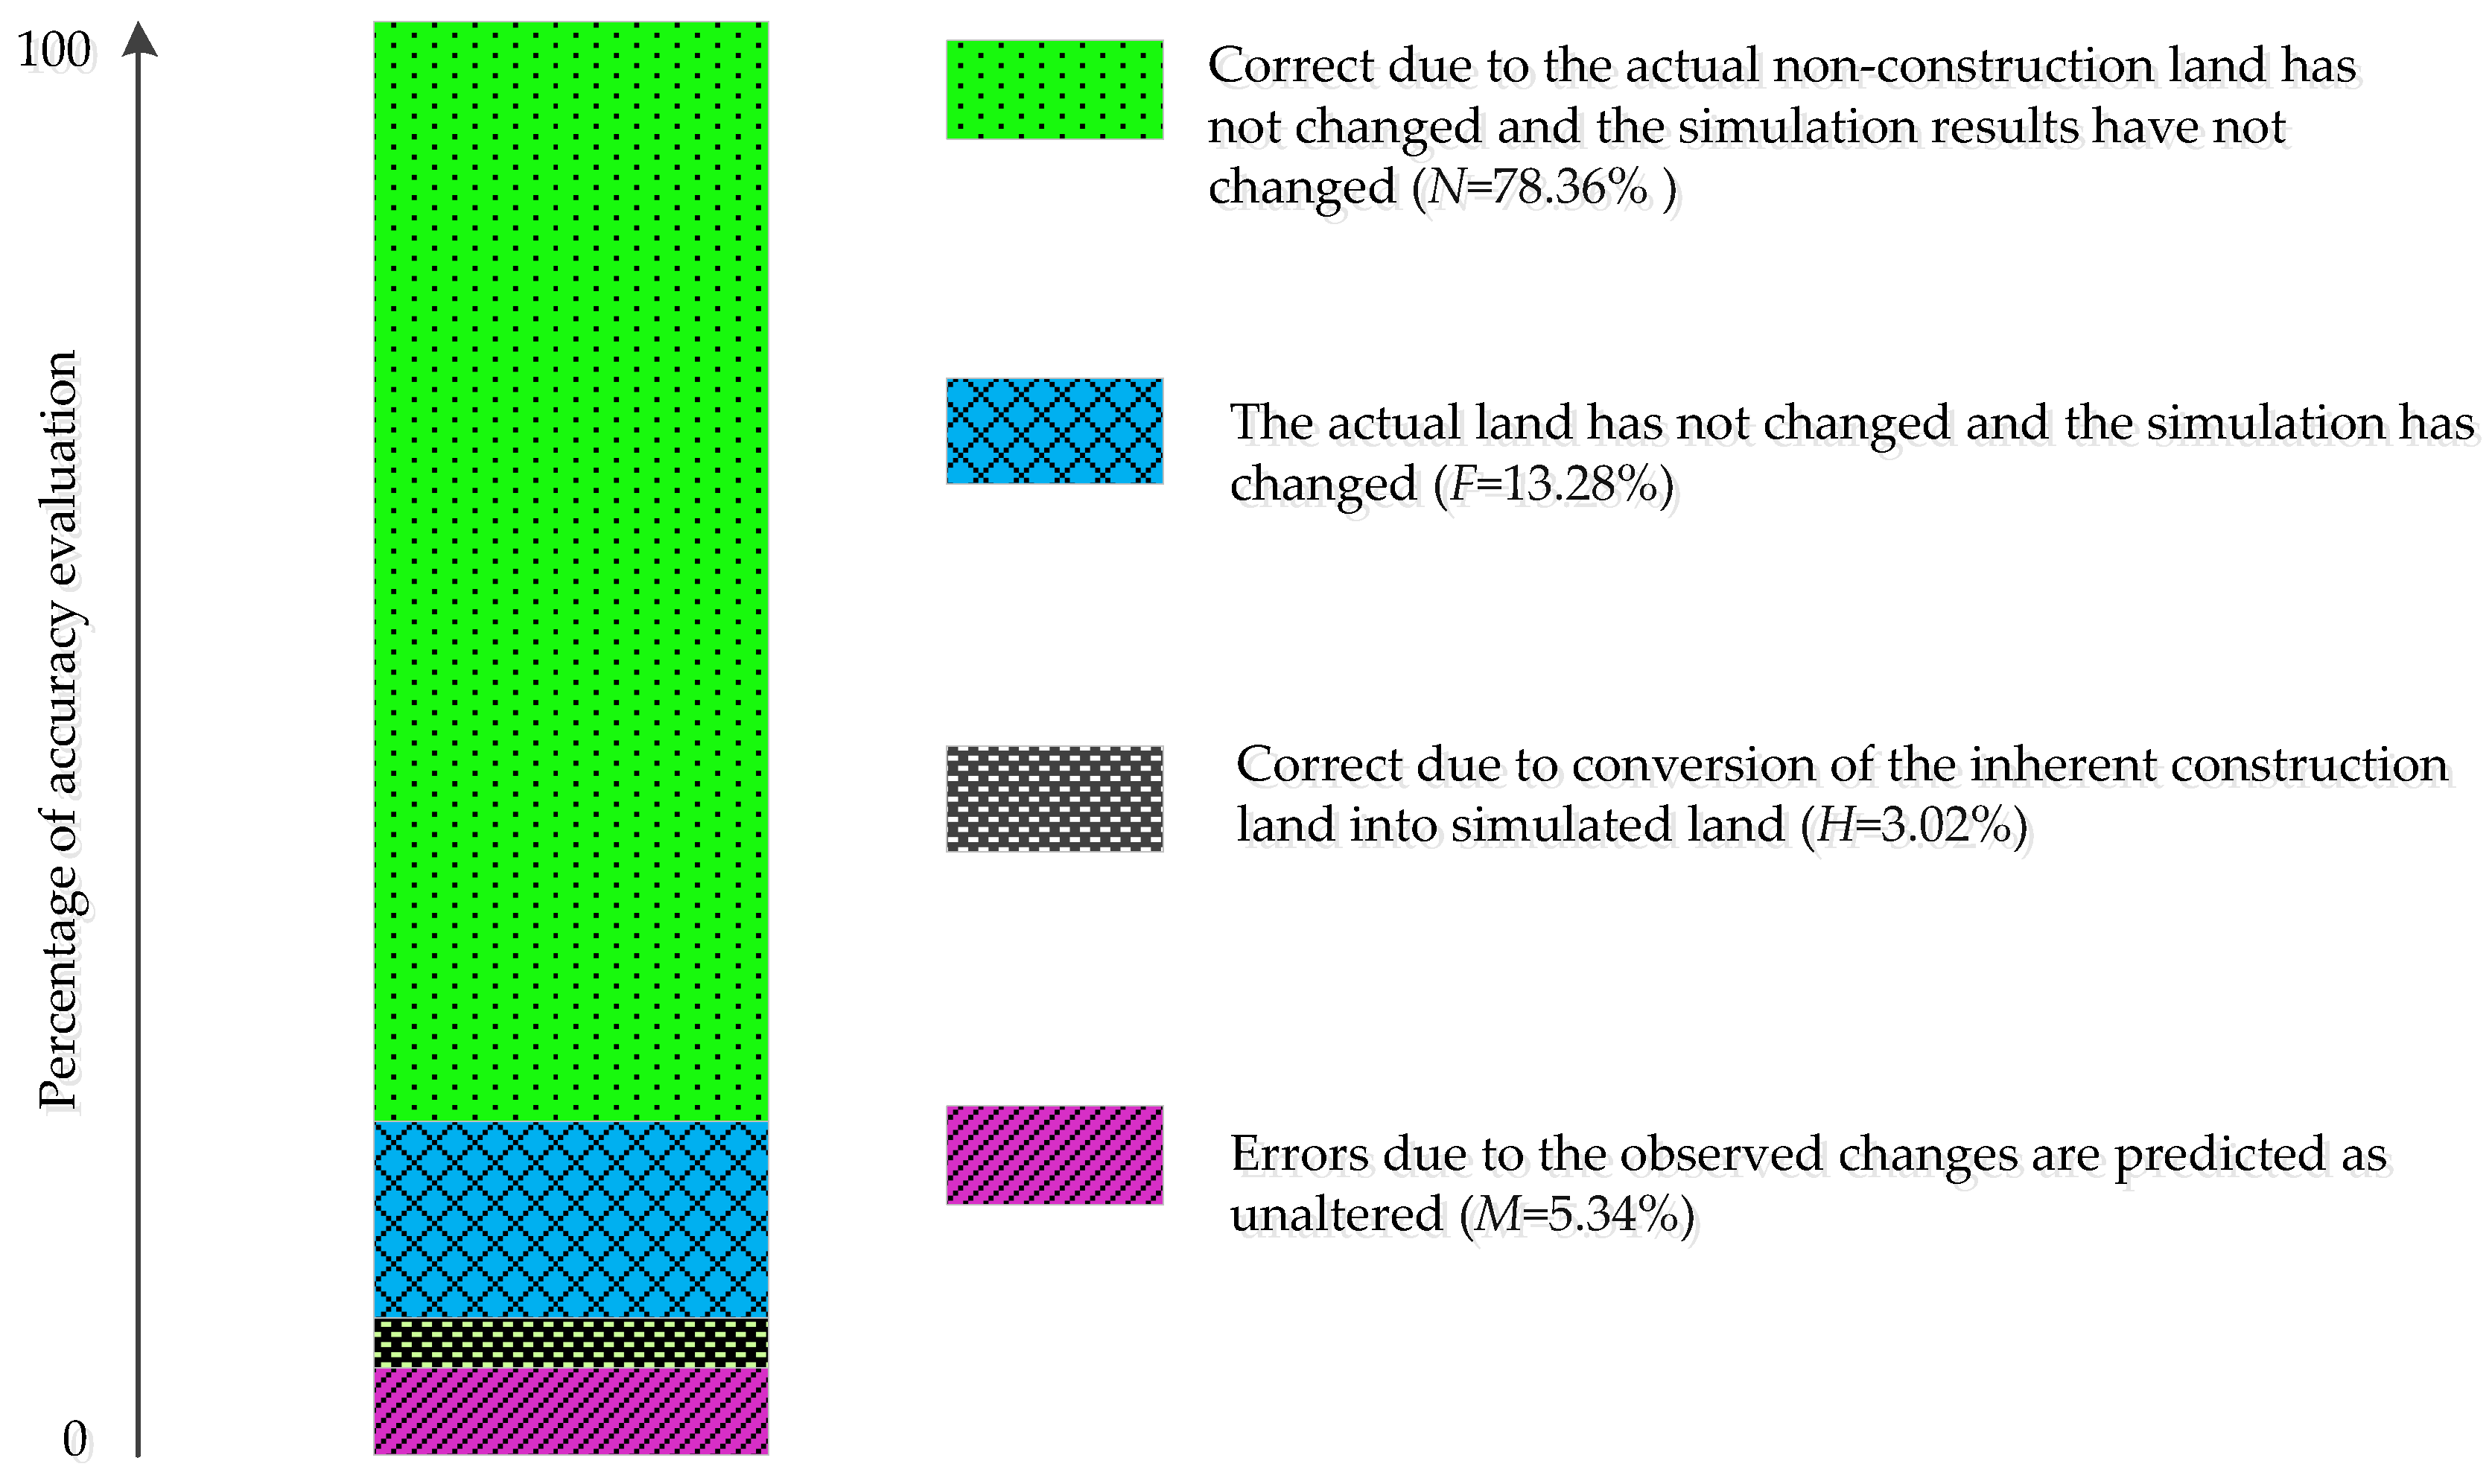
Four indicators are used by Pontius to test the accuracy, which provides a scientific method for accuracy assessment [41]. They are the following.
N ≡ Correct because the actual non-construction land has not changed and the simulation results have not changed (null successes).
F ≡ Actual land has not changed and the simulation has changed (false alarms).
H ≡ Correct due to the conversion of the inherent construction land into simulated land (hits).
M ≡ Errors due to the observed changes are predicted as unaltered (misses).
The change situation of urban land use is tested through the four indicators. The accuracy and error rate are presented through OC, PC, T and so on which are explained in detail as follows.
Observed Change (OC) = M + H
Predicted Change (PC) = H + F
Total Error (T) = M + F
After calculation [42], the total accuracy is 81.38%, the OC is 8.36%, and the PC is 16.3%. Although the accuracy is lower for the whole region, it excludes the changeless construction land in space and takes the changed region into consideration. On the contrary, the way in which the whole region is evaluated makes the result more accurate, but there exists a certain “pseudo accuracy” because of not excluding changeless land.
4. Discussion
This discussion covers the following relevant points.
(1) We review the rule extraction process for the model. The CART-CA model constructed in this paper extracts the sample data mainly through the CART decision tree and adopts the Bootstrap algorithm to train the weights assigned to the different impact factors to generate the logistic regression equation to extract the rules. After rule extraction, the CART decision tree can promptly generate a binary tree, trim it to retain the optimum classification results as the weights of the spatial variables, and combine those with the weights of the different impact factors from the training of the Bootstrap algorithm to construct the logistic regression function, which is the focus of this paper. That function is then used to represent the suitability of urban expansion, combined with the neighborhood function, random factor, and the constraint condition for simulation and training. The experiment results indicated that the CART-CA model gains a significant advantage from using the CART decision tree to analyze the data, and it is easy to establish the parameters of the impact factors. This approach both avoids over fitting and considers the spatial variables fairly well. Meanwhile, the model’s simulation results when predicting urban construction land use are reasonable, and its accuracy is relatively high. Building a successful model for predicting urban construction land use changes is advantageous from many aspects because such a model can provide a reference for future studies of laws and policies for land use changes.
(2) Based on the changes in the urban construction land use of Xinyang City (Figure 8), the speed of development in the south and northwest of the main urban area of Xinyang City occurs relatively slowly; the city has mainly expanded east and north. The scale of expansion is relatively large, and the overall development state of the city exhibits a good tendency. Specifically, the urban construction land use in Xinyang City expands mainly along the traffic arteries to the east and north. The magnitude of expansion is obvious and corresponds to the layout and planning of urban construction in Xinyang City. In the west and south, due to the influence of constraint conditions such as water bodies (Shihe and the Nanwan reservoir), the expansion of urban construction land use is restricted to some extent, and there are few new urban construction land conversions. By observing the urban distribution pattern in Figure 8 combined with the urban planning layout of Xinyang City, we found that the development of Xinyang City has a relatively strong dependence on transportation and government policies; meanwhile, it is mutually corroborated with the selected impact factors of urban development (transportation and regional centers). This indicates that the development of small cities has a relatively strong dependence on transportation and government factors. Moreover, from the simulated prediction of the expansion of urban construction land use in Xinyang City in 2020, we can see that Xinyang City will continue its eastward-expanding trend. The area of construction land use in the Pingqiao District will obviously increase, and the scale of the city will expand continually. The occupancy rate of urban construction land use will increase continually, accelerating the future pattern of urban expansion.
(3) Urban expansion and evolution is a complicated process affected by many factors. In this paper, the influences on the expansion of urban construction land use are reflected by identifying the spatial impact factors that have relatively large correlations. Therefore, we needed to analyze the significance of spatial impacting factors [43,44,45]. Based on the results of the significance calculations, we obtained the influences of different spatial variables on the overall variations of urban construction land use in Xinyang City. The influence was highest for the following spatial factors: distance to national roads, distance to city centers, and distance to provincial roads. These results indicate that for the continued expansion of urban construction land use in Xinyang City, the regions closest to the city center that have easy access to roads and good locations will be the first-choice areas for urban construction land use. Lesser influences were indicated for the spatial factors of distance to the district center, distance to the township center, and distance to the county roads. The influence of distance to a highway was relatively small. These spatial variables jointly promote the transformation from non-urban construction land use to urban construction land use, and they affect the urban development patterns of Xinyang City.
(4) The complex geographic factors in the research area exaggerate the instability in the simulation and the accuracy of its land use predictions. Therefore, there are still some deficiencies in the model. In the selection of the spatial influence factors, because the selected research area was a small city, it was difficult to obtain GDP data and per capita income data, which means that the consideration of impact factors was not as thorough as it could be. Furthermore, the impacts of some factors (such as roads) are not easy to predict, which further increases the simulation difficulty.
5. Conclusions
In the CA model, effectively determining the conversion rule is the core of the model. In this study, we mined the sample data using the CART decision tree for data mining and trained the weights of different impacting factors to construct the logistic regression function relationships to obtain the cellular conversion rules. When extracting rules, the CART decision tree effectively considers the impact factors, extracts the rules in a reasonable fashion with high efficiency, and achieves relatively high simulation accuracy. Meanwhile, by introducing the random factor, we improved the optimum results of the CART decision tree, and avoided over fitting. The resulting model has relatively good tolerance to random factors when predicting the expansion of urban construction land use. The neighborhood function calculation is an important factor that affects the development probability of the cellular areas. It is most applicable to regions with complicated land use types, and increases the thoroughness of consideration when calculating the probability that the central cell (of the neighborhood) will convert to a different land use type. Furthermore, we also measured the degrees to which different variables contributed to the prediction results and interpreted the role of different spatial variables in urban expansion.
In this paper, using Xinyang City from 2008 to 2014 as an example, the CART decision tree was applied to data of the changes in urban construction land use. Impact factors were used to mine the evolutionary patterns of urban land use in the urban area of Xinyang City. By combining the Moore neighborhood, constraint conditions, and cellular conversion rules based on constraint conditions, the changes in land use in the urban area of Xinyang were simulated and we then used the model to predict future changes in urban construction land use in the study area. The results indicate that the transformation rules obtained through the CART method were relatively accurate; in comparison with the CA model alone, the transformation rules constructed using the CART method have a clear structure and obvious outcomes—and they can be combined with the CA model. The CART-CA model established by integrating the CART decision tree achieves a relatively high accuracy when simulating changes in urban construction land use, and the simulation results are reliable.
Acknowledgments
This paper is supported by the National Natural Science Foundation of China (No. 41461038).
Author Contributions
Yongxiang Yao performed the research, analyzed the data, and wrote the paper. Jia Li and Ping Duan studied the latest development of the CA model and the integration of the CART algorithm and CA model. Xingguo Zhang studied and designed the early model framework of CA. Shuang Li mainly dealt with the basic data and she also extracted the impact factor. Quanli Xu participated in the construction of the model test method. In the precision assessment, he also experimented with the removal of the unaltered area, and supplemented the accuracy verification process. All authors read and approved the final manuscript.
Conflicts of Interest
The authors declare no conflict of interest.
References
- Codd, E.F. Cellular Automata; Academic Press: New York, NY, USA, 2014. [Google Scholar]
- Prato, T. Evaluating land use plans under uncertainty. Land Use Policy 2007, 24, 165–174. [Google Scholar] [CrossRef]
- Guan, D.J.; Li, H.F.; Inohae, T.; Hokao, K. Modeling urban land use change by the integration of cellular automaton and Markov model. Ecol. Model. 2011, 222, 3761–3772. [Google Scholar] [CrossRef]
- Al-sharif, A.A.A.; Pradhan, B. Monitoring and predicting land use change in Tripoli Metropolitan City using an integrated Markov chain and cellular automata models in GIS. Arab. J. Geosci. 2014, 7, 4291–4301. [Google Scholar] [CrossRef]
- Li, X.; Lao, C.; Liu, X.; Chen, Y. Coupling urban cellular automata with ant colony optimization for zoning protected natural areas under a changing landscape. Int. J. Geogr. Inf. Sci. 2011, 25, 575–593. [Google Scholar] [CrossRef]
- Rienow, A.; Goetzke, R. Supporting SLEUTH–Enhancing a cellular automaton with support vector machines for urban growth modeling. Comput. Environ. Urban Syst. 2015, 49, 66–81. [Google Scholar] [CrossRef]
- Arsanjani, J.J.; Helbich, M.; Kainz, W.; Boloorani, A.D. Integration of logistic regression, Markov chain and cellular automata models to simulate urban expansion. Int. J. Appl. Earth Obs. Geoinform. 2013, 21, 265–275. [Google Scholar] [CrossRef]
- Wang, F.; Hasbani, J.G.; Wang, X.; Marceau, D.J. Identifying dominant factors for the calibration of a land-use cellular automata model using Rough Set Theory. Comput. Environ. Urban Syst. 2011, 35, 116–125. [Google Scholar] [CrossRef]
- Kamusoko, C.; Aniya, M.; Adi, B.; Manjoro, M. Rural sustainability under threat in Zimbabwe–simulation of future land use/cover changes in the Bindura district based on the Markov-cellular automata model. Appl. Geogr. 2009, 29, 435–447. [Google Scholar] [CrossRef]
- Garzon, M.H. Models of Massive Parallelism: Analysis of Cellular Automata and Neural Networks; Springer Science & Business Media: Memphis, TN, USA, 2012. [Google Scholar]
- Malaitham, S.; Vichiensan, V.; Fukuda, A.; Wasuntarasook, V. Determinants of land use change using geographically weighted logistic regression. In Proceedings of the Transportation Research Board 94th Annual Meeting, Washington, DC, USA, 11–15 January 2015; p. 20. [Google Scholar]
- Azizi, G.S.; Rangzan, K.; Taghizadeh, A.; Ahmadi, S.H. LCM Logistic Regression Modelling of Land-Use Changes in Kouhmare Sorkhi, Fars Province. Iran. J. For. Poplar Res. 2014, 22, 585–596. [Google Scholar]
- Xie, H. Analysis of regionally ecological land use and its influencing factors based on a logistic regression model in the Beijing-Tianjin-Hebei region, China. Resour. Sci. 2011, 33, 2063–2070. [Google Scholar]
- Van Dessel, W.; Van Rompaey, A.; Szilassi, P. Sensitivity analysis of logistic regression parameterization for land use and land cover probability estimation. Int. J. Geogr. Inf. Sci. 2011, 25, 489–508. [Google Scholar] [CrossRef]
- Loh, W.Y. Classification and regression trees. WIREs Data Min. Knowl. Discov. 2011, 1, 14–23. [Google Scholar] [CrossRef]
- Burrows, W.R.; Benjamin, M.; Beauchamp, S.; Lord, E.R.; McCollor, D.; Thomson, B. CART decision-tree statistical analysis and prediction of summer season maximum surface ozone for the Vancouver, Montreal, and Atlantic regions of Canada. J. Appl. Meteorol. 1995, 34, 1848–1862. [Google Scholar] [CrossRef]
- Razi, M.A.; Athappilly, K. A comparative predictive analysis of neural networks (NNs), nonlinear regression and classification and regression tree (CART) models. Expert Syst. Appl. 2005, 29, 65–74. [Google Scholar] [CrossRef]
- Westreich, D.; Lessler, J.; Funk, M.J. Propensity score estimation: Neural networks, support vector machines, decision trees (CART), and meta-classifiers as alternatives to logistic regression. J. Clin. Epidemiol. 2010, 63, 826–833. [Google Scholar] [CrossRef] [PubMed]
- Yadav, S.K.; Pal, S. Data mining: A prediction for performance improvement of engineering students using classification. World Comput. Sci. Inf. Technol. J. 2012, 2, 51–56. [Google Scholar]
- Pal, M. Random forest classifier for remote sensing classification. Int. J. Remote Sens. 2005, 26, 217–222. [Google Scholar] [CrossRef]
- Wen, L.; Ling, J.; Saintilan, N.; Rogers, K. An investigation of the hydrological requirements of River Red Gum (Eucalyptus camaldulensis) Forest, using Classification and Regression Tree modelling. Ecohydrology 2009, 2, 143–155. [Google Scholar] [CrossRef]
- Deep, S.; Saklani, A. Urban sprawl modeling using cellular automata. Egypt. J. Remote Sens. Space Sci. 2014, 17, 179–187. [Google Scholar] [CrossRef]
- Ratner, K.A.; Goetz, A.R. The reshaping of land use and urban form in Denver through transit-oriented development. Cities 2013, 30, 31–46. [Google Scholar] [CrossRef]
- Li, X.; Liu, X.; Yu, L. A systematic sensitivity analysis of constrained cellular automata model for urban growth simulation based on different transition rules. Int. J. Geogr. Inf. Sci. 2014, 28, 1317–1335. [Google Scholar] [CrossRef]
- Kleinbaum, D.G.; Klein, M. Logistic Regression: A Self-Learning Text; Springer-Verlag: New York, NY, USA, 1994. [Google Scholar]
- Rabbani, A.; Aghababaee, H.; Rajabi, M.A. Modeling dynamic urban growth using hybrid cellular automata and particle swarm optimization. J. Appl. Remote Sens. 2012, 6, 063582:1–063582:10. [Google Scholar] [CrossRef]
- Liu, X.; Ma, L.; Li, X.; Ai, B.; Li, S.; He, Z. Simulating urban growth by integrating landscape expansion index (LEI) and cellular automata. Int. J. Geogr. Inf. Sci. 2014, 28, 148–163. [Google Scholar] [CrossRef]
- Hu, Z.; Lo, C.P. Modeling urban growth in Atlanta using logistic regression. Comput. Environ. Urban Syst. 2007, 31, 667–688. [Google Scholar] [CrossRef]
- Liu, X.; Li, X.; Shi, X.; Liu, T. Simulating complex urban development using kernel-based non-linear cellular automata. Ecol. Model. 2008, 211, 169–181. [Google Scholar] [CrossRef]
- White, R.; Engelen, G. Cellular automata and fractal urban form: A cellular modelling approach to the evolution of urban land-use patterns. Environ. Plan. A 1993, 25, 1175–1199. [Google Scholar] [CrossRef]
- Pijanowski, B.C.; Tayyebi, A.; Doucette, J.; Pekin, B.K.; Braun, D.; Plourde, J. A big data urban growth simulation at a national scale: Configuring the GIS and neural network based land transformation model to run in a high performance computing (HPC) environment. Environ. Model. Softw. 2014, 51, 250–268. [Google Scholar] [CrossRef]
- Pandey, B.; Joshi, P.K.; Seto, K.C. Monitoring urbanization dynamics in India using DMSP/OLS night time lights and SPOT-VGT data. Int. J. Appl. Earth Obs. Geoinf. 2013, 23, 49–61. [Google Scholar] [CrossRef]
- Liu, Z.; He, C.; Zhang, Q.; Yang, Y. Extracting the dynamics of urban expansion in China using DMSP-OLS nighttime light data from 1992 to 2008. Landsc. Urban Plan. 2012, 106, 62–72. [Google Scholar] [CrossRef]
- Ma, T.; Zhou, C.; Pei, T.; Haynie, S.; Fan, J. Quantitative estimation of urbanization dynamics using time series of DMSP/OLS nighttime light data: A comparative case study from China’s cities. Remote Sens. Environ. 2012, 124, 99–107. [Google Scholar] [CrossRef]
- Liao, J.; Tang, L.; Shao, G.; Su, X.; Chen, D.; Xu, T. Incorporation of extended neighborhood mechanisms and its impact on urban land-use cellular automata simulations. Environ. Model. Softw. 2016, 75, 163–175. [Google Scholar] [CrossRef]
- Feng, Y.; Liu, Y.; Tong, X.; Liu, M.; Deng, S. Modeling dynamic urban growth using cellular automata and particle swarm optimization rules. Landsc. Urban Plan. 2011, 102, 188–196. [Google Scholar] [CrossRef]
- Liu, X.; Li, X.; Liu, L.; He, J.; Ai, B. A bottom-up approach to discover transition rules of cellular automata using ant intelligence. Int. J. Geogr. Inf. Sci. 2008, 22, 1247–1269. [Google Scholar] [CrossRef]
- Li, Y.; Pan, Y.; Zhu, X.; Li, Y.; Gu, J. Comparison analysis on land cover area estimators: Confusion matrix calibration and regression. Trans. Chin. Soc. Agric. Eng. 2013, 29, 115–123. [Google Scholar]
- Yi, L.; Zhang, G. Object-oriented remote sensing imagery classification accuracy assessment based on confusion matrix. In Proceedings of the International Conference on Geoinformatics, Hong Kong, China, 15–17 June 2012; IEEE: New York, NY, USA, 2012; pp. 1–8. [Google Scholar]
- Pontius, R.G., Jr.; Boersma, W.; Castella, J.C.; Clarke, K.D.; Nijs, T. Comparing the input, output, and validation maps for several models of land change. Ann. Reg. Sci. 2008, 42, 11–47. [Google Scholar] [CrossRef]
- Chen, H.; Pontius, R.G. Sensitivity of a Land Change Model to Pixel Resolution and Precision of the Independent Variable. Environ. Model. Assess. 2011, 16, 37–52. [Google Scholar] [CrossRef]
- Wang, H.; He, S.; Liu, X.; Dai, L.; Pan, P.; Hong, S.; Zhang, W. Simulating urban expansion using a cloud-based cellular automata model: A case study of Jiangxia, Wuhan, China. Landsc. Urban Plan. 2013, 110, 99–112. [Google Scholar] [CrossRef]
- Celio, E.; Koellner, T.; Grêt-Regamey, A. Modeling land use decisions with bayesian networks: Spatially explicit analysis of driving forces on land use change. Environ. Model. Softw. 2014, 52, 222–233. [Google Scholar] [CrossRef]
- Macdonald, G.K.; Bennett, E.M.; Taranu, Z.E. The influence of time, soil characteristics, and land-use history on soil phosphorus legacies: A global meta-analysis. Glob. Chang. Biol. 2012, 18, 1904–1917. [Google Scholar] [CrossRef]
- Hamidov, A.; Helming, K.; Balla, D. Research on Land Use Functions in Central Asia: A bibliometric analysis. In Proceedings of the Recca-Conference, Halle (Saale), Germany, 24–26 November 2014. [Google Scholar]
Figure 1.
Classification and Regression Tree (CART) training flow chart.

Figure 2.
The basic architecture of the cellular automata (CA) model.

Figure 3.
Study area map.

Figure 4.
The map of the distance between the primitive cells and various related factors.

Figure 5.
Cellular distribution of the samples.

Figure 6.
The probability of the overall development influenced by cellular and various factors.

Figure 7.
The CA model flowchart.

Figure 8.
The map of the Xinyang urban construction land simulation forecast. The (a) represents Landsat image of Xinyang in 2008. The (b) represents Landsat image of Xinyang in 2014.The (c) represents original urban land of Xinyang in 2008. The (d) represents real result of urban construction land in 2014. The (e) represents simulation results of urban construction land in 2014. The (f) represents forecast of urban construction land use in 2020.
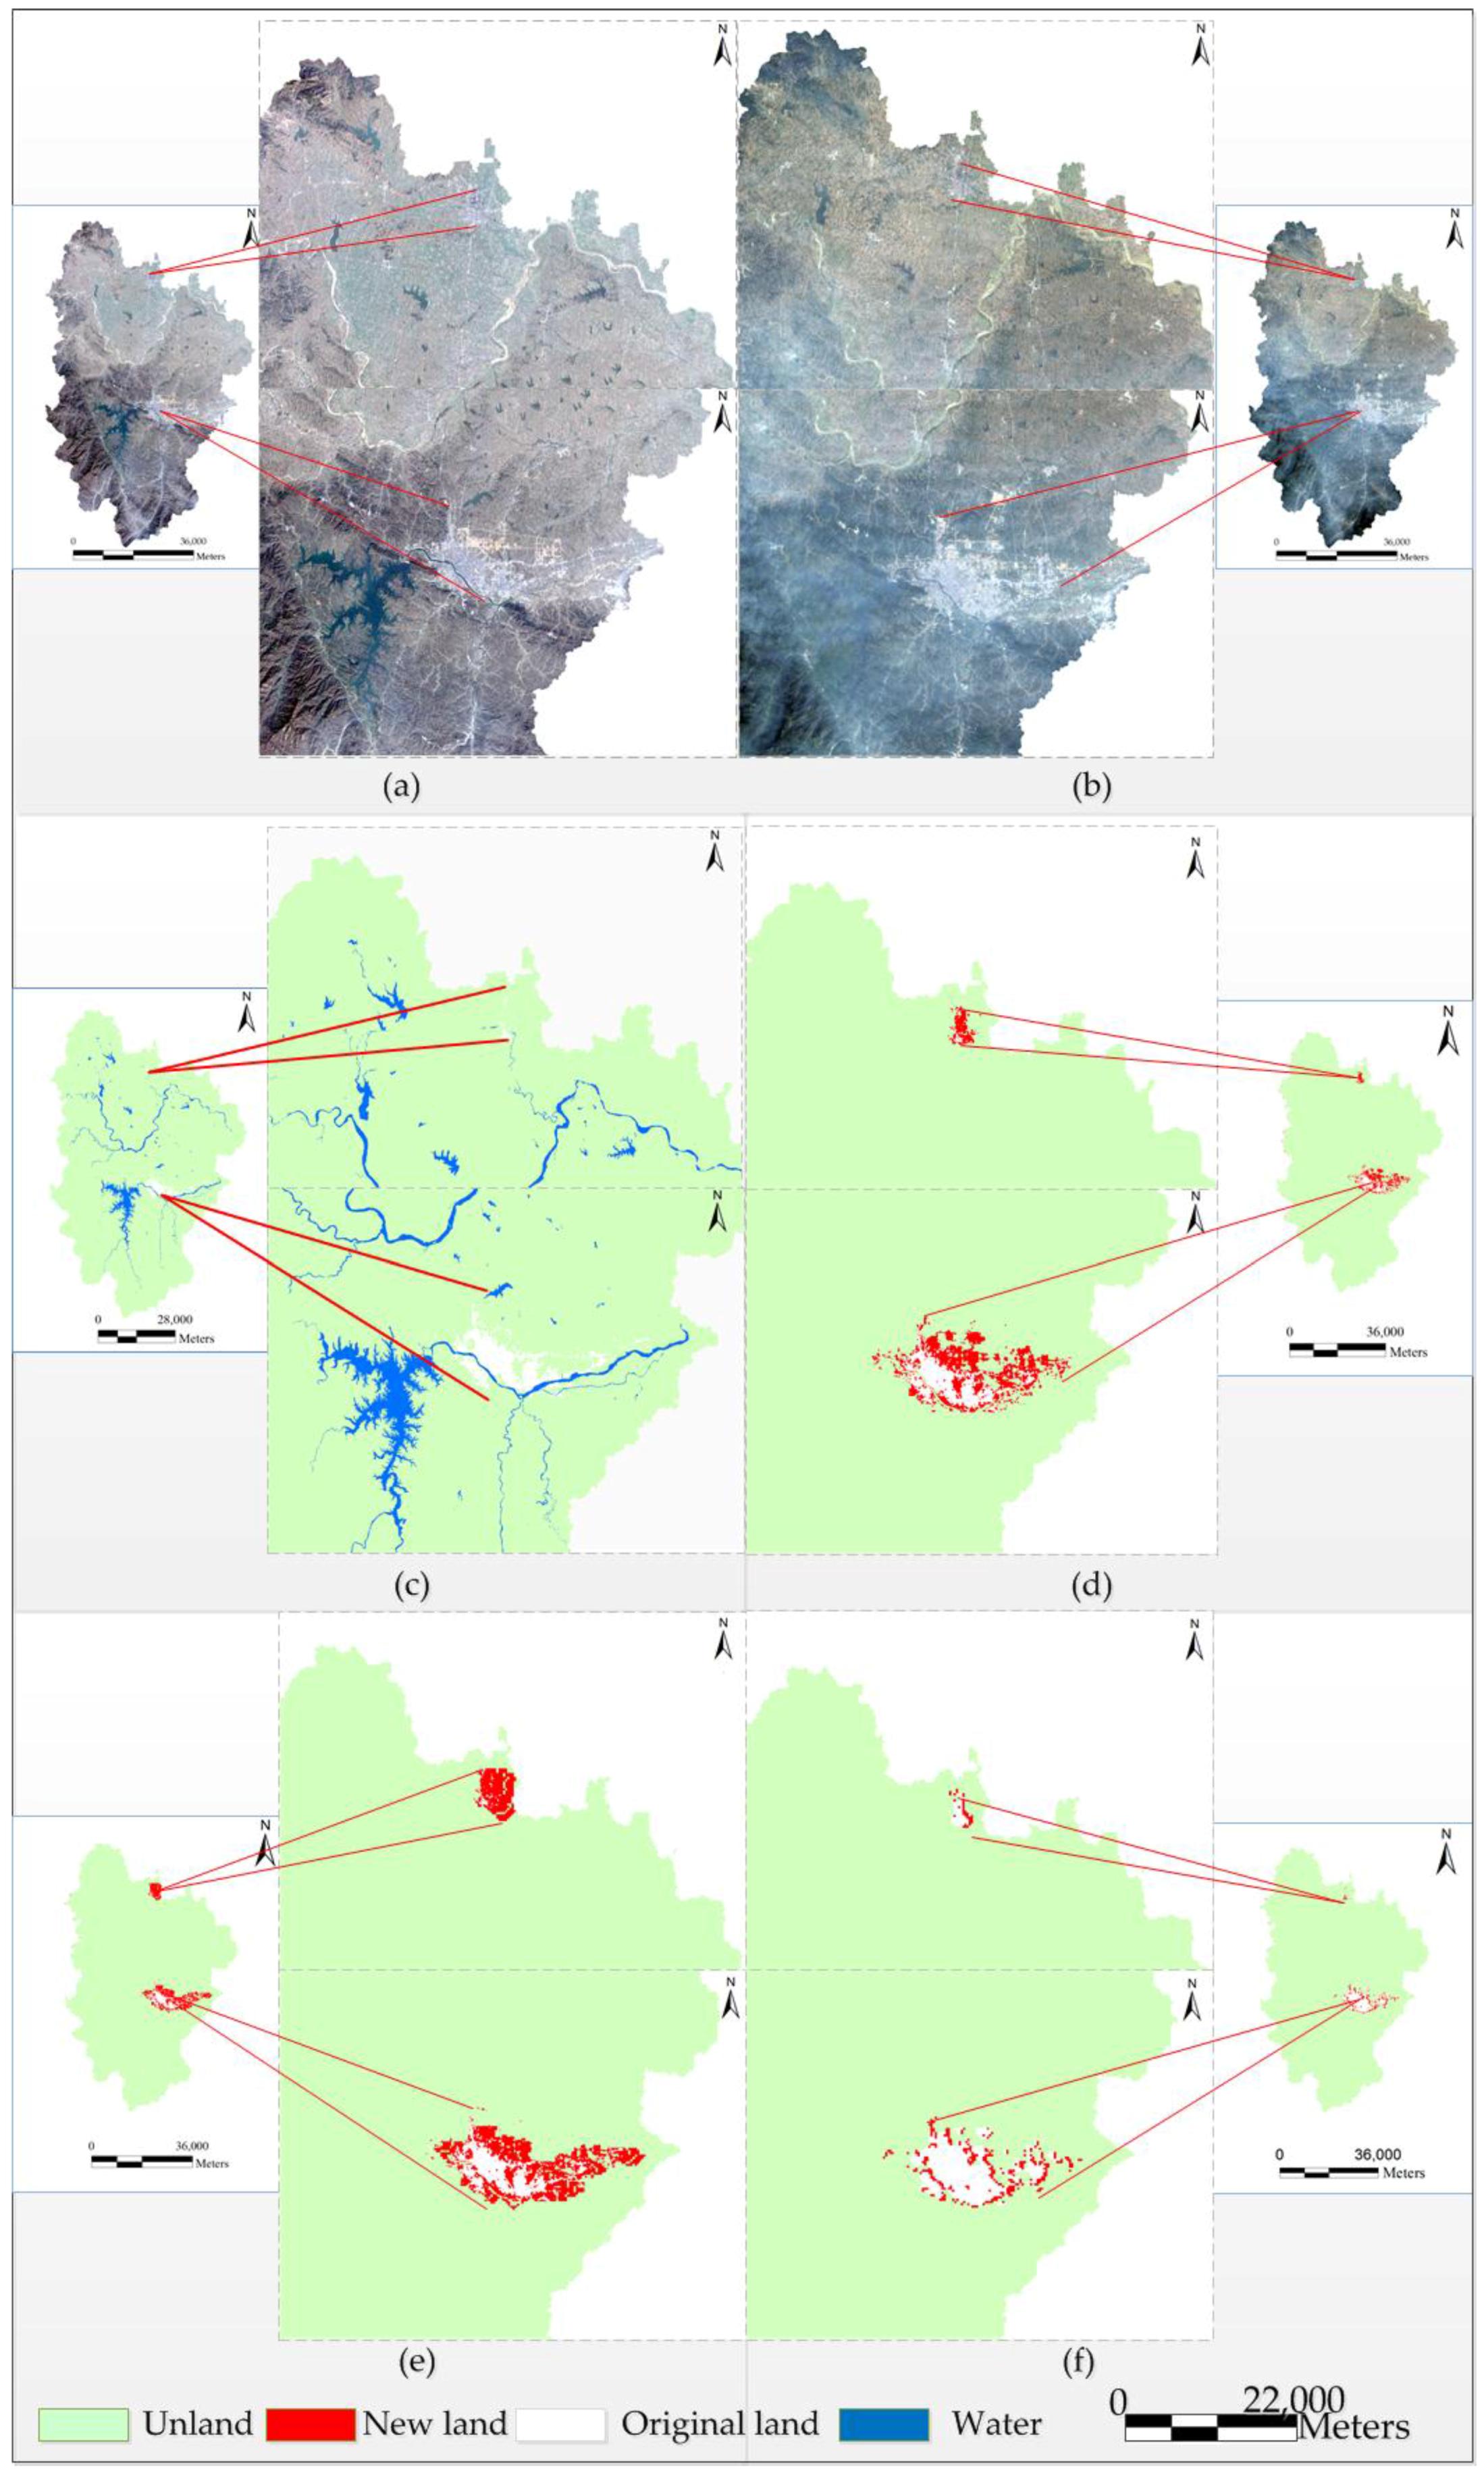
Figure 9.
Actual construction land and simulated construction land map. The (a) is a real change in land use from 2008 to 2014. The (b) is a simulated change in land use from 2008 to 2014.
Figure 9.
Actual construction land and simulated construction land map. The (a) is a real change in land use from 2008 to 2014. The (b) is a simulated change in land use from 2008 to 2014.

Figure 10.
At a 30-by-30 m fine resolution, the overall landscape of the overall prediction of success and error.
Figure 10.
At a 30-by-30 m fine resolution, the overall landscape of the overall prediction of success and error.


Table 1.
The weight of influencing factors for the suitability of urban construction land.
| Factors | X1 | X2 | X3 | X4 | X5 | X6 | X7 | Constant |
|---|---|---|---|---|---|---|---|---|
| Coefficient | +1.0074 | −0.3384 | −1.4125 | +0.5350 | −1.2192 | −3.4121 | −2.9956 | +1.4676 |
Table 2.
Comparison between the simulation results of the CART-CA model and the actual situation.
| 2014 Simulation Results | ||||
|---|---|---|---|---|
| Unchanged | Changed | Overall/% | ||
| Unchanged | 198,682 | 22,991 | 89.63 | |
| Actual situation | Changed | 22,486 | 80,135 | 78.09 |
| Overall accuracy | 85.98 | |||
| Kappa | 0.734 | |||
© 2017 by the authors. Licensee MDPI, Basel, Switzerland. This article is an open access article distributed under the terms and conditions of the Creative Commons Attribution (CC BY) license (http://creativecommons.org/licenses/by/4.0/).
Share and Cite
MDPI and ACS Style
Yao, Y.; Li, J.; Zhang, X.; Duan, P.; Li, S.; Xu, Q. Investigation on the Expansion of Urban Construction Land Use Based on the CART-CA Model. ISPRS Int. J. Geo-Inf. 2017, 6, 149. https://doi.org/10.3390/ijgi6050149
AMA Style
Yao Y, Li J, Zhang X, Duan P, Li S, Xu Q. Investigation on the Expansion of Urban Construction Land Use Based on the CART-CA Model. ISPRS International Journal of Geo-Information. 2017; 6(5):149. https://doi.org/10.3390/ijgi6050149
Chicago/Turabian StyleYao, Yongxiang, Jia Li, Xingguo Zhang, Ping Duan, Shuang Li, and Quanli Xu. 2017. "Investigation on the Expansion of Urban Construction Land Use Based on the CART-CA Model" ISPRS International Journal of Geo-Information 6, no. 5: 149. https://doi.org/10.3390/ijgi6050149
Note that from the first issue of 2016, this journal uses article numbers instead of page numbers. See further details here.