
A GIS-Based Fuzzy Decision Making Model for Seismic Vulnerability Assessment in Areas with Incomplete Data


1
GIS Department, School of Surveying and Geospatial Engineering, College of Engineering, University of Tehran, Tehran 14174-66191, Iran
2
Center of Excellence in Geomatics Engineering in Disaster Management, School of Surveying and Geospatial Engineering, College of Engineering, University of Tehran, Tehran 14174-66191, Iran
3
Seismology Research Center, International Institute of Earthquake Engineering and Seismology (IIEES), Tehran 19537-14453, Iran
*
Author to whom correspondence should be addressed.
ISPRS Int. J. Geo-Inf. 2017, 6(4), 119; https://doi.org/10.3390/ijgi6040119
Submission received: 24 January 2017
/
Revised: 6 April 2017
/
Accepted: 10 April 2017
/
Published: 14 April 2017
Abstract
:Earthquakes are one of the natural disasters that threaten many lives every year. It is important to estimate seismic damages in advance to be able to reduce future losses. However, seismic vulnerability assessment is a complicated problem, especially in areas with incomplete data, due to incorporated uncertainties. Therefore, it is important to use adequate methods that take into account and handle the associated uncertainties. Although different seismic vulnerability assessment methods at the urban scale have been proposed, the purpose of this research is to introduce a new Geospatial Information System GIS-based model using a modified integration of Analytical Hierarchy Process (AHP), fuzzy sets theory, and Technique for Order Preference by Similarity to an Ideal Solution (TOPSIS) in a vector-based environment. The proposed method emphasizes handling one of the important uncertainties in areas with incomplete data, namely the ‘vagueness’ of the existing knowledge about influences of the criteria on seismic vulnerability, which is handled using fuzzy sets theory in this research. The applicability of the proposed method is tested in a municipality district of Tabriz, which is in a near vicinity to the fault system. It can be concluded that the proposed method contributes to a pragmatic and efficient assessment of physical seismic vulnerability under uncertainty, which provides useful information for assisting planners in mitigation and preparation stages in less-studied areas.
1. Introduction
An earthquake is one of the major natural disasters that causes severe physical, social, and financial damages around the world every year. Seismic risk in urban areas is defined as the convolution of ‘seismic hazard’ and ‘seismic vulnerability’ [1,2]. While studies on the seismic hazard analysis (SHA) provide a conceptual framework for evaluating the probability of the occurrence of the hazard, the ‘vulnerability assessment’ is used to determine the likely effects of hazards on human beings and property within a particular area [3]. Seismic vulnerability can have physical, social, economic, and political aspects [4,5]. This study focuses on ‘physical seismic vulnerability assessment (PSVA)’; that is, the estimation of expected damages to buildings at the urban scale caused by a hypothetical earthquake or a set of likely earthquakes. Considering that cities are more vulnerable to disasters due to the large population, huge building stock, and infrastructures, the importance of physical seismic vulnerability assessment (PSVA) in urban areas is more highlighted [6]. Several methods have been proposed by researchers for PSVA at the urban scale.
There are some studies that use existing analytical relations or vulnerability indices in a Spatial Decision Support System (SDSS) framework (e.g., [7,8,9,10,11,12,13,14]). These approaches are applicable solely when there are predefined relations or indices elucidated particularly for the studied area, though there are many highly vulnerable urban areas all around the world that lack the required well developed building inventory and/or damage statistics from the previous earthquakes required for developing such relations/indices. Insufficient attention has been given to the implementation of seismic vulnerability assessment methods in areas with data scarcity [15].
Considering the inadequacy of available data on one hand and the necessity of assessing physical seismic vulnerability on the other, it would be an appropriate solution to think of PSVA at the urban scale as a spatial decision making problem [2,16]. In this regard, some researchers have used Geospatial Information System GIS-based Multi Criteria Decision Making (MCDM) methods (e.g., [16,17,18,19,20]).
Although the intrinsic uncertainties associated with PSVA using MCDM methods can influence the results of the assessment considerably, a few studies considered and handled the incorporated uncertainties. For instance, fuzzy logic was used for handling the vague uncertainties associated with an MCDM method for a seismic vulnerability assessment of the buildings in Los Angeles County by Rashed and Weeks [2]. Intuitionistic fuzzy logic was applied to produce human loss maps for some parts of Tehran metropolitan area [21]. A seismic vulnerability model was proposed for Tehran by deriving decision rules using a granular computing method [22]. The ordered weighted averaging operator (OWA) was used to provide the vulnerability map of the statistical units of Tehran [23]. In the mentioned approaches to study the seismic vulnerability of Tehran, experts address the vulnerability of each statistical unit individually. In other words, experts rank the selected sample statistical units according to their seismic vulnerability; thus, in those studies, the defined rules are dependent on case study units. Fuzzy-IHWP (Inverse Hierarchy Weight Process) was applied for decision-making on seismic vulnerability of Zanjan, Iran in a raster-based environment using relevant software [24]. The robustness and reliability of the results were not validated.
Although there are several studies on seismic vulnerability assessment briefly mentioned in the literature, this paper suggests a modified method independent of case study area using fuzzy MCDM in a vector-based environment to reduce the vagueness uncertainty in physical seismic vulnerability (PSV). This study proposes a customized model for PSVA using a new combination of existing methods and new datasets. In this study, a modified use of fuzzy rules in areas with incomplete data is introduced to handle the incorporated ‘vagueness’ uncertainty in ‘influences of the adopted sub-criteria on PSV’. The proposed method uses Analytic Hierarchy Process (AHP) to weigh the importance of the selected criteria and a TOPSIS [25] method to estimate the overall PSV of the studied units concerning the selected criteria. The method proposed is GIS-based because most of the needed data have spatial characteristics. The preparation of datasets, executing analyses on the spatial data and representation of the outputs of the model are handled using GIS.
This paper contributes to the PSVA literature in the following ways: (A) revealing the necessity and efficiency of applying MCDM methods for PSVA in areas with incomplete data to treat the inadequacy of the existing knowledge; (B) proposing a new GIS-based MCDM method for PSVA, which is independent of the study area due to introducing seismic vulnerability rules so that the fuzzy rules applied treat the existing ‘vagueness’ uncertainty; (C) proposing a new insight into the adopted criteria. In that respect, seismic risk indicators are considered in two main categories, i.e., the indicators that influence ground motion intensity and the indicators pertinent to structural properties that influence buildings’ vulnerability. (D) The proposed method is implemented in a real case study in Tabriz, a seismic hazard-prone metropolis in the northwest of Iran with data scarcity for previous seismic damages and a few studies on the seismic vulnerability assessment of the city [12,26,27]. The authors are not aware of any study on PSVA (physical seismic vulnerability assessment) of Tabriz using a vector-based MCDM method emphasizing considering and reducing associated knowledge-based uncertainties. (E) Sensitivity analyses are performed to examine the robustness and reliability of the proposed model.
The main goal of this paper is to identify urban statistical units with higher building damage estimates in Municipality District One in Tabriz. The mentioned units, which are mostly used for decision-making by local and governmental planners in urban areas, are like sub-districts defined by the Statistical Center of Iran (SCI). Including around 400 families, as described by the SCI in the year 2011, the mentioned urban statistical units are used as the base units for spatial analyses in this research. The most devastating earthquake magnitude that Tabriz has undergone, based on the historical records, is as large as Ms ~7.7 (1780 A.D), which was due to the movement of the North Tabriz Fault (NTF) [28]. This was hypothesized as the earthquake scenario of the present study. Furthermore, damages caused by the secondary disasters such as liquefaction, landslides, fire, and explosions are not included in this study. This paper concludes that the proposed method can be a pragmatic model for a quick and efficient PSVA in urban areas with incomplete data to handle the incorporated uncertainties.
The remaining parts of the paper are organized as follows: Section 2 describes the study area; Section 3 discusses the methods used and the proposed model; and Section 4 provides data analyses and results. Section 5 explains sensitivity analyses implemented, and Section 6 provides discussions and concluding remarks.
2. The Study Area
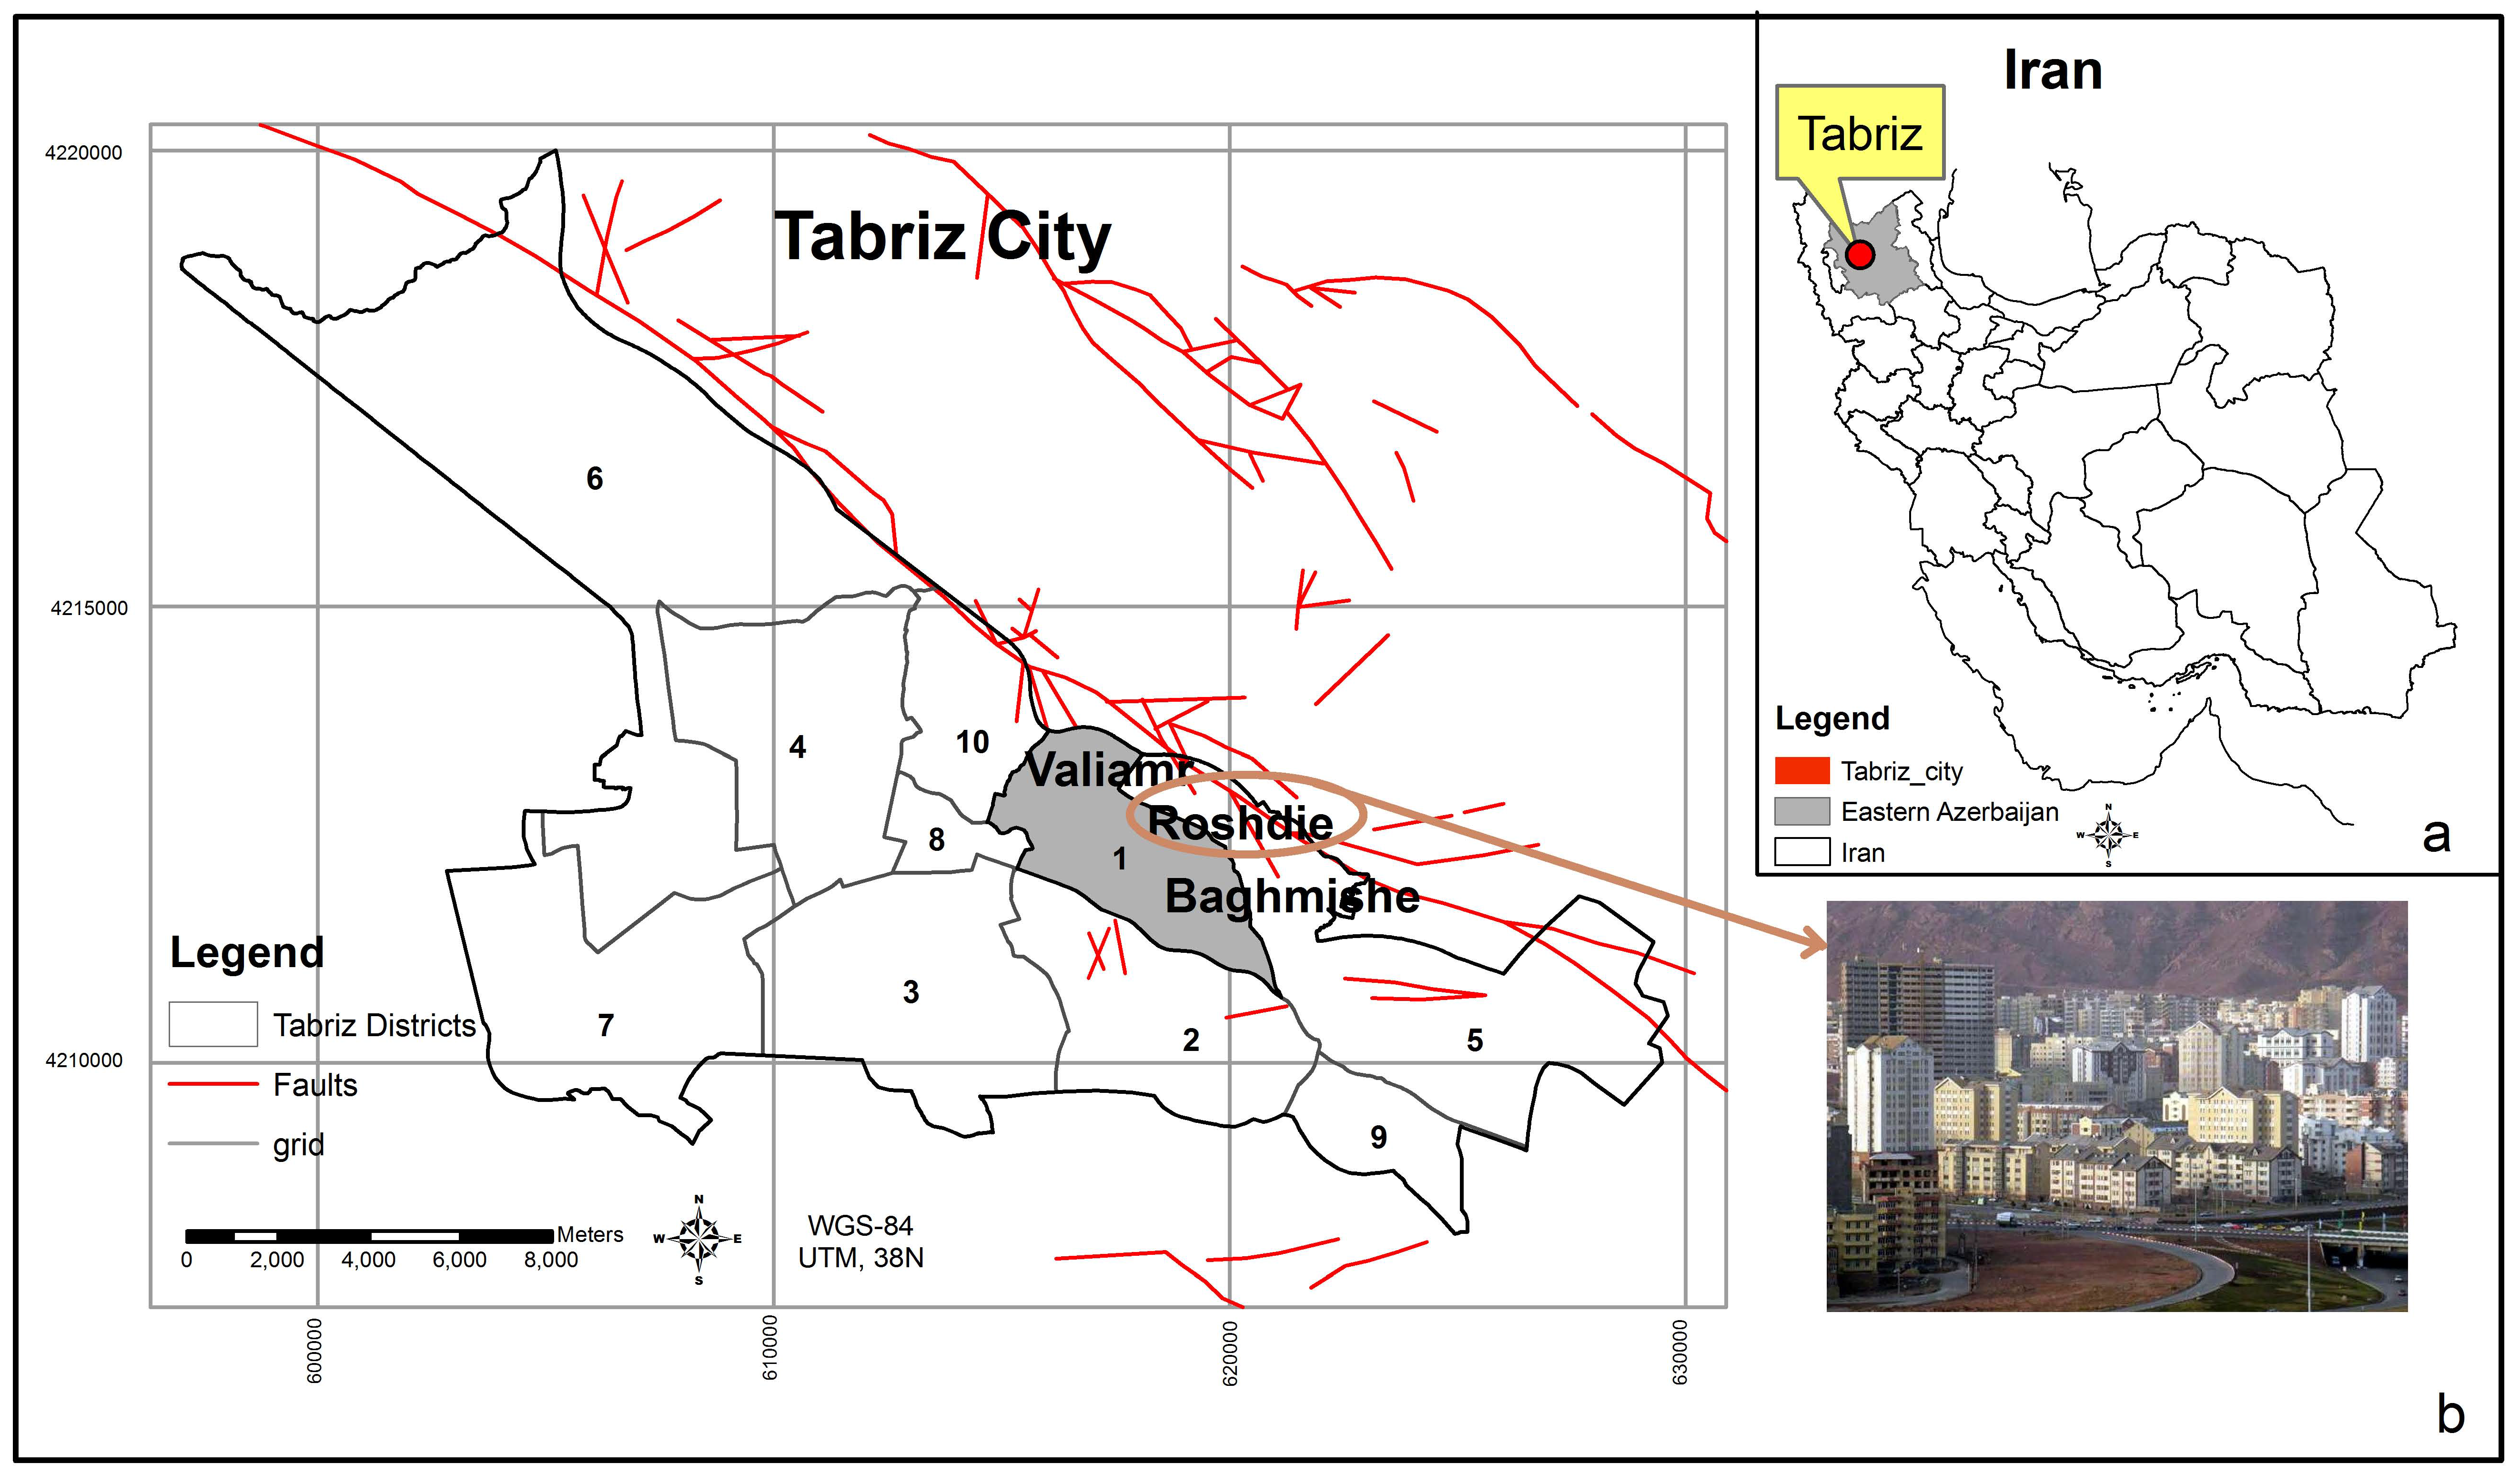
The capital of the Eastern-Azerbaijan Province in the North West of Iran, Tabriz is one of the metropolitan cities in Iran (Figure 1a), with a population of over 1.6 million people, it is ranked fourth in urban population in the country. The city has many old historically and culturally significant buildings. There is a high seismic risk in Tabriz due to its adjacency to the North Tabriz active faults (NTF). These faults caused devastating historical earthquakes in Tabriz in the years 858, 1042, 1721, 1780, and 1965 A.D [28]. The historical earthquakes caused tens of thousands of casualties and extensive physical and social destruction in the city. A recent time series analysis of RADAR images in the area between 2004 and 2010 supports a probable earthquake of M ~7 as a result of strain accumulation across the NTF [29]. There are some limitations in the availability of useful data for assessing PSV (physical seismic vulnerability) in Tabriz. For example, there is lack of proper region-specific fragility curves or pre-defined seismic vulnerability codes/indices for the existing structures. Therefore, it is crucial to propose a pragmatic and quick seismic vulnerability assessment model to be used by local policy makers for mitigation and preparation activities.
There are several densely populated districts and towns built in the hazardous areas adjacent to the NTF in Tabriz (Figure 1b). As represented in Figure 1b, one of the districts adjacent to the active part of the NTF is District One, which is approximately 1900 hectares, containing over 63,300 dwellings and more than 250,000 inhabitants. The statistical data referred to and used in this study was based on 2011 census data conducted by the SCI, which is the last census data announced officially in Iran.
There are also several old buildings in this district that have not been constructed/renewed based on standard construction regulations. District One consists of 156 urban statistical units selected as the study area in this research.
3. Methods
This research aims to propose a parametric approach to build a new physical seismic vulnerability assessment model for earthquake prone urban areas that lack predefined seismic damage relations and/or vulnerability codes for existing structures. In this regard the ‘incompleteness’ of essential input data can be compensated by taking advantage of expert judgments.
The main methods used in this study are briefly described in this section. A detailed explanation of combination of AHP, fuzzy sets, and TOPSIS methods in the proposed methodology is presented in Section 4.
3.1. AHP
One of the widely adopted techniques for weighing the criteria is the Analytic Hierarchy Process (AHP) developed by Saaty (1977) [30]. AHP breaks the problem into smaller simpler decisions and then asks respondents to rank them using pairwise comparisons, giving an organizational tool to criticize the larger problem [31]. AHP calculates the required weights, assigning a weight to each criterion against each of the other criteria [32], as shown in Table 1. The higher the weight of a criterion, the more important it is in the decision.
AHP was first employed in spatial MCDA (Multi Criteria Decision Analysis) by Malczewski (1999) [33]. Subsequently, it has been used consecutively by researchers for assessing vulnerability to natural disasters via spatial MCDM methods. Examples can be seen in [34,35,36,37,38,39].
The final results of AHP include the weight of each criterion and an inconsistency measure indicating whether the judgments are consistent. When experts are confused about the criteria or don’t fully understand the problem, their preferences may not be consistent [31]. The maximum acceptable level of inconsistency measure is 0.1; if consistency ratio (CR) exceeds 0.1, the preferences assignment needs to be revised [40]. In this study, AHP is used to weigh the selected criteria and the inconsistency score is computed for the criteria weights obtained through the AHP approach.
3.2. Fuzzy Set Theory
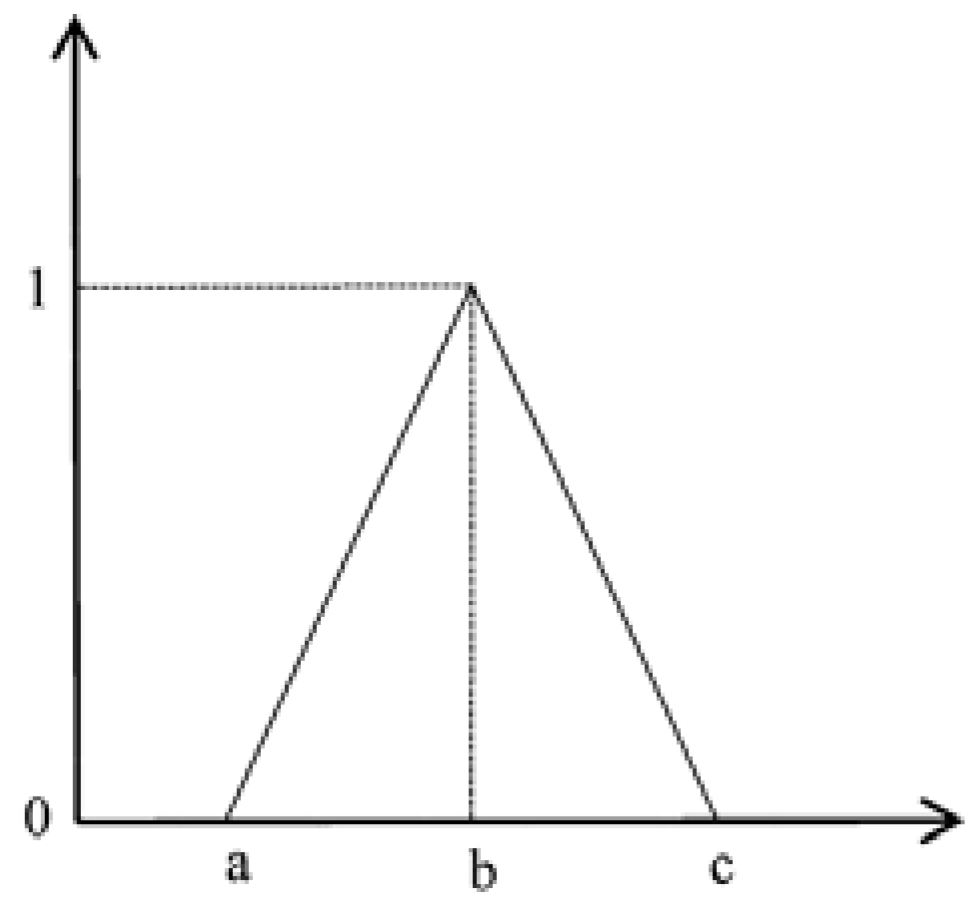
The fuzzy set theory [41] focuses on representing and managing vague information. A fuzzy set is essentially a set whose members have degrees of membership between 0 and 1; this is the opposite of a crisp set, in which each member must have a membership degree of either 0 or 1. Linguistic variables represented as words or sentences can be modeled by triangular fuzzy numbers (TFN). These variables are useful to describe the ill-defined situations that cannot be reasonably described quantitatively. A TFN can be defined by a triplet (a, b, c), as shown in Figure 2.
In this study, due to the vagueness or imprecision of the vulnerability of the study units due to contributing criteria, fuzzy set theory is used [42]. It is difficult to precisely express the relationship between adopted sub-criteria and PSV (Physical seismic vulnerability) quantitatively using crisp values. Therefore, the relationships are given by experts as fuzzy rules using linguistic variables [41,43].
Defuzzification is an important step in fuzzy modeling that involves converting fuzzy values into crisp values. Many defuzzification techniques are introduced [43]. The graded mean integration technique [44] is used as the defuzzification method in this research (Equation (1)).
P (Ã) = 1/6 (a + 4 × b + c)
3.3. TOPSIS Method
TOPSIS is a simple and efficient MCDM method. It has been used successfully by researchers in decision-making problems for disaster management, e.g., [45,46,47,48]. TOPSIS is a simple, highly trustable, and appropriate method for earthquake vulnerability assessment among MCDM methods [49,50]. In the TOPSIS model, given the features and criteria, two positive and negative ideal points are selected regarding each criterion. The best alternative will have the minimum distance from the positive ideal point and maximum distance from the negative ideal point. This method can be suitable for this research due to the following advantages:
- (i)
- It has a sound logic that represents the rationale of human choice.
- (ii)
- It is intuitive and easy to understand; it can be modeled and solved by decision makers and managers using simple computer codes or Excel worksheets [47].
- (iii)
- It considers both the best and the worst alternatives simultaneously.
In this study, defining ideal points and negative ideal points with respect to each of the employed sub-criteria, the TOPSIS method is used to obtain the overall vulnerability ratings of the study units.
3.4. Proposed Method
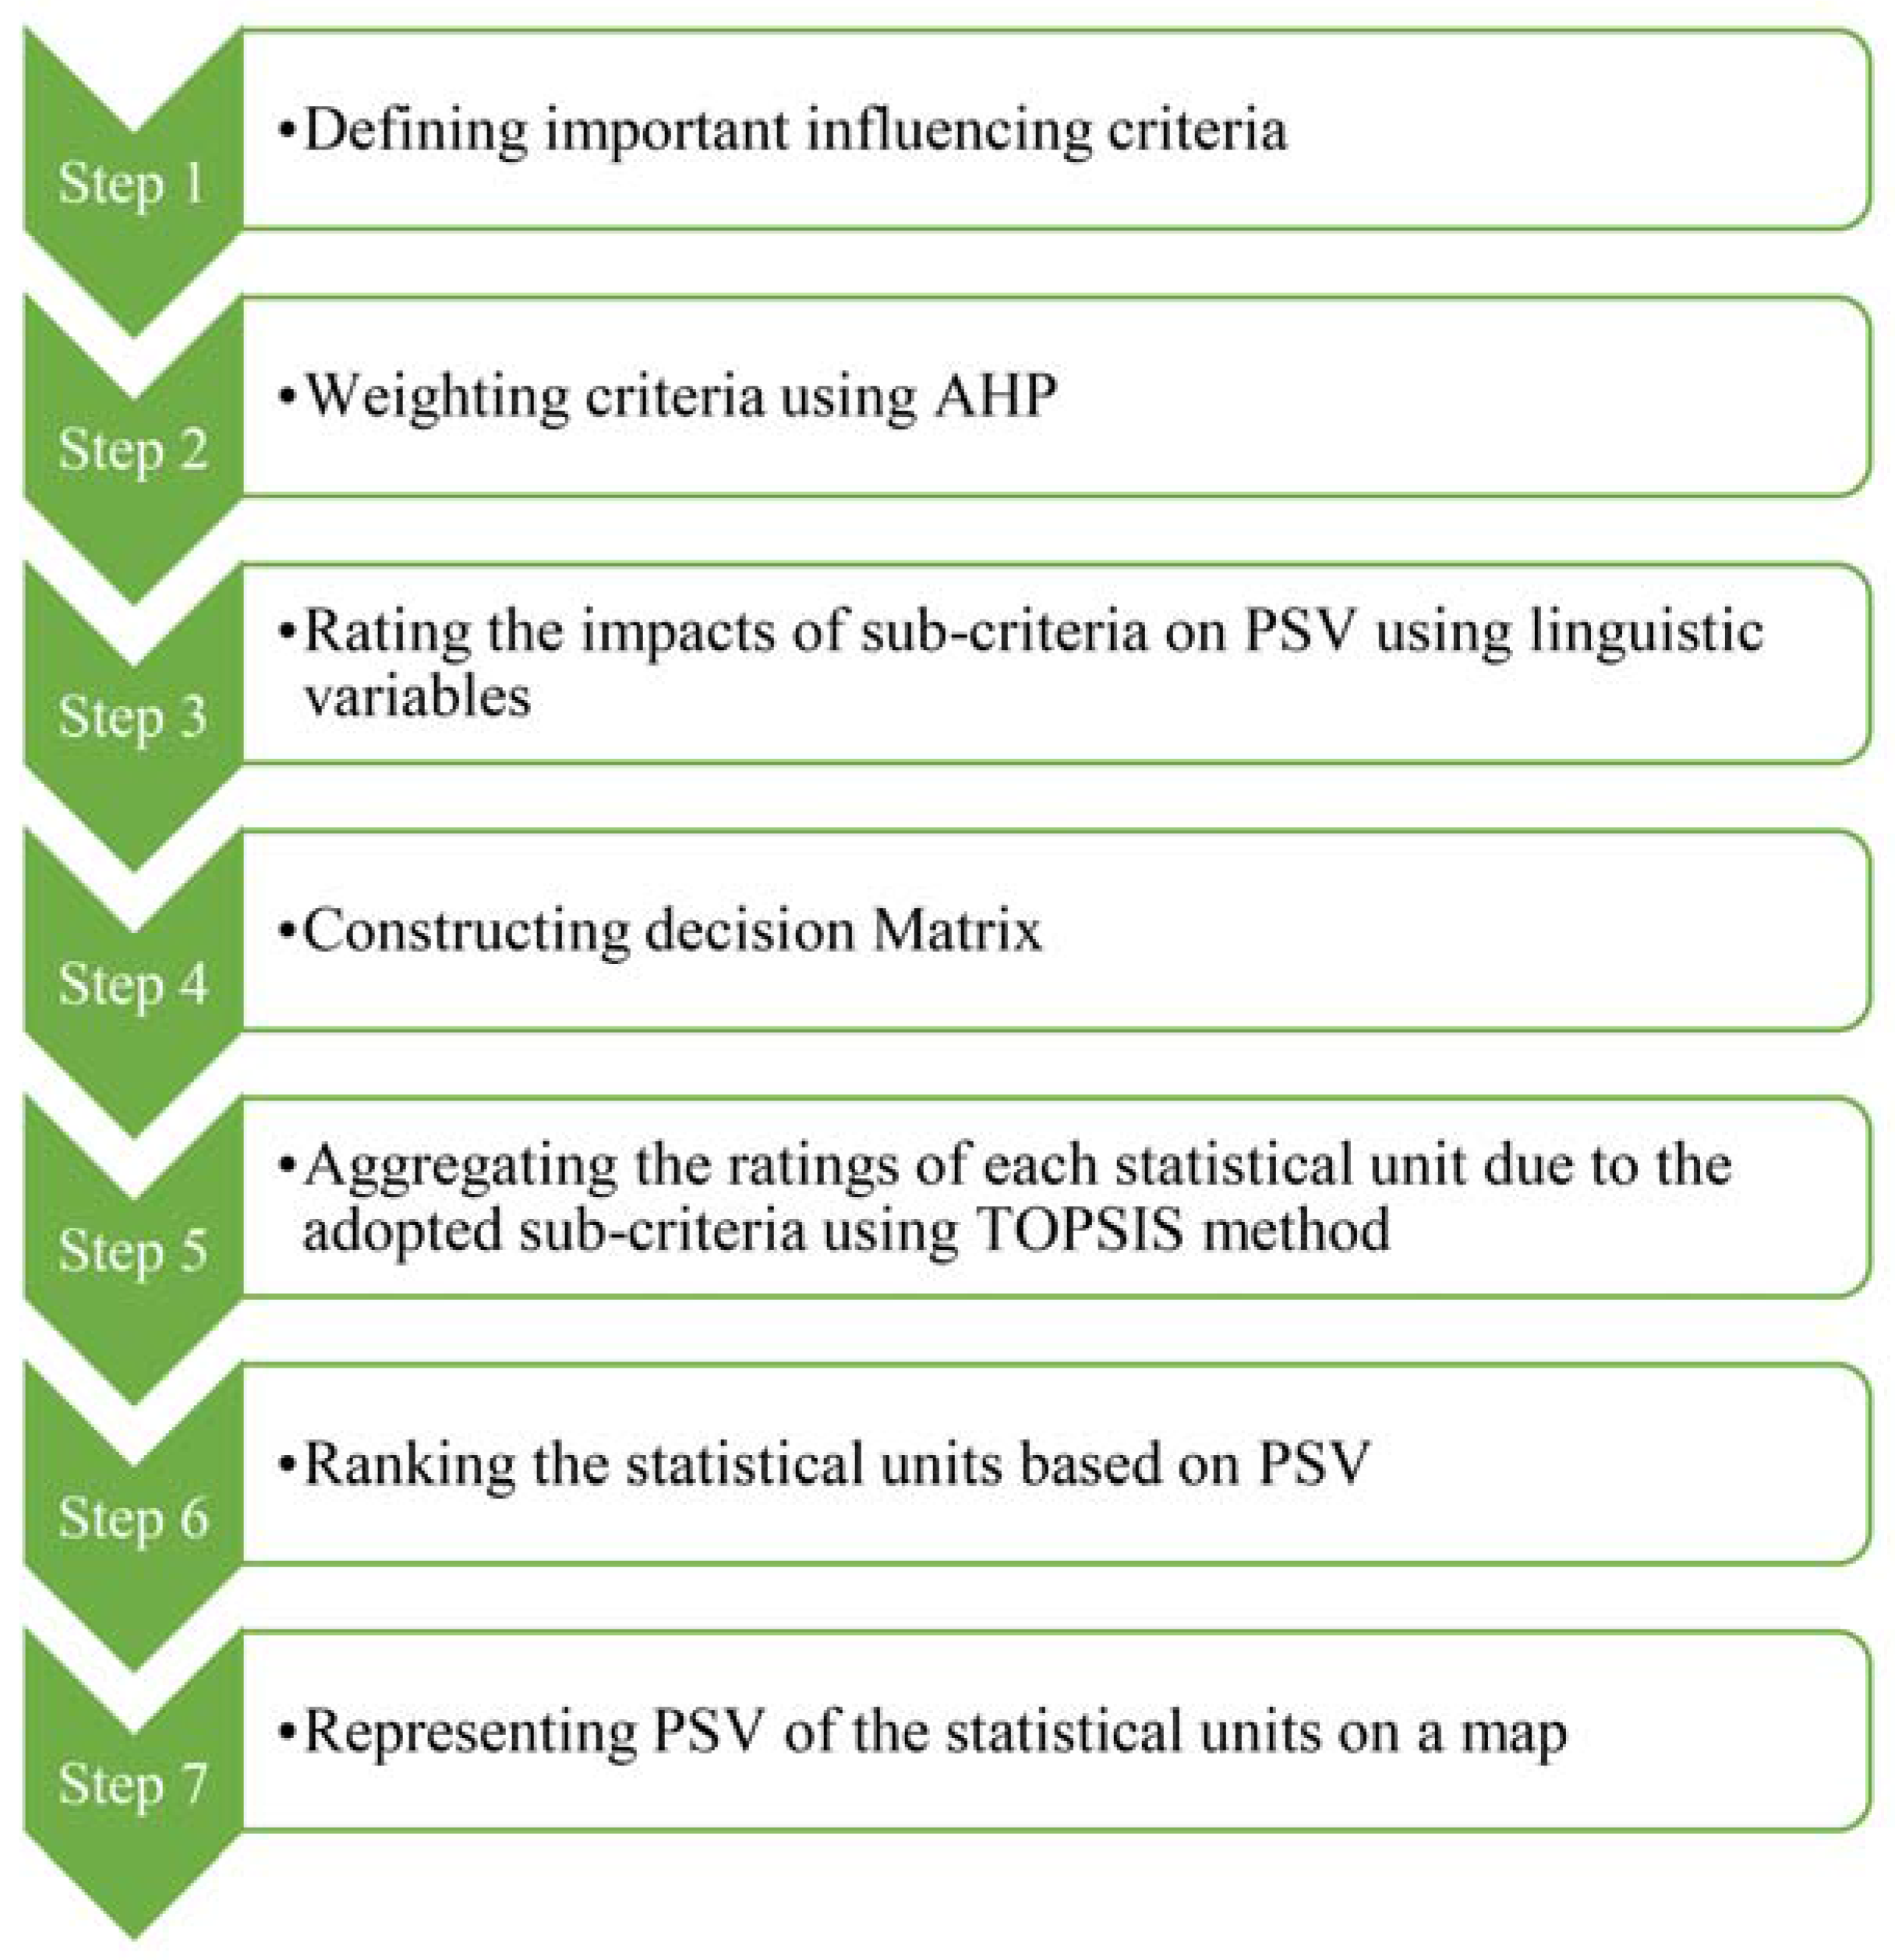
The proposed method in this study aims to model physical seismic vulnerability in urban areas with data scarcity, emphasizing assessing the incorporated ‘vagueness’ uncertainties. Such areas need pragmatic and quick PSVA (physical seismic vulnerability assessment) methods to provide proper information on expected building damages for disaster mitigation and preparation phases. To this end, a new GIS-based fuzzy MCDM method using a modified combination of AHP, fuzzy sets theory, and TOPSIS is proposed, as shown in Figure 3. The proposed methodology consists of seven main steps; Step 1 is to define a set of qualitative criteria as the main indicators of seismic risk that are mainly spatial criteria. Step 2 is using AHP to weigh the selected criteria. In Step 3, the effect of each sub-criterion on the severity of the expected damages to the buildings is defined as a fuzzy rule.
In Step 4, a Decision Matrix (DM) is constructed. The fuzzy decision rules are assigned to the statistical units concerning their attributes, which are available using GIS analysis capabilities.
Step 5 is to use fuzzy TOPSIS method. Regarding each sub-criterion, the statistical unit with the lowest physical seismic vulnerability (PSV) is considered the positive ideal point (IP), and the unit with the highest PSV is considered the negative ideal point (NP). Step 6 is to rank the given statistical units based on the studied units’ physical seismic vulnerability (or priority for taking action in disaster mitigation activities). As shown in Equation (2), the ranking of each statistical unit is calculated based on the overall closeness to the ideal solution (D+) and negative ideal solution (D¯).
R = D¯/(D¯ + D+)
Step 7 is to represent the calculated PSV of the statistical units on a map using GIS visualization capabilities.
4. Data Analysis and Results
In this research a new combination of AHP, fuzzy sets, and TOPSIS methods for physical seismic vulnerability assessment is proposed and implemented on real data of statistical units of a municipality district in Tabriz.
Step 1. The set of main criteria, which should sufficiently represent the problem domain, were defined through literature review and local experts’ judgments. After gathering the necessary information on the available data and their metadata such as the scale, data type, and the date of production, the set of the main contributing criteria was finalized. The adopted datasets and the providing organizations are illustrated in Table 2. All data were collected for the 156 urban statistical units in Tabriz Municipality District One.
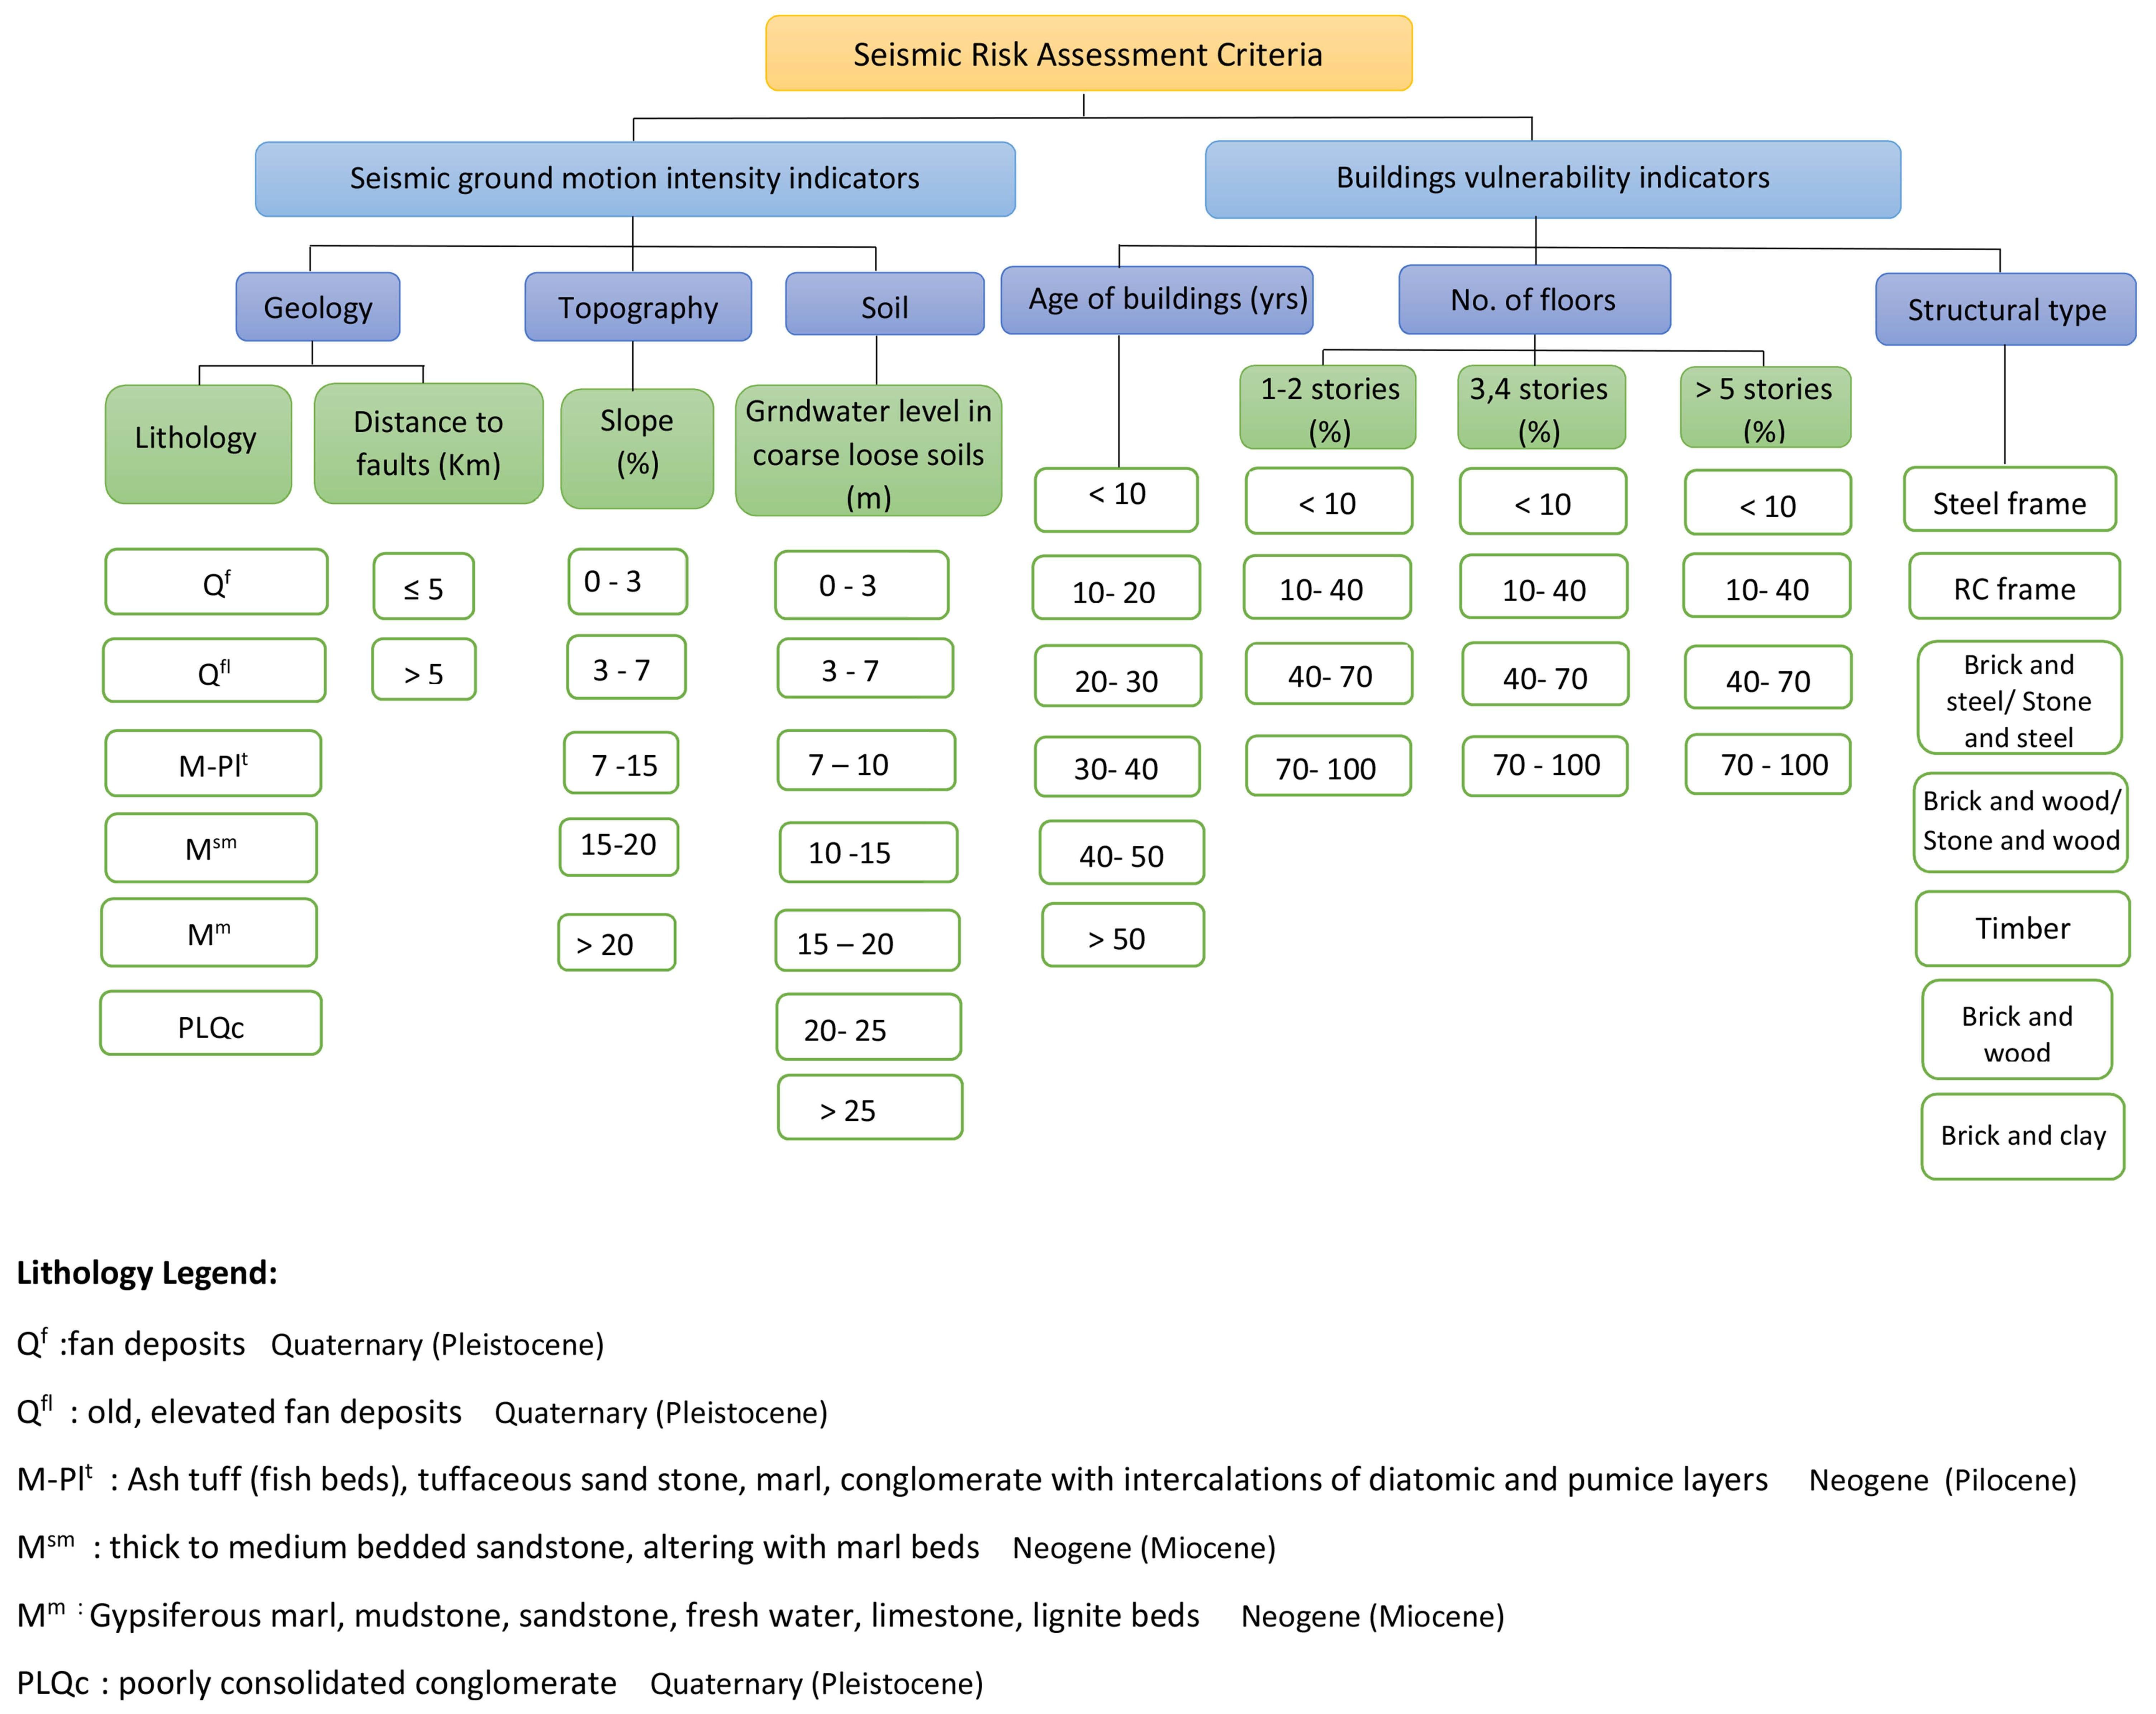
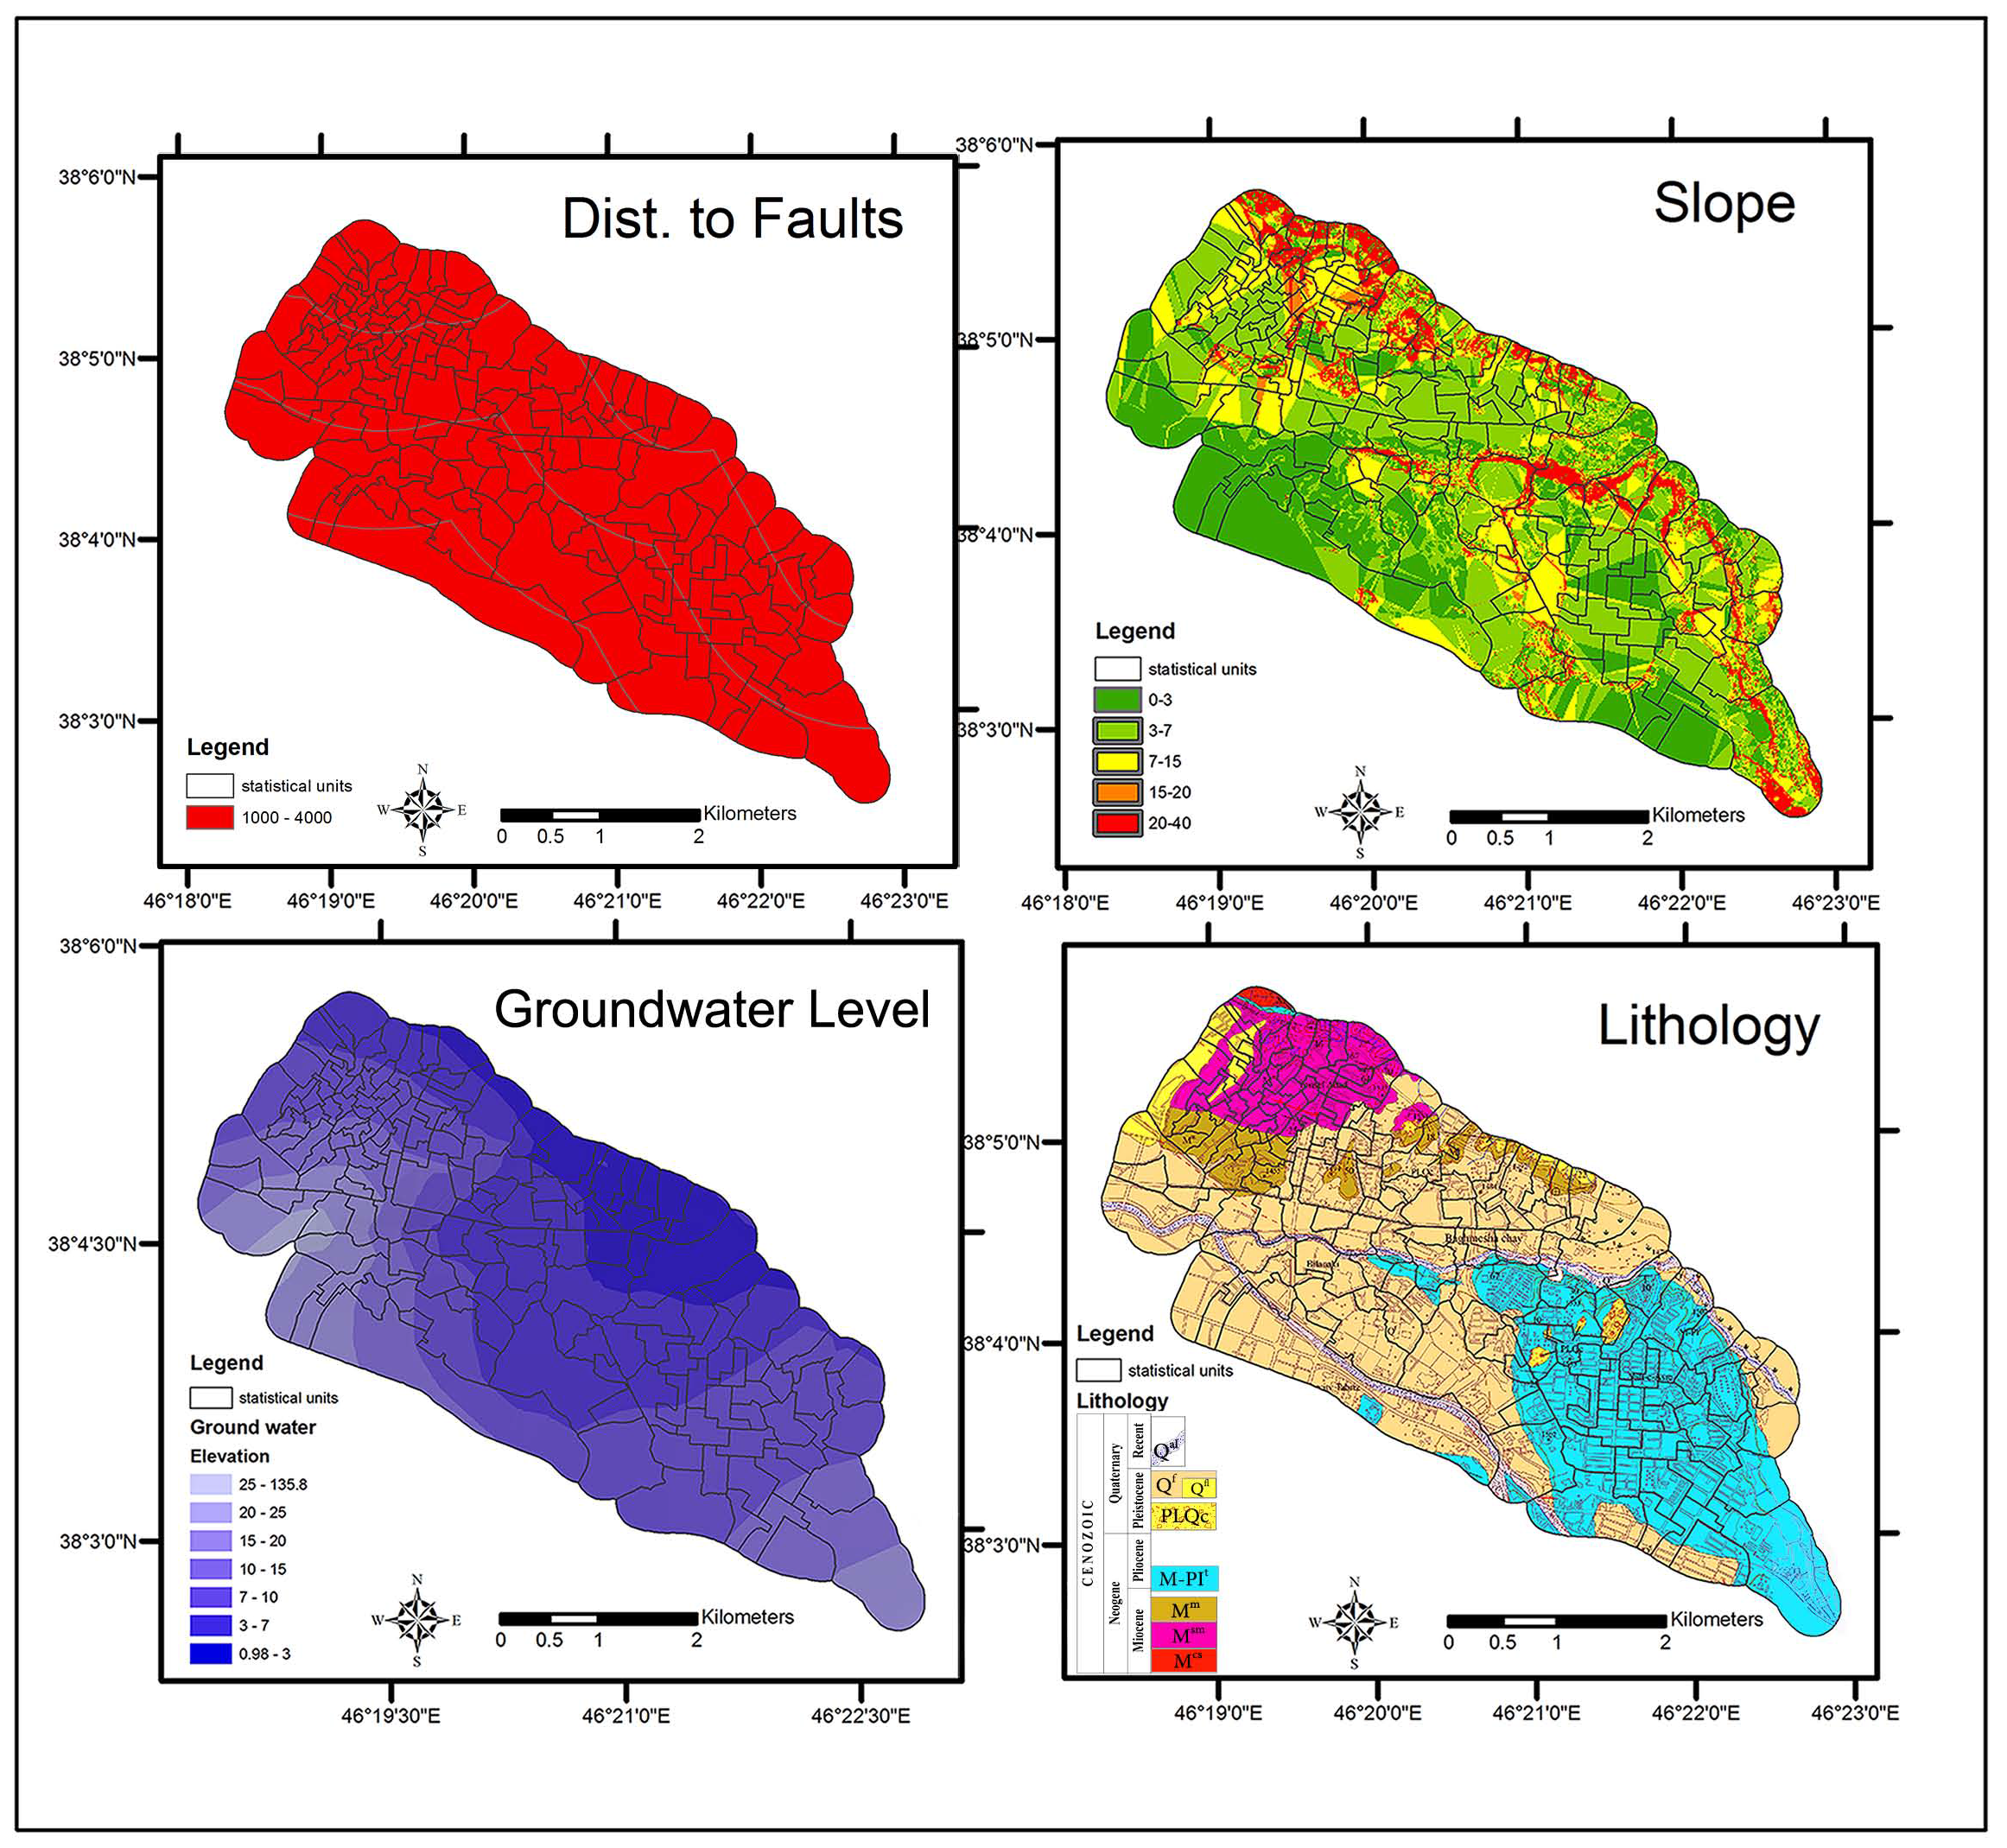
The criteria were categorized into two main categories; namely hazard indicators, related to micro zonation, and structural indictors, pertaining to the buildings’ structural characteristics. These criteria were classified into sub-criteria based on existing data conditions and local experts’ suggestions (see Figure 4). The created maps pertinent to the sub-classes of ‘ground motion intensity’ indicators in the study area are shown in Figure 5. Regarding sub-classes of the indicator ‘distance to faults’, taking into account the width of municipality District One, which is less than 5 km, and its very near vicinity to the North Tabriz faults, the whole area was considered a near-field, concerning the distance between site and faults (e.g., [51,52]).
Step 2. The responses of experts on the pairwise comparison between the selected criteria importance regarding their influence on physical seismic vulnerability were gathered in an AHP approach (Table 3).
The comparative weights then were analyzed for determining each criterion weight. The results are illustrated in Table 4. The inconsistency was 0.03, which is acceptable in comparision to the value of CR = 0.1, identified by Saaty (1990) [37].
Step 3. Seven experts from seven backgrounds, namely ‘engineering seismology’, ‘earthquake engineering’, ‘geology’, ‘geotechnical engineering’, ‘structural engineering’, ‘soil mechanics’, and ‘foundation engineering’, were asked to give their opinions on the impacts of the adopted sub-criteria on PSV (physical seismic vulnerability). It is not practical to provide exact numerical ratings, due to the lack of (sufficient) knowledge. The uncertainty, which stems from lack of knowledge, is called epistemic (or subjective) uncertainty [53]. This research focuses on treating one of the sources of epistemic uncertainty called ‘vagueness’.
Thus, in this research, the rules were defined using linguistic variables, e.g., ‘the vulnerability is very high if ‘buildings age’ is more than 40 years’. The fuzzy seismic vulnerability rules can be applied to different areas, and thus the proposed method is independent of the study area. Table 5 demonstrates the fuzzy numbers used to represent the linguistic variables employed in this paper.
Step 4. A multi-criteria decision-making (MCDM) problem can be concisely expressed in a matrix format, in which the rows are decision cases and columns are the criteria against which the studied cases are evaluated. In this study, the rows of DM are the statistical units and the columns are the adopted sub-criteria. Thus DM contains 156 rows and 9 columns. Due to the fuzzy rules expressed with linguistic terms (described in Step 3) regarding each cub-criterion, the members of DM are presented as TFNs (see Table 5). For determining the attributes of each statistical unit, ArcGIS 9.3 software was used.
Step 5. The fuzzy ratings in the DM were defuzzified using the graded mean integration technique (see Equation (1)). The TOPSIS method was programmed in MATLAB in this study. First, the ideal point (IP) and negative ideal point (NP) in each column of DM were determined. Thereupon Euclidean distances from IP and NP were calculated in each column. The criteria weights obtained from the AHP method were implemented to the calculated distances of each column. Finally, the distances from both IPs and NPs for each statistical unit were aggregated.
Step 6. Using Equation (2), the rankings of the statistical units were calculated based on their overall closeness to the IPs and NPs, which were obtained in Step 5. As a result, 52 ranks were attained for the studied statistical units.
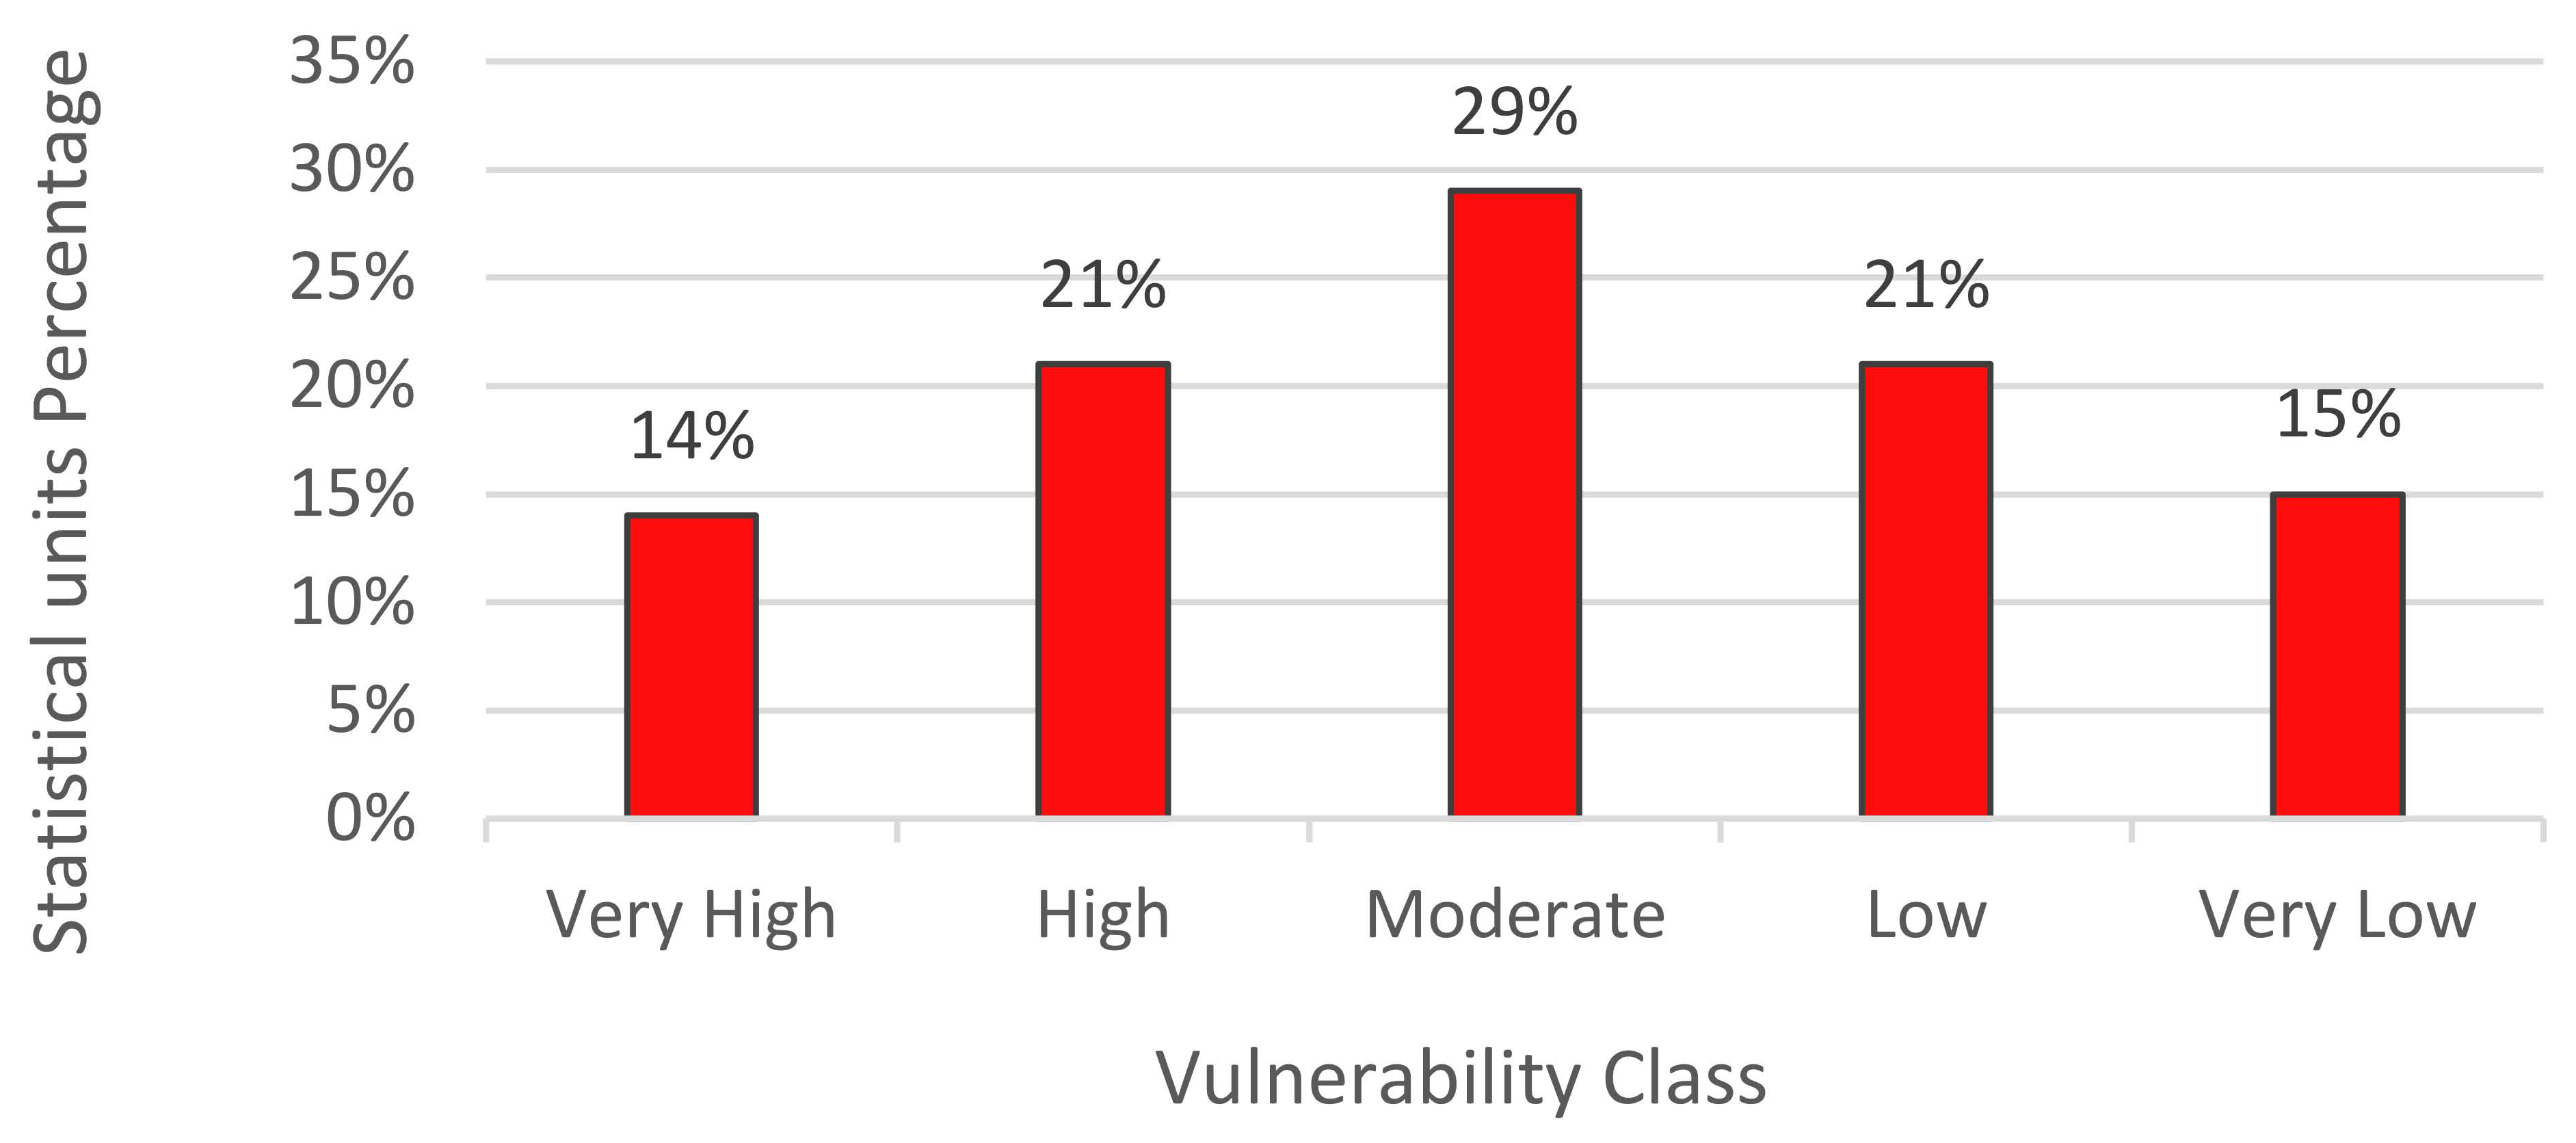
Step 7. In order to have a quick view of physical seismic vulnerability in the study area, the obtained ranks were categorized to five classes, namely ‘Very High: VH’, ‘High: H’, ‘Moderate: M’, ‘Low: L’, and ‘Very Low: VL’ (e.g., [2,21,22,54]). As shown in the legend of Figure 6, the ranks 1 through 11 were categorized in the vulnerability class ‘VH’ and the ranks 12 through 22 were categorized as ‘H’ class and so forth. The vulnerability classes were represented on a map layer (Figure 6).
The sum of the statistical units categorized in each vulnerability class is illustrated in Figure 7. The results of this research reveal that 14% of the 156 studied statistical units have very high physical seismic vulnerability (PSV) considering the predicted damages to the buildings, and almost 21% of the studied statistical units have high PSV (see Figure 7).
5. Sensitivity Analysis
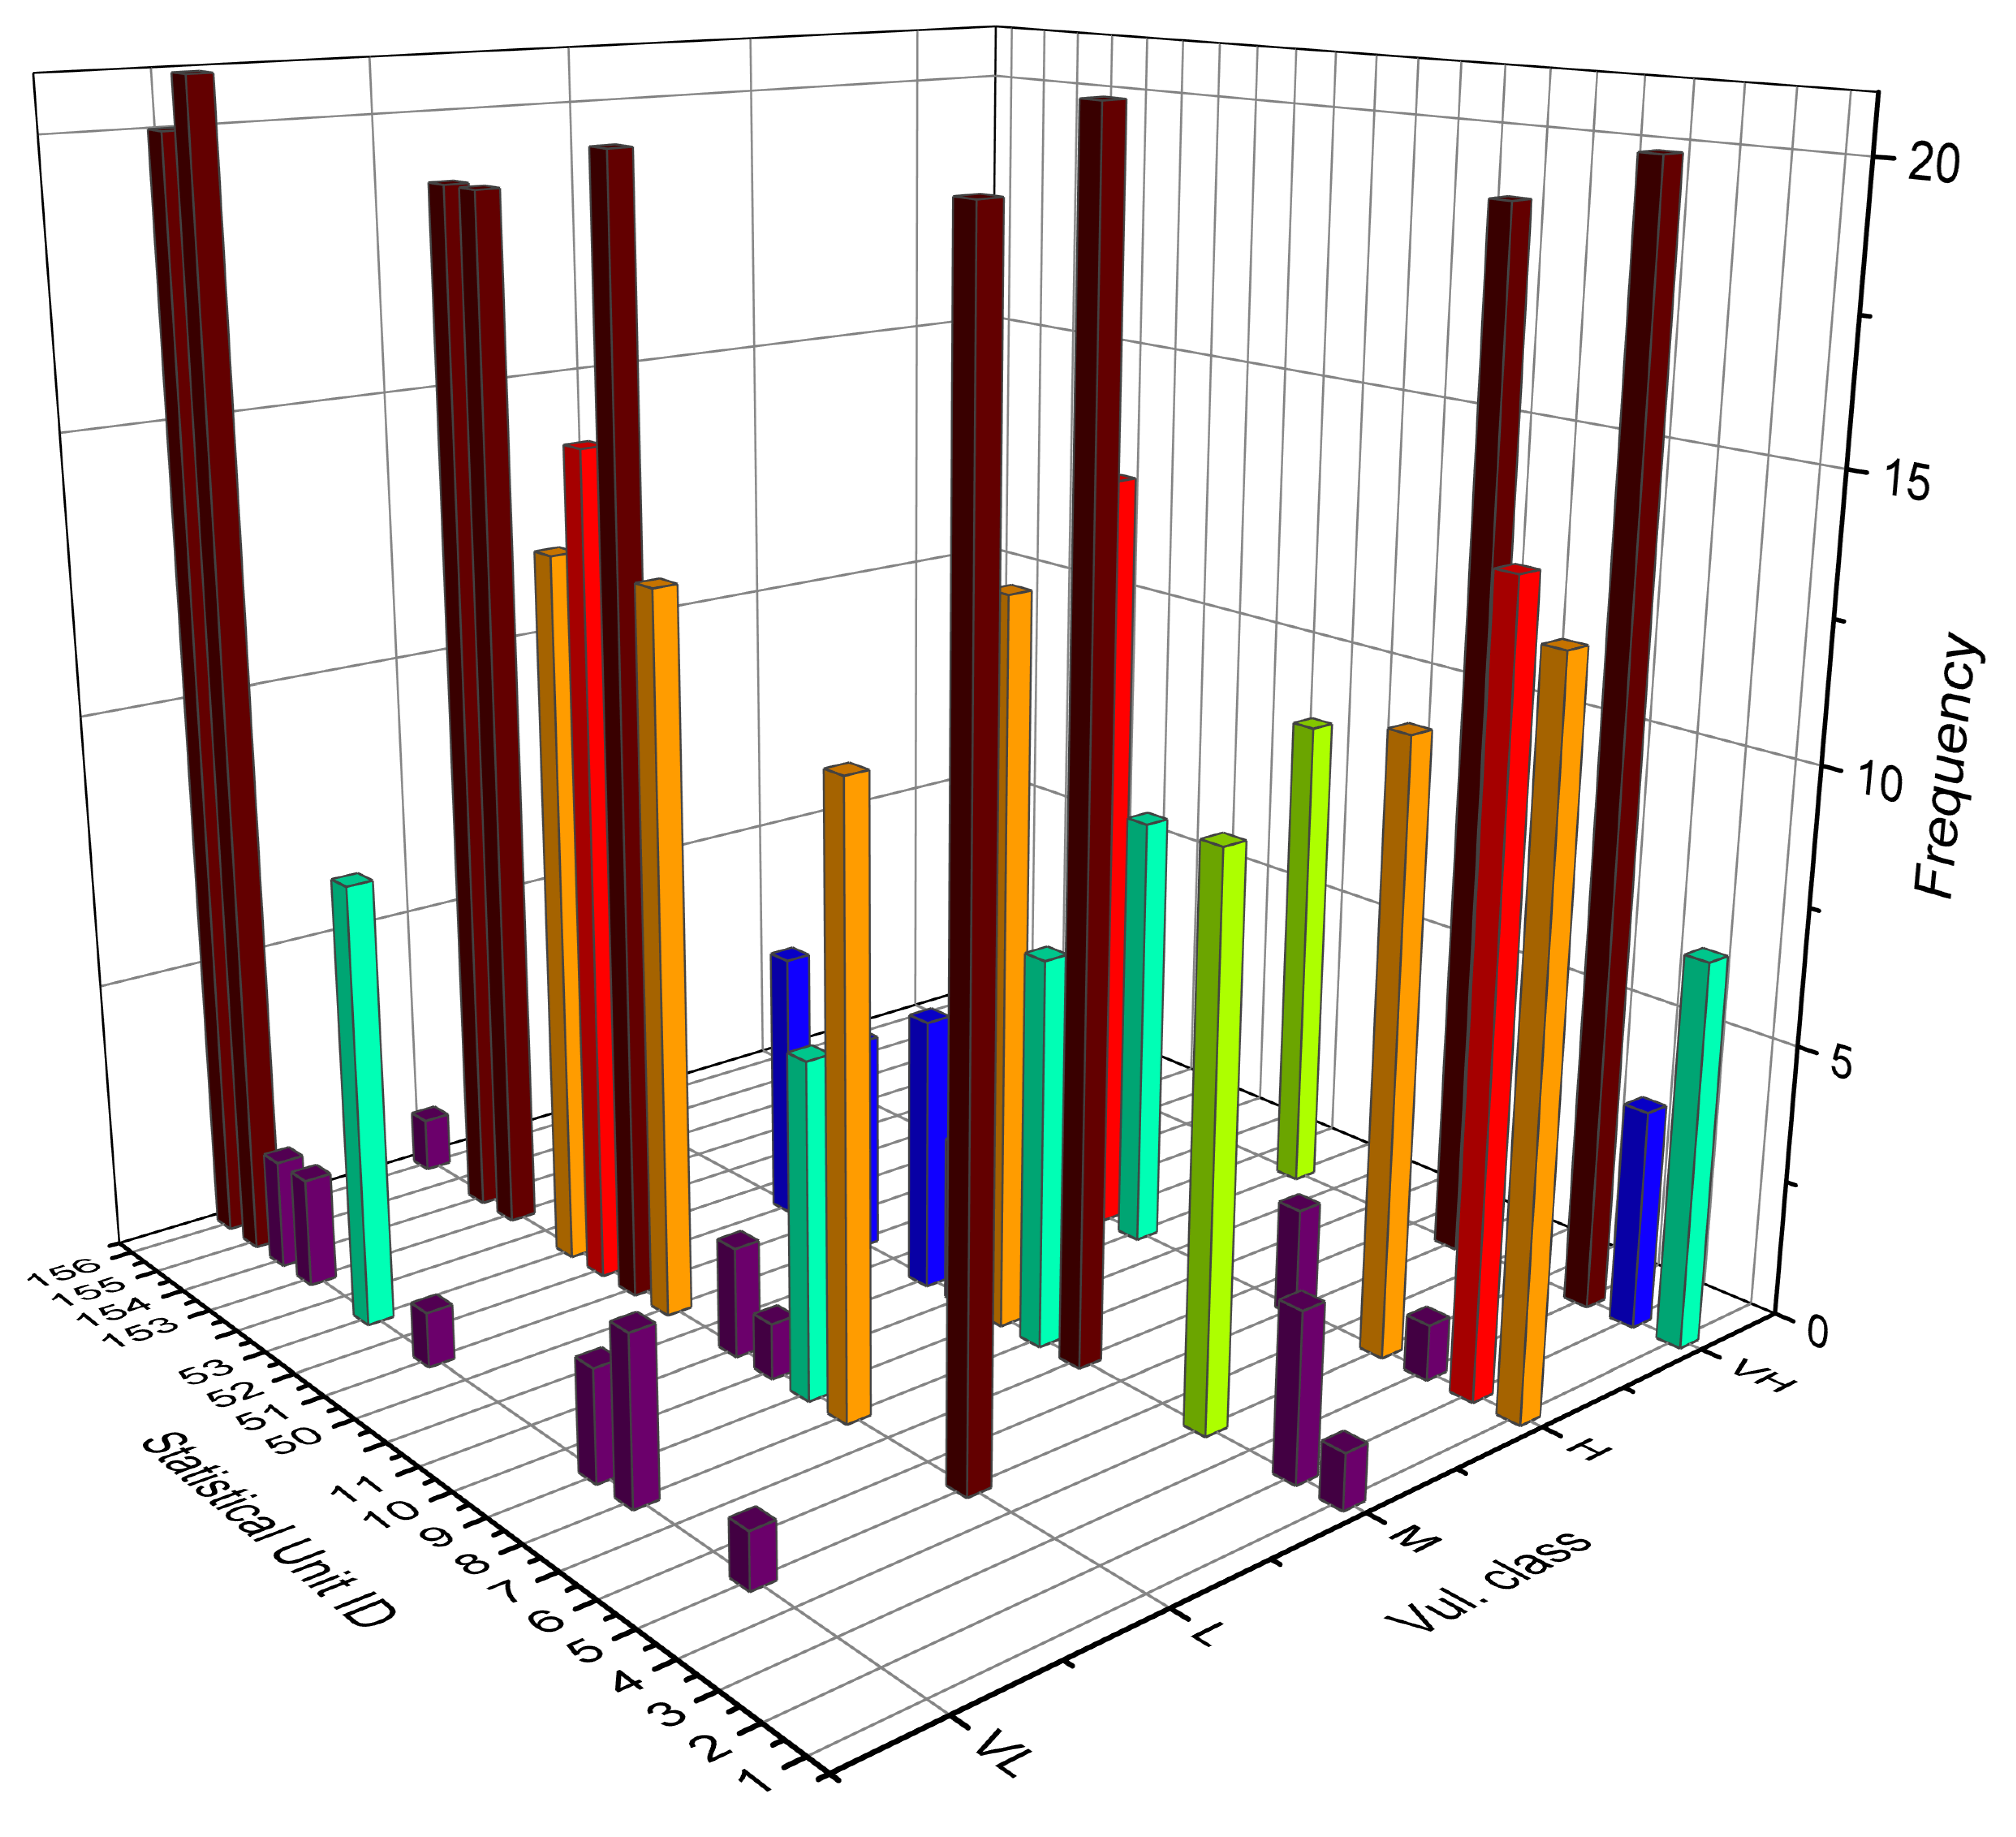
In the AHP-based MCDM methods considering the expert judgments in giving weights, a degree of subjectivity is allowed [55]. Sensitivity Analysis (SA) is performed to investigate how changes in the criteria weights influence the outputs of the model. A common SA method which is based on the variation of the employed criteria weights was used in this study [56]. For this purpose, the weights of the criteria derived by applying the AHP method were exchanged with each other one at a time. For example, the 1st and the 2nd criteria weights have changed (the rest of the criteria weights were invariable) and were named ‘criteria weights Set 1’. The next criteria weights set is calculated by changing the 1st criterion weight with the 3rd one (the weights of the 2nd, 4th, 5th, 6th, and 7th criteria remained the same), and the new set is named ‘Set 2’. Therefore, 21 sets were obtained, and, accordingly, 21 computations for re-estimating the physical seismic vulnerability (PSV) of the study units were performed. The calculated PSV ranks using the 21 sets of the criteria weights were compared with the PSV ranks obtained from the proposed methodology. The results indicate that the vulnerability class of 136 units out of the 156 study units remained the same in more than 62% of the re-estimations. Therefore it can be approved that changing the criteria weights did not significantly impact the model outputs. Figure 8 shows the vulnerability classes and the frequency of each vulnerability class in different 21 computations regarding some of the statistical units of Tabriz District One.
In order to validate the approach and ensure the reliability and transferability of the proposed method to a general case (considering near-vicinity of the case study to the fault system in this study), a sensitivity analysis was carried out, removing the ‘distance to the fault’ from the criteria. The weights of the criteria were recalculated using Saaty’s preference scale [30]. The obtained weights are illustrated in Table 6.
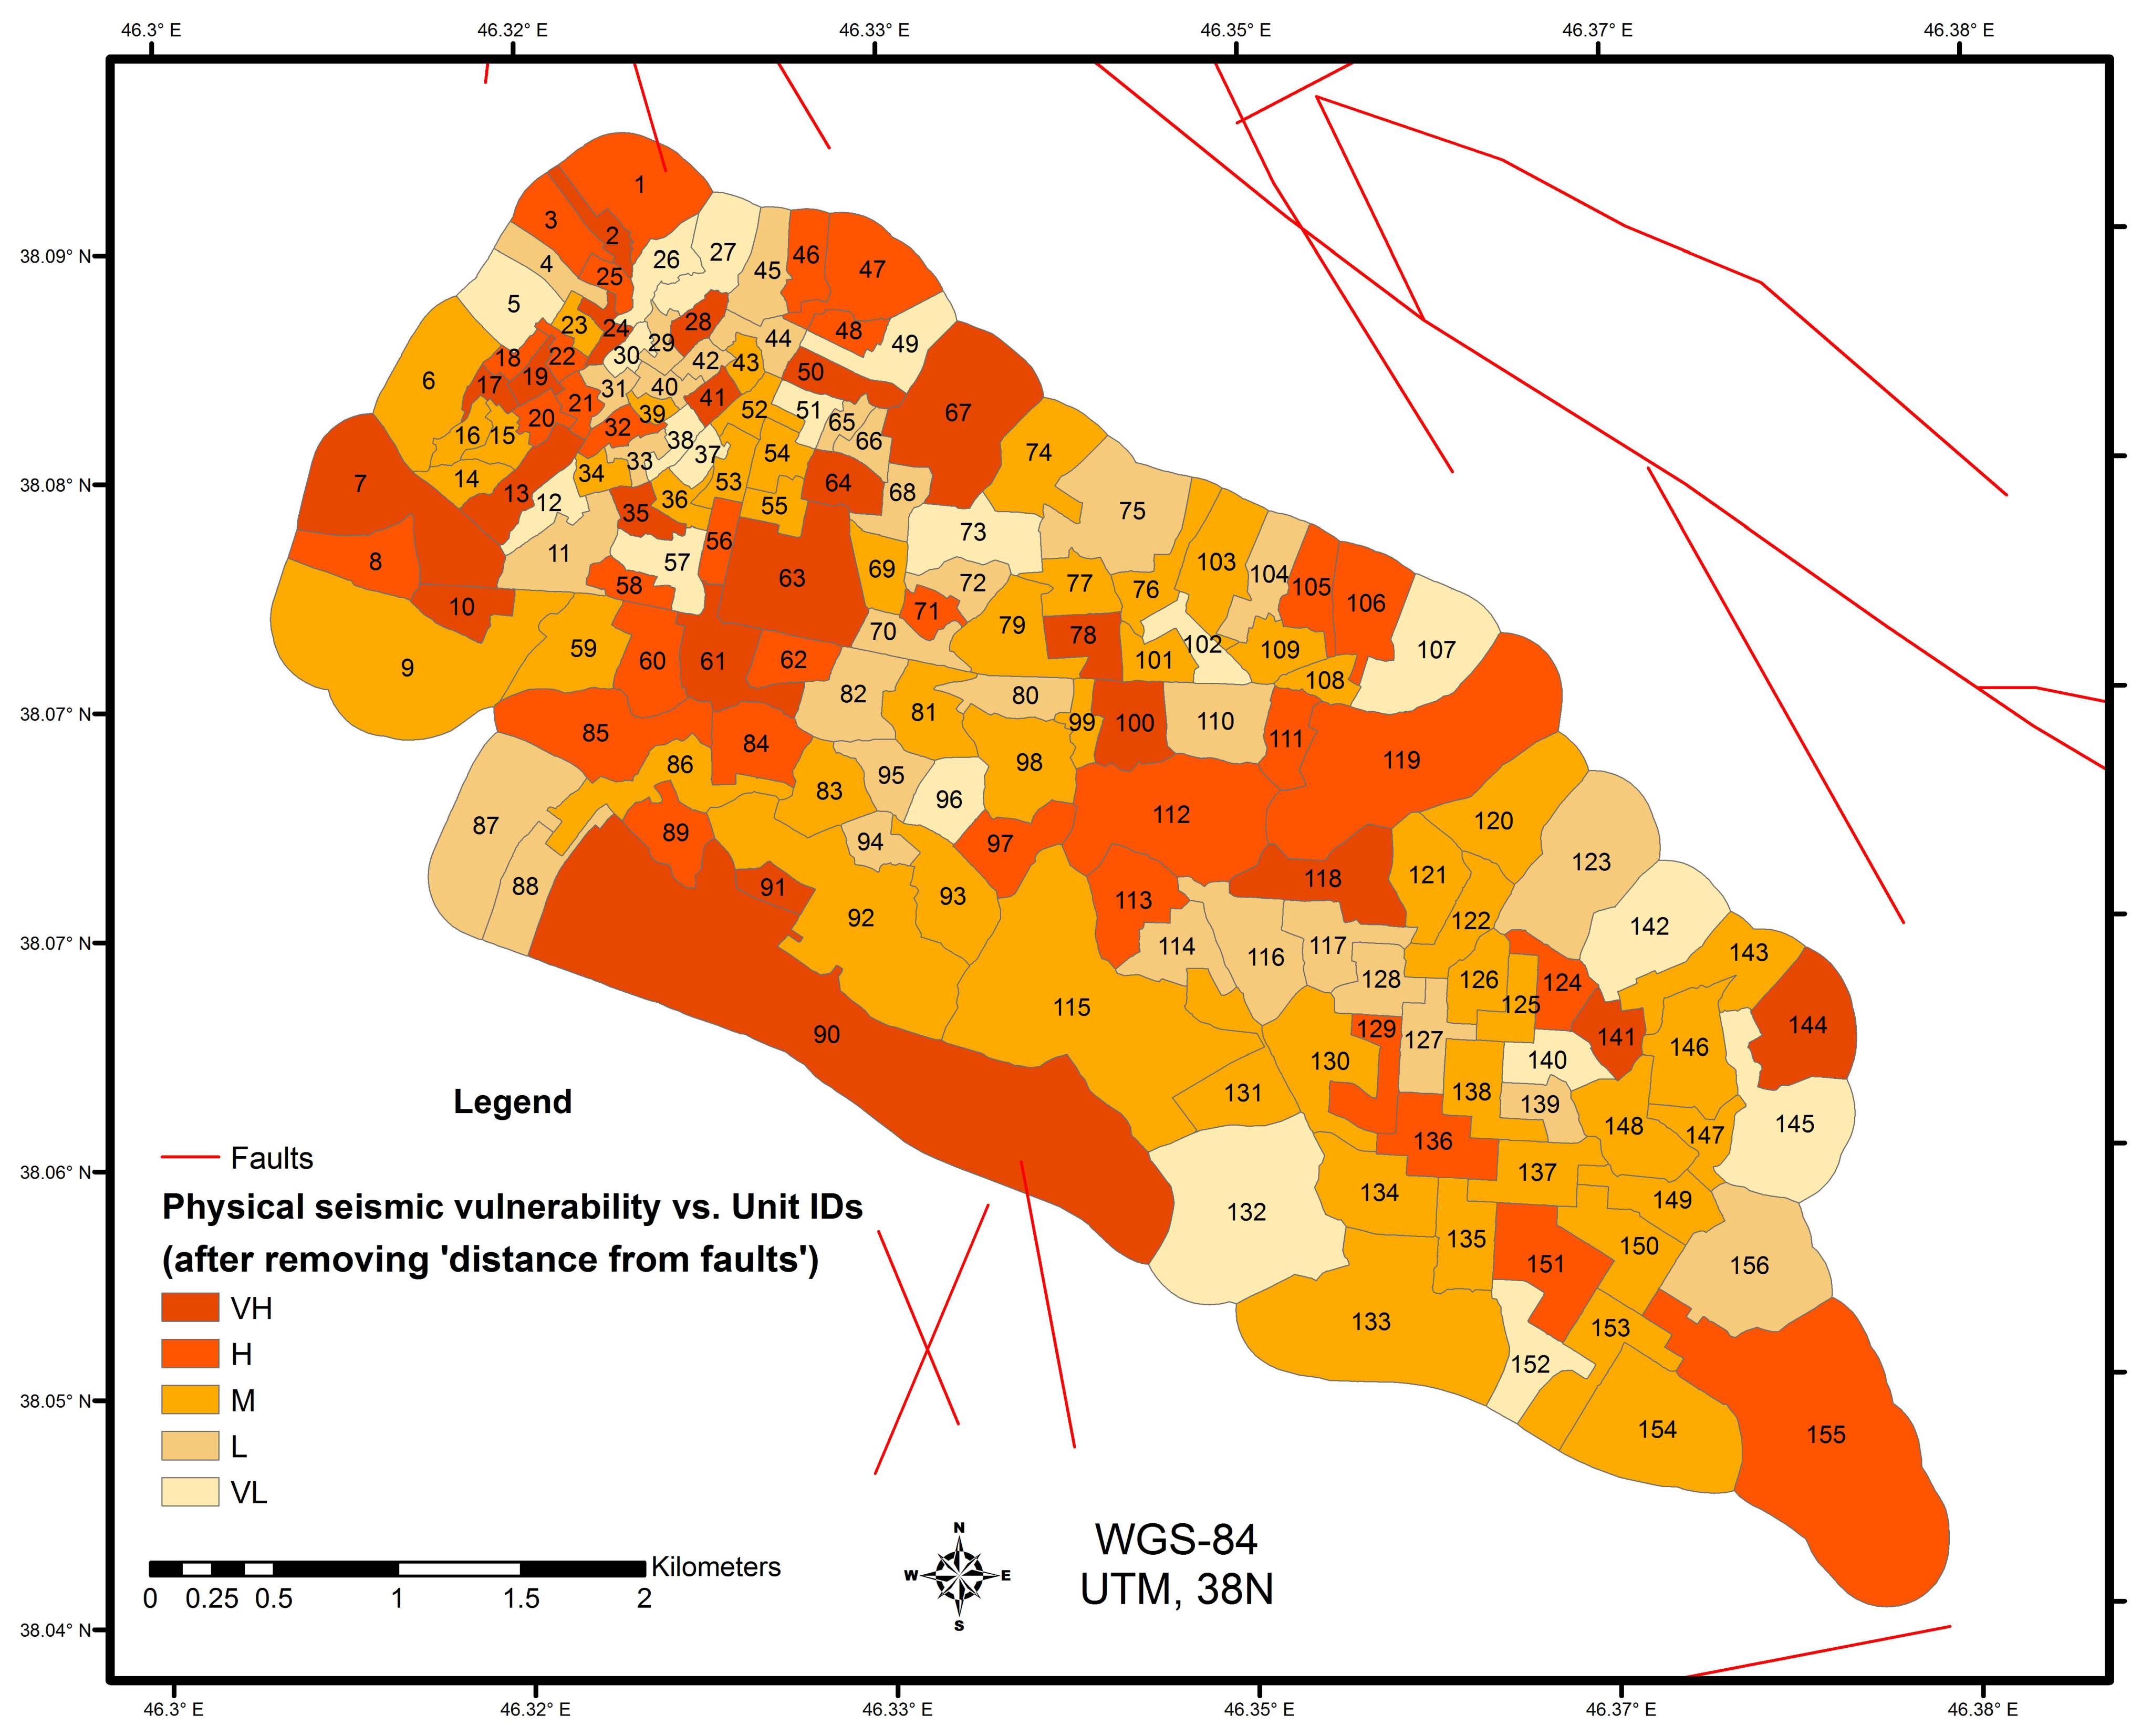
The physical seismic vulnerability of the statistical units was assessed using the weights illustrated in Table 6. The obtained physical seismic vulnerabilities for the statistical units in the study area are illustrated in Figure 9.
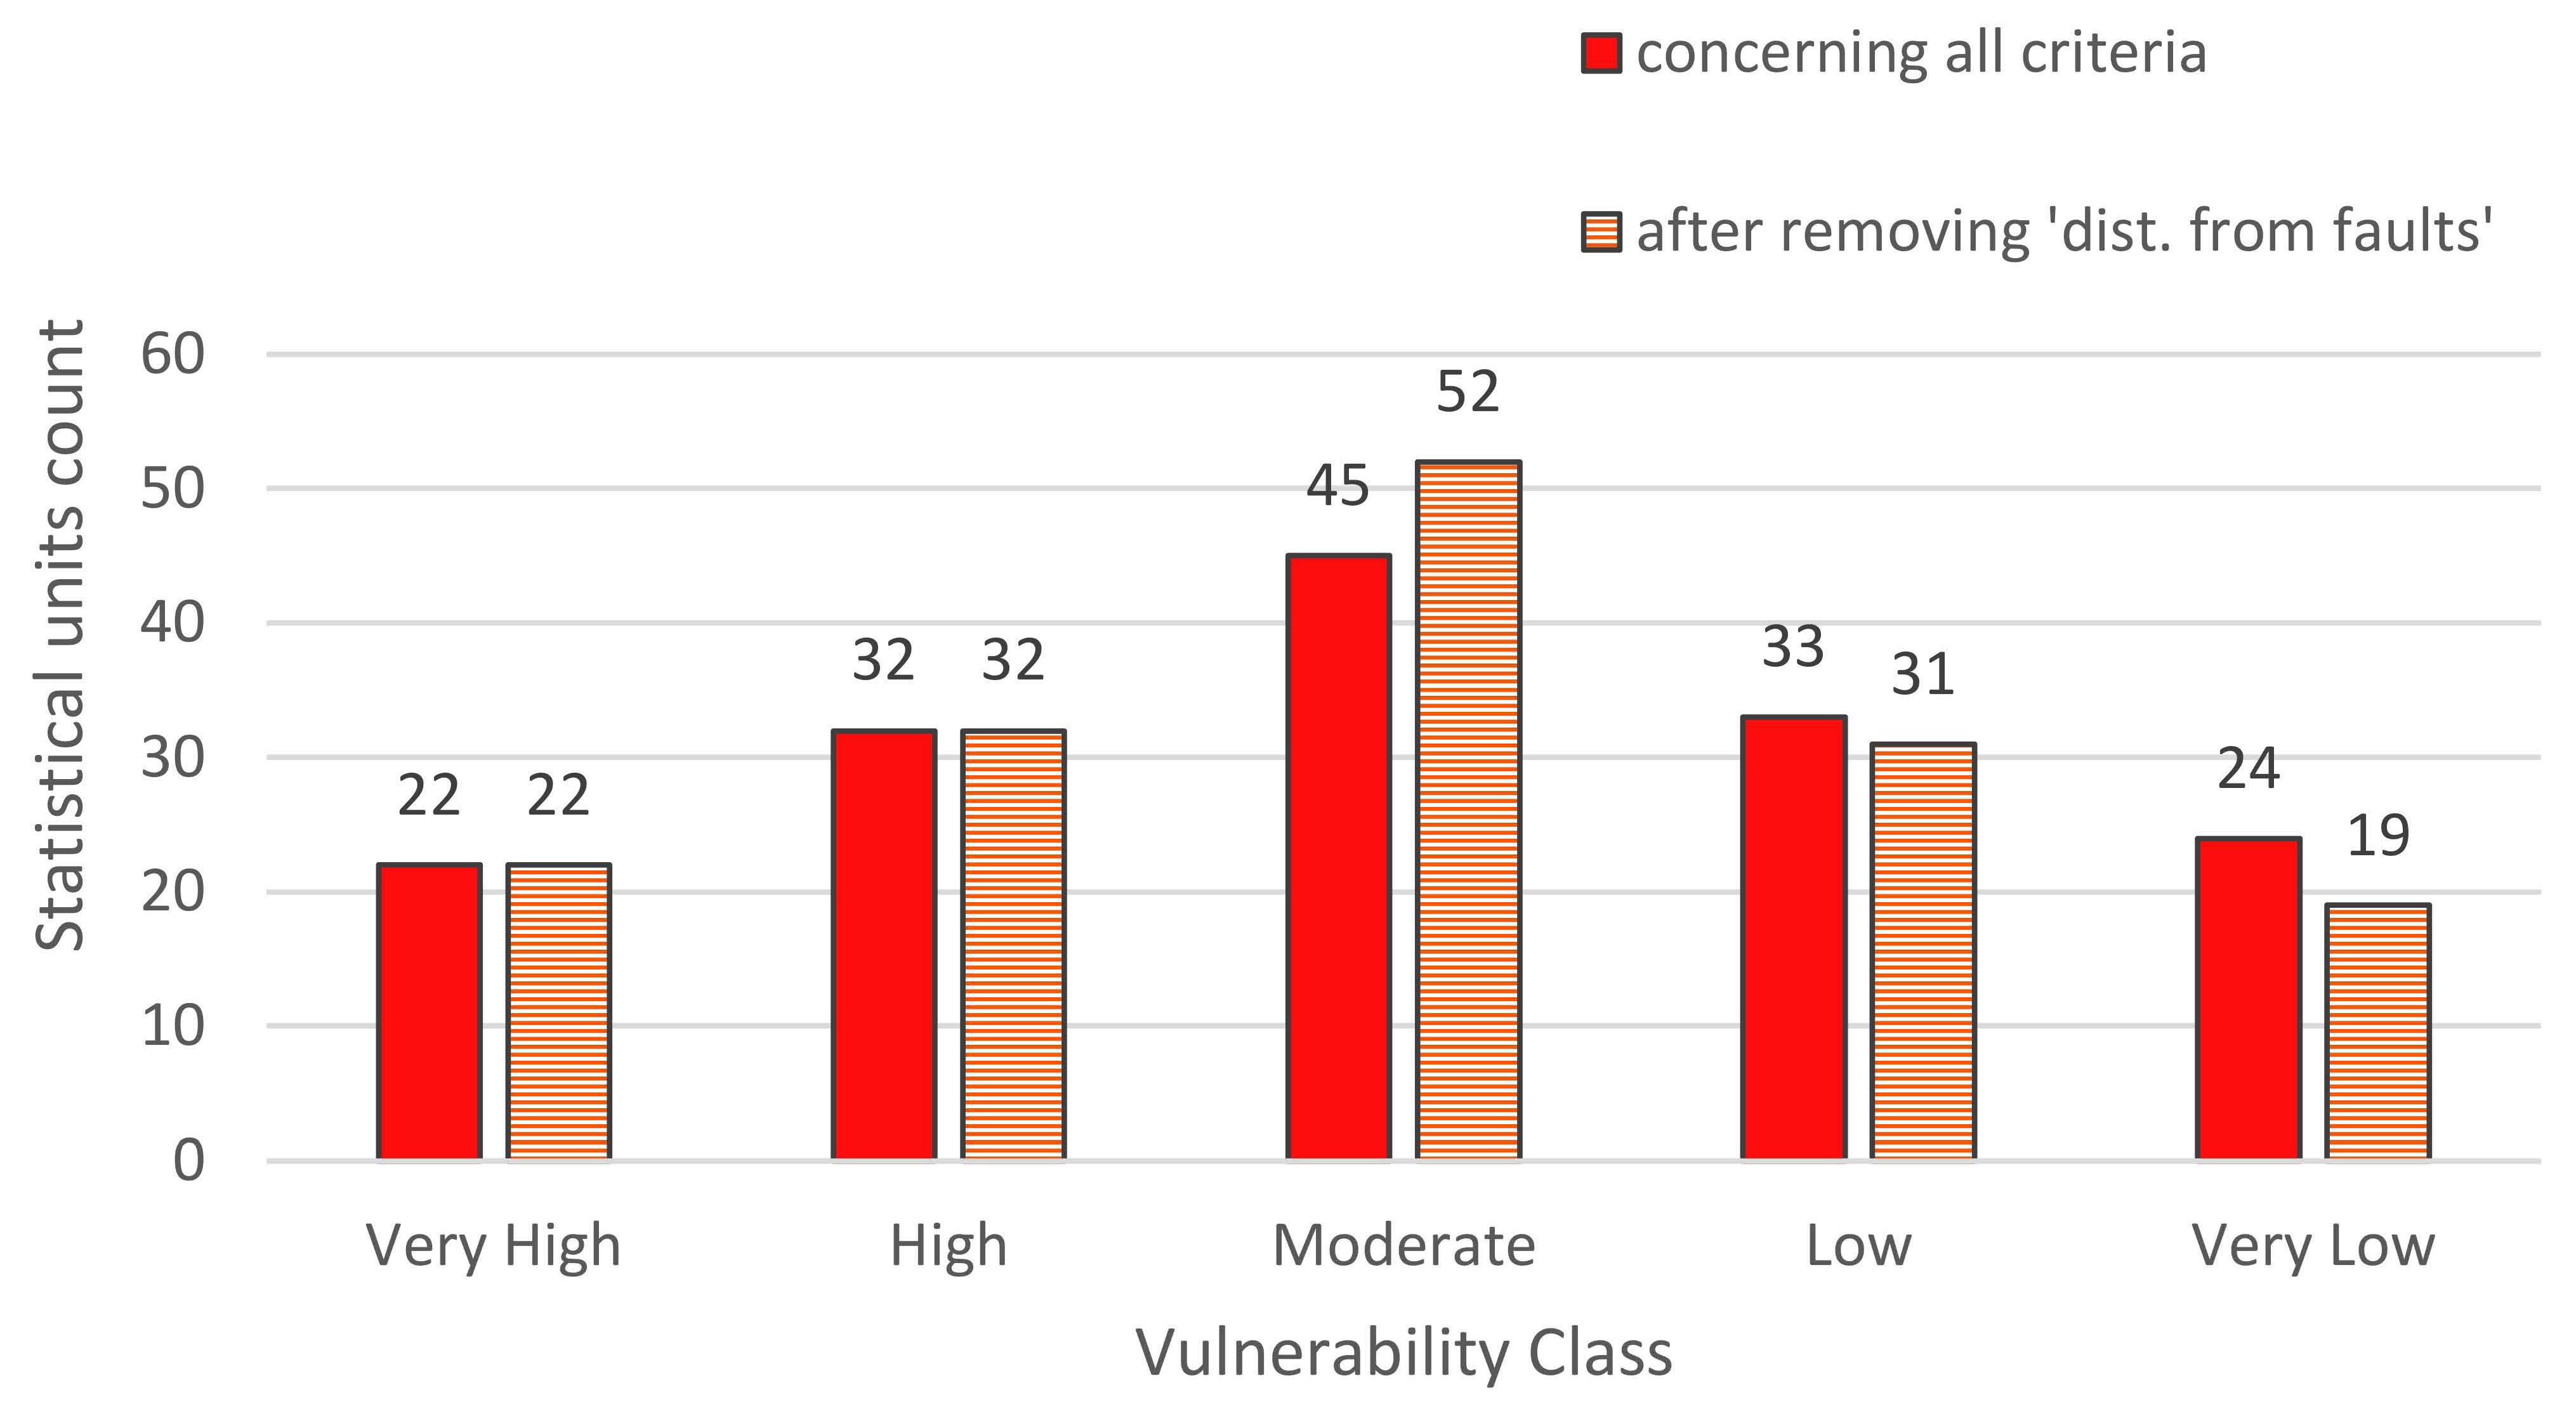
The results were compared to the outputs of the proposed model. As shown in Figure 10, it was observed that all of the units that were categorized in the ‘VH’ and ‘H’ seismic vulnerability classes remained in the same vulnerability classes. However, 12 units (i.e., around 7% of the statistical units of District One) were categorized in different vulnerability classes; seven units that were categorized in the ‘L’ class were ranked as ‘M’ vulnerability class (Unit IDs 34, 36, 54, 98, 120, 122, and 125) using the new criteria weights, and five units that were in the ‘VL’ class (namely unit IDs 29, 70, 72, 88, and 117) were classified into the ‘L’ vulnerability class. Thus the results of this analysis concerning the influence of ‘dist. from faults’ confirm the robustness of the outputs of the proposed model.
6. Discussion and Conclusions
Revealing the necessity and benefit of using MCDM methods for physical seismic vulnerability assessment (PSVA) in earthquake prone urban areas with incomplete data, this paper proposed a new easily applicable PSVA method using a combination of AHP and fuzzy TOPSIS methods. Although the methods applied are already used in different studies, a new modified combination of AHP, fuzzy sets, and TOPSIS is proposed and implemented in this research, which emphasizes treating one of the important uncertainties in PSVA in areas with incomplete data, called ‘vagueness’. The validity and accuracy of the input data is improved by treating the incorporated ‘vagueness’ uncertainties associated with ‘influences of the sub-criteria on physical seismic vulnerability’ by using fuzzy sets theory in this research.
Against related works, this paper proposes a new rational approach independent of the studied area, using a trustable MCDM method, which attempts to treat the incorporated epistemic uncertainties. A new insight on the influencing criteria was introduced, which concerns the influencing criteria in two main categories; namely, the building vulnerability indicator, which considers the building structural properties, and the criteria which influence ground motion intensity, which takes into account the properties of the ground on which the building is constructed. The datasets pertinent to each category are introduced and implemented in a real case study, which was an earthquake prone municipality district with high seismic risk. The study area had a serious lack of proper forms of datasets to be used in pre-disaster mitigation activities, and this research addressed how to prepare the needed datasets and implement a simple and easily applicable assessment of physical seismic vulnerability despite the data scarcity in the region. The mitigation priority of the studied units was obtained using the proposed method. The results of this study suggest that the proposed method is arguably a pragmatic and quick approach to solve the complex problem of PSVA under the vagueness uncertainty of the criteria influences on physical seismic vulnerability. The results of the implementation also indicated that the proposed model has acceptable robustness concerning the weights of the criteria defined using the AHP method.
It is observed that the existing buildings of 156 urban statistical units in Tabriz District One are categorized into ‘very high’, ‘high’, ‘moderate’, ‘low’, and ‘very low’ vulnerability classes with 14%, 21%, 29%, 21%, and 15% vulnerability, respectively, against the most probable devastating earthquake. The produced vulnerability map shows that the higher vulnerable areas are mostly in the northwestern and western parts of District One of Tabriz. Considering that the case study in this paper was in a near vicinity to the fault system, a sensitivity analysis was undertaken to study the influence of the ‘distance from fault’ criterion on the outputs of the model. The results of sensitivity analysis indicated that the mitigation priorities of the statistical units assessed by the proposed model were not significantly modified, which may confirm the transferability of the model to other cases.
The outputs of this research help urban planners and administrators in planning and prioritizing the actions needed in mitigation and preparation phases for municipality districts (e.g., population propagation and settlement, future urban expansions, retrofit and strengthening programs, and insurance schemes), providing necessary information concerning the severity of expected building damages. Those pre-disaster mitigation stages lead to reducing future building damages and human/property losses in high seismic risk areas.
The proposed method can be applied in urban areas other than the case study of this research considering that the framework proposed in this study is independent from the study area or adopted criteria. The buildings’ vulnerability indicators (see Figure 4) were available from Ministry of Roads and Urban Development (MRUD) or SCI census data (see Table 2) in this research. The mentioned criteria were similarly used by Japan International Cooperation Agency (JICA) for the Tehran municipality [11]. However, in areas in which data on structural properties are not available, ground-based observations may be used to gather the needed data on buildings using rapid visual screening (e.g., [57]) or remote sensing imagery (e.g., [20]).
The present model can be applied in higher spatial resolutions than the considered urban statistical units, such as urban parcels, in future studies. In this research, only a number of important criteria were considered, future applications might expand or modify the criteria/sub-criteria used. For instance concerning the ‘structural type’ indicator, future studies may use the Global Earthquake Model (derived from the World Housing Encyclopedia [58]) or another international taxonomy for classifying the indicator to sub-classes.
Developing a GIS-based software for modelling physical seismic vulnerability is the other plan for future works in order to assist decision-makers with an automated and interactive tool for understanding seismic risks quickly. The next step of the research is investigating and analyzing other types of incorporated epistemic uncertainties in assessing physical seismic vulnerability at the urban scale using MCDM methods and attempting to reduce them.
Acknowledgments
The authors would like to thank all of the organizations listed in Table 2.
Author Contributions
Mahmoud Reza Delavar and Mehdi Zare conceived and designed the initial idea of the research; Mahmoud Reza Delavar helped Mansoureh Sadrykia in the methodology development; Mansoureh Sadrykia gathered the data from Mahmoud Reza Delavar and Mehdi Zare; Mahmoud Reza Delavar and Mansoureh Sadrykia analyzed the data; and Mansoureh Sadrykia has undertaken the computational parts and experiments. Mansoureh Sadrykia wrote the draft paper. Mahmoud Reza Delavar has critically reviewed and extended the abstract, introduction, discussion, and conclusions sections. Mansoureh Sadrykia finalized the paper.
Conflicts of Interest
The authors declare no conflict of interest.
References
- Lantada, N.; Irizarry, J.; Barbat, A.H.; Goula, X.; Roca, A.; Susagna, T.; Pujades, L.G. Seismic hazard and risk scenarios for Barcelona, Spain, using the Risk-UE vulnerability index method. Bull. Earthq. Eng. 2010, 8, 201–229. [Google Scholar] [CrossRef]
- Rashed, T.; Weeks, J. Assessing vulnerability to earthquake hazards through spatial multicriteria analysis of urban areas. Int. J. Geogr. Inf. Sci. 2003, 17, 547–576. [Google Scholar] [CrossRef]
- Iervolino, I.; Manfredi, G.; Polese, M.; Verderame, G.M.; Fabbrocino, G. Seismic risk of R.C. Building classes. Eng. Struct. 2007, 29, 813–820. [Google Scholar] [CrossRef]
- Barbat, A.H.; Carreño, M.L.; Pujades, L.G.; Lantada, N.; Cardona, O.D.; Marulanda, M.C. Seismic vulnerability and risk evaluation methods for urban areas. A review with application to a pilot area. Struct. Infrastruct. Eng. 2009, 6, 17–38. [Google Scholar] [CrossRef]
- Carreño, M.-L.; Cardona, O.; Barbat, A. Urban seismic risk evaluation: A holistic approach. Nat. Hazards 2007, 40, 137–172. [Google Scholar] [CrossRef]
- Montoya, L.; Masser, I. Management of natural hazard risk in Cartago, Costa Rica. Habitat Int. 2005, 29, 493–509. [Google Scholar] [CrossRef]
- Alam, M.S.N.; Tesfamariam, S.; Alam, M.S.N. Gis-based seismic damage estimation: Case study for the city of Kelowna, BC. Nat. Hazards Rev. 2013, 14, 66–78. [Google Scholar] [CrossRef]
- Hashemi, M.; Alesheikh, A.A. A GIS-based earthquake damage assessment and settlement methodology. Soil Dyn. Earthq. Eng. 2011, 31, 1607–1617. [Google Scholar] [CrossRef]
- Hassanzadeh, R.; Nedović-Budić, Z.; Alavi Razavi, A.; Norouzzadeh, M.; Hodhodkian, H. Interactive approach for GIS-based earthquake scenario development and resource estimation (karmania hazard model). Comput. Geosci. 2013, 51, 324–338. [Google Scholar] [CrossRef]
- HAZUS 99 Technical Manual; Federal Emergency Management Agency (FEMA): Washington, DC, USA, 1999.
- The Study on Seismic Micro Zoning of the Greater Tehran Area in the Islamic Republic of Iran; Final Report; Tehran Municipality, Japan International Cooperation Agency (JICA): Tehran, Iran, 2000.
- Karimzadeh, S.; Miyajima, M.; Hassanzadeh, R.; Amiraslanzadeh, R.; Kamel, B. A GIS-based seismic hazard, building vulnerability and human loss assessment for the earthquake scenario in Tabriz. Soil Dyn. Earthq. Eng. 2014, 66, 263–280. [Google Scholar] [CrossRef]
- Tang, A.; Wen, A. An intelligent simulation system for earthquake disaster assessment. Comput. Geosci. 2009, 35, 871–879. [Google Scholar] [CrossRef]
- Vicente, R.; Parodi, S.; Lagomarsino, S.; Varum, H.; Silva, J.A.R.M. Seismic vulnerability and risk assessment: Case study of the historic city centre of Coimbra, Portugal. Bull. Earthq. Eng. 2011, 9, 1067–1096. [Google Scholar] [CrossRef]
- Godfrey, A.; Ciurean, R.L.; van Westen, C.J.; Kingma, N.C.; Glade, T. Assessing vulnerability of buildings to hydro-meteorological hazards using an expert based approach—An application in Nehoiu valley, Romania. Int. J. Disaster Risk Reduct. 2015, 13, 229–241. [Google Scholar] [CrossRef]
- Rezaie, F.; Panahi, M. Gis modeling of seismic vulnerability of residential fabrics considering geotechnical, structural, social and physical distance indicators in Tehran using multi-criteria decision-making techniques. Nat. Hazards Earth Syst. Sci. 2015, 15, 461–474. [Google Scholar] [CrossRef]
- Armaş, I. Multi-criteria vulnerability analysis to earthquake hazard of Bucharest, Romania. Nat. Hazards 2012, 63, 1129–1156. [Google Scholar] [CrossRef]
- Hizbaron, D.R.; Baiquni, M.; Sartohadi, J.; Rijanta, R. Urban vulnerability in Bantul district, Indonesia—Towards safer and sustainable development. Sustainability 2012, 4, 2022. [Google Scholar] [CrossRef]
- Servi, M. Assessment of Vulnerability to Earthquake Hazards Using Spatial Multicriteria Analysis: Odunpazari, Eskisehir Case Study. Master’s Thesis, Middle East Technical University, Ankara, Turkey, 2004. [Google Scholar]
- Sinha, N.; Priyanka, N.; Joshi, P.K. Using spatial multi-criteria analysis and ranking tool (smart) in earthquake risk assessment: A case study of Delhi region, India. Geomat. Nat. Hazards Risk 2016, 7, 680–701. [Google Scholar] [CrossRef]
- Silavi, T.; Delavar, M.R.; Malek, M.R.; Kamalian, N.; Karimizand, K. An integrated strategy for GIS-based fuzzy improved earthquake vulnerability assessment. In Proceedings of the Second International Symposium in Geo-Information for Disaster Management, ISPRS, Goa, India, 25–26 September 2006; p. 6. [Google Scholar]
- Samadi Alinia, H.; Delavar, M.R. Tehran’s seismic vulnerability classification using granular computing approach. Appl. Geomat. 2011, 3, 229–240. [Google Scholar] [CrossRef]
- Moradi, M.; Delavar, M.R.; Moshiri, B. A GIS-based multi-criteria decision-making approach for seismic vulnerability assessment using quantifier-guided owa operator: A case study of Tehran, Iran. Ann. GIS 2015, 21, 209–222. [Google Scholar] [CrossRef]
- Meshkini, A.; Habibi, K.; Alizadeh, H. Using fuzzy logic and GIS tools for seismic vulnerability of old fabric in Iranian cities (case study: Zanjan city). J. Intell. Fuzzy Syst. 2013, 25, 965–975. [Google Scholar]
- Hwang, C.L.; Yoon, K. Multiple Attribute Decision Making: Methods and Applications: A State-of-the-Art Survey; Springer: Berlin, Germany; New York, NY, USA, 1981. [Google Scholar]
- Kamelifar, M.J.; Rustei, S.; Ahadnejad, M.; Kamelifar, Z. The Assessment of road network vulnerability in formal and informal (slum) urban tissues to earthquake hazards with crisis management approach (Case study: Zone 1 Tabriz). J. Civ. Eng. Urban. 2013, 3, 380–385. [Google Scholar]
- Hosseinzade Delir, K.; Khodabakhah Charkhaloo, M. The study of efficiency of street networks in earthquake (case study of zones 1 and 5 of Tabriz detailed Pland). Geogr. Plan. 2015, 18, 153–174. [Google Scholar]
- Ambraseys, N.N.; Melville, C.P. A History of Persian Earthquakes; Cambridge University Press: Cambridge, UK, 1982 (Translated by Radeh, A.); Agah Publishers: Tehran, Iran, 1991. (In Persian) [Google Scholar]
- Karimzadeh, S.; Cakir, Z.; Osmanoğlu, B.; Schmalzle, G.; Miyajima, M.; Amiraslanzadeh, R.; Djamour, Y. Interseismic strain accumulation across the North Tabriz fault (NW Iran) deduced from InSAR time series. J. Geodyn. 2013, 66, 53–58. [Google Scholar] [CrossRef]
- Saaty, T.L. A scaling method for priorities in hierarchical structures. J. Math. Psychol. 1977, 15, 234–281. [Google Scholar] [CrossRef]
- Strasser, S.E.; Ozgur, C.; Schroeder, D.L. Selecting a business college major: An analysis of criteria and choice using the analytical hierarchy process. Am. J. Bus. 2002, 17, 47–56. [Google Scholar] [CrossRef]
- Saaty, T.L. The Analytic Hierarchy Process; McGraw-Hill: New York, NY, USA, 1980. [Google Scholar]
- Malczewski, J. GIS and Multicriteria Decision Analysis; Wiley: New York, NY, USA, 1999. [Google Scholar]
- Botero Fernández, V. Geo-Information for Measuring Vulnerability to Earthquake: A Fitness for Use Approach. Ph.D. Thesis, ITC, Enschede, The Netherlands, 2009. [Google Scholar]
- Cutter, S.L.; Boruff, B.J.; Shirley, W.L. Social vulnerability to environmental hazards. Soc. Sci. Q. 2003, 84, 242–261. [Google Scholar] [CrossRef]
- Feizizadeh, B.; Blaschke, T. Gis-multicriteria decision analysis for landslide susceptibility mapping: Comparing three methods for the Urmia lake Basin, Iran. Nat. Hazards 2013, 65, 2105–2128. [Google Scholar] [CrossRef]
- Kamp, U.; Owen, L.; Growley, B.; Khattak, G. Back analysis of landslide susceptibility zonation mapping for the 2005 kashmir earthquake: An assessment of the reliability of susceptibility zoning maps. Nat. Hazards 2010, 54, 1–25. [Google Scholar] [CrossRef]
- Nefeslioglu, H.A.; Sezer, E.A.; Gokceoglu, C.; Ayas, Z. A modified analytical hierarchy process (m-AHP) approach for decision support systems in natural hazard assessments. Comput. Geosci. 2013, 59, 1–8. [Google Scholar] [CrossRef]
- Erden, T.; Karaman, H. Analysis of earthquake parameters to generate hazard maps by integrating AHP and GIS for küçükçekmece region. Nat. Hazards Earth Syst. Sci. 2012, 12, 475–483. [Google Scholar] [CrossRef]
- Saaty, T.L. Eigenvector and logarithmic least squares. Eur. J. Oper. Res. 1990, 48, 156–160. [Google Scholar] [CrossRef]
- Zadeh, L.A. Fuzzy sets. Inf. Control 1965, 8, 338–353. [Google Scholar] [CrossRef]
- Malczewski, J.; Rinner, C. Multicriteria Decision Analysis in Geographic Information Science; Springer: Berlin/Heidelberg, Germany, 2015. [Google Scholar]
- Zimmermann, H.J. Fuzzy Set Theory—And Its Applications; Springer Science + Business Media B.V.: Dordrecht, The Netherlands, 1991. [Google Scholar]
- Chou, C.C. The canonical representation of multiplication operation on triangular fuzzy numbers. Comput. Math. Appl. 2003, 45, 1601–1610. [Google Scholar] [CrossRef]
- Chen, K.; Blong, R.; Jacobson, C. MCE-Risk: Integrating multicriteria evaluation and GIS for risk decision-making in natural hazards. Environ. Model. Softw. 2001, 16, 387–397. [Google Scholar] [CrossRef]
- Chu, J.; Su, Y. The application of TOPSIS method in selecting fixed seismic shelter for evacuation in cities. Syst. Eng. Procedia 2012, 3, 391–397. [Google Scholar] [CrossRef]
- Lee, G.; Jun, K.S.; Chung, E.-S. Robust spatial flood vulnerability assessment for Han River using fuzzy TOPSIS with α-cut level set. Expert Syst. Appl. 2014, 41, 644–654. [Google Scholar] [CrossRef]
- Zhang, H.; Huang, G.H. Assessment of non-point source pollution using a spatial multicriteria analysis approach. Ecol. Model. 2011, 222, 313–321. [Google Scholar] [CrossRef]
- Peng, Y. Regional earthquake vulnerability assessment using a combination of MCDM methods. Ann. Oper. Res. 2015, 234, 95–110. [Google Scholar] [CrossRef]
- Caterino, N.; Iervolino, I.; Manfredi, G.; Cosenza, E. Comparative analysis of multi-criteria decision-making methods for seismic structural retrofitting. Comput.-Aided Civ. Infrastruct. Eng. 2009, 24, 432–445. [Google Scholar] [CrossRef]
- Iranian Code of Practice for Seismic Resistance Design of Buildings (Standard No. 2800-3rd Ed.), 4th ed.; Building and Housing Research Center (BHRC): Tehran, Iran, 2014.
- Tehrani Zade, M.; Haj Najafi, L. Assessing Seismic Behavior of Eccentrically Braced Frames (EBFs) Due to Near-Field Ground Motions. In Proceedings of the 14th World Conference on Earthquake Engineering, Beijing, China, 12–17 October 2008. [Google Scholar]
- Matthies, H. Quantifying uncertainty: Modern computational representation of probability and applications. In Extreme Man-Made and Natural Hazards in Dynamics of Structures; Ibrahimbegovic, A., Kozar, I., Eds.; Springer Science + Business Media B.V.: Dordrecht, The Netherlands, 2007; pp. 105–135. [Google Scholar]
- Şen, Z. Supervised fuzzy logic modeling for building earthquake hazard assessment. Expert Syst. Appl. 2011, 38, 14564–14573. [Google Scholar] [CrossRef]
- Chen, Y.; Yu, J.; Khan, S. The spatial framework for weight sensitivity analysis in AHP-based multi-criteria decision making. Environ. Model. Softw. 2013, 48, 129–140. [Google Scholar] [CrossRef]
- Önüt, S.; Efendigil, T.; Soner Kara, S. A combined fuzzy MCDM approach for selecting shopping center site: An example from Istanbul, Turkey. Expert Syst. Appl. 2010, 37, 1973–1980. [Google Scholar] [CrossRef]
- Ajay Kumar, S.; Rajaram, C.; Mishra, S.; Pradeep Kumar, R.; Karnath, A. Rapid visual screening of different housing typologies in Himachal Pradesh, India. Nat. Hazards 2017, 85, 1851–1875. [Google Scholar] [CrossRef]
- World Housing Encyclopedia—WHE. Available online: http://db.world-housing.net (accessed on 27 February 2017).
Figure 1.
(a) Study area; (b) Tabriz Municipality Districts and some dense parishes near active faults.
Figure 1.
(a) Study area; (b) Tabriz Municipality Districts and some dense parishes near active faults.

Figure 2.
A triangular fuzzy number.

Figure 3.
The flowchart of the proposed method.

Figure 4.
The criteria and sub-criteria used for seismic vulnerability assessment.

Figure 5.
Input map layers regarding adopted ground motion intensity indicators.

Figure 6.
The physical seismic vulnerability (PSV) ranks of Tabriz District One statistical units.
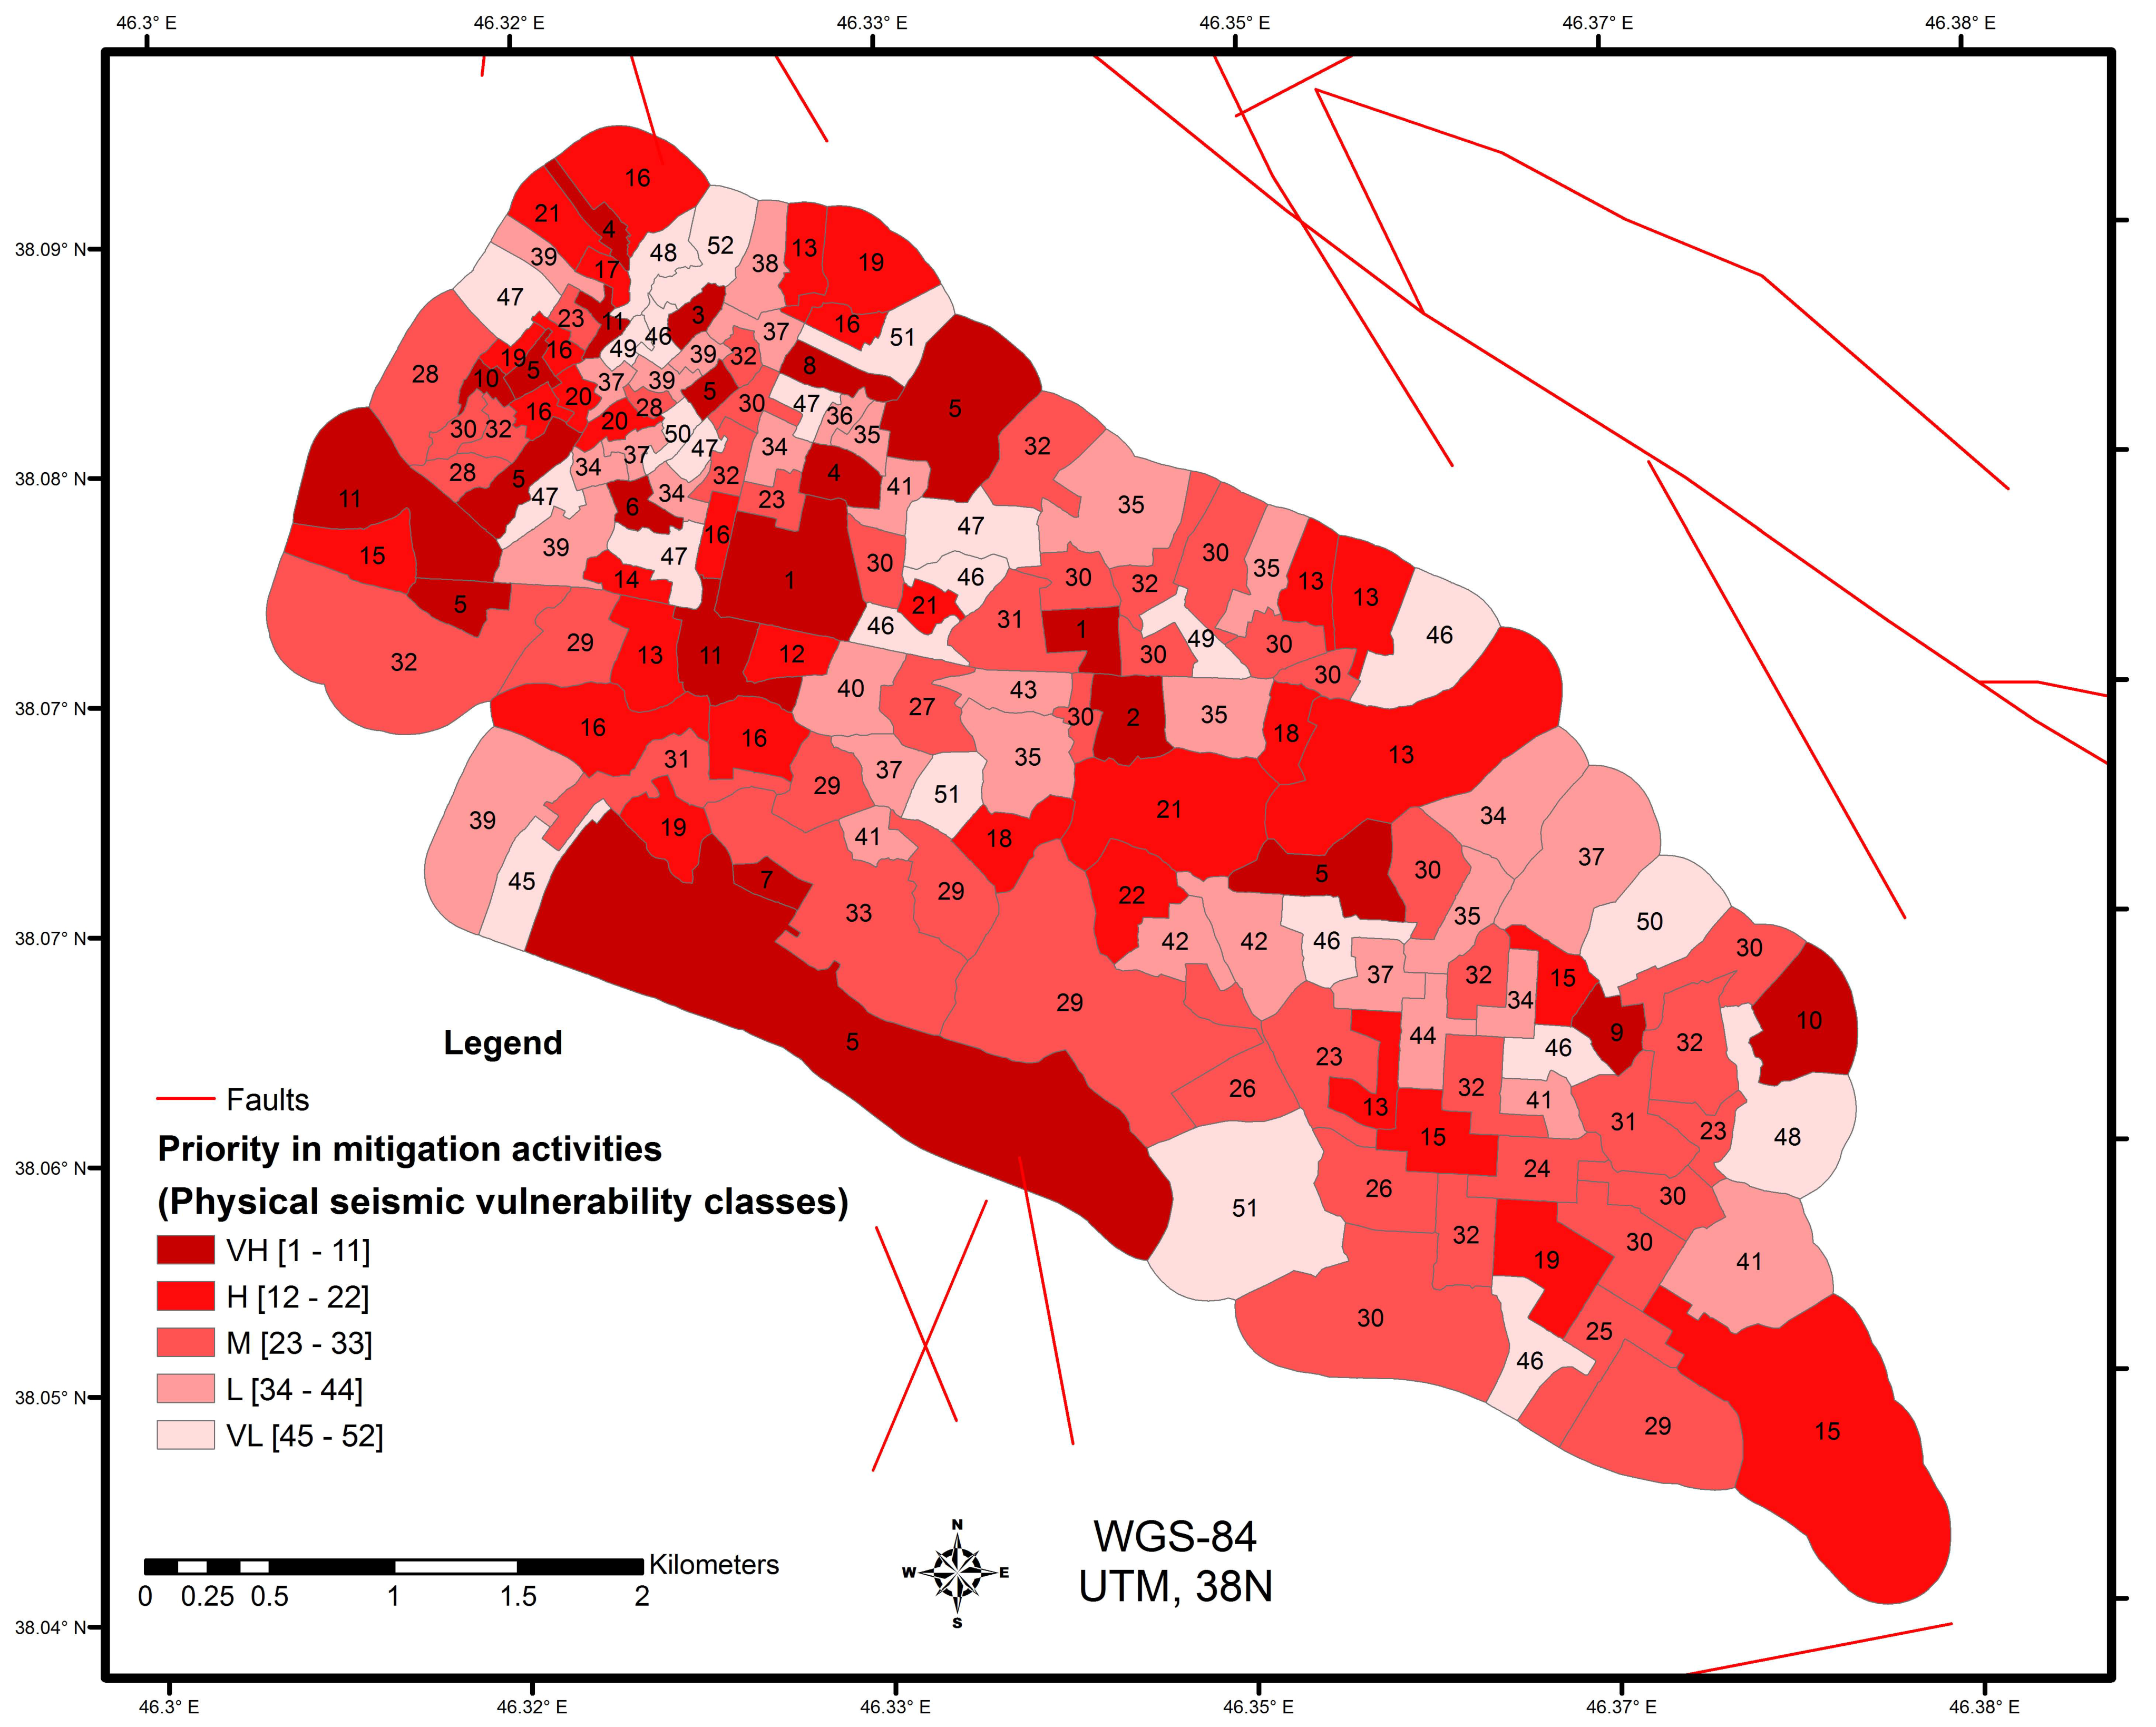
Figure 7.
The percentage of the categorized statistical units.

Figure 8.
Sensitivity analysis results for a random set of the statistical units.

Figure 9.
Statistical units IDs vs. physical seismic vulnerability classes after removing ‘dist to faults’.
Figure 9.
Statistical units IDs vs. physical seismic vulnerability classes after removing ‘dist to faults’.

Figure 10.
The sum of the categorized statistical units based on physical seismic vulnerability.


Table 1.
Saaty’s scale for pairwise weight assignment.
| Weight | Definition |
|---|---|
| 1 | Equal |
| 2 | Equal to moderate |
| 3 | Moderate |
| 4 | Moderate to strong |
| 5 | Strong |
| 6 | Strong to very strong |
| 7 | Very strong |
| 8 | Very strong to extreme |
| 9 | Extreme |
Table 2.
The acquired data and the stakeholder organizations.
| Prepared Data | Source data | Source Scale | Organization |
|---|---|---|---|
| Tabriz Districts layer | Tabriz county map | 1:2000 | Statistics and IT organization/Municipality of Tabriz |
| Slope layer | Topographical map | 1:2000 | Iran National Cartographic Center (NCC) |
| Lithology layer | Geological map | 1:2000 | Geological Survey of Iran (GSI) |
| Faults layer | Active faults of Iran map | 1:2,500,000 | International Institute of Earthquake Eng. and Seismology (IIEES) |
| statistical units layer | District One statistical units map | 1:2000 | Statistical Center of Iran (SCI) |
| Age of the buildings | Year of the construction (Excel worksheet) | - | Statistical Center of Iran (SCI) |
| Structural types | Frame types of the buildings (Excel worksheet) | - | Statistical Center of Iran (SCI) |
| Ground water layer | (UTM) X,Y,Z of wells of East Azerbaijan (Excel worksheet) | - | Water Resources Management Company/Ministry of Energy |
| Number of floors | Land use map (attribute table) | 1:2000 | Ministry of Roads and Urban Development |
Table 3.
Comparative weights of the criteria due to Saaty’s preference scale.
| Slope | Ground-Water | Dist. to Faults | Lithology | Struct. Age | Floor No. | Struct. Type | |
|---|---|---|---|---|---|---|---|
| slope | 1 | 2 | 1/6 | 1/4 | 1/5 | 1/2 | 1/3 |
| groundwater | 1/2 | 1 | 1/7 | 1/5 | 1/6 | 1/3 | 1/4 |
| dist to faults | 6 | 7 | 1 | 4 | 2 | 5 | 4 |
| lithology | 4 | 5 | 1/4 | 1 | 1/2 | 3 | 2 |
| lithology | 5 | 6 | 1/2 | 2 | 1 | 4 | 3 |
| floor no. | 2 | 3 | 1/5 | 1/3 | 1/4 | 1 | 1/2 |
| struct. type | 3 | 4 | 1/4 | 1/2 | 1/3 | 2 | 1 |
Table 4.
Calculated importance weights of the criteria.
| Criterion | Weight | Criterion | Weight |
|---|---|---|---|
| lithology | 0.152 | struct. age | 0.235 |
| dist. to faults | 0. 369 | No. of floors | 0.067 |
| slope | 0.044 | struct. type | 0.102 |
| groundwater level | 0.031 | Inconsistency = 0.03 | |
Table 5.
Triangular fuzzy numbers (TFN) for the ratings of the sub-criteria.
| Vulnerability | Triangular Fuzzy Number |
|---|---|
| Very Low (VL) | (0,0.1,0.3) |
| Low (L) | (0.1,0.3,0.5) |
| Moderate (M) | (0.3,0.5,0.7) |
| High (H) | (0.5,0.7,0.9) |
| Very High (VH) | (0.7,0.9,1.0) |
Table 6.
Calculated importance weights of the criteria removing ‘dist. to faults’.
| Criterion | Weight | Criterion | Weight |
|---|---|---|---|
| lithology | 0.250 | struct. age | 0.382 |
| slope | 0.064 | no. of floors | 0.101 |
| groundwater level | 0.043 | struct. type | 0.160 |
| Inconsistency: 0.02 | |||
© 2017 by the authors. Licensee MDPI, Basel, Switzerland. This article is an open access article distributed under the terms and conditions of the Creative Commons Attribution (CC BY) license (http://creativecommons.org/licenses/by/4.0/).
Share and Cite
MDPI and ACS Style
Sadrykia, M.; Delavar, M.R.; Zare, M. A GIS-Based Fuzzy Decision Making Model for Seismic Vulnerability Assessment in Areas with Incomplete Data. ISPRS Int. J. Geo-Inf. 2017, 6, 119. https://doi.org/10.3390/ijgi6040119
AMA Style
Sadrykia M, Delavar MR, Zare M. A GIS-Based Fuzzy Decision Making Model for Seismic Vulnerability Assessment in Areas with Incomplete Data. ISPRS International Journal of Geo-Information. 2017; 6(4):119. https://doi.org/10.3390/ijgi6040119
Chicago/Turabian StyleSadrykia, Mansoureh, Mahmoud Reza Delavar, and Mehdi Zare. 2017. "A GIS-Based Fuzzy Decision Making Model for Seismic Vulnerability Assessment in Areas with Incomplete Data" ISPRS International Journal of Geo-Information 6, no. 4: 119. https://doi.org/10.3390/ijgi6040119
Note that from the first issue of 2016, this journal uses article numbers instead of page numbers. See further details here.