A Dynamic Indoor Field Model for Emergency Evacuation Simulation
by
 , and
, and
Qing Xiong
1, 
Qing Zhu
1,2,3,*,
Zhiqiang Du
1,3,*,
Xinyan Zhu
1,
Yeting Zhang
1,
Lei Niu
2,4,
Yun Li
2 and
Yan Zhou
5 1
State Key Laboratory of Information Engineering in Surveying, Mapping and Remote Sensing (LIESMARS), Wuhan University, 129 Luoyu Road, Wuhan 430079, China
2
Faculty of Geosciences and Environmental Engineering, Southwest Jiaotong University, Chengdu 611756, China
3
Collaborative Innovation Center for Geospatial Technology, 129 Luoyu Road, Wuhan 430079, China
4
Henan University of Urban Construction, Pingdingshan 467036, China
5
School of Resources and Environment, University of Electric Science and Technology of China, Chengdu 611731, China
*
Authors to whom correspondence should be addressed.
ISPRS Int. J. Geo-Inf. 2017, 6(4), 104; https://doi.org/10.3390/ijgi6040104
Submission received: 5 February 2017
/
Revised: 27 March 2017
/
Accepted: 29 March 2017
/
Published: 30 March 2017
Abstract
:Indoor emergency response plays a critically important role in disaster management for cities, which must consider the evacuation of people in a dynamic indoor environment. The spatial model is the foundation for the specific analysis of indoor emergency responses, such as evacuations. The current spatial model for evacuation has three primary pitfalls: (1) it primarily focuses on static spatial information, such as rooms, doors, and windows, and lacks dynamic information, such as events and sensors; (2) it mainly focuses on the horizontal space and the static scene and lacks a multi-story component that considers the different properties of stairs compared to planar areas; and (3) it places emphasis on the indoor navigation calculation with a 2D/3D network, which lacks individual properties that can support more complicated analysis, such as congestion and stagnation. In this paper, we propose a dynamic indoor field model with three typical characteristics. (1) It includes not only static information but also dynamic information, such as outdoor and indoor building geometry, sensors, fire spread, and personnel behavior. (2) It supports multi-story buildings from the macro level (building level and floor level) to the micro level (room level and individual level) based on horizontal and vertical indoor space. (3) It supports spatial calculations based on a three-dimensional space grid and can analyze potential congestion and stagnation during evacuation. We design a corresponding evacuation method that supports individual evacuation route finding and evacuation assessment. We perform a series of analyses of the applicability of the proposed model and the efficiency of the designed evacuation method based on multi-story evacuation studies. The simulation includes a total evacuation population exceeding 7000 individuals, and the analysis suggests that the new model and algorithm are effective in planning indoor emergency routes that avoid potential congestion or stagnation.
1. Introduction
With the rapid urbanization occurring in China, indoor emergency response systems play a critical role in disaster management in many cities, especially for building fires, in which case the evacuation of people in a dynamic indoor environment is necessary. According to a statistical analysis of fire accidents in high-rise buildings in China in 2013, 388,000 building fires caused 1637 casualties and a total loss of $0.71 billion in property damage [1]. Numerous investigations and cases [2,3,4,5] indicate that casualties are primarily caused by poor decision-making and navigation during a fire disaster. With the rapid development of geographic information system (GIS) technology and extensive application to the construction of fire evacuation routes in previous decades [6,7,8], the combined utilization of GIS and architectural spatial structures can help provide first responders and planners with sufficient information regarding indoor areas and surroundings to decrease routing uncertainty and facilitate efficient planning for indoor disasters [9,10,11].
One of the most important factors in indoor emergency response operations is situational awareness, which can be created only after carefully analyzing all available information [12]. The three-dimensional (3D) indoor–outdoor spatial model developed by Tashakkori et al. [13] introduces a complete inventory of the information required for route finding during indoor emergency response, including building information and the network between floors. They discuss the indoor situational awareness needed for emergency management and decision-making for successful emergency response based on 3D network navigation and blockage analysis. However, an integrated solution has not been created for delivering detailed information, such as the movements of crowds and the spreading of fire, to emergency responders.
Recently, studies of emergency evacuation models, such as Firescap, Exodus, Simulex, Evacuation Simulation Model (ESM), and Multi-Agent System for Cloud Management (MASCM), have been developed based on various computational principles [14,15,16,17,18] and represent efficient methods for building designers to evaluate evacuation safety when combined with a GIS-based spatial model. Tang and Ren’s study presents a simulation spatial model that incorporates behaviors, fire field, and building geometry to analyze the spatial features in a building environment and support evacuation decisions to a certain degree [19]. Because of the extension of GIS as an information system, analyzing the spatial relationships among static and dynamic features is feasible and advantageous for predicting fire evacuation performance and evaluating building designs in terms of fire safety. Compared with an actual scene, most of the necessary indoor emergency information is not available to responders using current systems and relevant spatial model research [20,21,22,23,24], which increases the risk of life-threatening situations for rescuers and complicates decision-making.
Thus, the provision of a dynamic indoor emergency spatial model that supports informed navigation strategies and improves situational awareness is crucial. This model should have the capacity to describe the dynamic process of indoor spatial information, including the structural layout of a building and the spread of the fire. The model should also present semantic information related to the architectural structure, emergency utilities, and floating crew and be able to distinguish individual differences, including the roles of different personnel, travel speed, and travel route.
An indoor emergency spatial model that can simulate an evacuation throughout an emergency process is needed. Indoor spatial information is a basic feature of an indoor emergency spatial model for evacuation analysis. A dynamic environment analysis of both the horizontal space and the vertical space in a building increases the reliability, but this analysis is the main challenge in simulating an indoor evacuation. However, 3D indoor spatial information is becoming increasingly abundant, enabling the comprehensive analysis of horizontal and vertical indoor space information; obtaining this information is no longer the bottleneck in an evacuation analysis. Most indoor real-time sensor data can reliably support indoor dynamic environment simulation analyses. Indoor evacuation route analysis and assessment is an effective method for improving the potential for fire emergency rescue from buildings.
This paper proposes a dynamic indoor field model (DIFM). Combined with the designed evacuation method for verification, the DIFM can be employed to not only simulate the evacuation process and provide an intuitive basis for evaluation but also predict possible congestion and stagnation and produce an accurate and reliable reference for evacuation planning and fire protection design. This research focuses on the following three areas to assist building inhabitants and rescuers in planning for emergency response in a timely and safe manner:
- The complexity of the indoor scene. Grasping the distribution characteristics of objects in an indoor scene and the dynamic change rule in a simulated process is a prerequisite for accurately describing the evacuation process. The spatial distribution of the elements in an evacuation scene is directly related to the interaction between these elements and the evacuation process.
- The diversity and dynamics of human behavior. The evacuation status of a scenario analysis represents a very complex thought process. A behavioral simulation during the evacuation of personnel is a major challenge in evacuation simulations.
- Highly effective evacuation analysis. Performing a rapid simulation analysis of fire spread, smoke and temperature field distribution, and spatial environment changes in a building during a fire is difficult but necessary for building fire protection design and for the safe evacuation of personnel.
The remainder of this paper is organized as follows. Related studies are discussed in Section 2, and a DIFM is proposed for quantitative spatial prediction and dynamic change-based indoor environmental expression to overcome the insufficiencies of current indoor modeling methodologies in Section 3. The proposed model is based on the CityGML level of detail 4 (LoD4) [25] standard, which is a well-known representation of an indoor building. Section 4 presents a change-based evacuation method that enables users to perceive, recognize, and understand fire evacuation based on the proposed model. Two typical case studies with comprehensive descriptions of the environmental features are simulated as single-floor and multi-floor scenarios, and the model’s ability to facilitate situational awareness regarding the indoor layout and evacuation strategies is further analyzed in Section 5. Finally, Section 6 presents the conclusions and suggestions for future research.
2. Background and Motivation
The indoor evacuation environment is a complex system with many components. Most recent research has primarily focused on network modeling and indoor routing for wayfinding and navigation purposes [26,27,28] but has not addressed the information required to identify potential congestion during indoor emergency situations. Currently, after establishing an evacuation path, occupants are dispatched to local exits with minimal information about the building or the fire location. Thus, a basic model that supports an individual’s level of fire response performance must be based on considerations of various features, such as information about the building, sensors, fire spread, and personnel behavior. Spatial features are the basic elements of the relationships among these features and support decision-making in potential congestion and stagnation prediction.
Based on differences in their spatial performance mechanisms, current indoor spatial models for emergency evacuation simulation can be divided into four categories: network-based models, particle-based models, cellular-based models, and field-based models.
The main concept behind a network-based model is to simplify the accessible space in a building into a corresponding network and consider the personnel in the scene as a flow of people moving at a certain speed in the network [13,15,29,30,31]. The network consists of nodes and the edges between connected nodes, where each node represents the building units, such as rooms, and the length of each edge represents the average distance between two units. The people flow between two network nodes to reach an exit node for evacuation. The evacuation velocity is negatively correlated with flow density. The advantages of a network-based model are the small number of calculations required and the fast computing speed. However, the processing method used for network-based models is too simple to represent the movement of individuals and analyze congestion at exits in terms of nodes and edges. Additionally, the evacuation accuracy is difficult to guarantee. In particular, the selection of node locations distinctly affects the length of the connection edges between two nodes, which introduces errors and renders the model unable to simulate the exact trajectory of the evacuation.
A particle-based model can describe the interaction or action intention among humans by introducing a physical force analogy to achieve regularity of motion with the aid of the mechanical theory model [32,33,34,35]. People are considered self-driving particles controlled by forces from the physical world, social psychology, and other aspects; thus, the impact of personnel behavior and the movement characteristics of panic can be simulated. A particle-based model facilitates the accurate description of the force and action intention of personnel using existing mechanics theory. However, describing the differences between individuals is challenging. To reproduce an actual situation, the mechanical model is complicated, and the computations become very time consuming as the number of occupants requiring evacuation increases.
Cellular-based models utilize cellular automata theory to simulate the evacuation process by the spatio-temporal modeling method [36,37,38,39]. These models use cells to realize the spatial discretization of an evacuation scene. Additionally, the interaction between people and building walls can be described by neighborhoods, and behaviors can be described in terms of the states of cells with conversion rules. After creating a 2D grid of an indoor space, the evacuation paths can be determined with routing rules according to the neighborhood of each grid. The spatio-temporal modeling ability of these models provides an effective solution for simulating the discrete spatial and temporal features of evacuation. Furthermore, although cellular-based models cannot describe the micro-behavior of personnel, they can describe the differences among individuals.
A field-based model defines the evacuation behavior of personnel at each simulated time point by defining the floor field of a scene and describing the flow trends of individuals in that scene [40,41,42,43]. The floor field relates to only the geometric layout and exit location of the room. In such a model, during evacuation, people always move from a high-weight grid to a low-weight gird in the floor field. A field-based model can reflect the geometric characteristics of a building layout. However, the floor field does not consider the dynamic changes and development of the scene elements and thus must be expanded and improved to dynamically describe these elements.
Table 1 summarizes the main features of the different indoor modeling approaches. Most of the emergency indoor spatial models represent floor plan and building structure information and can be used for limited indoor analysis and navigation with real-time data. However, these existing indoor spatial models cannot be employed in practical emergency situations primarily because they lack detailed building emergency and vertical navigation information, which is critical for dynamic spatial analysis, multi-floor evacuation, and the prediction of potential congestion and stagnation in a global scene.
Considering the lack of comprehensive indoor spatial models that were systematically developed and include the emergency information and quantitative calculations of both horizontal and vertical indoor spaces necessary for an individual’s evacuation, this paper recommends the DIFM. This model aims to facilitate the integration of existing and dynamic information about buildings, sensors, fire spread, and personnel behavior to improve the situational awareness of building occupants. Applying the proposed model shows that it can enhance indoor spatial analysis and decision-making by individuals and can be used to increase the emergency response efficiency when combined with a change-based evacuation method.
3. DIFM
Because of the unique characteristics of indoor spaces, data models and applications should be established to provide integrated and seamless services [44]. In particular, in indoor emergency situations, the incident location, its surrounding areas, and dynamic geo-reference information are core elements requiring parametric description and quantitative analysis [45]. To provide efficient indoor evacuation and indoor services for emergency situations, a basic indoor spatial model should have three characteristics: (1) it should include the static interior structures and dynamic emergency information to provide the detailed 3D geometric and semantic information required during an emergency; (2) it should support the quantitative description and calculation of the distribution characteristics and dynamic changes among indoor objects during the simulation; and, finally, (3) it should be able to predict congestion and stagnation to support emergency management and decision-making.
This section discusses the critical element requirements for indoor emergency evacuation and proposes a conceptual data model and unified modeling language (UML) class diagram for the DIFM. The comprehensive representation of an indoor dynamic environment could efficiently provide calculable emergency information to decision-makers and improve an individual’s navigation ability inside structures, as discussed in Section 4.
3.1. Element Requirements for Indoor Emergency Evacuation
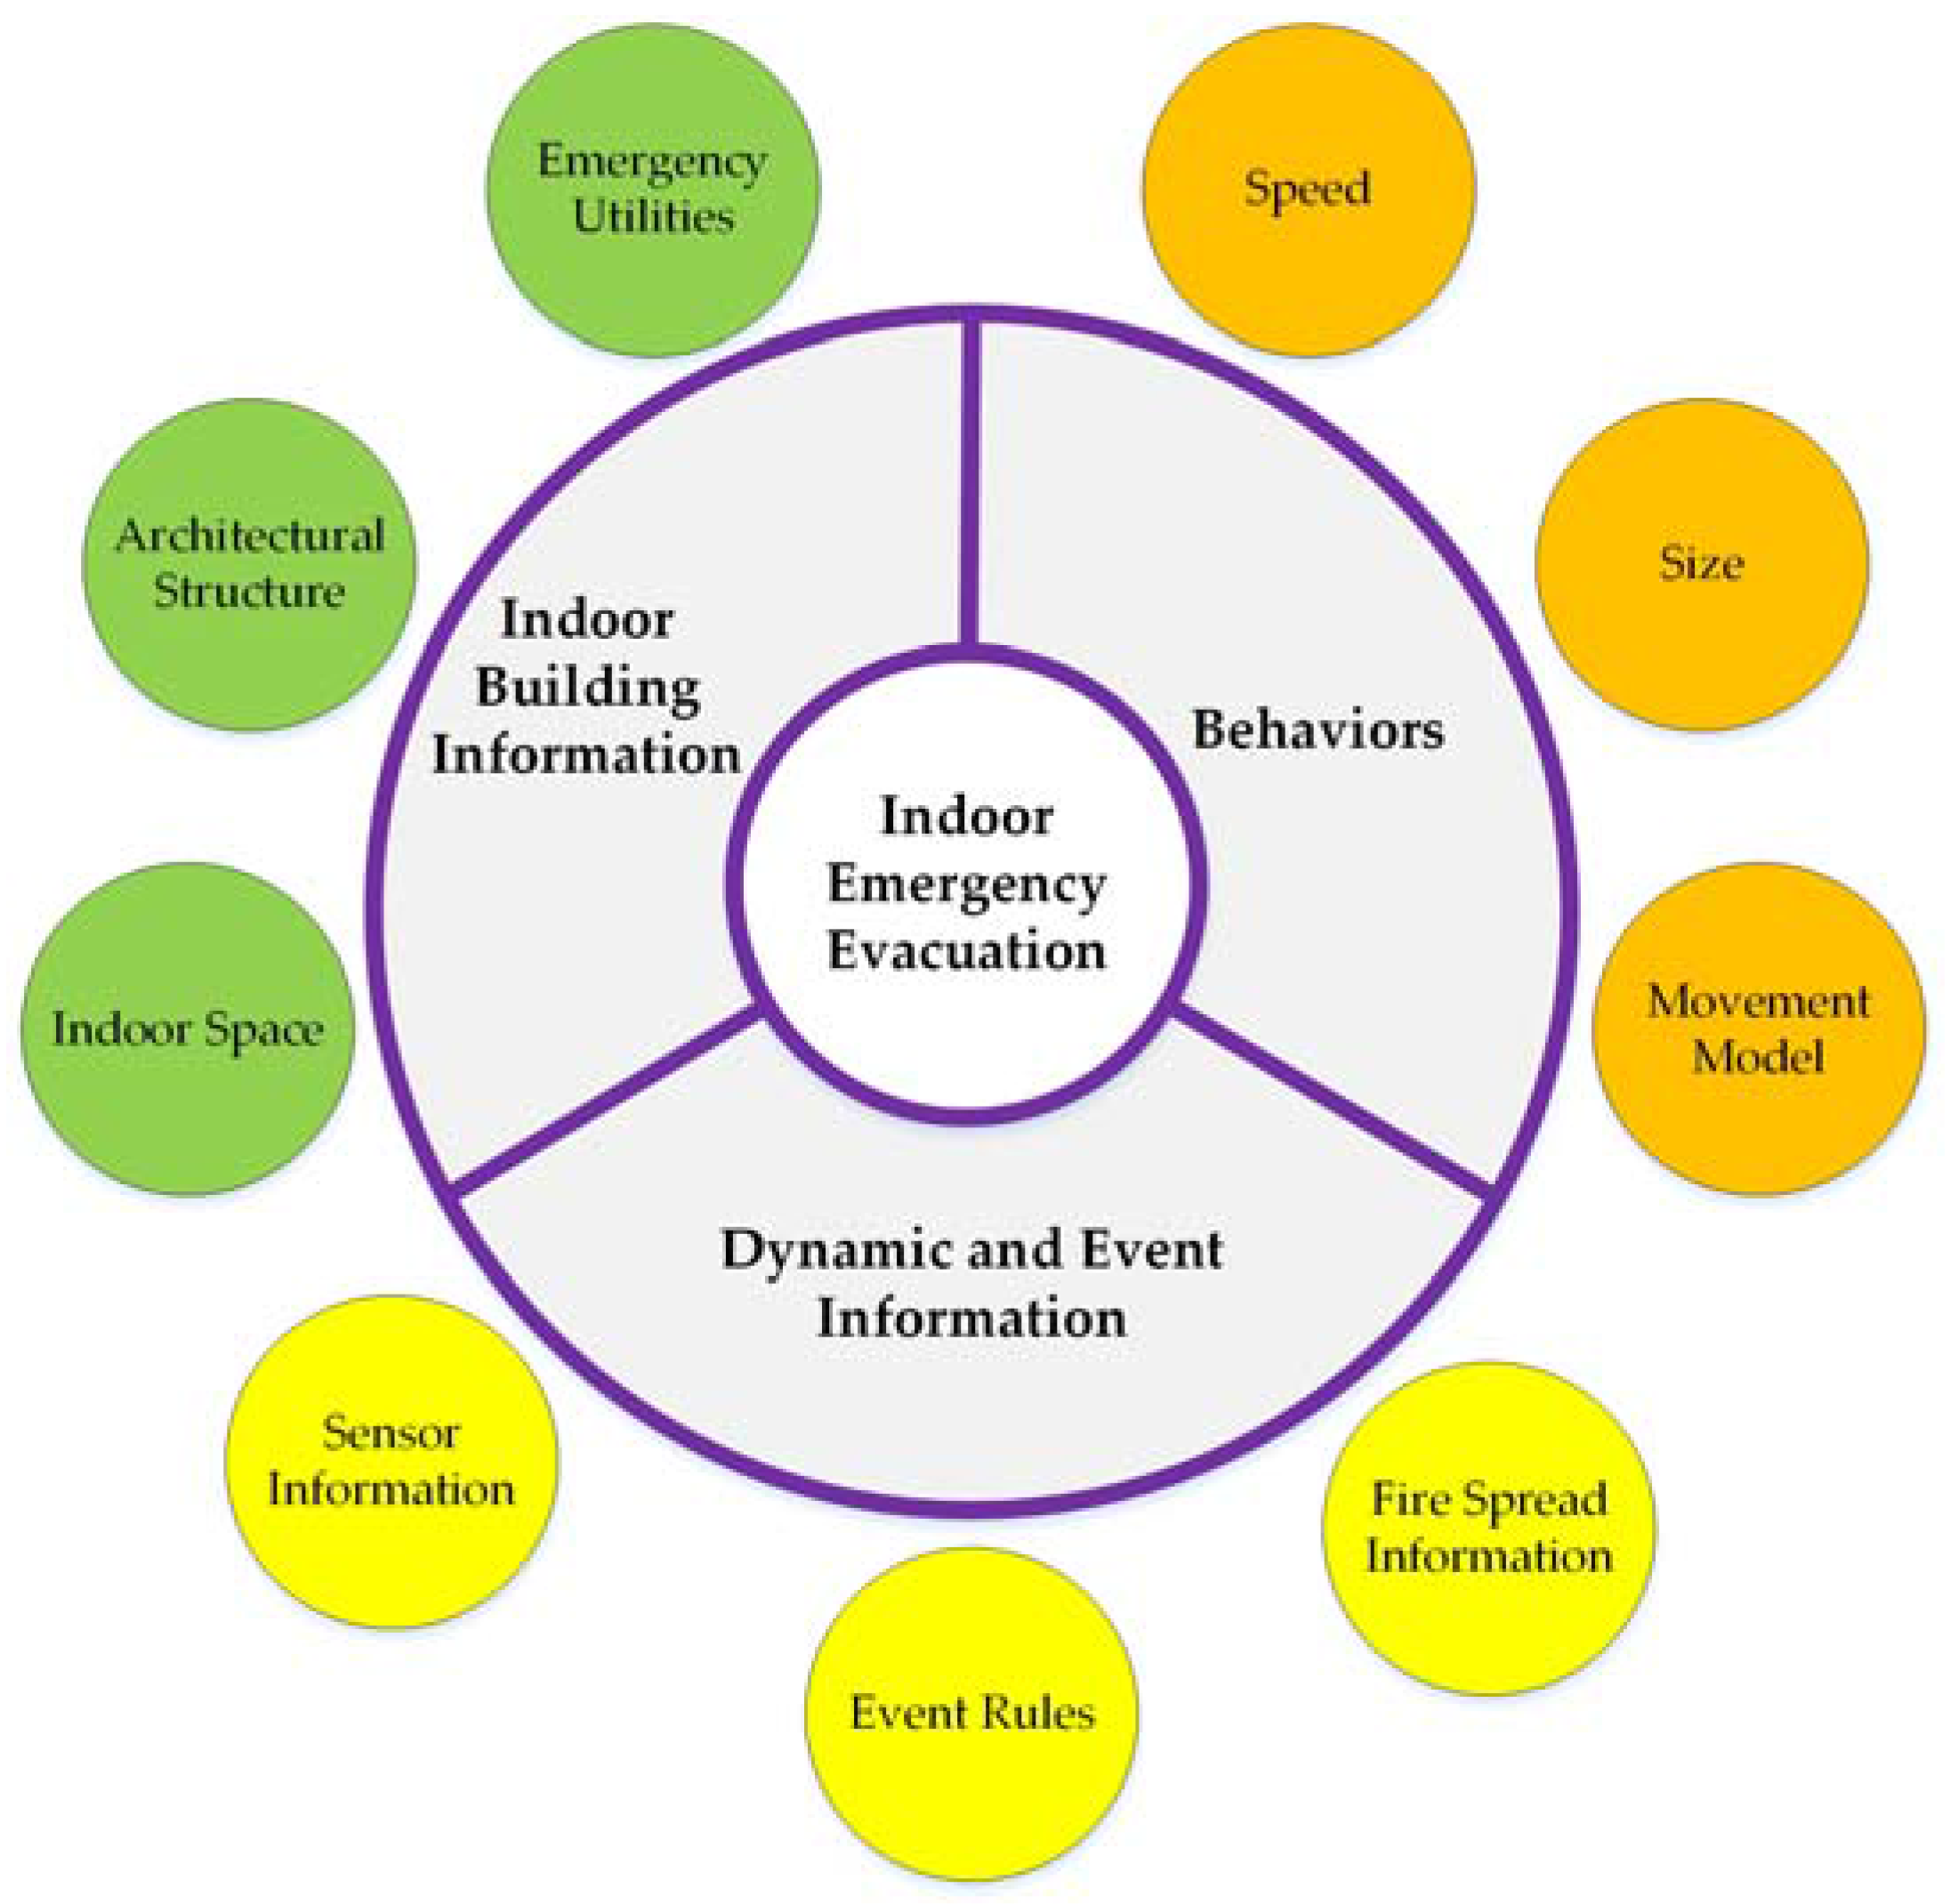
Indoor emergency evacuation is a very complex group behavior. Information about the distribution characteristics, behavioral characteristics, development of and changes in an evacuation environment, individual behaviors, dynamic changes, and the interaction among elements may exert important impacts on an actual evacuation process. A series of significant findings related to emergency response in various indoor emergency situations has been discussed [46,47,48]. Based on this research, during a building fire, critical indoor evacuation information that is required for situational awareness can be categorized into the three dimensions shown in Figure 1.
3.1.1. Indoor Building Information
The spatial distribution characteristics and dynamic changes of building information during the simulation period should be accurately presented. The spatial distribution of the elements in the evacuation scene is directly related to the interaction between the elements and the evacuation process. Indoor building information includes information about the indoor space, architectural structure, and emergency utilities. The indoor space is the most important element affecting personnel activities and is the basic spatial information required for evacuation. The architectural structure is an important complement to the indoor space, and its semantic information supports evacuation. The spatial distribution of the emergency utilities significantly influences the evacuation process and is an important constraint to solve the problems of congestion and retention. Therefore, these three features are significant elements for accurately describing interactions among indoor objects and analyzing an individual’s evacuation routes.
3.1.2. Dynamic and Event Information
The simulation and deduction of the fire spread, smoke, temperature field, and space environment of a building constitute the basis for evacuation safety demonstrations. Thus, fire spread information, sensor information, and event rules must be defined. Fire spread information is an important factor that affects an evacuation and serves as an important basis for evaluating evacuation routes. Sensor information provides important support for simulating changes in a spatial environment and is thus the basis for evaluating an indoor environment. The event rules are the core drivers for determining the best people-evacuation system and provide important support for evacuation.
3.1.3. Behaviors
Analyzing the people’s situations during an evacuation is a complicated thought process, and simulating their behaviors is difficult. Recently, there are many crowd flow models to simulate the behaviors of people [49,50]. The related crowd flow model can provide the attribute of physiology, psychology and social to simulate behaviors of people during emergency response. However, according to the spatial attribute of traditional crowd flow model, this paper discusses only individuals’ speeds, sizes, and movement types, which are directly related to evacuation route identification. Speed is an important parameter for calculating evacuation time. Size is an important basis for determining the smallest spatial unit of indoor space. Finally, movement type is an important basis for assigning different types of personnel to different evacuation strategies. Based on the characteristics of speed, size, and movement type, this paper describes an evacuation route algorithm by delineating the individual differences in an actual situation and then simulating congestion and stagnation during the evacuation process.
These identified requirements will form the data model representation of the DIFM presented in the following section.
3.2. Conceptual Data Model
Among the indoor modeling methodologies available, IndoorGML [51] is the most relevant for indoor spatial information and provides comprehensive geometric and semantic information about building elements [52]. To obtain indoor building information, IndoorGML uses the semantics and geometries of building elements and the spaces inside buildings [53]. However, because it presents the spatial relationships among elements in terms of a network, it cannot be directly employed for the evacuation of individuals; considerations of personnel behaviors and dynamic information are lacking. According to previous research [54], CityGML LoD4 building data can be translated to an expanded definition of an indoor space in IndoorGML. The expanded definition of indoor space improves the hierarchy and grid representation of an indoor space through a voxelization process, which can satisfy the complexity and efficacy requirements of indoor services. The DIFM proposed here modifies the IndoorGML classes to contain the three previously mentioned critical dimensions and inherit new characteristics; these changes enable the production of a complete indoor spatial data model that can facilitate the provision of indoor emergency response information to emergency responders and decision-makers.
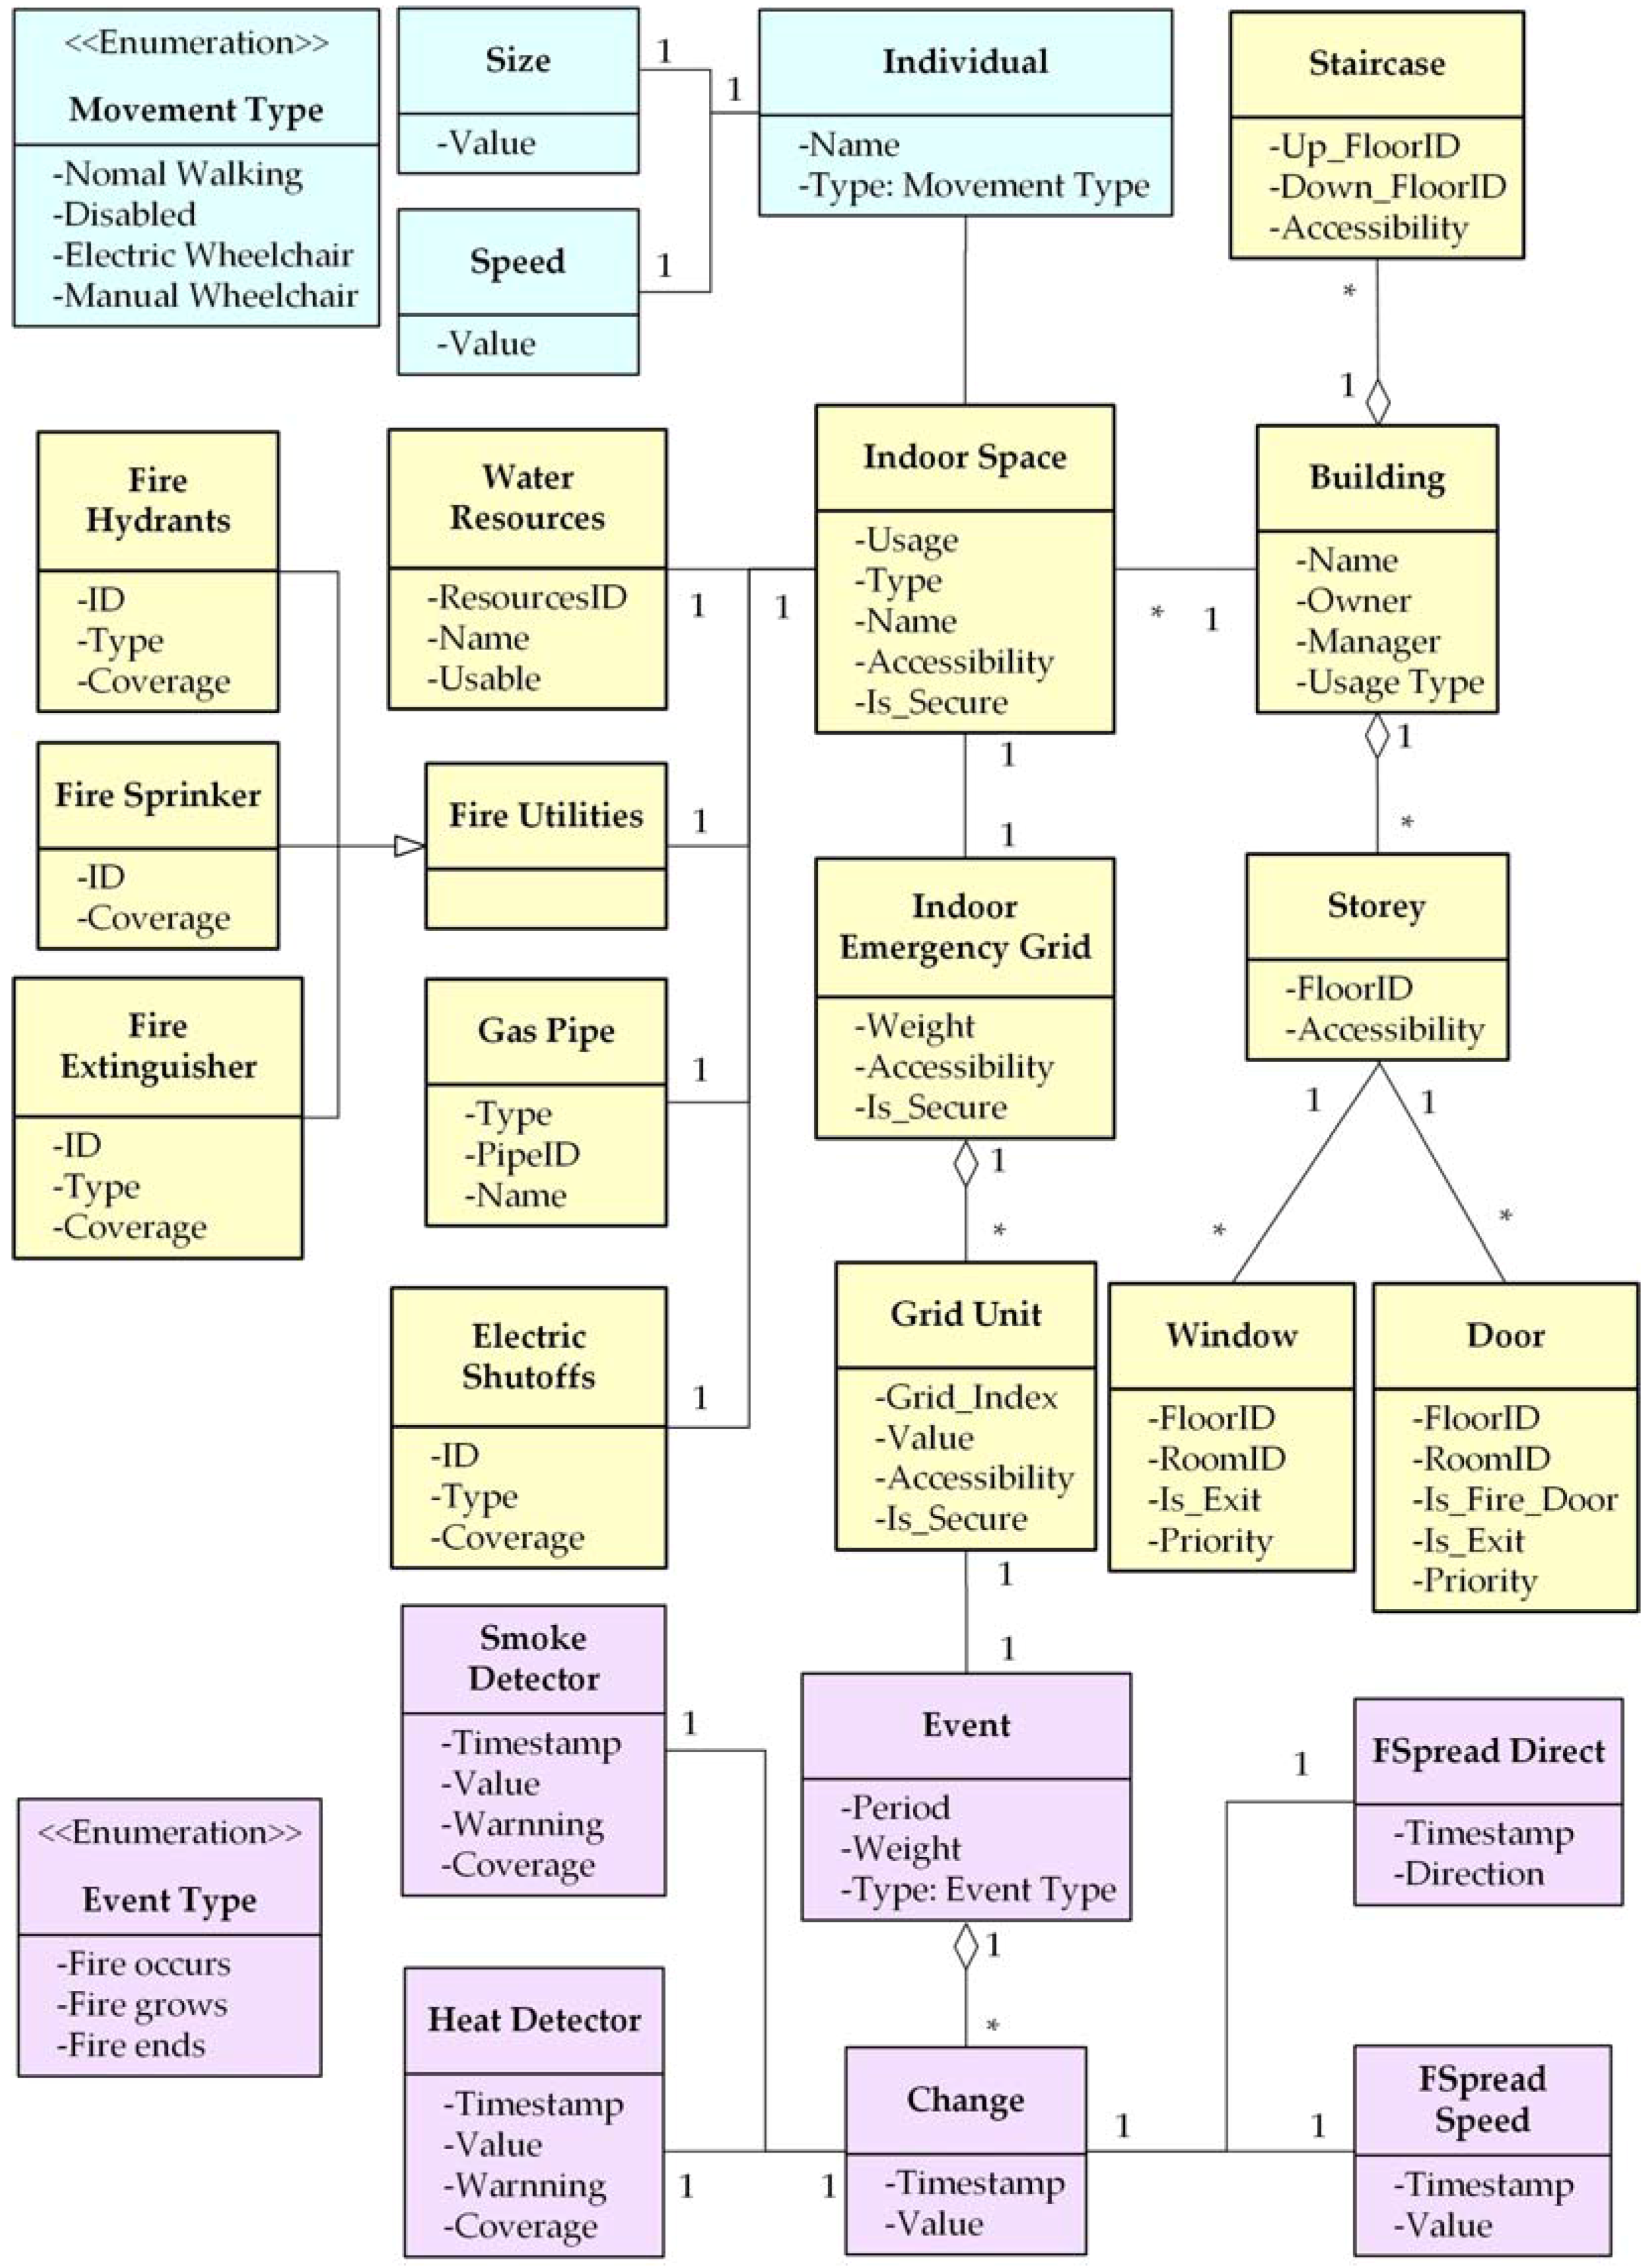
The conceptual data model of DIFM represents the objects and their relationships in terms of three critical dimensions, as shown in Figure 2. The core objects are the Indoor Space, Indoor Emergency Grid, and Grid Unit. The Indoor Emergency Grid is a grid set based on the Grid Unit and represents the basic analysis element in an indoor environment. The other objects are linked to the Indoor Space or Grid Unit, and their spatial relationships enable spatial analysis in a geo-spatial environment. Additionally, the DIFM can support indoor dynamic descriptions by updating the values of the Grid Unit and support event deduction by analyzing the adjacency relationships among the Grid Unit. Furthermore, this model can accurately simulate an individual’s behavior in corners or bottleneck zones (such as vertical spaces and doors) using the Grid Unit, which is a voxel that represents a 3D object.
Individual is the core element of behaviors. Speed is related to Size and Movement Type. According to Lo et al. [55], the relationship between an individual’s speed and size during an evacuation in a normal walking situation can be defined by the following equation:
where is the speed of an evacuee in m/s, and is the referencing crowd density in persons/m2 (Di). can be calculated based on the Size and local area.
When considering slower Movement Types, such as that of disabled people, the evacuation speed should be reduced. According to Christensen and Sasaki [56], the speed of disabled people who do not need help is 0.78 m/s, the speed of disabled people who do need help is 0.36 m/s, the average speed of an electric wheelchair is 0.69 m/s, and the average speed of a manual wheelchair is 0.89 m/s.
Event is the core element of Dynamic and Event Information. The basic element of Event is Change, which is linked to Smoke Detector, Heat Detector, Fire_Smoke Spread Direction, and Fire_Smoke Spread Speed. The value of Change can reflect the state of a fire’s trend, and the value of Event can reflect the situation of the fire.
The detailed design and realization of this conceptual data model are introduced in Section 3.3.
3.3. Logical Data Model
According to the IndoorGML 3 Release Documentation [51], “indoor spatial information is used to locate stationary or mobile features in indoor space and can provide spatial information services utilizing their position in indoor space.” The components of a building, such as staircases, floors, windows, doors, and indoor spaces, are integrated into DIFM. This paper defines these components by referring to the IndoorGML format and attributes for emergency response. The Story represents the horizontal space of a Building, and it includes two key features, Window and Door, which are potential hot spot regions during an evacuation; Window and Door are correlated with FloorID and RoomID. Staircase represents the vertical space of a Building and connects adjacent horizontal spaces, thus creating key life passageways when elevators are unavailable during an evacuation. The horizontal and vertical spaces are organized by Indoor Space, which is a core object for rapid quantitative calculations during an evacuation. The organization method of Indoor Space is based on previous studies of indoor space extraction [54]. Short descriptions of the main objects of DIFM are provided in Table 2.
One of the main objects in the DIFM is the Indoor Space entity. In particular, this object’s potential to reflect aspects of an emergency situation, such as the trends of hazards, distribution of individuals, and detailed routing solution, is not considered in IndoorGML. As shown in Figure 3, this entity was modified to help individuals become aware of their indoor environment and make safe evacuation decisions. Geometric and semantic information about detectors, utilities, and fire spread that corresponds to real-time situations inside a building is associated with the basic calculable element Grid Unit. Thus, the movement information of individuals and hazard event information can be substituted by a uniform entity. Based on this core idea, Section 4 introduces a change-based evacuation method to help an individual avoid congestion and stagnation during an emergency.
4. Change-Based Evacuation Method
Change-based GIS technology has been successfully applied in many fields in recent decades. Beyond its original purpose—map-making—change-based GIS has become an efficient method for awareness and prediction analyses of spatial data. Traditional change-based GIS approaches typically focus on the spatial evolution of large-scale areas based on remote sensing images. However, an emergency evacuation analysis of an indoor environment in terms of change, such as the evolution of variables associated with indoor building information, dynamic and event information, and behaviors, is possible. This paper introduces a change-based evacuation method based on DIFM to establish individual safety routing out of a building during emergency response.
First, the process an individual uses to analyze evacuation routes and the flow of the change-based evacuation method must be determined. Based on related research studying human behaviors in response to fire [57,58,59], Figure 4 presents a diagram of individual behaviors during the evacuation process. The arrows in the evacuation process indicate the directions of evacuation flows. In a fire evacuation, an individual will adjust strategies to respond to the evolution of the environment. For example, with congestion and stagnation, an individual may wait or turn back and seek an alternative route. An individual’s evacuation strategy adjustment can balance the evacuation efficiency and predict potential congestion and stagnation during an evacuation. Consequently, the key steps during emergency response are summarized in the event chain shown on the left side of Figure 4.
According to the event chain, the flow of a change-based evacuation method is shown in Figure 5. The input data include building information, utilities information, and behavior and fire settings, which can be modified according to the DIFM. The building emergency grid is based on the grid units of the extracted indoor space, including information associated with utilities and individuals. After obtaining the original grid set, a potential evacuation route for each individual can be calculated by applying a certain search algorithm (e.g., A* algorithm). As the fire grows, an individual’s evacuation route may intersect with a dangerous barrier, such as a fire or smoke barrier. Thus, the security of a potential route should be assessed when establishing each potential evacuation route. Furthermore, individuals must bypass congestion and stagnation where substantial numbers of people become trapped along the route. Thus, an individual can evacuate the building by selecting a reasonable and safe route.
4.1. Building Emergency Grid
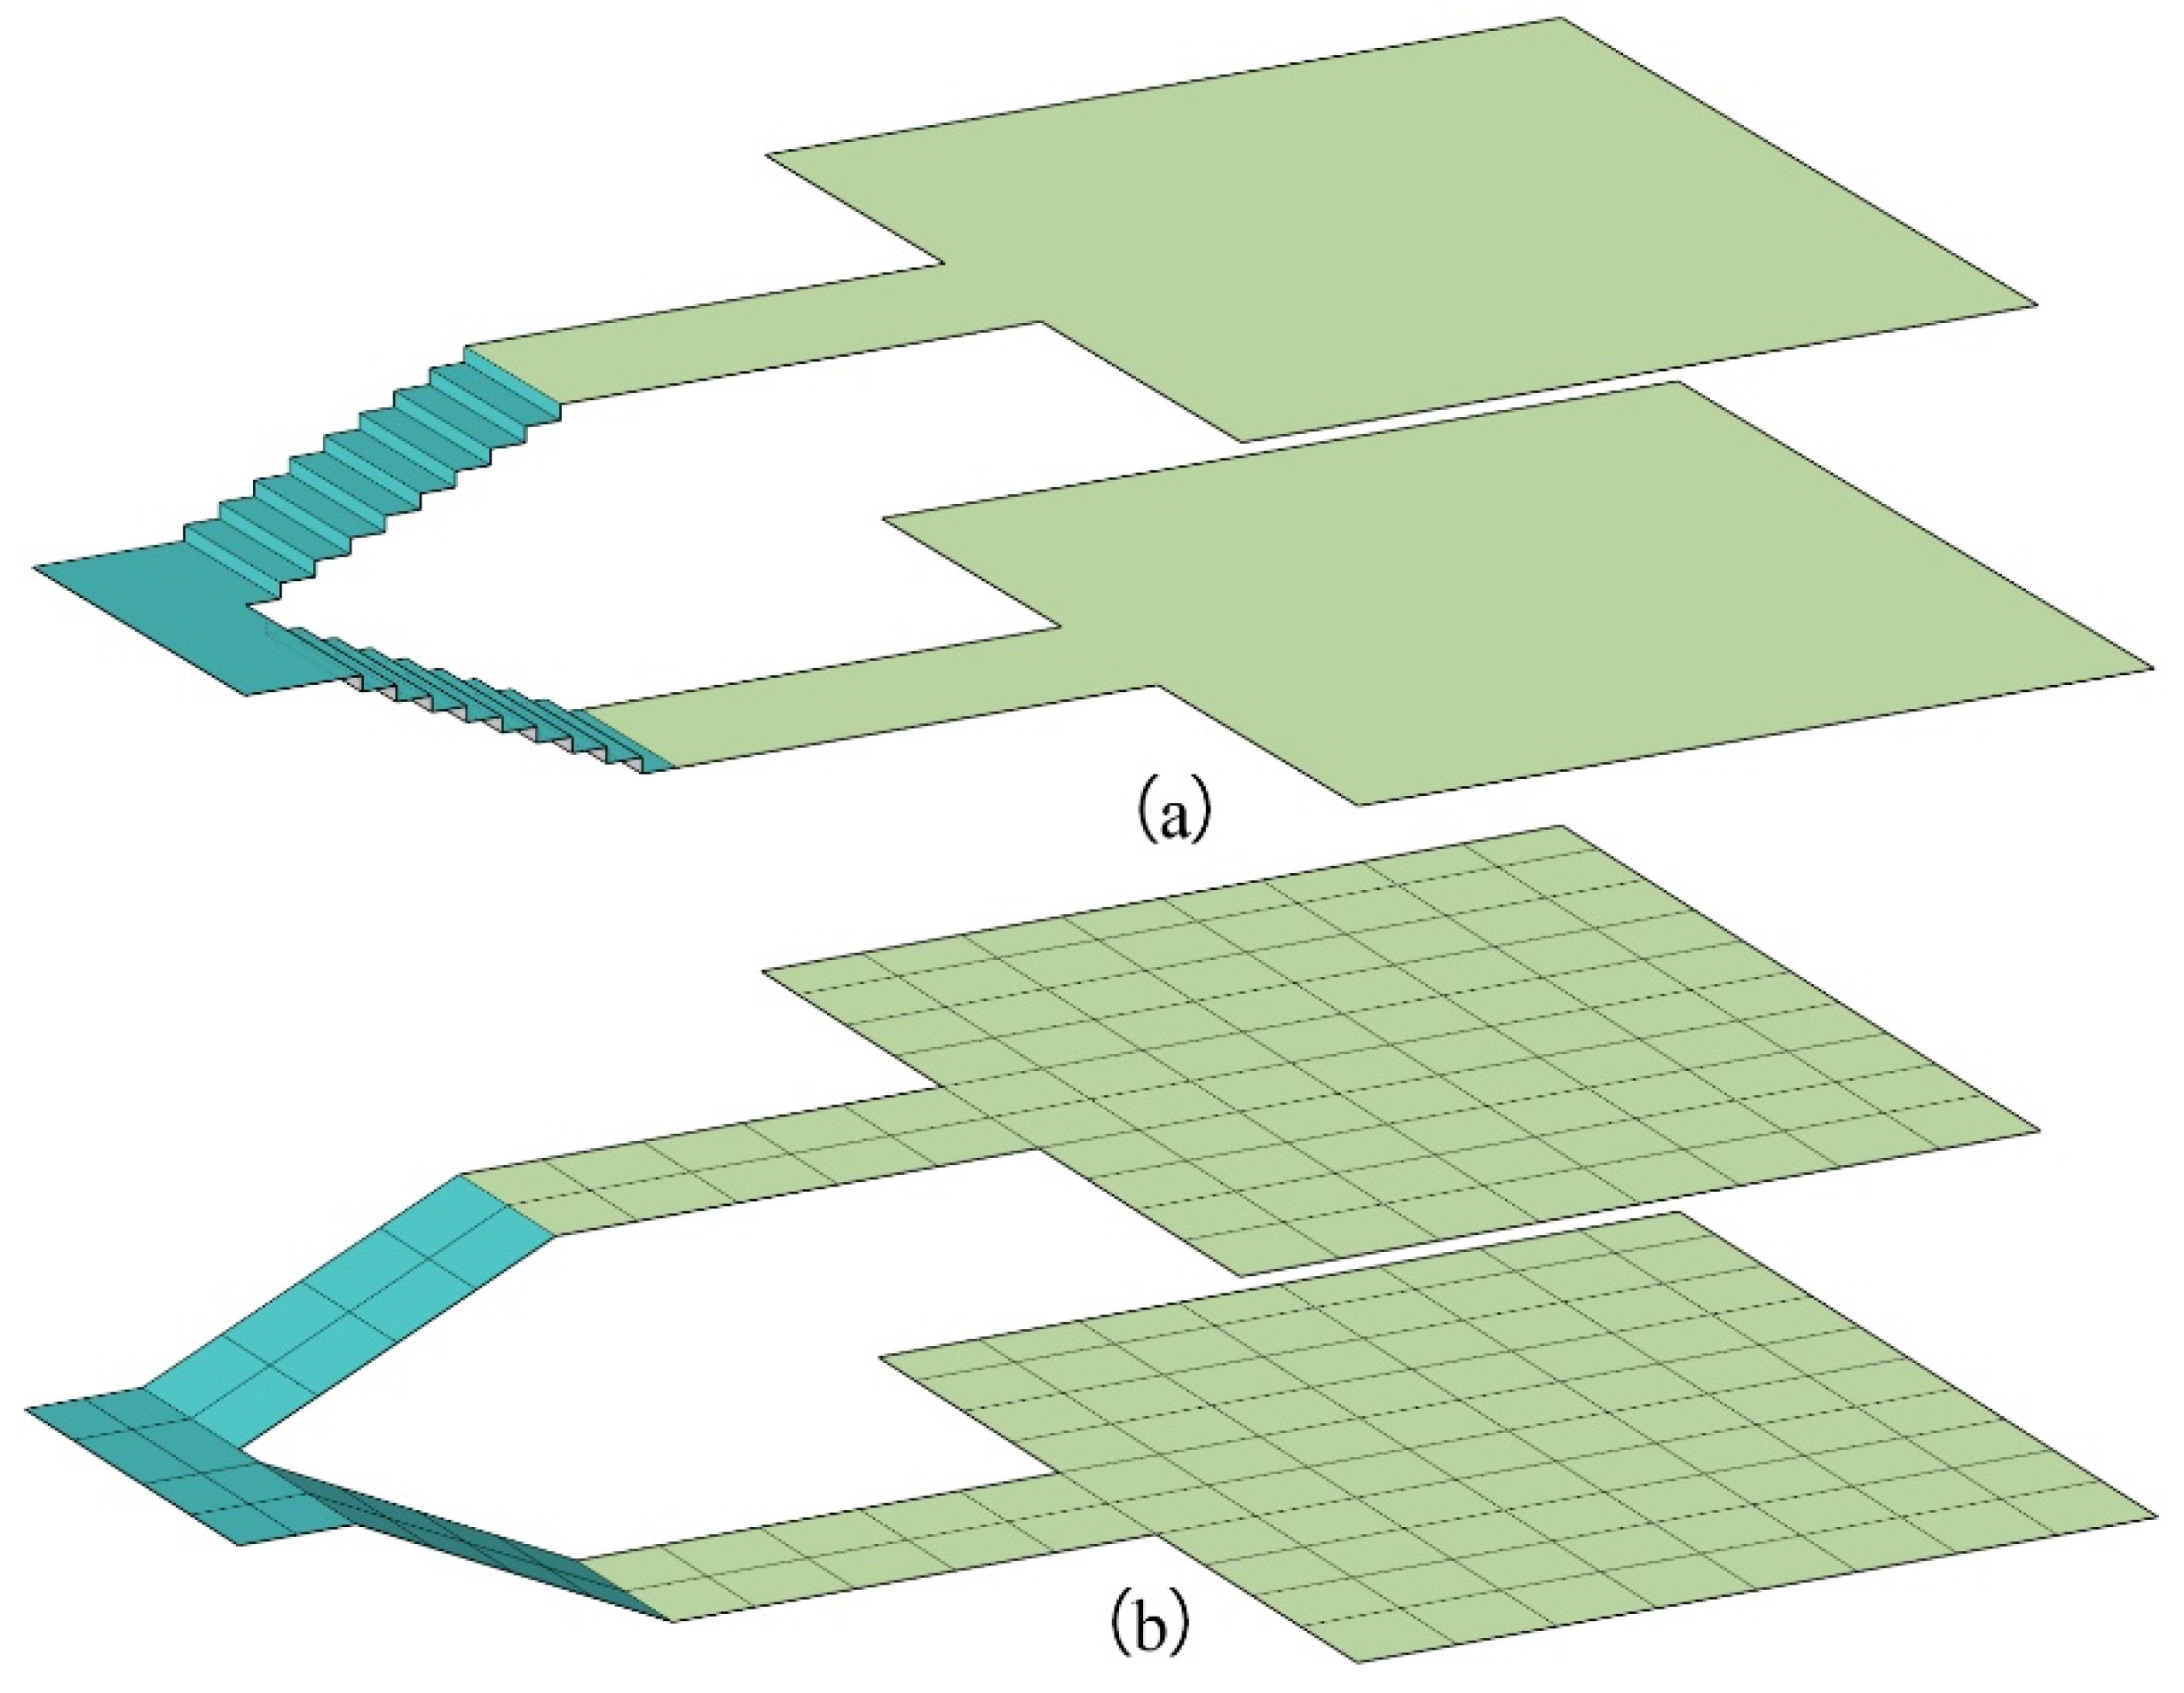
Because a building contains two types of indoor spaces (as shown in Figure 6a, a building is a footprint consisting of horizontal and vertical spaces), an emergency grid should be established based on different geometric characteristics. As shown in Figure 6b, a horizontal emergency grid can be represented as a set of connected grids with a certain elevation. To seamlessly connect the horizontal emergency grids, the vertical space can be represented as a set of connected grids with elevation and slope, such as a staircase. Note that a staircase is not available to an individual in a wheelchair. Consequently, this paper assumes that an individual in a wheelchair can receive help from others to utilize staircases.
The location of each grid can present many elements during the evacuation event chain. As defined in the DIFM, the weight of a grid can be calculated in terms of the influence exerted by utilities, detectors, individuals, and the fire. Available fire utilities and water resources can increase the security of trapped individuals or allow them to build a security zone as a fire grows. The utility weight of grids can be calculated using the following equation:
where s is the grid’s geometric size, and dis(u) represents the distance to the fire utilities. dis(u) can be calculated by determining the distance from the grid’s location to the fire utilities; this distance should be less than the coverage attribute of the fire utilities.
For detectors, the warning and value attributes can reflect the criticality of the grids. When the warning attribute of a detector is true, the detector weights of the grids can be calculated using the following equation:
where dis(d) is the distance to the detectors; this distance can be calculated by determining the distance from the grid’s location to the detector. dis(d) should be less than the coverage attribute of the detector. These values constitute the real-time data of the detectors. When the warning attribute of a detector is false, the detector weights of grids are 0.0.
According to the movement type of an individual, the individual weight of a grid can be defined as follows:
where is the speed of the individual. When a grid is not utilized by any evacuees, the is 0.0. When other individuals occupy a grid cell, it is not accessible by the targeted evacuee, thus giving a negative weight.
According to the location and spread information of a fire, the fire weight of the grids can be defined by the following equation:
Thus, the final weight of a grid can be calculated as follows:
where a, b, c, and d are the ratios of the four weight components. Because, according to the site assessment, each one of these four aspects (utilities, detector, individual, and fire) is very important and may have the key influence during evacuation, in this paper, we assume the ratio of each aspect is the same. When is equal to 0.0, the related grid can be freely accessed. When is greater than 0.0, the grid can be safely accessed to help a trapped individual wait or establish a security zone. When is less than 0.0, the grid cannot be accessed by individuals.
Additionally, there are two ways that grid weight can be 0.0:
- The grid is not occupied by utilities, detectors, or individuals and is not in the fire, i.e., each of the four weight components is 0.0.
- The grid is covered by fire utilities or water resources (thus, the weight for utilities components is greater than 0.0) and has been covered by detectors, individuals, fire, or a combination of these.
In Case 1, the evacuees are free to access the grid cell, because the grid weight is 0.0. In Case 2, it is possible that the grid is a water resource and has been covered by fire and/or individuals and/or detectors, and the summation of these four weight components incidentally produces a value of 0.0. In this case, these grids form the border between a dangerous area (grid weight is less than 0.0) and a security zone (grid weight is greater than 0.0). If the grid is in the fire field, it is not safe, and the evacuation route for evacuees must try to avoid these grids. Thus, if there are grids with weights greater than 0.0 near grids with weights of 0.0, the evacuation route should opt for the safer grids with weights greater than 0.0.
During the establishment of an emergency grid, the geometric location and the weight of the grids are calculated, as shown in Figure 7.
- Step 1.
- Extraction of indoor space. Based on a previous study [54], the indoor space can be extracted in grid form based on building information, utility locations, and individual positions.
- Step 2.
- The weight of the grids can be calculated based on Equations (2)–(6) presented above.
Creating the building emergency grid is the basic step of the proposed change-based evacuation method. This process can generate an original grid set that can be updated during an evacuation and supports the calculation of an escape route by providing a potential evacuation route for each individual.
4.2. Building Potential Evacuation Route
After constructing an emergency grid, a safe escape route out of the building must be calculated for each individual. Because the grids are seamlessly connected in both the horizontal space and vertical space, an emergency grid can be considered as a continuous spatial matrix with different elevations. Consequently, an optimized route from the individual’s location L(i,j) to a building exit E(i,j) can be calculated by a certain search algorithm f (e.g., A* algorithm) using the following equation:
where is the grid set of the optimized evacuation route, and is the search structure based on the emergency grid. The search structure and algorithm f are based on previous studies involving the A* algorithm [60], which chooses a greater value grid as its path to avoid the situation in which evacuees pass the grid that is covered by fire utilities or water resources with detectors, individuals, fire, or a combination of them (grid weight is 0.0). is related to only the static emergency grid at a given time and provides a rudimentary evacuation route for individuals in the event chain. Additionally, the assessment of a potential evacuation is calculated to ensure that an individual can avoid a fire or smoke barrier as the fire grows. A characteristic safety index SI is formulated for according to the following equation, which includes the attributes of static objects (exit priority p and distance from individual to exits dis) and the attributes of the dynamic event (surrounding fire warning level l).
where denotes the weight of grid k along . The exit priority p is related to the geometric size of the exit (e.g., its width) and indicates the available capacity for individuals. A suitable route ends with a greater safety index SI, which has a high priority in route searching.
According to the distribution of exits among the horizontal and vertical indoor spaces, the evacuation of an individual can be considered as a set of , which are selected based on the SI of the exits around the individual. Thus, the evacuation route of an individual can be calculated by the following equation:
When constructing a potential evacuation route, not only the shortest move distance but also the risk associated with moving that distance must be considered. However, merely calculating a suitable route is inadequate; congestion and stagnation must also be considered.
4.3. Identifying Potential Congestion and Stagnation
Identifying congestion and stagnation manually during an evacuation is simple, whereas doing so via quantitative analysis is difficult. The key problem is how to calculate the correct population density to identify potential congestion and stagnation.
Using the k-means algorithm, which can calculate the spatial density of discrete distribution data, this paper presents the following improved approach for identifying potential congestion and stagnation at a given time:
- Step 1.
- Identify the cluster number k of individuals by counting the number of available exits.
- Step 2.
- Randomly select k seed positions among individuals.
- Step 3.
- For each seed s, calculate the distance dis from other non-seed positions.
- Step 4.
- Cluster the individuals by dis; if individual pi’s closest seed is si, classify pi in the group corresponding to si.
- Step 5.
- Set the center position of each group as a new seed.
- Step 6.
- Assess whether the new seed is consistent with the old seed.
- Step 7.
- If the new seed changed, return to Step 3. If the new seed is not changed, calculate the population density of the clustered group using the following equation:where n is the individual number of clustered groups, and the area can be calculated by counting the grid number of the clustered group.
Because congestion and stagnation occur around exits, the non-related clustered groups should be filtered. According to the population density statistics around each exit, congestion and stagnation can be determined by the following equation:
When congestion and stagnation occur, the weight of the grids in the clustered group must be updated by the following equation, and the evacuation route must be re-calculated.
After identifying that the grid is congested, the grid is considered not accessible. Once congestion starts to occur at one or more grids, these grids become inaccessible, and evacuees who want to pass through must find a detour in the next step. In this case, the congestion around some doors inside the building may occur frequently and for short duration. This occurs because, once the density of evacuees reaches a threshold value, the other evacuees seek a detour. Thus, stagnation is not common when the evacuees have detour choices. However, once the detour cannot be re-calculated when the potential doors all have congestion, the evacuee must wait in one of congested areas. Then, the situation of stagnation (when the density is greater than 2.0) may happen.
Establishing an approach to identify potential congestion and stagnation is an important feat described in this paper. Using this approach, an efficient evacuation plan can be obtained by re-routing individuals around congestion and stagnation.
5. Experiment
The effectiveness of the DIFM is tested by modeling an example of a traffic hub with buildings that are located on the ground and underground. Typically, an evacuation simulation system is designed and developed for the visualization and validation of a proposed change-based evacuation method. In this example, indoor building information, dynamic information, and behaviors are added or set to the proposed mode to support indoor evacuation and management. The primary focus is the use of a reliable and extensible geographic information framework to achieve visualization, routing, and data management. OpenSceneGraph is an open 3D application engine that has been extensively employed in the design and implementation of 3D real-time applications. Because it is well integrated with a spatial analysis environment, it provides interfaces for evacuation analysis functions. The simulation was implemented on a computer with an Intel quad core 3.00-GHz CPU and 16.0 GB RAM. The system’s design features and simulation work will be explained in this section.
5.1. Implementation Framework
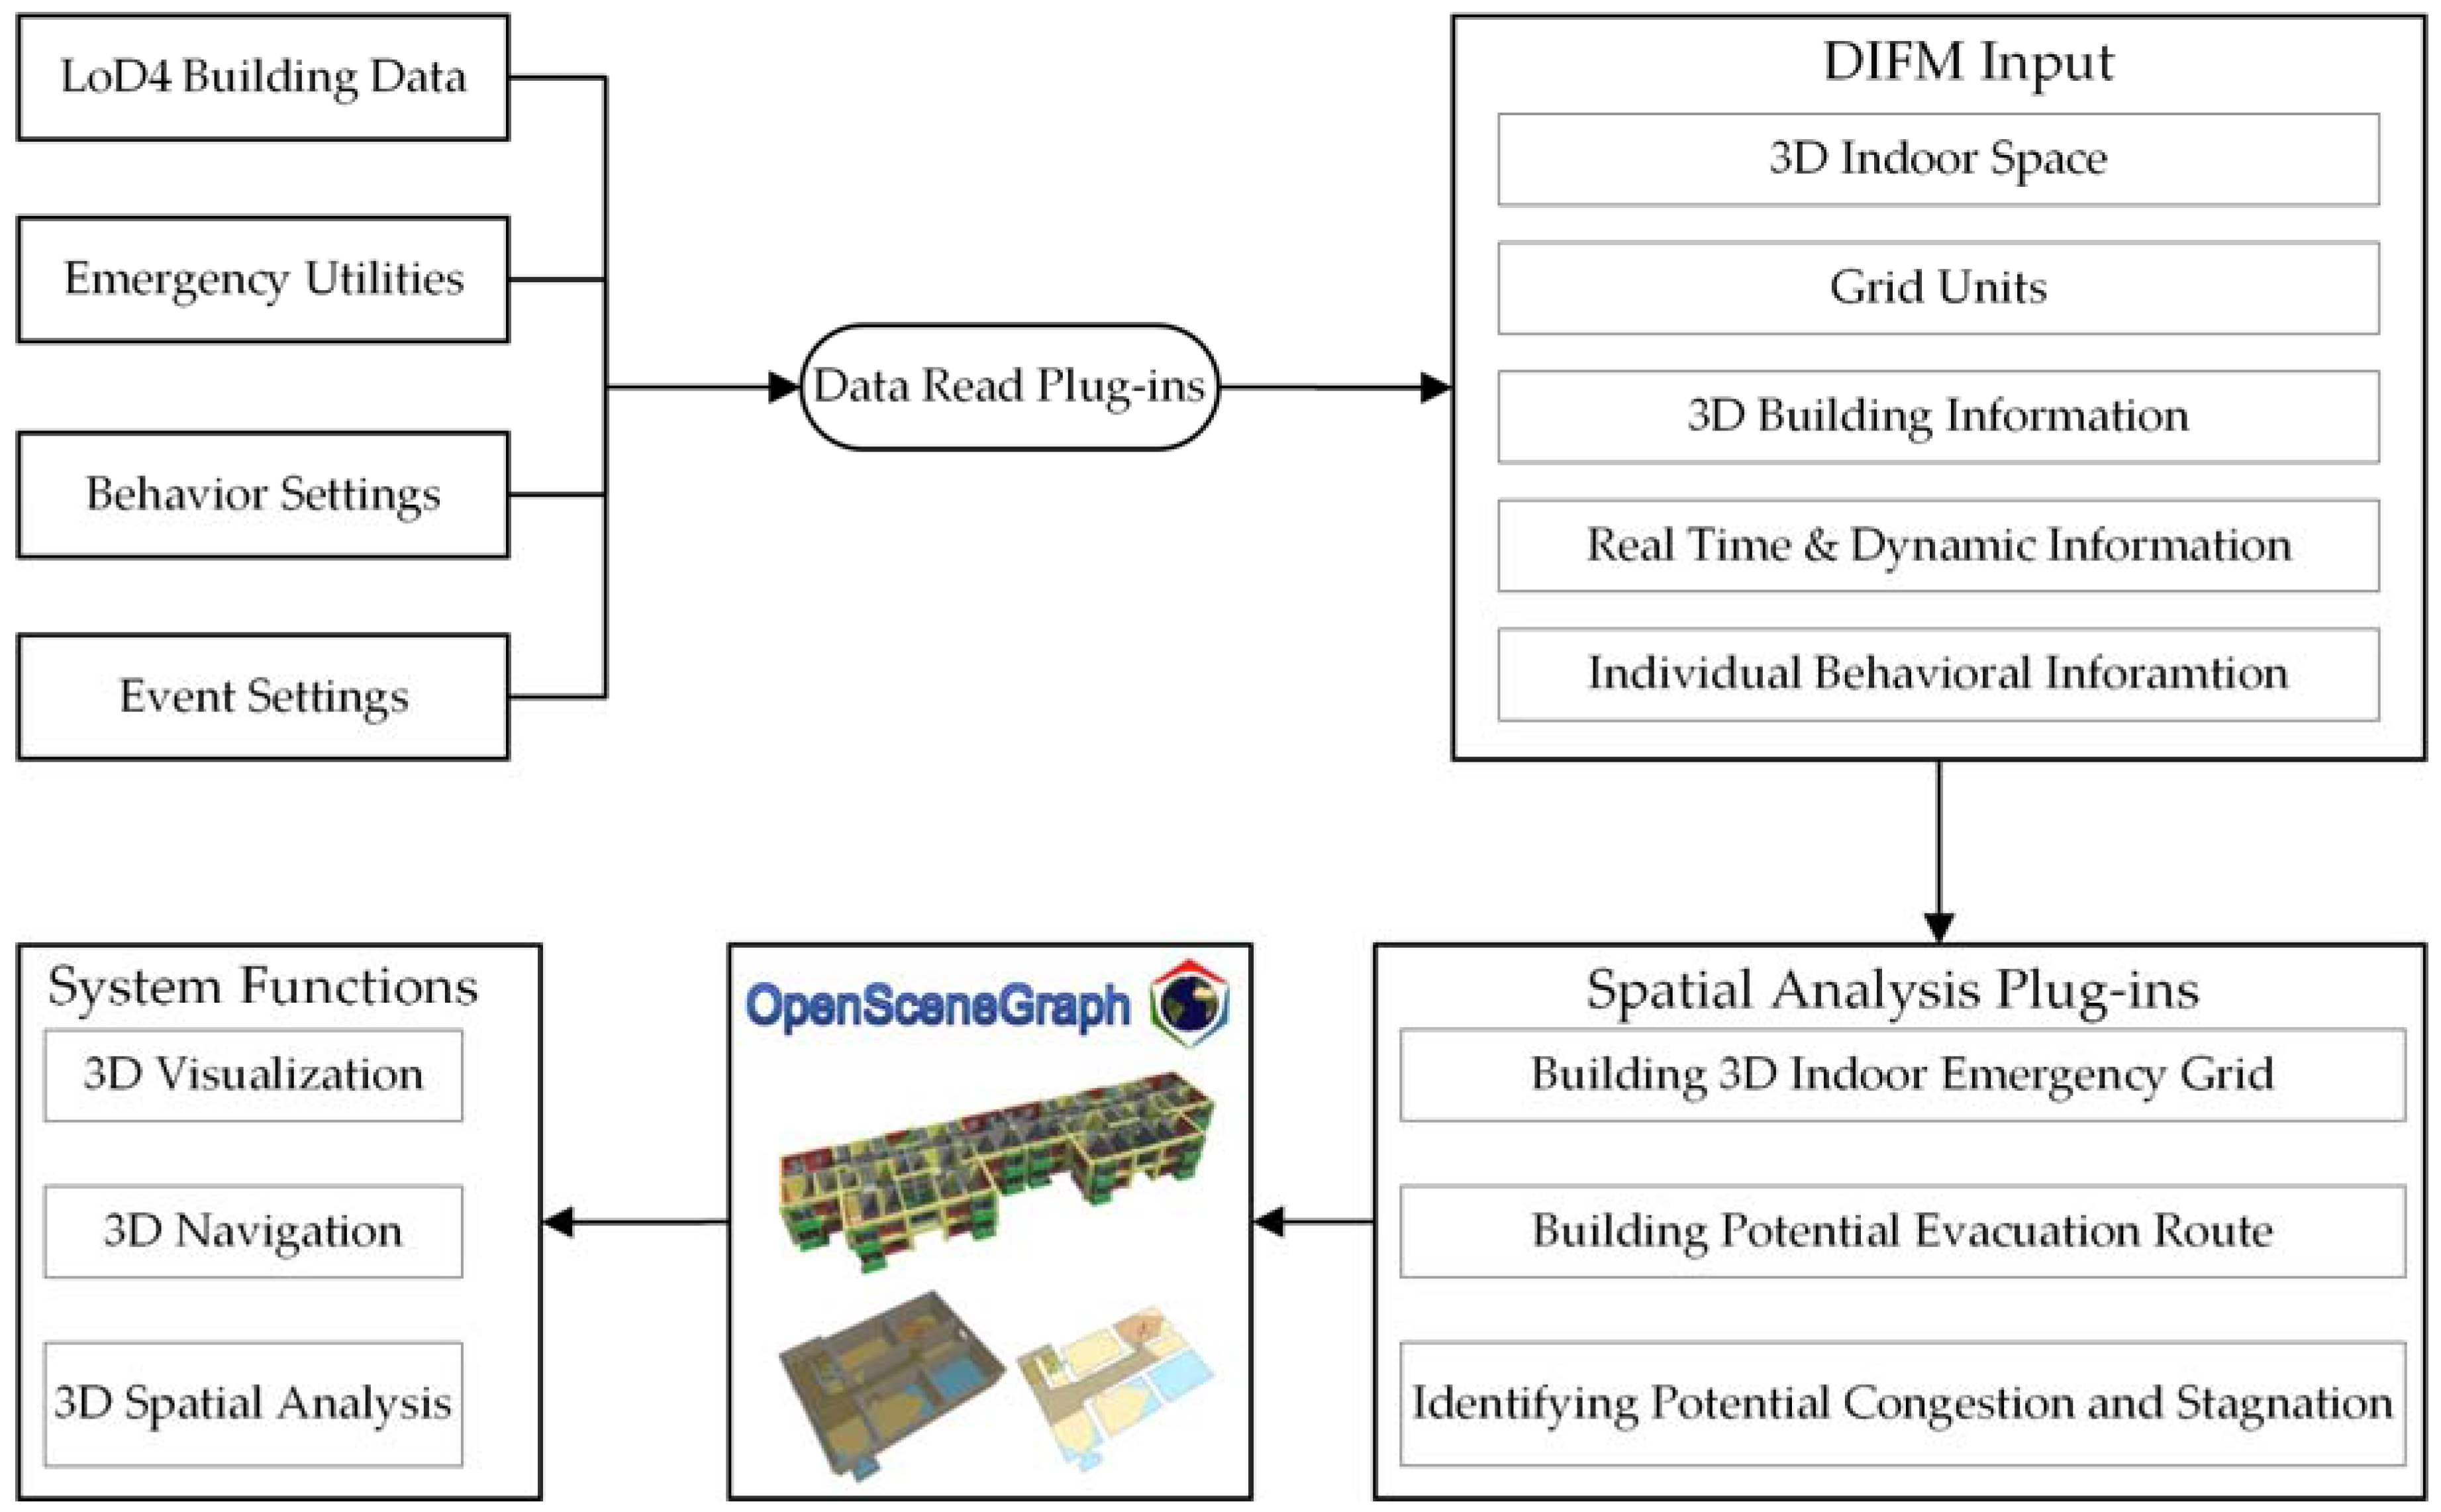
The framework used to develop the DIFM and the change-based evacuation method is illustrated in Figure 8. As shown in this architecture, the LoD4 building data, emergency utilities, behavior settings, and event settings in the DIFM data model are integrated using plug-ins to import data. The 3D indoor space and grid units are integrated into an emergency grid with weight restrictions for the building environment (as explained in Section 4.1). The evacuation routes for each individual are searched based on the emergency grid, and the fire is driven by real-time and dynamic information (as explained in Section 4.2). Congestion and stagnation may occur during the evacuation process (as explained in Section 4.3). At this stage, the navigation of individuals and environmental change information are visualized using the experimental platform, which is based on OSG (OpenSceneGraph).
Custom OSG plug-ins can be developed and added to the OSG spatial environmental framework to realize specific analysis functions for an emergency evacuation. The proposed system architecture will enable various evacuation management functions, as shown in Figure 8 and explained in the following sections.
5.2. Experimental Data Specification
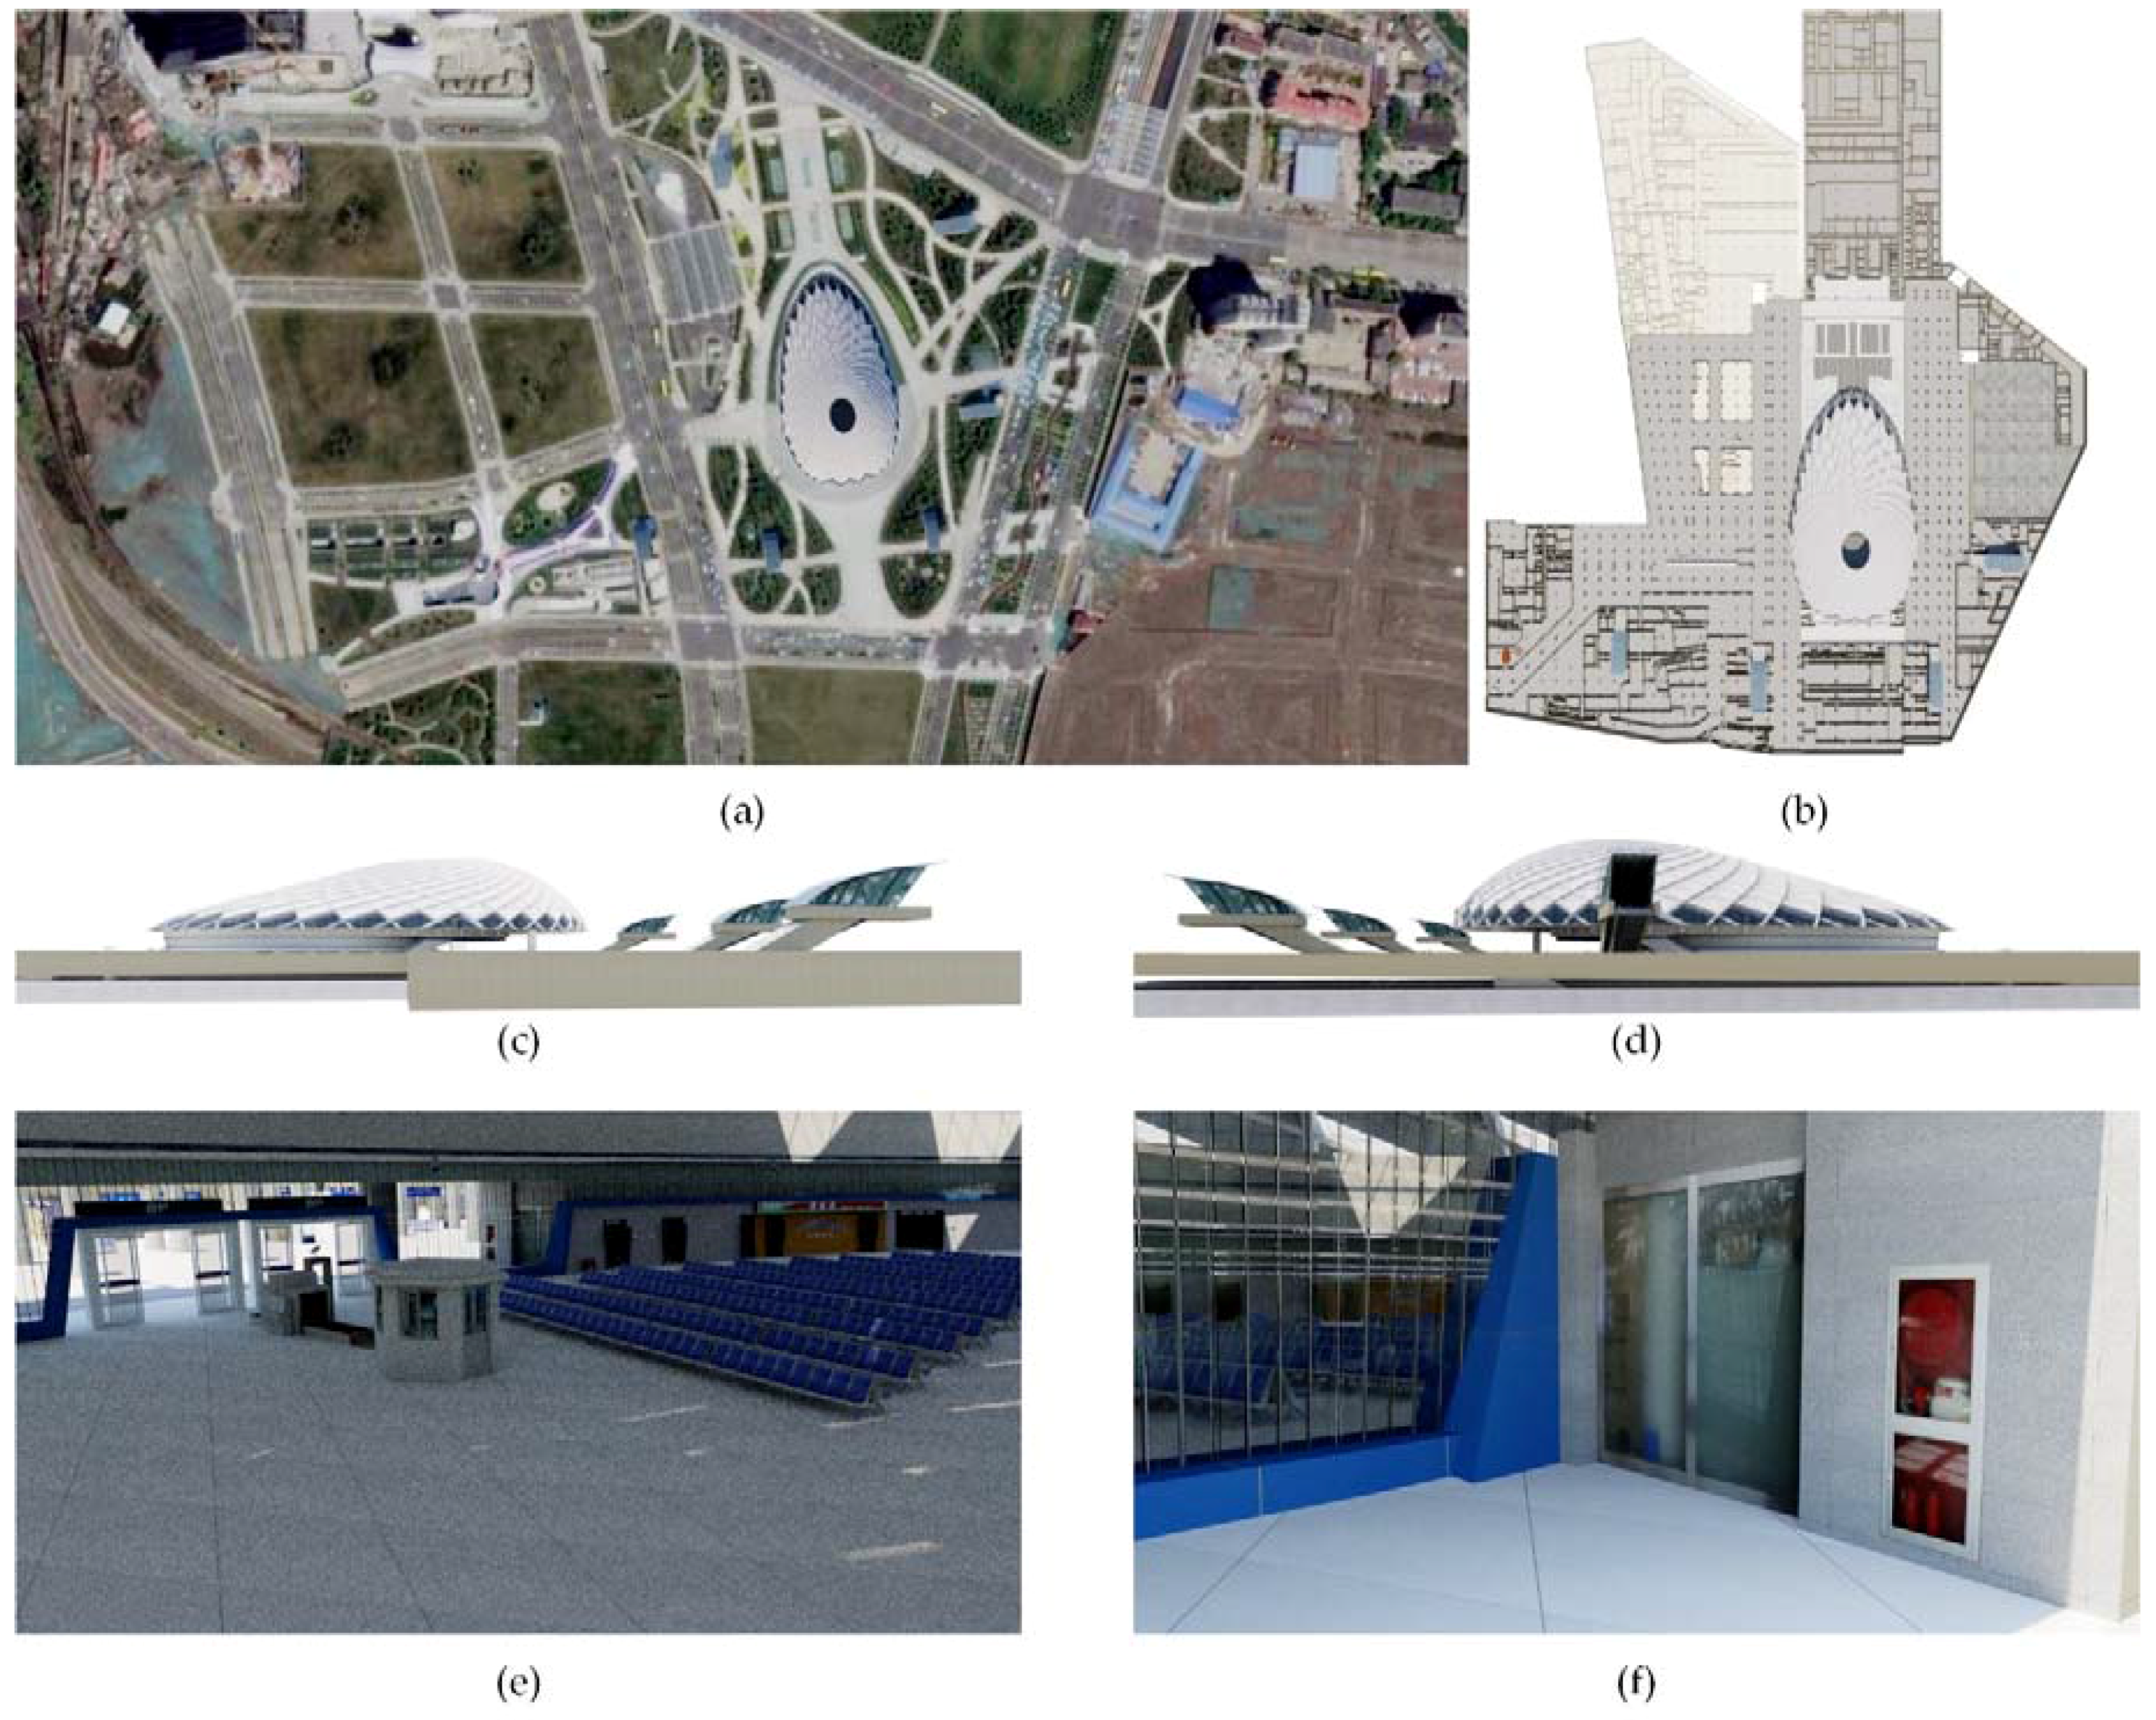
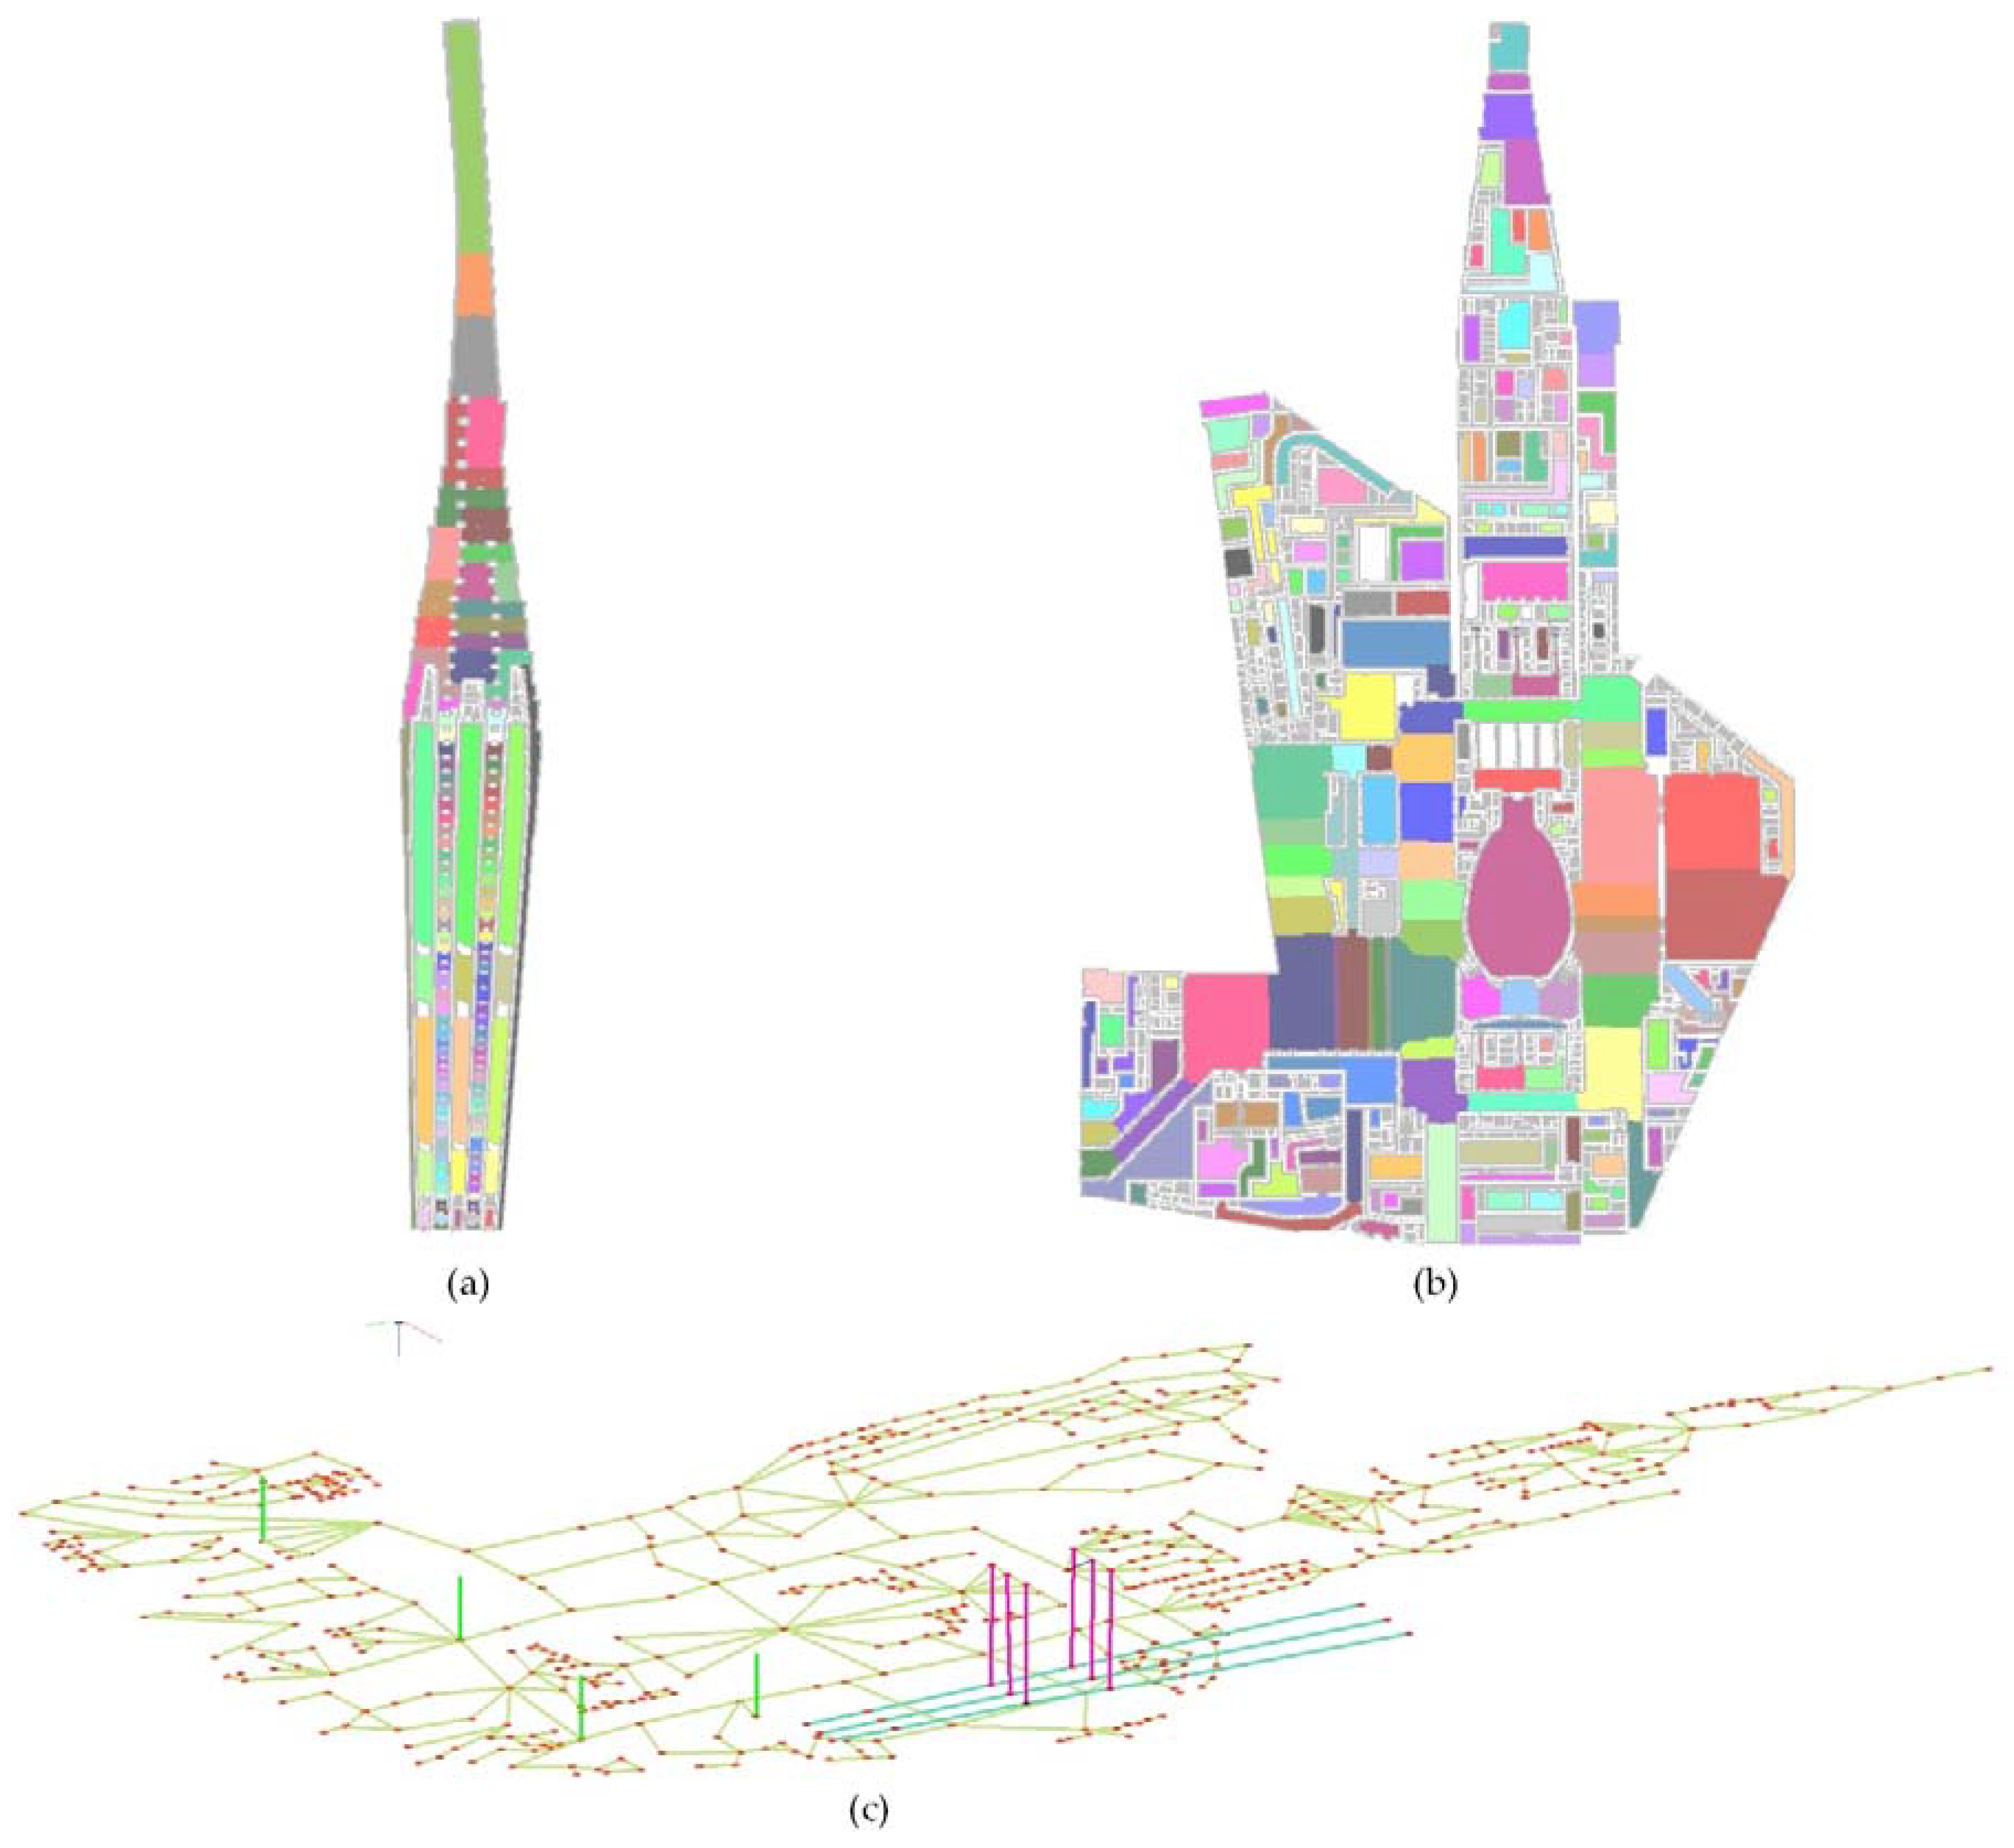
The experimental data pertain to the Yujiabao train station in Tianjin, China. As shown in Figure 9a, the station contains four exits that allow people to exit the station. Figure 9b shows the top view of the station without terrain. Figure 9c,d shows that the station is a three-floor building. Each floor has a different layout. Figure 9e,f indicates that the station has the necessary indoor building information and emergency utilities, which are the basic objects in the DIFM. These 3D views can enrich individuals’ perceptions and situation awareness of the indoor environment before they physically enter the station.
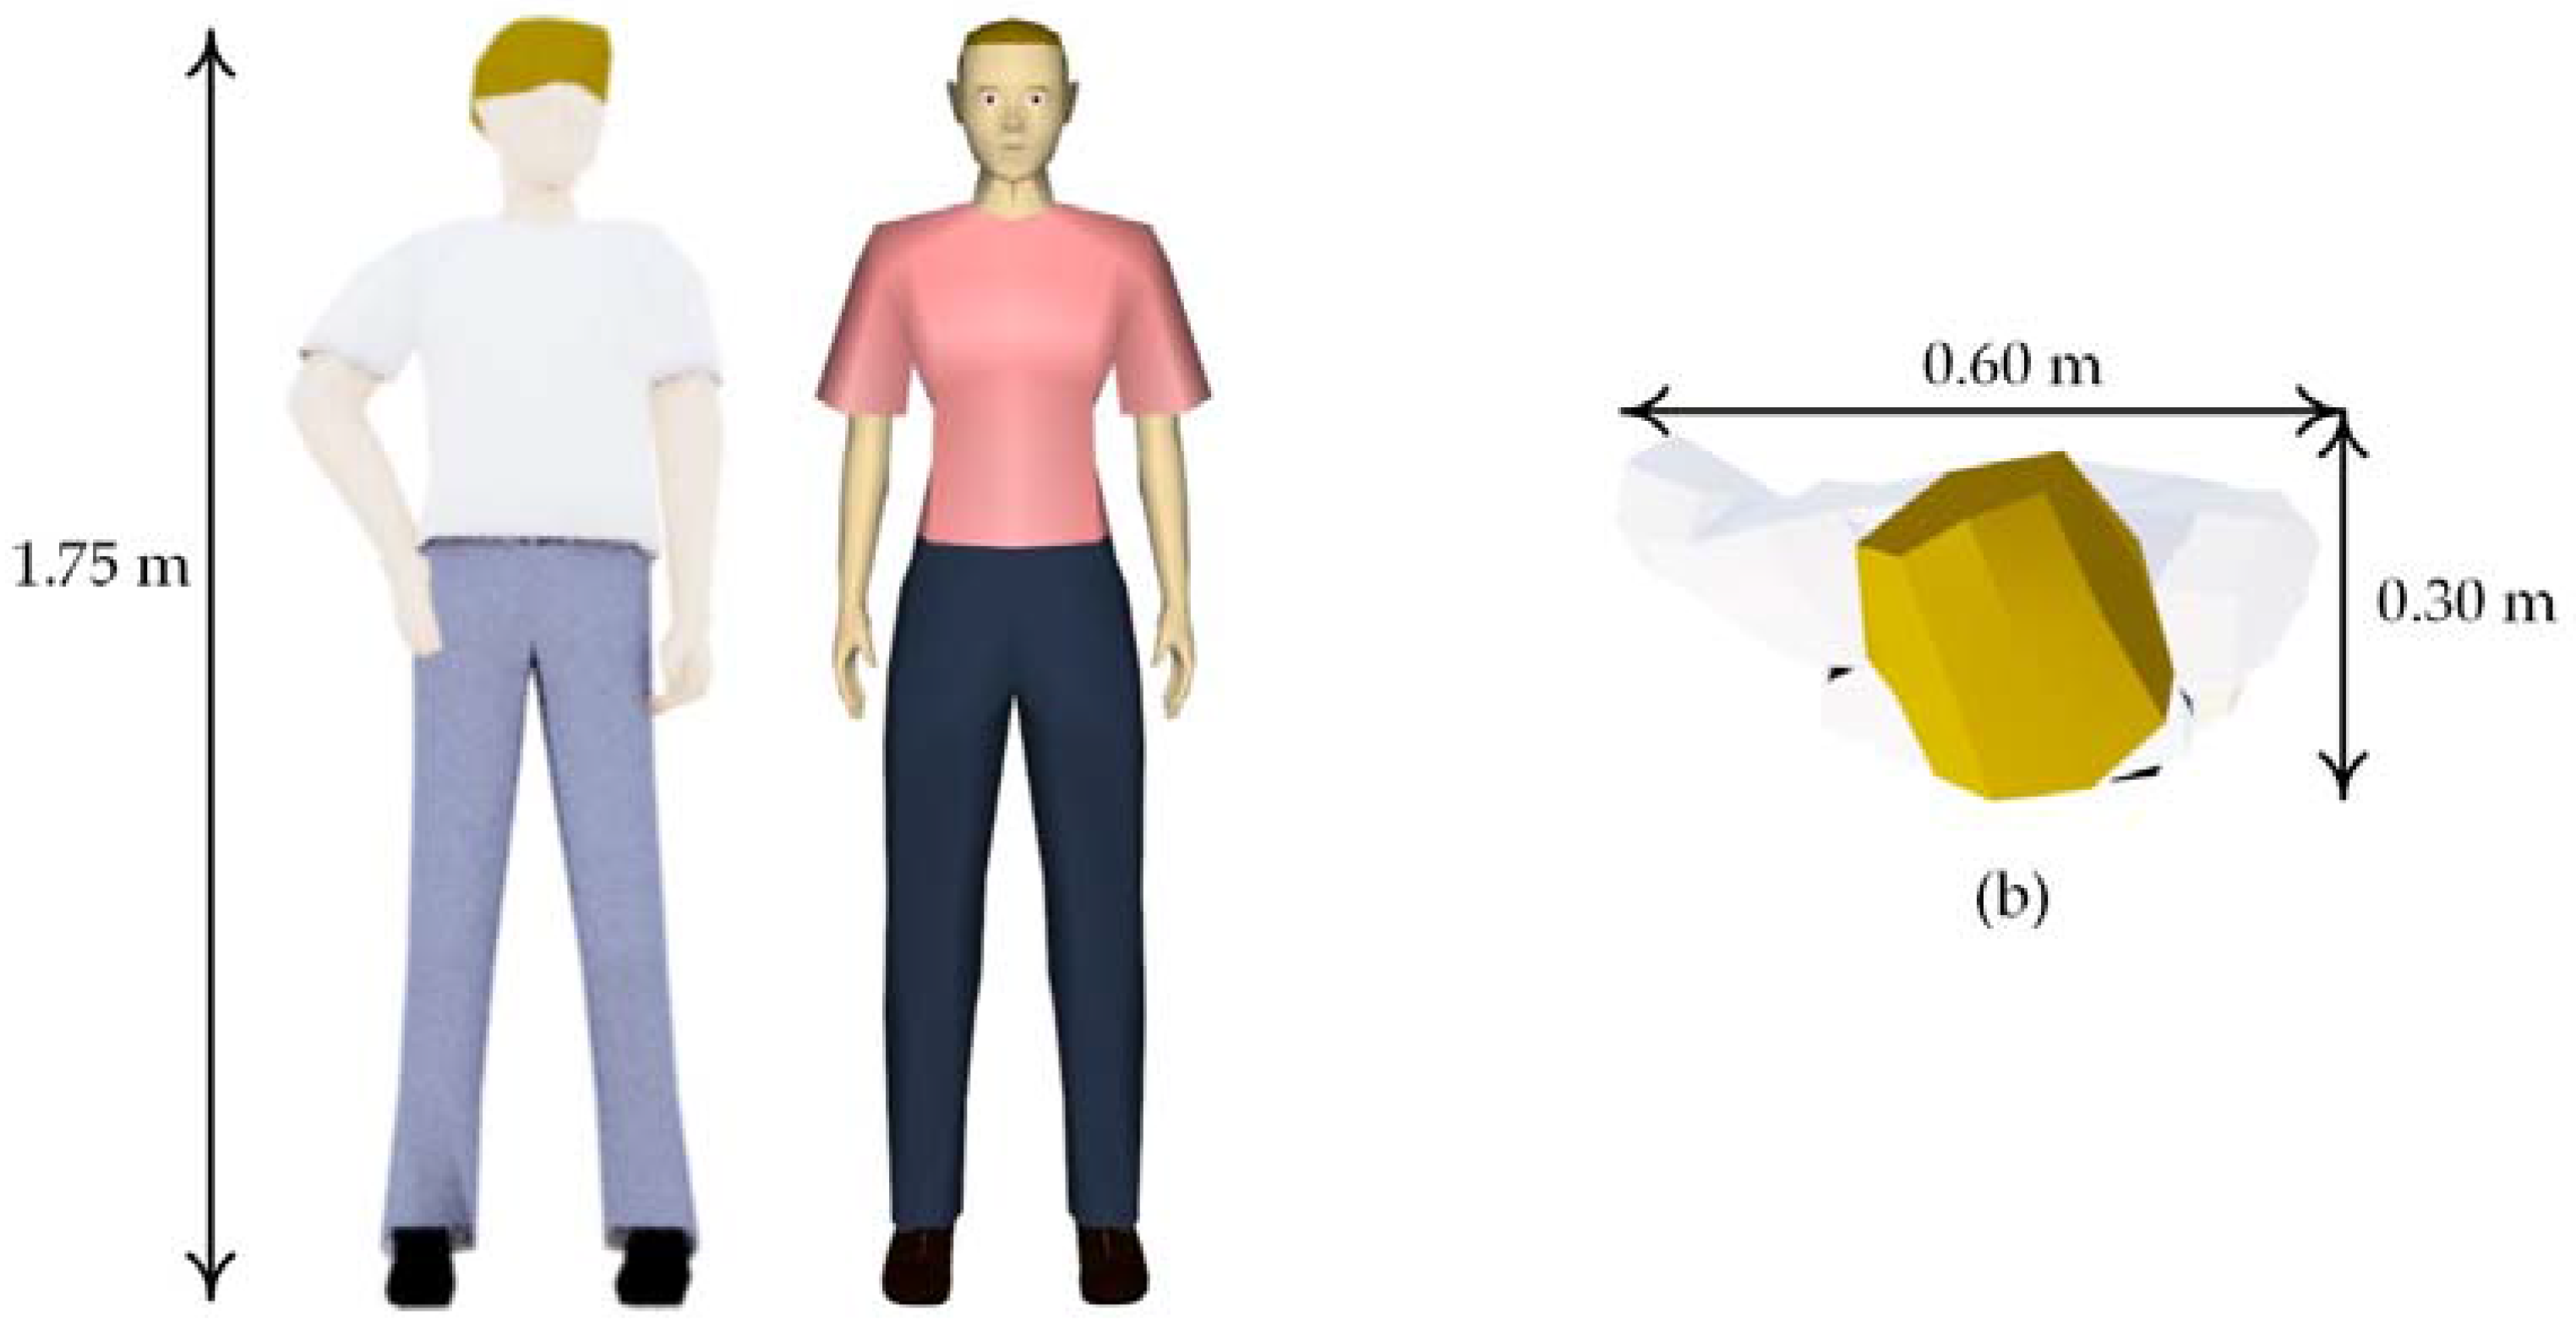
The area of the three-floor station is approximately 28,796 square meters. The station contains approximately six indoor staircases between floors and four staircases connected to the outdoors. There are also 68 doors, which comprise the main transition portals in the station; 95 fire hydrants; and 120 smoke and heat detectors, which are sources of dynamic emergency information. The daily maximal number of passengers and workers in the station is approximately 7000; thus, the simulation generated 7000 individuals with initial positions to simulate the evacuation and reflect a realistic situation as much as possible. According to a sampling survey of passengers around the station, the average height of individuals is 1.75 m (Figure 10a), and the average size of individuals is 0.60 m × 0.30 m (Figure 10b). According to the size of individuals, the grid unit size is set as 0.60 × 0.30 m × 0.2 m. The 0.60 m × 0.30 m is the projected size of individual on X-Y plane, and 0.2 m is the minimum height of sensors. With this setting, the grid unit can distinguish the individuals and sensors in indoor. The fire source was assumed to be located in a corner of a utility room on Floor 2. The fire spread information was set to 3.0 m/s according to the spatial size of the station. The pre-movement time was set to 60 s for individuals on Floor 2 (where the fire started), 70 s for individuals on Floor 3 (where the smoke spread), and 80 s for Floor 1 according to data related to individual pre-movement times [61].
5.3. Simulation and Analysis
Prior to the simulation, the system built an emergency grid for an evacuation. The emergency grid consists of 3D continuous grid meshes that are walkable for individuals. As shown in the horizontal green mesh in Figure 11a, the emergency grid reflects horizontal spatial navigable information around key portals on each floor. Analogously, the emergency grid presents vertical spatial navigable information around key portals between floors or key exits between indoors and outdoors, as shown by the green gradient mesh in Figure 11b. The emergency grid indicates the available area and dangerous area by calculating the weight of each grid as described in Section 4.2. During an evacuation, congestion and stagnation may occur around doors, staircases, and exits. The emergency grid can also provide the ability to shunt the crowd around these events, as mentioned in Section 4.3. Note that a potential safe route for individuals must detour around the fire-affected area, which has a negative grid weight.
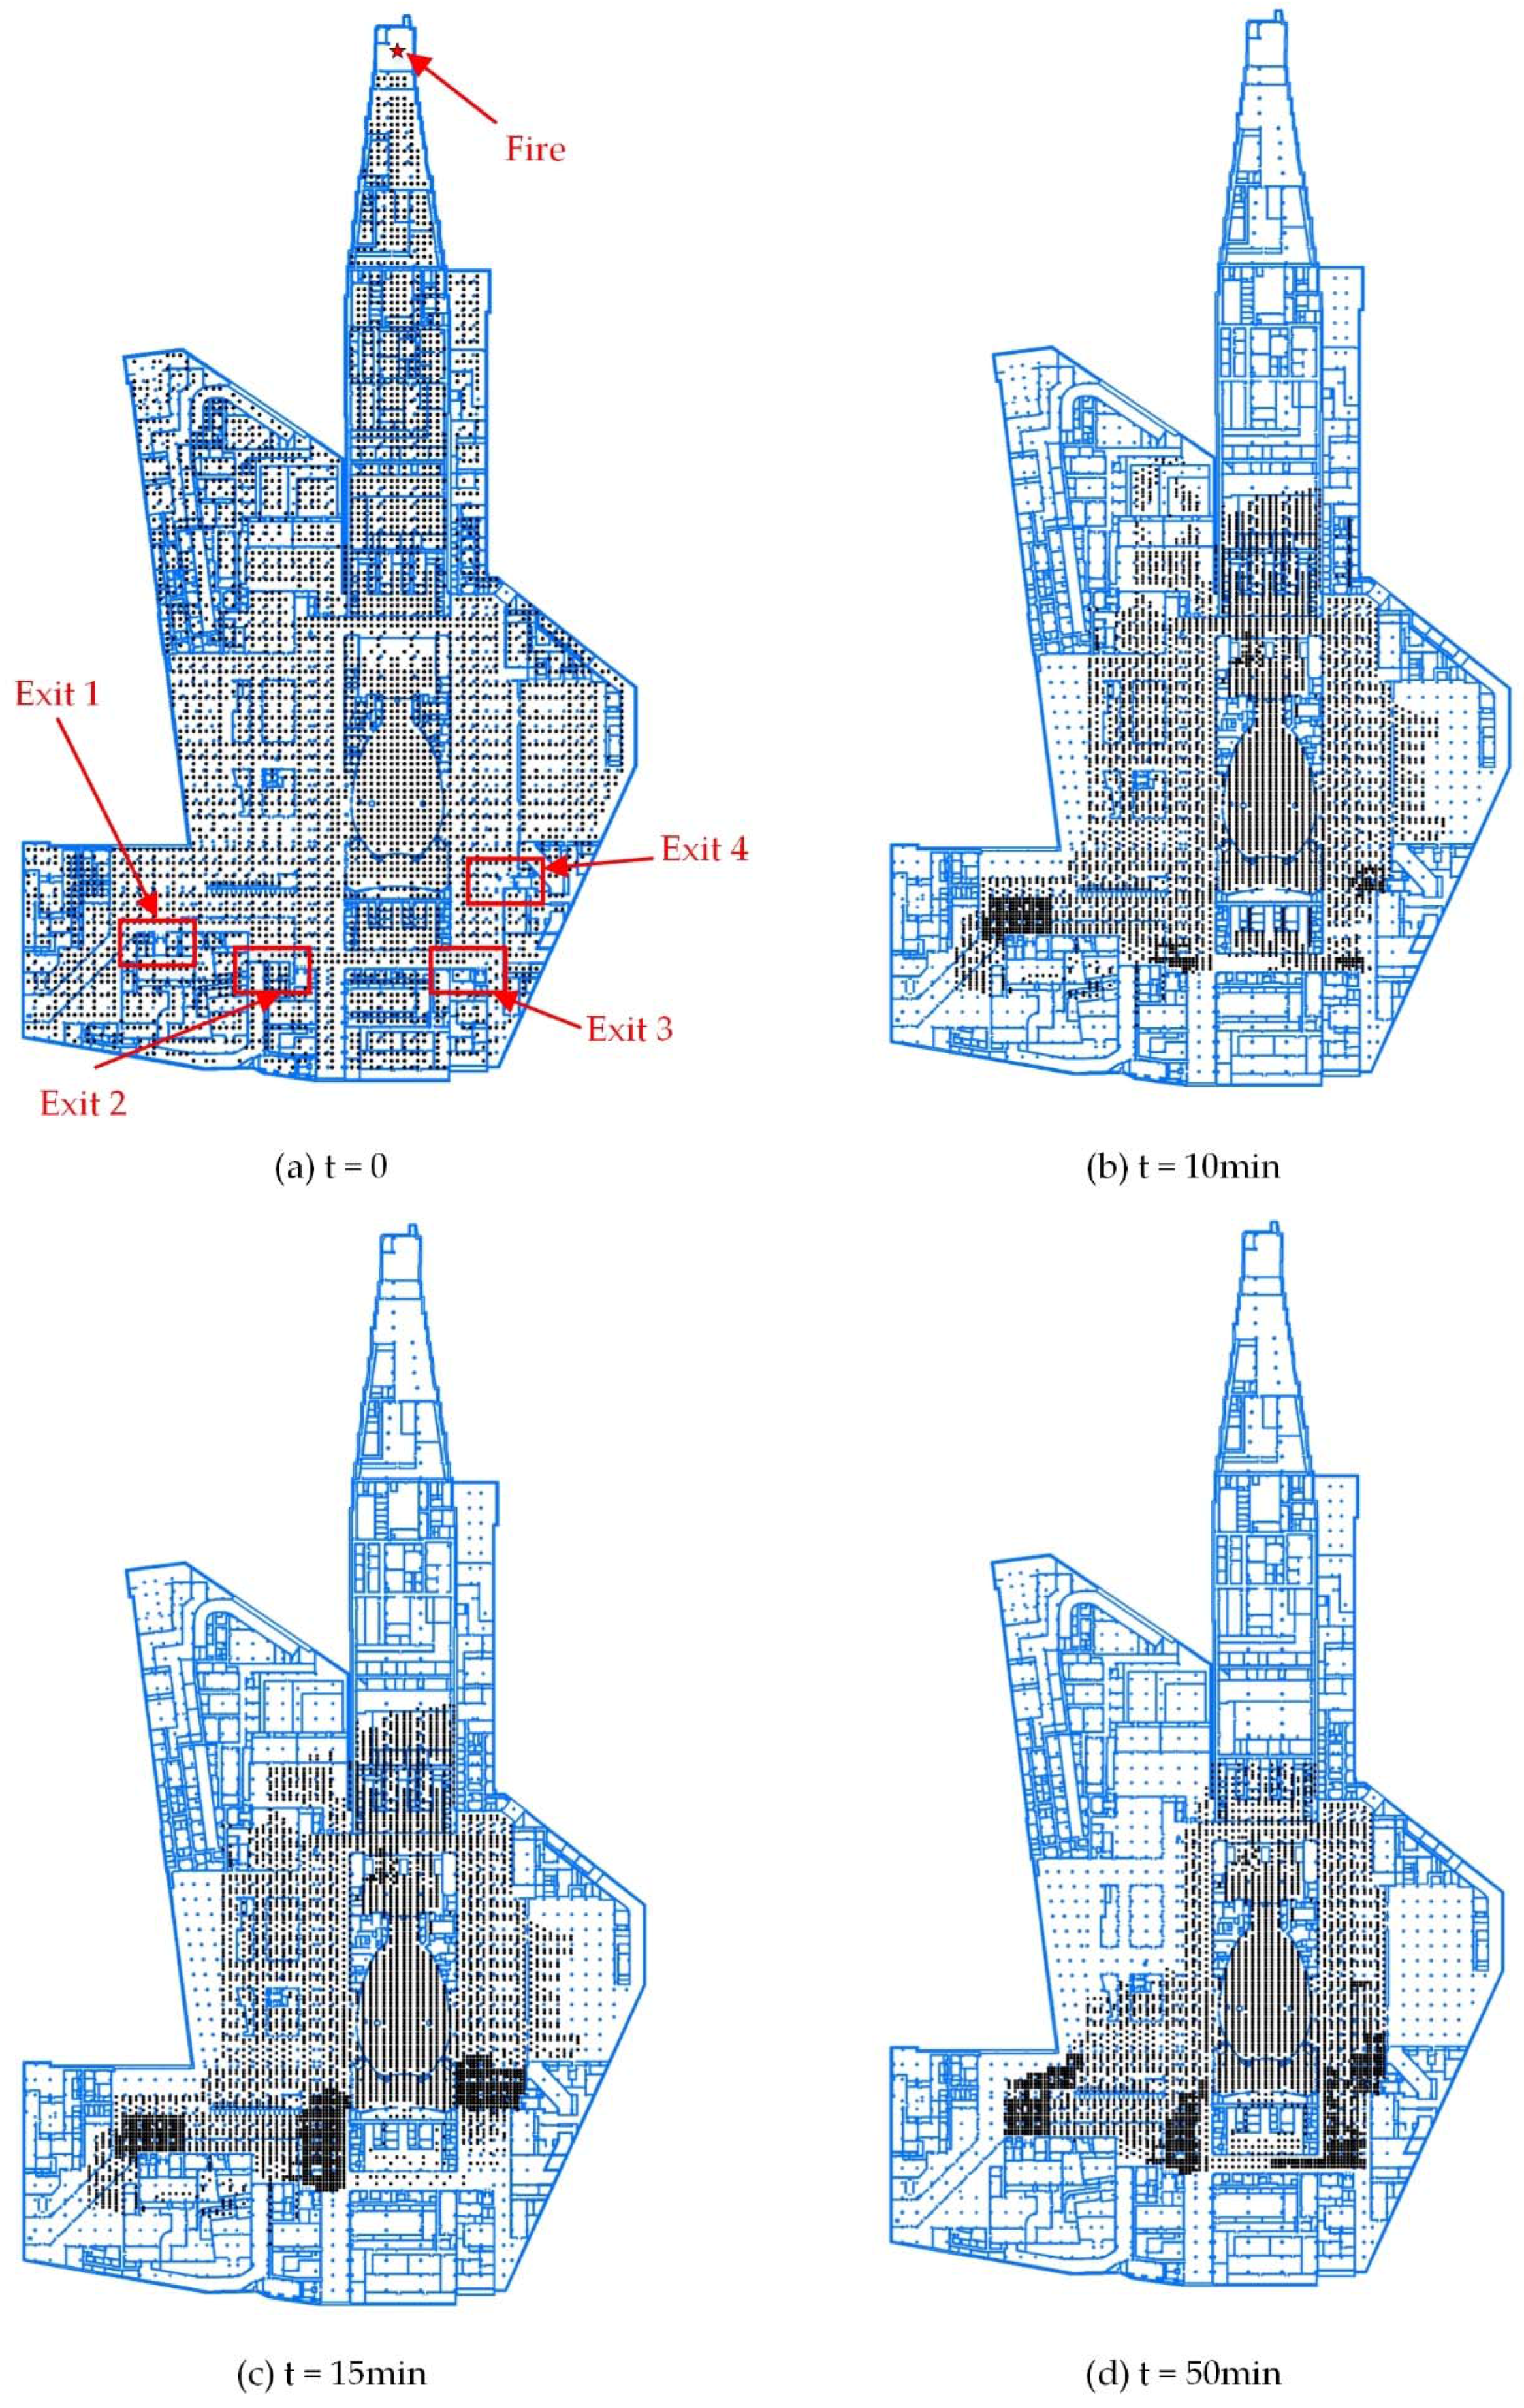
During the simulation, the system recorded the movement of each individual and statistical information for every exit. Figure 12 shows the process of congestion and re-routing during evacuation. As shown in Figure 12a, at the beginning of the evacuation simulation, the evacuees are placed manually in grids around the indoor environment, and the fire is placed at a corner of a utility room on Floor 2.
As shown in Figure 12b, the number of evacuees around Exits 1, 2, 3, and 4 begins to increase, which will decrease the evacuation speed. As shown in Figure 12c, because Exit 3 is located in the lower right corner of Floor 2 between and beyond Exits 2 and 4, the evacuees will first choose Exits 2 and 4 and rapidly cause the underutilization of Exit 3. Congestion occurs around Exits 1, 2, and 4. As shown in Figure 12d, as evacuation progressed, the evacuees around Exits 1, 2, and 4 began to reroute to Exit 3 to avoid congestion.
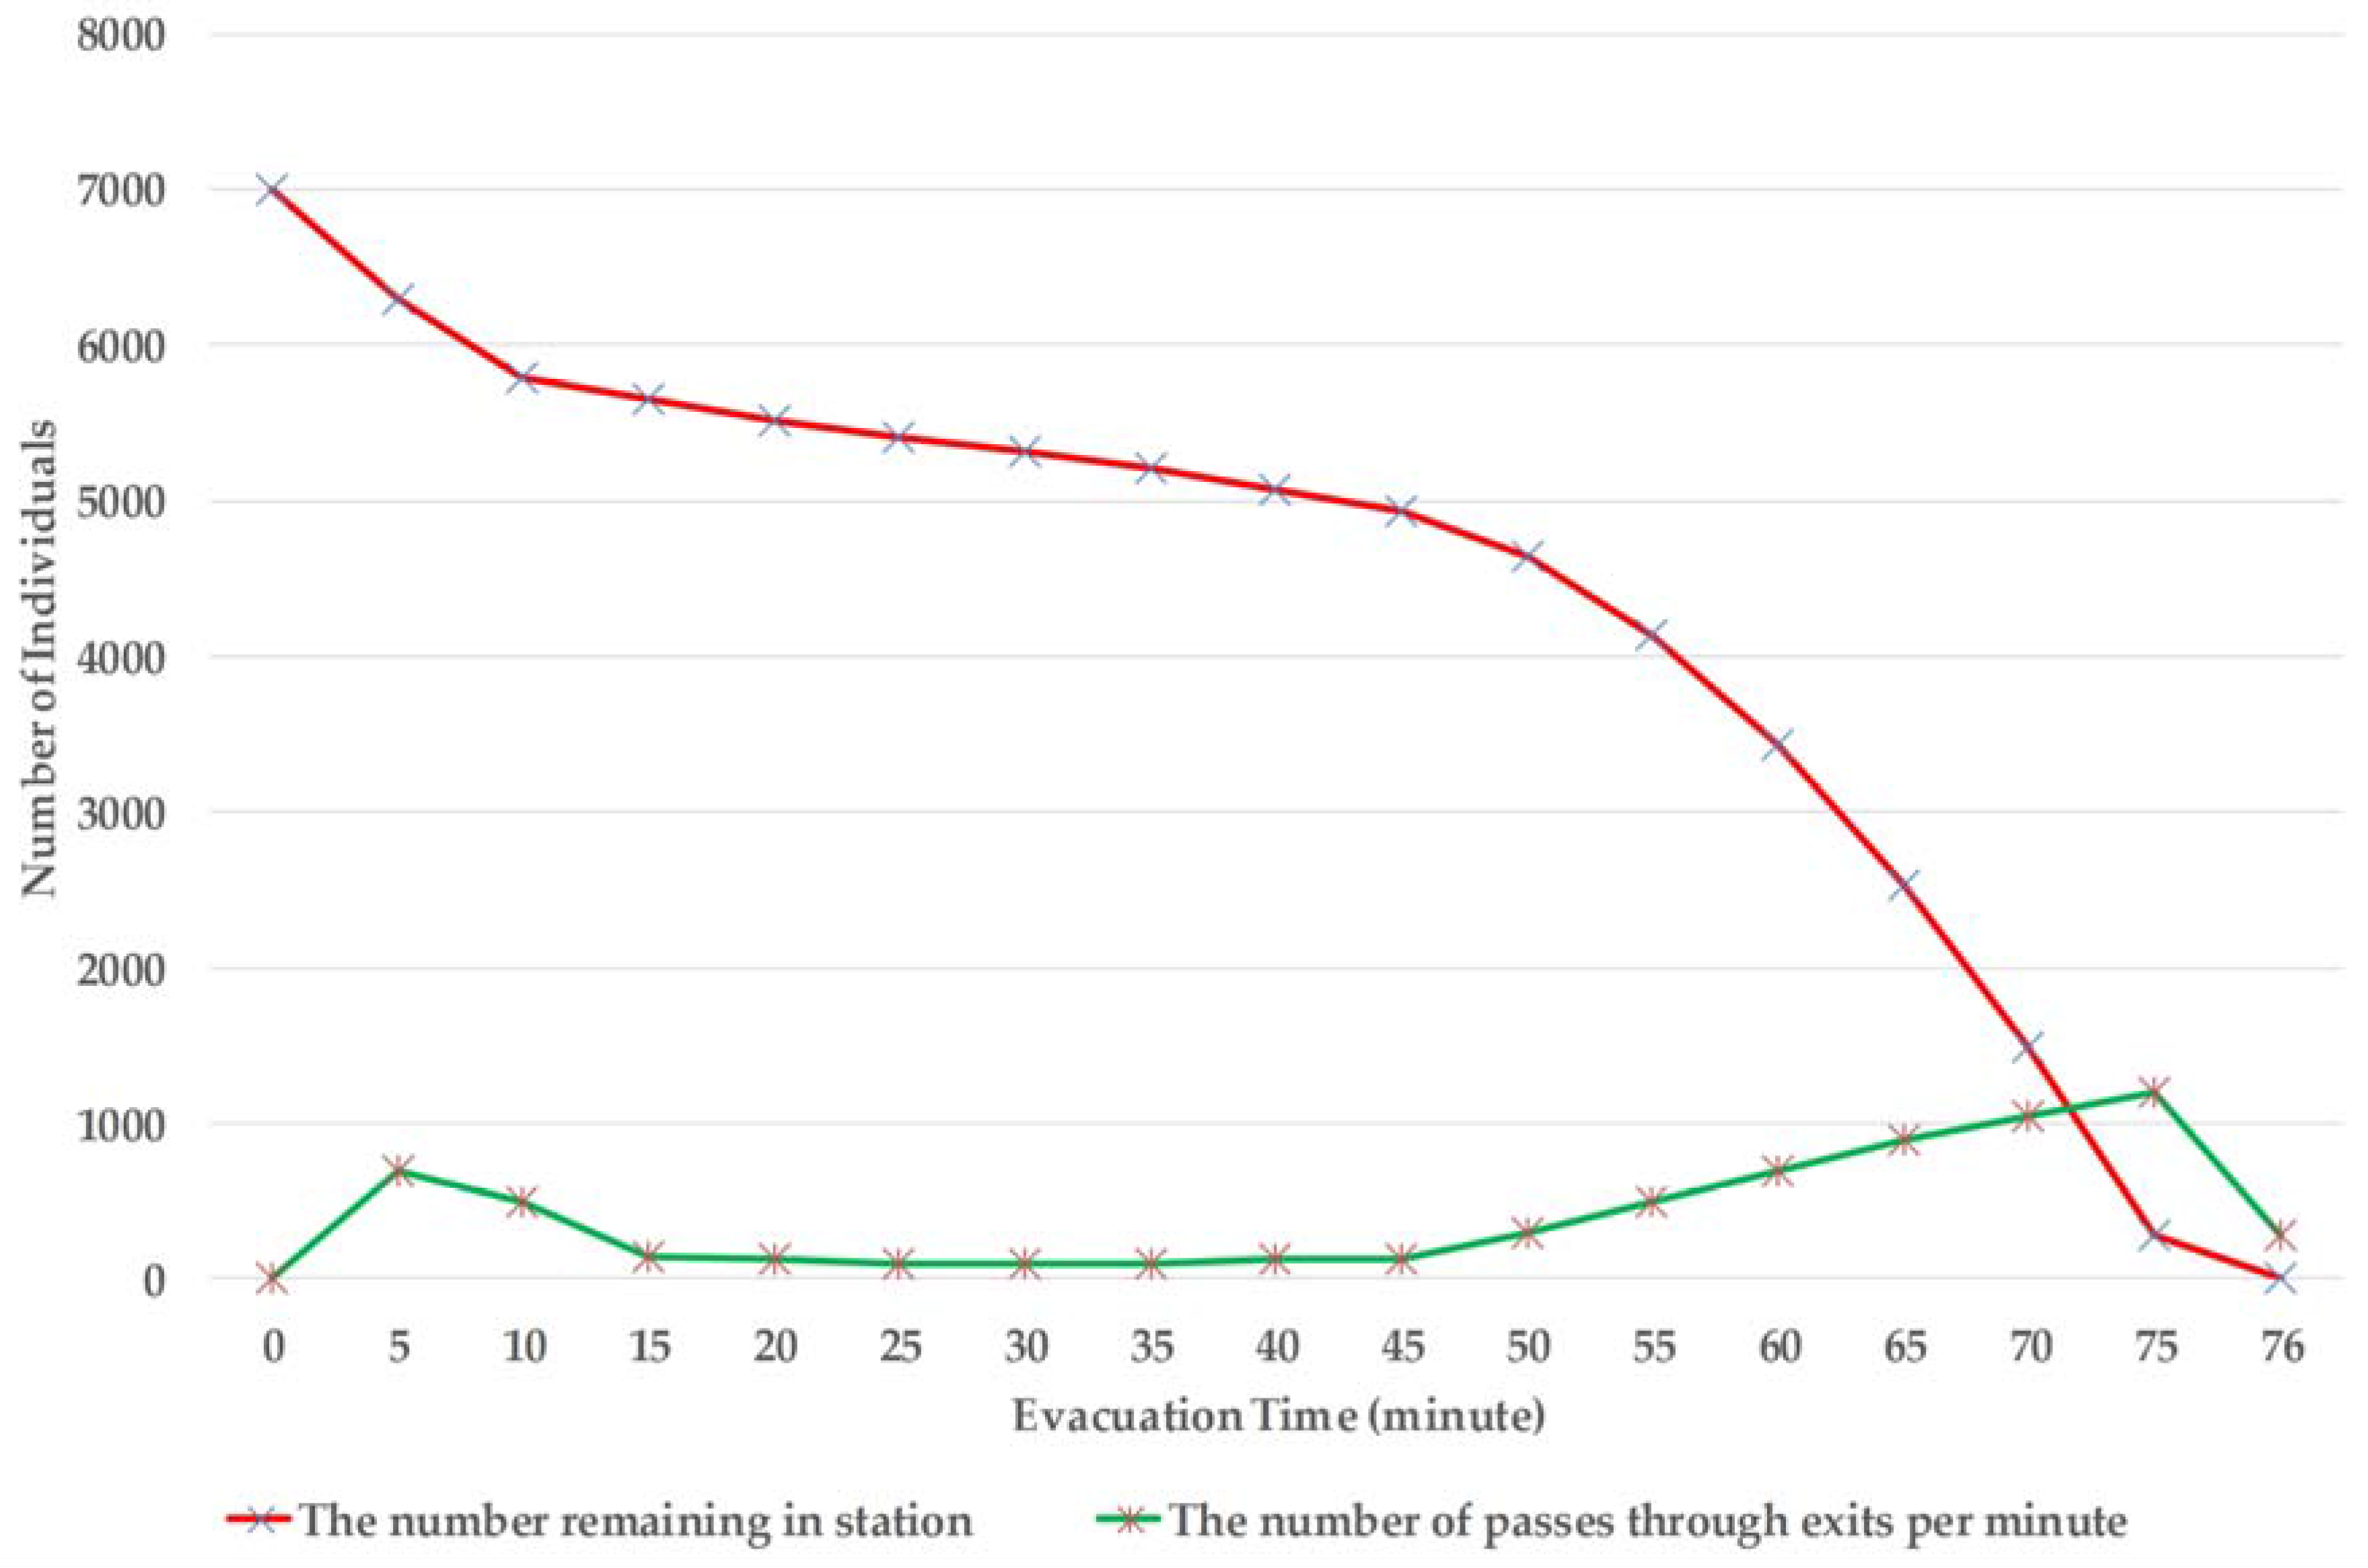
The statistical information collected during the evacuation is summarized in Figure 13. The remaining number of individuals is defined according to the time at which the last individual exits the station. The emergency response time is the total evacuation time of the building because all individuals had to leave the station via the four exits mentioned in Section 5.2. Evacuations of the three floors are parallel, and the evacuation time is primarily dependent on the spatial distribution; dynamic elements, such as the fire-affected distribution; and routing strategy. The potential congestion and stagnation around the key portals and exits may cause long delays in entering a staircase or exiting the building. As shown in Figure 13, from 10 min to 45 min after the fire started, the evacuation speed and pass speed significantly decreased because of congestion or stagnation.
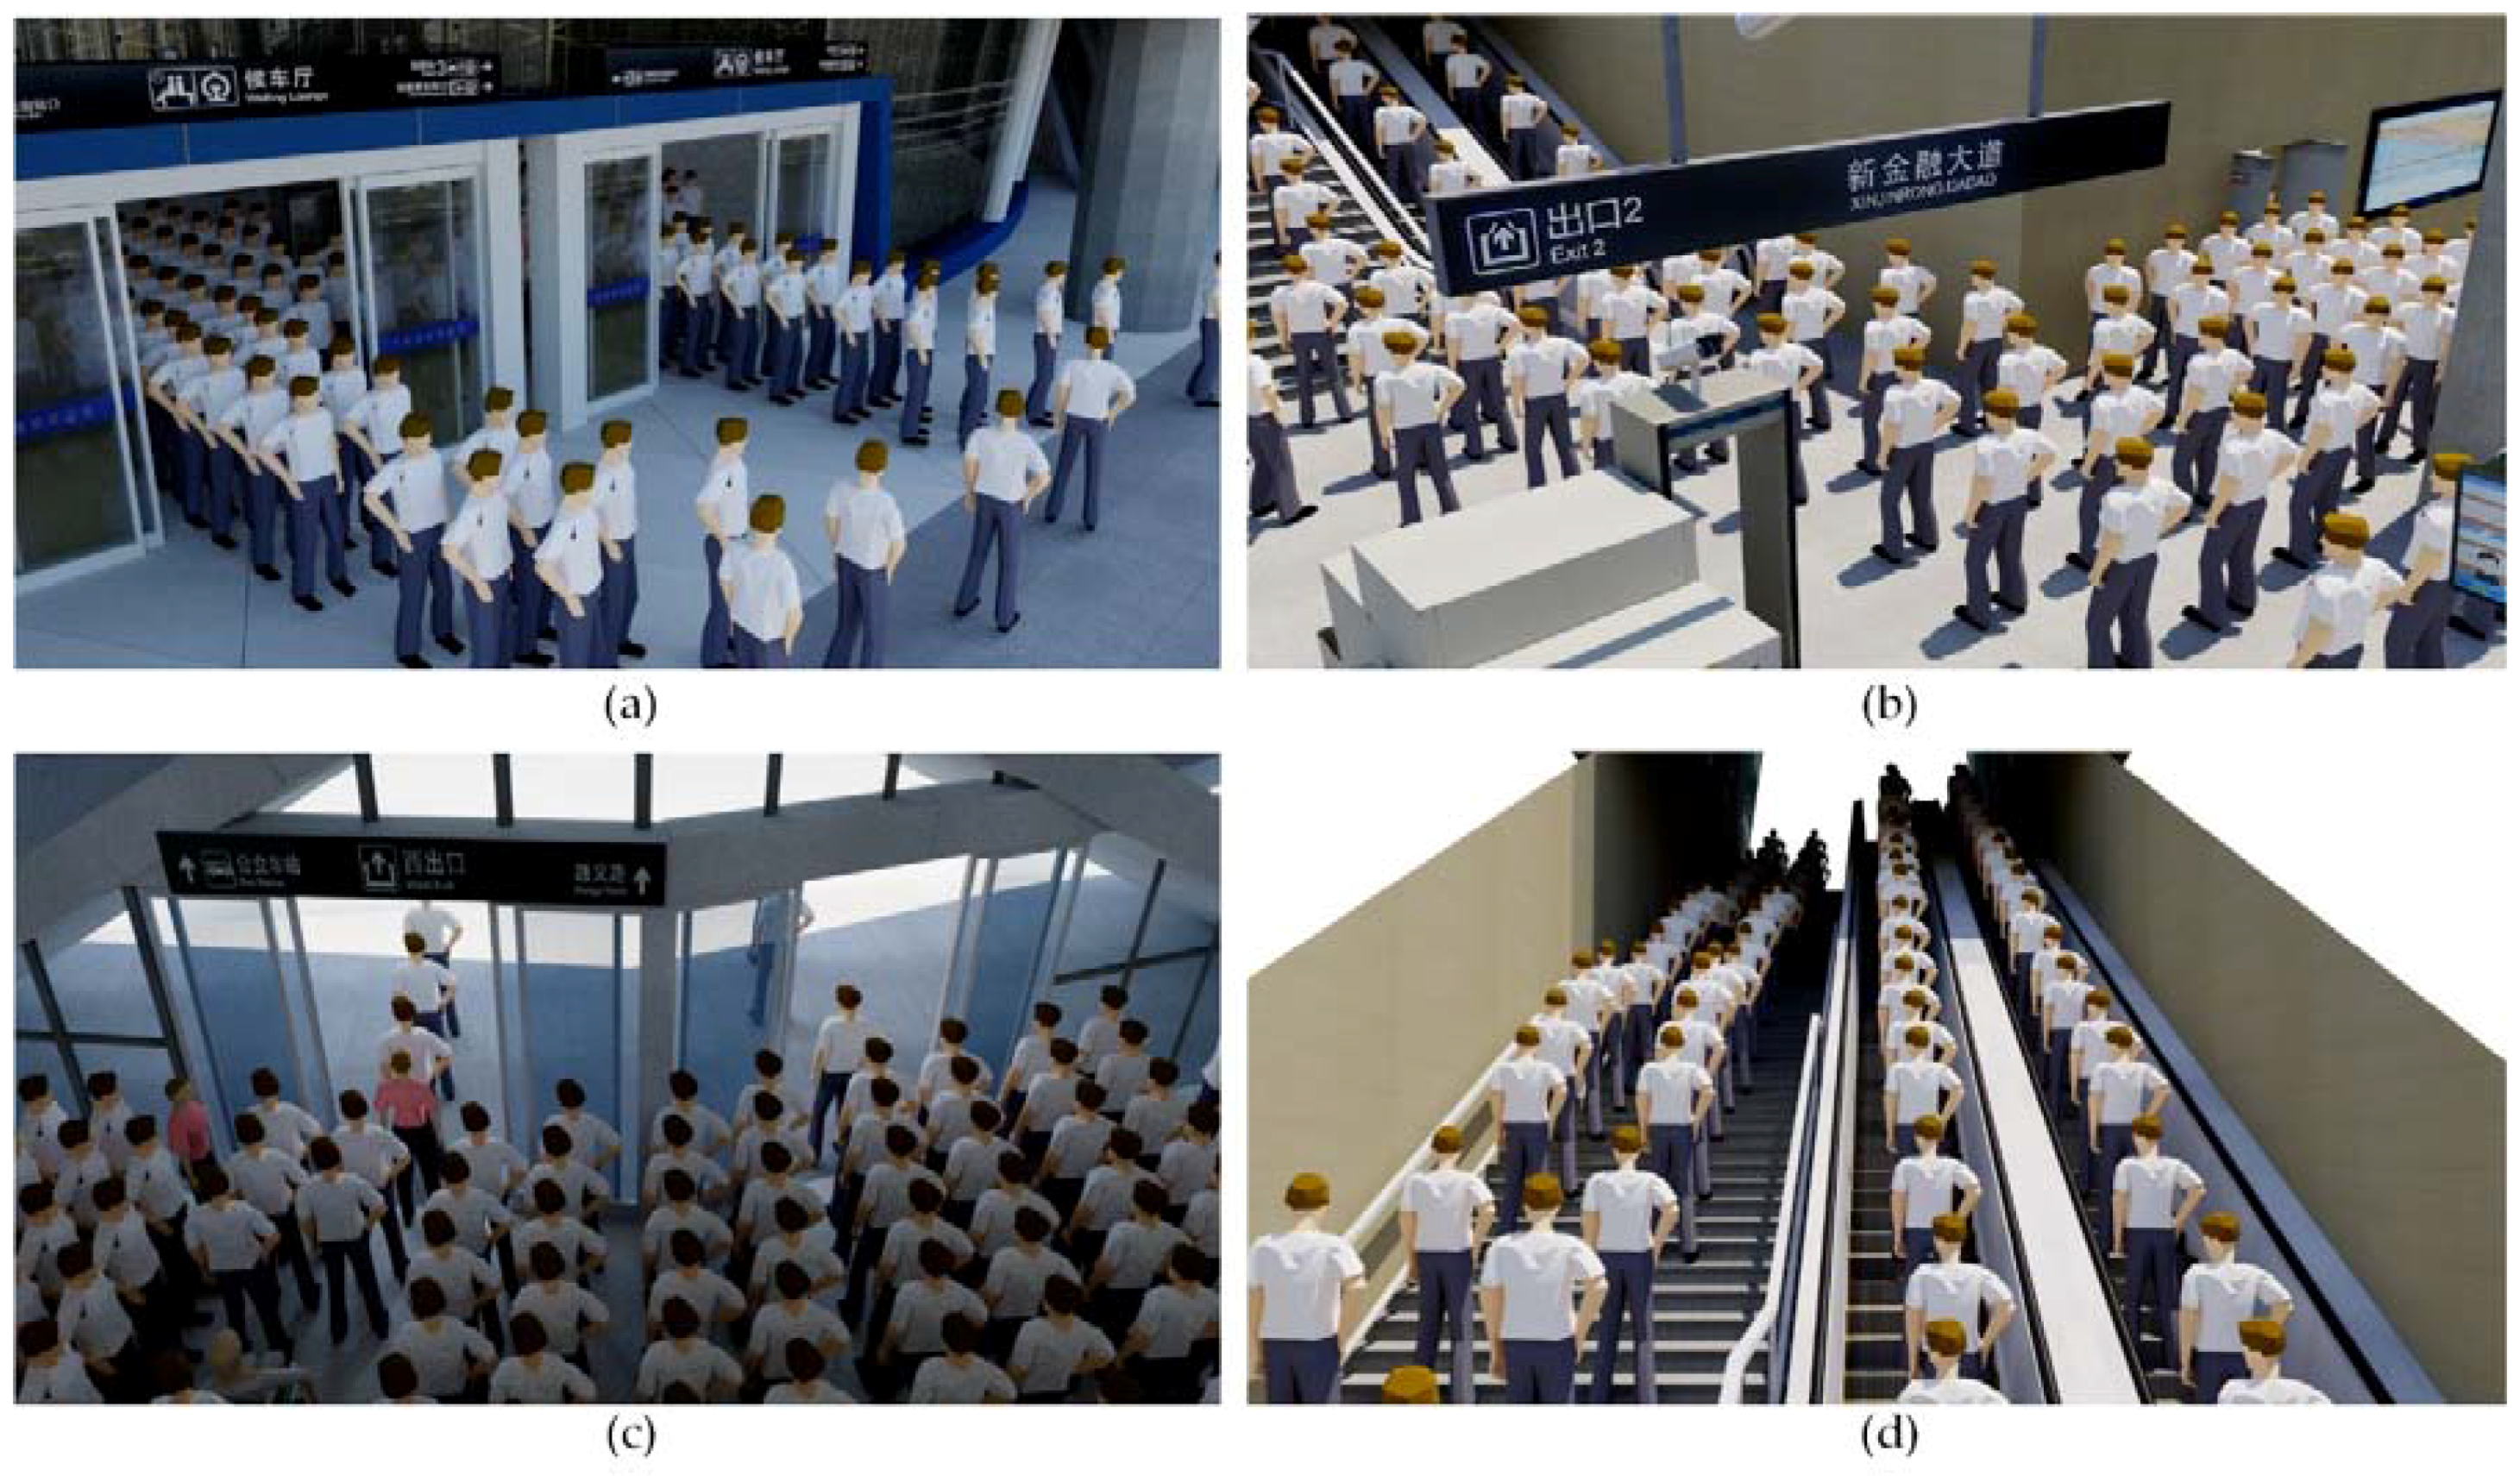
The evacuation simulation required 76 min. As the fire grew, the spatial analysis plug-ins constructed a detailed evacuation route for each individual and avoided potential congestion resulting from affected individuals becoming trapped around doors or exits. The capability of the simulation can be observed by 3D visualization. Congestion occurred around the key regions where crowds must pass in different directions and converge, such as exits or portals near exits. Figure 14 shows the congestion around key portals and exits in the station when individuals were moving outdoors. Figure 14a,c reveal that the adjacent portals can realize self-shunting despite the width of the doors, which enable only 1–2 people to pass. Figure 14b,d demonstrates that congestion occurs readily around vertical spaces because the pass speed in a staircase is lower than that in the horizontal space. Figure 14 shows the macro level to simulate the evacuation at building or floor level, which uses the gird set to analyze the potential congestion. The availability of dynamic features calculated based on an indoor building and dynamic setting can enable the visualization of this analysis or predict information in real time using the proposed model, which would enhance decision-making. Furthermore, the proposed model and evacuation simulation method can provide a micro level to simulate the behavior during evacuation in individual aspects, such as navigation or re-routing.
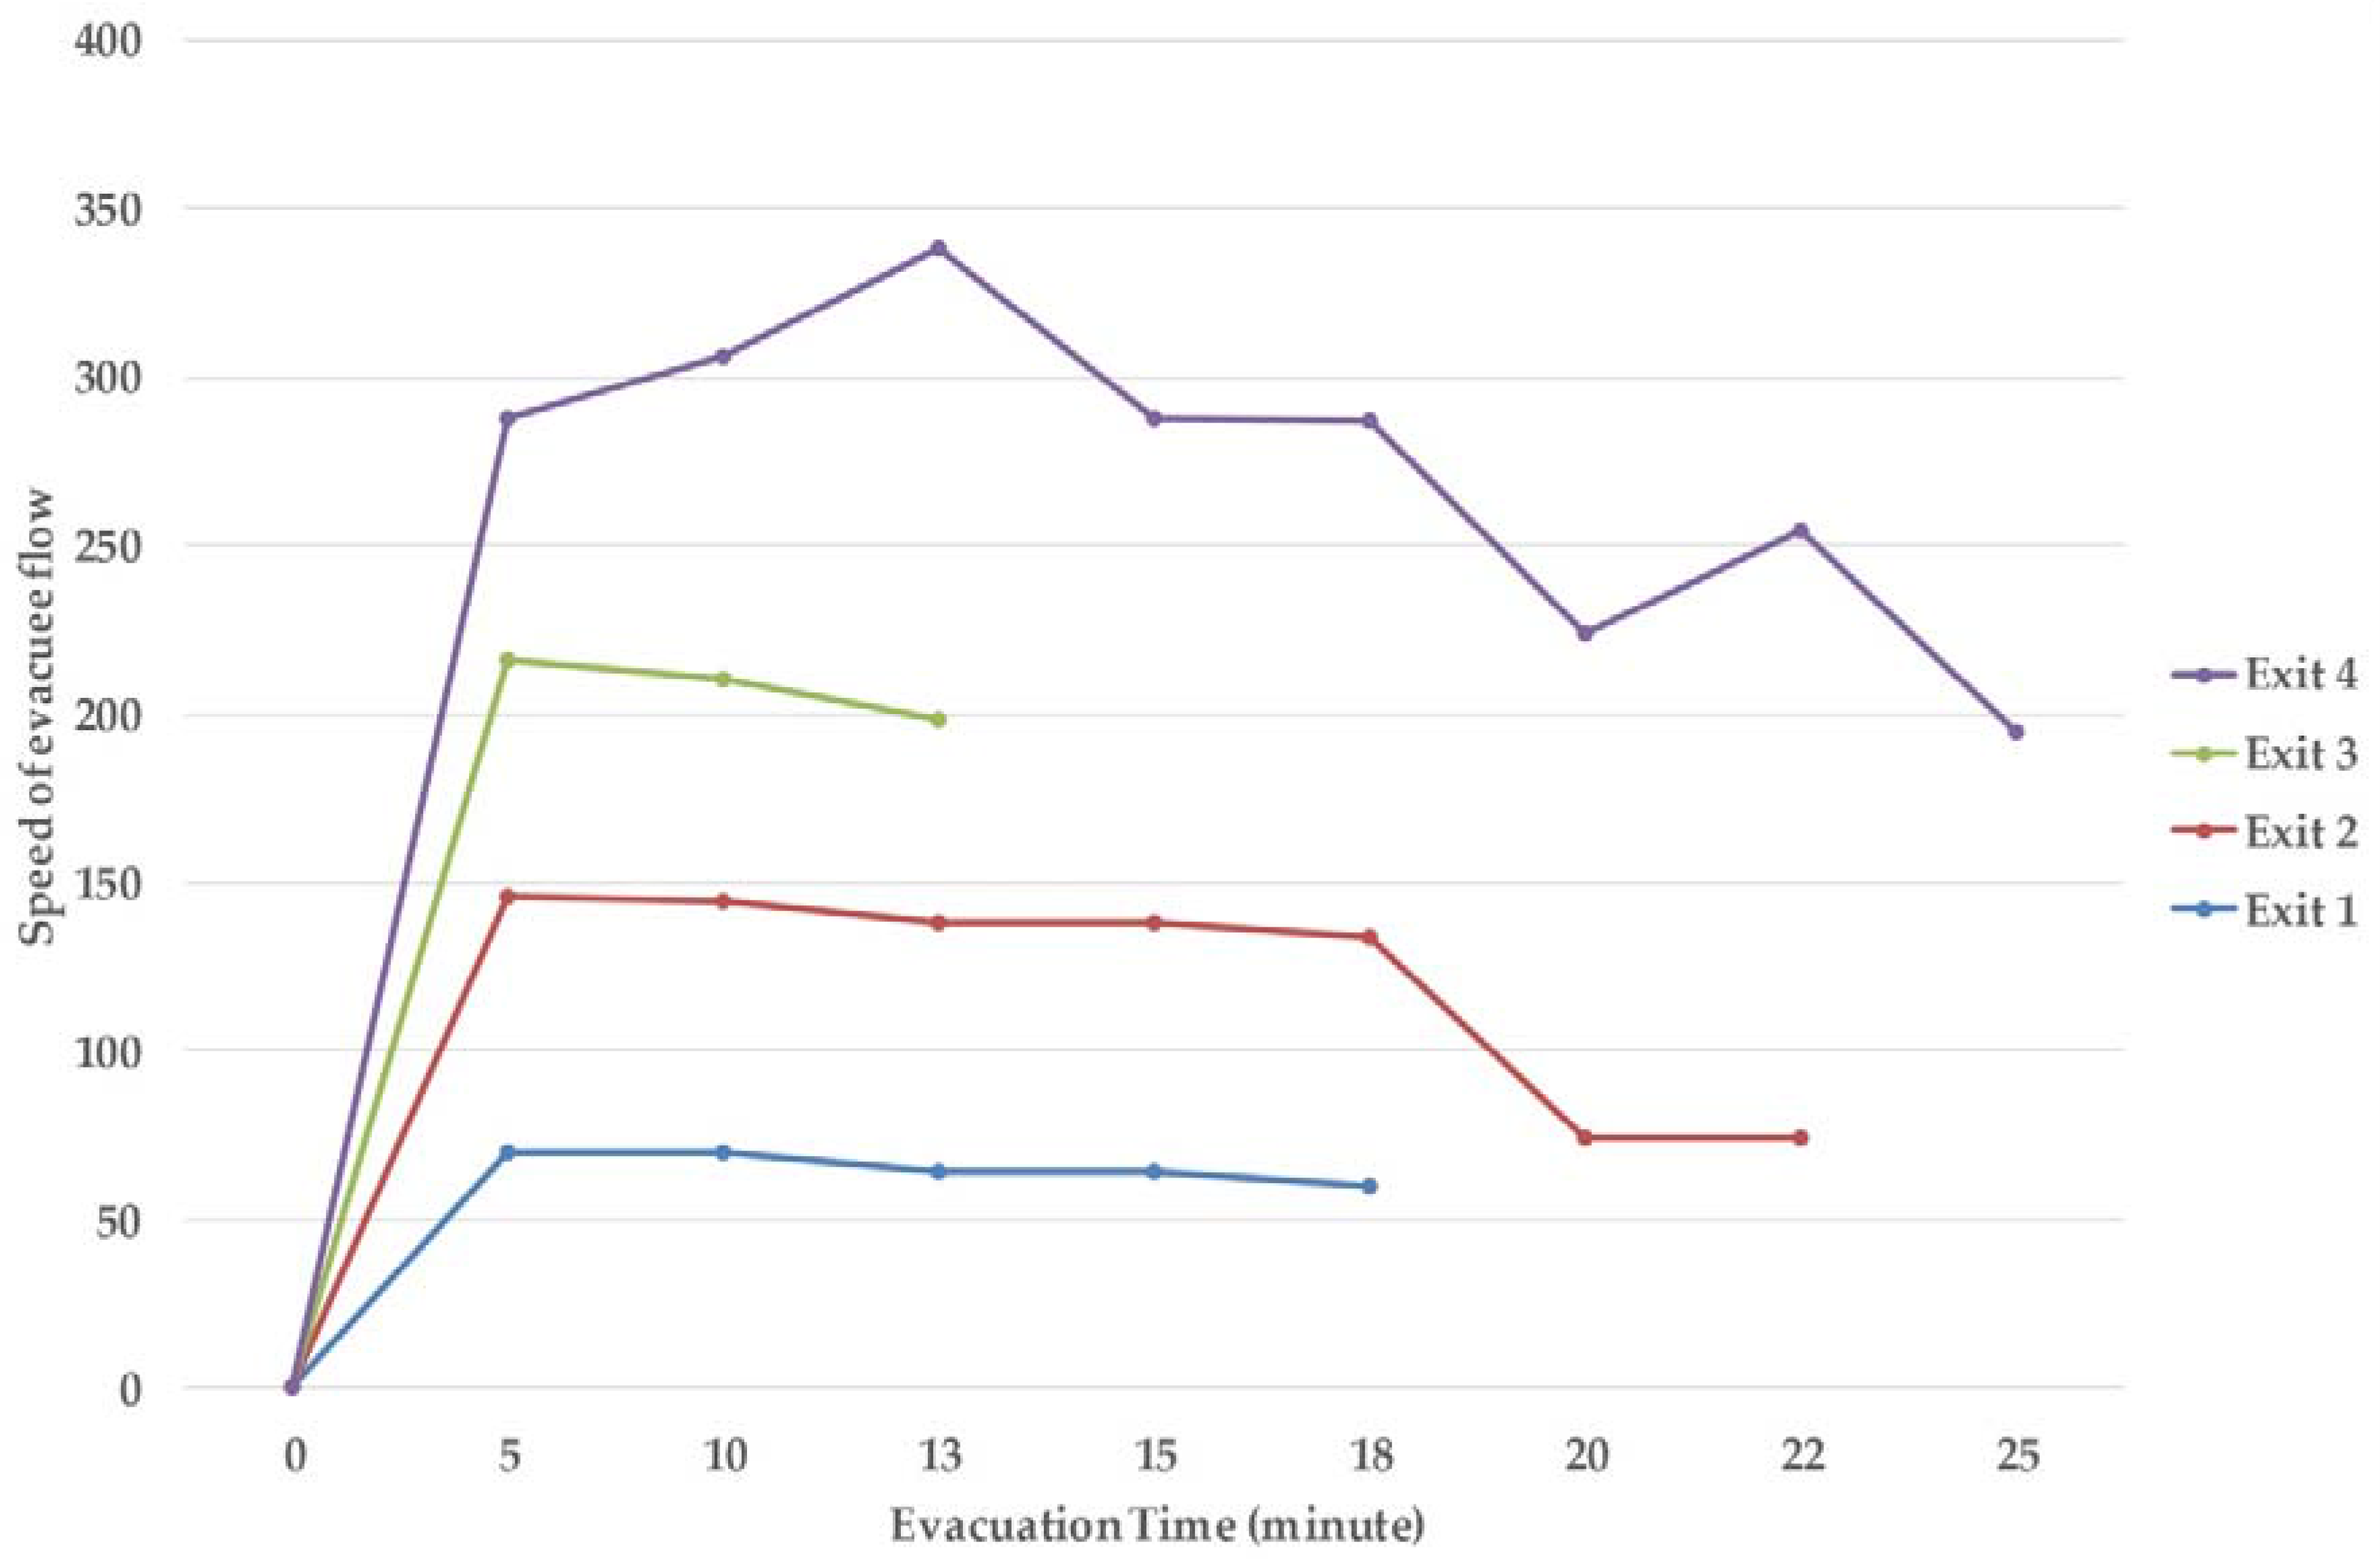
To compare the statistical information for each exit, a counter was placed at each exit of the station to count the individuals who passed over time. The gathered data are illustrated as a function of the elapsed time in Figure 15. Each exit can achieve an evacuation flow of approximately 35 individuals per minute. However, noticeable congestion occurred around Exits 1, 2, and 4 within the next 30 min as the flow clustered within approximately 5 min because all individuals were assigned a route to his or her nearest exit. Because the four exits have the same geometric size and evacuation pattern, the evacuation speed of each exit increases at the same rate before minute 10. Note that Exit 3 appeared to be substantially underutilized. According to the shunting strategy introduced in Section 4 for re-routing individuals during congestion, Exit 3 subsequently started to be utilized for the evacuation of extra individuals at Exits 1, 2, and 4. Additionally, as shown in Figure 12c, as some evacuees around Exits 1, 2, and 4 re-routed to Exit 3 after 15 min, Exit 3 started to allow the congested evacuees to pass through, which also relieved the evacuation pressure of the other three exits. This situation will produce another evacuation balance for the four exits; the evacuees are then allocated to each exit relatively, which will lead to each exit having little difference in evacuation speed after 50 min. After approximately 65 min, balanced evacuation was achieved as the remaining individuals were reassigned according to the dynamic calculation of congestion based on population density. The evacuation ended after 76 min. Figure 15 shows the total number of evacuees passing through each exit per minute. The value 0 on the vertical axis indicates stagnation (for example at 25 min for Exit 2) or complete underutilization (for example at 15 min for Exit 3).
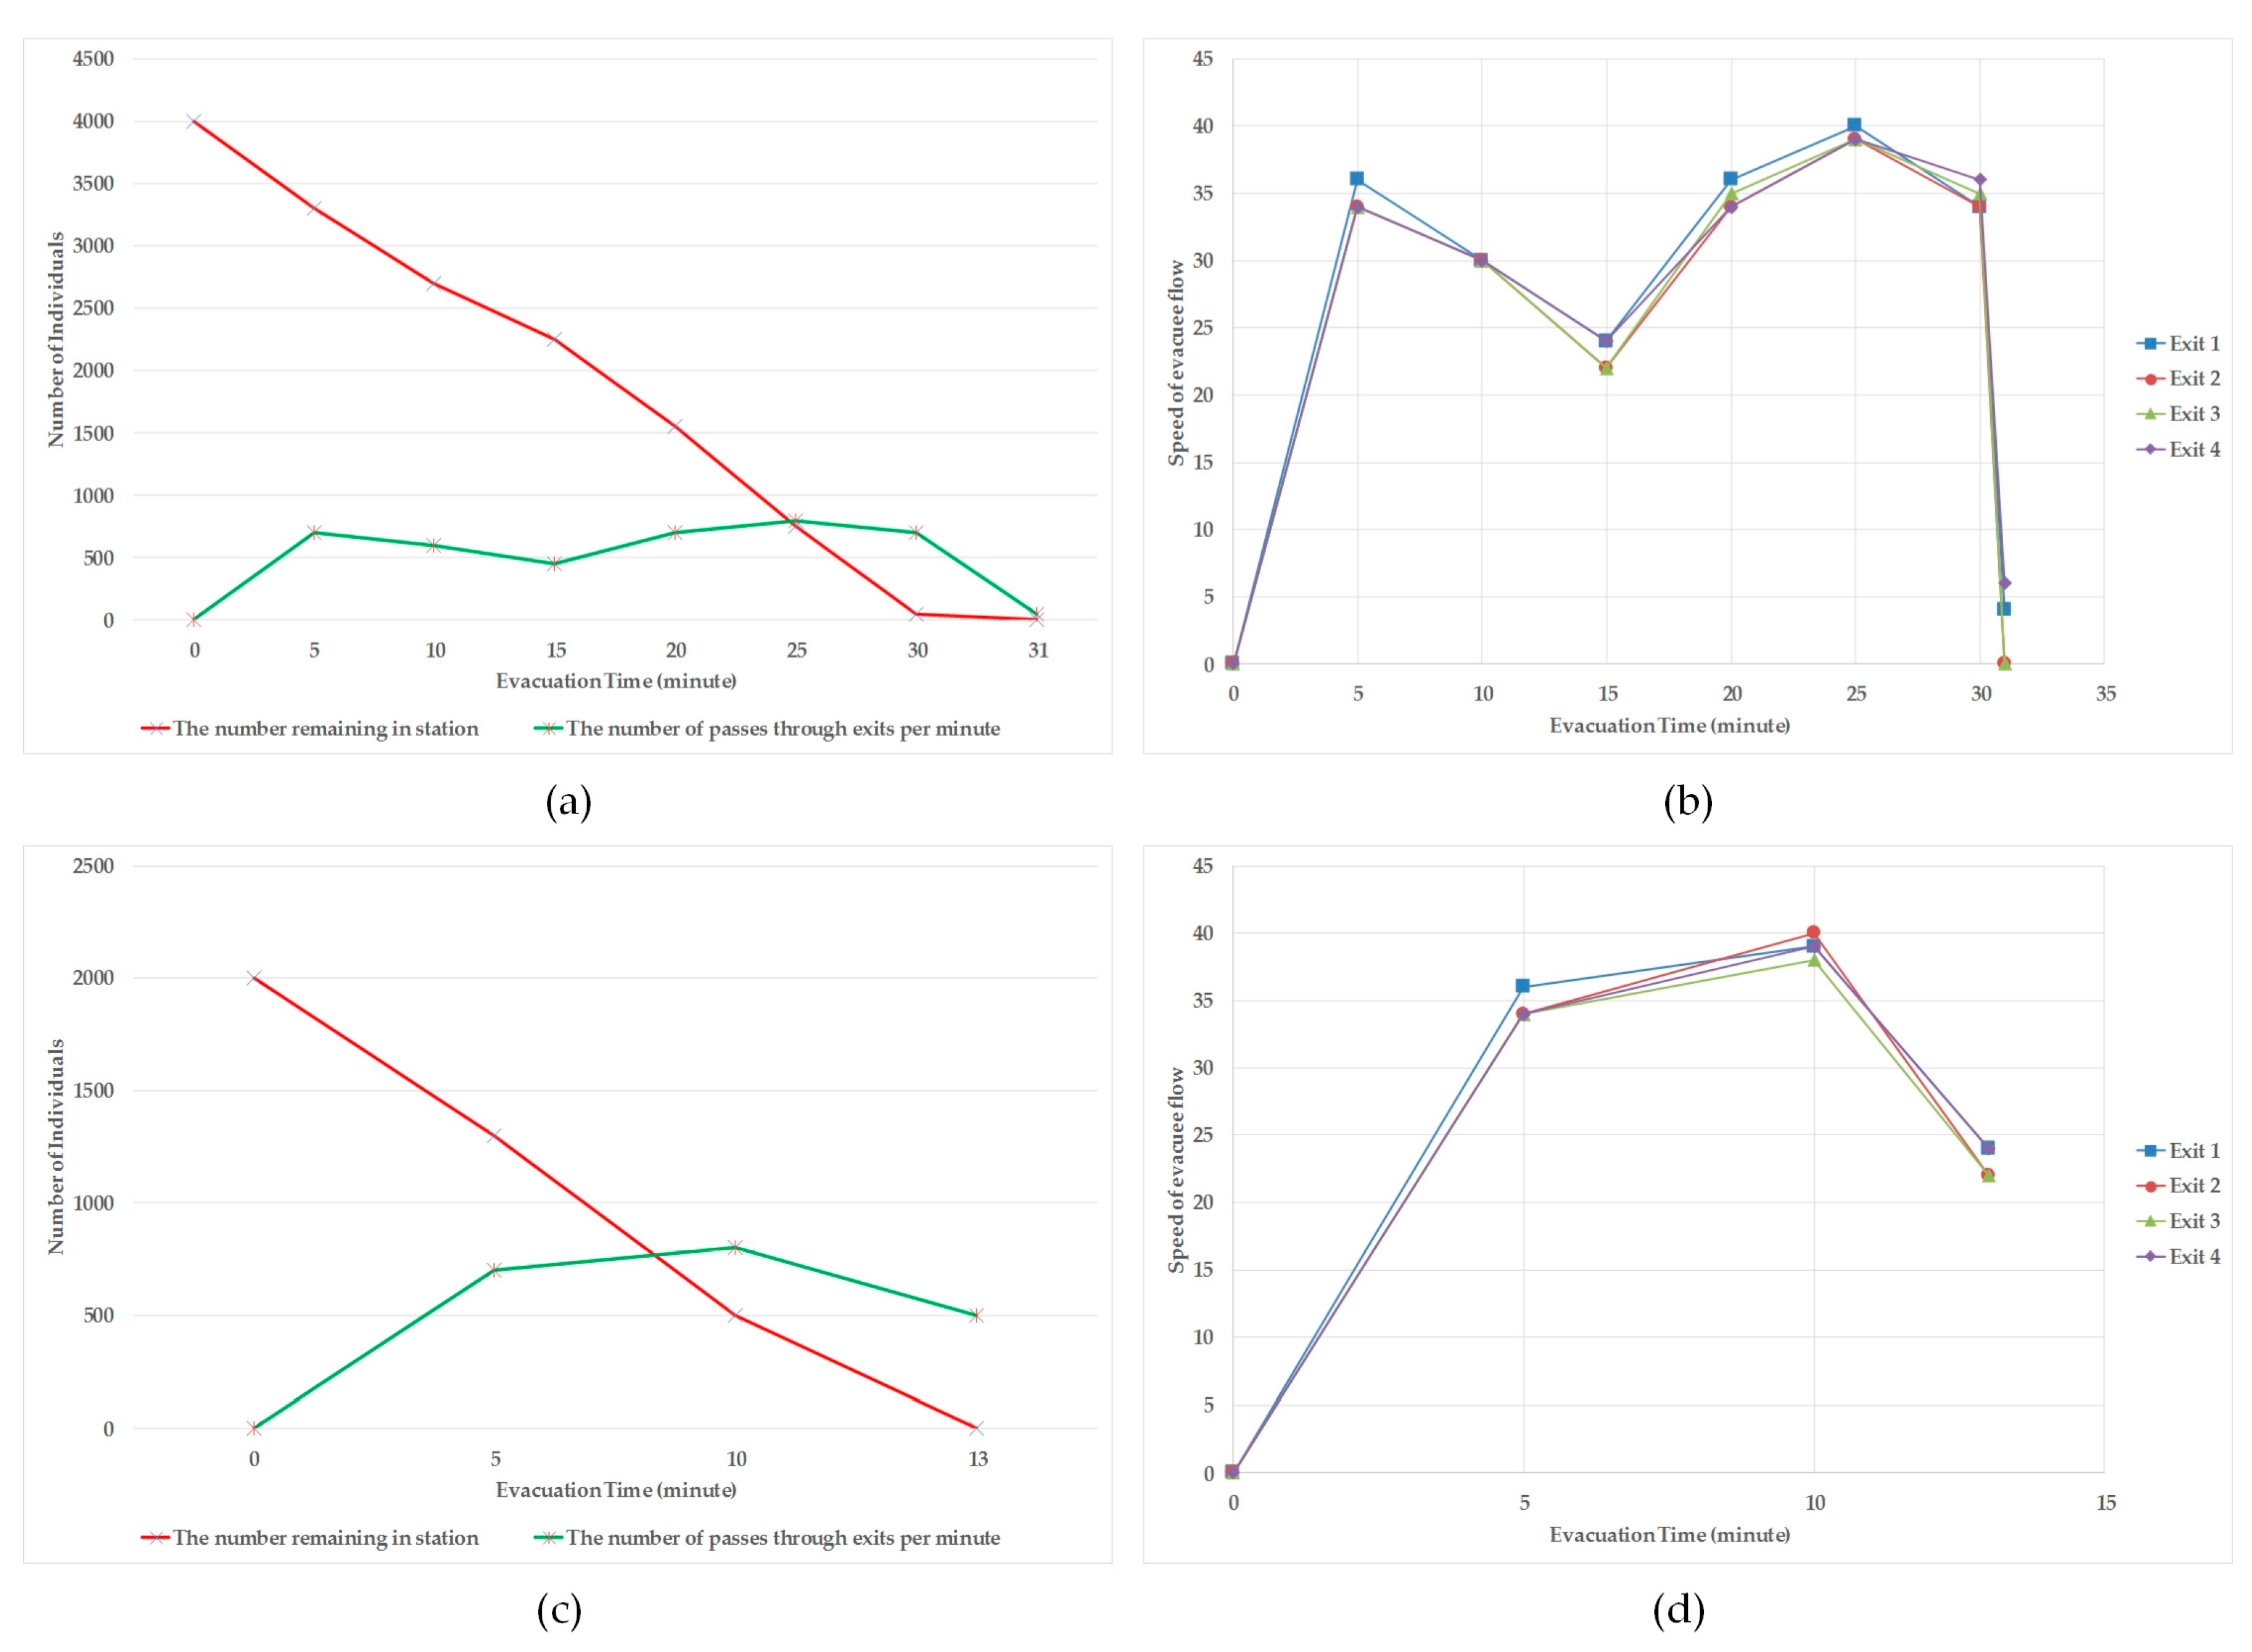
While the number of individuals changed, the DIFM can simulate a different evacuation situation. As shown in Figure 16, according to the experiment’s repeatable principle, this paper choose another two number and level of individuals to verify the reliability and availability of the proposed model and method. The Figure 16a shows the statistical information collected during the simulated evacuation based on 4000 individuals. Figure 16b shows the speed of evacuee passing through each exit in the station based on 4000 individuals. While setting the number of individuals as 4000, the distribution of individuals is sparser than 7000 individuals according to the average area of each person. This number and level of individuals can also produce a slight congestion refer to the ratio of evacuation speed. The Figure 16c shows the statistical information collected during the simulated evacuation based on 2000 individuals. Figure 16d shows the speed of evacuee passing through each exit in the station based on 2000 individuals, which is sparser than 4000 individuals. This number and level of individuals can evacuee to outside very smoothly without any congestion. According to the comparisons of Figure 13, Figure 15, and Figure 16, the proposed DIFM model and related method can simulate and analysis different number and level of individuals in a complex indoor environment, and the analysis result can provide an available reference to related indoor emergency decision-maker.
The simulation and analysis reveal that congestion can occur readily and lead to significant delays in reaching exits inside the building, which increases evacuation time and exposure to dangerous areas. The experimental case assessed in this paper is a complicated three-floor railway station, which was chosen for the purpose of vivid comparison and 3D visualization. However, real cases can be complicated by additional fire spreading; thus, the use of DIFM would be more effective because of its ability to identify congestion and achieve effective routing.
Because this paper only set a single fire with a constant speed on Floor 2 rather than multiple fires with the fire dynamics simulator (FDS) model around the indoor environment, there are no individuals trapped in an affected area and no casualties. The main focus of this simulation was to verify the proposed indoor field model during evacuation for navigation and the analysis of potential congestion and stagnation. The simulation of multiple fires with the FDS model will be considered in a future study.
Compared with the proposed model, the traditional 3D network model shows a connection relationship between indoor spaces, such as rooms, staircases, corridors, and doors. The 3D network model will filter the obstacles, such as chairs and desks. Additionally, it considers the individual flow as nodes distributed along the network. As shown in Figure 17, after making a region partition based on the grids with semantic information, the 3D network can be built by connecting the adjacent and interlinked regions. Figure 17a shows all the regions of Floor 1, and the 3D network will filter the invalid regions that individuals are forbidden to access, such as the railway. Figure 17b shows the regions of Floor 2. Figure 17c shows the 3D network based on the valid regions of both Floor 1 and Floor 2. The node in the 3D network indicates an indoor access space, and the connected edge between nodes indicates the interlinked relationships of adjacent indoor spaces. Combined with the distribution of evacuees in Figure 12a, the nodes are allocated an attribute of individual flow by counting the closest evacuees around the related nodes. Then, the evacuation of the 3D network can use the shortest path algorithm, such as the classic Dijkstra algorithm [62], to simulate the navigation and evacuation of the station.
As performed in the prior analysis, by counting the number of evacuees passing through each exit per minute, Figure 18 shows the statistical information regarding the speed of evacuee flow through the four exits. Because the node of the four exits did not consider the congestion situation and the shortest path algorithm sent the evacuee flow to the nearest exit, Exit 4 is the end of most nodes because of its location and the distribution of nodes throughout the 3D network. As a result, the evacuation takes approximately 25 min, and the speed of evacuees passing through each exit is not the same, which is also caused by the location of each exit and the distribution of nodes.
Compared with this paper’s proposed model, the 3D network can simulate the evacuation or navigation in a multi-story building. However, it cannot describe the individual’s behavior, which influences the detailed evacuation situation, especially around doors and exits. Furthermore, it cannot analyze the potential congestion or stagnation because it ignores the geometric size of individuals, doors, and exits. Consequently, the proposed model is more suitable for a much more complicated and detailed emergency evacuation.
6. Conclusions
This paper illustrates the effectiveness of the proposed DIFM for: (1) the analysis of static information and dynamic information, such as building, sensor, fire spread, and personnel behavior; (2) supporting evacuation analysis from the macro level (building level and floor level) to the micro level (room level and individual level) based on horizontal and vertical indoor spaces; and (3) supporting continuous spatial calculations based on a 3D space grid to predict potential congestion and stagnation during an evacuation. Additionally, this paper introduced a change-based evacuation method built on the implemented model. A simulation of a real railway station model revealed that the congestion phenomenon and delay response caused by a fire were successfully replicated in the 3D visualization. The proposed model and related algorithm are effective for planning indoor emergency routes that avoid multiple fire-affected areas and potential congestion or stagnation.
This research reveals the possibility and benefits of applying GIS technology in an emergency response model for indoor environments. The new model and related algorithm were developed by extending GIS technology to an evacuation system that analyzed the indoor spatial relationships among static and dynamic elements. This model represents the potential for extending large-scale evacuation analysis to, for instance, the simulation of urban areas. With the development of GIS, the proposed model could also be easily applied to outdoor environments. Furthermore, the entire evacuation could be represented within a multi-scale framework in a virtual geographical environment. Future studies will apply a detailed fire dynamic model, such as the fire dynamics simulator (FDS) model, to the dynamic and event information to perform a detailed analysis and optimize the computational process to improve its efficiency. Furthermore, the future studies will make a further study on crowd flow model to rich our works, with considering the people’s physiology, psychology and social attribute, including the age, gender respiratory rate, familiarity level of environment, sensitivity and patience.
Acknowledgments
This paper was supported by the National Nature Science Foundation of China (Nos. 41571390, 41471320, and 41471332), the National Key Research and Development Program of China (Nos. 2016YFB0502603 and 2016YFB0502303).
Author Contributions
Qing Xiong, Qing Zhu, and Zhiqiang Du conceived the experiments, designed the method, and wrote the paper; Zhiqiang Du and Qing Zhu acted as the corresponding authors; Xinyan Zhu, Lei Niu, Yun Li, and Yan Zhou contributed the experimental data and supplied infrastructure for the experiments; and Qing Xiong and Zhiqiang Du performed the experiments and analyzed the results.
Conflicts of Interest
The authors declare no conflicts of interest.
References
- Chen, W.; Yang, J. China Fire Almanac; Yunnan Peopole’s Publishing House: Kunming, China, 2014. (In Chinese) [Google Scholar]
- Melcher, T.; Zinke, R.; Trott, M.; Krause, U. Experimental investigations on the repeatability of real scale fire tests. Fire Saf. J. 2016, 82, 101–114. [Google Scholar] [CrossRef]
- Selamet, S.; Bolukbas, C. Fire resilience of shear connections in a composite floor: Numerical investigation. Fire Saf. J. 2016, 81, 97–108. [Google Scholar] [CrossRef]
- Comeau, E. Last year’s big three. NFPA J. 2000, 9, 54. [Google Scholar]
- Pigott, P.T. The fire at the stardust, Dublin: The public inquiry and its findings. Fire Saf. J. 1984, 7, 207–212. [Google Scholar] [CrossRef]
- Kaufman, M.M.; Rosencrants, T. GIS method for characterizing fire flow capacity. Fire Saf. J. 2015, 72, 25–32. [Google Scholar] [CrossRef]
- Liu, S.J.; Zhu, G.Q. The application of GIS and IOT technology on building fire evacuation. Procedia Eng. 2014, 71, 577–582. [Google Scholar] [CrossRef]
- Atila, U.; Karas, I.R.; Turan, M.K.; Rahman, A.A. Automatic generation of 3D networks in CityGML and design of an intelligent individual evacuation model for building fires within the scope of 3D GIS. In Innovations in 3D Geo-Information Sciences; Isikdag, U., Ed.; Springer: Cham, Switzerland, 2014; pp. 123–142. [Google Scholar]
- Atila, U.; Karas, I.R.; Rahman, A.A.A. A 3D-GIS implementation for realizing 3D network analysis and routing simulation for evacuation purpose. In Progress and New Trends in 3D Geoinformation Sciences; Pouliot, J., Daniel, S., Hubert, F., Zamyadi, A., Eds.; Springer: Berlin, Germany, 2013; pp. 249–260. [Google Scholar]
- Sun, J.; Li, X. Indoor evacuation routes planning with a grid graph-based model. Proceedings of 19th International Conference on Geoinformatics, Shanghai, China, 24–26 June 2011. [Google Scholar]
- Kwan, M.; Lee, J. Emergency response after 9/11: The potential of real-time 3D GIS for quick emergency response in micro-spatial environments. Comput. Environ. Urban Syst. 2005, 29, 93–113. [Google Scholar] [CrossRef]
- Dilo, A.; Zlatanova, S. A data model for operational and situational information in emergency response. Appl. Geomat. 2011, 3, 207–218. [Google Scholar] [CrossRef]
- Tashakkori, H.; Rajabifard, A.; Kalantari, M. A new 3D indoor/outdoor spatial model for indoor emergency response facilitation. Build. Environ. 2015, 89, 170–182. [Google Scholar] [CrossRef]
- Gwynne, S.; Galea, E.R.; Owen, M.; Lawrence, P.J.; Filippidis, L. A systematic comparison of buildingEXODUS predictions with experimental data from the Stapelfeldt trials and the Milburn House evacuation. Appl. Math. Modell. 2005, 29, 818–851. [Google Scholar] [CrossRef]
- Shen, T. ESM: A building evacuation simulation model. Build. Environ. 2005, 40, 671–680. [Google Scholar] [CrossRef]
- Murakami, Y.; Minami, K.; Kawasoe, T.; Ishida, T. Multi-agent simulation for crisis management. In Proceedings of the IEEE Workshop on Knowledge Media Networking, Kyoto, Japan, 10–12 July 2002; pp. 135–139. [Google Scholar]
- Thompson, P.; Wu, J.; Marchant, E. Modelling evacuation in multi-storey buildings with Simulex. Fire Eng. J. 1996, 56, 6–11. [Google Scholar] [CrossRef]
- Feinberg, W.E.; Johnson, N.R. FIRESCAP: A computer simulation model of reaction to a fire alarm. J. Math. Sociol. 1995, 20, 247–269. [Google Scholar] [CrossRef]
- Tang, F.; Ren, A. GIS-based 3D evacuation simulation for indoor fire. Build. Environ. 2012, 49, 193–202. [Google Scholar] [CrossRef]
- Hashemi, M.; Karimi, H.A. Indoor spatial model and accessibility index for emergency evacuation of people with disabilities. J. Comput. Civ. Eng. 2016, 30, 04015056. [Google Scholar] [CrossRef]
- Samah, K.A.F.A.; Hussin, B.; Basari, A.S.H. Modeling the wayfinding queueing bottleneck in autonomous evacuation navigation system using simulation approaches. J. Telecommun. Electron. Comput. Eng. 2015, 1, 77–80. [Google Scholar]
- Guo, R. A network-based method for modeling pedestrian evacuation in indoor areas. In Proceedings of the 2010 Third International Joint Conference on Computational Science and Optimization, Huangshan, Anhui, China, 28–31 May 2010; pp. 495–498. [Google Scholar]
- Kobes, M.; Helsloot, I.; de Vries, B.; Post, J.G.; Oberijé, N.; Groenewegen, K. Way finding during fire evacuation; an analysis of unannounced fire drills in a hotel at night. Build. Environ. 2010, 45, 537–548. [Google Scholar] [CrossRef]
- Pelechano, N.; Malkawi, A. Evacuation simulation models: Challenges in modeling high rise building evacuation with cellular automata approaches. Autom. Constr. 2008, 17, 377–385. [Google Scholar] [CrossRef]
- Gröger, G.; Kolbe, T.; Nagel, C.; Häfele, K. OGC City Geography Markup Language (CityGML) En-Coding Standard; Open Geospatial Consortium Inc., OGC: Wayland, MA, USA, 2008. [Google Scholar]
- Luo, F.; Cao, G.; Li, X. An interactive approach for deriving geometric network models in 3D indoor environments. In Proceedings of the Sixth ACM SIGSPATIAL International Workshop on Indoor Spatial Awareness, New York, NY, USA, 4–7 November 2014; pp. 9–16. [Google Scholar]
- Xie, J.; Li, Q.; Wan, Q.; Li, X. Near optimal allocation strategy for making a staged evacuation plan with multiple exits. Ann. GIS 2014, 20, 159–168. [Google Scholar] [CrossRef]
- Rakip, K.I.; Fatmagul, B.; Alias, A. An evacuation system for extraordinary indoor air pollution disaster circumstances. Disaster Adv. 2012, 5, 30–40. [Google Scholar]
- Lo, S.M.; Fang, Z.; Chen, D.H. Use of a modified network model for analyzing evacuation patterns in high-rise buildings. J. Archit. Eng. 2001, 7, 21–29. [Google Scholar] [CrossRef]
- Kisko, T.M.; Francis, R.L. EVACNET +: A network model of building evacuation. Silulation 1983, 11, 71–74. [Google Scholar]
- George, B.; Shekhar, S. Time-Aggregated Graphs for Modeling Spatio-Temporal Networks. Theory and Practice; Springer: Berlin, Germany, 2006; pp. 85–99. [Google Scholar]
- Yu, W.J.; Chen, R.; Dong, L.Y.; Dai, S.Q. Centrifugal force model for pedestrian dynamics. Phys. Rev. E Stat. Nonlin Soft. Matter Phys. 2005, 72, 026112. [Google Scholar] [CrossRef] [PubMed]
- Henein, C.M.; White, T. Agent-based modelling of forces in crowds. In International Workshop on Multi-Agent Systems and Agent-Based Simulation; Springer: Berlin, Germany, 2005; pp. 173–184. [Google Scholar]
- Helbing, D.; Farkas, I.; Vicsek, T. Simulating dynamical features of escape panic. Nature 2000, 407, 487–490. [Google Scholar] [CrossRef] [PubMed]
- Okazaki, S.; Magura, S. A study of simulation model for pedestrian movement with evacuation and queuing. In Proceedings of the International Conference on Engineering for Crowd Safety 1993, London, UK, 17–18 March 1993; Volume 271. [Google Scholar]
- Song, W.G.; Yu, Y.F.; Wang, B.H.; Fan, W.C. Evacuation behaviors at exit in CA model with force essentials: A comparison with social force model. Phys. A Stat. Mech. Appl. 2006, 371, 658–666. [Google Scholar] [CrossRef]
- Was, J. Cellular automata model of pedestrian dynamics for normal and evacuation conditions. In Proceedings of the 5th International Conference on Intelligent Systems Design and Applications, Wroclaw, Poland, 8–10 September 2005; pp. 154–159. [Google Scholar]
- Authority UK Atomic Energy. A Technical Summary of the AEA Egress Code; Technical Report. 2002, 1. AET/NOIL/27812001/002 (2); Authority UK Atomic Energy: Abingdon, UK, 2002. [Google Scholar]
- Kirchner, A.; Schadschneider, A. Simulation of evacuation processes using a bionics-inspired cellular automaton model for pedestrian dynamics. Phys. A Stat. Mech. Appl. 2002, 312, 260–276. [Google Scholar] [CrossRef]
- Fu, L.; Song, W.; Lv, W.; Liu, X.; Lo, S. Multi-grid simulation of counter flow pedestrian dynamics with emotion propagation. Simul. Model. Pract. Theory 2016, 60, 1–14. [Google Scholar] [CrossRef]
- Kirik, E.; Yurgel’Yan, T.; Krouglov, D. An intelligent Floor Field cellular automation model for pedestrian dynamics. In Proceedings of the 2007 Summer Computer Simulation Conference, San Diego, CA, USA, 16–19 July 2009. [Google Scholar]
- Huang, H.J.; Guo, R.Y. Static floor field and exit choice for pedestrian evacuation in rooms with internal obstacles and multiple exits. Phys. Rev. E Stat. Nonlin. Soft Matter Phys. 2008, 78, 021131. [Google Scholar] [CrossRef] [PubMed]
- Varas, A.; Cornejo, M.D.; Mainemer, D.; Toledo, B.; Rogan, J.; Muñoz, V.; Valdivia, J.A. Cellular automaton model for evacuation process with obstacles. Phys. A Stat. Mech. Appl. 2007, 382, 631–642. [Google Scholar] [CrossRef]
- Li, K. Indoor Space: A New Notion of Space; Springer: Berlin, Germany, 2008; pp. 1–3. [Google Scholar]
- Chen, L.; Wu, C.; Shen, T.; Chou, C. The application of geometric network models and building information models in geospatial environments for fire-fighting simulations. Comput. Environ. Urban Syst. 2014, 45, 1–12. [Google Scholar] [CrossRef]
- Holmberg, D.G.; Raymond, M.A.; Averill, J. Delivering Building Intelligence to First Responders. NIST Technical Note. National Institute of Standards and Technology; US Department of Commerce: Washington, DC, USA, 2013.
- Yang, L.; Prasanna, R.; King, M. On-site information systems design for emergency first responders. J. Inf. Technol. Theory Appl. 2009, 10, 5–27. [Google Scholar]
- Jones, W.; Holmberg, D.; Davis, W. National Institute of Standards and Technology Report NISTIR; Workshop to Define Information Needed by Emergency Responders during Building Emergencies; NIST: Gaithersburg, MD, USA, 2005. [Google Scholar]
- Henein, C.M.; White, T. Macroscopic effects of microscopic forces between agents in crowd models. Phys. A Stat. Mech. Appl. 2007, 373, 694–712. [Google Scholar] [CrossRef]
- Kuligowski, E.D.; Peacock, R.D.; Hoskins, B.L. A Review of Building Evacuation Models; NIST Technical Note 1680; National Institute of Standards and Technology: Gaithersburg, MD, USA, 2005.
- Lee, J.; Li, K.; Zlatanova, S. OGC IndoorGML; Open Geospatial Consortium Inc., OGC: Wayland, MA, USA, 2014. [Google Scholar]
- Kim, J.; Yoo, S.; Li, K. Integrating IndoorGML and CityGML for indoor space. In Web and Wireless Geographical Information Systems; Pfoser, D., Li, K.J., Eds.; Springer: Berlin, Germany, 2014; pp. 184–196. [Google Scholar]
- Li, K.J.; Lee, J.Y. Basic concepts of indoor spatial information candidate standard IndoorGML and its applications. J. Korea Spat. Inf. Soc. 2013, 21, 1–10. [Google Scholar] [CrossRef]
- Xiong, Q.; Zhu, Q.; Du, Z.; Zlatanova, S.; Zhang, Y.; Zhou, Y.; Li, Y. Free multi-floor indoor space extraction from complex 3D building models. Earth Sci. Inf. 2017, 10, 69–83. [Google Scholar] [CrossRef]
- Lo, S.M.; Fang, Z.; Lin, P.; Zhi, G.S. An evacuation model: The SGEM package. Fire Saf. J. 2004, 39, 169–190. [Google Scholar] [CrossRef]
- Christensen, K.; Sasaki, Y. Agent-based emergency evacuation simulation with individuals with disabilities in the population. J. Artif. Soc. Soc. Simul. 2008, 11, 9. [Google Scholar]
- Zhao, C.M.; Lo, S.M.; Zhang, S.P.; Liu, M. A post-fire survey on the pre-evacuation human behavior. Fire Technol. 2009, 45, 71–95. [Google Scholar] [CrossRef]
- McKinnon, G.P. Fire Protection Handbook, 20th ed.; National Fire Protection Association: Quincy, MA, USA, 2008. [Google Scholar]
- Pan, X.; Han, C.S.; Dauber, K.; Law, K.H. Human and social behavior in computational modeling and analysis of egress. Autom. Constr. 2006, 15, 448–461. [Google Scholar] [CrossRef]
- Xiong, Q.; Zhu, Q.; Zlatanova, S.; Du, Z.; Zhang, Y.; Zeng, L. Multi-level indoor path planning method. Int. Arch. Photogramm. Remote Sens. Spat. Inform. Sci. 2015, 40, 19–23. [Google Scholar] [CrossRef]
- Gwynne, S.; Galea, E.R.; Parke, J.; Hickson, J. The collection and analysis of pre-evacuation times derived from evacuation trials and their application to evacuation modelling. Fire Technol. 2003, 39, 173–195. [Google Scholar] [CrossRef]
- Dijkstra, E.W. A note on two problems in connexion with graphs. Numer. Math. 1959, 1, 269–271. [Google Scholar] [CrossRef]
Figure 1.
Dimensions of indoor emergency evacuation.

Figure 2.
Conceptual data model of DIFM (dynamic indoor field model).
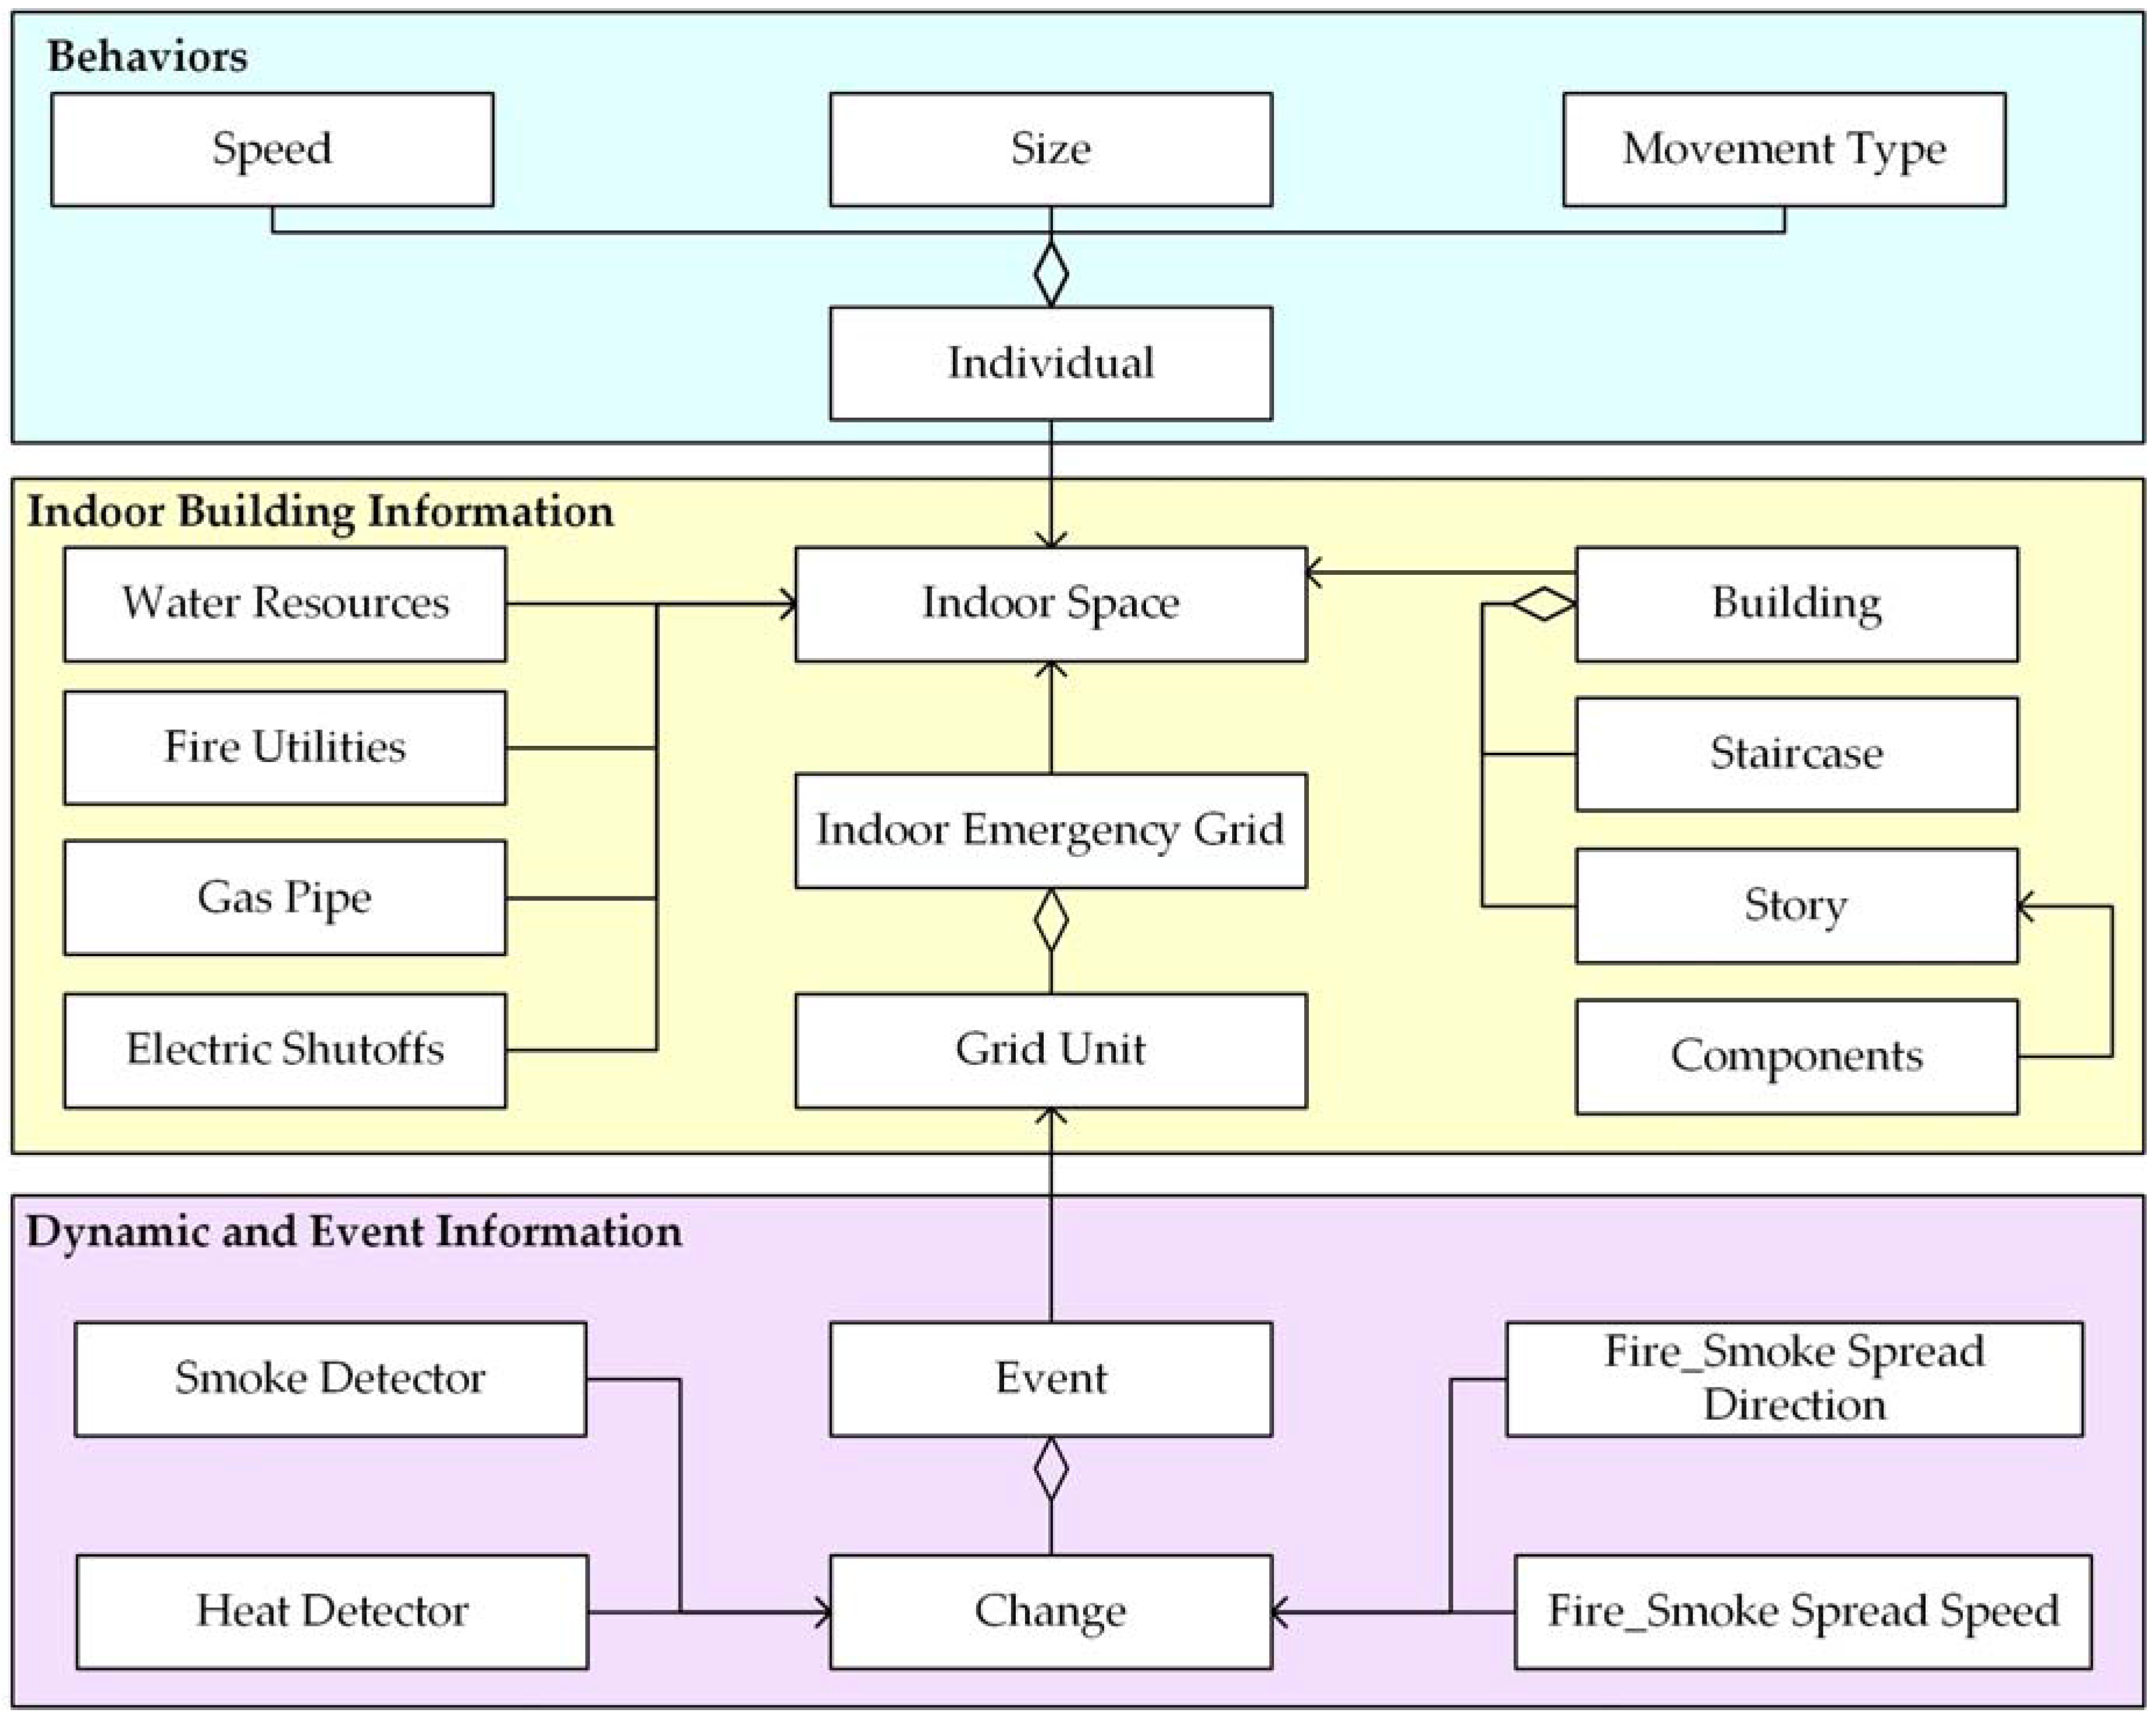
Figure 3.
Logical data model of DIFM.

Figure 4.
Diagram of individual behaviors during an evacuation process. Nodes indicate the individual’s responses to certain events. Arrows indicate the directions of evacuation flows.
Figure 4.
Diagram of individual behaviors during an evacuation process. Nodes indicate the individual’s responses to certain events. Arrows indicate the directions of evacuation flows.

Figure 5.
Flow chart of the change-based evacuation method.

Figure 6.
Diagram of horizontal and vertical emergency grids. The horizontal grid can be represented as a set of connected grids with a certain elevation. The vertical grid can be represented as a set of connected grids with elevation and slope. (a) A sample indoor space with a staircase; and (b) conceptualized field model of the sample indoor space.

Figure 7.
Flow chart of developing a building emergency grid.

Figure 8.
System implementation framework.

Figure 9.
Various views of the station being simulated: (a) top view of the station with terrain; (b) top view of the station without terrain; (c) left view of the station; (d) right view of the station; (e) indoor close-up view; and (f) close-up view of the evacuation element.
Figure 9.
Various views of the station being simulated: (a) top view of the station with terrain; (b) top view of the station without terrain; (c) left view of the station; (d) right view of the station; (e) indoor close-up view; and (f) close-up view of the evacuation element.

Figure 10.
Average height and size of individuals.

Figure 11.
Emergency grid of the station: (a) horizontal emergency grid around a door on Floor 2; and (b) vertical emergency grid between indoors and outdoors.
Figure 11.
Emergency grid of the station: (a) horizontal emergency grid around a door on Floor 2; and (b) vertical emergency grid between indoors and outdoors.
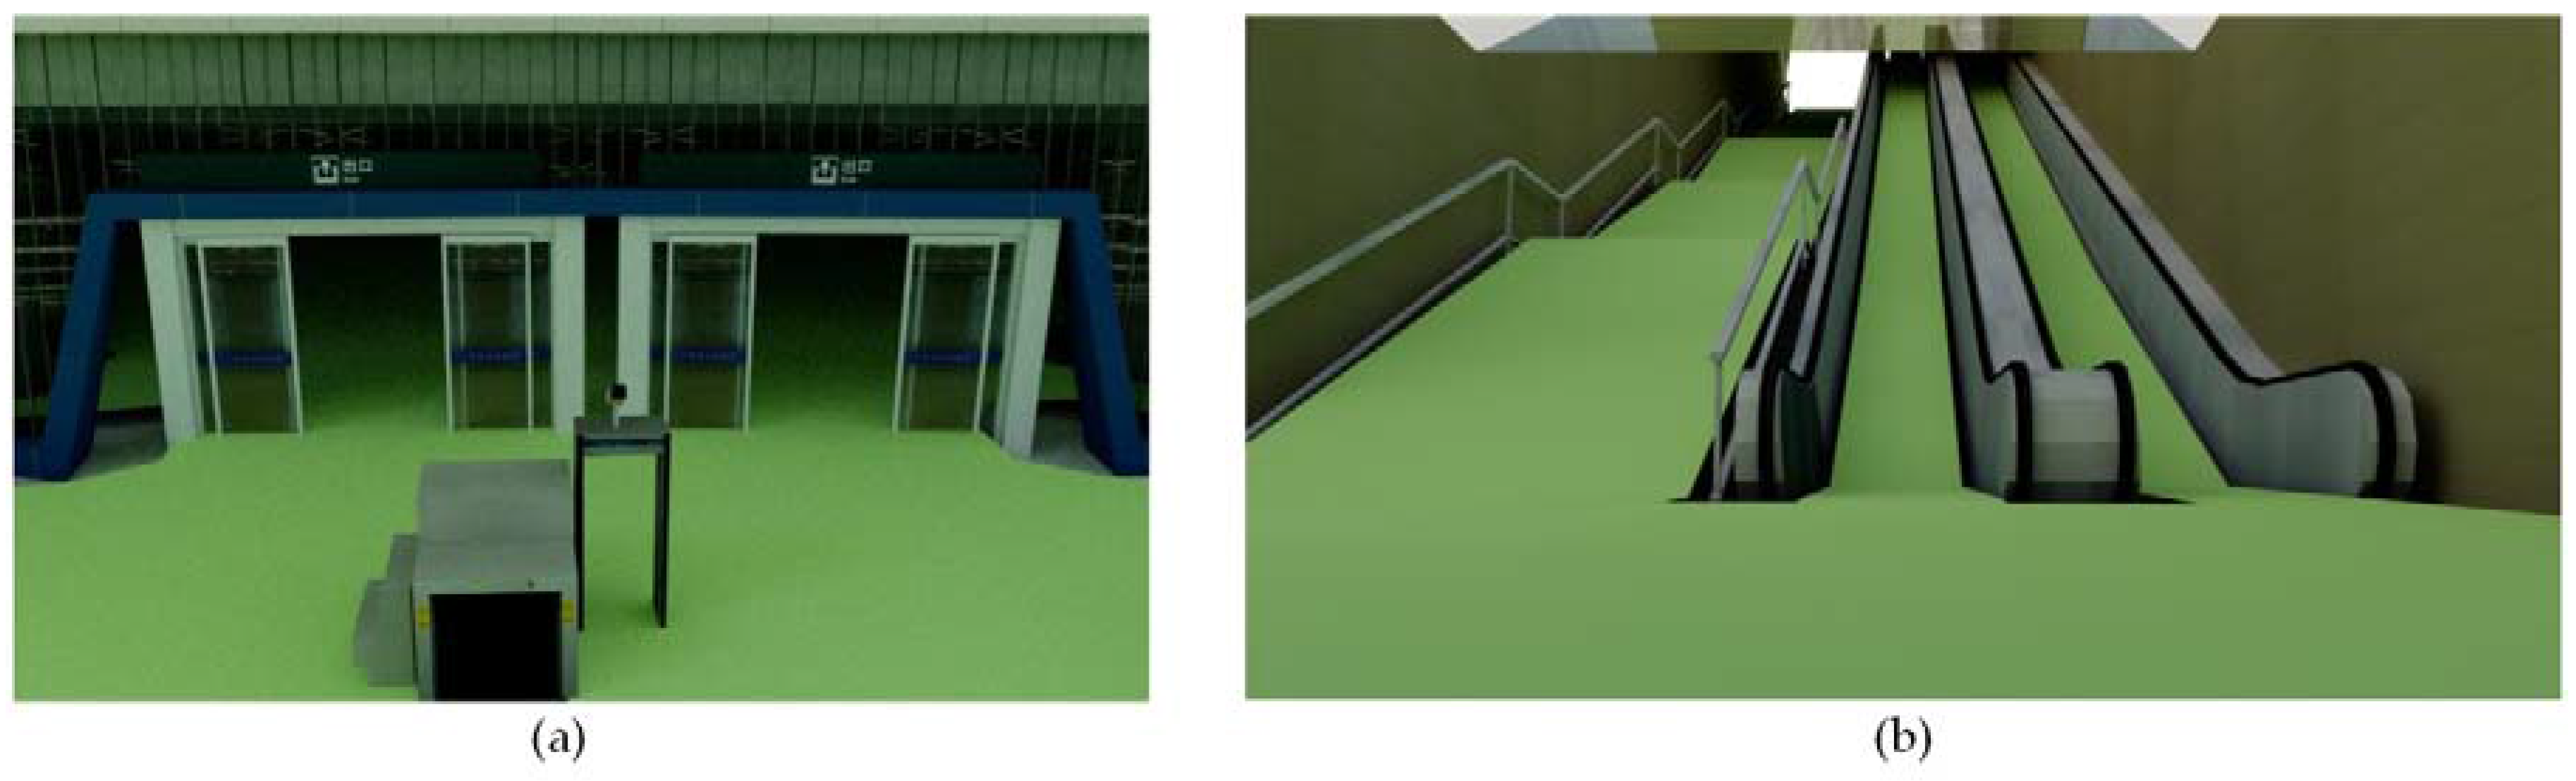
Figure 12.
The location distribution of evacuees on Floor 2 during evacuation: (a) the initial location distribution of evacuees at the beginning of evacuation; (b) the location distribution of evacuees 10 min after evacuation initiation; (c) the location distribution of evacuees 15 min after evacuation initiation; and (d) the location distribution of evacuees 50 min after evacuation initiation.

Figure 13.
Statistical information collected during the simulated evacuation.

Figure 14.
Congestion around key portals and exits: (a) congestion around a key portal on Floor 2 near Exit 1; (b) congestion around Exit 2; (c) congestion around Exit 3; and (d) congestion around Exit 4.
Figure 14.
Congestion around key portals and exits: (a) congestion around a key portal on Floor 2 near Exit 1; (b) congestion around Exit 2; (c) congestion around Exit 3; and (d) congestion around Exit 4.

Figure 15.
Speed of evacuee passing through each exit in the station with the proposed model.

Figure 16.
Evacuation analysis based on different number of individuals: (a) statistical information collected during the simulated evacuation based on 4000 individuals; (b) speed of evacuee passing through each exit in the station based on 4000 individuals; (c) statistical information collected during the simulated evacuation based on 2000 individuals; and (d) speed of evacuee passing through each exit in the station based on 2000 individuals.

Figure 17.
3D network of the experiment station data: (a) the region partition based on grids of Floor 1; (b) the region partition based on grids of Floor 2; and (c) the 3D network based on region partition of the station.
Figure 17.
3D network of the experiment station data: (a) the region partition based on grids of Floor 1; (b) the region partition based on grids of Floor 2; and (c) the 3D network based on region partition of the station.

Figure 18.
Speed of evacuee passing through each exit in the station with the 3D network.

Table 1.
Comparison of emergency indoor spatial models.
| Research | 3D | Real-Time Data | Sensors | Vertical Navigation | Human Behavior | Floor Plan | Structure Information | Emergency Information |
|---|---|---|---|---|---|---|---|---|
| network-based model | √ | √ | × | × | × | √ | √ | × |
| particle-based model | √ | √ | √ | × | √ | √ | √ | × |
| cellular-based model | × | √ | √ | × | √ | √ | √ | × |
| field-based model | × | √ | √ | × | √ | √ | √ | × |
Table 2.
Summary of DIFM objects.
| Object | Definition | Relation |
|---|---|---|
| Building | Global element of spatial structures, which are aggregates of horizontal and vertical building components. | Associated with the Indoor Space during an evacuation. |
| Indoor Space | Virtual spatial element for evacuation assessment with both physically and theoretically bounded areas. | Associated with indoor features, such as Individuals, Water Resources, Fire Utilities, Gas Pipe, Electric Shutoffs, and Indoor Emergency Grid used for navigation. |
| Indoor Emergency Grid | Indoor grid set with information that describes the features of individuals and utilities that effect emergency operations. | Built using Grid Unit, which describes individual accessibility, security, and weight restrictions. |
| Grid Unit | Indoor calculable grid of features. | Represents the weight that can be determined by the type of indoor space and the event in a location. |
| Individual | Evacuee inside a building. | Has attributes of size and speed that must be considered when formulating evacuation strategies. |
| Event | Quantitative and qualitative description of the evacuation process. | Associated with inaccessible spaces that deliver its value to the Grid Unit to help an Individual select a safe route. |
| Change | Quantitative description of fire spread result. | Represents the fire spread process during an evacuation in terms of its association with the information needed to calculate the fire situation. |
© 2017 by the authors. Licensee MDPI, Basel, Switzerland. This article is an open access article distributed under the terms and conditions of the Creative Commons Attribution (CC BY) license (http://creativecommons.org/licenses/by/4.0/).
Share and Cite
MDPI and ACS Style
Xiong, Q.; Zhu, Q.; Du, Z.; Zhu, X.; Zhang, Y.; Niu, L.; Li, Y.; Zhou, Y. A Dynamic Indoor Field Model for Emergency Evacuation Simulation. ISPRS Int. J. Geo-Inf. 2017, 6, 104. https://doi.org/10.3390/ijgi6040104
AMA Style
Xiong Q, Zhu Q, Du Z, Zhu X, Zhang Y, Niu L, Li Y, Zhou Y. A Dynamic Indoor Field Model for Emergency Evacuation Simulation. ISPRS International Journal of Geo-Information. 2017; 6(4):104. https://doi.org/10.3390/ijgi6040104
Chicago/Turabian StyleXiong, Qing, Qing Zhu, Zhiqiang Du, Xinyan Zhu, Yeting Zhang, Lei Niu, Yun Li, and Yan Zhou. 2017. "A Dynamic Indoor Field Model for Emergency Evacuation Simulation" ISPRS International Journal of Geo-Information 6, no. 4: 104. https://doi.org/10.3390/ijgi6040104
Note that from the first issue of 2016, this journal uses article numbers instead of page numbers. See further details here.