
An Exploratory Study Investigating Gender Effects on Using 3D Maps for Spatial Orientation in Wayfinding


Abstract
:1. Introduction
- (1)
- Are there any gender differences in user performance and visual attention during self-localization and spatial orientation when applying spatial knowledge acquired from 3D maps?
- (2)
- If the above gender differences exist, are these differences consistent with those from using 2D maps?
2. Background and Related Work
2.1. Gender Differences in Wayfinding
2.2. Evaluation of 3D Representations for Wayfinding
3. Methods and Materials
3.1. Designing the 3D Map
3.2. Pre-Test Evaluation
3.3. Eye-Tracking Experimental Setup
3.4. Participants
3.5. Apparatus
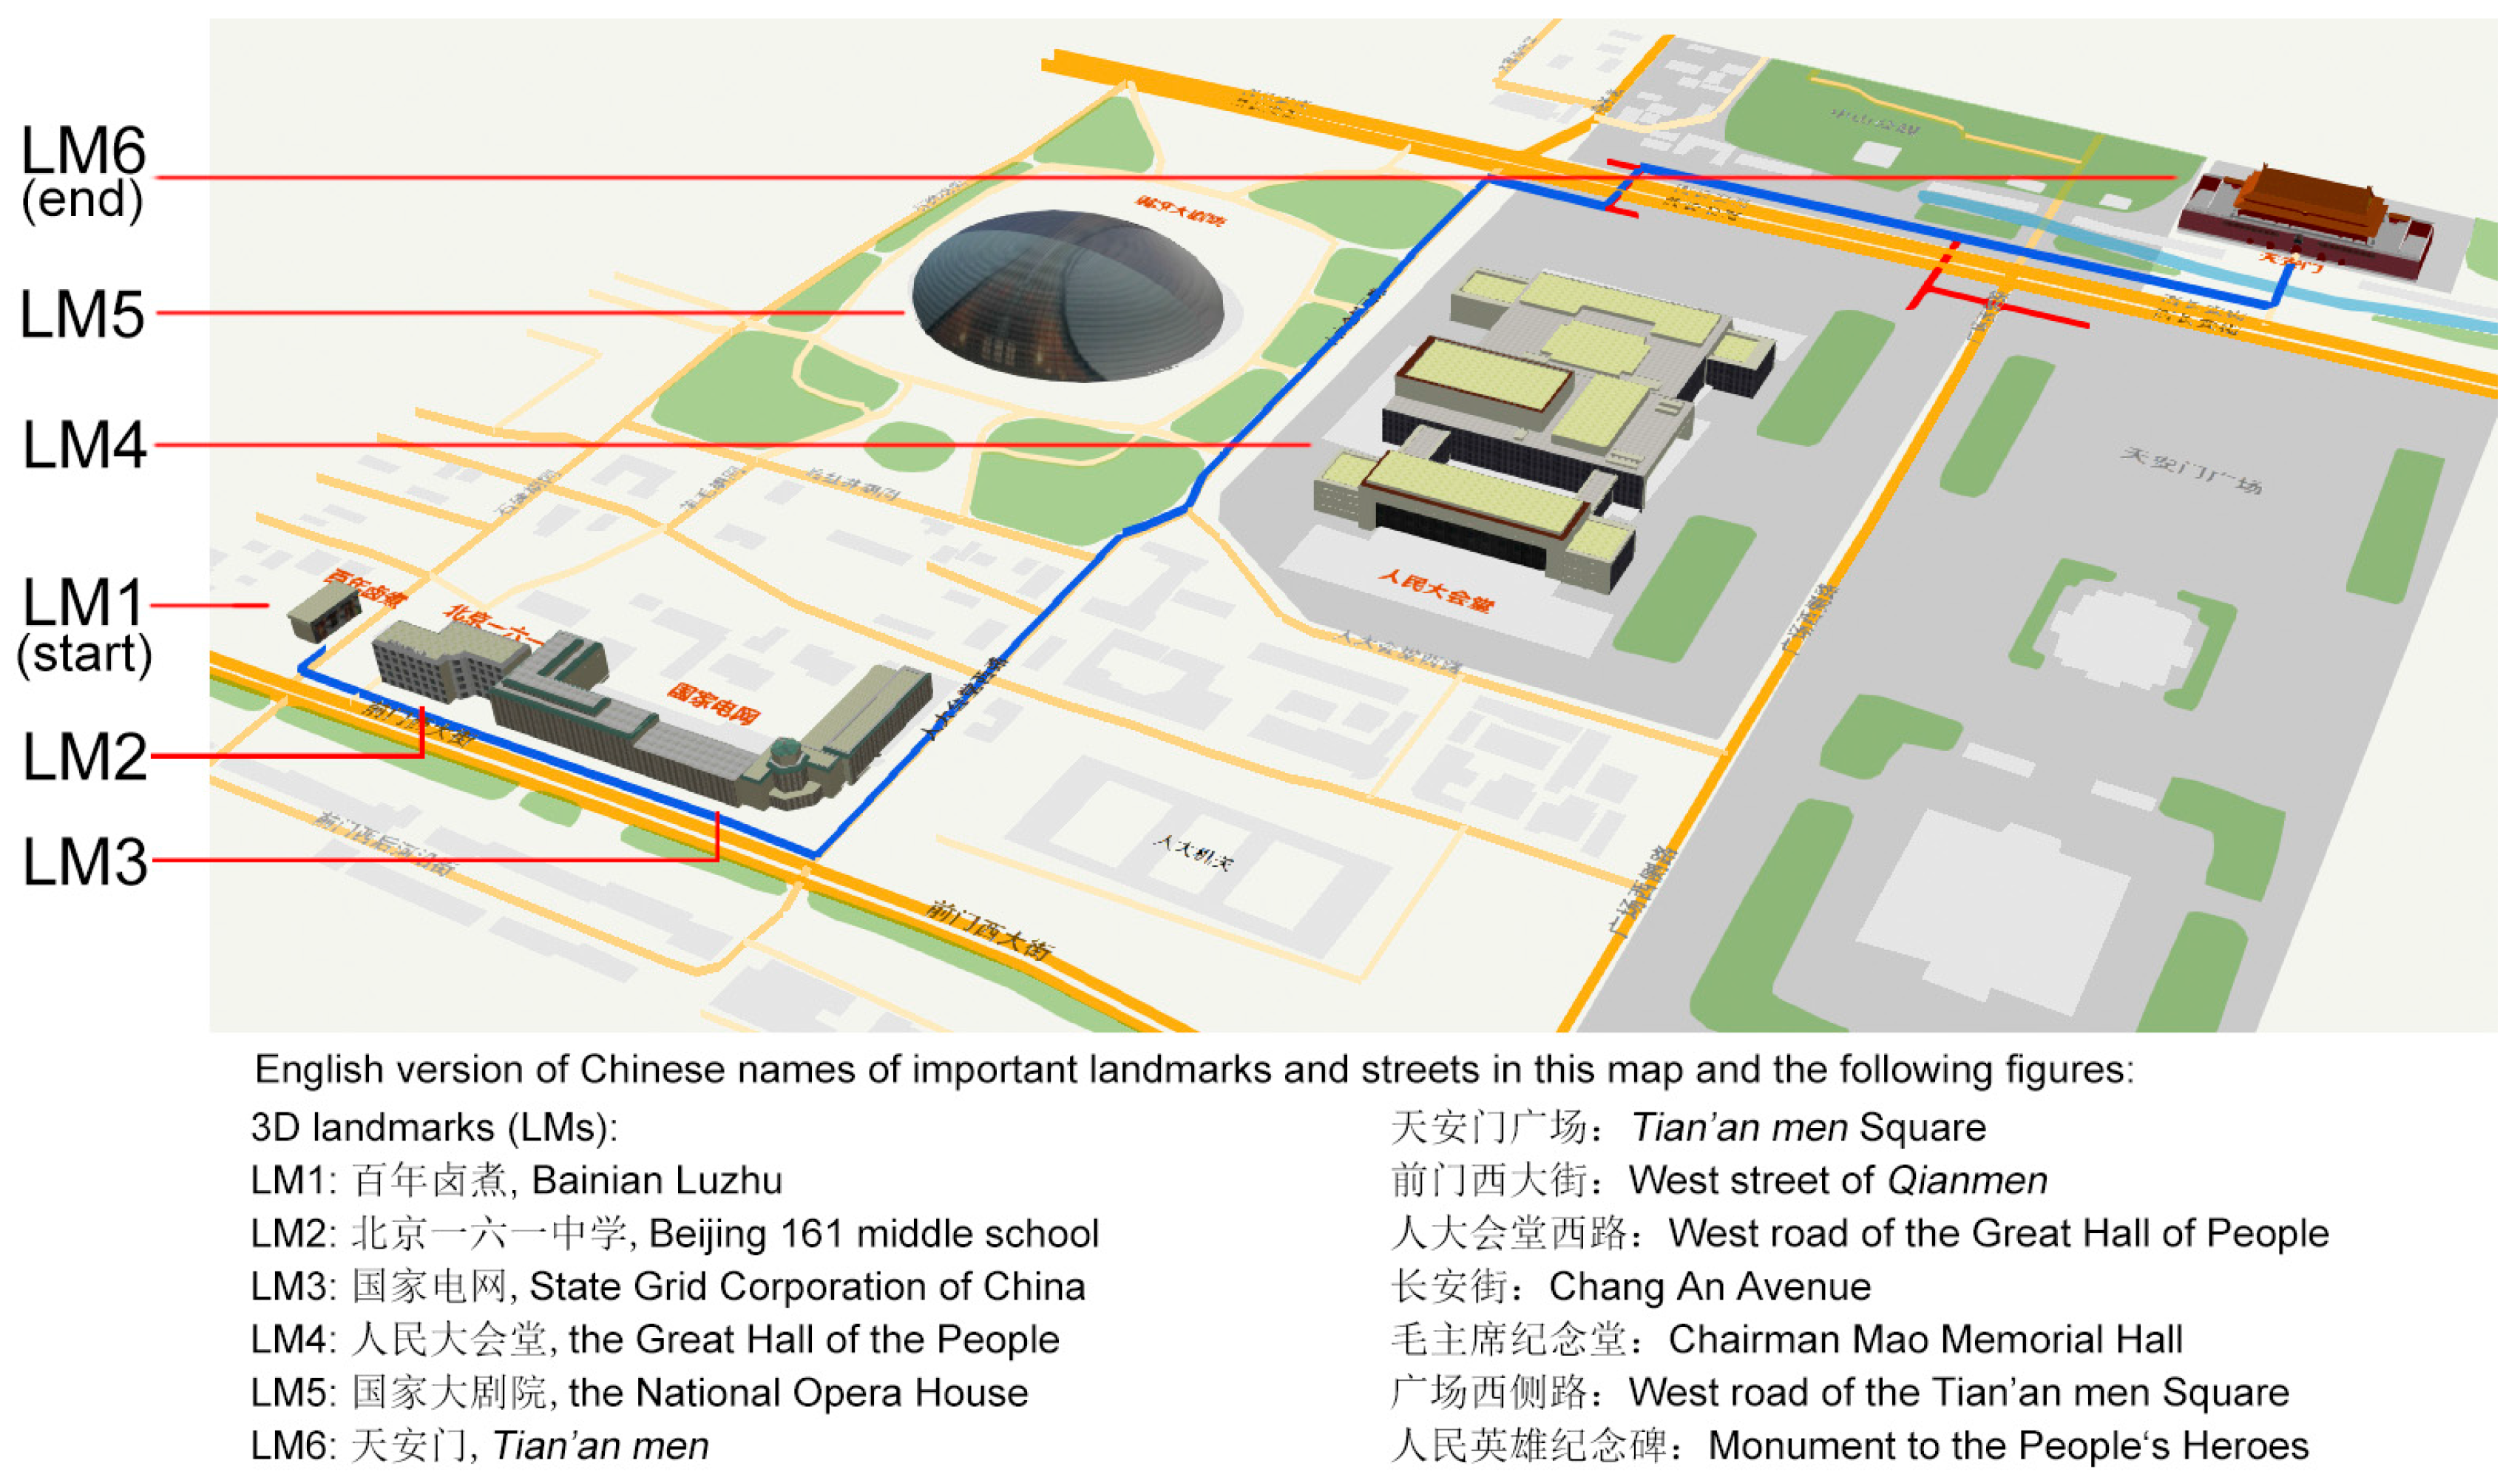
3.6. Stimuli
3.7. Procedure
4. Results and Discussion
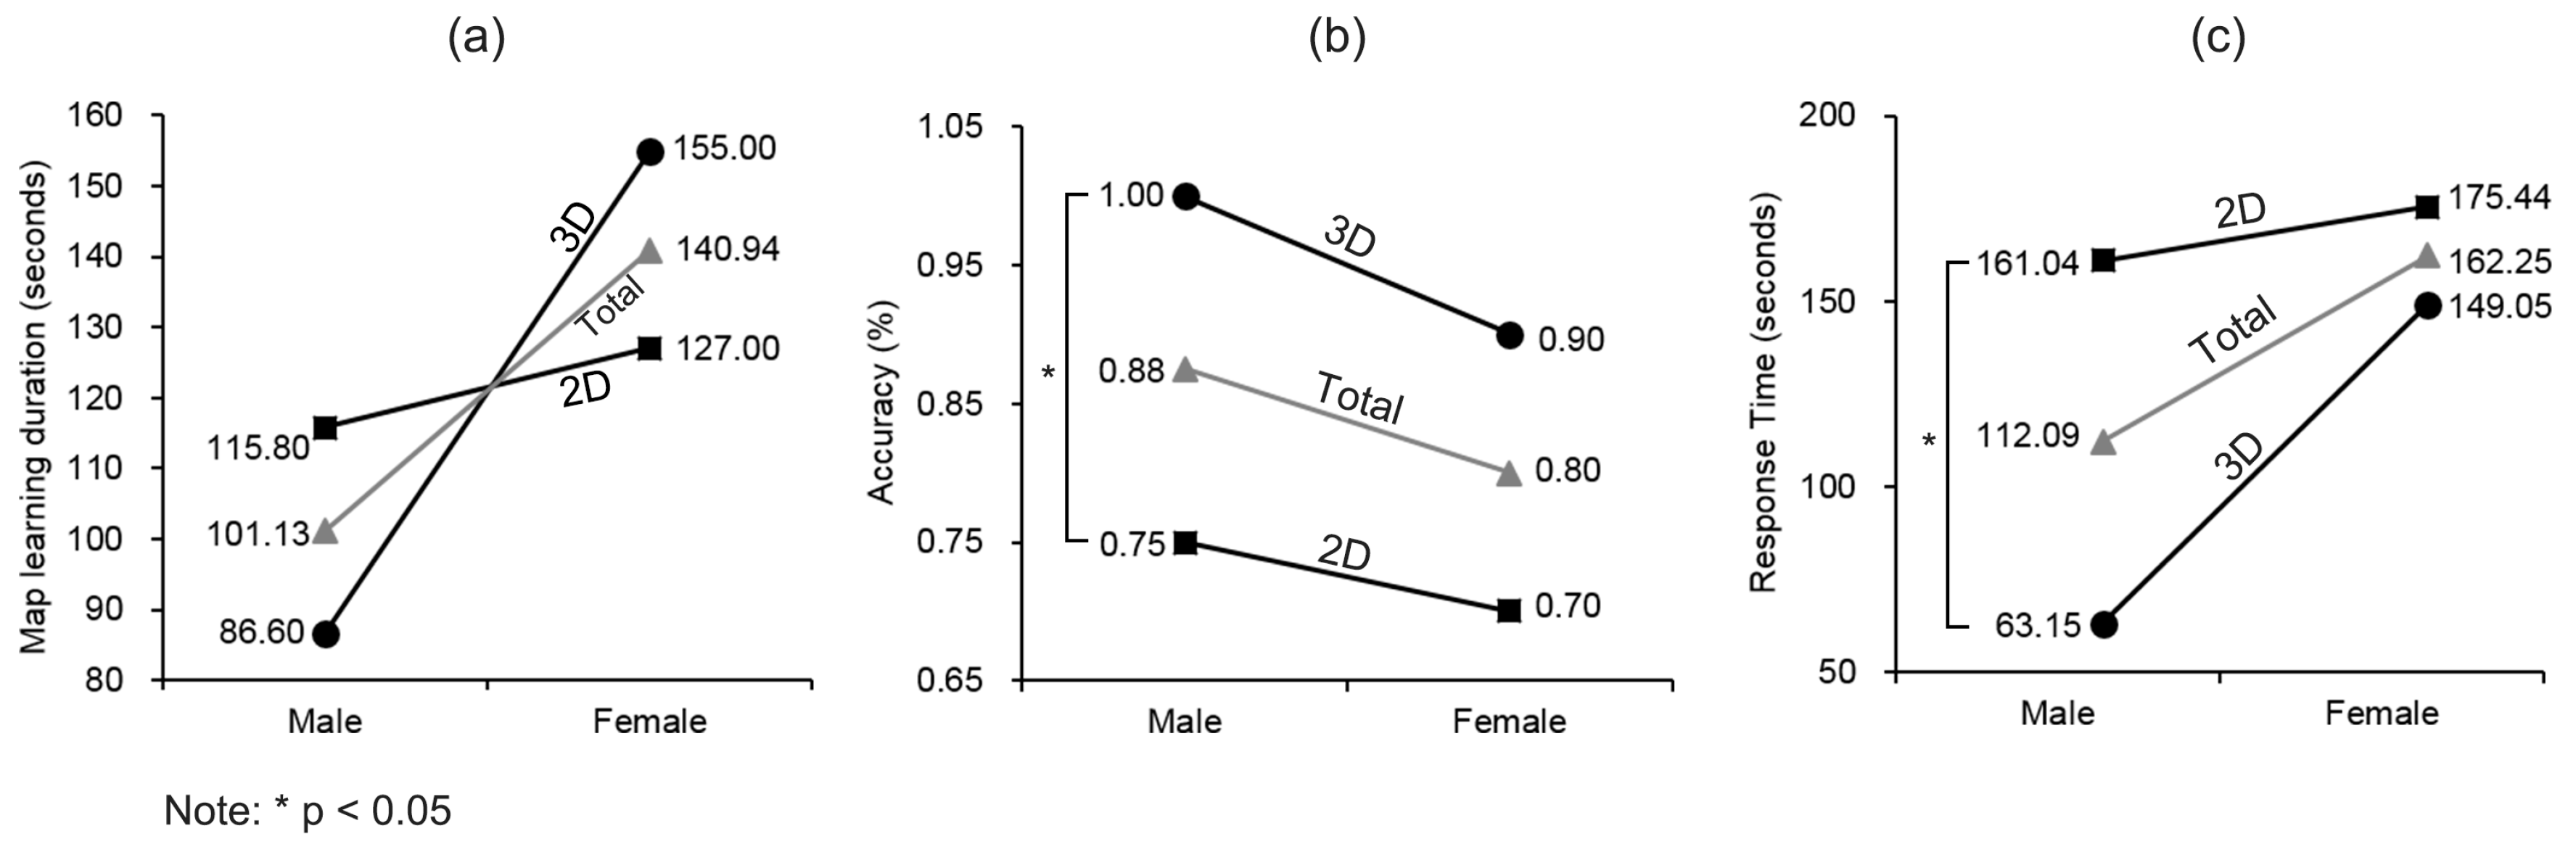
4.1. Map Learning
4.2. General Performance
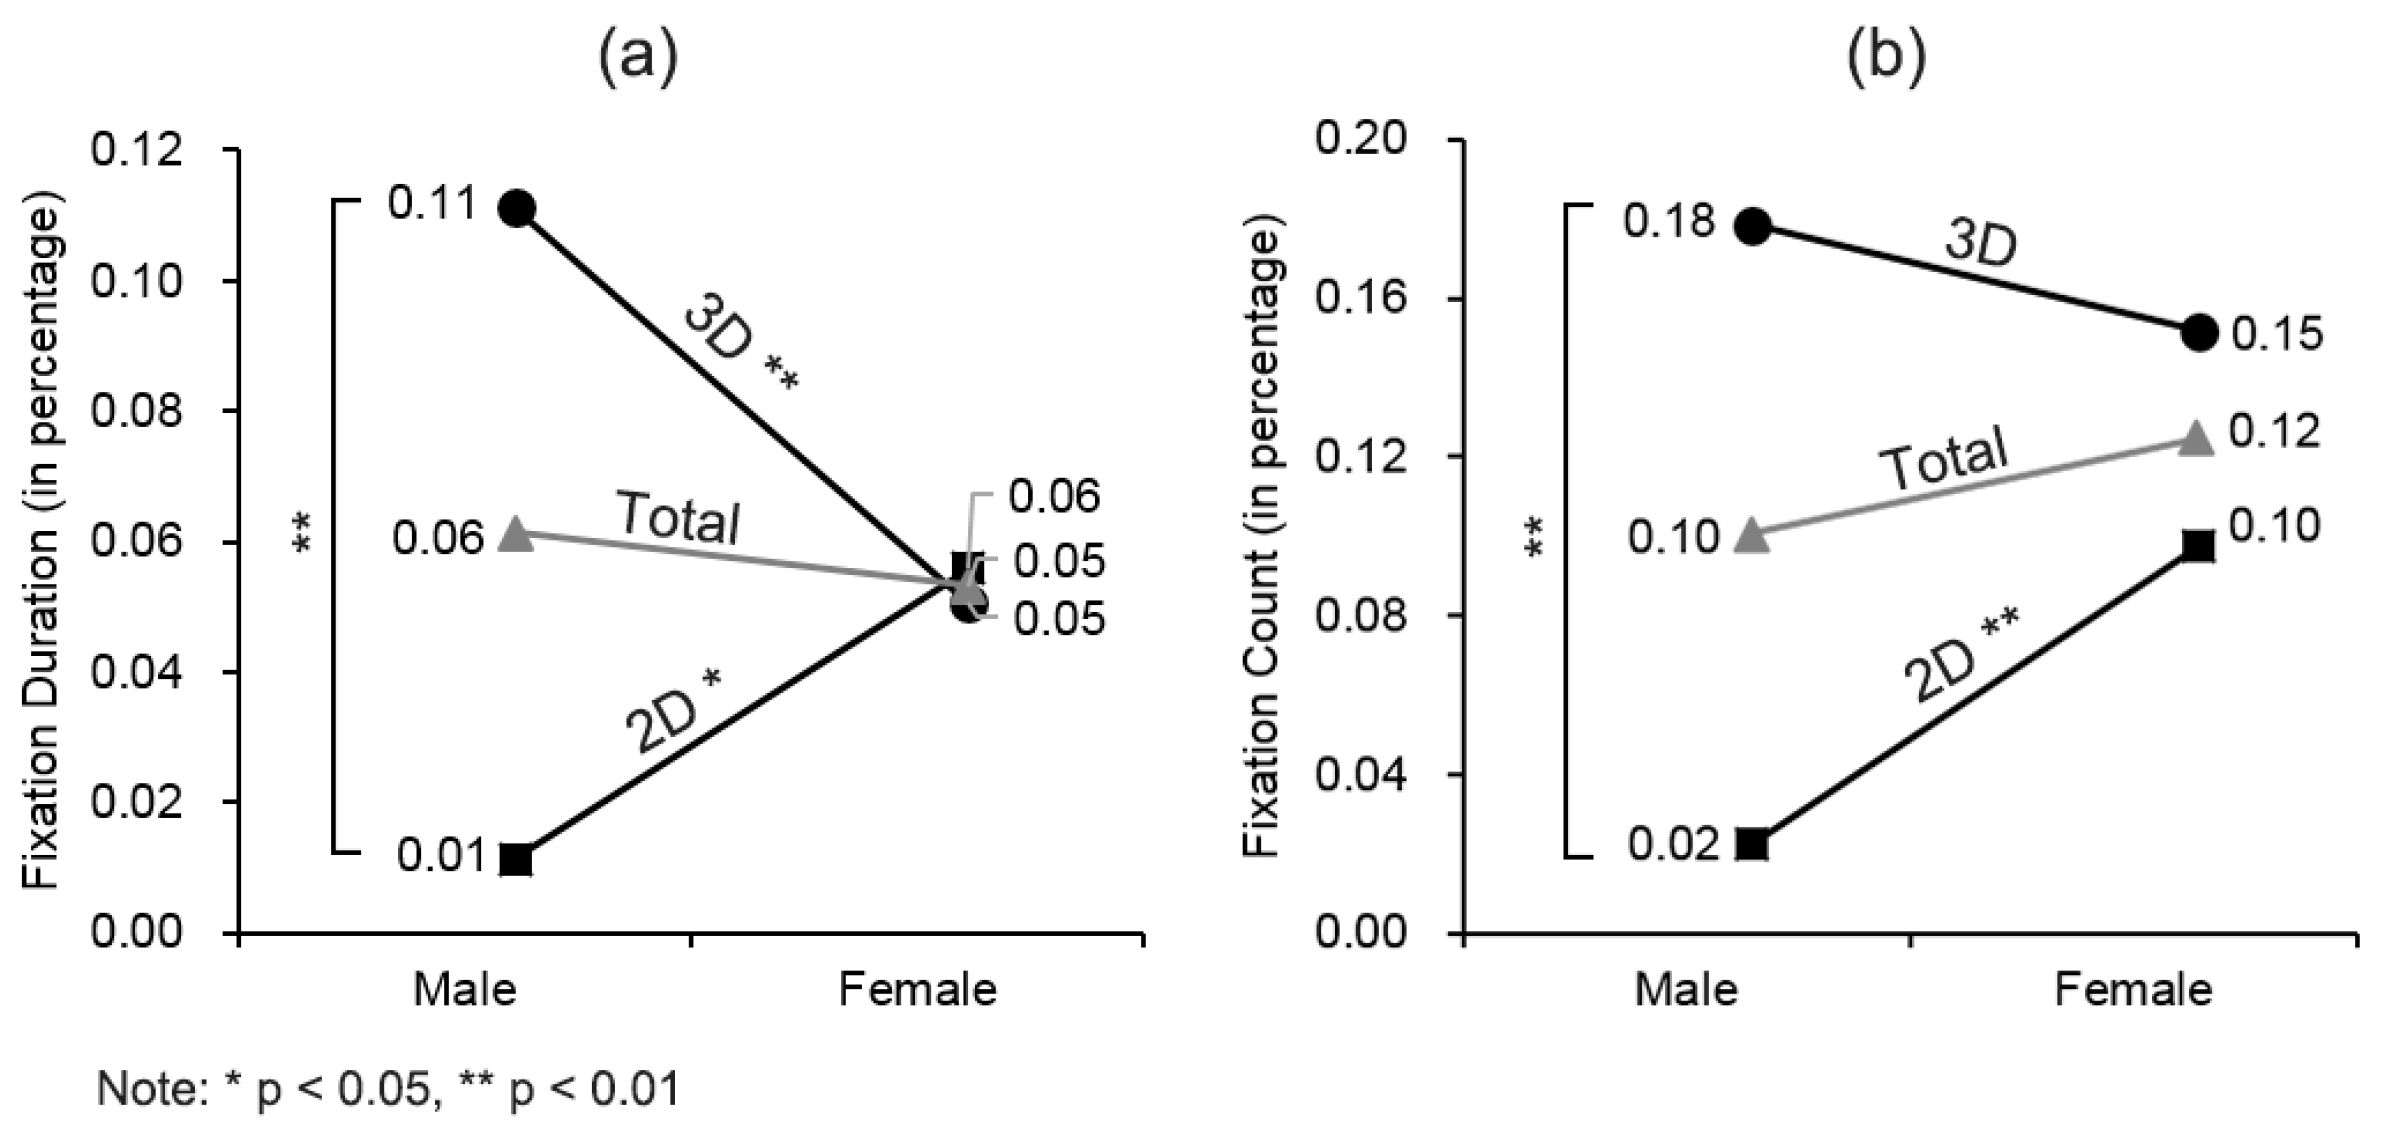
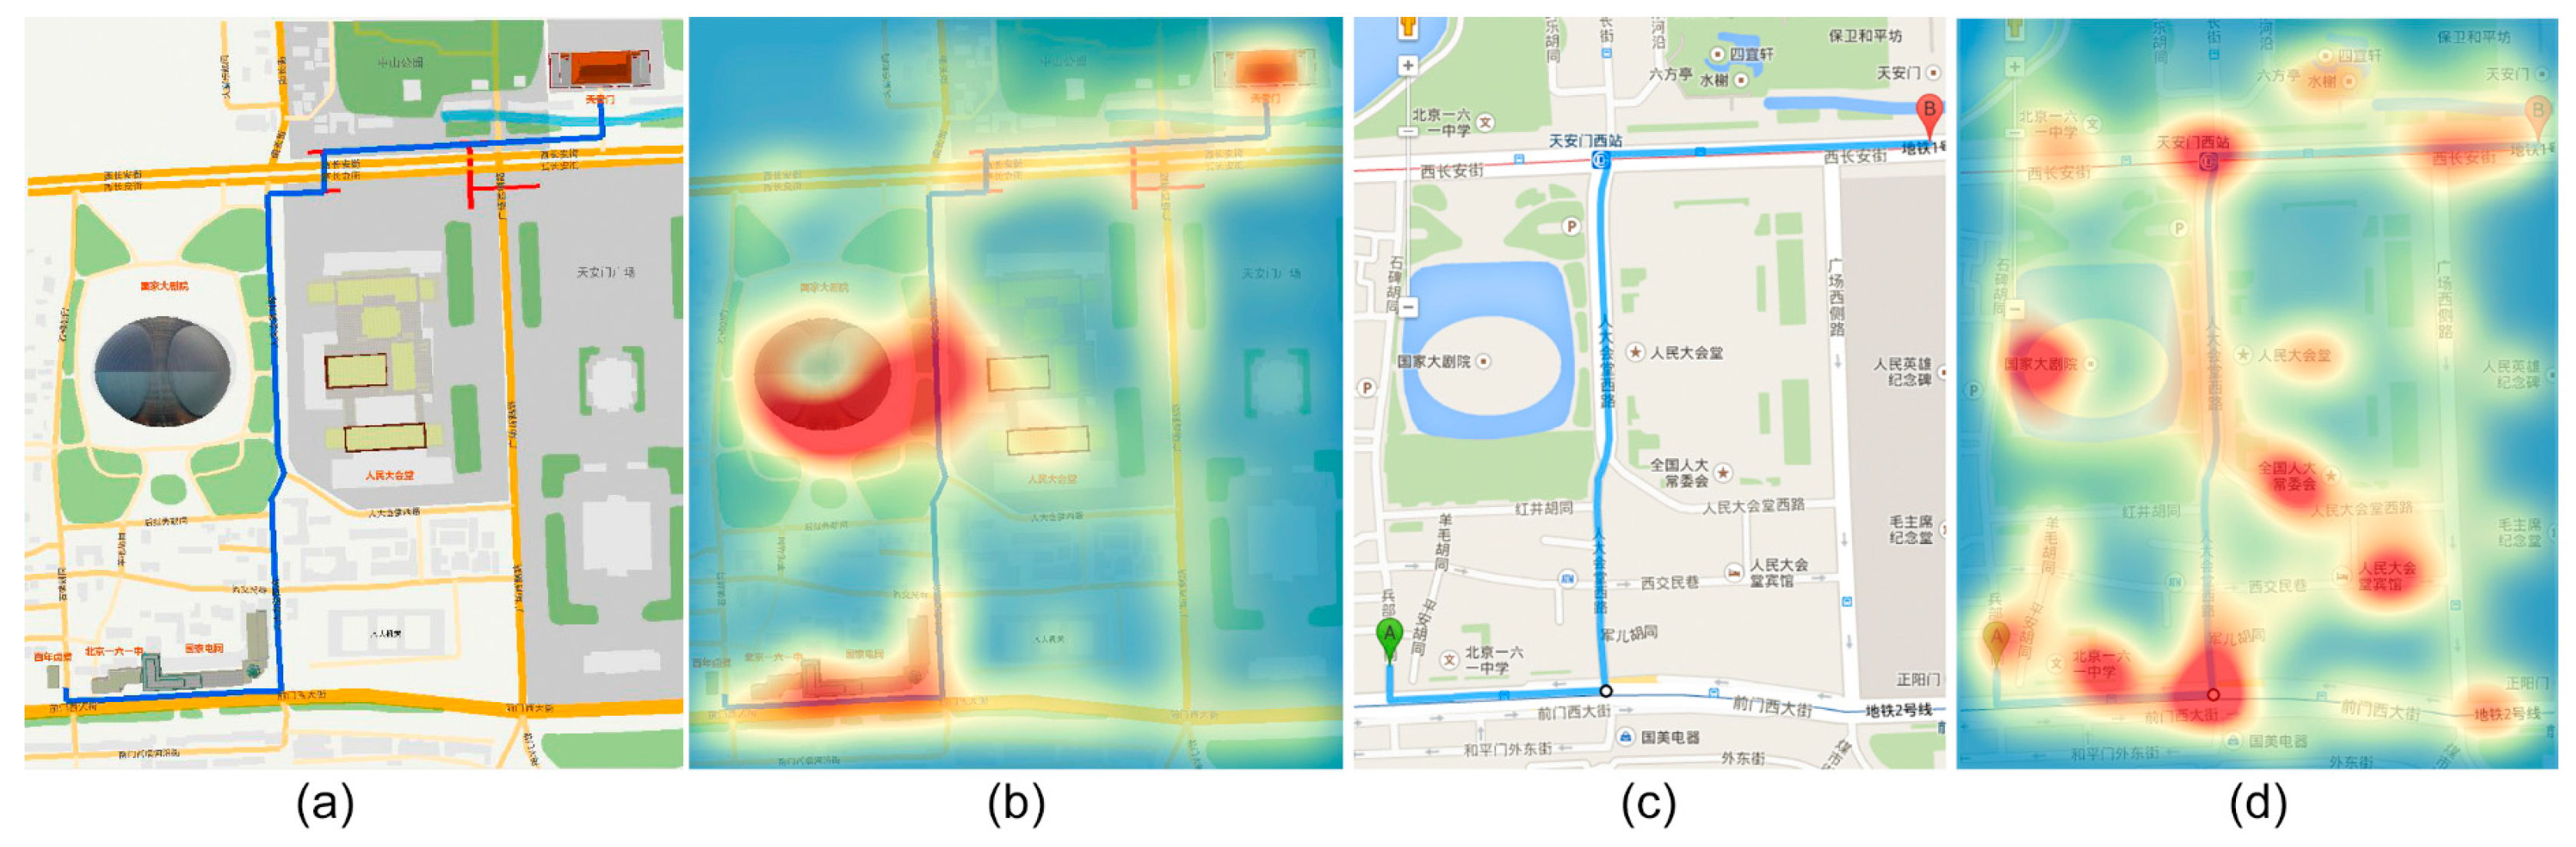
4.3. Visual Attention on Landmarks
4.4. Verbal Protocols
5. General Discussion
5.1. Gender Differences and Its Implications to Map Design
5.2. Limitations
6. Summary and Future Work
Supplementary Materials
Acknowledgments
Author Contributions
Conflicts of Interest
References
- Kray, C.; Elting, C.; Laakso, K.; Coors, V. Presenting route instructions on mobile devices. In Proceedings of the 8th International Conference on Intelligent User Interfaces, Miami, FL, USA, 12–15 January 2003; Leake, D., Johnson, L., Andre, E., Eds.; ACM: New York, NY, USA; Miami, FL, USA, 2003; pp. 117–124. [Google Scholar]
- Plesa, M.A.; Cartwright, W. Evaluating the effectiveness of non-realistic 3D maps for navigation with mobile devices. In Map-Based Mobile Services; Meng, L., Zipf, A., Winter, S., Eds.; Springer: Berlin/Heidelberg, Germany, 2008; pp. 80–104. [Google Scholar]
- Biljecki, F.; Stoter, J.; Ledoux, H.; Zlatanova, S.; Cöltekin, A. Applications of 3D city models: State of the art review. ISPRS Int. J. Geo Inf. 2015, 4, 2842–2889. [Google Scholar] [CrossRef]
- Cöltekin, A.; Lokka, I.-E.; Zahner, M. On the usability and usefulness of 3D (geo)visualizations—A focus on virtual reality environments. In Proceedings of the ISPRS—International Archives of the Photogrammetry, Remote Sensing and Spatial Information Sciences, Prague, Czech Republic, 12–19 July 2016.
- Slocum, T.A.; Blok, C.; Jiang, B.; Koussoulakou, A.; Montello, D.R.; Fuhrmann, S.; Hedley, N.R. Cognitive and usability issues in geovisualization. Cartogr. Geogr. Inf. Sci. 2001, 28, 61–75. [Google Scholar] [CrossRef]
- Knust, C.; Buchroithner, M.F. Principles and terminology of true-3D geovisualisation. Cartogr. J. 2014, 51, 191–202. [Google Scholar] [CrossRef]
- Häberling, C.; Bär, H.; Hurni, L. Proposed cartographic design principles for 3D maps: A contribution to an extended cartographic theory. Cartogr. Int. J. Geogr. Inf. Geovis. 2008, 43, 175–188. [Google Scholar] [CrossRef]
- Popelka, S.; Doležalová, J. Non-photorealistic 3D visualization in city maps: An eye-tracking study. In Modern Trends in Cartography; Brus, J., Vondrakova, A., Vozenilek, V., Eds.; Springer: Berlin/Heidelberg, Germany, 2015; pp. 357–367. [Google Scholar]
- Golledge, R.G. Human wayfinding and cognitive maps. In Wayfinding Behavior: Cognitive Mapping and Other Spatial Processes; Golledge, R.G., Ed.; The Johns Hopkins University Press: Baltimore, MD, USA, 1999; pp. 5–45. [Google Scholar]
- Farr, A.C.; Kleinschmidt, T.; Yarlagadda, P.; Mengersen, K. Wayfinding: A simple concept, a complex process. Transp. Rev. 2012, 32, 715–743. [Google Scholar] [CrossRef] [Green Version]
- Montello, D.R. Navigation. In The Cambridge Handbook of Visuospatial Thinking; Shah, P., Miyake, A., Eds.; Cambridge University Press: New York, NY, USA, 2005; pp. 257–294. [Google Scholar]
- Halpern, D.F.; Collaer, M.L. Sex differences in visuospatial abilities: More than meets the eye. In The Cambridge Handbook of Visuospatial Thinking; Shah, P., Miyake, A., Eds.; Cambridge University Press: New York, NY, USA, 2005; pp. 170–212. [Google Scholar]
- Dabbs, J.M., Jr.; Chang, E.-L.; Strong, R.A.; Milun, R. Spatial ability, navigation strategy, and geographic knowledge among men and women. Evol. Hum. Behav. 1998, 19, 89–98. [Google Scholar] [CrossRef]
- Lawton, C.A. Gender differences in way-finding strategies: Relationship to spatial ability and spatial anxiety. Sex Roles 1994, 30, 765–779. [Google Scholar] [CrossRef]
- Lövdén, M.; Herlitz, A.; Schellenbach, M.; Grossman-Hutter, B.; Krüger, A.; Lindenberger, U. Quantitative and qualitative sex differences in spatial navigation. Scand. J. Psychol. 2007, 48, 353–358. [Google Scholar] [CrossRef] [PubMed]
- Devlin, A.S.; Bernstein, J. Interactive way-finding: Map style and effectiveness. J. Environ. Psychol. 1997, 17, 99–110. [Google Scholar] [CrossRef]
- Tlauka, M.; Brolese, A.; Pomeroy, D.; Hobbs, W. Gender differences in spatial knowledge acquired through simulated exploration of a virtual shopping centre. J. Environ. Psychol. 2005, 25, 111–118. [Google Scholar] [CrossRef]
- Allen, G.L. Men and women, maps and minds. In Spatial Cognition: Foundations and Applications: Selected Papers from Mind III, Annual Conference of the Cognitive Science Society of Ireland, 1998; John Benjamins Publishing: Amsterdam, The Netherlands, 2000; p. 3. [Google Scholar]
- Henrie, R.L.; Aron, R.H.; Nelson, B.D.; Poole, D.A. Gender-related knowledge variations within geography. Sex Roles 1997, 36, 605–623. [Google Scholar] [CrossRef]
- Coluccia, E.; Iosue, G.; Brandimonte, M.A. The relationship between map drawing and spatial orientation abilities: A study of gender differences. J. Environ. Psychol. 2007, 27, 135–144. [Google Scholar] [CrossRef]
- Lloyd, R.E.; Bunch, R.L. Individual differences in map reading spatial abilities using perceptual and memory processes. Cartogr. Geogr. Inf. Sci. 2005, 32, 33–46. [Google Scholar] [CrossRef]
- Montello, D.R.; Lovelace, K.L.; Golledge, R.G.; Self, C.M. Sex-related differences and similarities in geographic and environmental spatial abilities. Ann. Assoc. Am. Geogr. 1999, 89, 515–534. [Google Scholar] [CrossRef]
- Coluccia, E.; Louse, G. Gender differences in spatial orientation: A review. J. Environ. Psychol. 2004, 24, 329–340. [Google Scholar] [CrossRef]
- Shepherd, I.D. Travails in the third dimension: A critical evaluation of three-dimensional geographical visualization. In Geographic Visualization: Concepts, Tools and Applications; Dodge, M., McDerby, M., Turner, M., Eds.; John Wiley & Sons: Chichester, UK, 2008; pp. 199–222. [Google Scholar]
- Zanola, S.; Fabrikant, S.I.; Cöltekin, A. The effect of realism on the confidence in spatial data quality in stereoscopic 3D displays. In Proceedings of the 24th International Cartography Conference (ICC 2009), Santiago, Chile, 15–21 November 2009.
- Wilkening, J.; Fabrikant, S.I. How do decision time and realism affect map-based decision making? In Spatial Information Theory; Egenhofer, M., Giudice, N., Moratz, R., Worboys, M., Eds.; Springer: Berlin/Heidelberg, Germany, 2011; pp. 1–19. [Google Scholar]
- Laakso, K.; Gjesdal, O.; Sulebak, J.R. Tourist information and navigation support by using 3D maps displayed on mobile devices. In Proceedings of the Workshop on Mobile Guides (Mobile HCI 2003 Symposium), Udine, Italy, 8 September 2003.
- Delikostidis, I.; van Elzakker, C.P. Geo-identification and pedestrian navigation with geo-mobile applications: How do users proceed? In Location Based Services and Telecartography II; Gartner, G., Rehrl, K., Eds.; Springer: Berlin/Heidelberg, Germany, 2009; pp. 185–206. [Google Scholar]
- Liao, H.; Dong, W.; Peng, C.; Liu, H. Exploring differences of visual attention in pedestrian navigation when using 2D maps and 3D geo-browsers. Cartogr. Geogr. Inf. Sci. 2016, 1–17. [Google Scholar] [CrossRef]
- Lei, T.-C.; Wu, S.-C.; Chao, C.-W.; Lee, S.-H. Evaluating differences in spatial visual attention in wayfinding strategy when using 2D and 3D electronic maps. GeoJ 2014, 1–15. [Google Scholar] [CrossRef]
- Davies, C.; Peebles, D. Spaces or scenes: Map-based orientation in urban environments. Spat. Cogn. Computat. 2010, 10, 135–156. [Google Scholar] [CrossRef]
- Bleisch, S.; Dykes, J. Quantitative data graphics in 3D desktop-based virtual environments—An evaluation. Int. J. Digit. Earth 2015, 8, 623–639. [Google Scholar] [CrossRef]
- Golledge, R.G.; Dougherty, V.; Bell, S. Acquiring spatial knowledge: Survey versus route-based knowledge in unfamiliar environments. Ann. Assoc. Am. Geogr. 1995, 85, 134–158. [Google Scholar]
- Kettunen, P.; Irvankoski, K.; Krause, C.M.; Sarjakoski, T.; Sarjakoski, L.T. Geospatial images in the acquisition of spatial knowledge for wayfinding. J. Spat. Inf. Sci. 2015, 75–106. [Google Scholar] [CrossRef]
- Swienty, O.; Reichenbacher, T.; Reppermund, S.; Zihl, J. The role of relevance and cognition in attention-guiding geovisualisation. Cartogr. J. 2008, 45, 227–238. [Google Scholar] [CrossRef]
- Fabrikant, S.I.; Hespanha, S.R.; Hegarty, M. Cognitively inspired and perceptually salient graphic displays for efficient spatial inference making. Ann. Assoc. Am. Geogr. 2010, 100, 13–29. [Google Scholar] [CrossRef]
- De Sabbata, S.; Reichenbacher, T. Criteria of geographic relevance: An experimental study. Int. J. Geogr. Inf. Sci. 2012, 26, 1495–1520. [Google Scholar] [CrossRef]
- Raper, J. Geographic relevance. J. Doc. 2007, 63, 836–852. [Google Scholar] [CrossRef]
- Raubal, M.; Winter, S. Enriching wayfinding instructions with local landmarks. In Giscience 2002, lncs 2478; Egenhofer, M.J., Mark, D.M., Eds.; Springer: Berlin/Heidelberg, Germany, 2002; pp. 243–259. [Google Scholar]
- Nothegger, C.; Winter, S.; Raubal, M. Selection of salient features for route directions. Spat. Cogn. Computat. 2004, 4, 113–136. [Google Scholar] [CrossRef]
- Robinson, A.H.; Morrison, J.L.; Muehrcke, P.C.; Kimerling, A.J.; Guptill, S.C. Elements of Cartography, 6th ed.; John Wiley & Sons: Hoboken, NJ, USA, 1995; p. 688. [Google Scholar]
- Borji, A.; Itti, L. State-of-the-art in visual attention modeling. IEEE Trans. Pattern Anal. 2013, 35, 185–207. [Google Scholar] [CrossRef] [PubMed]
- Henderson, J.M. Human gaze control during real-world scene perception. Trends Cogn. Sci. 2003, 7, 498–504. [Google Scholar] [CrossRef] [PubMed]
- Swienty, O. Attention-Guiding Geovisualisation: A Cognitive Approach of Designing Relevant Geographic Information; der Technischen Universität München: München, Germany, 2008. [Google Scholar]
- Garlandini, S.; Fabrikant, S.I. Evaluating the effectiveness and efficiency of visual variables for geographic information visualization. In Spatial Information Theory; Hornsby, K.S., Claramunt, C., Denis, M., Ligozat, G., Eds.; Springer: Berlin/Heidelberg, Germany, 2009; pp. 195–211. [Google Scholar]
- Itti, L.; Koch, C.; Niebur, E. A model of saliency-based visual attention for rapid scene analysis. IEEE Trans. Pattern Anal. 1998, 20, 1254–1259. [Google Scholar] [CrossRef]
- Steinke, T.R. Eye movement studies in cartography and related fields. Cartogr. Int. J. Geogr. Inf. Geovis. 1987, 24, 40–73. [Google Scholar] [CrossRef]
- Wang, S.; Chen, Y.; Yuan, Y.; Ye, H.; Zheng, S. Visualizing the intellectual structure of eye movement research in cartography. ISPRS Int. J. Geo Inf. 2016, 5, 168. [Google Scholar] [CrossRef]
- Cöltekin, A.; Heil, B.; Garlandini, S.; Fabrikant, S.I. Evaluating the effectiveness of interactive map interface designs: A case study integrating usability metrics with eye-movement analysis. Cartogr. Geogr. Inf. Sci. 2009, 36, 5–17. [Google Scholar] [CrossRef]
- Dong, W.; Liao, H.; Xu, F.; Liu, Z.; Zhang, S. Using eye tracking to evaluate the usability of animated maps. Sci. China Earth Sci. 2014, 57, 512–522. [Google Scholar] [CrossRef]
- Cöltekin, A.; Fabrikant, S.I.; Lacayo, M. Exploring the efficiency of users’ visual analytics strategies based on sequence analysis of eye movement recordings. Int. J. Geogr. Inf. Sci. 2010, 24, 1559–1575. [Google Scholar] [CrossRef]
- Ooms, K.; De Maeyer, P.; Fack, V. Study of the attentive behavior of novice and expert map users using eye tracking. Cartogr. Geogr. Inf. Sci. 2014, 41, 37–54. [Google Scholar] [CrossRef] [Green Version]
- Giannopoulos, I.; Kiefer, P.; Raubal, M. The influence of gaze history visualization on map interaction sequences and cognitive maps. In Proceedings of the 1st ACM SIGSPATIAL International Workshop on MapInteraction, Orlando, FL, USA, 5–8 November 2013; ACM: New York, NY, USA; Orlando, FL, USA, 2013; pp. 1–6. [Google Scholar]
- Kiefer, P.; Giannopoulos, I.; Raubal, M. Where am I? Investigating map matching during self-localization with mobile eye tracking in an urban environment. Trans. GIS 2014, 18, 660–686. [Google Scholar] [CrossRef]
- Kiefer, P.; Giannopoulos, I.; Raubal, M.; Duchowski, A.T. Eye tracking for spatial research: Cognition, computation, challenges. Spat. Cogn. Computat. 2017, 17. [Google Scholar] [CrossRef]
- Delikostidis, I. Improving the Usability of Pedestrian Navigation Systems. Ph.D. Dissertation, University of Twente, Enschede, The Netherland, 2011. [Google Scholar]
- Spiers, H.J.; Maguire, E.A. The dynamic nature of cognition during wayfinding. J. Environ. Psychol. 2008, 28, 232–249. [Google Scholar] [CrossRef] [PubMed]
- Caduff, D.; Timpf, S. On the assessment of landmark salience for human navigation. Cogn. Process. 2008, 9, 249–267. [Google Scholar] [CrossRef] [PubMed]
- Anguelov, D.; Dulong, C.; Filip, D.; Frueh, C.; Lafon, S.; Lyon, R.; Ogale, A.; Vincent, L.; Weaver, J. Google street view: Capturing the world at street level. Computer 2010, 43, 32–38. [Google Scholar] [CrossRef]
- Lynch, K. The Image of the City; MIT Press: Cambridge, MA, USA, 1960; Volume 11. [Google Scholar]
- MacEachren, A.M. Application of environmental learning theory to spatial knowledge acquisition from maps. Ann. Assoc. Am. Geogr. 1992, 82, 245–274. [Google Scholar] [CrossRef]
- Tobii. Tobii Studio User’s Manual Version 3.4.5. Available online: http://www.tobiipro.com/siteassets/tobii-pro/user-manuals/tobii-pro-studio-user-manual.pdf (accessed on 18 September 2016).
- Olsson, P. Real-Time and Offline Filters for Eye Tracking. Master’s Thesis, Royal Institute of Technology, Stockholm, Sweden, April 2007. [Google Scholar]
- Salvucci, D.D.; Goldberg, J.H. Identifying fixations and saccades in eye-tracking protocols. In Proceedings of the 2000 Symposium on Eye Tracking Research & Applications, Palm Beach Gardens, FL, USA, 6–8 November 2000; ACM: New York, NY, USA, 2000; pp. 71–78. [Google Scholar]
- Komogortsev, O.V.; Gobert, D.V.; Jayarathna, S.; Koh, D.H.; Gowda, S.M. Standardization of automated analyses of oculomotor fixation and saccadic behaviors. IEEE Trans. Bio Med. Eng. 2010, 57, 2635–2645. [Google Scholar] [CrossRef] [PubMed]
- Dong, W.; Liao, H.; Roth, R.E.; Wang, S. Eye tracking to explore the potential of enhanced imagery basemaps in web mapping. Cartogr. J. 2014, 51, 313–329. [Google Scholar] [CrossRef]
- Ooms, K.; De Maeyer, P.; Fack, V.; Van Assche, E.; Witlox, F. Interpreting maps through the eyes of expert and novice users. Int. J. Geogr. Inf. Sci. 2012, 26, 1773–1788. [Google Scholar] [CrossRef]
- Ooms, K.; Coltekin, A.; De Maeyer, P.; Dupont, L.; Fabrikant, S.; Incoul, A.; Kuhn, M.; Slabbinck, H.; Vansteenkiste, P.; Van der Haegen, L. Combining user logging with eye tracking for interactive and dynamic applications. Behav. Res. Methods 2015, 47, 977–993. [Google Scholar] [CrossRef] [PubMed] [Green Version]
- Andersen, N.E.; Dahmani, L.; Konishi, K.; Bohbot, V.D. Eye tracking, strategies, and sex differences in virtual navigation. Neurobiol. Learn. Mem. 2012, 97, 81–89. [Google Scholar] [CrossRef] [PubMed]
- Franke, C.; Schweikart, J. Mental representation of landmarks on maps—Investigating cartographic visualization methods with eye tracking technology. Spat. Cogn. Computat. 2016, 1–19. [Google Scholar] [CrossRef]
- Emo, B. Wayfinding in real cities: Experiments at street corners. In Proceedings of the Spatial Cognition VIII: International Conference, Spatial Cognition 2012, Kloster Seeon, Germany, 31 August–3 September 2012; Stachniss, C., Schill, K., Uttal, D., Eds.; Springer: Berlin/Heidelberg, Germany, 2012; pp. 461–477. [Google Scholar]
- Lawton, C.A. Gender, spatial abilities, and wayfinding. In Handbook of Gender Research in Psychology; Chrisler, J.C., McCreary, D.R., Eds.; Springer: Heidelberg, Germany, 2010; Volume 1, pp. 317–341. [Google Scholar]
- Silverman, I.; Choi, J.; Peters, M. The hunter-gatherer theory of sex differences in spatial abilities: Data from 40 countries. Arch. Sex. Behav. 2007, 36, 261–268. [Google Scholar] [CrossRef] [PubMed]
- Woodard, E.H.; Gridina, N. Media in the Home 2000: The Fifth Annual Survey of Parents and Children. Available online: http://www.annenbergpublicpolicycenter.org/Downloads/Media_and_Developing_Child/mediasurvey/survey7.pdf (accessed on 12 December 2016).
- Richardson, A.E.; Montello, D.R.; Hegarty, M. Spatial knowledge acquisition from maps and from navigation in real and virtual environments. Mem. Cogn. 1999, 27, 741–750. [Google Scholar] [CrossRef]
- Ruddle, R.A.; Payne, S.J.; Jones, D.M. Navigating buildings in “desktop” virtual environments: Experimental investigations using extended navigational experience. J. Exp. Psychol. Appl. 1997, 3, 143. [Google Scholar] [CrossRef]
- Huang, H.; Klettner, S.; Schmidt, M.; Gartner, G.; Leitinger, S.; Wagner, A.; Steinmann, R. Affectroute-considering people’s affective responses to environments for enhancing route-planning services. Int. J. Geogr. Inf. Sci. 2014, 28, 2456–2473. [Google Scholar] [CrossRef]
- Quercia, D.; Schifanella, R.; Aiello, L.M. The shortest path to happiness: Recommending beautiful, quiet, and happy routes in the city. In Proceedings of the 25th ACM Conference on Hypertext and Social Media, Santiago, Chile, 1–4 Septermber 2014; pp. 116–125.
- Allen, G.L. Spatial abilities, cognitive maps, and wayfinding. In Wayfinding Behavior: Cognitive Mapping and Other Spatial Processes; Golledge, R.G., Ed.; The Johns Hopkins University Press: Baltimore, MD, USA, 1999; pp. 46–80. [Google Scholar]
- Hegarty, M.; Montello, D.R.; Richardson, A.E.; Ishikawa, T.; Lovelace, K. Spatial abilities at different scales: Individual differences in aptitude-test performance and spatial-layout learning. Intelligence 2006, 34, 151–176. [Google Scholar] [CrossRef]
- Hegarty, M.; Richardson, A.E.; Montello, D.R.; Lovelace, K.; Subbiah, I. Development of a self-report measure of environmental spatial ability. Intelligence 2002, 30, 425–447. [Google Scholar] [CrossRef]
- Lobben, A.K. Navigational map reading: Predicting performance and identifying relative influence of map-related abilities. Ann. Assoc. Am. Geogr. 2007, 97, 64–85. [Google Scholar] [CrossRef]
- Fonteyn, M.E.; Kuipers, B.; Grobe, S.J. A description of think aloud method and protocol analysis. Qual. Health Res. 1993, 3, 430–441. [Google Scholar] [CrossRef]
- Someren, M.V.; Barnard, Y.F.; Sandberg, J.A. The Think Aloud Method: A Practical Approach to Modelling Cognitive Processes; Academic Press: Cambridge, MA, USA, 1994. [Google Scholar]
- Cooke, L. Assessing concurrent think-aloud protocol as a usability test method: A technical communication approach. IEEE Trans. Prof. Commun. 2010, 53, 202–215. [Google Scholar] [CrossRef]
- Elling, S.; Lentz, L.; De Jong, M. Combining concurrent think-aloud protocols and eye-tracking observations: An analysis of verbalizations and silences. IEEE Trans. Prof. Commun. 2012, 55, 206–220. [Google Scholar] [CrossRef]
- Schwarzkopf, S.; von Stülpnagel, R.; Büchner, S.J.; Konieczny, L. What lab eye tracking tells us about wayfinding: A comparison of stationary and mobile eye tracking in a large building scenario. In Proceedings of the 2nd International Workshop on Eye Tracking for Spatial Research (in Conjunction with GIScience 2014), Vienna, Austria, 23 September 2014.
- Dolezalova, J.; Popelka, S. Evaluation of the user strategy on 2D and 3D city maps based on novel scanpath comparison method and graph visualization. In Proceedings of the ISPRS—International Archives of the Photogrammetry, Remote Sensing and Spatial Information Sciences, Prague, Czech Republic, 12–19 July 2016.
- Ooms, K.; Andrienko, G.; Andrienko, N.; De Maeyer, P.; Fack, V. Analysing the spatial dimension of eye movement data using a visual analytic approach. Expert Syst. Appl. 2012, 39, 1324–1332. [Google Scholar] [CrossRef] [Green Version]


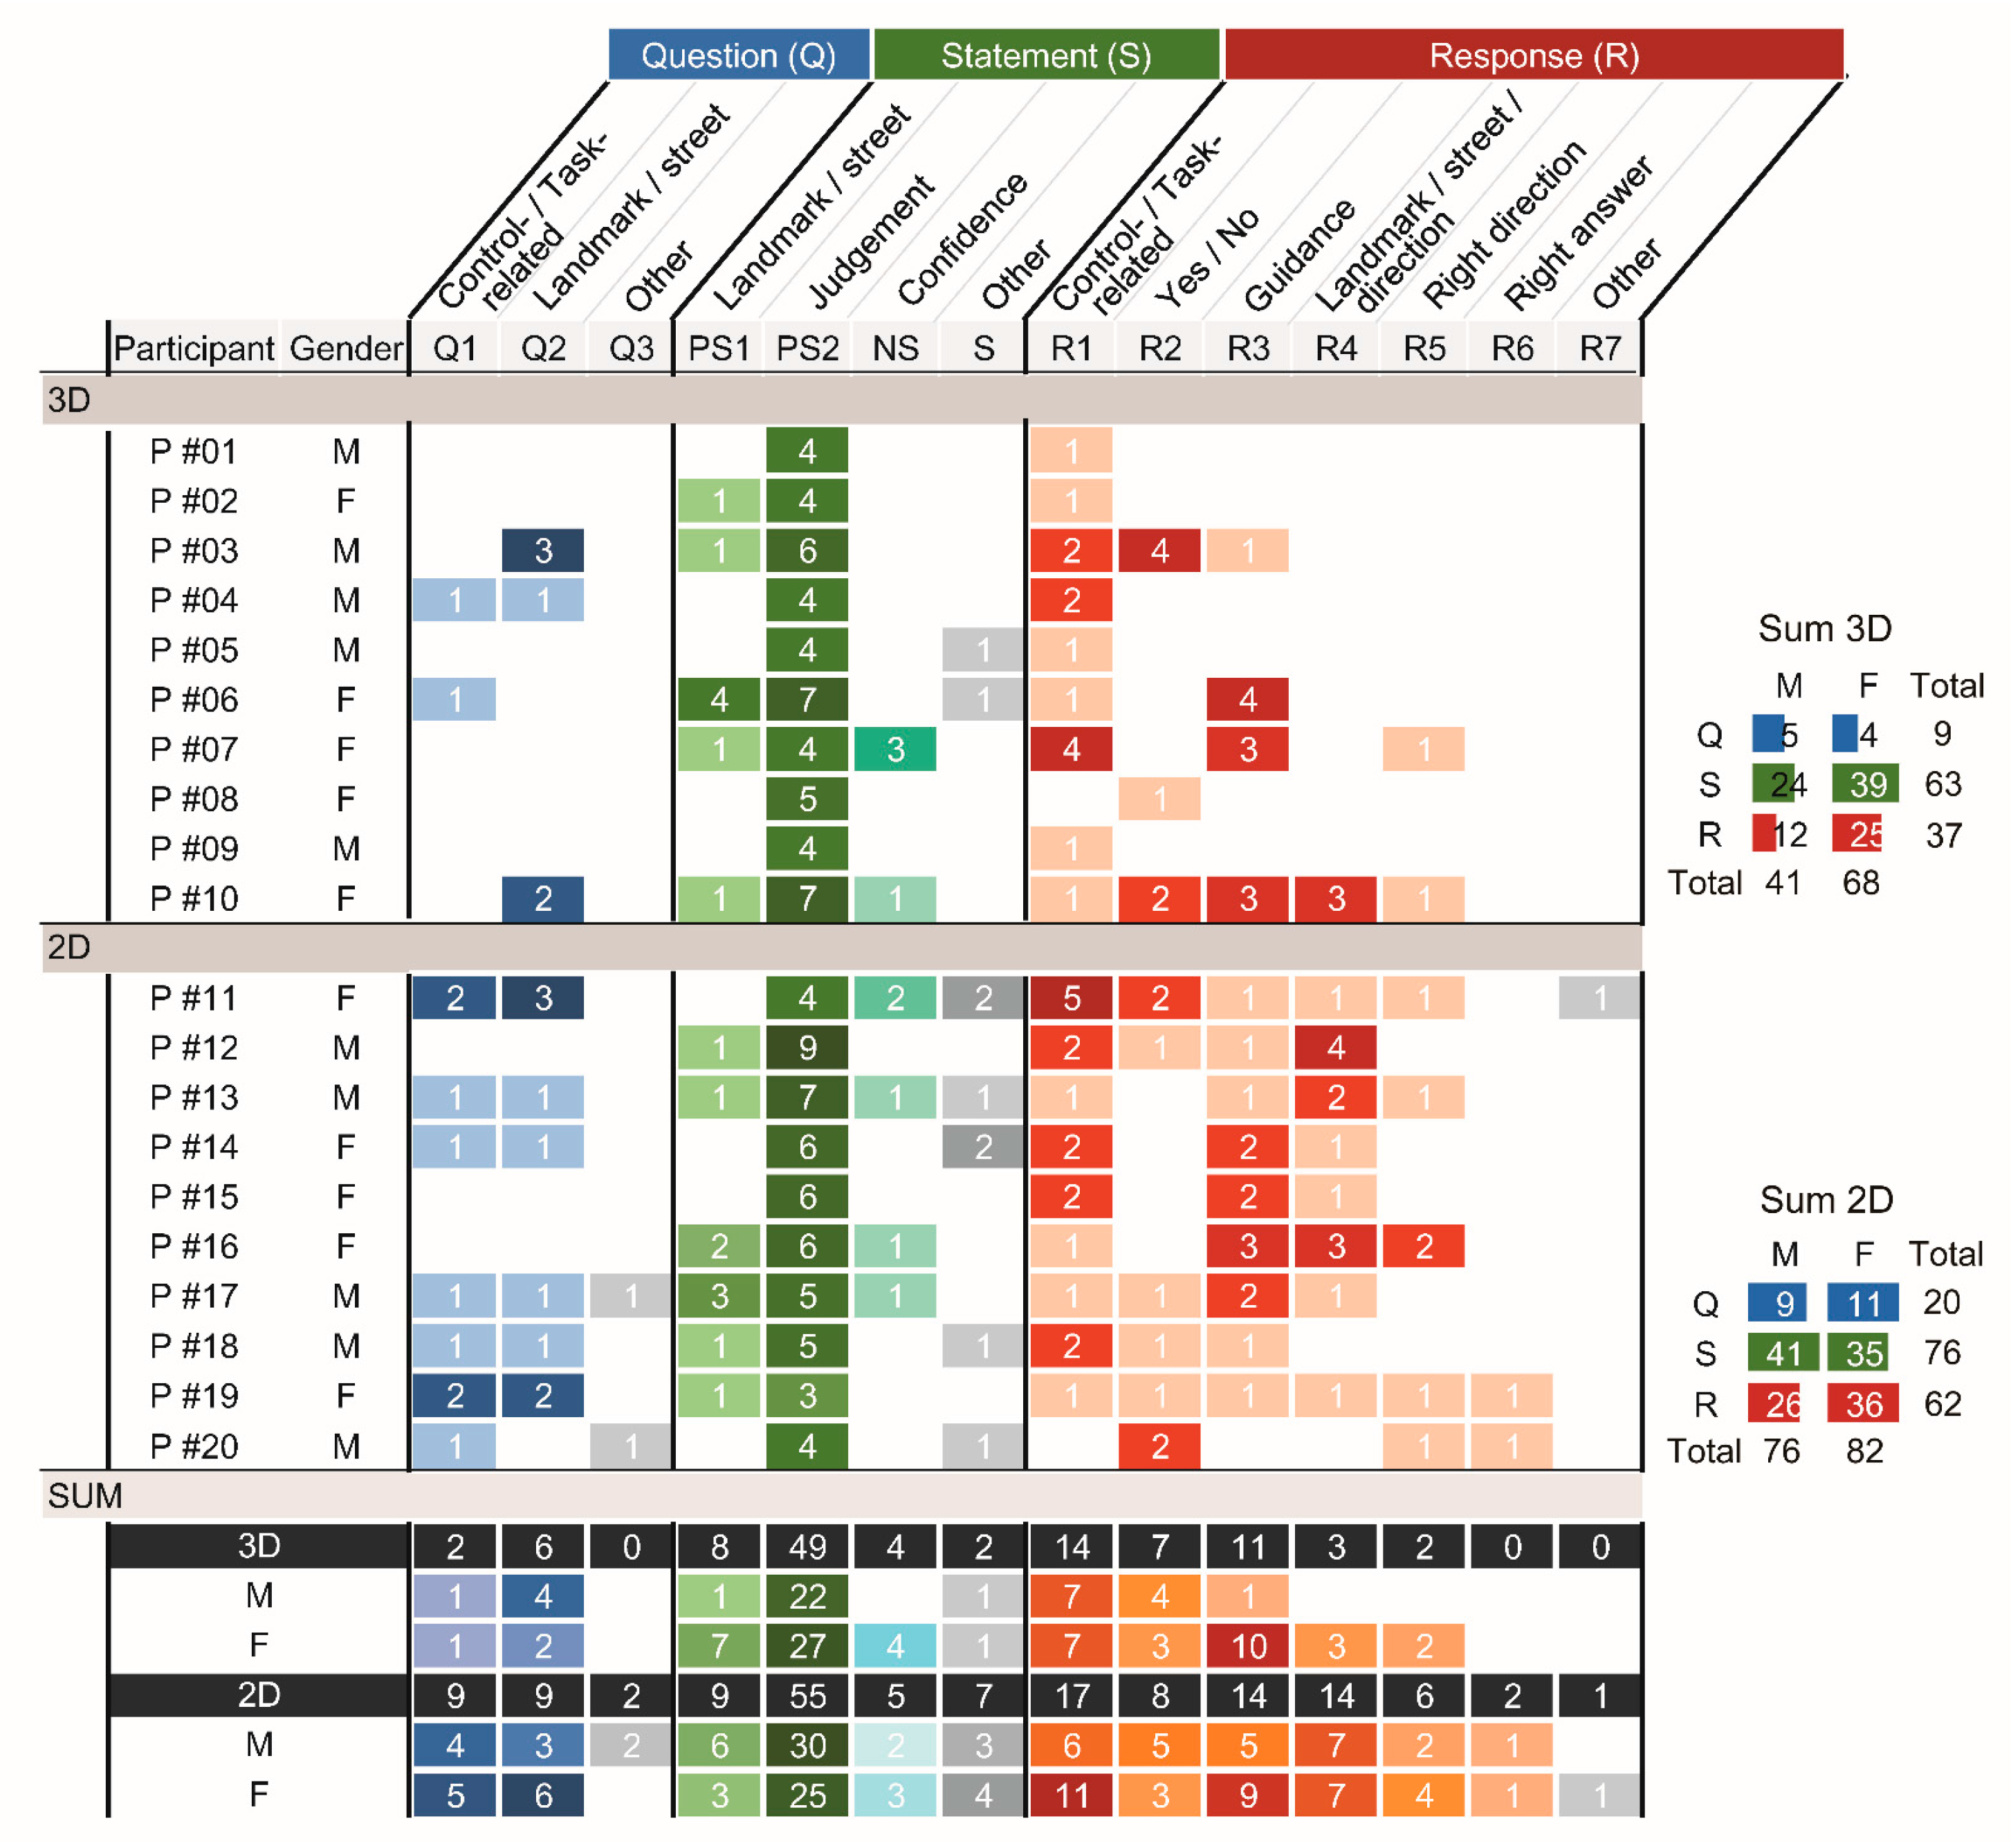
| Code | Description | Typical Example(s) |
|---|---|---|
| Question (Q) | ||
| Q1 | Questions about controlling the street view and the task at hand | (1) What should I do now? (2) Can I zoom in? |
| Q2 | Questions intended to confirm landmarks and streets | Is this the Great Hall/West Avenue? |
| Q3 | Other | What is this? |
| Statement (S) | ||
| PS1 | Positive statements about landmarks/streets | This should be the Great Hall/West Avenue. |
| PS2 | Positive judgment | I should go north/to West Avenue. |
| NS | Negative statement | (1) I’m not sure. (2) I’m lost. (3) I don’t know. |
| S | Other | |
| Response (R) | ||
| R1 | Instructions about controlling the street view and the current task | You should look around and tell me which direction you should go. |
| R2 | Yes/No | |
| R3 | Questions to guide the participants | Can you remember which direction is north? |
| R4 | The names of landmarks, streets, and directions | This is the Great Hall/West Avenue/north. |
| R5 | Telling the right direction | You should go north. |
| R6 | Showing the right answer | You should go this way. |
| R7 | Other | |
© 2017 by the authors. Licensee MDPI, Basel, Switzerland. This article is an open access article distributed under the terms and conditions of the Creative Commons Attribution (CC BY) license ( http://creativecommons.org/licenses/by/4.0/).
Share and Cite
Liao, H.; Dong, W. An Exploratory Study Investigating Gender Effects on Using 3D Maps for Spatial Orientation in Wayfinding. ISPRS Int. J. Geo-Inf. 2017, 6, 60. https://doi.org/10.3390/ijgi6030060
Liao H, Dong W. An Exploratory Study Investigating Gender Effects on Using 3D Maps for Spatial Orientation in Wayfinding. ISPRS International Journal of Geo-Information. 2017; 6(3):60. https://doi.org/10.3390/ijgi6030060
Chicago/Turabian StyleLiao, Hua, and Weihua Dong. 2017. "An Exploratory Study Investigating Gender Effects on Using 3D Maps for Spatial Orientation in Wayfinding" ISPRS International Journal of Geo-Information 6, no. 3: 60. https://doi.org/10.3390/ijgi6030060