Article

Assessing Patient bypass Behavior Using Taxi Trip Origin–Destination (OD) Data

1
State Key Laboratory of Resources and Environmental Information System, Institute of Geographic Sciences and Natural Resources Research, Chinese Academy of Sciences, Beijing 100101, China
2
University of Chinese Academy of Sciences, Beijing 100049, China
3
Jiangsu Center for Collaborative Innovation in Geographical Information Resource Development and Application, Nanjing 210023, China
*
Author to whom correspondence should be addressed.
ISPRS Int. J. Geo-Inf. 2016, 5(9), 157; https://doi.org/10.3390/ijgi5090157
Submission received: 10 June 2016 / Revised: 21 August 2016 / Accepted: 24 August 2016 / Published: 1 September 2016
(This article belongs to the Special Issue Big Data for Urban Informatics and Earth Observation)

Abstract

:
Many patients prefer to use the best hospitals even if there are one or more other hospitals closer to their homes; this behavior is called “hospital bypass behavior”. Because this behavior can be problematic in urban areas, it is important that it be reduced. In this paper, the taxi GPS data of Beijing and Suzhou were used to measure hospital bypass behavior. The “bypass behavior index” (BBI) represents the bypass behavior for each hospital. The results indicated that the mean hospital bypass trip distance value ranges from 5.988 km to 9.754 km in Beijing and from 4.168 km to 10.283 km in Suzhou. In general, the bypass shares of both areas show a gradually increasing trend. The following hospitals exhibited significant patient bypass behavior: the 301 Hospital, Beijing Children’s Hospital, the Second Affiliated Hospital of Soochow University and the Suzhou Hospital of Traditional Chinese Medicine. The hospitals’ reputation, transport accessibility and spatial distribution were found to be the main factors affecting patient bypass behavior. Although the hospital bypass phenomena generally appeared to be more pronounced in Beijing, the bypass trip distances between hospitals were found to be more significant in Suzhou.

1. Introduction

A widespread and unusual phenomenon exists in Chinese health care has occurred for years where patients prefer high-quality medical resources (large hospitals) regardless of whether they have a minor ailment or a serious illness. Anyone can bypass a nearby hospital and use a large hospital located farther away, even if that person simply has a cold that could be directly treated in any ordinary, nearby hospital. The decision to ignore closer hospitals to see a high-quality doctor who is farther away is called hospital bypass behavior [1]. Hospital bypass behavior exists in many countries, but in China, the situation is different. With the rapid urbanization in China in recent years, the urban population has exploded. For example, the fraction of the nation’s population dwelling in cities increased from 17.9% to 52.6% between 1978 and 2012 [2]. However, according to the World Bank’s WDI database, the proportion of Chinese government expenditures on health was only 5.4% of GDP by 2012, which is far below the world’s average level (10.2%). Therefore, the allocation of medical resources has not kept pace with the urban population’s medical needs. In addition, medical resources may not have expanded homogenously with the process of urban land expansion. Although new hospitals are being built in new urban areas, the superior medical resources still remain in inner city regions [3]. These patterns of heterogeneity, which lead to a mismatch between medical service supply and demand, promote hospital bypass behavior. Hospital bypass behavior has caused many problems such as overcrowding in high quality hospitals with few patients in ordinary hospitals, which leads to the inefficient usage of medical resources, difficulty registering because of long wait times, and traffic jams around quality hospitals [4,5]. Accordingly, hospital bypass behavior has been a significant reason for “proper health care is difficult to get” in China; thus, it is necessary to discourage bypass behavior. To realize this goal, we quantify bypass behavior trends and attempt to identify its causes in terms of the heterogeneity of medical resources in cities. This analysis should provide guidance on the reasonable allocation of medical resources, which can help individuals successfully obtain proper medical care.
Studies on hospital bypass behavior have mainly focused on two aspects: pattern descriptions and analyses of influencing factors. Statistical characteristics have been evaluated in terms of bypass percentages [6], average travel distances [7], time periods [8], and costs [9]. Bypass rates vary among areas; for example, in rural America, bypass rates were less than 40% in general [6,10,11], whereas this number was much higher in some undeveloped countries [9,12,13]. Bypass patients pay costs in terms of additional travel distances, travel time and extra financial costs, and most studies have explored why they are willing to pay these costs [14]. The factors that influence bypass behavior mainly include the patient’s age, gender, income and experiences or associations with hospital attributes, i.e., type, size, quality, accessibility, etc. Logistic regression analysis results have indicated that patients with private insurance and Medicare were significantly more likely to bypass local hospitals than the uninsured [15]. Using a binary probit model and a conditional logit model, He [16] found that the severity of illness and the quality of medical services positively influence bypass behavior, whereas satisfaction with the local hospital reduces it. Reasonable waiting times at the nearest hospital also decrease the likelihood of bypass behavior [17]. Although certain improvements have been made regarding bypass behavior, previous studies have some weaknesses. First, although previous studies have primarily presented descriptive analyses of bypass behavior, few studies have examined the spatial characteristics that relate to patterns of heterogeneity. This deficiency is attributable to the fact that official reports and statistics on public use, questionnaires, interviews and patient registration records have typically been used to represent hospitalization behaviors. These records may not contain spatial information and therefore cannot be used to depict the spatial heterogeneity of the phenomenon. Second, the data that have been used account for a small sample of patients and may not reveal the overall trends of a city. To address these limitations, this study is the first to assess patient bypass behavior using taxi GPS data. GPS-equipped taxicabs can be regarded as mobile sensors that continually trace the real-time locations of drivers and passengers [18,19,20]. The passenger pick-up and drop-off points that are extracted from taxi trajectories can reveal passenger origins and travel destinations [21,22]. Taxi GPS data together with other data (e.g., POI data) can be used in many ways to detect people’s activities and can be quickly reviewed. Two major types of identification are travel type (e.g., working, and shopping) from a macroscopic perspective [23,24] and destination location (including land use type [25] and specific POI [26,27]) from a microcosmic perspective. For specific location identification, Si et al. [23] concretely predefined three types of POI (e.g., restaurants) and their corresponding travel patterns (e.g., dining) before determining the candidate drop-off POI; then, the weight of each type of POI was calculated by considering the probability distribution of the travel pattern for different periods of time. The candidate POI with the most weight could be the identified destination. Zhang et al. [26] used the reported trajectories from a fleet of GPS-equipped taxicabs to detect gas station visits (i.e., refueling events) by considering mobility and geographic constraints; accordingly, a taxicab driver’s activity pattern (refueling) and destination (gas station) could be identified. Moreover, Yue et al. [27] defined a 500-m-buffer radius based on a shopping mall. In their study, taxi passenger drop-off points in the buffer could be considered as being for shopping purposes. Therefore, taxi GPS data can reveal people’s specific activities on some level and thus appear to be a novel data source to demonstrate behavior around hospital visits. This relatively large collection of sample data was used in our research; thus, much of this paper assesses bypass behavior from a geospatial perspective.
The objective of this study is to determine the level of spatial heterogeneity for the high-quality hospitals examined in the study area. In addition, this paper provides information on the reasonable allocation of quality hospital services and guidance for people who are seeking the appropriate medical authorities. The remainder of the paper is organized as follows. Following a brief description of the datasets and study area used, the analysis procedures used to assess the data are presented. The empirical results are then reported. Finally, key findings are shown, and avenues for future research are described.

2. Methods

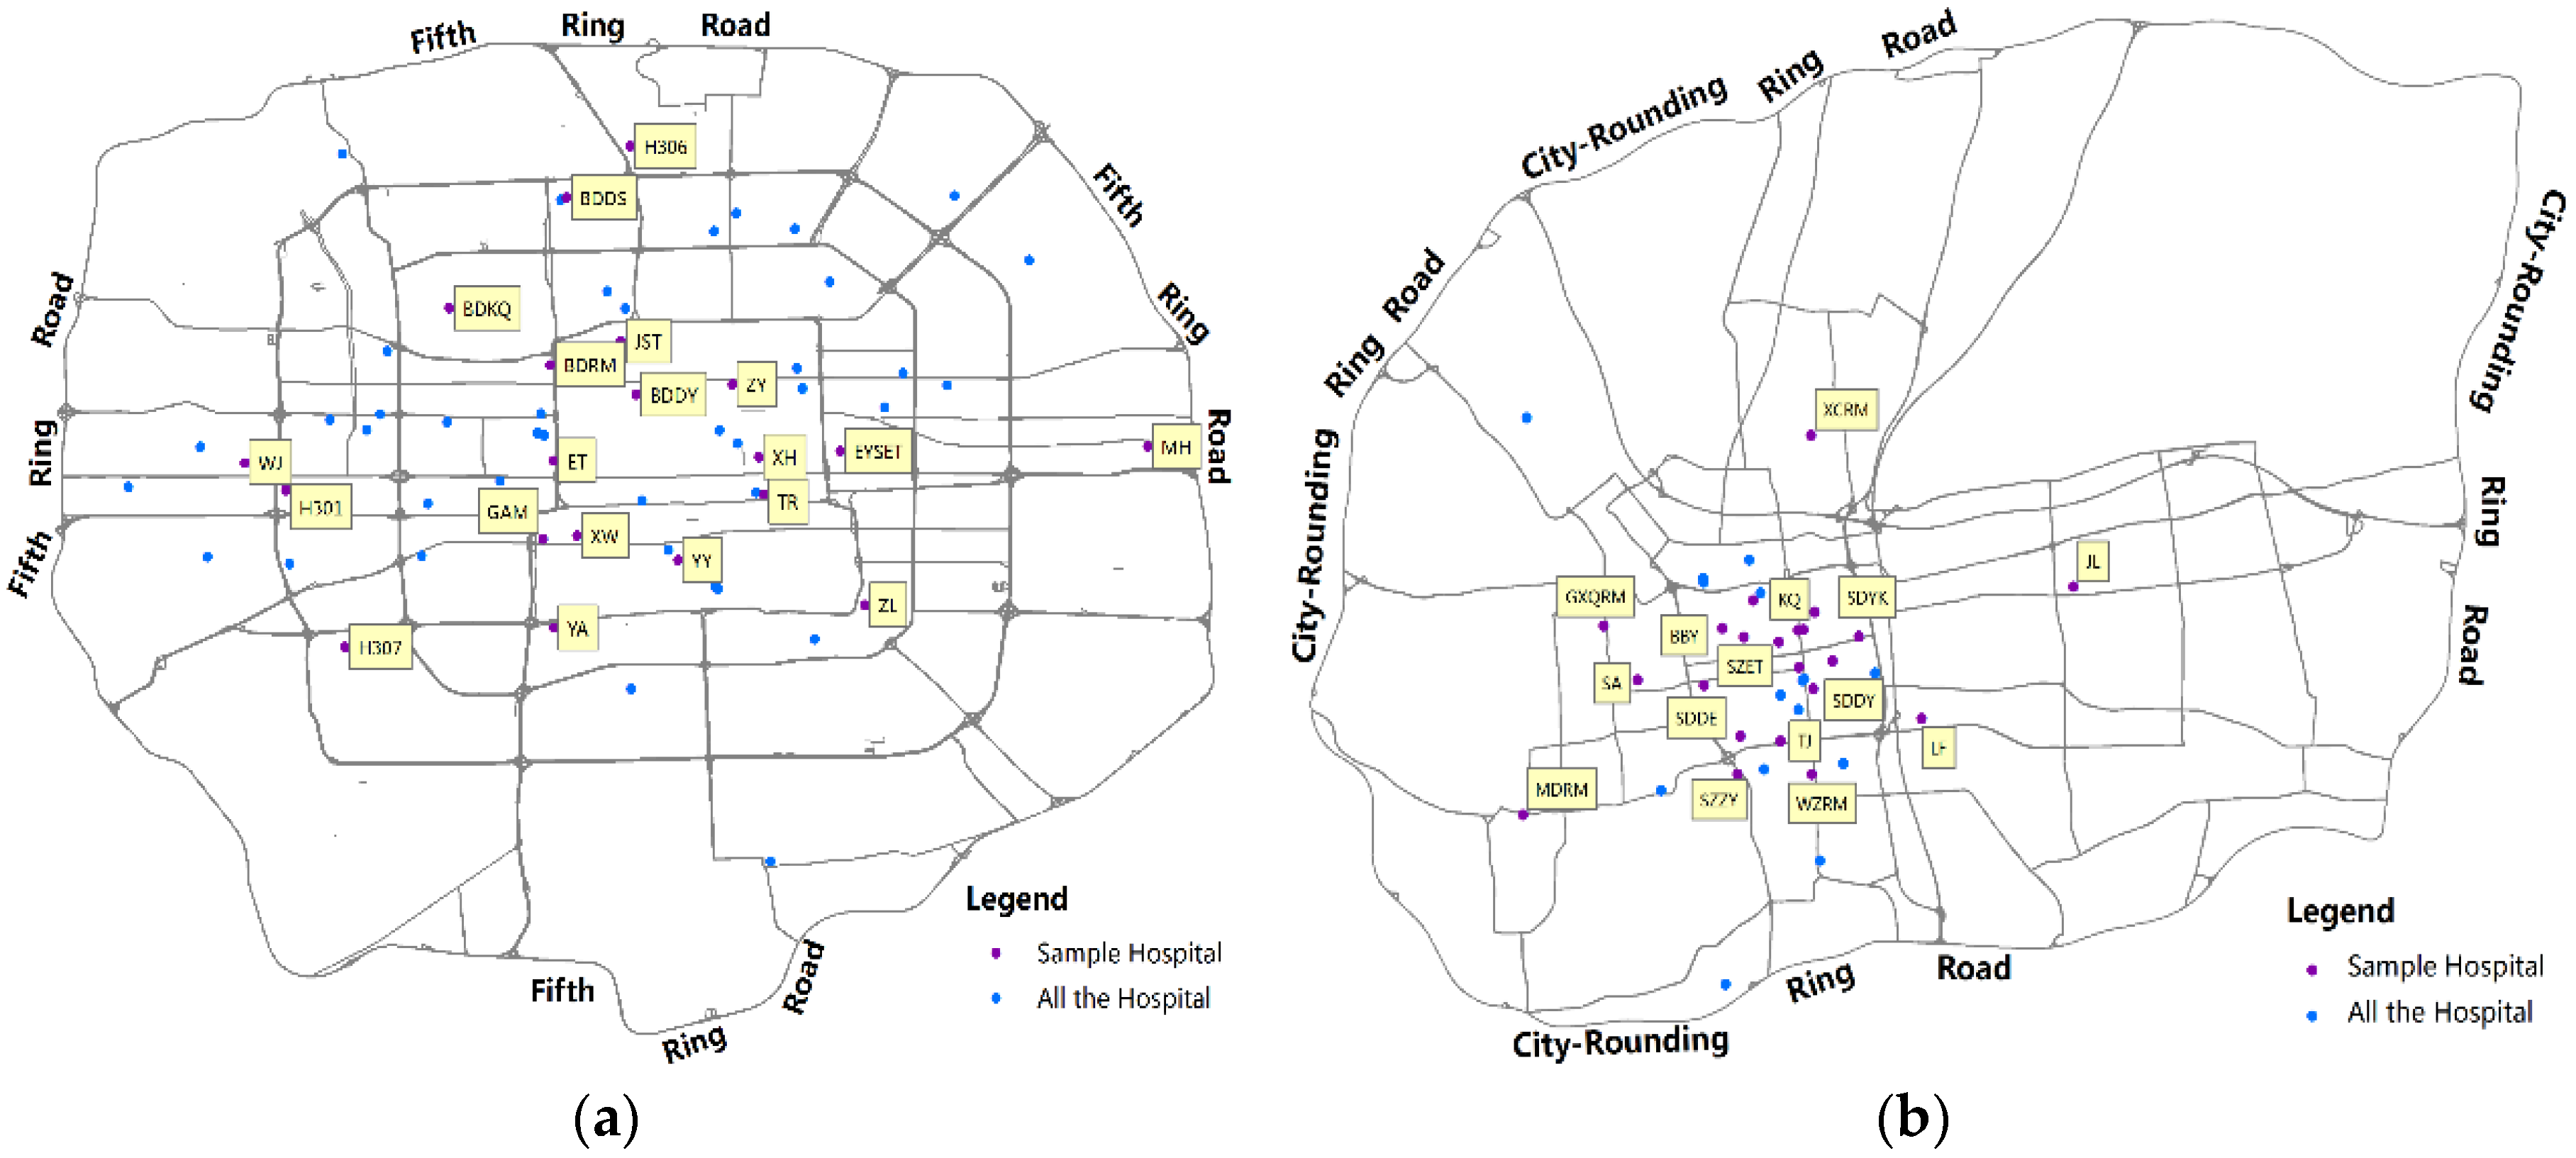
2.1. Datasets and Study Area

The taxi GPS data used in this study were collected from 15 April 2011, to 19 April 2011, for Beijing and from 21 April 2014, to 22 April 2014, for Suzhou. The Beijing dataset contains GPS records for more than 10,000 taxis, whereas the Suzhou dataset includes data for approximately 4300 local taxis; each dataset presents different data formats and content. The GPS records for both datasets include the following common fields:
  • PointID: record identification;
  • TaxiID: sampled taxi identification;
  • Longitude: longitude information for a taxi during the recording period;
  • Latitude: latitude information for a taxi during the recording period;
  • Time: the recording time; and
  • State: whether a taxi is with (1) or without (0) passengers.
Because our focus pertains to the relation between the origin and the destination (OD) of taxi passenger trips, taxi trajectories were simplified into pick-up and drop-off points (taxi trip OD data), i.e., when the “state” changes from 0 to 1, a pick-up event has occurred. Similarly, a transition from 1 to 0 indicates that a drop-off event has occurred. We used OD to indicate the pick-up and drop-off events of a taxi trip hereafter. This measure can thus be used to identify individual trips to a certain hospital.
The two following study areas were used: a district that is located in the Fifth Ring Road area in Beijing and a district in the City-Rounding Ring Road area in Suzhou; both are urban areas typical of the two cities. Beijing, the capital city of China, covers a land area of 16,410.54 km2 and includes more than 20 million residents [28]. As the political and cultural center of the country, Beijing offers abundant social resources. The city includes 88 tertiary-level (top-level) hospitals [29], with 61 located in the Fifth Ring Road area (Figure 1a). Suzhou, which is located in the southern region of Jiangsu Province, is a renowned cultural, historical and tourism center. As one of the major cities in the Yangtze Delta, Suzhou covers an area of 8488.42 km2, and the city proper covers 2743 km2. The city boasts a population of 1057.87 million, and 546.83 million live in the city proper. Suzhou is also a region famous for its canals, and its water area (which includes the Taihu and Yangcheng Lakes) contains 42.5% of all China’s water [30,31]. Fourteen tertiary (top-level) hospitals and 29 secondary (mid-level) hospitals are found in the Suzhou urban area [32]; 37 of these hospitals are located in the City-Rounding Ring Road area (Figure 1b). The medical resources vary (in quantity and distribution) because of the presence of different city grades.
We selected 20 tertiary hospitals in the Beijing study area and 22 hospitals (10 tertiary, 12 secondary) in the Suzhou study area to research patient bypass behavior. Some conditions were considered when choosing those sample hospitals. First, it must be clear to see whether taxi trips are going to the selected hospital. There are two situations surrounding the gates of our selected sample hospitals: no other POIs (e.g., only the walls of the hospital) and some POIs people are unlikely to go there by taxi (e.g., small storefronts); second, the hospital must be relatively high-quality in study area; and, third, the distribution of sample hospitals must cover the study area. We chose those eligible and typical sample hospitals for two cities based on the above criteria. All taxi GPS data, hospital data, and road networks [33] were stored in a spatial database.

2.2. Bypass Behavior Assessment Indices

Before presenting the indices used to measure the spatial heterogeneity of bypass behavior, we specify whether passengers were visiting/leaving hospitals using taxi trip OD data. These data are provided in the following section. It is important to note that we used actual route lengths rather than Euclidean distances when calculating trip distances. When a hospital visitor did not go to his/her closest hospital, the trip was considered a hospital bypass trip. There is an exception that if a children’s hospital is the one closest to a certain patient, he/she will only be considered as our study subject (bypass patient) only after he/she has bypassed the closest general hospital (probably the second closest to him/her).
To measure the bypass behavior of the sampled hospitals, a “bypass behavior index” (BBI) was used. When the BBI is higher, the patient bypass behavior is more significant for the sampled hospital. BBI data were integrated with three indices: hospital bypass trip distance rankings, the hospital bypass proportion source points among the sampled hospitals (hospital bypass share, hereafter), the hospital bypass proportion source points for a single hospital (hospital bypass proportion, hereafter).

Bypass Behavior Index

To determine the patient bypass behavior levels for the examined high-quality medical institutions, the BBI was used as an indicator. The BBI was defined as the average of three factors based on the standardization of raw values on a scale from 1 to 100. The formulas are written as follows:
P j = i = 1 3 F i j 3
F i j = [ 99 f i j m i n i m a x i m i n i ] + 1
where P j is the BBI of hospital j determined from Equations (1) and (2).   F i j   is the scaled final value of hospital j for index i (i = 1, 2, 3, hereafter), f i j is the raw value of hospital j for index i,   m a x i is the maximum value for index i, and   m i n i is the minimum value for index i. Several studies offer ranked assessment indicators [34,35,36,37,38] (e.g., the PROMETHEE method); however, such indicators are mainly determined by a policymaker’s willingness to employ personal preference-based functions and the parameters of varying criteria. The approach recommended by [34,35] was used for index calculation and ranking because it is easy to understand, objective and applicable.

Index 1: Hospital bypass trip distance ranking

This index is defined as Equation (3). Based on the trip distances to all of the hospitals, we ranked the hospitals used by the sampled individuals. Thus, each hospital bypass source point was given a target hospital rank attribute based on the distance travelled, and we averaged all related rankings for the target hospital. The expression is shown as Equation (3).
f 1 j = R p 1 + R p 2 + R p 3 + + R p n N j
where f 1 j denotes the hospital bypass trip distance rank factor of sample hospital j.   R p n represents the distance rank of sample hospital j for source point pn. N j denotes the number of all hospital bypass source points for sample hospital j. This factor generally shows how far patients travelled to reach a specific hospital.

Index 2: Hospital bypass share

This index is defined as Equation (4). The hospital bypass share denotes the percentage of hospital bypass source points a particular hospital occupies among all bypass source points for all hospitals sampled. The factor shows that a hospital’s relative attractiveness to hospital bypass patients, which is highly robust, i.e., the relative rank of this index does not change if other hospitals are added to the sample. The expression is shown as Equation (4).
f 2 j = N j j = 1 m N j
where f 2 j denotes the hospital bypass proportion of sample hospital j for all of the sampled hospitals. N j denotes the number of hospital bypass source points for sample hospital j.   j = 1 m N j denotes the sum of hospital bypass source points for all of the hospitals sampled. m = 20 in the Beijing study area, whereas m = 22 in the Suzhou study area.

Index 3: Hospital bypass proportion

This index is defined as Equation (5). The hospital bypass proportion shows the percentage of hospital bypass patients for a single hospital. The index presents the degree of patient hospital bypass demand based on non-neighboring patients preferring that specific hospital and sharing medical resources with those patients who live nearby. The expression is shown as Equation (5).
f 3 j = N j S j
where f 3 j denotes the proportion of hospital bypass source points for sample hospital j. N j denotes the number of hospital bypass source points for sample hospital j.   S j denotes the number of source points for sample hospital j.

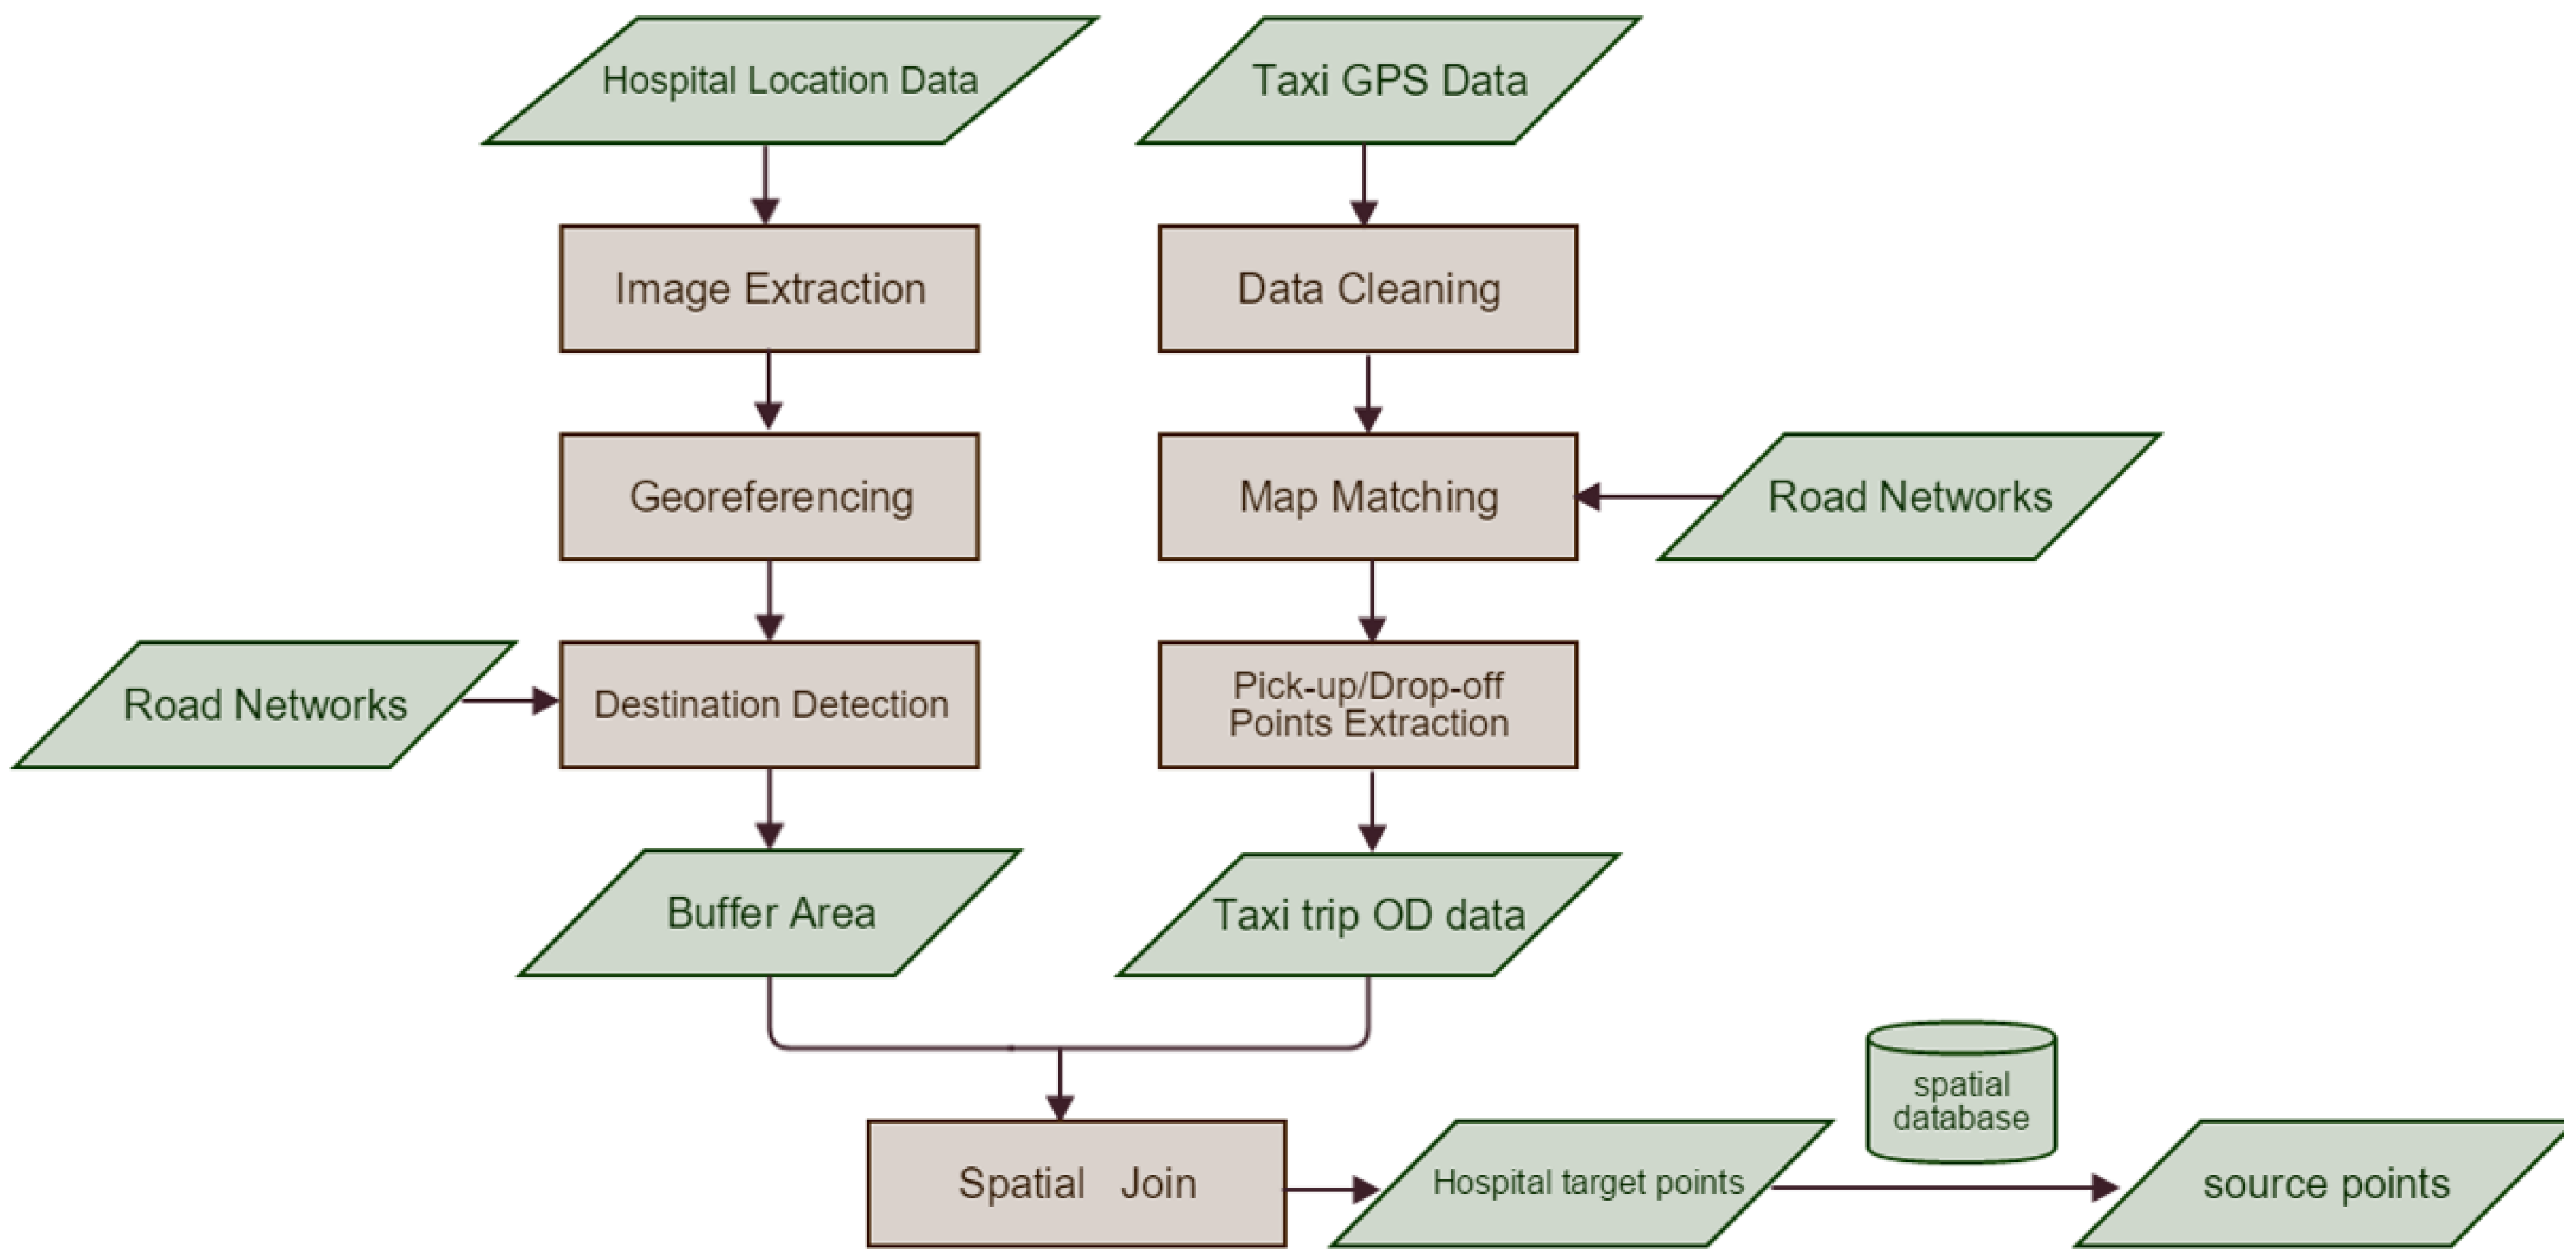
2.3. Source Point Recognition
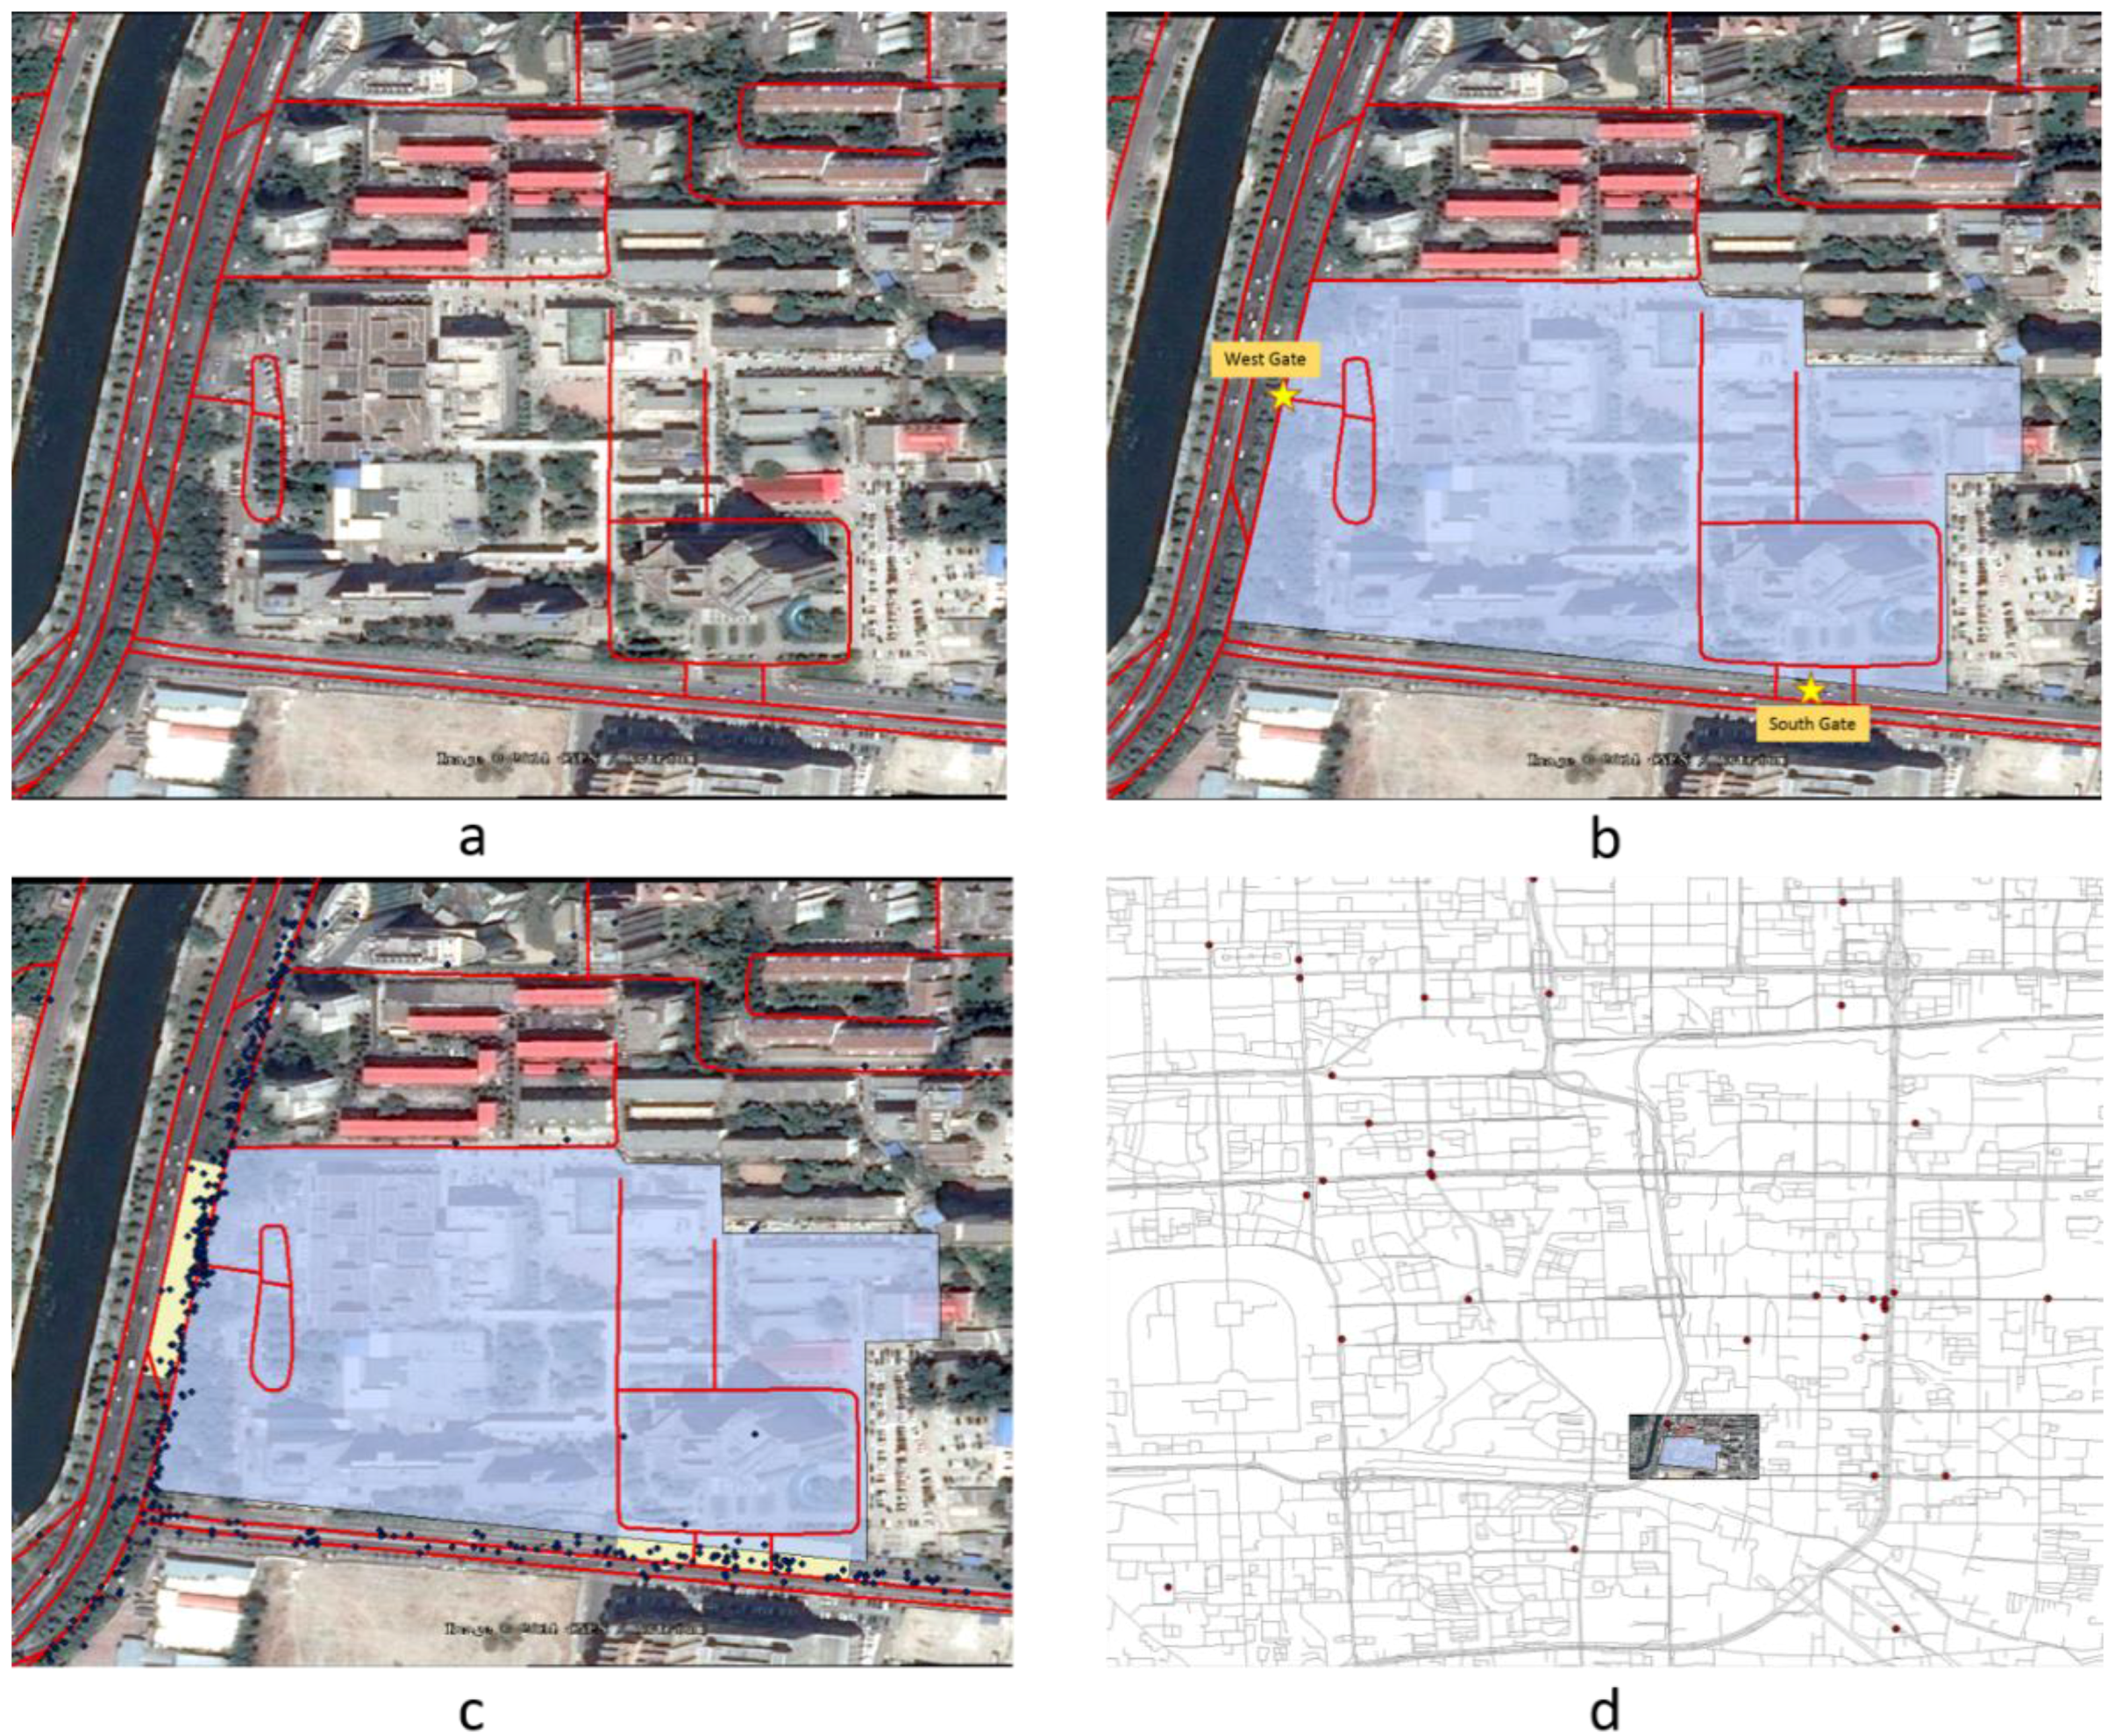
Taxi passenger hospital attendance behaviors can be determined based on pick-up and drop-off points. Each pick-up and drop-off point positioned within a certain spatial distance around the gate of a hospital defined as a “target point.” Their related drop-off or pick-up points were loaded in the database as “source points”. Hence, each target point and its related source point formed a taxi passenger’s origin or destination point for a given taxi trip (OD data). Trip distance or time could thus be determined based on the target points and related source points attributes.
To obtain taxi trip OD data with accurate location information (longitude and latitude), we first did data cleaning to gather precise taxi GPS location information; for example, we removed unreasonable trips (e.g., trip length of less than 10 m, trip periods of 0S). Next, we did map matching work based on a program provided by GraphHopper to track taxis on the road. Taxi trajectories were then simplified into pick-up and drop-off points (OD data) as mentioned in Section 2.1. Concurrent to the above, hospital location data were used to take a corresponding Google Maps image. Then we detected the buffer area of each hospital based on road networks after image georeferencing via ArcGIS 10.1. Hospital target points were then extracted after spatial join processing and their corresponding source points (points that belong to the same trip) could be obtained in the database. The whole workflow can be seen in Figure 2.
Using the Cancer Hospital Chinese Academy of Medical Sciences (ZL in Chinese Pinyin and hereafter) as an example, the following step-by-step process was used to determine the hospital source point origins (Figure 3).
Step 1
Extract the image with the area surrounding ZL according to Google Earth, and then georeference the image to the map coordinate system of the existing road network in ArcGIS 10.1 as shown in Figure 3a (the red line indicates the road network).
Step 2
Create an outline of ZL through image interpretation and find its west and south gate as shown in Figure 3b (the translucent blue polygon indicates the spatial environment of ZL).
Step 3
Focus on the two gates. Draw the potential target point area (roughly 50 m along the road) separately. When GPS positioning error issues are encountered, the potential area can be covered. The yellow polygon in Figure 3c shows the potential ZL area; therefore, origin and destination points in the yellow polygon serve as the target points of ZL.
Step 4
Identify each target point’s corresponding source point in the database (points that belong to the same trip). Figure 3d presents some of the ZL source points on a map.

3. Results

The analysis procedure involves four steps. First, each sample hospital source point indicating that patients were served was identified. Trip distances based on road networks between the source points and hospitals in the study area were calculated, and hospital bypass source points were extracted on the basis of trip distance rankings. Hospital bypass source point proportions and distance rankings for each hospital bypass source point were then determined. Finally, each sample hospital’s BBI value was synthesized using the three factors noted above. The abbreviations for each hospital will be used in the following sections for the sake of clarity. A list of abbreviations used to refer to the sampled hospitals is presented in Appendix A, Table A1.

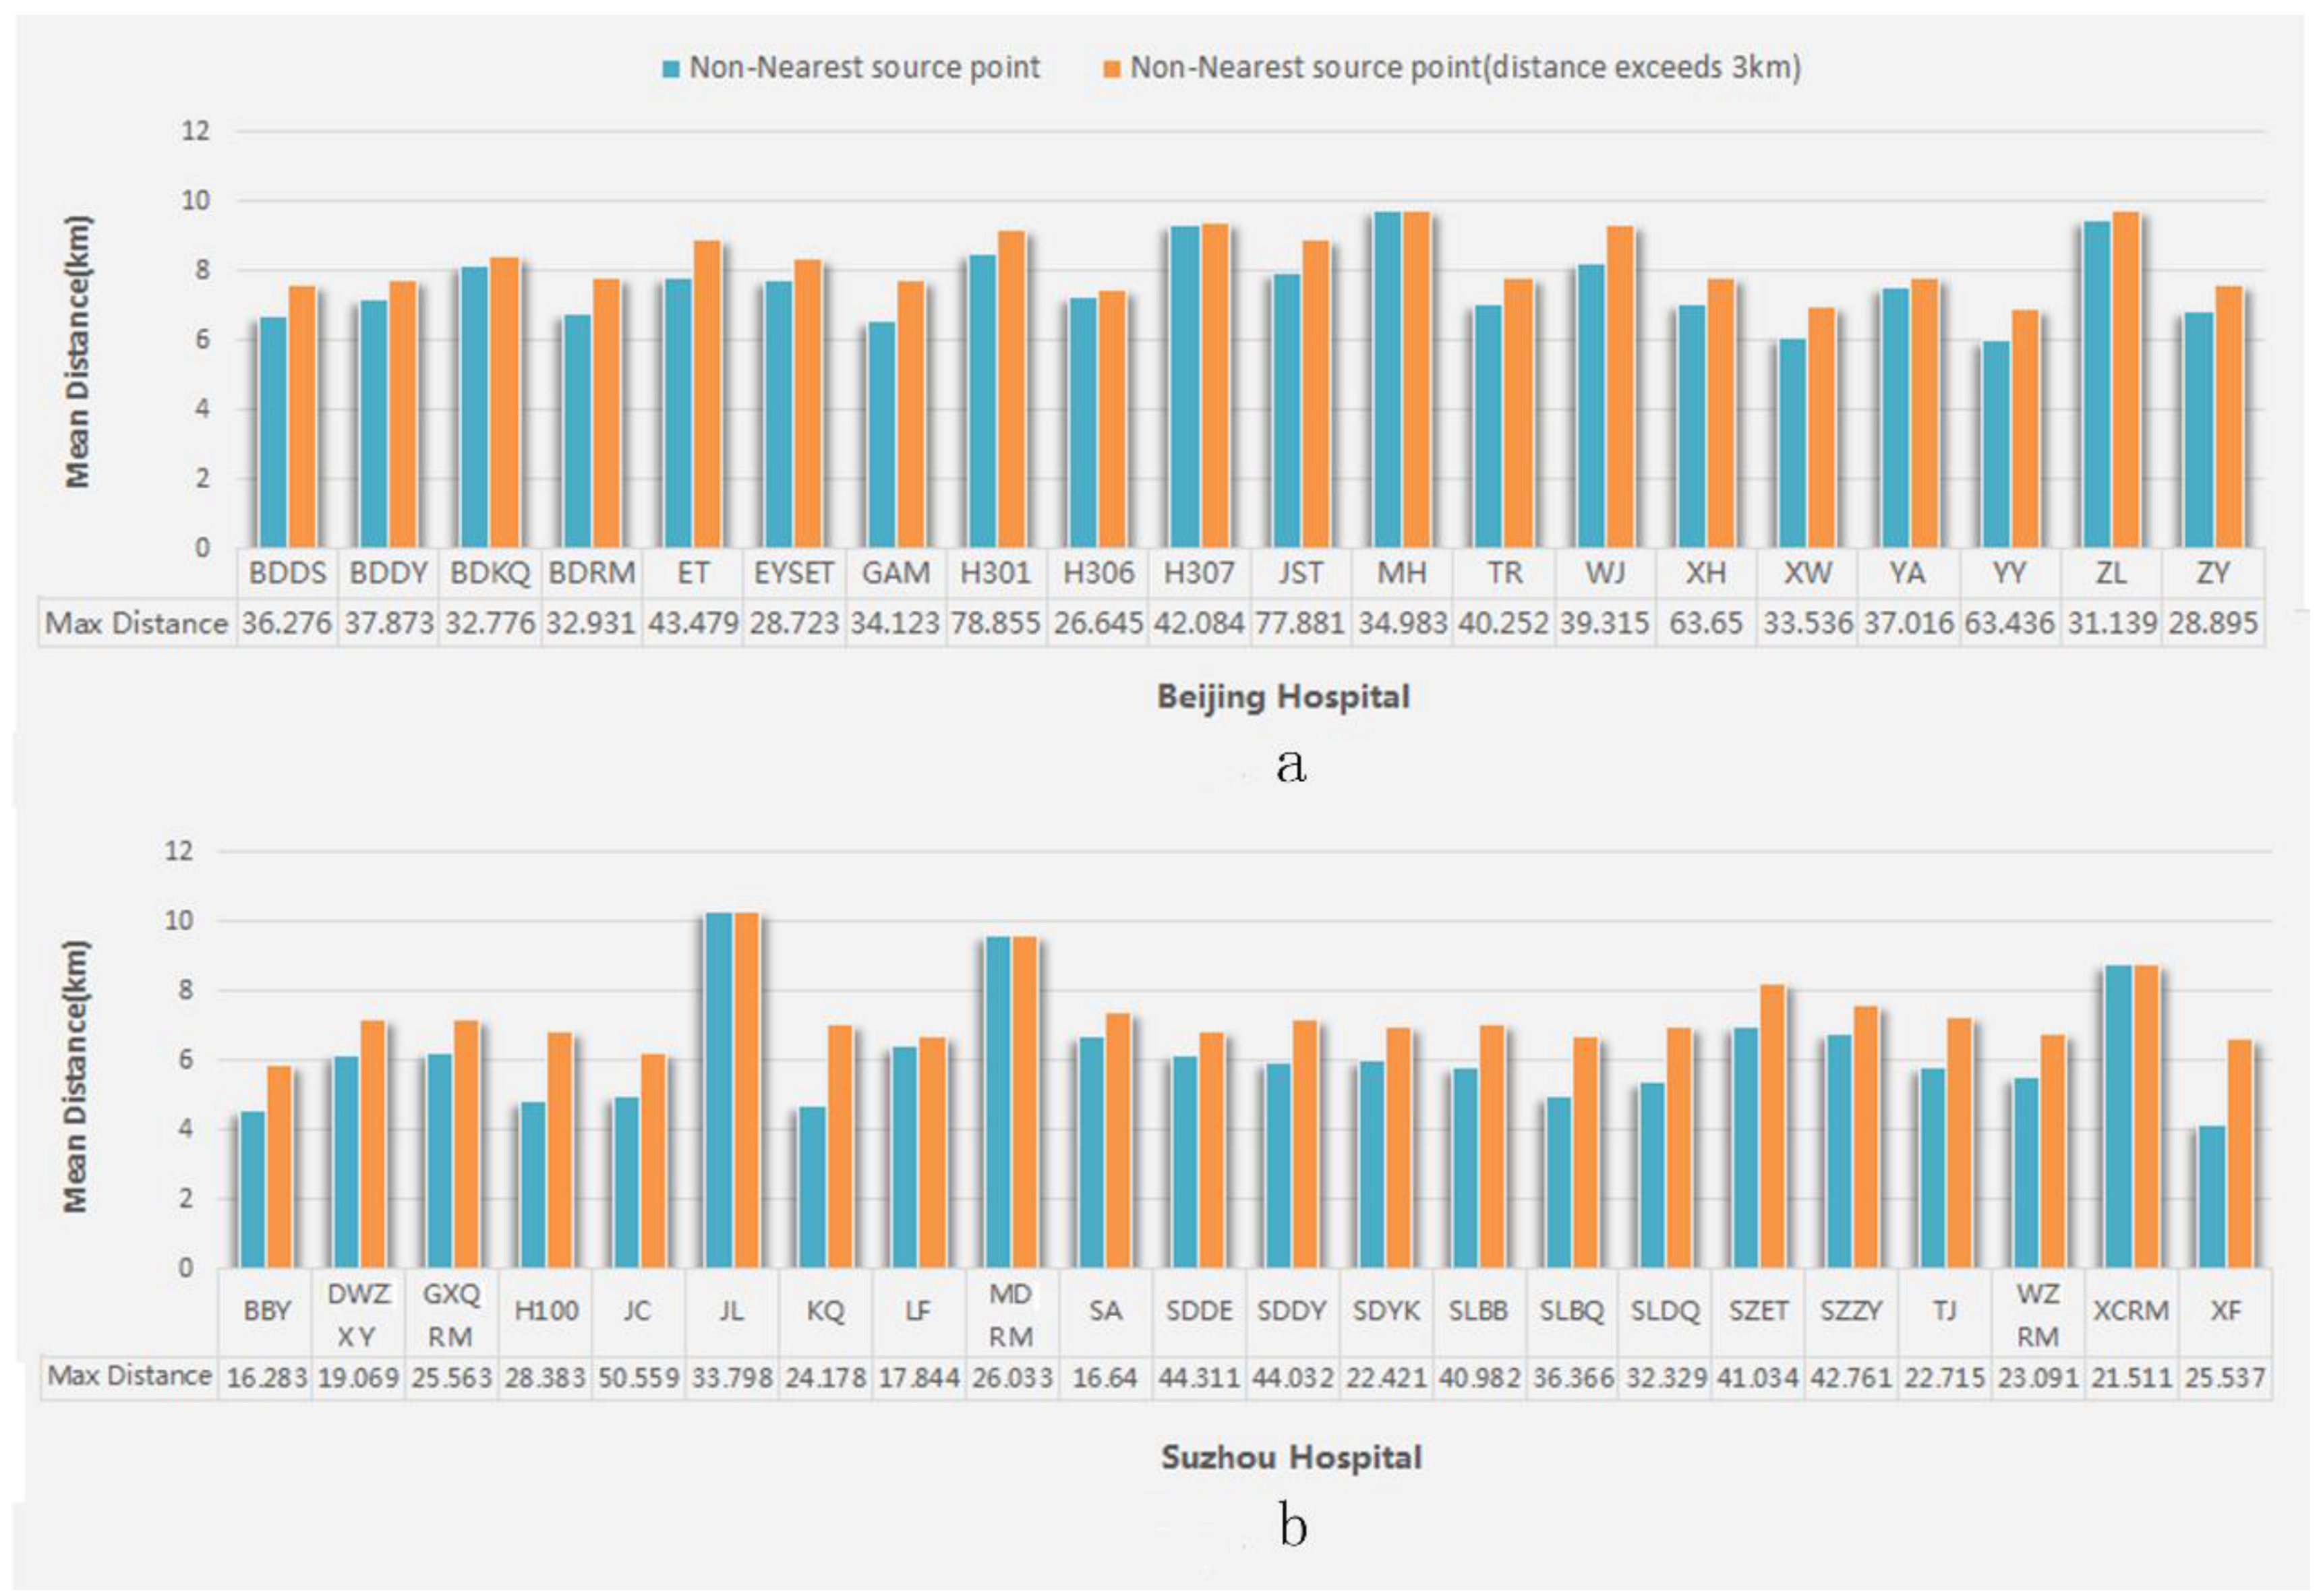
3.1. Statistical Characteristics of Hospital Bypass Distance

Figure 4 lists descriptive statistics (mean value and max value) for two types of hospital bypass trip distances for the Beijing and Suzhou hospitals examined, respectively. Standard deviation and variance are presented in Appendix B, Table B1 and Table B2 respectively. Regarding taxi trips, taxi hailing areas were based on a distance of 3 km; we also examined non-neighboring hospital bypass trips of more than 3 km for the entire sample. For the hospitals in Beijing(Figure 4a), hospital bypass trip distance mean values were found to range from 5.988 km (YY) to 9.754 km (MH), and maximum hospital bypass trip distance values were found to range from 26.645 km (H306) to 78.855 km (H301); hospital standard deviation values were not found to differ considerably. For the hospitals in Suzhou (Figure 4b), hospital bypass trip distance mean values were found to range from 4.168 km (XF) to 10.283 km (JL), and maximum hospital bypass trip distance values were found to range from 16.283 km (BBY) to 50.559 km (JL). In addition, hospital standard deviation values showed minor variations. Overall, mean and maximum hospital bypass trip distances for Beijing were found to be larger than those for Suzhou. Figure 4 reveals nearly the same trend for non-neighboring hospital bypass trips of all distances in Beijing and Suzhou.

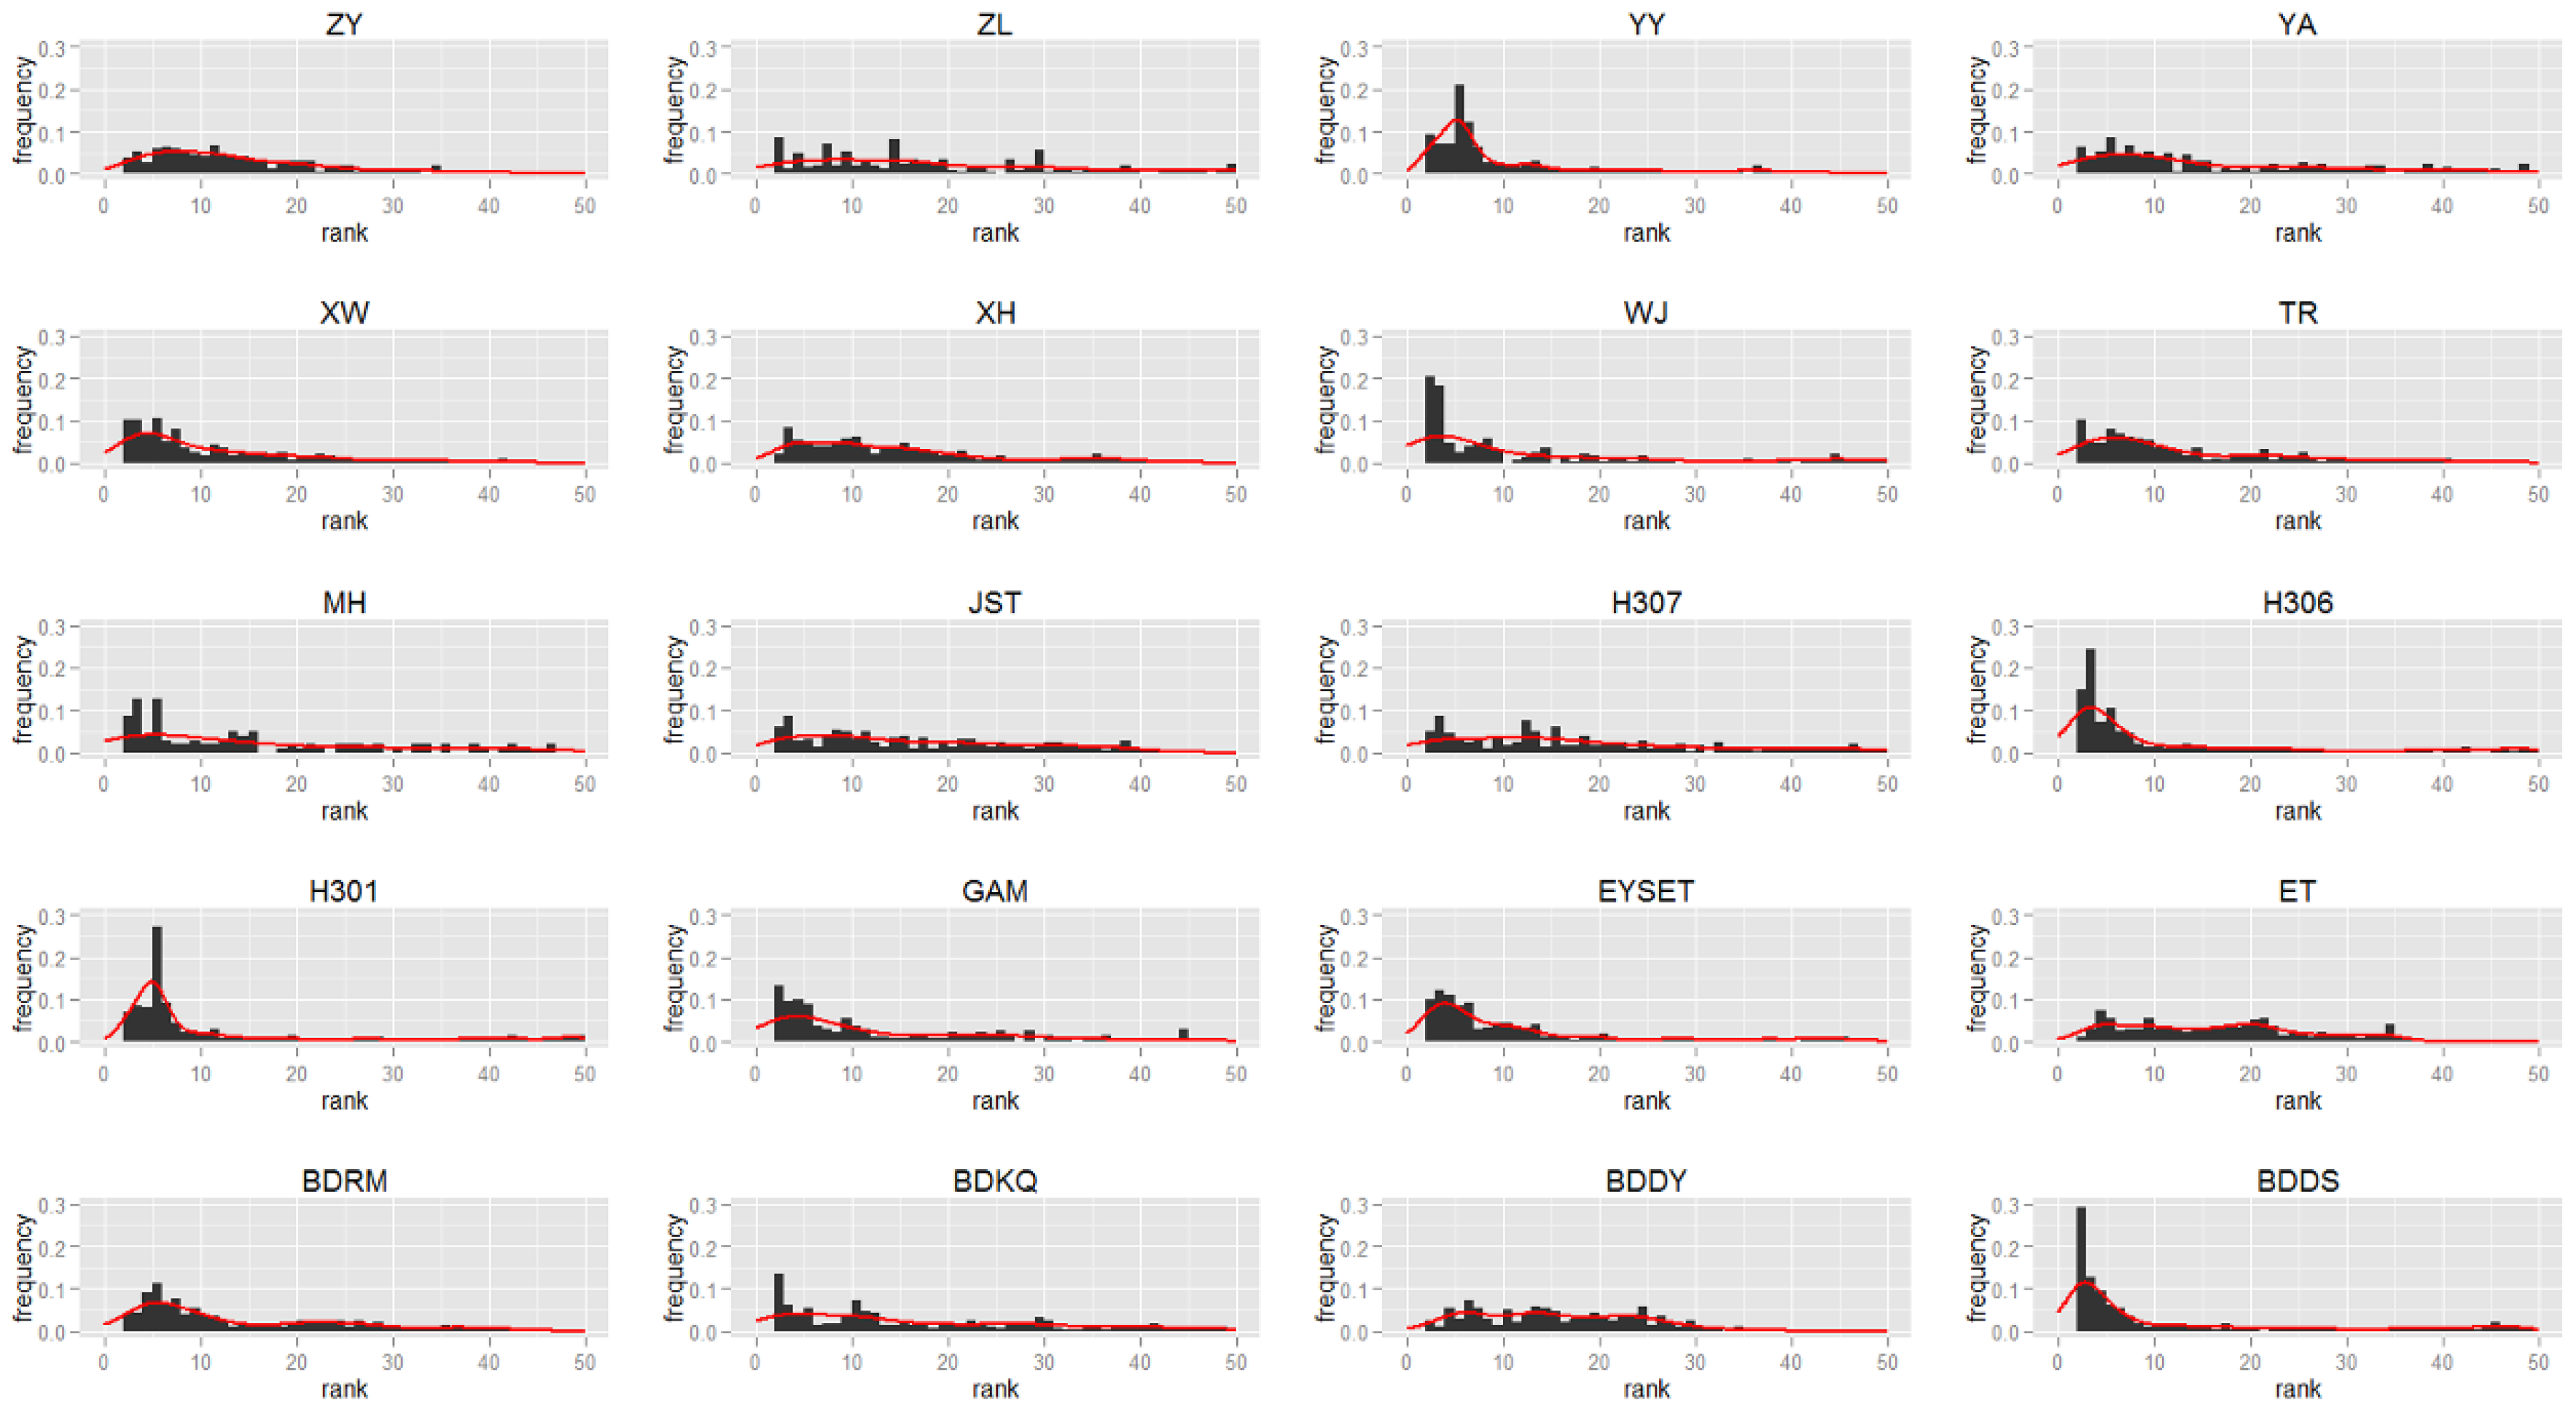
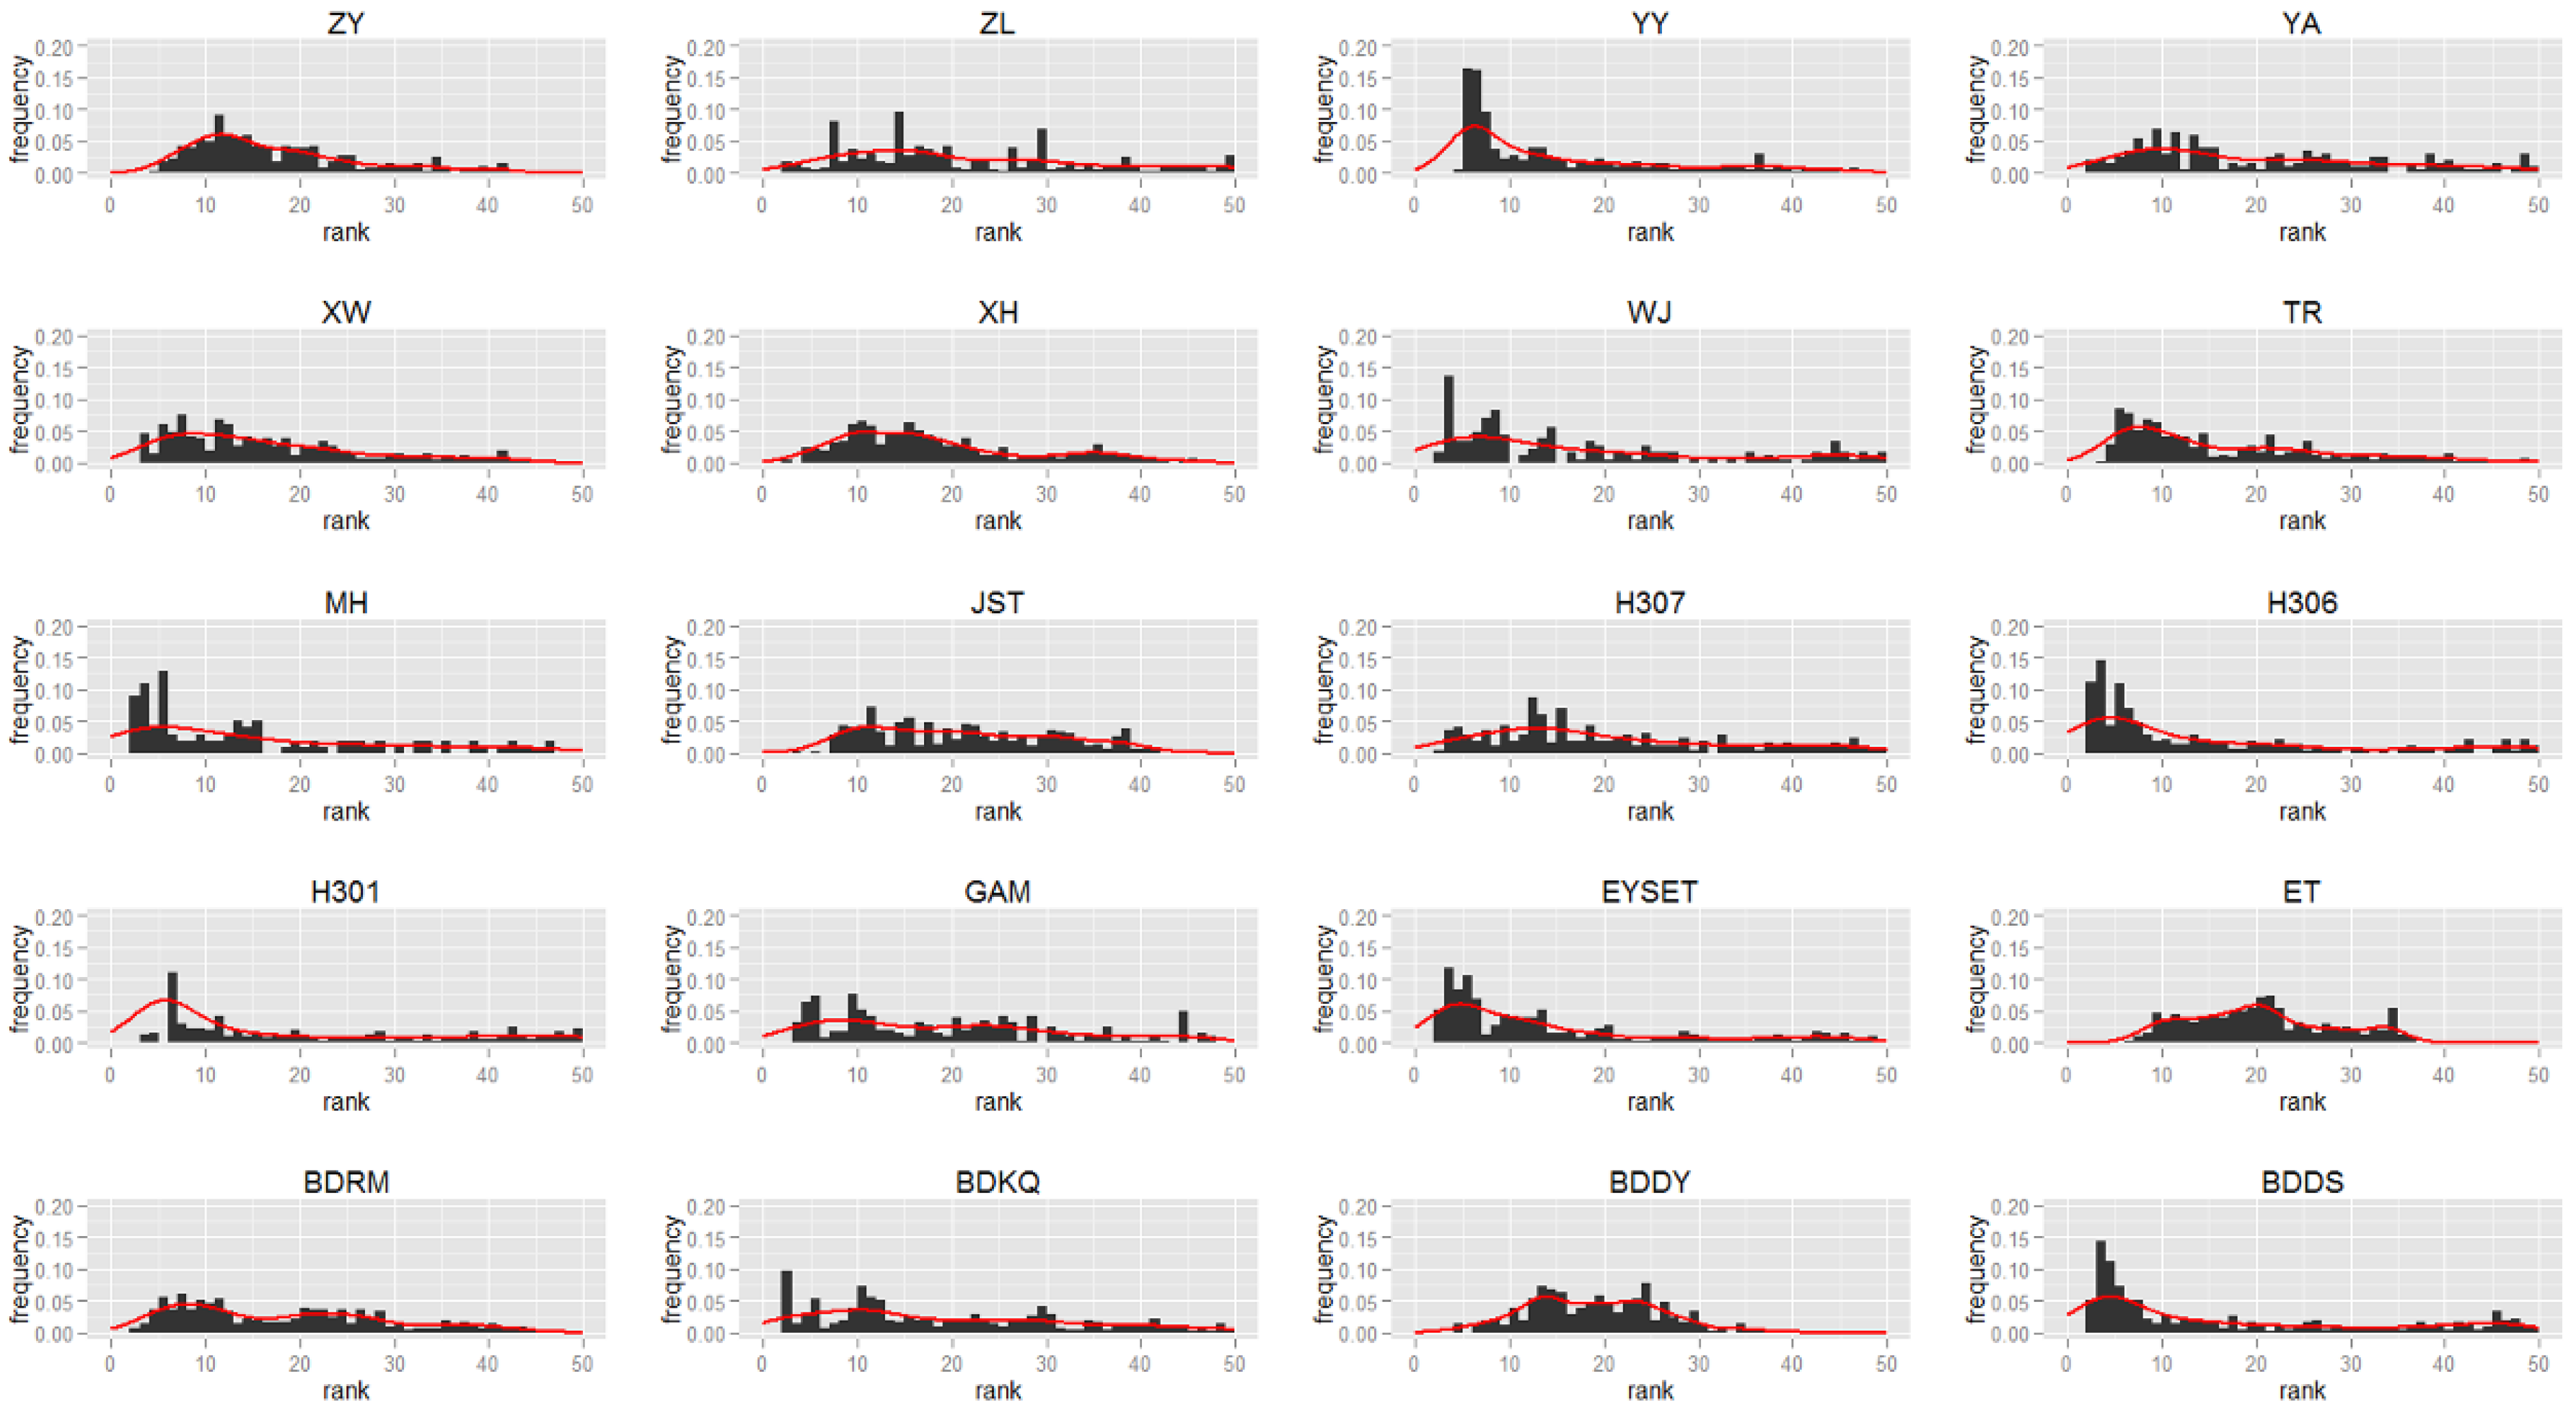
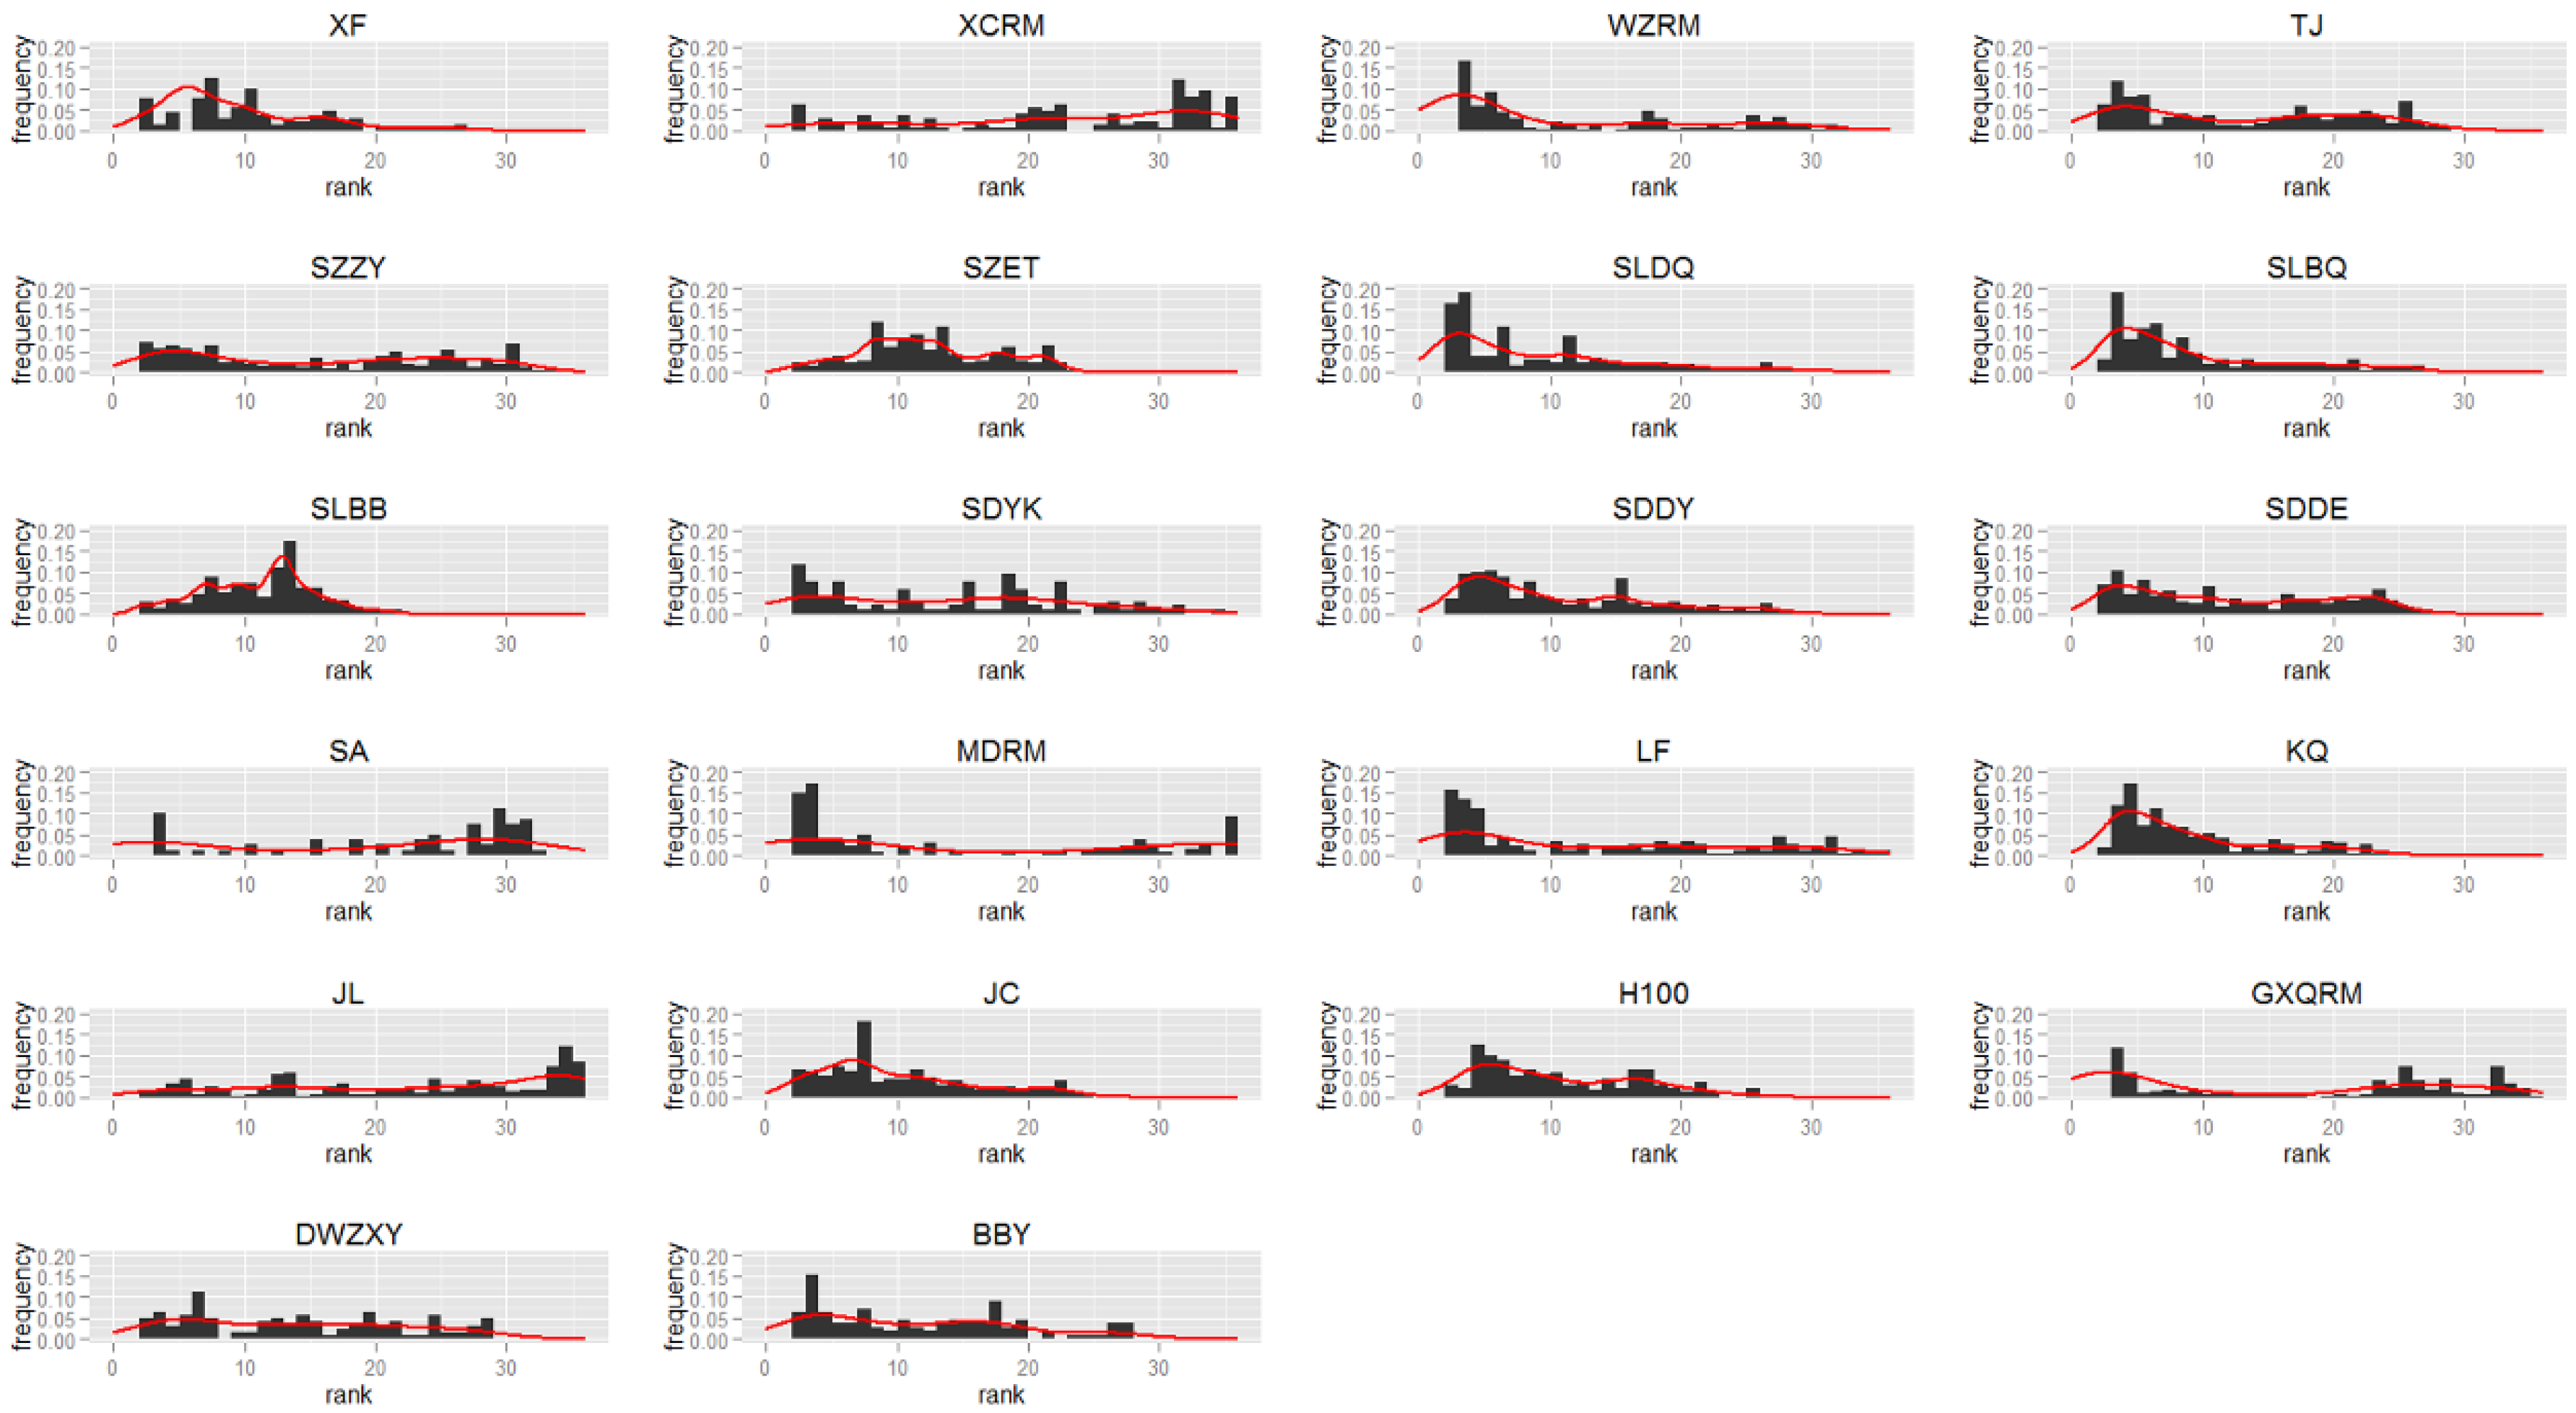
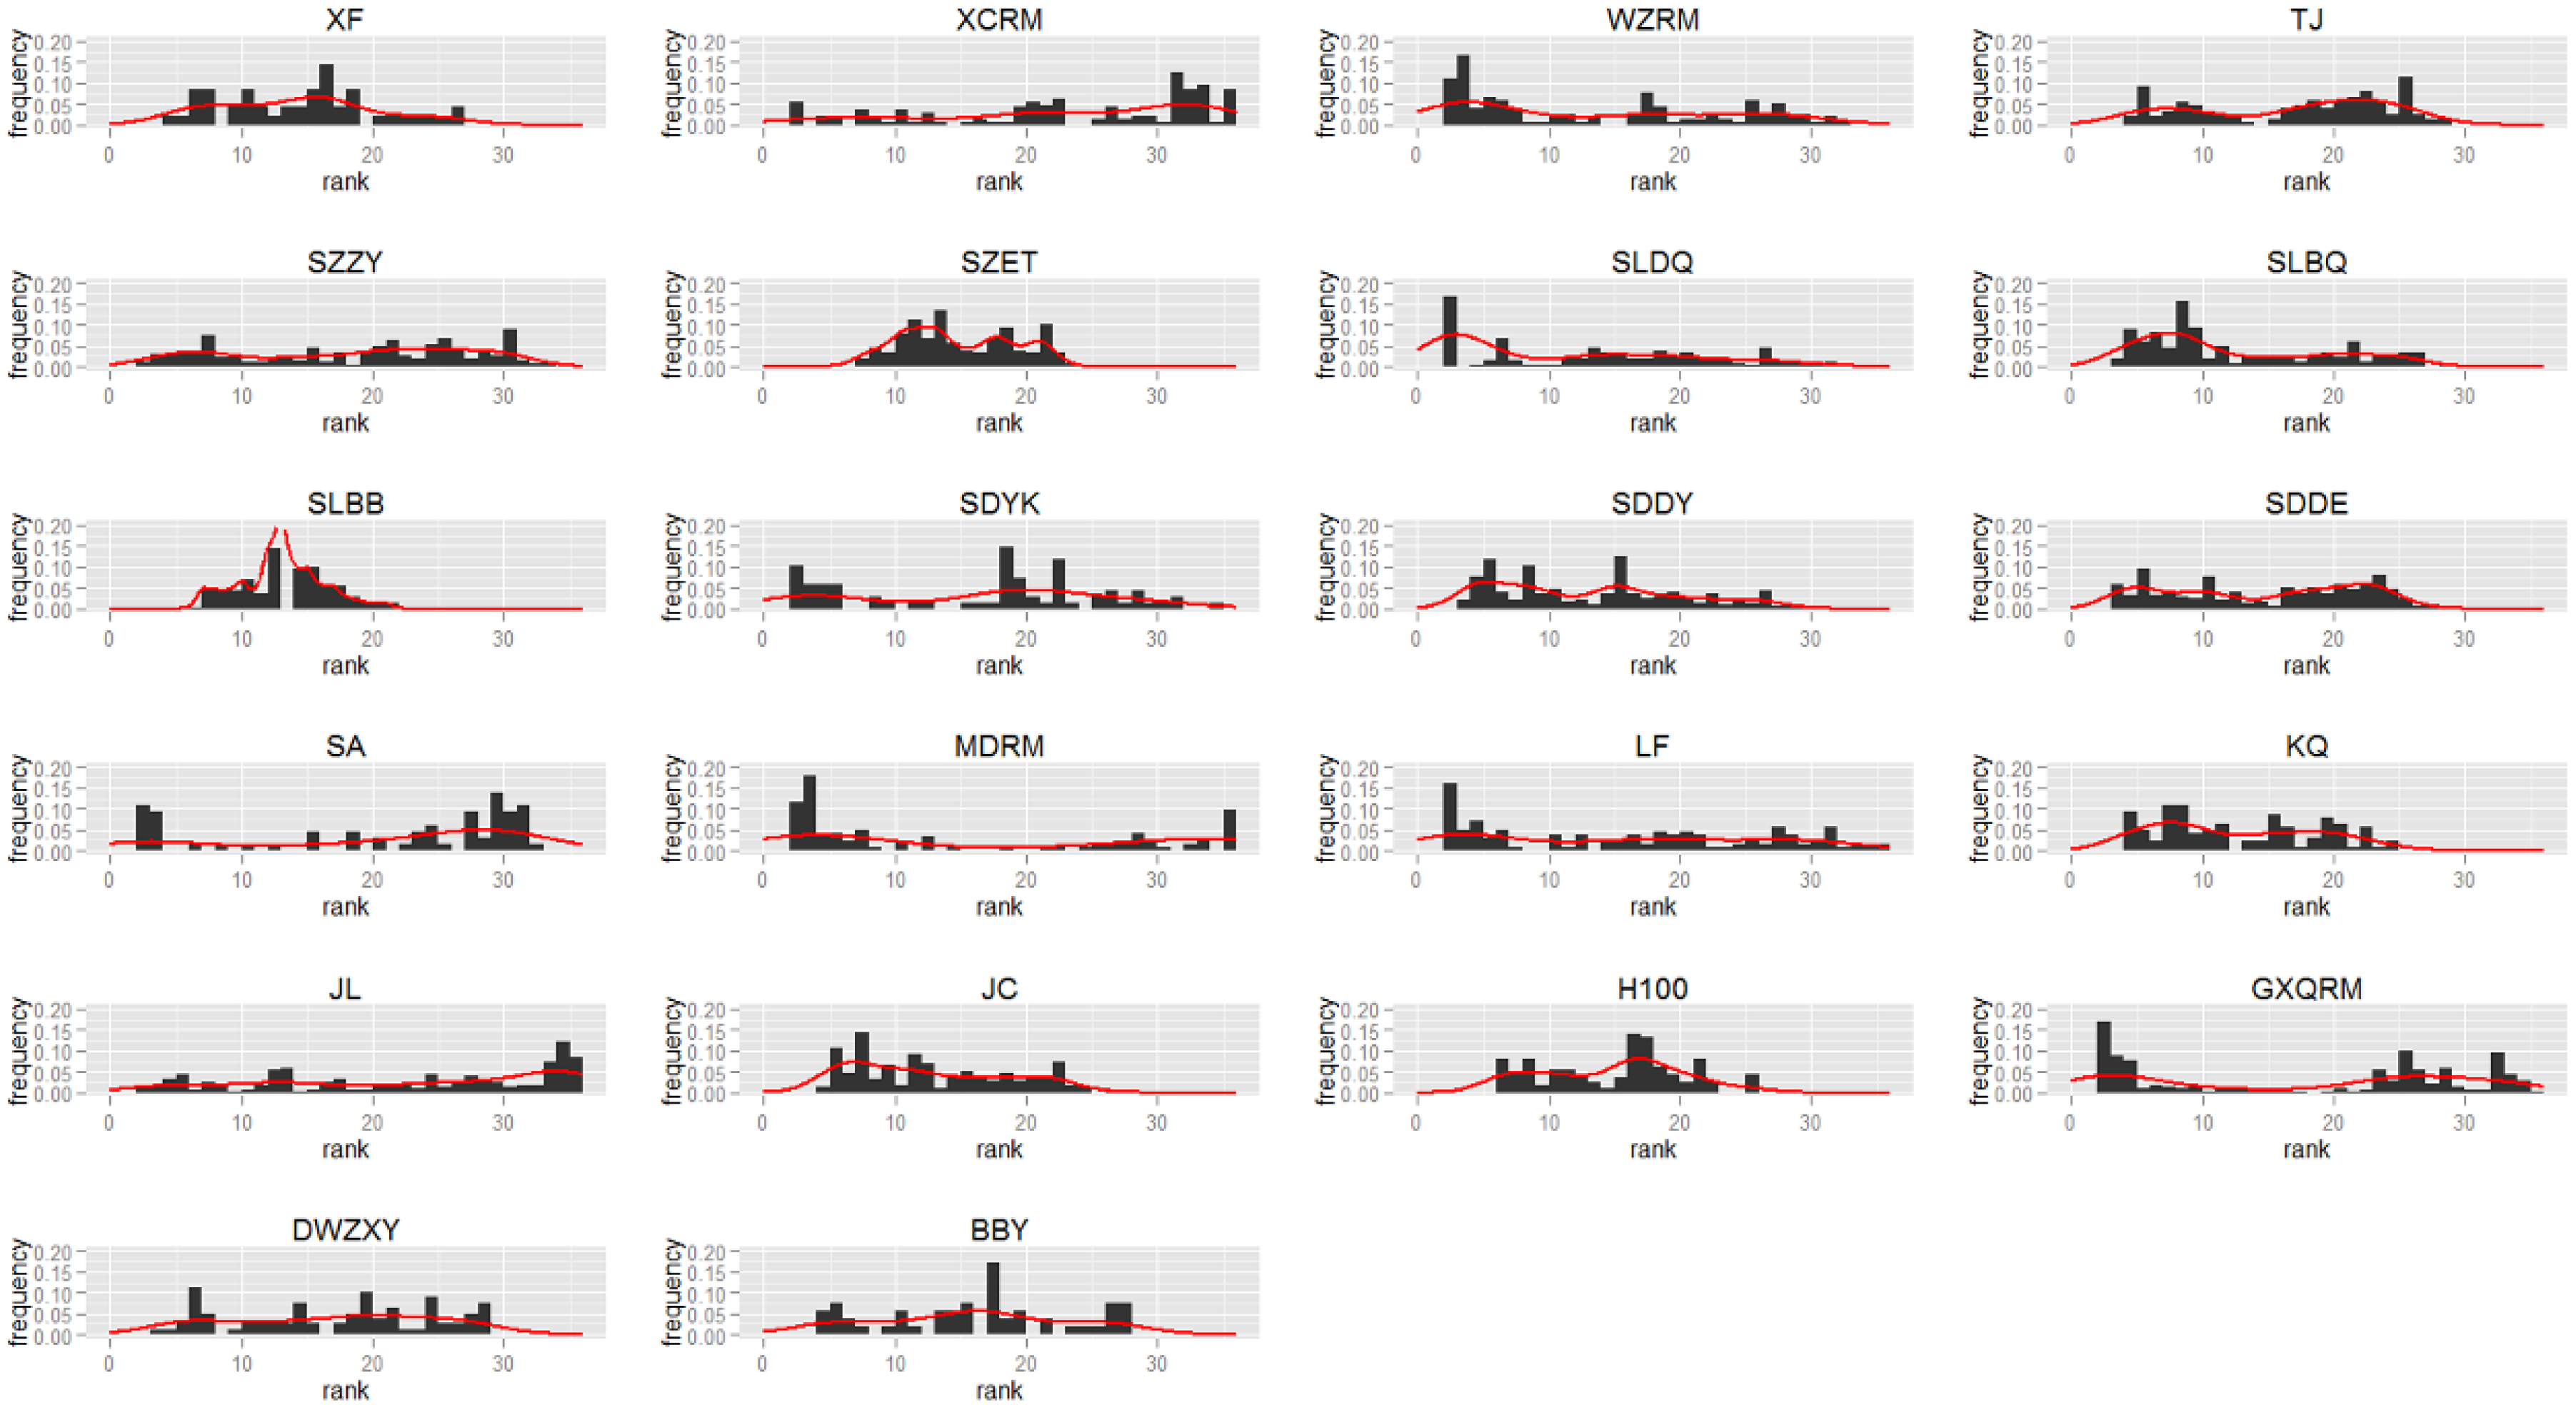
3.2. Distance Ranking Characteristics

Figure 5, Figure 6, Figure 7 and Figure 8 show hospital bypass distance rank histograms for the hospitals examined in the two study areas under two conditions. In each graph, the bottom axis (X-axis) reflects the trip distance ranking of a given hospital, whereas the vertical axis (Y-axis) shows the frequency of each rank; the red line serves as the probability density curve.
As shown in Figure 5, the distance rank histograms for the examined Beijing hospitals can be grouped into the following three classes according to the characteristics of the rank frequency distribution:
  • Hospital bypass source points are mainly found between the sections ranked 2 and 10, which include YY, XW, EYSET, BDDS, GAM, H306, WJ, and H301;
  • Hospital bypass source point distributions are relatively uniform between the sections ranked 2 and 30, which include BDRM, TR, ZY, XH, BDDY, ET, and JST;
  • Hospital bypass source points show clear distribution patterns in the sections ranked 30–50, which include ZL, H307, MH, YA, and BDKQ.
In general, the non-neighboring hospital bypass trip distance (more than 3 km) rank histogram of the examined Beijing hospitals shown in Figure 6 is similar to the histogram in Figure 5. Slight differences can be observed between the hospitals, e.g., GAM, and the hospital bypass source point distributions are relatively uniform for this period.
Figure 7 presents a non-neighboring hospital bypass trip distance rank histogram for the Suzhou hospitals examined. The values can be grouped into three classes based on the following rank frequency distribution characteristics:
  • Hospital bypass source points are mainly found between the sections ranked 2 and 15, which include XF, WZRM, TJ, SZET, SLDQ, SLBQ, SLBB, SDDY, LF, KQ, JC, H100, and BBY;
  • Hospital bypass source point distributions are relatively uniform from the sections ranked 2 to 30, which include SZZY, SDYK, SDDE, and DWZXY;
  • Hospital bypass source points show a clear distribution pattern from the section ranked 30 to the end, which account for XCRM, SA, MDRM, GXQRM, and JL.
Similar to Beijing, the farthest hospital bypass trip distance (more than 3 km) rank histogram for the examined Suzhou hospitals in Figure 8 is generally similar to the histogram shown in Figure 7, with the exception of XF; for XF in Figure 8, the hospital bypass source points mainly concentrate in sections 5–20, especially in sections 15–20.

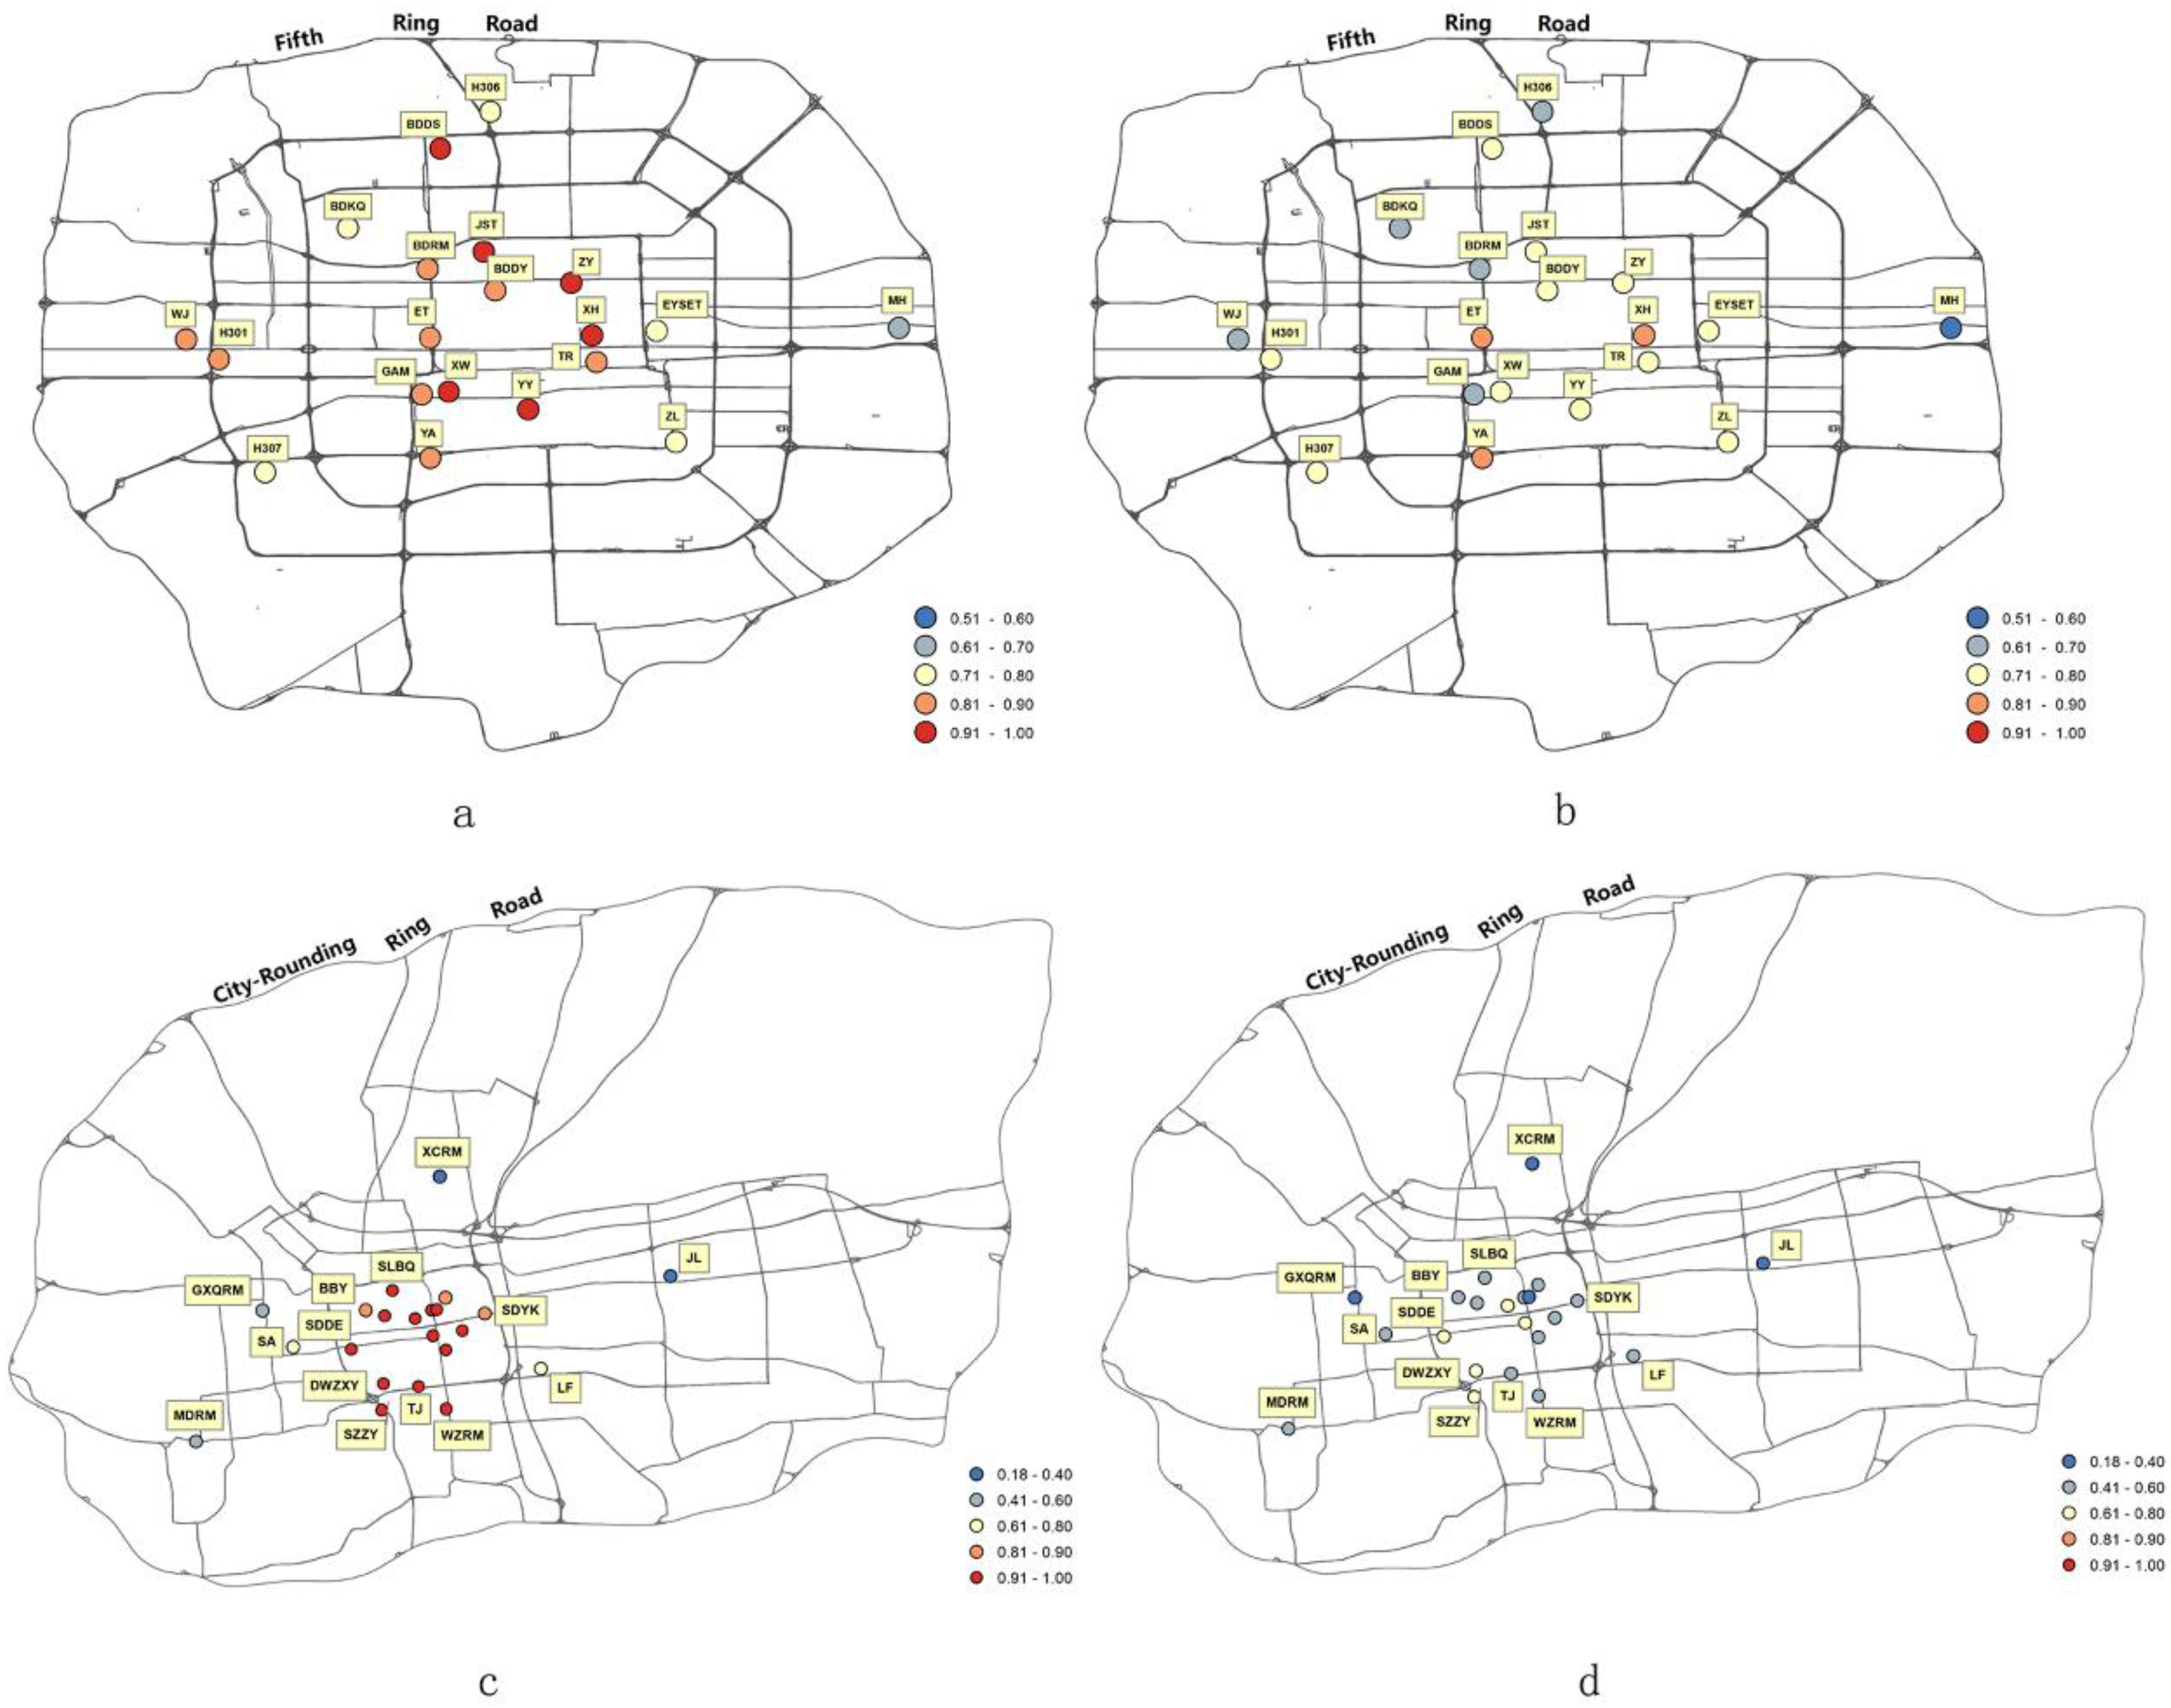
3.3. Hospital Bypass Share

Figure 9 shows the proportion of hospital bypass source points for the two study areas under two conditions for all of the non-neighboring hospital bypass trips and for trip distances exceeding 3 km. Hospitals listed along the horizontal axis are sorted by source point quantities. The figure clearly shows that the proportions found in the two conditions are nearly identical, with very minimal differences found in the two study areas. For the Beijing hospitals examined (Figure 9a), the proportions gradually increase with the source point quantities, reaching a maximum value of 12.38%/11.87% (BDDS). This trend is conspicuous. However, a notable exception is found in Suzhou (Figure 9b). JL includes the second largest total number of source points; however, the corresponding proportion is much smaller. This finding is attributable to the fact that JL occupies a large area east of the Suzhou urban area; thus, neighboring residents and residents located farther away prefer to use JL, as it is the closest high-quality hospital. Thus, while the total number of source points in JL is high, the proportion is low (only approximately 4%). The highest proportion found in Suzhou is 18.72%/18.01% (SLBB). The daily outpatient visits of those hospitals with high proportion shared in both cities were come out in front among the local hospitals. For example, the number in sample hospitals with high proportion shared in Beijing (i.e., BDDS, H301, YY, and XH) were more than 3500. Moreover, these hospitals have unique medical features and tend to attract many outpatient visits and even more bypass patients. BDDS, for instance, has a strong nationwide reputation as it houses some of the earliest established medical departments in China such as the Spinal Surgery department and the Reproductive Medicine Centre. Similar trends were found in Suzhou, where SLBB has the largest maternity and childcare institution in Southern Jiangsu and has been a trusted medical service by Suzhou natives for over 60 years.

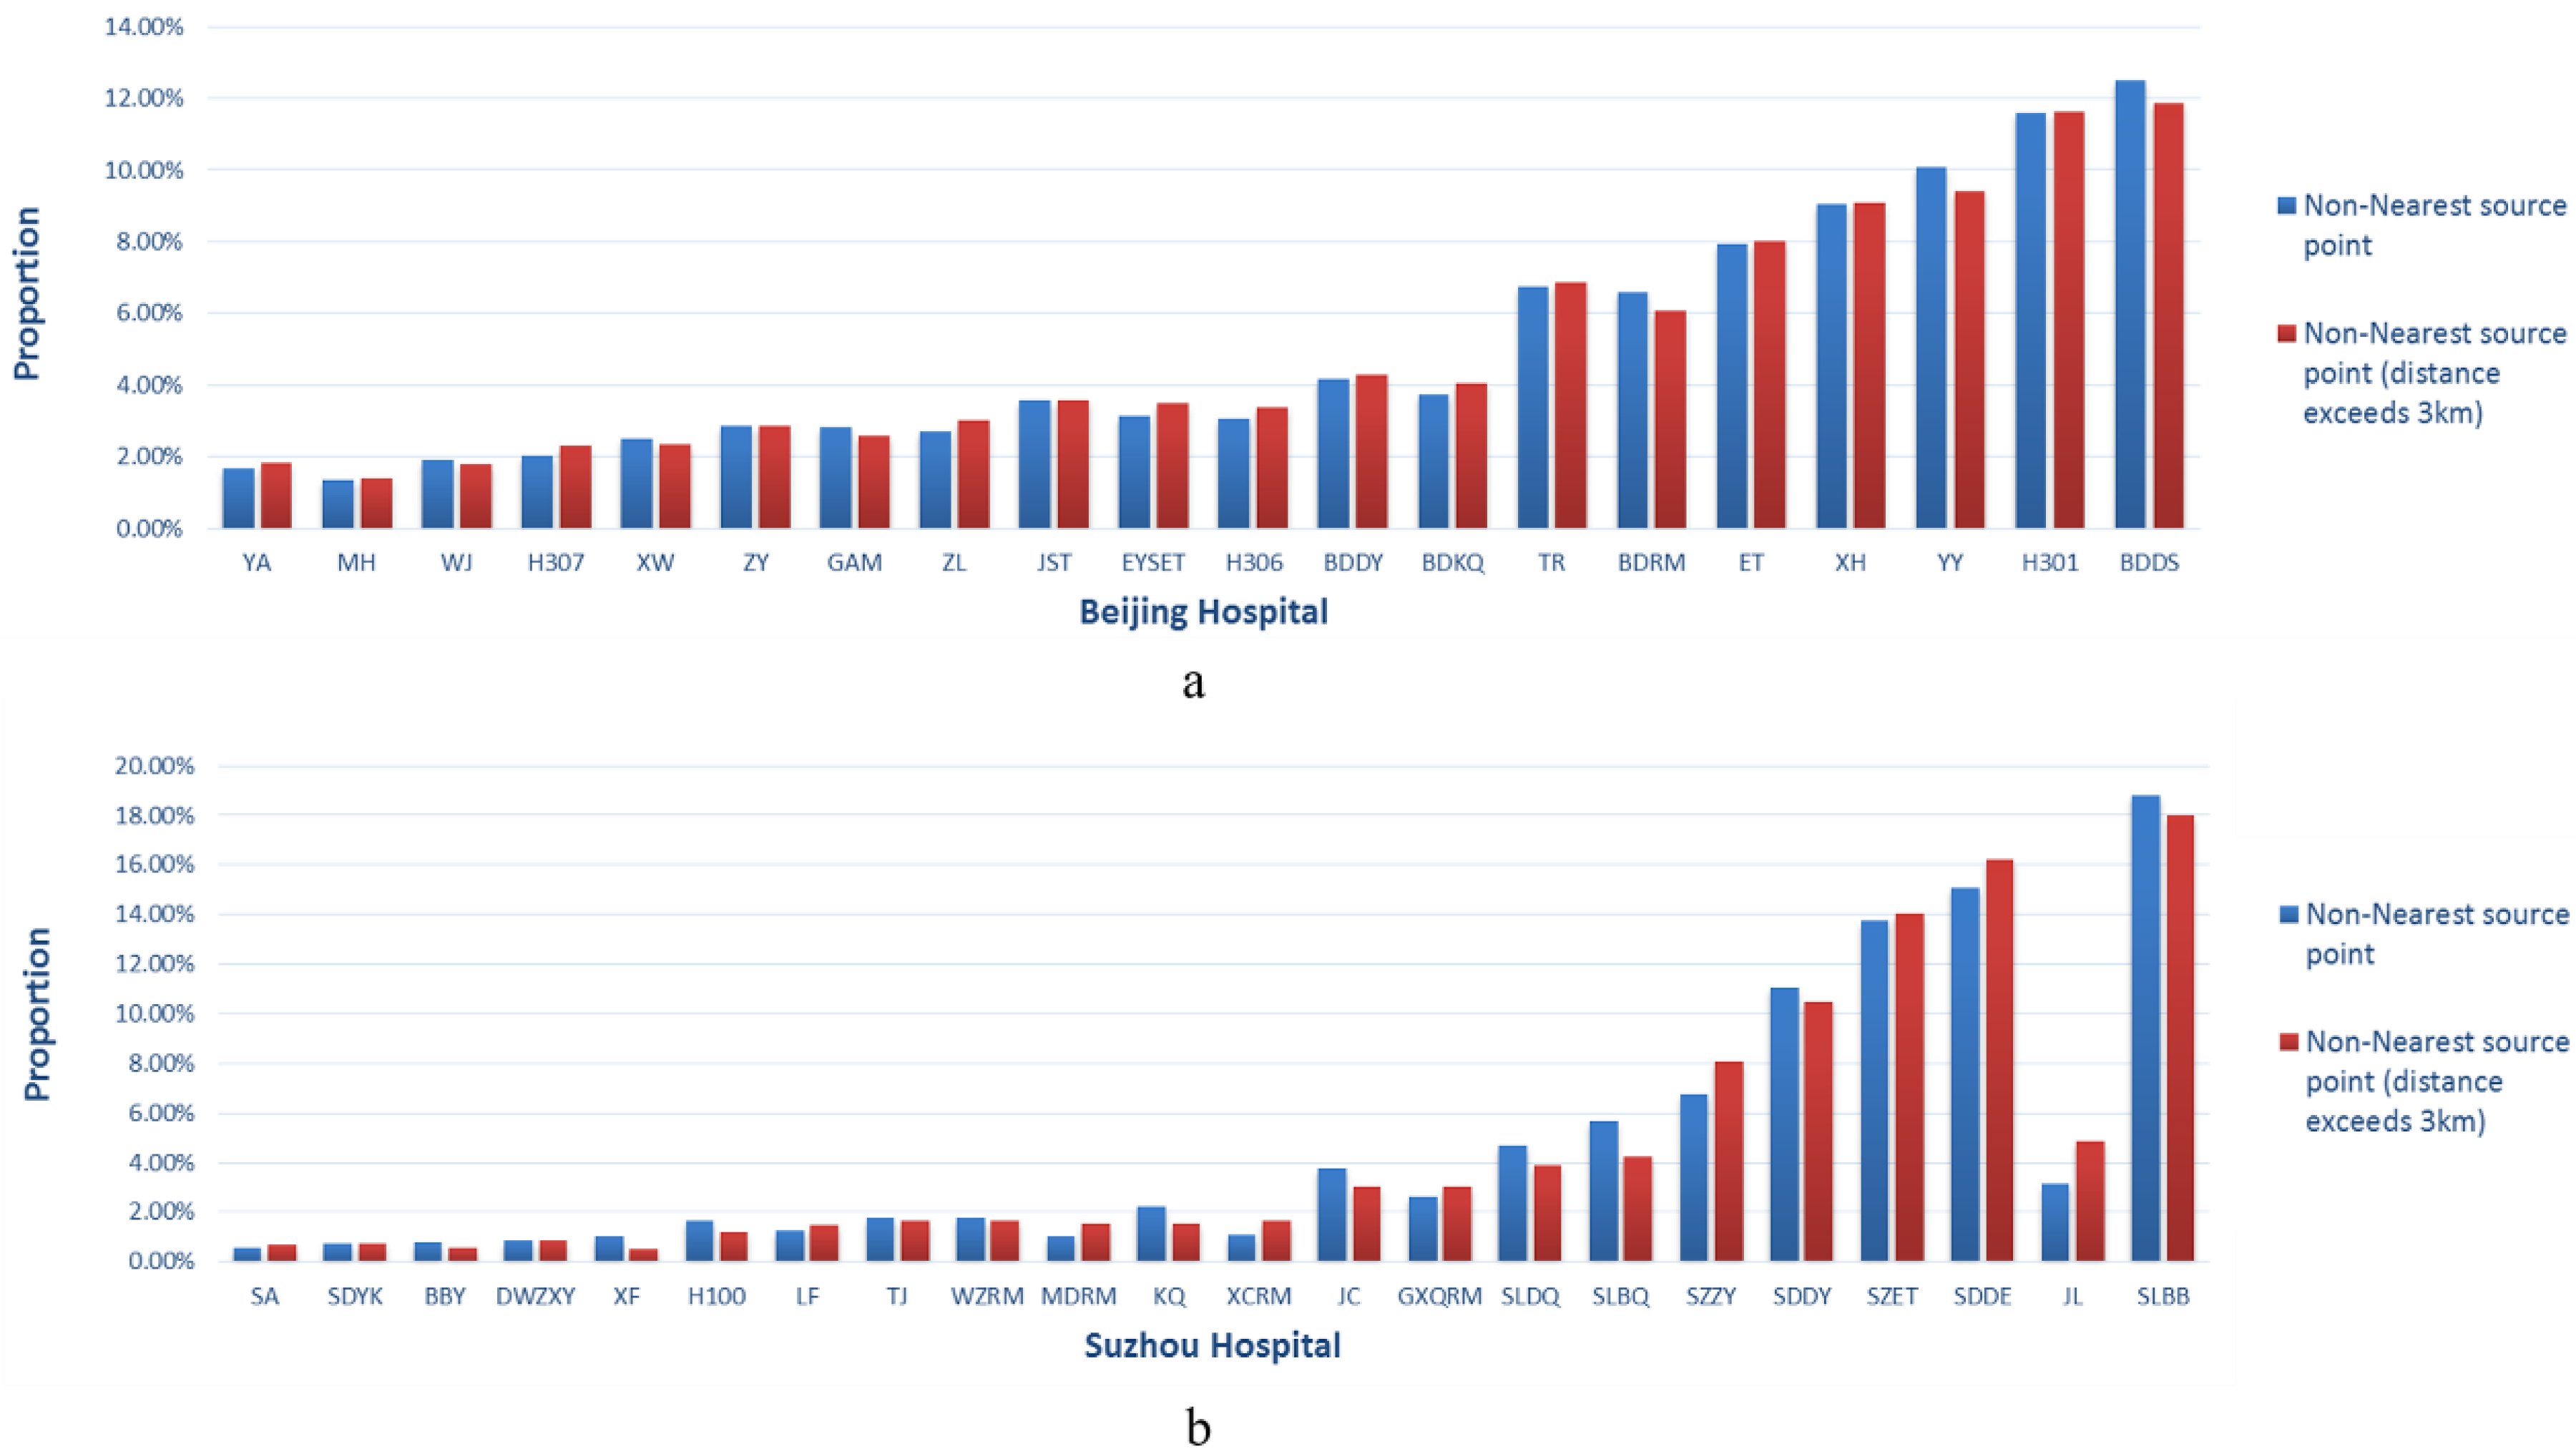
3.4. Hospital Bypass Proportion

Figure 10 shows the proportion of hospital bypass source points found for each hospital examined. Figure 10a,b presents the proportional distribution of all non-neighboring hospital bypass trips made to the Beijing hospitals examined. Figure 10c,d shows the same data for the Suzhou hospitals examined. The higher the proportion, the higher the demand for the corresponding hospital was found to be. For the Beijing hospitals examined, hospitals with higher ratios (>0.8) were generally found around the center of the Beijing urban area and around the 4th ring road (H301, WJ and BDDS; Figure 10a). Figure 10b presents the proportional distribution of the non-neighboring hospital bypass proportion (trip distances exceeding 3 km), which was found to differ from that found for all of the trips combined; in addition, the proportion was generally found to be descending. However, several hospitals were found to maintain nearly the same ratios (H307, YA and ZL), indicating that non-neighboring hospital bypass trip distances to these hospitals were at least greater than 3 km. Hospitals with other ratios were found to be scattered throughout urban areas, with MH presenting the lowest ratios in both conditions. For the Suzhou hospitals examined, non-neighboring hospital bypass trips (Figure 10c) showed similar patterns to those found for Beijing (Figure 10a), but with a higher degree of geographic heterogeneity. For example, JL, which is located in the eastern Suzhou urban area, had a proportion of 0.181, whereas SLBQ, positioned near the center of Suzhou, had the highest proportion at 0.985. Analogously, non-neighboring hospital bypass trip proportions (trip distances exceeding 3 km) tended to be lower, with most recorded between 0.4 and 0.6. No discernable proportional distribution trend was observed from the corresponding map (Figure 10d).

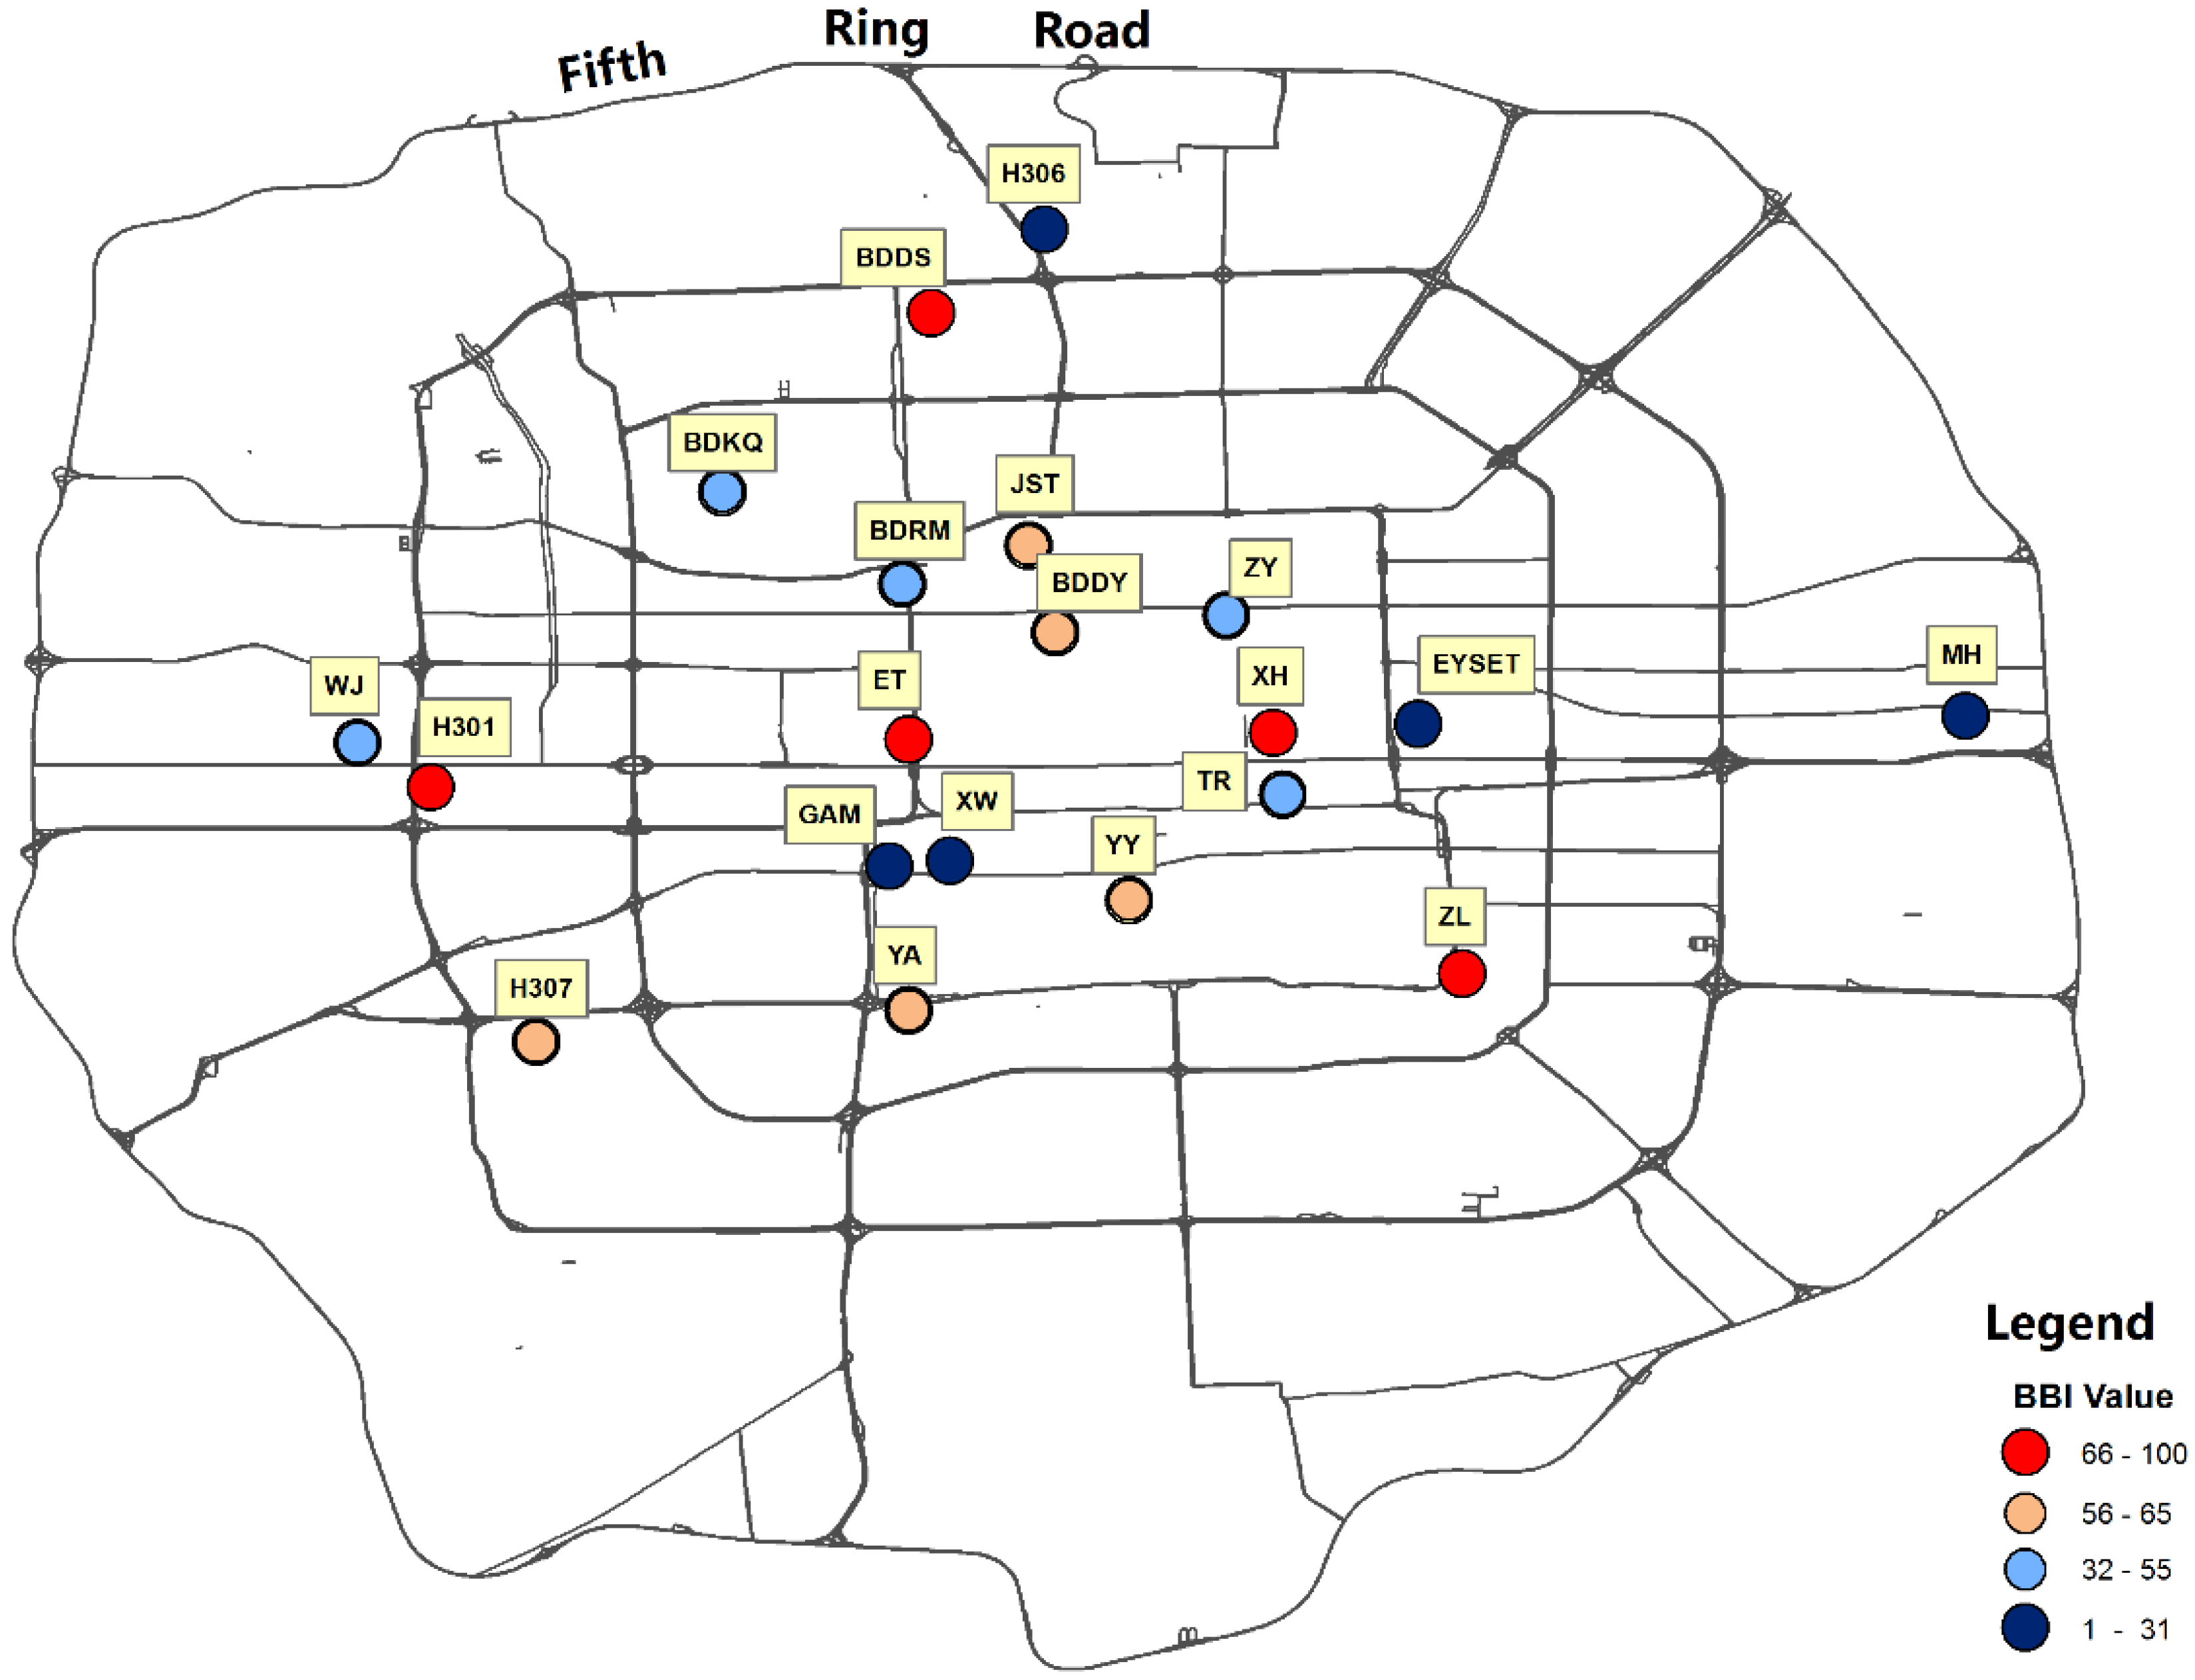
3.5. Bypass Behavior Assessment

All of the second-closest hospital bypass trips to hospitals examined in the two areas were measured. Average distances of 2.94 km (Beijing) and 2.74 km (Suzhou) were found. To avoid collecting vague distance differences to resident identifications of the closest hospitals, the non-neighboring hospital bypass trip distance results (exceeding 3 km) were used here to assess the hospital bypass behavior of each examined hospital.
Figure 11 presents the BBI distributions for each Beijing hospital examined. As shown in the figure, H301, ET, XH, BDDS, and ZL occupy the first five positions, respectively (BBI value > 66), whereas GAM, H306, EYSET, XW, and MH rank in the last five positions, respectively (BBI value < 32). Hospitals of each rank are generally scattered throughout the Beijing study area. The distributions for Suzhou are shown in Figure 12. SDDE, SZZY, SLBB, ET, and SA rank in the top five positions, respectively (BBI value > 66), and SLBQ, H100, JC, BBY, SLDQ, KQ, and XF rank in the last seven positions, respectively (BBI value < 29), with most being located within the older downtown district of Suzhou; however, mid-ranking hospitals are primarily found in the surrounding areas.

4. Discussion

4.1. Bypass Behavior Analysis

This study evaluates patient bypass behavior in relation to high-quality hospitals in Beijing and Suzhou using taxi trip OD data. The top five BBI values for Beijing were found for the following hospitals: H301, ET, XH, BDDS, and ZL. Of these hospitals, ET, XH, and ZL are located within or next to the 2nd ring road and H301 and BDDS are located next to the 4th ring road. Patient bypass phenomena appear to be more pronounced here than for the other Beijing hospitals examined. The lowest ranked BBI values (GAM, XW, and EYSET) are found next to the 2nd ring road; H306 and MH are positioned near the 4th and 5th ring roads, respectively. Hospitals with other values are scattered across the ring road areas. These trends are partly attributable to hospital specialties. In Beijing, most of the examined hospitals manage specialty departments that are ranked among the best in the country. Certain hospitals manage several specialty departments, e.g., H301 and XH; however, hospitals that lack high-ranking departments show lower BBI values, e.g., MH and H306. The presence of outstanding medical facilities encourages hospital bypass patients to access such services by taxi. However, certain exceptions are found. For example, the TR ophthalmology department is one of the best in China [39], and patients travel from all parts of the country and stay near TR when visiting Beijing. In this case, fewer taxi source points are found further away; thus, TR is not particularly popular among hospital bypass taxi passengers. Similarly, EYSET treats children, and the road in front of its main entrance (near the west gate of Ritan Park) is a one-way street, leading to the development of constant traffic jams. Thus, patients are more likely to use public transportation to access this facility.
In the Suzhou study area, hospitals with higher and lower BBI values are located in and around archaic zones; this is likely because of the spatial distribution of Suzhou hospitals and the major differences among them. For example, while SLBB and XF are positioned close to each other, SLBB has a completely different number of hospital bypass source points than XF (2693 for SLBB, 145 for XF). This difference is attributable to the fact that SLBB has a much better reputation than XF, boasting superior medical facilities and medical staff. Additionally, SLBB is more accessible by vehicle, e.g., taxi. SA, which has a small number of hospital bypass patients but ranks high in BBI, serves as a special case. Patients who wish to meet with reshaping experts and who seek access to cosmetic surgery services travel long distances to use SLBB. Medium BBI hospitals are distributed across vast areas surrounding the archaic zone.

4.2. Comparisons between the Two Study Areas

We examined a district within the Fifth Ring Road in Beijing and a district within the City-Rounding Ring Road in Suzhou, and 20/22 hospitals were examined to study patient hospital bypass phenomena. It is worth noting here that certain patients in Beijing must visit doctors at several hospitals due to medical insurance restrictions. To mitigate the effects of these restrictions, the 16 examined Beijing hospitals are A-class designated medical organizations that accept basic medical insurance [40]; WJ is not a designated hospital. Therefore, of the hospital patients studied, 85% were not affected by reimbursement limitations. In Suzhou, there are no restrictions on the number of hospitals designated for individual medical insurance purposes.
The differences in hospital bypass phenomena for the two study areas mainly pertain to two factors. First, hospital bypass trip distances in Beijing are greater than those in Suzhou. Mean values, maximum bypass trip distance values and hospital bypass proportions for Beijing are greater than those for Suzhou. This finding may indicate that the patient hospital bypass phenomenon is likely to appear more serious in Beijing. In addition, hospital bypass levels found for the examined hospitals vary greatly in Suzhou, whereas variations are relatively less significant in Beijing. Consequently, the levels of spatial heterogeneity for Suzhou hospitals appear more significant than those found for Beijing.
Three regional disparities must be considered when interpreting the differences between the two cities. First, the spatial distribution patterns of quality medical resources in Beijing and Suzhou are completely different. A comparison between the maps shown in Figure 1 shows that hospitals in Beijing are more widely dispersed than those in Suzhou. Tertiary hospitals in Beijing are distributed relatively uniformly within the Fifth Ring Road; however, hospitals in Suzhou are mainly located in archaic zones, which form approximately 5% of the area of Suzhou city proper. Second, in Beijing, medical resources are generally better than those in Suzhou. This distinction is common between a typical metropolis and an economically developed secondary city. There are nearly six times more tertiary hospitals in Beijing relative to the 10 tertiary hospitals located in Suzhou. Beijing also boasts numerous famous hospitals with outstanding medical features relative to the few renowned facilities in Suzhou. These two factors lead to less significant differences in the extent of hospital bypass behavior among the hospitals in Beijing and reflect patients in Suzhou being more accustomed to using the best hospitals. Third, transportation conditions surrounding hospitals may have an effect. Beijing boasts relatively complete traffic networks, with many hospitals located near subway stations; however, most hospitals in Suzhou are located in archaic zones, where traffic jams occur frequently. Such factors may partly affect hospital selection behaviors.
This study presents certain limitations. First, as new data, taxi trip OD can only reflect medical care-seeking behaviors to a certain degree because they lack information on patient attributes. Certain variables, e.g., age and occupation, were not considered in the assessment. Additional registration data on patient attributes would improve the accuracy of the findings. Second, Beijing and Suzhou were selected as study areas, and only certain hospitals in the cities were examined. The relatively small sample size used (20/22 for Beijing and Suzhou, respectively) cannot reflect all meaningful patterns found around both cities. Thus, the results should be considered to be preliminary and exploratory. Such issues related to data collection and sampling should be resolved in future studies.

5. Conclusions

This paper presents a novel perspective on patient bypass behavior, i.e., patient bypass behavior related to the selection of high-quality medical resources and based on taxi GPS data. Spatial diversity levels and uneven distributions of high-quality hospitals in Beijing and Suzhou were explored. Certain conclusions can be made with regard to the two study areas:
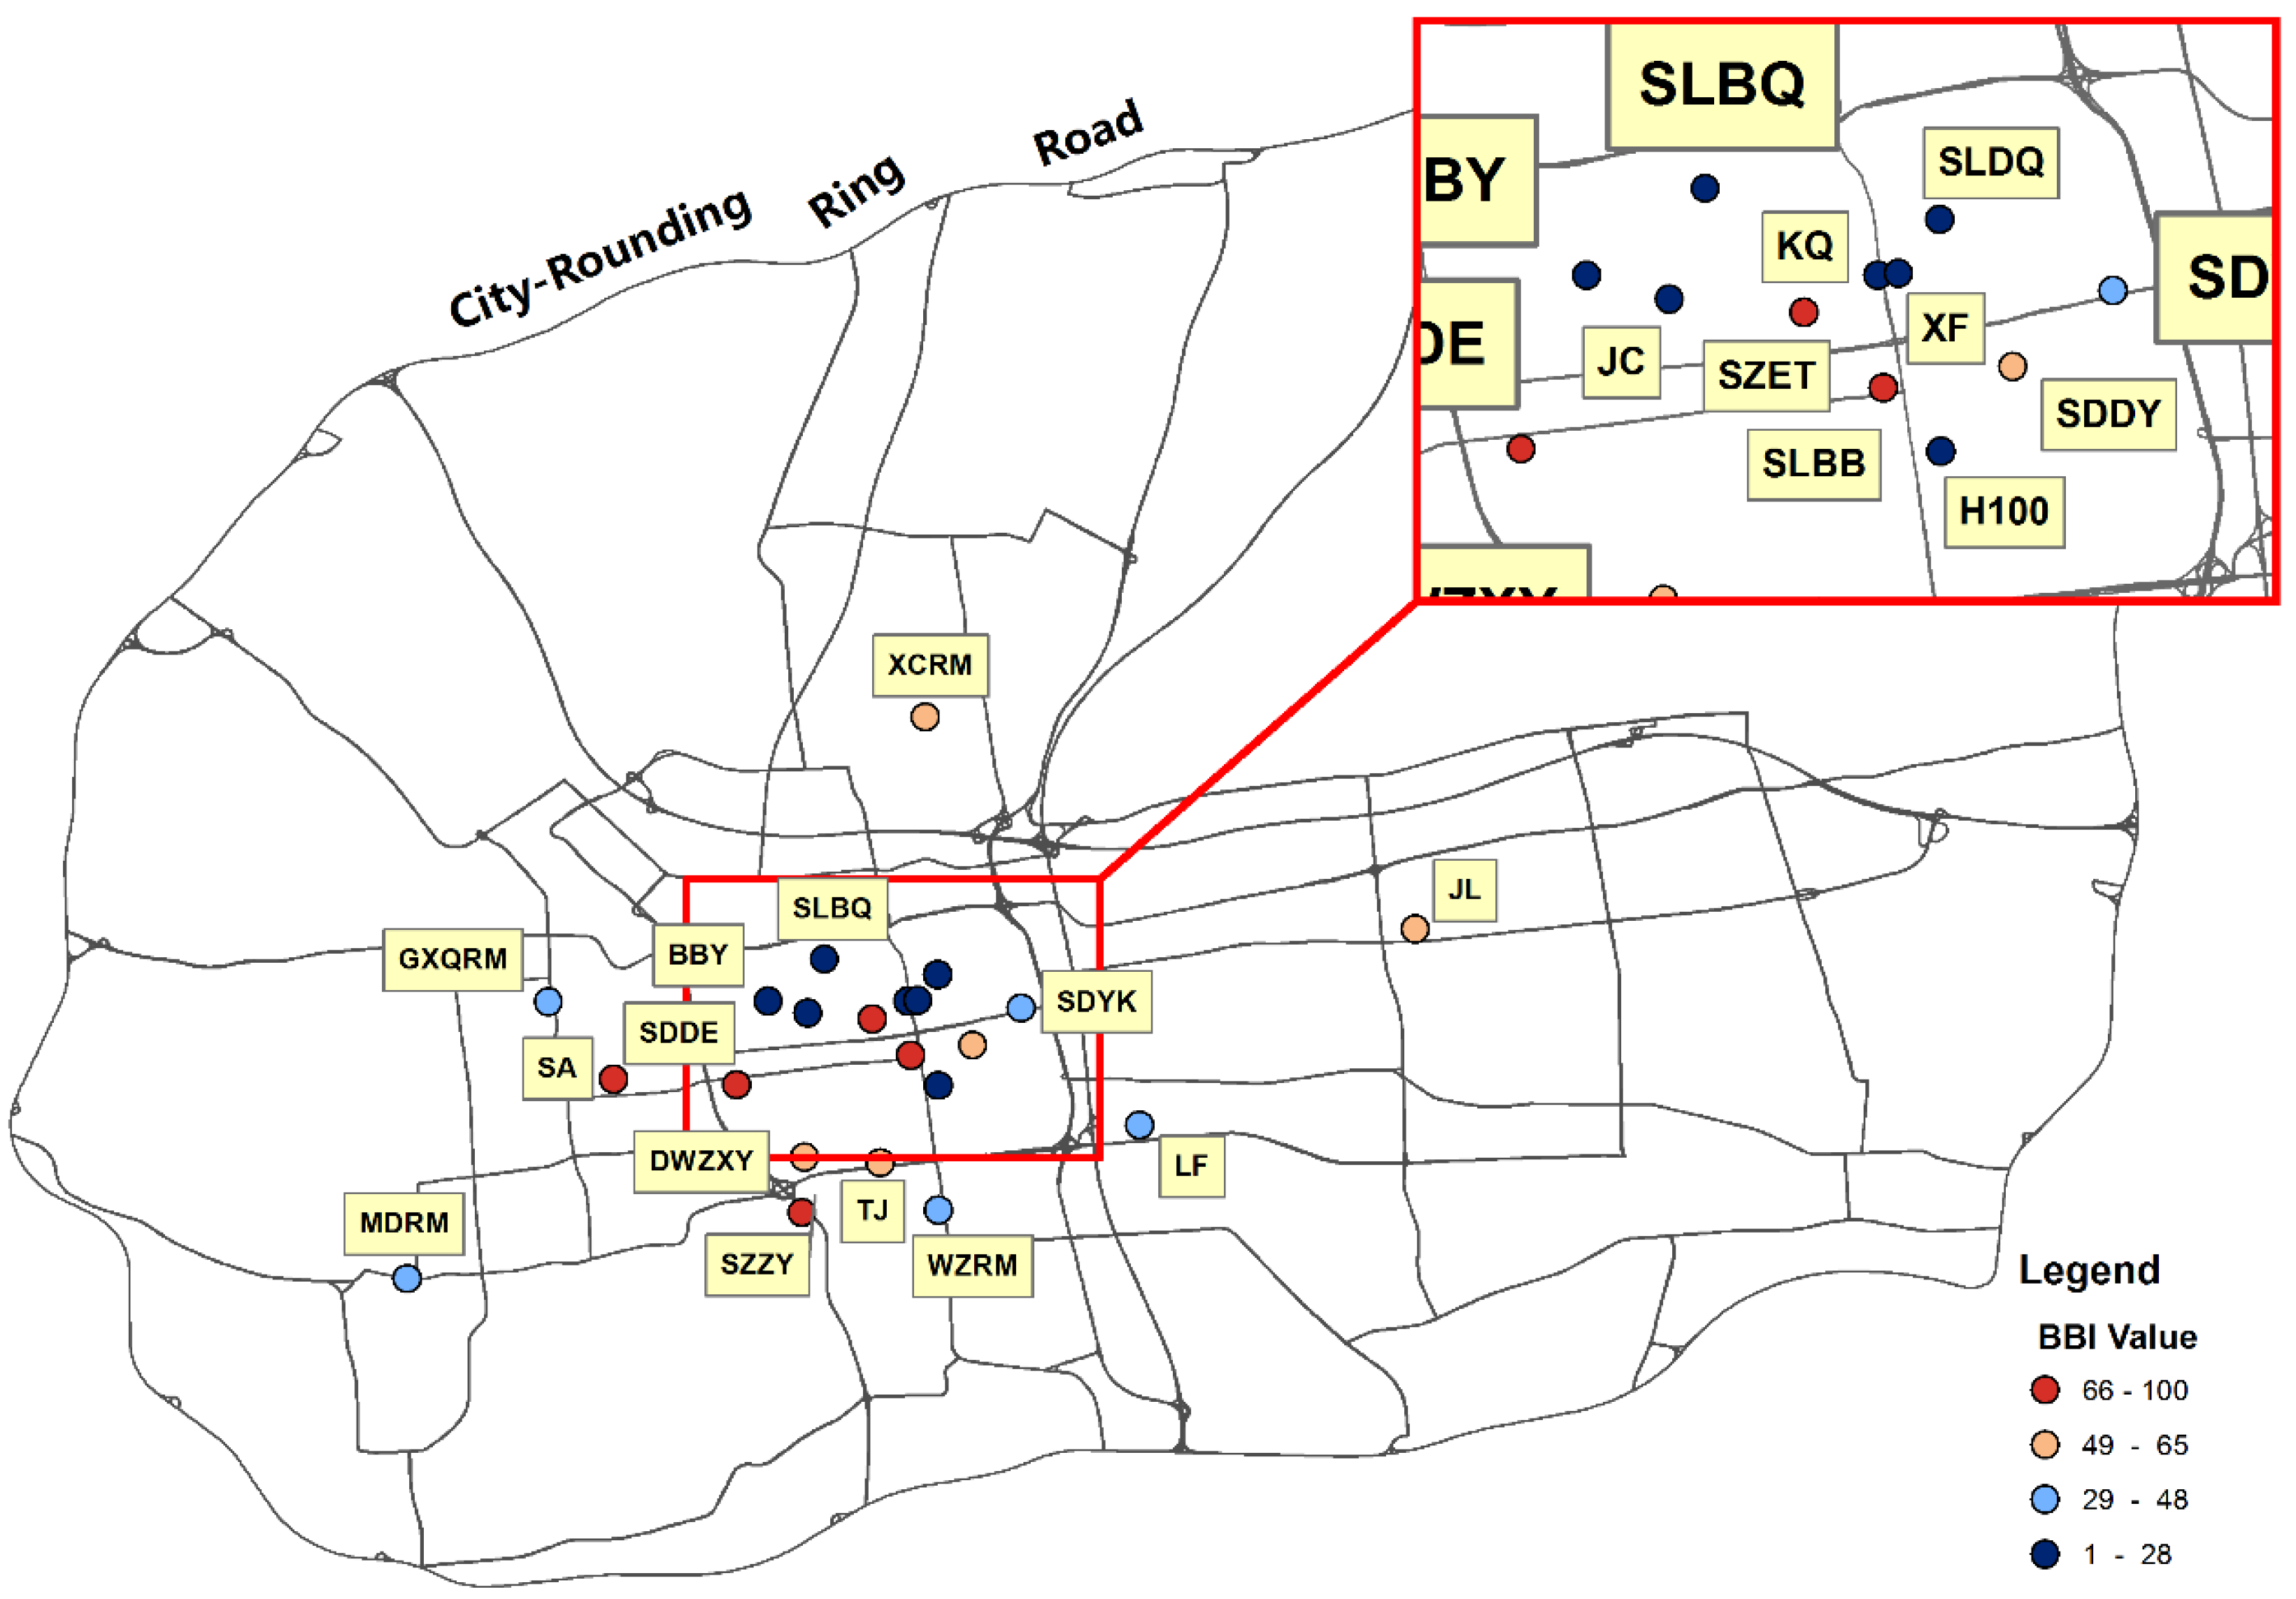
  • For the Beijing hospitals examined, H301, ET, XH, BDDS, and ZL occupy the top five BBI rank positions; for the Suzhou hospitals examined, SDDE, SZZY, SLBB, ET, and SA occupy the top five BBI rank positions.
  • Hospital reputation, transport considerations, and spatial distributions may influence BBI variations. The presence of specialty departments, convenient transportation access, and prime location features increase a hospital’s bypass level.
  • Generally speaking, patient hospital bypass phenomena are likely to be more pronounced in Beijing. Differences in the bypass trip distances between hospitals are more significant in Suzhou. These results are likely attributable to differences in hospital distribution patterns and quality levels between the two cities.

Acknowledgments

All of the authors gratefully thank the reviewers and editor for their insightful and constructive comments. We also appreciate suggestions on the research project from Jixia Huang in the College of Forestry at Beijing Forestry University and all of the professionals who helped collect the data. Financial support comes from the National Natural Science Foundation of China (Grant No. 41525004, 41421001 and 41231171).

Author Contributions

Gege Yang and Tao Pei were mainly responsible for the conception and design of the article, the analysis of the data, the drafting of the article and the final approval of the version to be published. Ci Song contributed to the design and analysis of the study and to manuscript revisions. Hua Shu and Jia Zhang contributed to drafting the method section of the article. Chenghu Zhou edited the manuscript. All authors read and approved the final manuscript.

Conflicts of Interest

All authors declare that they have no financial or competing interests that relate to the material in the manuscript.

Appendix A

Table A1. Abbreviations of the full name of sample hospitals in Beijing and Suzhou.
LocationFull Name of HospitalAbbreviation
BeijingPeking University Third HospitalBDDS
BeijingPeking University First HospitalBDDY
BeijingPeking University School of StomatologyBDKQ
BeijingPeking University People’s HospitalBDRM
BeijingBeijing Children’s Hospital affiliated to Capital Medical UniversityET
BeijingChildren’s Hospital affiliated to The Capital Institute of PediatricsEYSET
BeijingGuang’anmen Hospital affiliated to China Academy of Chinese Medical SciencesGAM
Beijing301 HospitalH301
Beijing306 HospitalH306
Beijing307 HospitalH307
BeijingBeijing Jishuitan HospitalJST
BeijingCivil Aviation General HospitalMH
BeijingBeijing Tongren Hospital affiliated to Capital Medical UniversityTR
BeijingThe Armed Police General HospitalWJ
BeijingPeking Union Medical College HospitalXH
BeijingXuan Wu Hospital affiliated to Capital Medical UniversityXW
BeijingBeijing You’an Hospital affiliated to Capital Medical UniversityYA
BeijingBeijing Friendship Hospital affiliated to Capital Medical UniversityYY
BeijingCancer Hospital affiliated to Chinese Academy of Medical SciencesZL
BeijingBeijing Hospital of Traditional Chinese MedicineZY
SuzhouSuzhou Beibingying HospitalBBY
SuzhouSuzhou Dongwu Hospital integrating Traditional Chinese & Western MedicineDWZXY
SuzhouSuzhou Gaoxinqu People’s HospitalGXQRM
Suzhou100 HospitalH100
SuzhouSuzhou Jinchang Medical BeautyJC
SuzhouSuzhou Kowloon Hospital affiliated to Shanghai Jiaotong University Medical SchoolJL
SuzhouSuzhou Stomatological HospitalKQ
SuzhouSuzhou Gongyeyuanqu Loufeng HospitalLF
SuzhouSuzhou Mudu People’s HospitalMDRM
SuzhouSuzhou SaintLove Plastic BeautySA
SuzhouThe Second Affiliated Hospital of Soochow UniversitySDDE
SuzhouThe First Affiliated Hospital of Soochow UniversitySDDY
SuzhouLixiang Eye Hospital of Soochow UniversitySDYK
SuzhouSuzhou Municipal Hospital, HeadquartersSLBB
SuzhouSuzhou Municipal Hospital, North DistrictSLBQ
SuzhouSuzhou Municipal Hospital, East DistrictSLDQ
SuzhouChildren’s Hospital of Soochow UniversitySZET
SuzhouSuzhou Hospital of Traditional Chinese MedicineSZZY
SuzhouSuzhou Tongji Medical CosmetologyTJ
SuzhouSuzhou Wuzhong People’s HospitalWZRM
SuzhouSuzhou Xiangcheng People’s HospitalXCRM
SuzhouThe Fire Hospital of SuzhouXF
Note: The abbreviations have been generated according to Chinese Pinyin.

Appendix B

Table B1. Descriptive statistics of trip distance for the sampled Beijing hospitals.
HospitalNon-Neighboring Hospital Bypass Distances (km)Non-Neighboring Hospital Bypass Distances (Exceeding 3 km)
MeanMaxSTDEVVarMeanMaxSTDEVVar
BDDS6.70636.2764.62621.4007.57736.2764.55620.756
BDDY7.19937.8734.62421.3797.73237.8734.57320.914
BDKQ8.12932.7764.90924.1018.39732.7764.86923.706
BDRM6.79532.9314.96624.6617.84232.9314.99124.915
ET7.83843.4795.52030.4668.88743.4795.36028.733
EYSET7.76628.7234.54120.6258.37428.7234.38619.234
GAM6.54934.1234.34518.8837.75834.1234.18717.529
H3018.52478.8556.70644.9759.20678.8556.73345.337
H3067.26426.6454.62521.3897.47726.6454.61621.308
H3079.33242.0845.45529.7569.42942.0845.43729.564
JST7.93177.8816.13037.5748.92177.8816.11637.411
MH9.75434.9835.32328.3369.75434.9835.32328.336
TR7.07740.2524.55920.7817.80640.2524.39819.340
WJ8.22439.3156.06036.7199.33739.3155.96435.565
XH7.08063.6504.71622.2427.80263.6504.63121.449
XW6.13833.5364.17217.4077.01133.5364.14917.214
YA7.54537.0164.74422.5047.79637.0164.73922.461
YY5.98863.4364.36919.0866.88163.4364.37719.155
ZL9.49731.1395.30128.1009.75331.1395.22327.276
ZY6.85828.8954.61821.3297.60128.8954.56620.847
Table B2. Descriptive statistics of trip distance for the sampled Suzhou hospitals.
HospitalNon-Neighboring Hospital Bypass Distances (km)Non-Neighboring Hospital Bypass Distances (Exceeding 3 km)
MeanMaxSTDEVVarMeanMaxSTDEVVar
BBY4.55916.2833.20910.2995.90616.2833.1569.960
DWZXY6.15919.0694.22117.8207.20719.0694.15317.248
GXQRM6.23825.5633.81114.5277.16625.5633.61613.074
H1004.87428.3834.12617.0236.85828.3834.37819.164
JC5.01050.5593.84914.8156.21750.5594.01316.100
JL10.28333.7984.00216.01410.28333.7984.00216.014
KQ4.72824.1784.02716.2177.01824.1784.35518.963
LF6.40017.8443.17110.0586.72717.8443.0859.519
MDRM9.58426.0334.88223.8369.63426.0334.86523.672
SA6.71516.6403.46612.0157.42716.6403.19210.189
SDDE6.14644.3114.16317.3286.83344.3114.18017.476
SDDY5.97344.0324.75222.5827.21244.0324.83523.378
SDYK5.99522.4213.79214.3786.94822.4213.62113.108
SLBB5.80640.9824.48220.0887.06240.9824.51020.342
SLBQ5.00236.3663.82414.6216.67936.3663.86514.937
SLDQ5.40832.3294.13517.0986.97232.3294.23517.932
SZET6.95641.0345.40129.1708.21141.0345.36128.745
SZZY6.74742.7614.75322.5907.61342.7614.68121.914
TJ5.78622.7154.00916.0757.23622.7153.91915.362
WZRM5.56623.0913.73013.9166.74723.0913.67513.507
XCRM8.80621.5113.46011.9708.80621.5113.46011.970
XF4.16825.5373.67713.5246.65925.5374.39419.308

References

  1. Zhang, Y.; Wang, X.; Qi, W.; Wang, J. Literature review on domestic difficulties of medical treatment. China Mod. Med. 2013, 20, 14–16. [Google Scholar]
  2. Bai, X.; Shi, P.; Liu, Y. Society: Realizing China’s urban dream. Nature 2014, 509, 158–160. [Google Scholar] [CrossRef] [PubMed]
  3. Meng, H. Study on the Current Situation, Problems and Countermeasures of Medical Function Dispersal in Beijing Central District; Capital University of Economics and Business: Beijing, China, 2014. [Google Scholar]
  4. Chen, J. Solution of the problems of “proper health care is difficult to get” by mobile medical service. Guangzhou Med. J. 2015, 46, 93–95. [Google Scholar]
  5. Li, D.; Ma, Y.; He, Q.; Yang, X.; Qi, Y. The effect of new medical reform policy on medical service accessibility. J. Bengbu Med. Coll. 2015, 40, 305–308. [Google Scholar]
  6. Liu, J.J.; Bellamy, G.; Barnet, B.; Weng, S. Bypass of local primary care in rural counties: Effect of patient and community characteristics. Ann. Fam. Med. 2008, 6, 124–130. [Google Scholar] [CrossRef] [PubMed]
  7. Sanders, S.R.; Erickson, L.D.; Call, V.R.; Mcknight, M.L. Middle-aged and older adult health care selection: Health care bypass behavior in rural communities in Montana. J. Appl. Gerontol. 2015. [Google Scholar] [CrossRef] [PubMed]
  8. Liu, J.; Bellamy, G.R.; McCormick, M. Patient bypass behavior and critical access hospitals: Implications for patient retention. J. Rural Health 2007, 23, 17–24. [Google Scholar] [CrossRef] [PubMed]
  9. Gauthier, B.; Wane, W. Bypassing health providers: The quest for better price and quality of health care in Chad. Soc. Sci. Med. 2011, 73, 540–549. [Google Scholar] [CrossRef] [PubMed]
  10. Sanders, S.R.; Erickson, L.D.; Call, V.R.; McKnight, M.L.; Hedges, D.W. Rural health care bypass behavior: How community and spatial characteristics affect primary health care selection. J. Rural Health 2014, 31, 146–156. [Google Scholar] [CrossRef] [PubMed]
  11. Roh, C.Y.; Lee, K.H.; Fottler, M.D. Determinants of hospital choice of rural hospital patients: The impact of networks, service scopes, and market competition. J. Med. Syst. 2008, 32, 343–353. [Google Scholar] [CrossRef] [PubMed]
  12. Karkee, R.; Lee, A.H.; Binns, C.W. Bypassing birth centres for childbirth: An analysis of data from a community-based prospective cohort study in Nepal. Health Policy Plan. 2015, 30, 1–7. [Google Scholar] [CrossRef] [PubMed]
  13. Kruk, M.E.; Mbaruku, G.; Mccord, C.W.; Moran, M.; Rockers, P.C.; Galea, S. Bypassing primary care facilities for childbirth: A population-based study in rural Tanzania. Health Policy Plan. 2009, 24, 279–288. [Google Scholar] [CrossRef] [PubMed]
  14. Victoor, A.; Delnoij, D.M.; Friele, R.D.; Rademakers, J.J. Determinants of patient choice of healthcare providers: A scoping review. BMC Health Serv. Res. 2012, 12, 272. [Google Scholar] [CrossRef] [PubMed]
  15. Drph, R.L.G.; Falcone, D.J.; Broyles, R.W.; Goldsteen, K.; Reilly, B.J. Local factors affecting the tendency to bypass local hospitals for inpatient mental health care: An exploratory analysis. J. Rural Health 1994, 10, 89–97. [Google Scholar]
  16. He, X. Factors Affecting Rural Kentucky Patients Hospital Choice and Bypass Behavior. Master’s Thesis, University of Kentucky, Lexington, KY, USA, 2011. [Google Scholar]
  17. Varkevisser, M.; Geest, S.A.V.D. Why do patients bypass the nearest hospital? An empirical analysis for orthopaedic care and neurosurgery in the Netherlands. Eur. J. Health Econ. 2006, 8, 287–295. [Google Scholar] [CrossRef] [PubMed]
  18. Zheng, Y.; Capra, L.; Wolfson, O.; Yang, H. Urban computing: Concepts, methodologies, and applications. ACM Trans. Intell. Syst. Technol. 2014, 5, 222–235. [Google Scholar] [CrossRef]
  19. Castro, P.S.; Zhang, D.; Chen, C.; Li, S.; Pan, G. From taxi GPS traces to social and community dynamics: A survey. ACM Comput. Surv. 2013, 46, 1167–1182. [Google Scholar] [CrossRef]
  20. Veloso, M.; Phithakkitnukoon, S.; Bento, C. Sensing urban mobility with taxi flow. In Proceedings of the 3rd ACM SIGSPATIAL International Workshop on Location-Based Social Networks, Chicago, IL, USA, 1–4 November 2011; pp. 41–44.
  21. Jiang, B.; Yin, J.; Chen, Z.; Zhao, S. Characterizing the human mobility pattern in a large street network. Phys. Rev. E 2009, 80, 1711–1715. [Google Scholar] [CrossRef] [PubMed]
  22. Zhang, W.; Li, S.; Pan, G. Mining the Semantics of Origin-Destination Flows Using Taxi Traces; UbiComp: Pittsburgh, PA, USA, 2012. [Google Scholar]
  23. Si, Y.; Weng, J.; Chen, Z.; Wang, Y. Taxi Travel Purpose Estimation and Characteristic Analysis Based on Multi-Source Data and Semantic Reasoning—A Case Study of Beijing; Springer: Berlin, Germany, 2014. [Google Scholar]
  24. Peng, C.; Jin, X.; Wong, K.C.; Shi, M.; Liò, P. Collective human mobility pattern from taxi trips in urban area. PLoS ONE 2012, 7, e34487. [Google Scholar] [CrossRef]
  25. Nyberg, G.; Caidahl, K.; Kharitonova, N.; Petersson, A. U 2 Sod-db: A Database System to Manage Large-Scale Ubiquitous Urban Sensing Origin-Destination Data; ACM SIGKDD International Workshop on Urban Computing: Beijing, China, 2012. [Google Scholar]
  26. Zhang, F.; Wilkie, D.; Zheng, Y.; Xie, X. Sensing the pulse of urban refueling behavior. Acm Trans. Intell. Syst. Technol. 2013, 6, 13–22. [Google Scholar]
  27. Yue, Y.; Wang, H.; Hu, B.; Li, Q.; Li, Y.; Yeh, A. Exploratory calibration of a spatial interaction model using taxi GPS trajectories. Comput. Environ. Urban Syst. 2012, 36, 140–153. [Google Scholar] [CrossRef]
  28. Ebeijing, the Official Website of the Beijing Government. Available online: http://www.ebeijing.gov.cn/ (accessed on 1 December 2015).
  29. Bejing Unified Platform for Appointment Registration. Available online: http://www.bjguahao.gov.cn/index.htm (accessed on 2 December 2015).
  30. Suzhou, China. Available online: http://www.suzhou.gov.cn/zgszeng/ (accessed on 5 December 2015).
  31. Suzhou Statistic Bureau. Suzhou Statistical Yearbook; China Statistics Press: Beijing, China, 2014.
  32. 12320 Suzhou Health Hotline. Available online: http://www.szws.net/index.asp (accessed on 5 December 2015).
  33. The Latest Road Network in Beijing. Available online: http://www.datatang.com/data/43855 (accessed on 15 August 2015).
  34. Cavusgil, S.T. Measuring the potential of emerging markets: An indexing approach. Bus. Horiz. 1997, 40, 87–91. [Google Scholar] [CrossRef]
  35. Cavusgil, S.T.; Kiyak, T.; Yeniyurt, S. Complementary approaches to preliminary foreign market opportunity assessment: Country clustering and country ranking. Ind. Mark. Manag. 2004, 33, 607–617. [Google Scholar] [CrossRef]
  36. Rossi, E.; Kuitunen, M. Ranking of habitats for the assessment of ecological impact in land use planning. Biol. Conserv. 1996, 77, 227–234. [Google Scholar] [CrossRef]
  37. Mohamadabadi, H.S.; Tichkowsky, G.; Kumar, A. Development of a multi-criteria assessment model for ranking of renewable and non-renewable transportation fuel vehicles. Energy 2009, 34, 112–125. [Google Scholar] [CrossRef]
  38. Tokunaga, M.; Sannomiya, K.; Watanabe, S.; Nakanishi, R.; Yamanaga, H.; Yonemitsu, H.; Terasaki, T.; Mita, S.; Kawano, S.; Hirata, Y. Relationship between hospital ranking based on functional independence measure (FIM) efficiency and factors related to rehabilitation system for stroke patients—A study of three hospitals participating in Kumamoto stroke liaison critical pathway. Jpn. J. Compr. Rehabil. Sci. 2012, 3, 51–58. [Google Scholar]
  39. Xu, X.; Li, B.; Sun, X.; Li, L.; Ren, R.; Gao, F.; Jonas, J.B. Eyelid neoplasms in the Beijing Tongren eye centre between 1997 and 2006. Ophthalmic Surg. Lasers Imaging Retina 2008, 39, 367–372. [Google Scholar] [CrossRef]
  40. Bejing 19 A-Class Designated Medical Organizations in 2011. Available online: http://www.gov.cn/gzdt/2011-10/29/content_1981168.htm (accessed on 1 February 2016).
Figure 1. Distribution of high-quality medical resources in the study area: (a) Beijing study area; (b) Suzhou study area.
Ijgi 05 00157 g001
Figure 2. The workflow of source point recognition.
Ijgi 05 00157 g002
Figure 3. An Example of source point determination process: (a) image extraction and georeferencing; (b) destination detection; (c) buffer area generation and spatial join (d) source point identification.
Ijgi 05 00157 g003
Figure 4. Mean and Max value of trip distance for the sampled hospitals in two cities: (a) Beijing sample hospitals; (b) Suzhou sample hospitals.
Ijgi 05 00157 g004
Figure 5. Distance rank histogram of the examined Beijing hospitals—non-neighboring hospital bypass trips.
Ijgi 05 00157 g005
Figure 6. Distance rank histogram of the examined Beijing hospitals—non-neighboring hospital bypass trips and trip distances of more than 3 km.
Ijgi 05 00157 g006
Figure 7. Distance rank histogram of the examined Suzhou hospitals—non-neighboring hospital bypass trips.
Ijgi 05 00157 g007
Figure 8. Distance rank histogram of the examined Suzhou hospitals—non-neighboring hospital bypass trips and trip distances of more than 3 km.
Ijgi 05 00157 g008
Figure 9. Hospital bypass share values for the examined hospitals in two study areas: (a) Beijing sample hospitals; (b) Suzhou sample hospitals.
Ijgi 05 00157 g009
Figure 10. Hospital bypass proportion source points for the examined hospitals: (a) the proportional distribution of the non-neighboring hospital bypass proportion in Beijing; (b) the proportional distribution of the non-neighboring hospital bypass proportion (trip distances exceeding 3 km) in Beijing; (c) the proportional distribution of the non-neighboring hospital bypass proportion in Suzhou; (d) the proportional distribution of the non-neighboring hospital bypass proportion (trip distances exceeding 3 km) in Suzhou.
Ijgi 05 00157 g010
Figure 11. Distribution of the BBI values for the examined Beijing hospitals.
Ijgi 05 00157 g011
Figure 12. Distribution of the BBI values for the examined Suzhou hospitals.
Ijgi 05 00157 g012

