Article

Detecting Themed Streets Using a Location Based Service Application

1
KT R & D Center Convergence Lab., 151, Taebong-ro, Seocho-gu, Seoul 06763, Korea
2
Department of Civil and Environmental Engineering, Seoul National University, 1, Gwanak-ro, Gwanak-gu, Seoul 08826, Korea
3
Institute of Construction and Environmental Engineering, Seoul National University, 1, Gwanak-ro, Gwanak-gu, Seoul 08826, Korea
*
Author to whom correspondence should be addressed.
ISPRS Int. J. Geo-Inf. 2016, 5(7), 111; https://doi.org/10.3390/ijgi5070111
Submission received: 26 April 2016 / Revised: 24 June 2016 / Accepted: 8 July 2016 / Published: 12 July 2016
(This article belongs to the Special Issue Location-Based Services)

Abstract

:
Various themed streets have recently been developed by local governments in order to stimulate local economies and to establish the identity of the corresponding places. However, the motivations behind the development of some of these themed street projects has been based on profit, without full considerations of people’s perceptions of their local areas, resulting in marginal effects on the local economies concerned. In response to this issue, this study proposed a themed street clustering method to detect the themed streets of a specific region, focusing on the commercial themed street, which is more prevalent than other types of themed streets using location based service data. This study especially uses “the street segment” as a basic unit for analysis. The Sillim and Gangnam areas of Seoul, South Korea were chosen for the evaluation of the adequacy of the proposed method. By comparing trade areas that were sourced from a market analysis report by a reliable agent with the themed streets detected in this study, the experiment results showed high proficiency of the proposed method.

1. Introduction

In order to encourage the local economy and to establish the identity and placeness (sense of place) of an area, various streets have been created in USA. For example, Broadway and Wall Street in New York City and Hollywood Boulevard in Los Angeles are well-known themed streets and can easily be found online or in a web map service. These types of themed streets not only offer areas of special characteristics for a city, but also provide a place where the community can spend their leisure time. It is also known that the development of themed streets increases as a city matures [1].
While a themed street is recognized by the public, it is difficult to illustrate its exact boundary because the themed street is usually expressed as lines on a map. Since density based clustering or aggregation of polygons is normally used to draw the boundaries as areal shapes on maps, illustrating a line-based area such as a themed street is limited.
In reality, people travel via roads and their activity areas are based on roads. The road is the first impression of a city; the features of interest along a road are, therefore, strongly related to the features of interest of the city [2]. In other words, the image of a street area as seen from the road can form an impression of the city within which it is located. From this perspective, a boundary of a special space should be expressed based on the road in order to ensure the public understands the city intuitively.
To express a place based on a road, the characteristics of the road need to be determined. In most cases, the characteristics are formed according to the points of interest (POIs) on the roads. By categorizing the POIs and assigning them to the road, various types of themes on the roads can be identified. However, few research papers have focused on detecting themes on roads. Even the related researches only show one measured phenomenon, such as the level of crime on the roads. With this method, the face of a city where various events occur cannot be illustrated.
This study, therefore, used data on peoples’ behavior and POIs obtained from mobile GPS and Wi-Fi sensors to detect various themed streets. The Themed Street Clustering Method (the TSCM) is suggested for this purpose. For this study, two subtle words are introduced; “the hot street” and “the themed street”. Although the two words can be used interchangeably, the meaning of each is still defined for this study. As a hot spot is a clustered area of relatively high values, it represents a road that has a high value of a unique index. For example, the popularity index of a street is high if the street is popular. A themed street, however, is a street with a special placeness that is due to the close co-location of popular places; therefore, in addition to the popularity of a themed street, it is also known for a specialty. It was confirmed through this study that various themed streets have been detected via the use of a mobile sensor and collected data according to the TSCM.

2. Related Works

To analyze the life pattern and characteristics of people according to space, the “Livehoods” project was conducted [3]. Check-in data (a user manually tells the application when he/she is at a certain location by selecting from a list of venues on a smart device) was used, as acquired from the Foursquare service and the spectral clustering method, which aggregates similar data and creates clusters. Using the method, “Livehoods” clustered sections were generated by calculating similar values of locations and attributes. However, it was difficult to distinguish the exact themes of the sectioned area since the data was not categorized in a manner that allowed for this. That is, “Livehoods” places more significance on determining geographic boundaries than on detecting themes associated with such boundaries.
Meanwhile, a study was conducted to analyze hot spots using check-in data from Jiepang, a Chinese location based social media service [4]. The testing area was divided into fishnet grids and the number of check-in data was counted. Each grid was colored based on the significance level that expresses hot spots of the check-in. With the result, the researchers insisted that the check-in data indirectly reflect the population and economy of its area by showing the correlation between population census and the number of counted check-in data. While this study is a good reference in terms of research on socio-economic active areas, different results can arise when the fishnet grid size changes (also known as modifiable areal unit problem). In addition, the study only defined the area in which many check-ins occurred, only representing the check-in hot spots. Therefore, the themed regions cannot be understood through this type of analysis.
The studies introduced above ([3]) have limitations, whereby the results can only be expressed as areal shapes (polygons). Other problems arose, such as the lack of any meaning for the division of areas, since the study measures only check-in frequency. Again, with the methods introduced by previous studies, identifying themed streets presents a challenge.
In the meantime, studies on network-based clustering methods have been conducted in order to supplement the limitations of areal based clustering methods. One of the most popular and widely used methods for analyzing point distribution is known as kernel density estimation (KDE) [5]. However, conventional KDE has many faults in finding hot spots on road networks. One of the main flaws is that the density area of not only in the networks but also of the other areas are detected and this leads to skewed results. For this reason, network kernel density estimation (NKDE) was suggested [6] and it has been used for various applications such as detection of the likelihood of a hot spot in vehicle incidents [7]. Not only NKDE, but also network spatial and temporal analysis of crime (NT-STAC) and network spatial scan statistics (NT-SaTScan) were introduced to detect crime occurrences (robbery, burglary, drug deals/use, etc.) on road networks [8]. In the study, the researchers insisted that using STAC and SaTScan to detect hot spots results is producing round shaped clusters on a 2-D space, and argued that the methods are limited when linear spaces are analyzed. Therefore, they demonstrated that NT-STAC and NT-SaTScan can successfully detect the crime areas on road networks throughout their research.
In hot spot detection studies based on road networks, hot spots were found in linear spaces; however, these studies mostly focused on the clustering data overlaid on road networks and the road networks themselves were not considered. That is, the results only connect point data to linear shapes and do not provide significant information about the road networks.
To overcome the above limitations, Lu (2005) explained the phenomenon of public socio-economic activities constrained by roads in a city by expanding the point data clustering method, which shows hot spots in 2-D spaces, to road networks [9]. Particularly, the term “hot street”, a road network acting as a hot spot, was introduced by conducting clustering testing of vehicle burglary point data on street segments, where the basic analysis involved dividing the units by each junction. Finally, the statistically significant hot streets were detected using Poisson distribution on each street segment. Nevertheless, the limitations of the research can be summarized as follows. First, the data used in the study only show the locations of vehicle burglaries on road networks. Second, the Poisson distribution can only analyze discrete data, such as the number of counted point data. Lastly, since the lengths of road segments differ, the incident cases according to the length of road segments could not be normalized.
Previously published studies do not include methods for detecting various themed streets containing abundant attributes. Furthermore, it has been recognized that a themed street cluster analysis and visualization based on road segments needed. Therefore, this study suggested the TSCM to address the limits of the previous studies.

3. Themed Street Clustering Method

3.1. LBSM Data

The raw data used in this study were created using mobile GPS or Wi-Fi signal, which can be represented as ( x P n t 1 , y P n t 1 ). Additional information such as users’ comments and the history of leisure activities are added using data in location-based social media (LBSM) such as Foursquare, a mobile application which allows a user to check-in where they have been and leave a comment. Particularly, the venue of Foursquare was utilized to detect themed streets. Essentially, the venues are equivalent to the POI, which includes a great deal of information such as traces (check-in counts), addresses, grades, and so forth. The venues are used because the data directly records peoples’ perceptions of POIs and their behavior at the POIs. For example, if a significant amount of data on a venue is accumulated, it can be assumed that the venue is popular and well-known [10]. In other words, by analyzing the characteristics of the venues, the public interest in the locations and historical data can be obtained, which is not provided with normal GIS data. Therefore, the venues used for this study are the most suitable way to find various themed streets.
Meanwhile, Goodchild et al. (2012) argued that volunteered geographic information (VGI) [11] can be used to build detailed and real time spatial data economically. However, they also pointed out the poor quality and accuracy of the VGI data [12]. This present study also verifies the quality of the venues. The venues employed in this study from Foursquare using Venues API are illustrated in Figure 1. As shown below, the venues are clearly identified; however, some venues are located in empty spaces and in the middle of streets. It is confirmed that the identified venues have low location accuracy, similar to that described by Goodchild et al. (2012).
Sillim, located in Seoul, South Korea, was selected as a test area to check the position errors of the venues (SW: 126.928, 37.482; NE: 126.931, 37.486). Among the 412 venues, the coordinates of 128 venue samples were manually recorded to measure the Euclidean distance error between the manually input coordinates of the sample data ( x P n t 2 , y P n t 2 ) and the samples’ raw coordinates ( x P n t 1 , y P n t 1 ). Also, the azimuth of error vector was measured to verify whether the position errors have any particular direction. The calculation of the Euclidean distance error between P n t 1 and P n t 2 is described in Equation (1) and the azimuth between P n t 1 and P n t 2 is measured using Equation (2):
P n t 1 P n t 2 ¯   ( m ) = ( x P n t 1 x P n t 2 ) 2 + ( y P n t 1 y P n t 2 ) 2
P n t 1 P n t 2 ( d e g r e e ) = arctan ( y P n t 1 y P n t 2 x P n t 1 x P n t 2 ) × 180 π
Again, P n t 1 represents the raw coordinates of the samples and P n t 2 represents the manually input exact coordinates of the samples. Applying the equations to the 128 samples, the average Euclidean distance error was about 50 meters (Figure 2a) and the azimuth of error vector did not show any particular patterns (Figure 2b).
The position error is caused by the mobile sensors. In usual cases, when users check in to a venue or create a venue, they tend to do so inside the building which belongs to the venue. While they are doing this, they might not realize that the location measured by the mobile sensor is actually the venue location, which is not always true. It is known that the average position errors of a positioning system using mobile GPS and Wi-Fi are 10 meters and 40 meters, respectively [13]. Thus, the position error of venue can be concluded from GPS and Wi-Fi environments or Foursquare usage patterns.
For this study, the coordinates of venues were manually edited to correct the position error. As a result, 87% of the venues extracted from raw data were geocoded. Then, the venues were spatially joined with a corresponding building polygon layer.

3.2. Road Segments and Spatially Joined Venue Data Matching

Using the road network layer without dividing it into smaller areas, the length of the road segment can be longer than the length of the study area. The longer segment can be detected as a themed street, because it can be affected more by the buildings to which the venues belong. Thus, road networks are split at each junction (Figure 3), since the junction interrupts the cognition of a continuous space and people usually stop at the junction when walking along a road [9].
The building polygon layer was matched to divided road segments to assign venue information to the segment. The matching condition between road segments and the building layer is defined as considering the frontage space of a building, the building should touch the road segment, and the building front should be seen from the road. Using Isovist, building polygons are matched to road segments that only influence the target [14].
Isovist is a visible area that can be seen from a given location (a view point), excluding any area beyond surrounding obstacles. Isovist can show the process of people recognizing signboards and walking towards a building intuitively. Furthermore, the Isovist area, created from a building centroid as a view point, does not increase due to neighboring buildings; this feature is very similar to people’s point of view in the real world, since people’s sight are also interrupted by barriers. The Isovist area therefore matches the appropriate road segment, even if the building is located within complicated road structures, as described in Figure 4a. Additionally, the road layer was used as a barrier to interrupt the growing Isovist area. Due to this effect, incorrect matching to all road segments at every junction was resolved as illustrated in Figure 4b.
To use Isovist, a certain range should be set based on peoples’ viewpoints. As mentioned above, the centroids of each building were set to match these viewpoints. If the range is set as the same distance for all buildings, an Isovist area could be created inside buildings. To prevent this type of issue, the Isovist range was calculated as described in Equation (3):
s i g h t _ d i s t ( m ) = l × ( 2 2 ) + 5
where l is the side length of a building and all buildings in the study area are regarded as square shapes. Then, the width of the frontage space of a building and sidewalk, five meters, was added. After the Isovist area was trimmed to a road segment, the Isovist area would be restricted by roads and neighboring buildings (Figure 5).
Because the venues were spatially joined to building layers in the previous process, and Isovist areas were created from the building, the Isovist area also contains the venue attributes. Thus, Isovist areas are spatially joined to road segments to assign venue attributes to roads.

3.3. Themed Street Cluster Detection

3.3.1. Hot Value

Each road segment should have unique values to establish criteria, whether or not the road segments are regarded as themed streets. For this study, the unique value is called the “hot value ( H i )” and it is derived by Equation (4), as follows:
H i =   P i × R i × D i
where H i   is defined as the sum of the average popularity of venues ( P i ), the ratio of the venue buildings ( R i ), and the density of the venue buildings ( D i ). H i is subsequently used as the input dataset of Getis-Ord’s G i * in this paper. The calculation details of each factor are explained next.
P i is the sum of opinions divided by the number of venues on the road and is given by Equation (5), as follows:
P i =   j = 1 k N i , j k
where k is the total number of venues on the i th road segment; N i , j is the quantified numerical value such as the number of check-ins, tips, likes, and others, which consider people’s positive actions to the specific venues [10]. The N i , j is then measured, as in Equation (6):
N i , j = c h e c k i , j + t i p i , j + l i k e i , j
N i , j refers to the popularity of the j th venue amongst the venues on the i th road segments, when the n number of road segments exist. That is, P i refers to the average popularity of the i th road segment, when there are n number of road segments.
Second, if a similar theme of venues exists on a road with a sufficient number of venues, the road tends to take on the characteristics of the venues. This will help people recognize the road as a themed street in that venue. In Equation (7), R i is a mathematical expression of the people’s recognition and the ratio of the venue buildings, as follows:
R i =   B V i B N i
where B N i is the number of buildings that touch the i th road segment; B V i is the number of buildings that have venue data belonging to the matched buildings on the i th road segment. That is, R i is the ratio of the venue buildings on the i th road segment. Therefore, as R i increases, the venue buildings on the target road segment become denser.
Lastly, because the usage of only P i and R i can cause a statistical error (i.e., one popular building among two buildings and five popular buildings among 10 buildings could lead to the same result), the density of the venue buildings on the target road ( D i ) is finally added to H i .
D i is the total number of the venue buildings on a length of road segment, as in Equation (8).
D i =   B V i l e n g t h i
where B V i is the number of venue buildings on the i th road segment; l e n g t h i is the length of the i th road segment in meters; and D i is the intuitive index that indicates the density of venue buildings on a road segment. This equation is also used to distinguish whether or not a road has the same P i and R i .
Consequently, H i is the hot value of the i th road segment. A higher H i implies the greater popularity of the venues, the higher ratio of the venue buildings, and the higher density of the venue buildings. It can therefore be concluded that it is more likely that road segments with a higher H i will be detected as themed streets.

3.3.2. LISA

Among the spatial cluster detection methods, this study considered using local indicator of spatial association (LISA) [15]. The spatial cluster detection method using LISA has been standardized previously in many studies. The specific LISA can be calculated, significantly important aggregation can then be extracted, and the aggregation can be named as a spatial cluster (hot or cold spot) after the significance of the value test [16].
Getis-Ord’s G i * , among LISA, was chosen for this study. The most significant advantage of G i * is that hot and cold spots can be intuitively identified through statistical results. Getis-Ord’s G i * is measured as shown in Equation (9).
G i * = j = 1 w i j x j x ¯ j = 1 w i j s n j = 1 w i j 2 ( j = 1 w i j ) 2 n 1
where s is standard deviation; w i j is the spatial weight between spatial unit i and j ; and n is the total number of data. If the units are defined as adjacent, w i j = 1 and 0 otherwise. Since G i * is regarded as a neighborhood, w i j is 1. This also means that the spatial weight matrix diagonal values are not 0. The expectation value of G i * is 0 and the variance is 1 [17]. Therefore, the significance test of G i * is processed almost the same as the normal distribution test [16].
To measure the G i * index, the spatial weight matrix should be modified for the spatial unit of this study, the road segments. If the road segments are connected, w i j is 1, otherwise it is 0. Figure 6a shows the nine road segments connected at junctions and the spatial weight matrix of the road segments is described in Figure 6b.
To achieve the normality (expectation value of 0 and variance of 1) of Getis-Ord’s G i * , a normal distribution of the spatial data is preferable. Provided that the number of spatial data is sufficient and the number of adjacent spatial units is more than 30, the normality of G i * can still be assumed even if the spatial data have skewed distribution. On the other hand, if the number of spatial data is small, and the number of adjacent spatial units is less than 30, the normality of G i * cannot be assumed, provided the skewness is moderate [18].
The spatial unit for this study is split at the junctions. Hence, the number of adjacent spatial units is low. As mentioned above, if the H i distribution has a moderate skewness, the G i * index can be measured assuming that it has normality. However, as shown in Figure 7a, H i has a very positive skewness. Therefore, the skewed values were normalized using a natural logarithm to calculate the G i * index (Figure 7b). Nevertheless, it is not critical to follow the normal distribution strictly, since Getis and Ord’s G i * does not provide clear equations regarding the calculation of the variance and the expected value [17].
Finally, the G i * index was measured using ln ( H i ) . For this study, only the positive G i * index (hot spot) was regarded as a target. With the significance level of 0.05, a z score of G i * of over 1.96 was selected as themed street clusters.

4. Results and Analysis

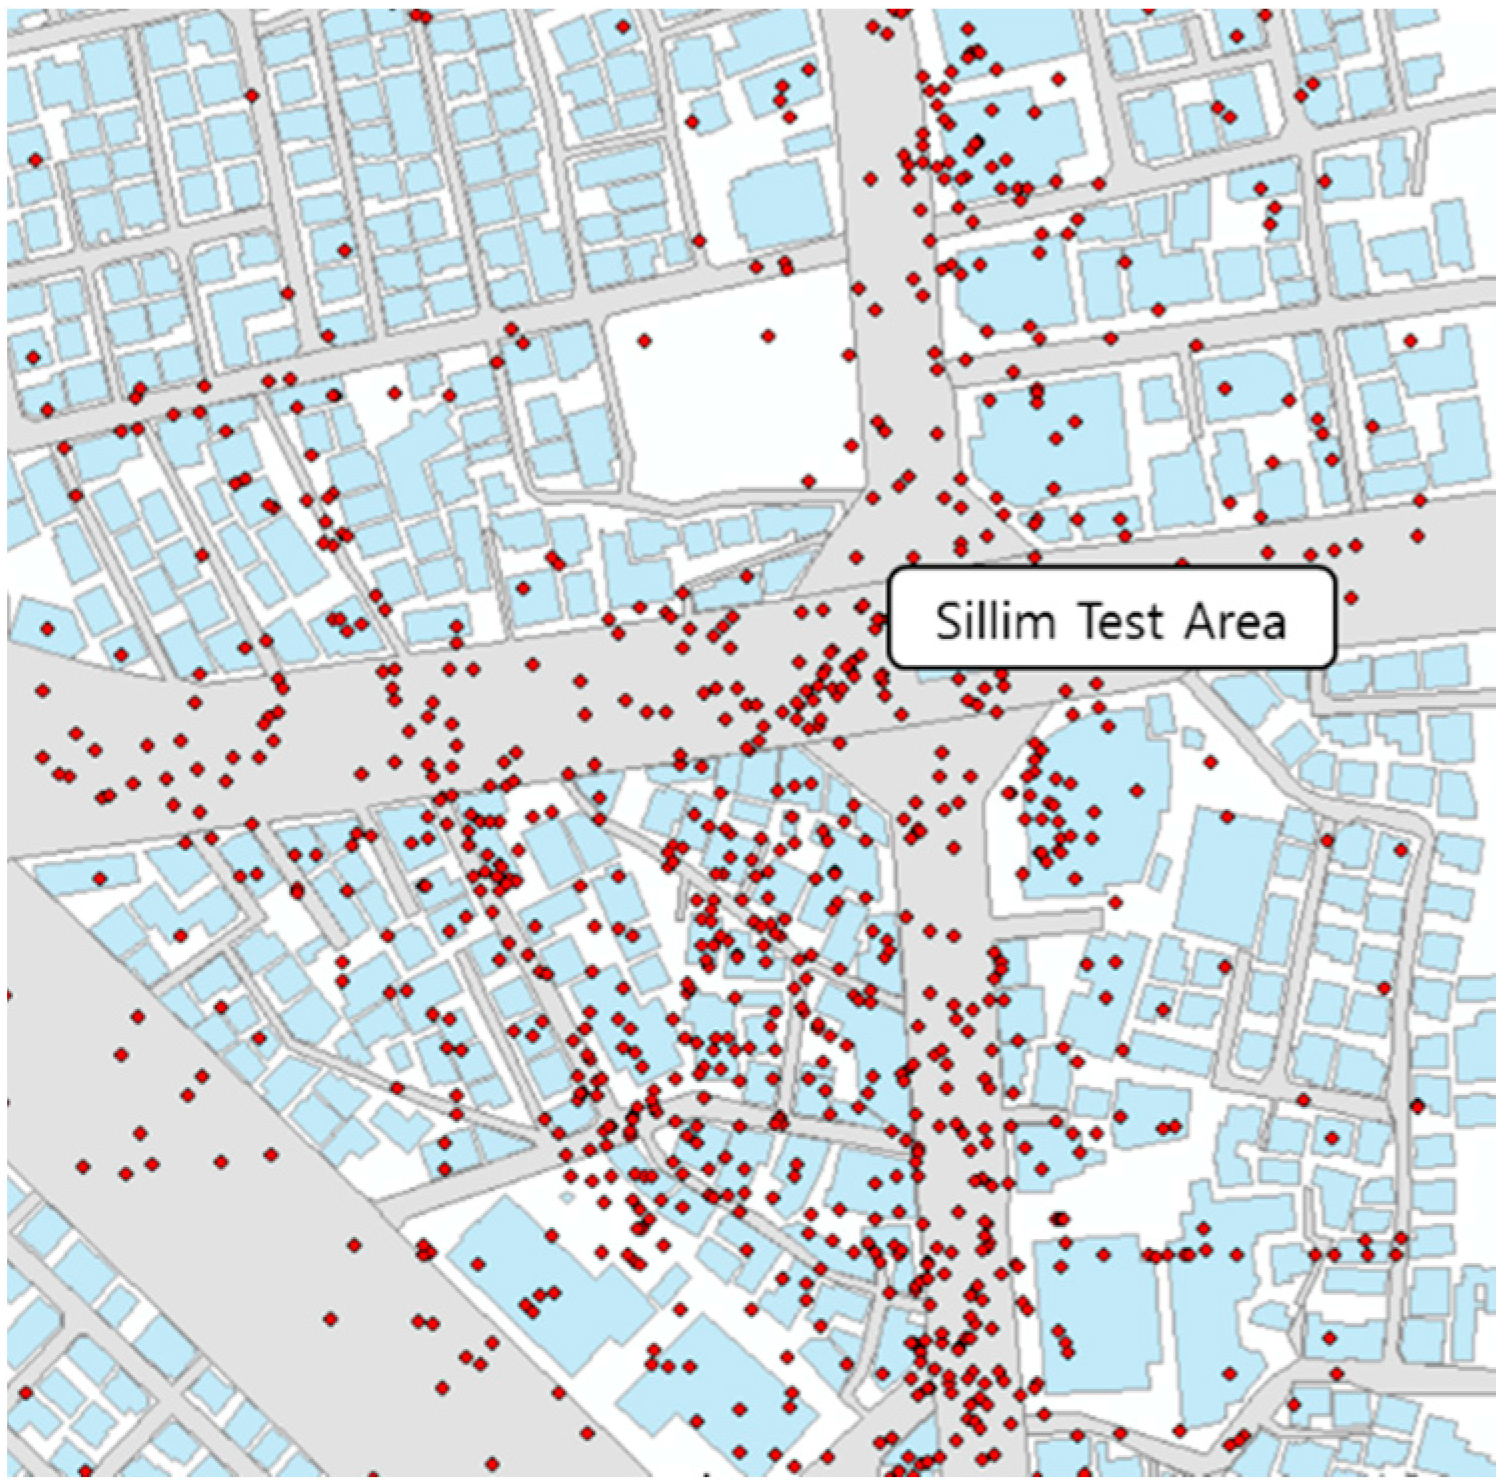
Sillim and Gangnam, two districts in Seoul, were chosen for the examination of the results and the versatility of the suggested method.
The total number of venue data is 312 in the Sillim test area. It was confirmed that the number of venue buildings and matched road segments to the buildings is 154 and 152, respectively.
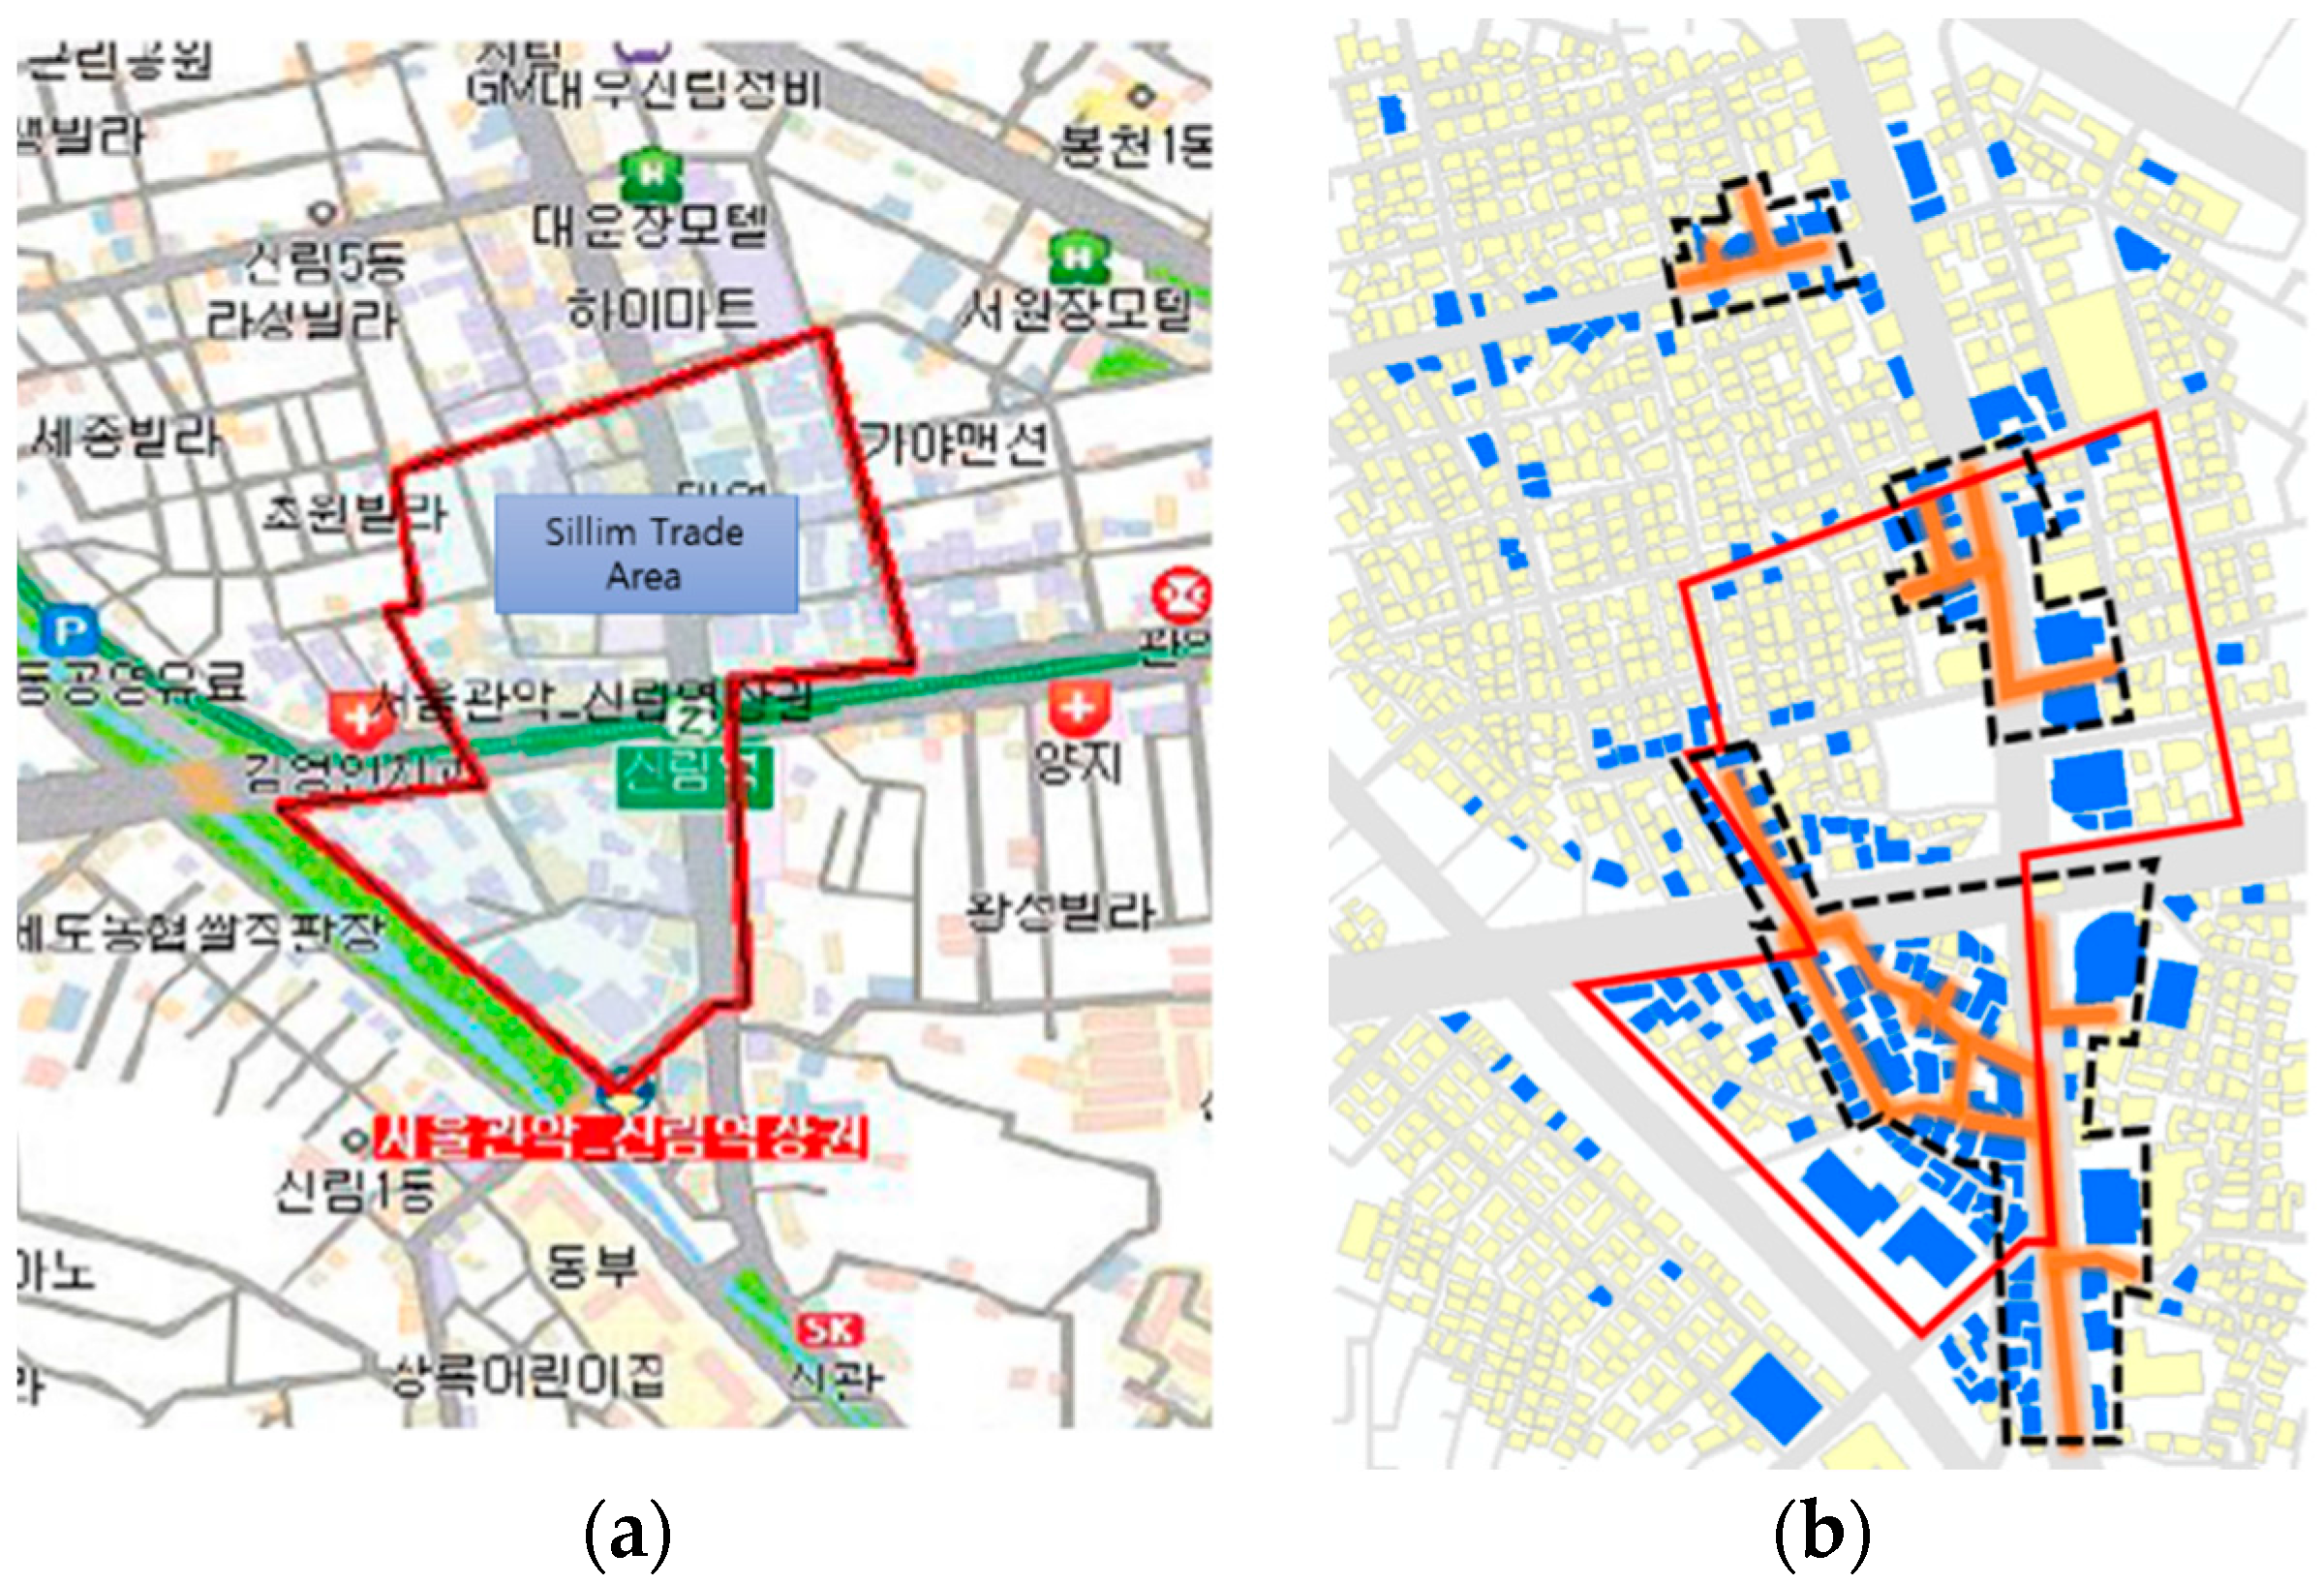
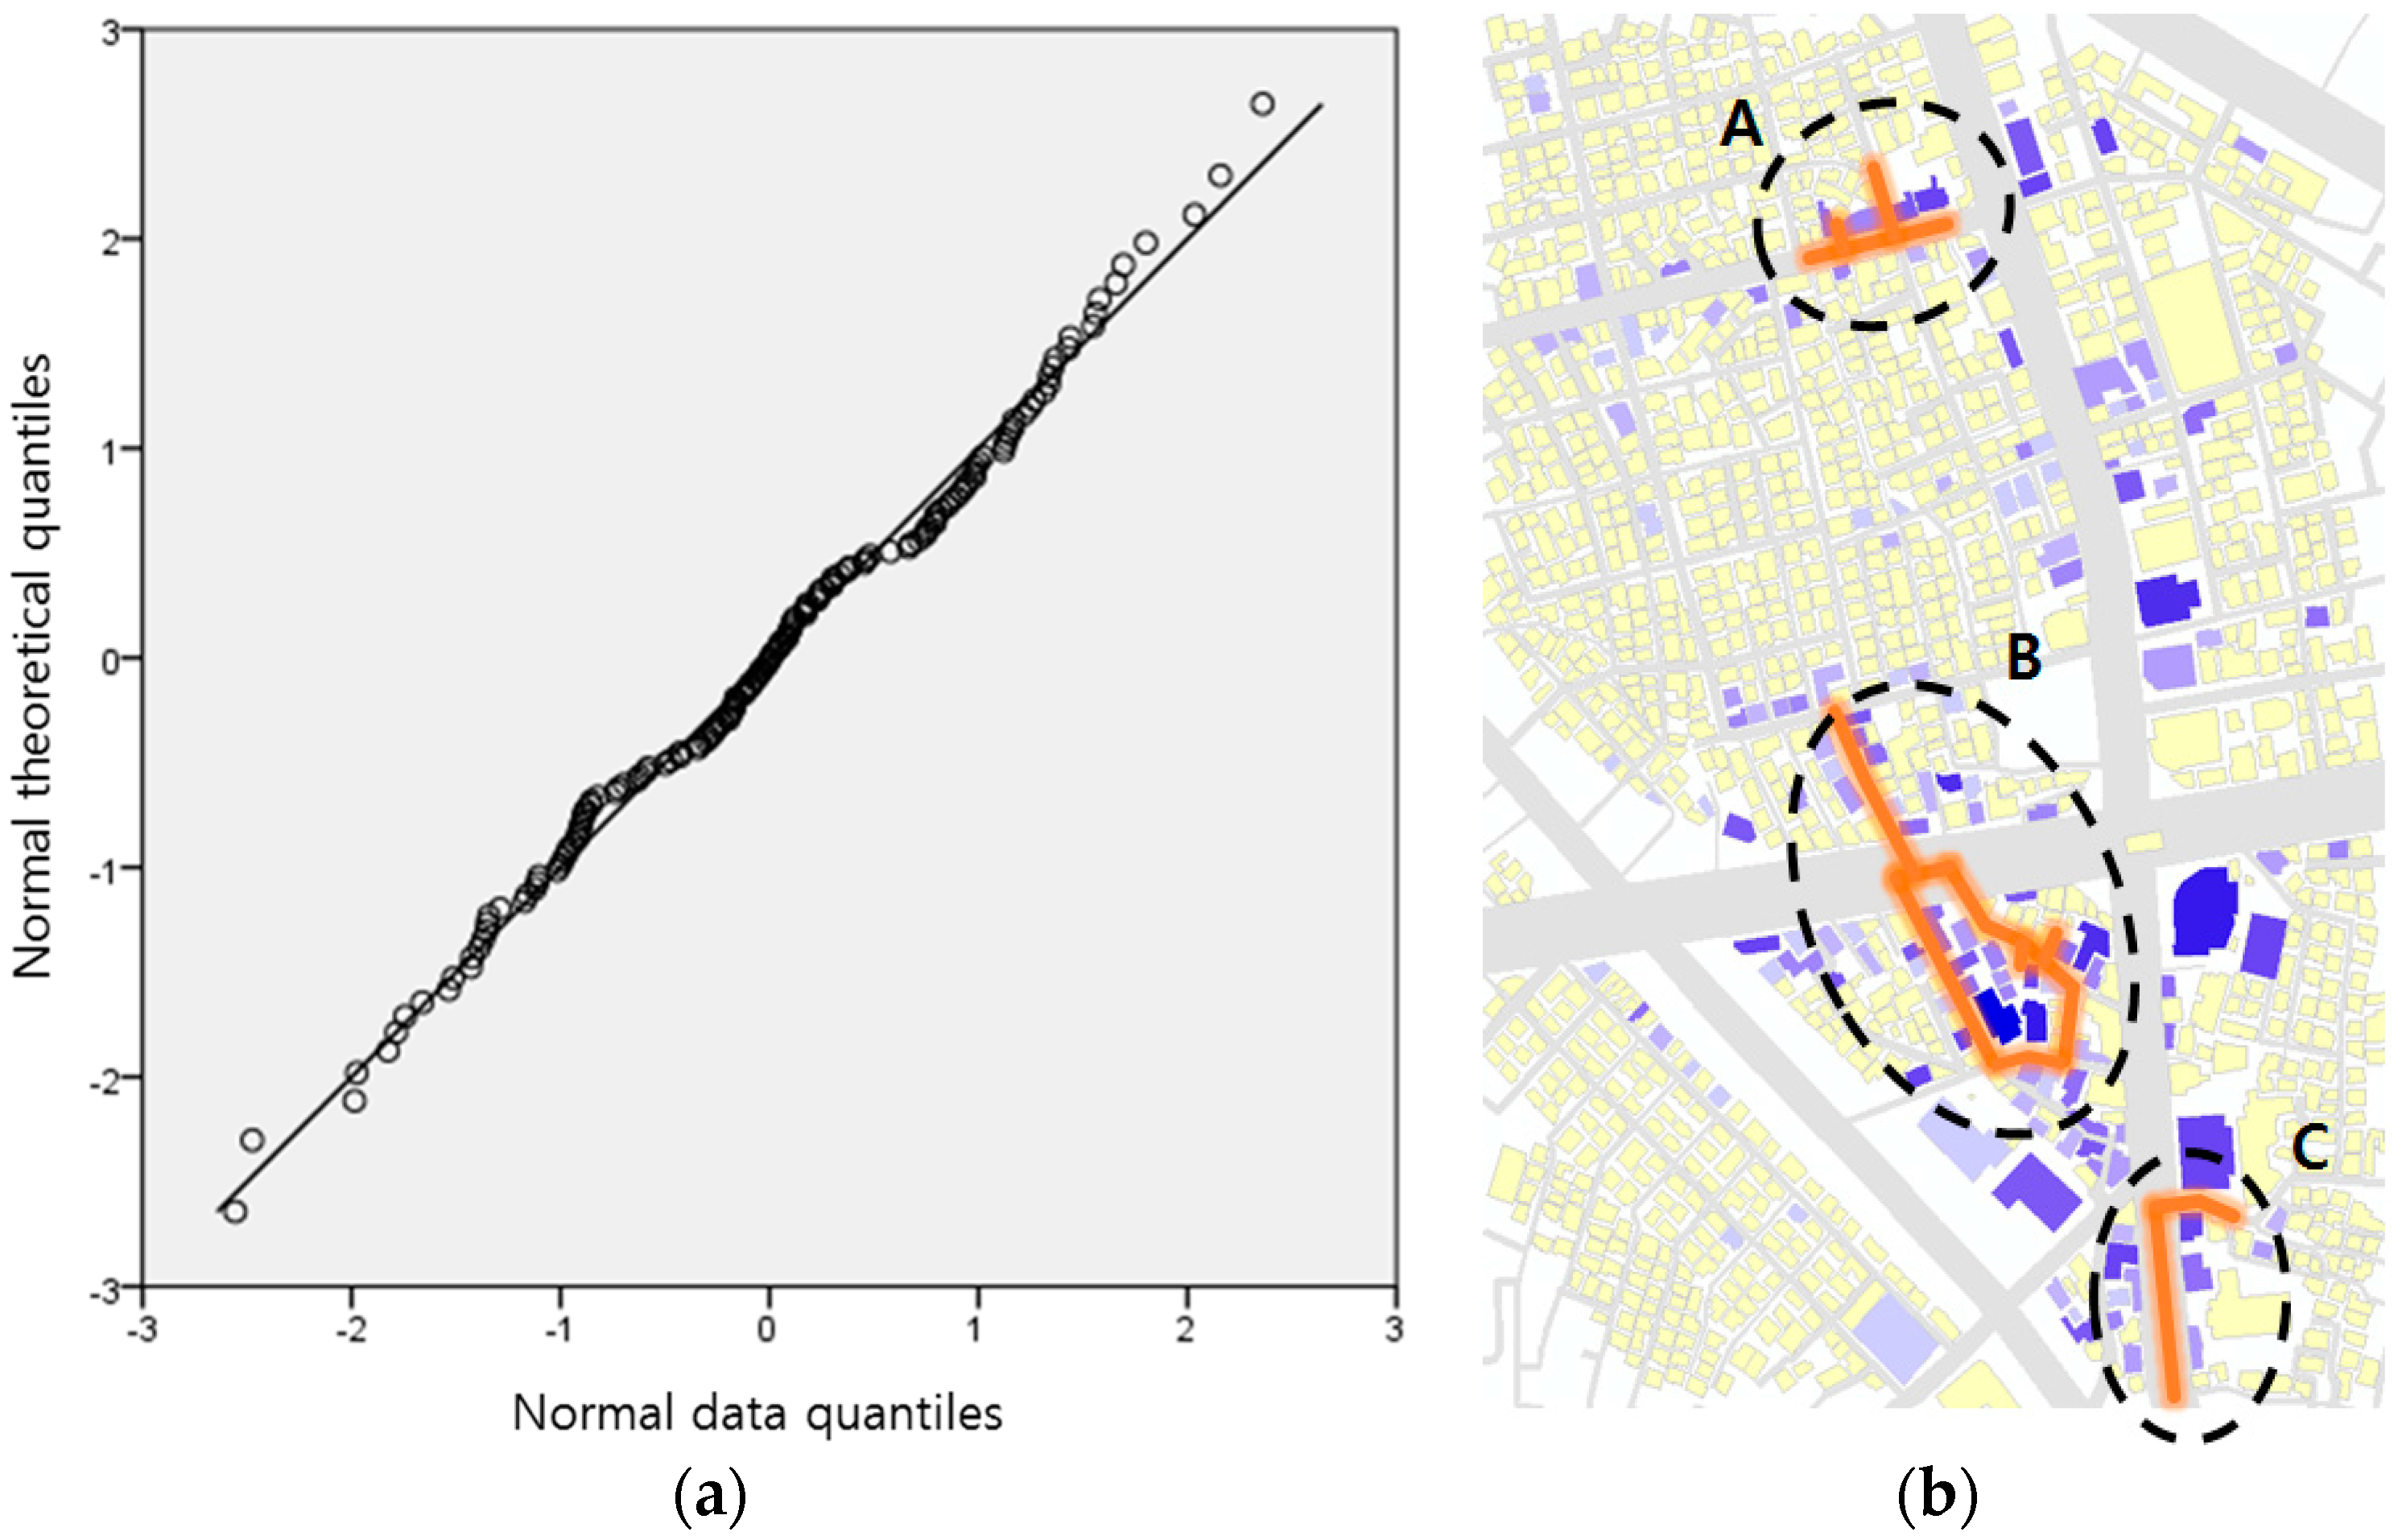
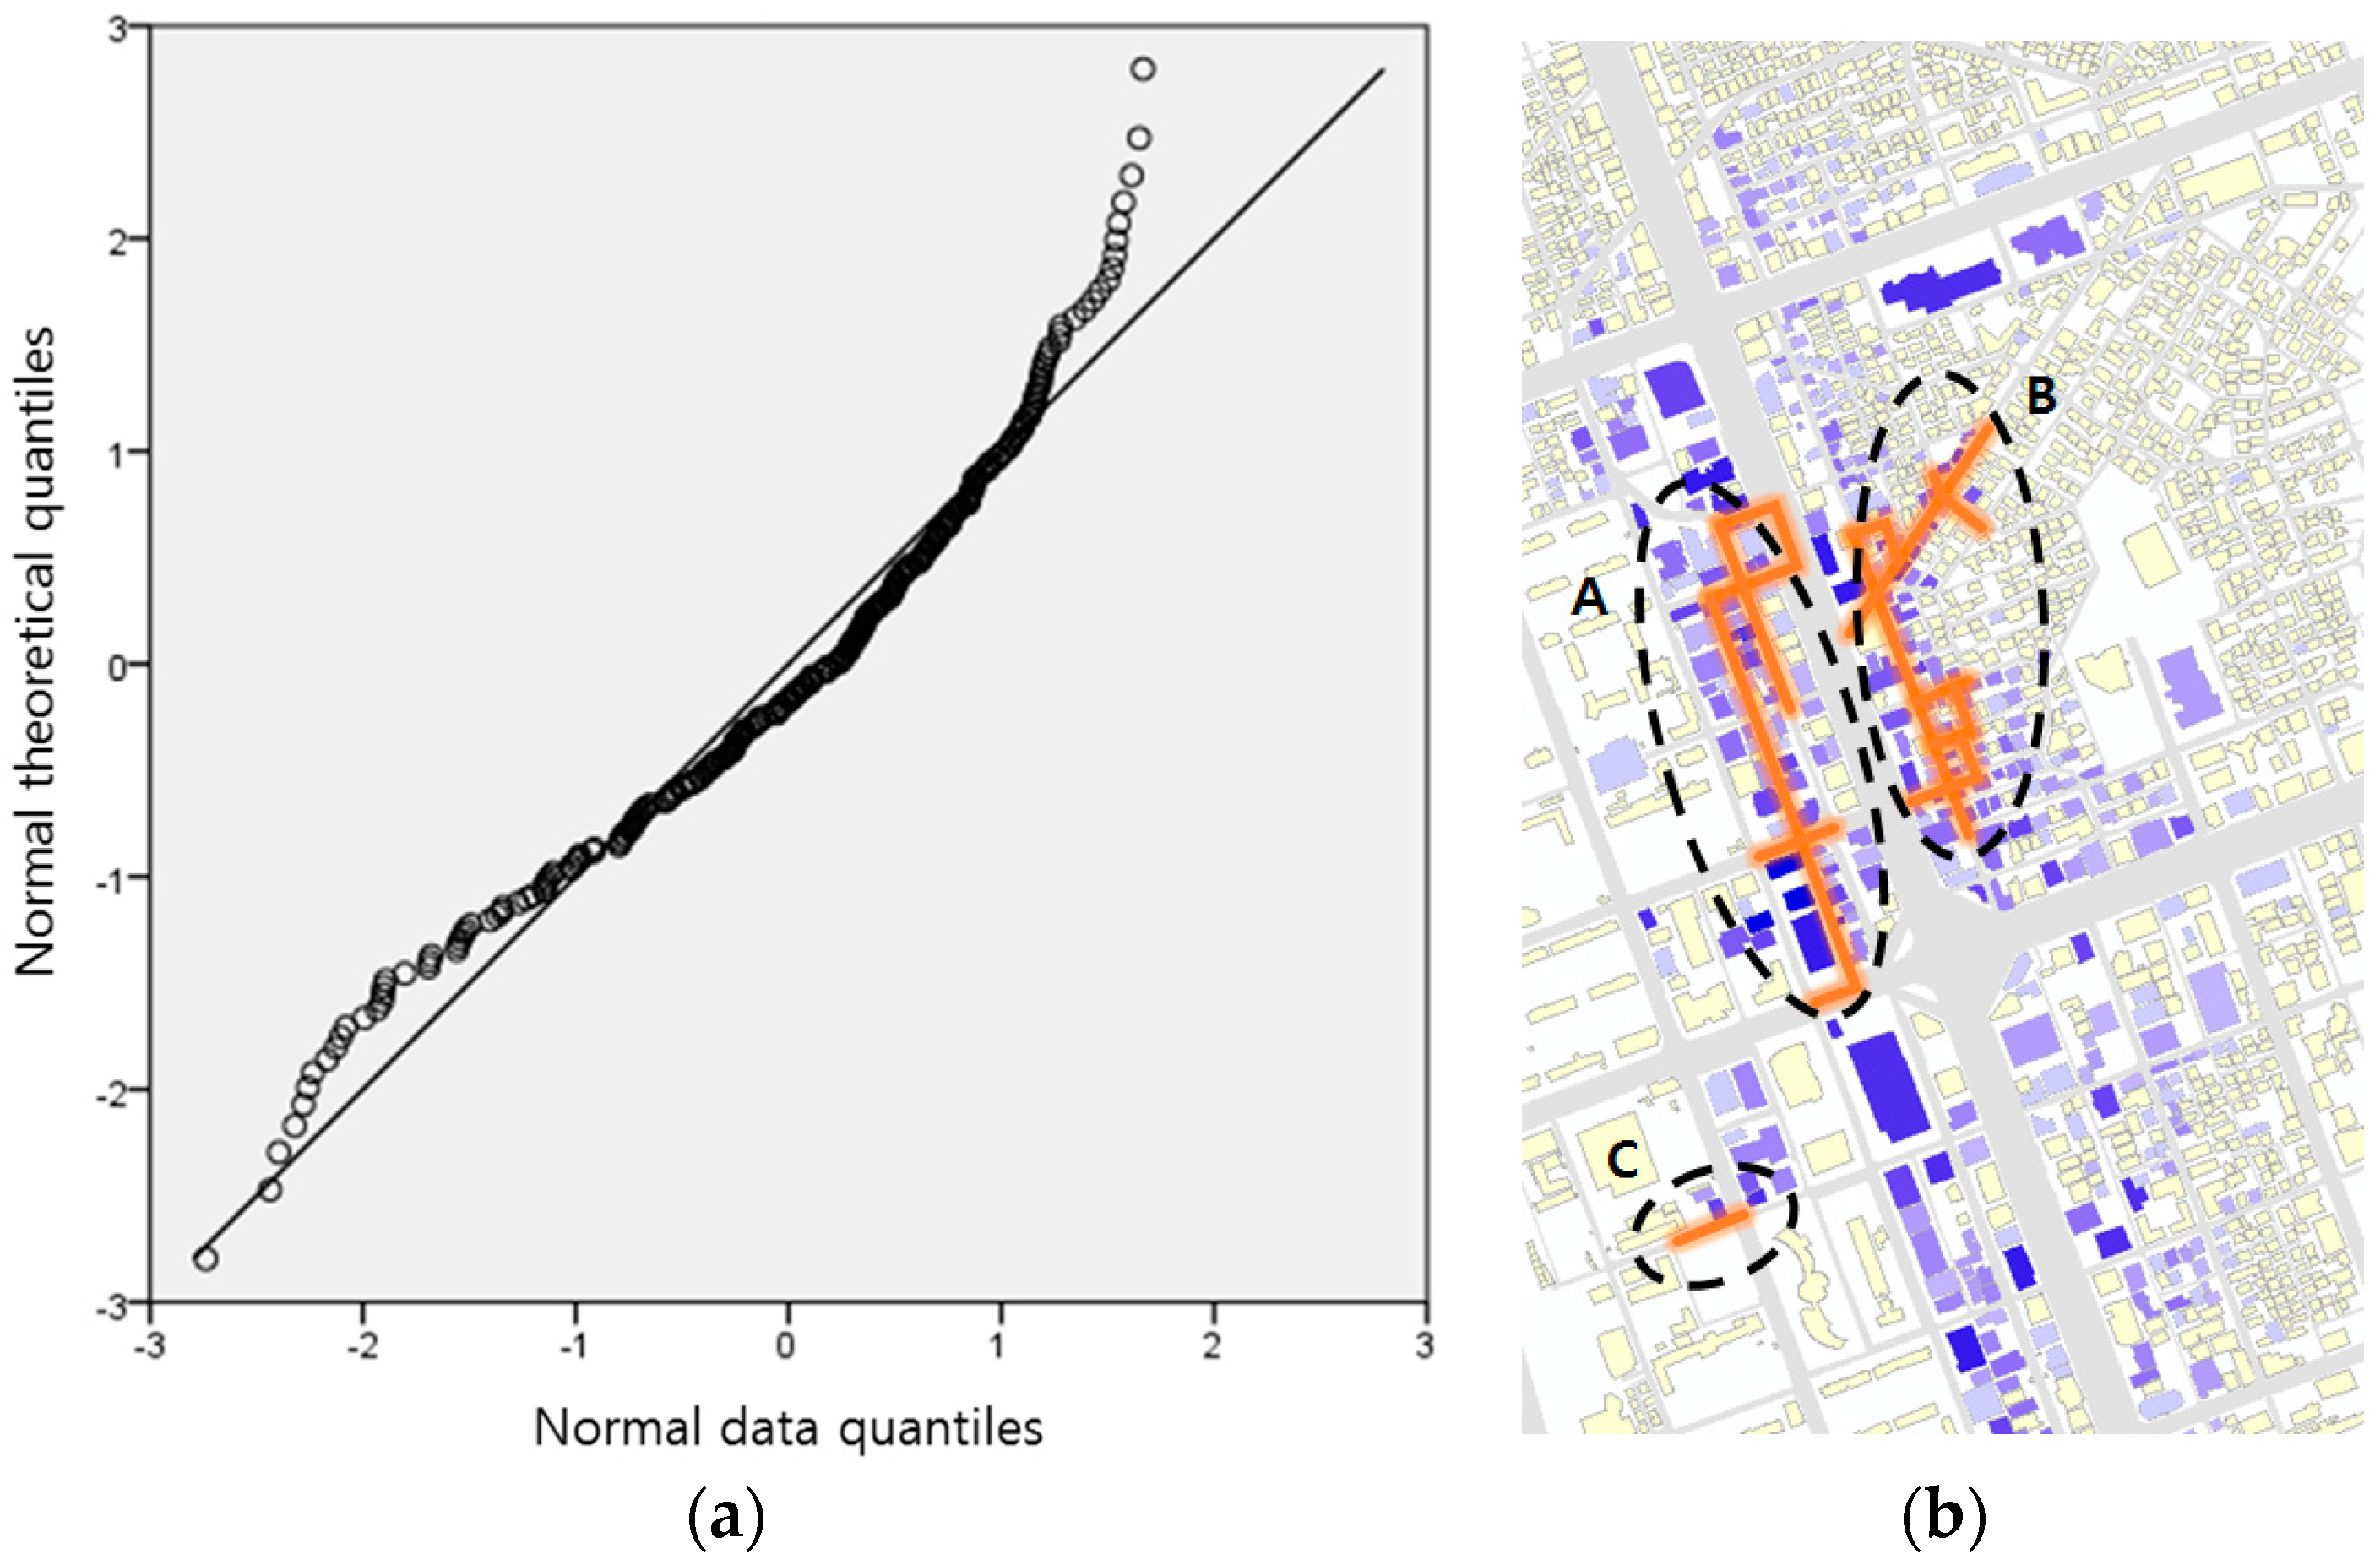
The results of the analysis of the restaurant themed street clusters in the Sillim test area are illustrated in Figure 8b. The red colored streets have a G i * value that satisfies the significance level of 0.05 and are regarded as themed streets, while the blue colored buildings refer to the scale of popular venues ( P i ). To verify the normalization of the ln ( H i ) distribution of the restaurant theme, a normal Q-Q plot was drawn (Figure 8a).
The test area has three large restaurant themed street clusters. District A is relatively smaller than the other districts and is located some distance from them. District A is named a “Fashion and Cultural Street”, originally developed by the local government. However, the public has criticized the development, stating that tax money was wasted and the original aim of the development was not met, since most of the fashion-related stores are closed and restaurants now line the street [19]. District A reflects the actual condition directly by showing the functionality of the street as a food alley.
It was observed that district B has many restaurants, with 92 restaurant venues within the district. Among these, about half are related to selling Korean sausages (named “sundae” in Korean) (44 out of 92 venues sell Korean sausages). This unusual restaurant distribution was reported in the market analysis report on Sillim published by the Small Business Development Center (SBDC). The area is named “Sundae Town”, the Korean term for “Sausage Town”. The report was confirmed again through the test result.
District C has various restaurants such as Pizza Hut, McDonald’s, Chicken barbecue, etc. along with Sillim-ro (Sillim Avenue). District C, is located close to district B, to the south; however, the two districts have not merged as one large cluster. This shows that the restaurant venues between districts B and C do not receive enough attention, which separates B and C as different districts.
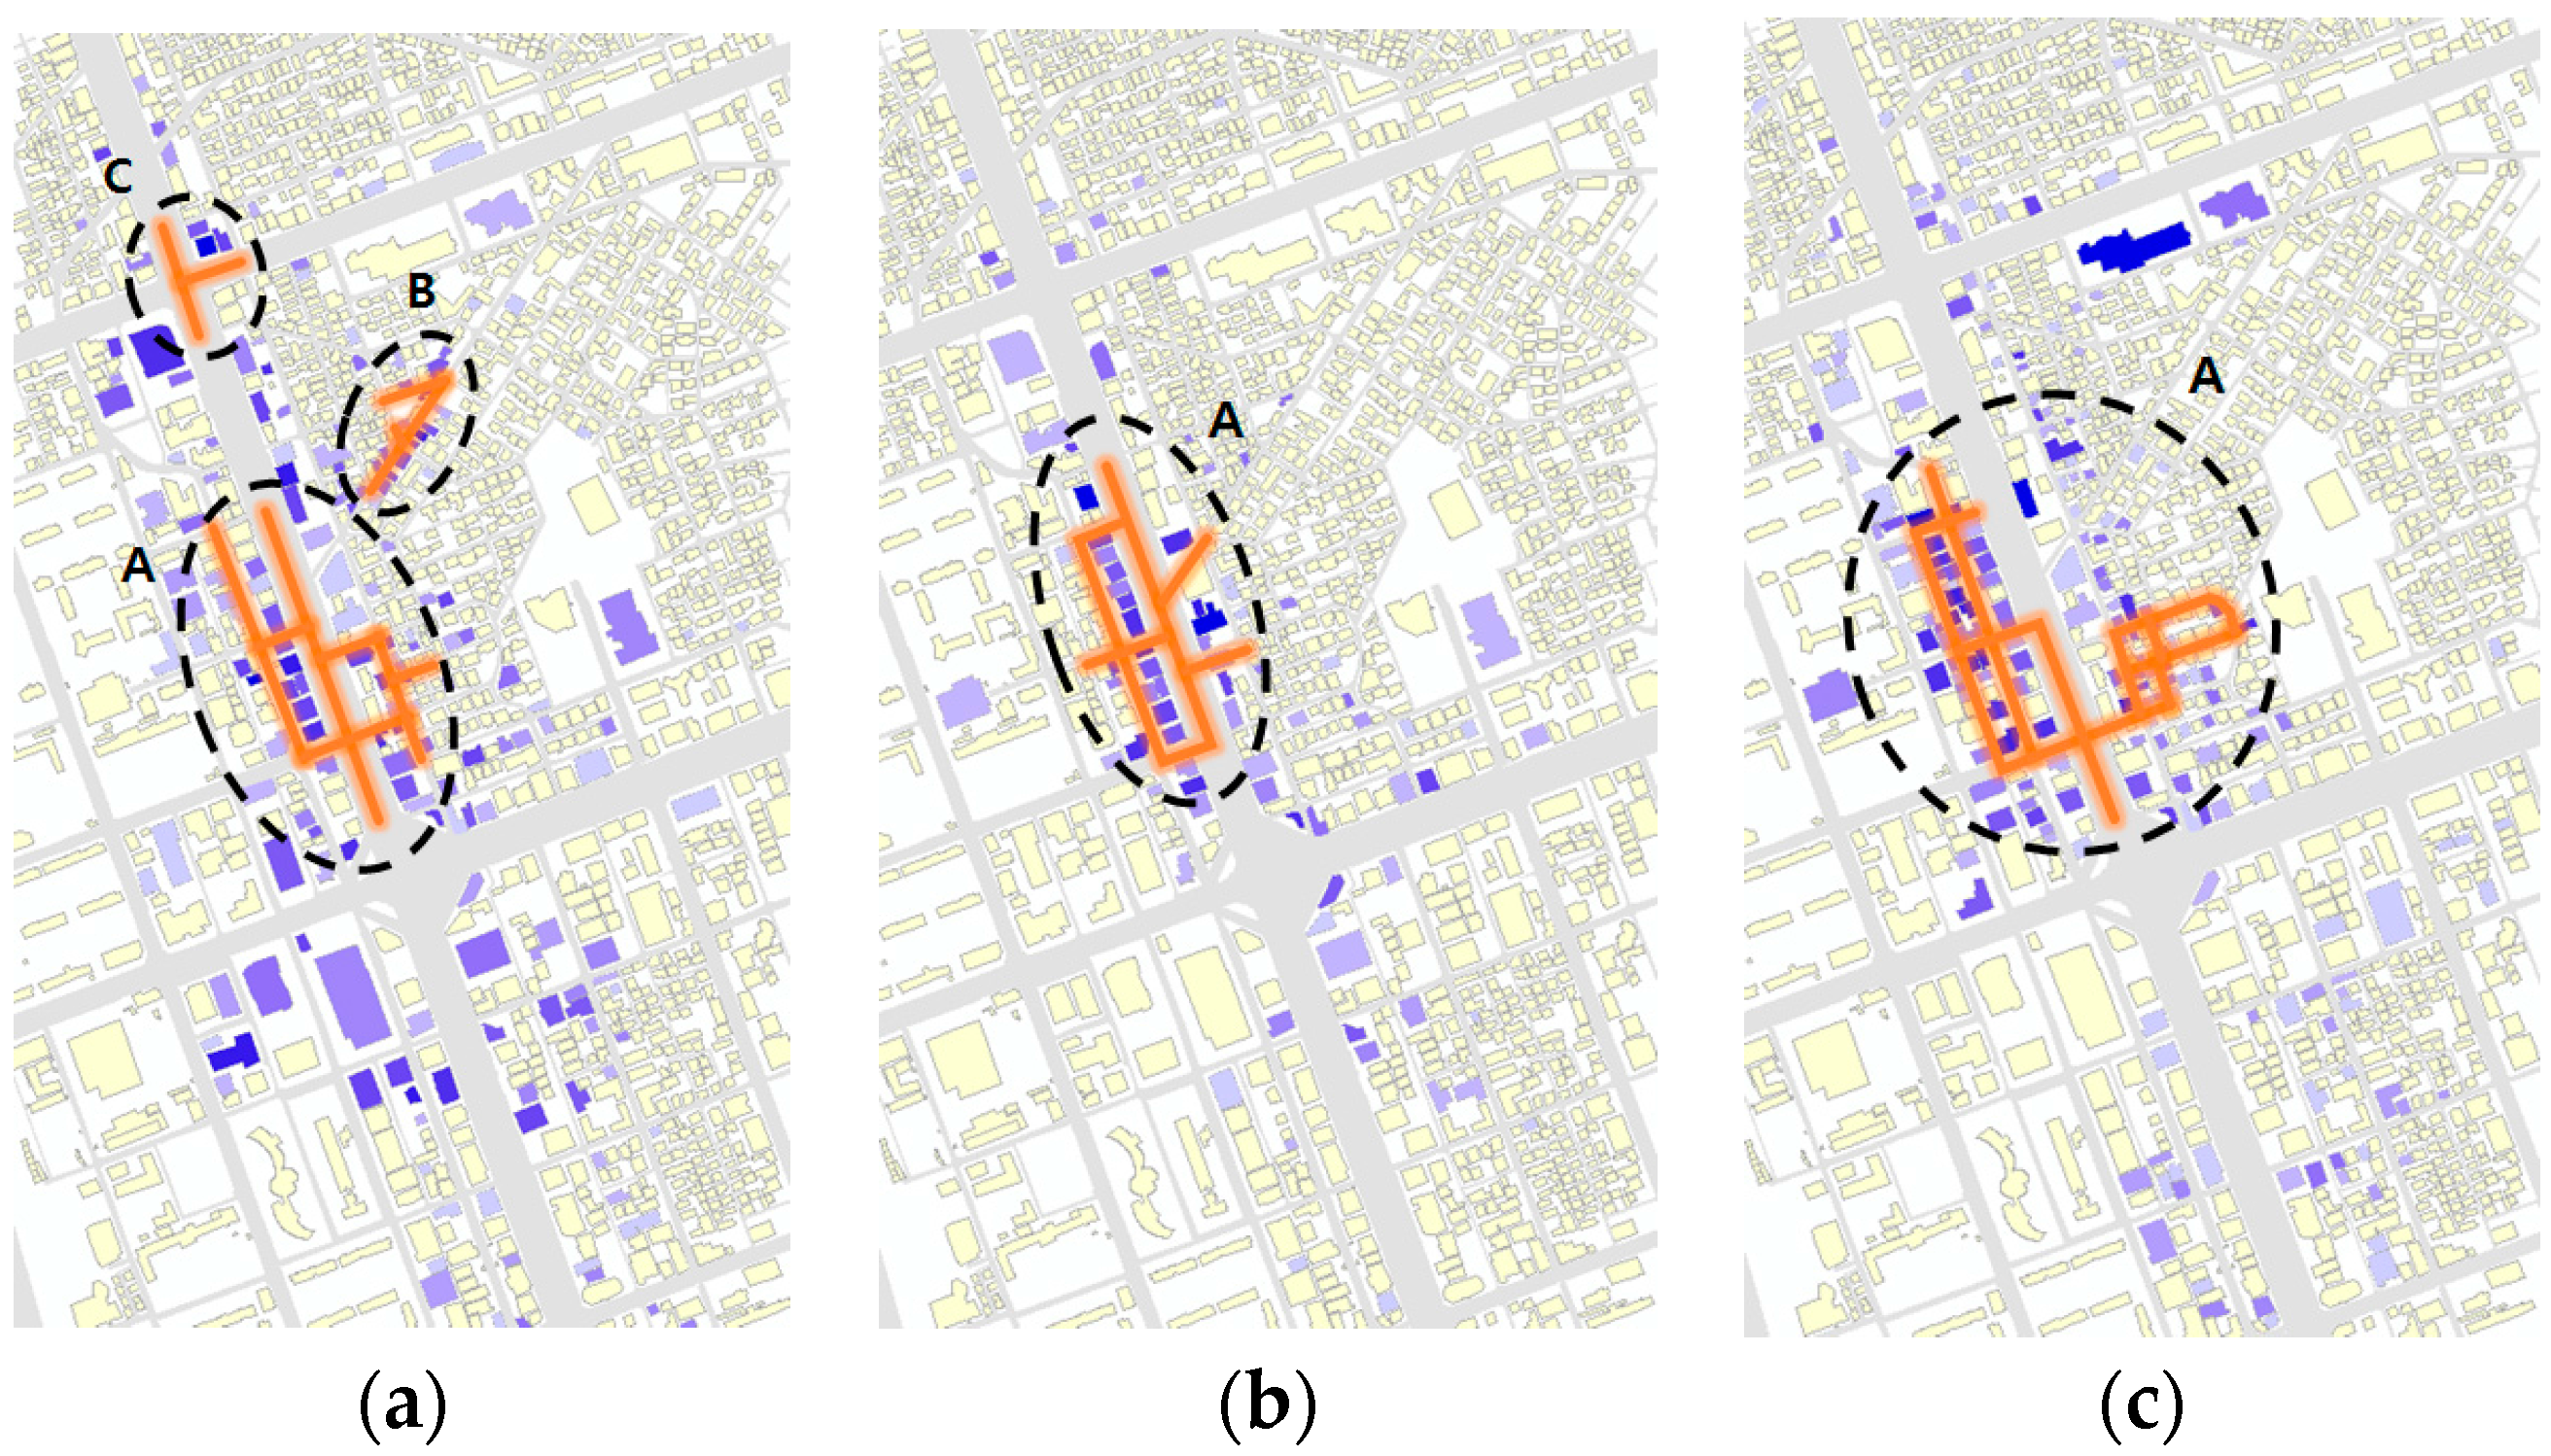
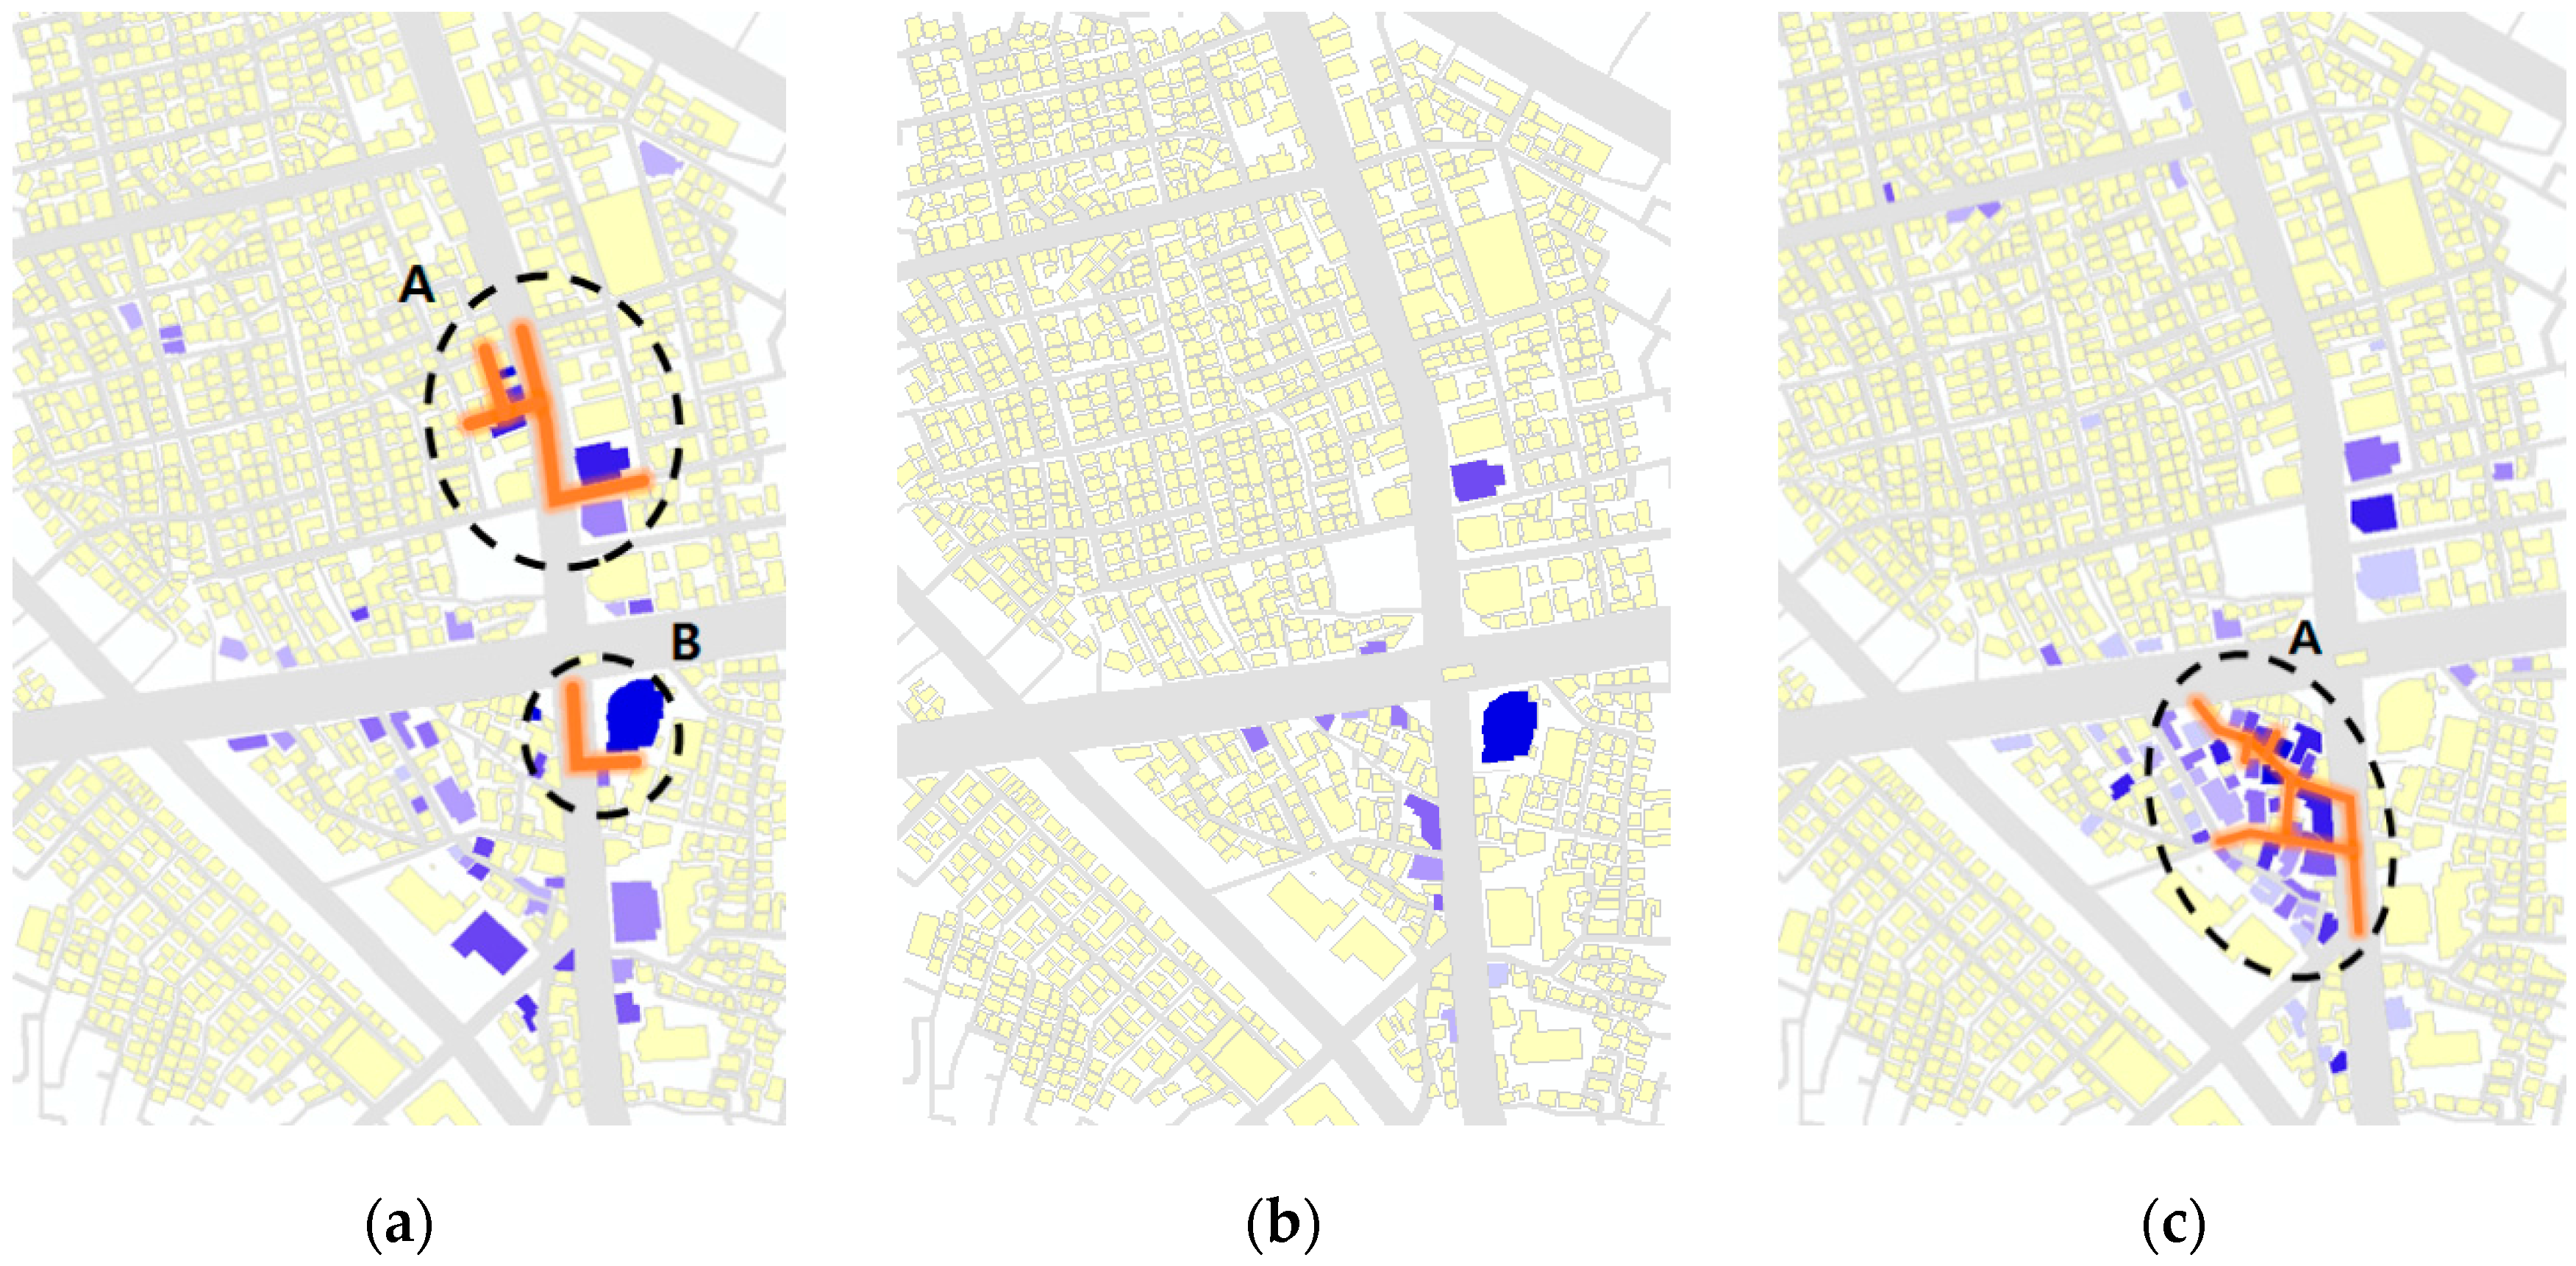
To deduce the various themed streets, not only the restaurants, but also the themes of cafés (Figure 9a), fashion stores (Figure 9b), and entertainment facilities (Figure 9c) were tested using the same method. The most noticeable aspect of Figure 9 is that a fashion themed street cluster was not detected (Figure 9b). None of the road segments satisfies the G i * value of the significant level of 0.05, although a few fashion venues appear in the data. However, a building located to the southeast side of the intersection in the test area shows the highest popularity. It can be seen that the popular fashion stores are entered through a mall rather than via streets.
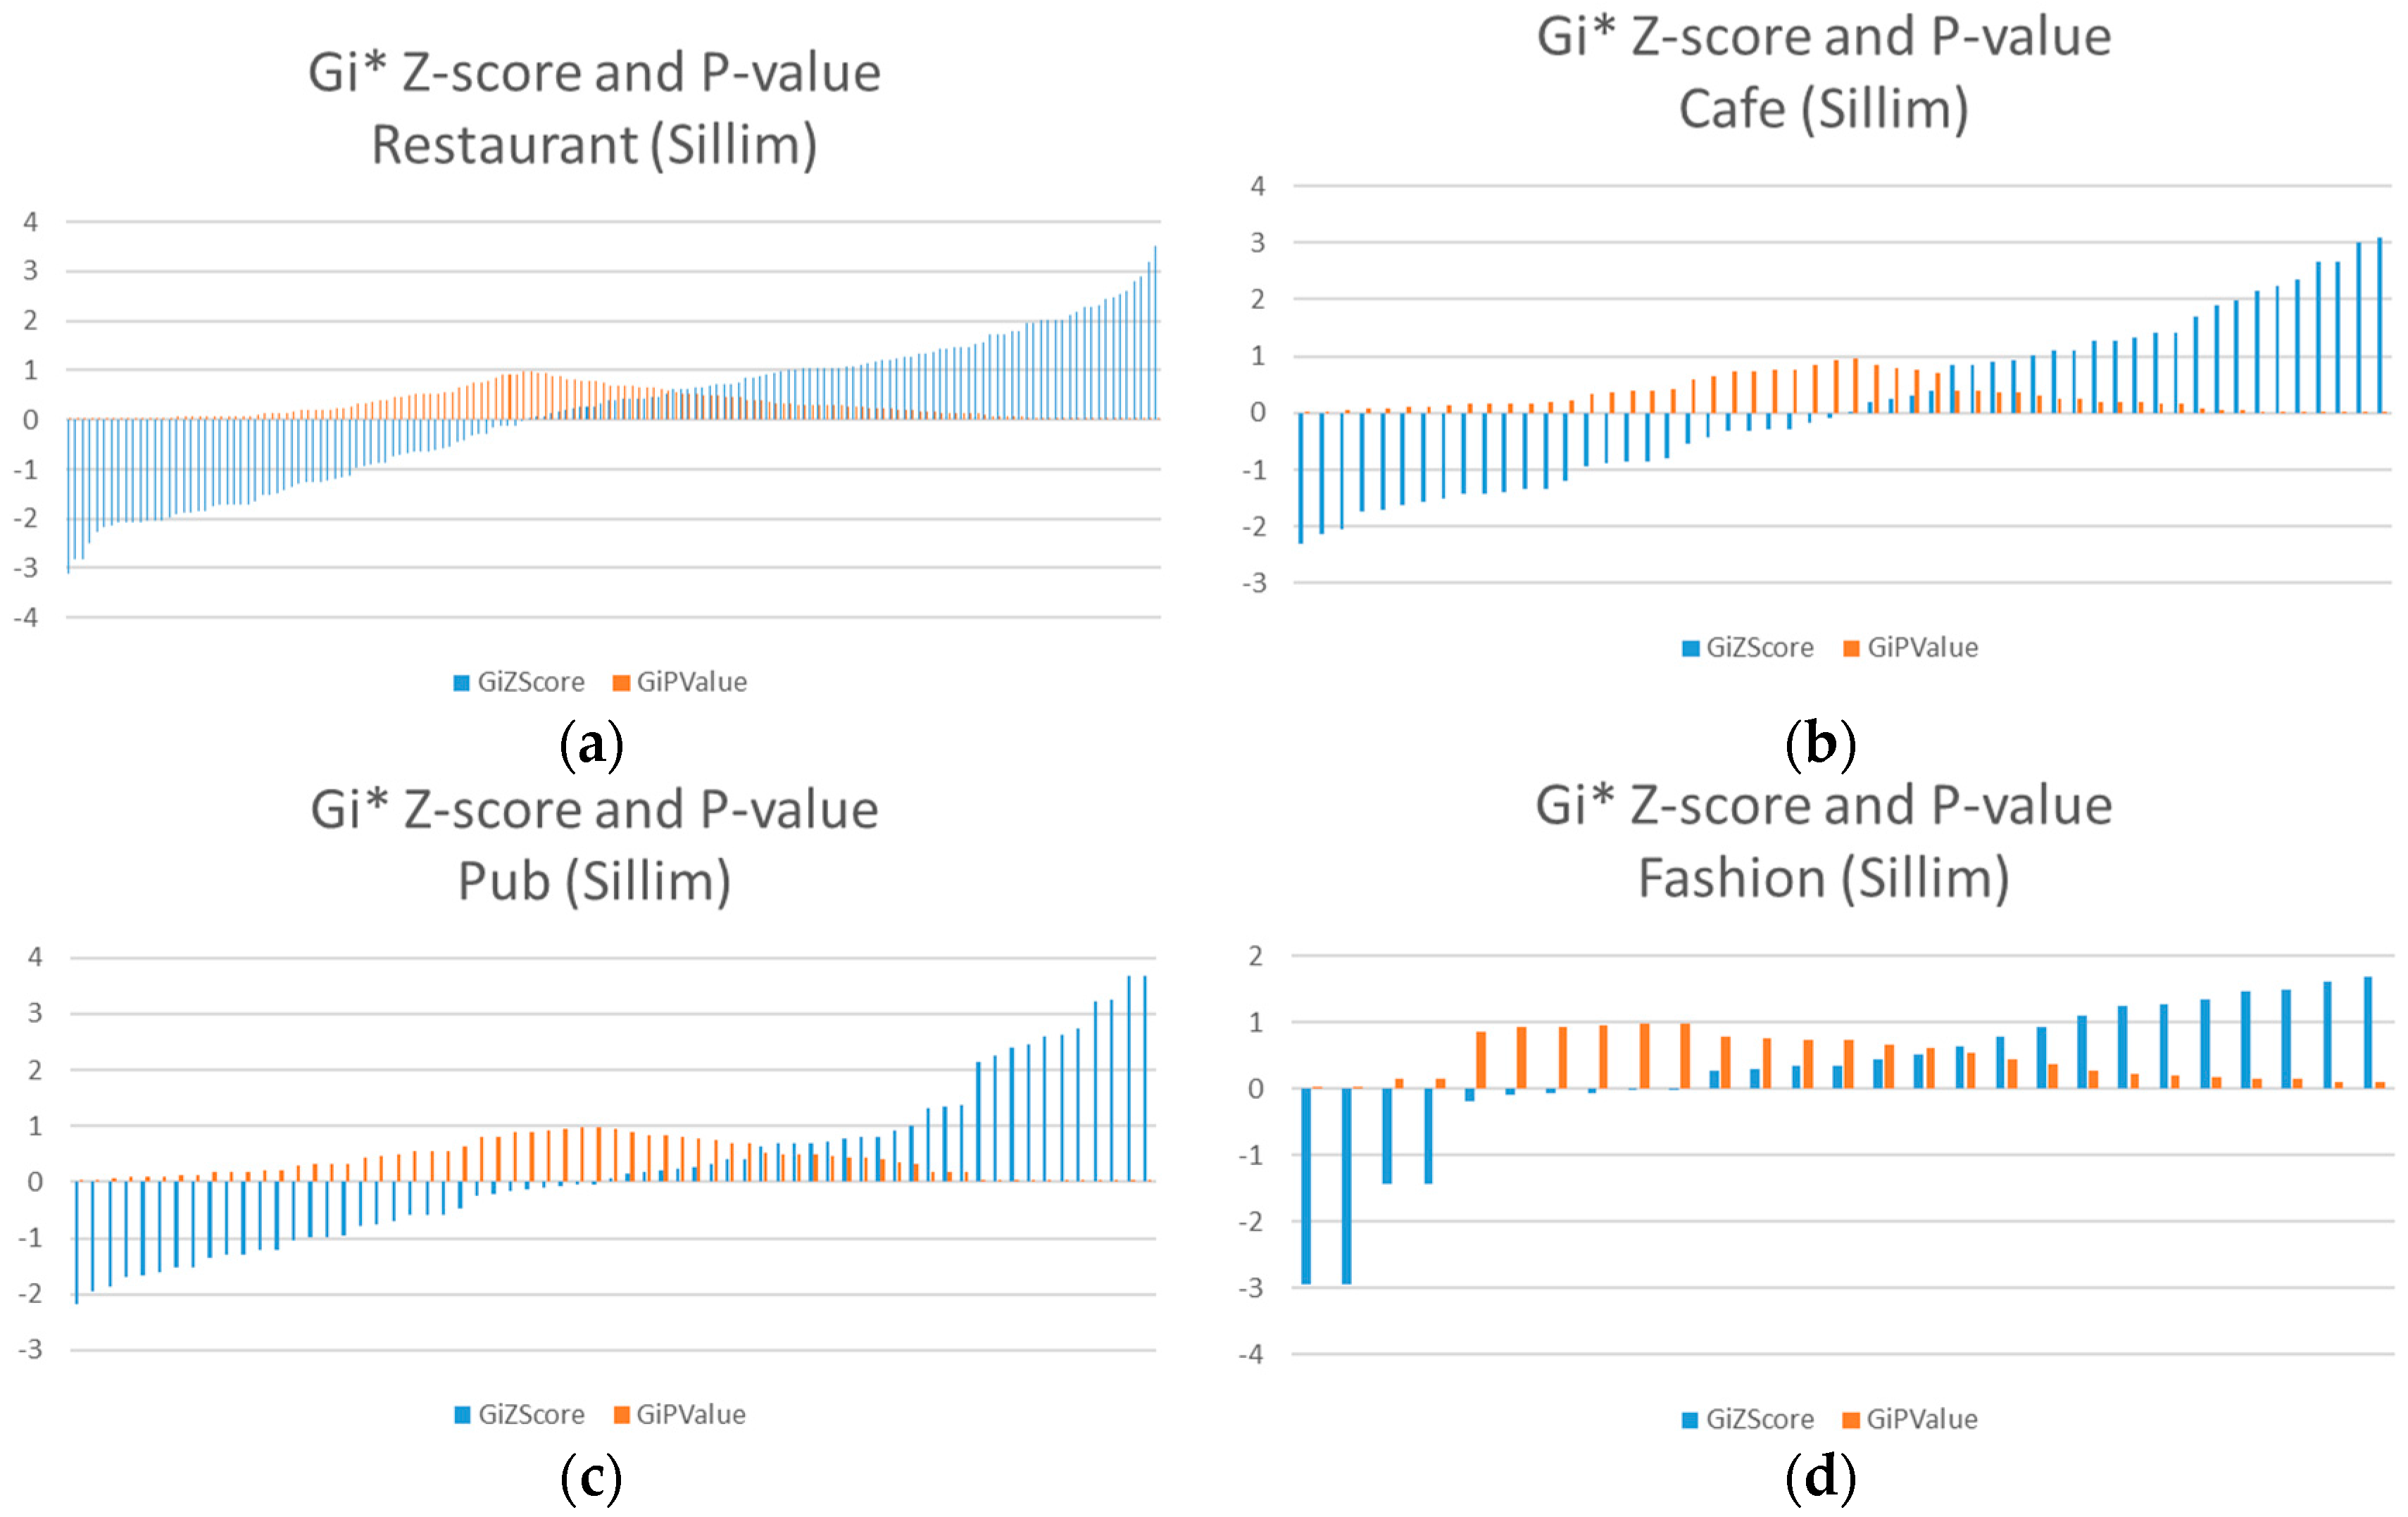
The G i * z-score and p-value of each theme are plotted so that the overall detections of the themed streets can be observed (Figure 10). The values are ordered according to the z-score in accordance with its p-value. Notice that the data shows the G i * calculations of the road segments that contain venue information. Furthermore, the frequency of each theme is different because not all of the road segments contains venues. The roads that do not contain any data were disregarded.
Four different venues were used to detect the various themed street clusters. While themed streets represent the placeness of a region, they are also important in forming the business district. Therefore, the sum of all the themed street clusters mentioned above can be regarded as a business district. The total area was visually compared to that in a market analysis report from the SBDC of Korea, presented in June 2008.
A map of the trade area from the market analysis report (Figure 11a) and the themed street clusters along with buildings (Figure 11b) is illustrated below. The test result did not reveal abnormally incorrect areas and most of the areas created by the test were inside of the area described in the SBDC report. From this visual comparison, it can be seen that the test method is reliable. It was observed that the market report presented in 2008 did not provide updated information. The themed street clusters had expanded to the south compared to the 2008 report. Also, the Fashion and Cultural street was not surveyed by the SBDC, so it was not possible to make a comparison.
In the meantime, the total number of venues in the Gangnam test area is 1570 and the number of confirmed venue buildings and matched road segments to the buildings is 425 and 242, respectively. The normal Q-Q plot indicates that the distribution of ln ( H i ) of restaurant venues in the Gangnam area is slightly negatively skewed (skewness of −0.61) as shown in Figure 12a. As previously mentioned though, a strict following of the normal distribution is not critical since Getis-Ord’s G i * does not provide clear equations for the calculation of the variance and the expected value [17]. The detection of the themed street clusters from the test results of the Gangnam area are illustrated in Figure 12b.
Three restaurant themed street clusters are detected in the Gangnam area. The special aspect of the area is that districts A and B form the back alleys of Gangnam-daero (the widest road shown in Figure 12b). It was reported that many restaurants and pubs are densely located in the back alleys of the Gangname-daero [20]. Considering the study, it can be concluded that the test result has objective accuracy. Unlike districts A and B, district C reveals a limitation of the test method. In fact, district C is not a cluster, but it is detected as only a single hot street (a street acting as a hot spot) segment. Only one restaurant venue building was assigned to the target road segment, and the z score of G i * was 1.98, with a significance level of 0.05, whose values are within the average range of the study areas. However, the popularity value ( P i ) was 1045. This value is extremely high considering that the average P i in the Gangnam area is around 80. This shows that an extremely high value of P i could render a road segment as a themed street.
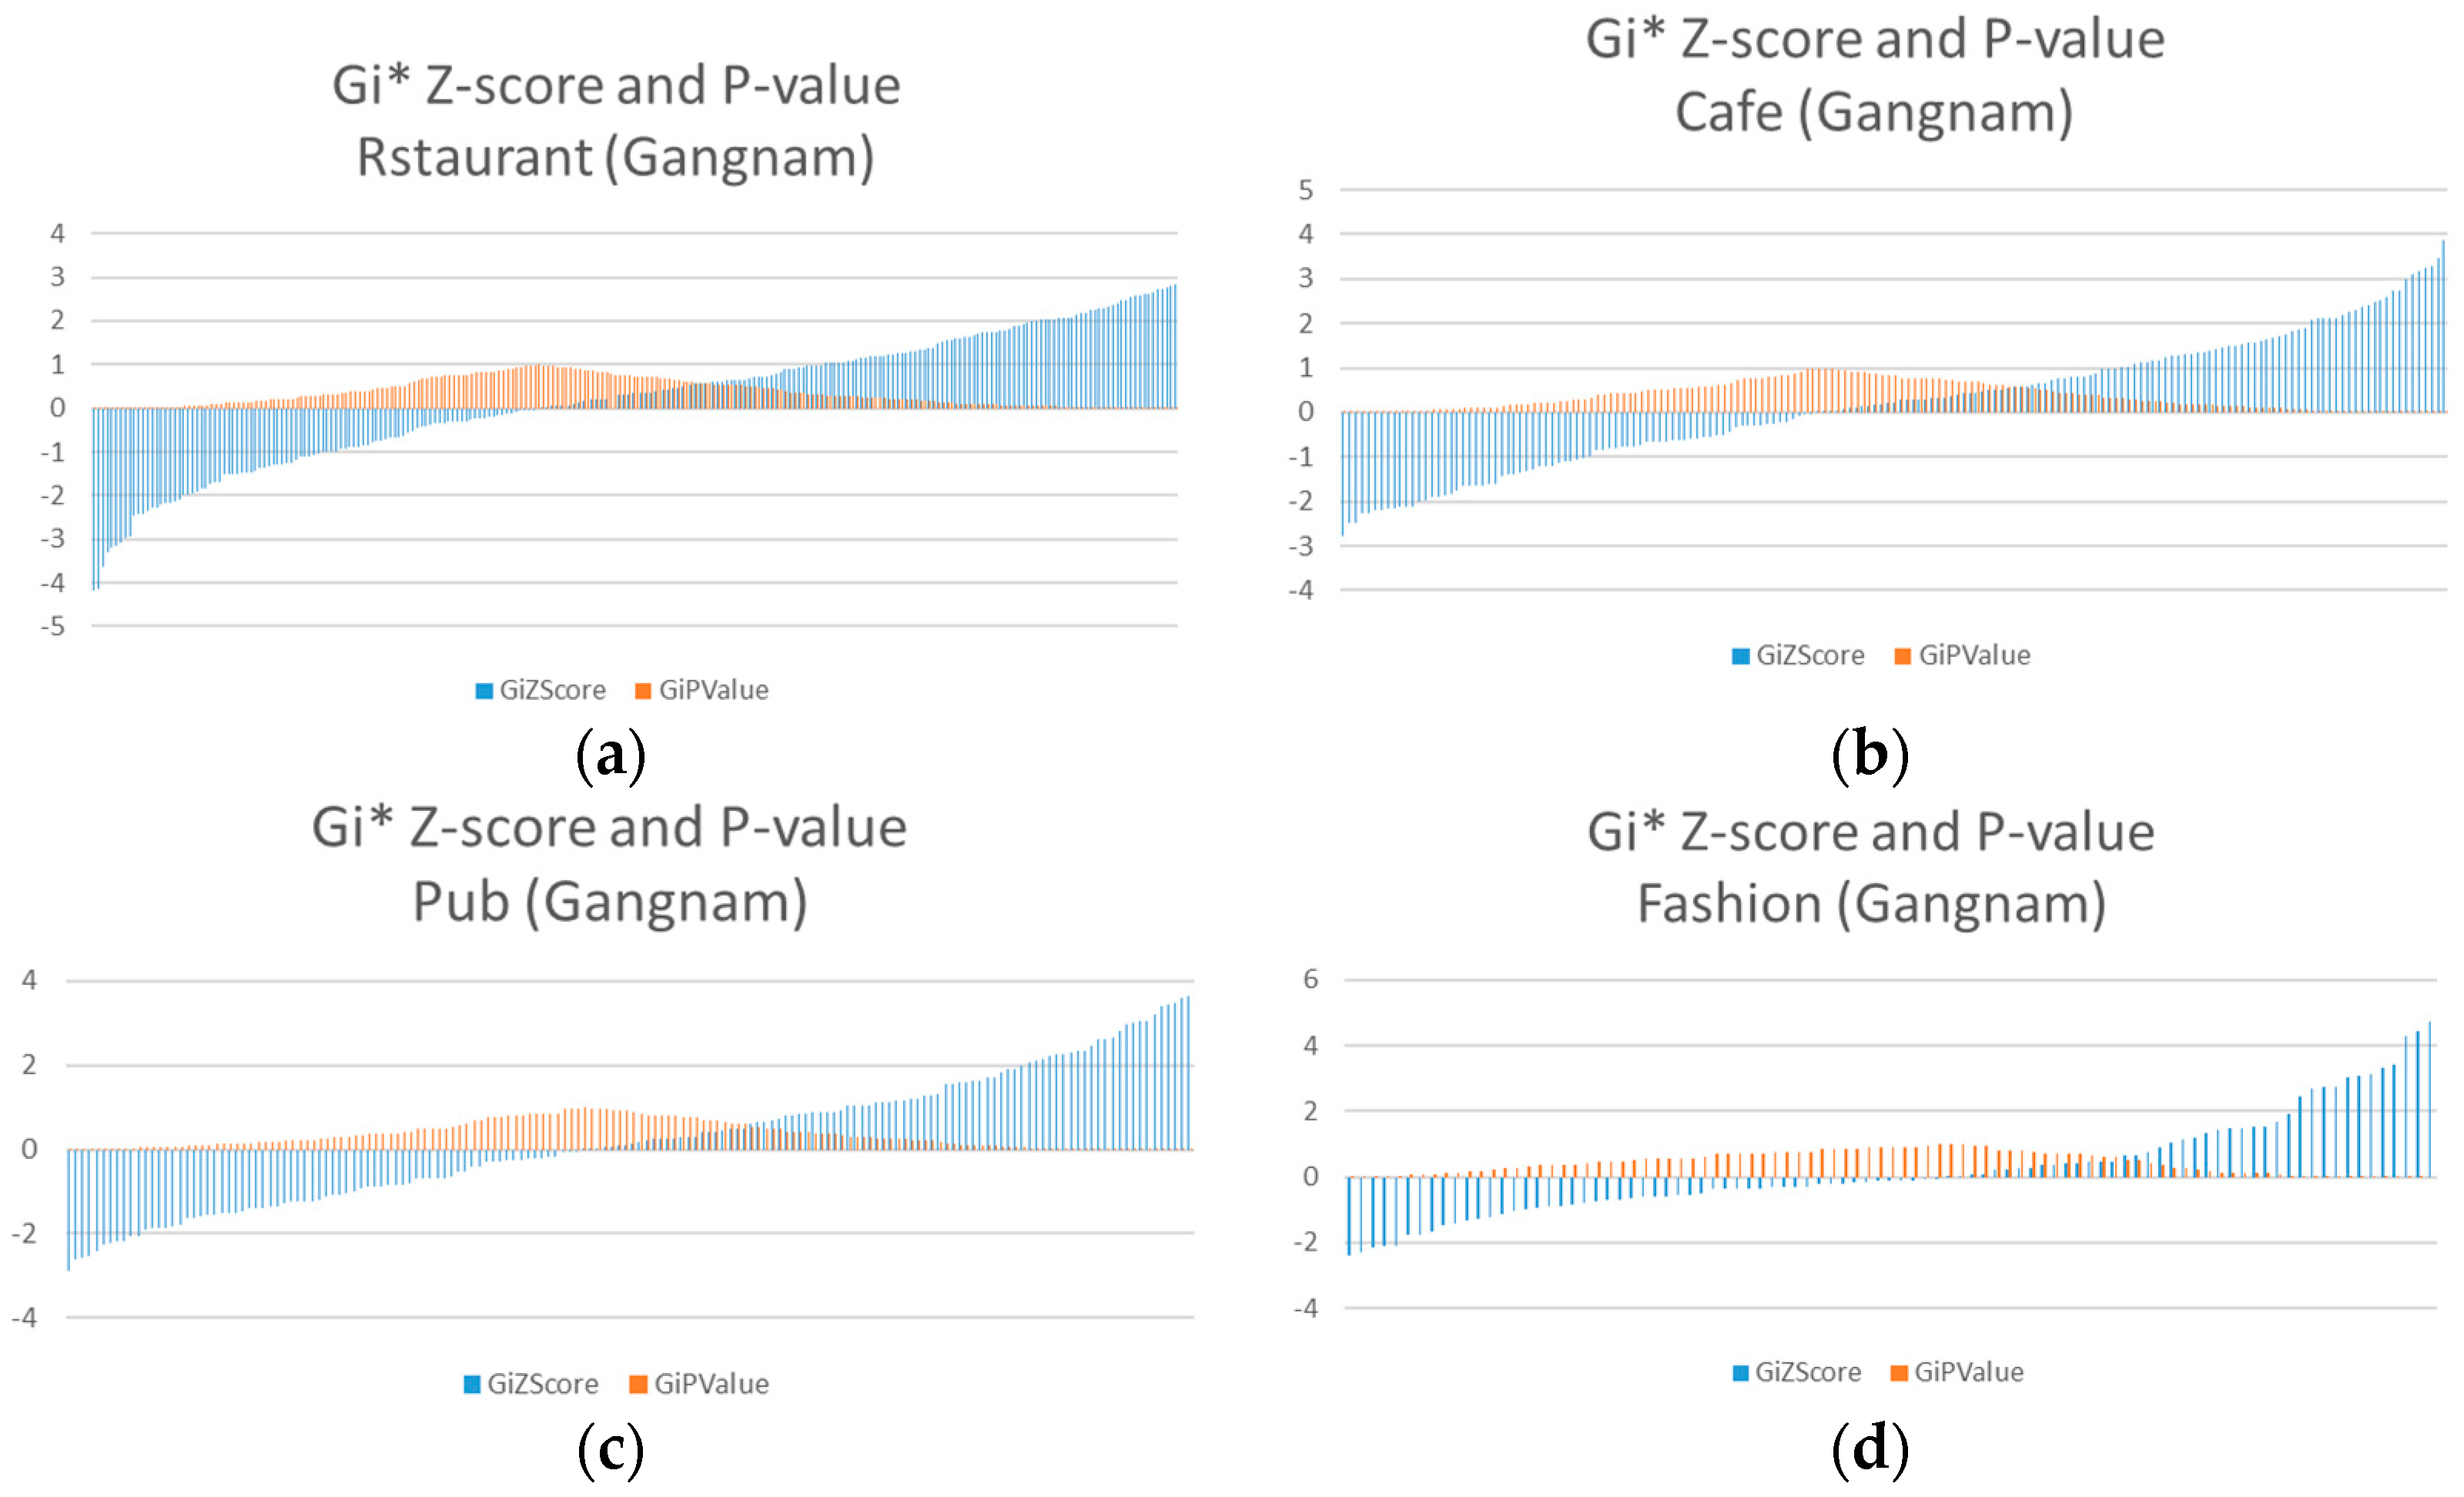
Similar to the Sillim test area, the café (Figure 13a), fashion (Figure 13b), and pub (Figure 13b) themes are tested.
The G i * z-score and p-value of each themes are plotted in Figure 14.
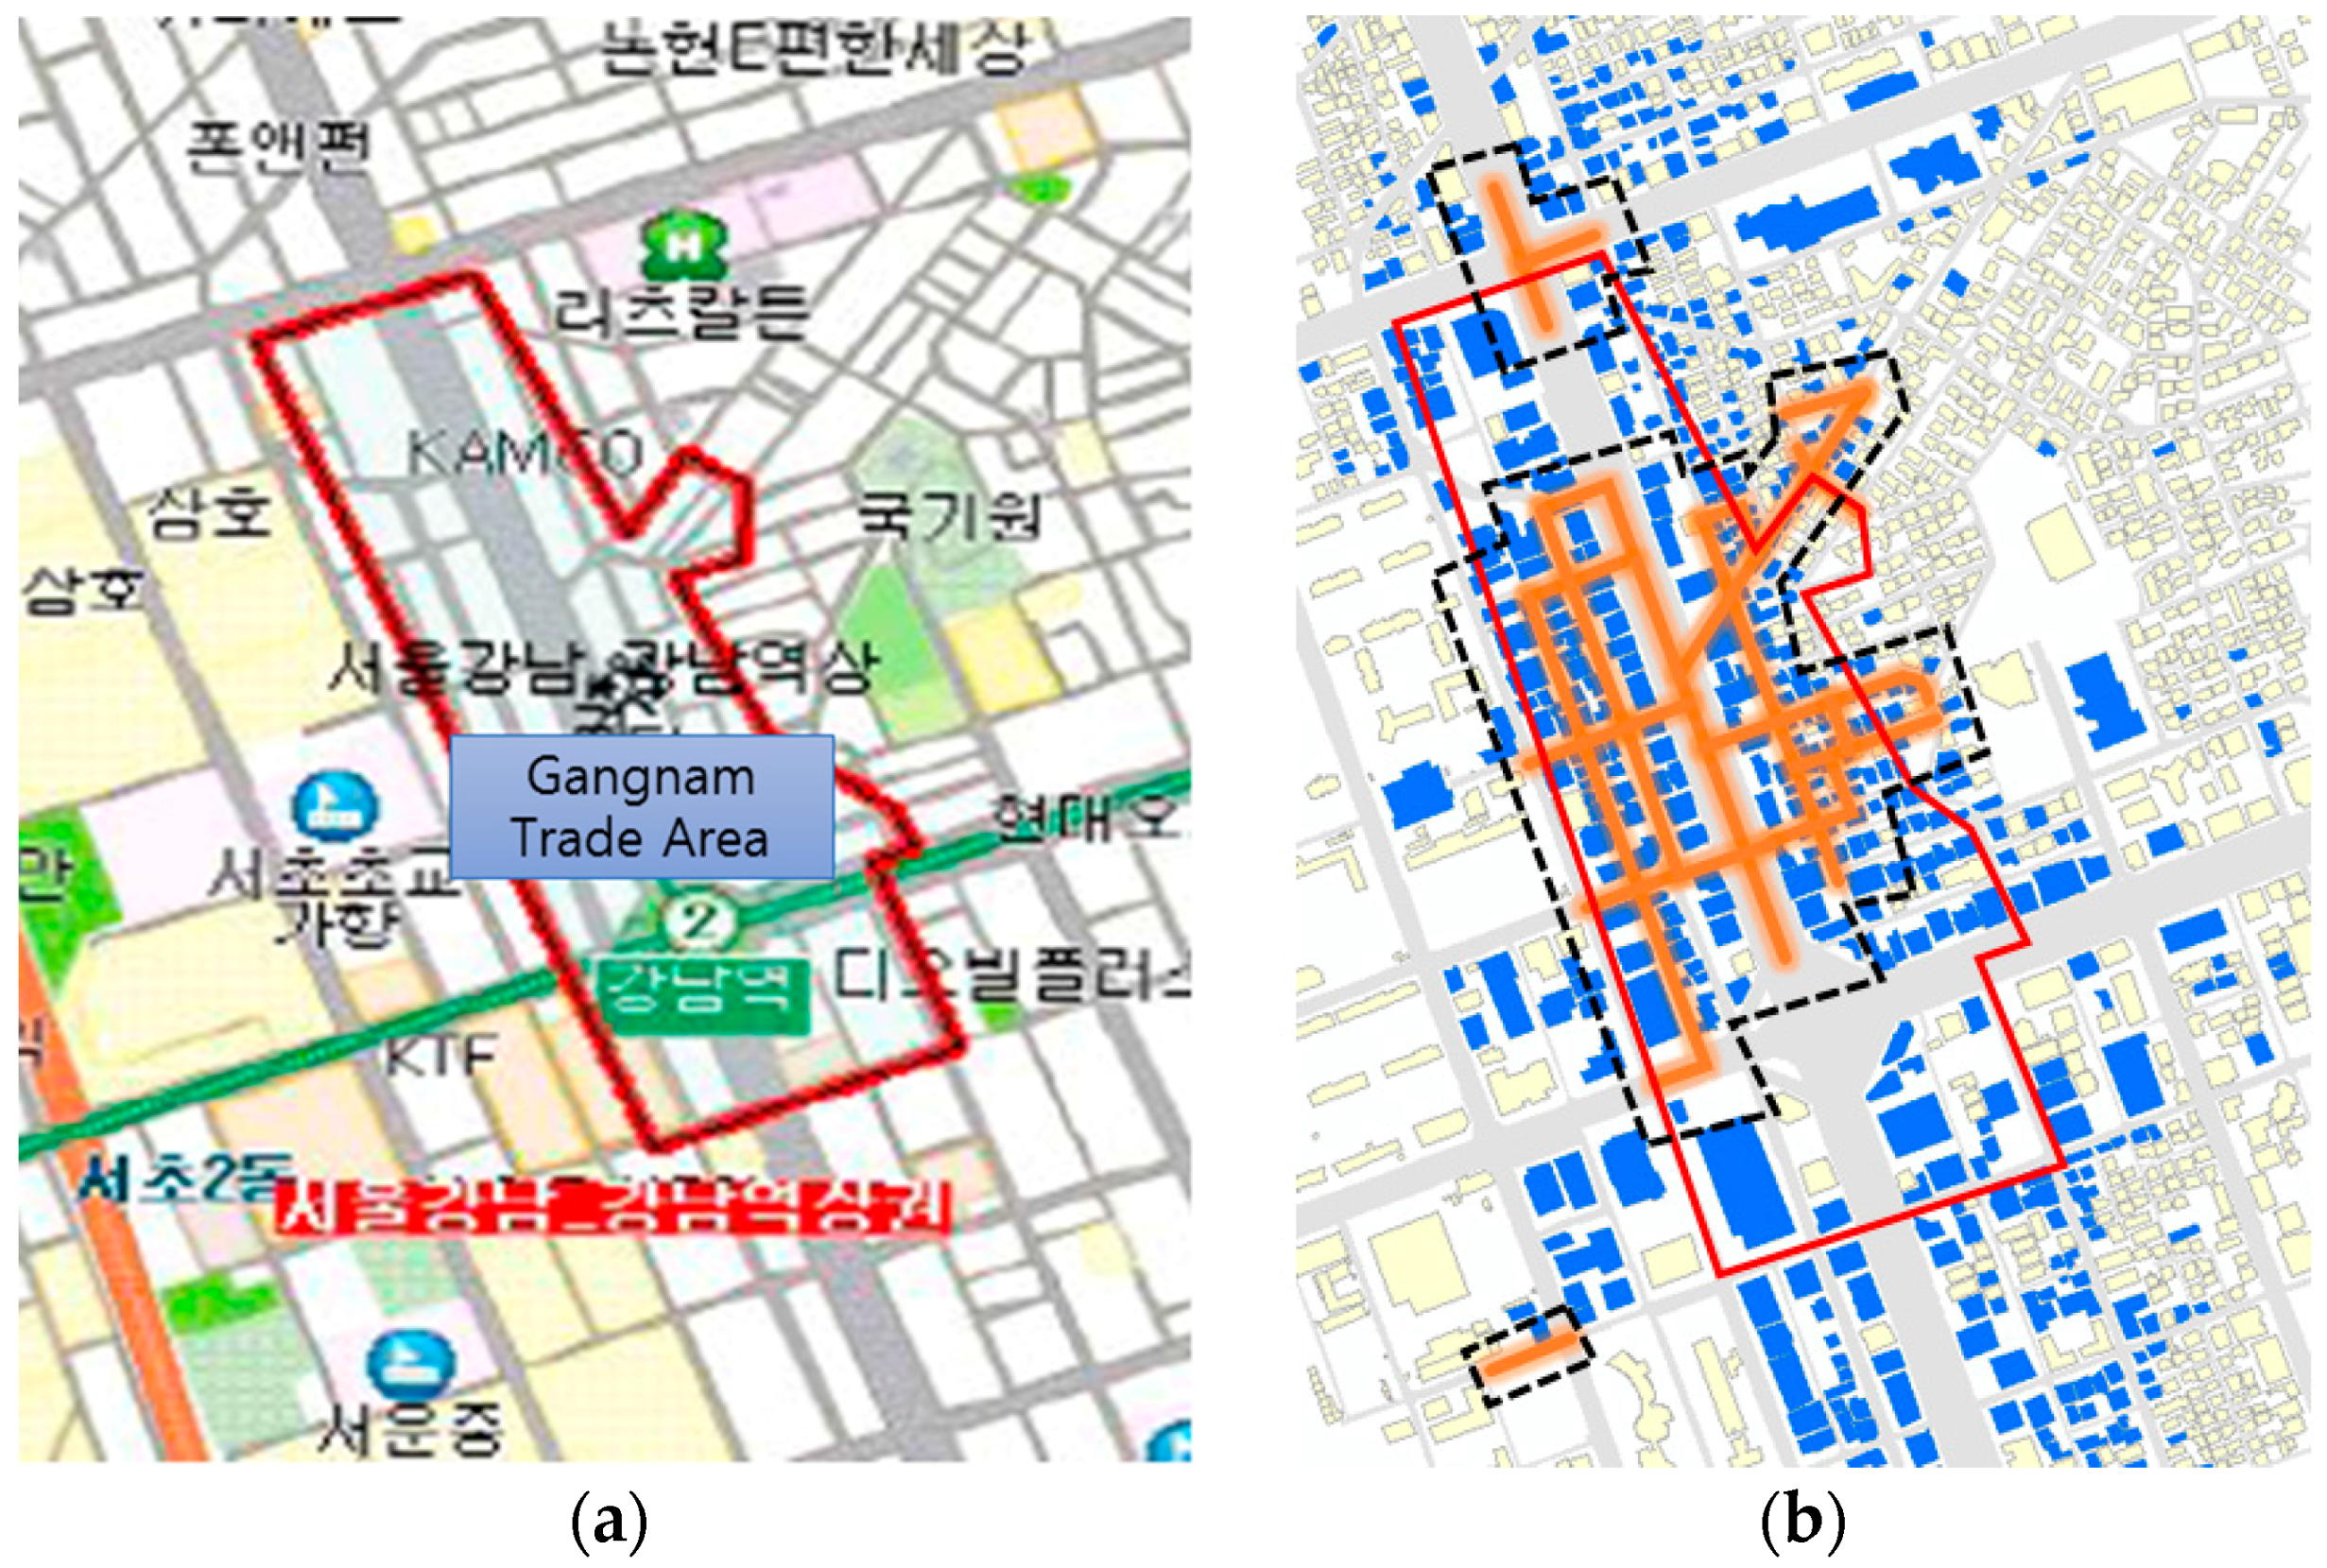
The SBDC market analysis report of Gangnam was presented in May 2008, in which all of the themed street clusters in the Gangnam area were visually compared. Figure 15 shows a map of the trade area from the market analysis report (Figure 15a) and the themed street clusters along with buildings that have venue data (Figure 15b). Excluding district C in Figure 12b, which as explained above, reveals the limitation of the testing method, the SBDC market analysis report shows that most of the themed street clusters are located inside of the area. This demonstrates that the test method has reliability and versatility.

5. Conclusions

The TSCM has been suggested throughout this study to detect themed streets. Themed streets encourage local economy and provide social and cultural spaces. The TSCM is not limited to merely detecting areas where similar stores are densely located, but also detects various themed streets using LBSM data, providing rich information.
Comparing the trade areas from the market analysis report prepared from a field survey with the test results of this study, the reliability of the method was confirmed.
The most significant contribution of this study is that various themes were detected using the suggested TSCM and that the method produced consistent results. Also, through the identification of themed streets, local governments may be able to understand the socio-dynamics of target areas, or they may engage in the re-development of the existing town planning [21]. Using this method, planners can receive up-to-date data regarding the specific usage of urban areas without the need for field surveys or the risk of outdated literature investigations, and budgetary spending is consequently reduced. Besides, like the finding of this study whereby the “Fashion and Cultural Street” in Sillim test area is used for different purposes, planners can identify the way that official planning outcomes have been transformed. With these perspectives, an enhanced decision making process can be used for re-development of urban areas.
Furthermore, the TSCM produced objective results irrespective of the location of the test area, since the method converts LBSM data attributes to mathematical values. Also, using road segments as basic spatial units for analysis, the test results were intuitive and distinguishable by avoiding formation of ambiguous spatial areas such as those created by KDE or conventional hot spot areas. Finally, not only the number of POIs and check-in counts, but also other attributes were mathematically measured to find meaningful themed streets.
However, this study also has some limitations. First, a quantitative measurement to evaluate the themed street clusters was not carried out. Second, the age range of people using the Foursquare service is limited. Although this is a general problem of the analyses for which LBSM data are used, additional data from different sources can be used to represent the whole population. Third, human error and participation leads to mistakes like typos and subjective opinions of venues when LBSMs are used. Also, internet access and other types of physical limitations could lead to the ununiformed distribution of LBSM data. Such limitations should be known by those researchers who utilize LBSM data. Lastly, a number stores or buildings (venues), such as large malls or well-known restaurants, can skew the detection of themed streets if their popularity levels are extremely high.
To overcome the abovementioned limits, an evaluation method needs to be studied. Also, errors caused by a few venues should be avoided and continuously identified and investigated by modifying the hot value ( H i ), which reflects the characteristics of road segments.

Acknowledgments

This research was supported by a grant (15CHUD-C061156-05) from the National Spatial Information Research Program funded by the Ministry of Land, Infrastructure and Transport of the Korean government.

Author Contributions

Byeongsuk Ji, Youngmin Lee and Pil Kwon provided the core idea for this study. Byeongsuk Ji implemented the methodology and carried out the experimental validation. Kiyun Yu and Pil Kwon wrote the main manuscript.

Conflicts of Interest

The authors declare no conflicts of interest.

Abbreviations

The following abbreviations are used in this manuscript:
LBSMLocation Based Social Media
VGIVolunteered Geographic Information
POIPoint of Interest
NT-STACNetwork Spatial and Temporal Analysis of Crime
NT-SaTScanNetwork Spatial Scan Statistic
NKDE(Network Kernel Density Estimation)
KDE(Kernel Density Estimation)

References

  1. Park, C.-B. A study on the revitalization of specialized street in a viewpoint of downtown regeneration in physical environment. J. Archit. Inst. Korea Plan. Des. 2009, 25, 285–292. [Google Scholar]
  2. Jacobs, J. The Death and Life of Great American Cities; Vintage: New York, NY, USA, 1961. [Google Scholar]
  3. Cranshaw, J.; Schwartz, R.; Hong, J.sI.; Sadeh, N. The livehoods project: Utilizing social media to understand the dynamics of a city. In Proceedings of the International AAAI Conference on Weblogs and Social Media, Dublin, Ireland, 5 June 2012; p. 58.
  4. Wang, M.; Qin, L.; Hu, Q. Data mining and visualization research of check-in data. In Proceedings of the 2012 20th International Conference on Geoinformatics (GEOINFORMATICS), Hong Kong, China, 15–17 June 2012; pp. 1–4.
  5. Xie, Z.; Yan, J. Kernel density estimation of traffic accidents in a network space. Comput. Environ. Urban Syst. 2008, 32, 396–406. [Google Scholar] [CrossRef]
  6. Okabe, A.; Satoh, T.; Sugihara, K. A kernel density estimation method for networks, its computational method and a GIS-based tool. Int. J. Geogr. Inf. Sci. 2009, 23, 7–32. [Google Scholar] [CrossRef]
  7. Mohaymany, A.S.; Shahri, M.; Mirbagheri, B. GIS-based method for detecting high-crash-risk road segments using network kernel density estimation. Geo-Spat. Inf. Sci. 2013, 16, 113–119. [Google Scholar] [CrossRef]
  8. Shiode, S. Street-level spatial scan statistic and stac for analysing street crime concentrations. Trans. GIS 2011, 15, 365–383. [Google Scholar] [CrossRef]
  9. Lu, Y. Approaches for Cluster Analysis of Activity Locations Along Streets: From Euclidean Plane to Street Network Space; Texas State University: San Marcos, TX, USA, 2005. [Google Scholar]
  10. Li, Y.; Steiner, M.; Wang, L.; Zhang, Z.-L.; Bao, J. Exploring venue popularity in foursquare. In Proceedings of the 2013 IEEE Conference on Computer Communications Workshops (INFOCOM WKSHPS), Turin, Italy, 14–19 April 2013; pp. 3357–3362.
  11. Goodchild, M.F. Citizens as sensors: The world of volunteered geography. GeoJournal 2007, 69, 211–221. [Google Scholar] [CrossRef]
  12. Goodchild, M.F.; Li, L. Assuring the quality of volunteered geographic information. Spat. Stat. 2012, 1, 110–120. [Google Scholar] [CrossRef]
  13. Paek, J.; Kim, J.; Govindan, R. Energy-efficient rate-adaptive GPS-based positioning for smartphones. In Proceedings of the 8th International Conference on Mobile Systems, Applications, and Services, San Francisco, CA, USA, 15–18 June 2010; pp. 299–314.
  14. Benedikt, M.L. To take hold of space: Isovists and isovist fields. Environ. Plan. B Plan. Des. 1979, 6, 47–65. [Google Scholar] [CrossRef]
  15. Anselin, L. Local indicators of spatial association—Lisa. Geogr. Anal. 1995, 27, 93–115. [Google Scholar] [CrossRef]
  16. Lee, S.-I.; Cho, D.; Sohn, H.; Chae, M. A GIS-based method for delineating spatial clusters: A modified amoeba technique. Korean Geogr. Soc. 2010, 45, 502–520. [Google Scholar]
  17. Aldstadt, J.; Getis, A. Using amoeba to create a spatial weights matrix and identify spatial clusters. Geogr. Anal. 2006, 38, 327–343. [Google Scholar] [CrossRef]
  18. Getis, A.; Ord, J.K. Local spatial statistics: An overview. Spat. Anal. Model. GIS Environ. 1996, 374, 269–285. [Google Scholar]
  19. Jeong, H. Wasting the Tax-Payer’s Money, "Fashion and Cultural Street“. Available online: http://www.ytn.co.kr/_ln/0103_200610020814127112 (accessed on 11 July 2016).
  20. Kwak, K.S. A study on trade city area analysis: Focused on the trade city areas of Kangnam, Seocho; The Graduate School of Business Administration, Kwangwoon University: Seoul, Korea, 2010. [Google Scholar]
  21. Rösler, R.; Liebig, T. Using data from location based social networks for urban activity clustering. In Geographic Information Science at the Heart of Europe; Springer: Cham, Switzerland, 2013; pp. 55–72. [Google Scholar]
Figure 1. Venue distribution in Sillim test area.
Ijgi 05 00111 g001
Figure 2. (a) Euclidean distance error histogram; (b) azimuth error histogram.
Ijgi 05 00111 g002
Figure 3. Dividing a road into several road segments.
Ijgi 05 00111 g003
Figure 4. Building layer and road segment matching examples; (a) matching to appropriate road segment; (b) by using road layer as a barrier, Isovist area from the building at corner matched only to road segments that satisfy the match condition. Otherwise, dashed line could be matched.
Ijgi 05 00111 g004
Figure 5. Isovist area created from a viewpoint.
Ijgi 05 00111 g005
Figure 6. Spatial weight matrix example: (a) sample road segments; (b) spatial weight matrix of Figure 6a.
Ijgi 05 00111 g006
Figure 7. Test area histograms: (a) distribution of H i ; (b) distribution of natural logarithm value of H i .
Ijgi 05 00111 g007
Figure 8. Sillim test area results: (a) Q-Q plot for normal; (b) Restaurant themed streets.
Ijgi 05 00111 g008
Figure 9. Themed street cluster detection results in Sillim test area: (a) Café themed street; (b) Fashion themed street; (c) Pub themed street.
Ijgi 05 00111 g009
Figure 10. G i * z-scores and p-values of the road segments of each theme in the Sillim test area: (a) restaurant; (b) café; (c) fashion; (d) pub.
Ijgi 05 00111 g010
Figure 11. Visual assessment test: (a) trade area from the Small Business Development Center (SBDC) market analysis report; (b) trade areas from the SBDC (red line) and sum of all the themed street clusters (dashed black line). Blue polygons are buildings that have venues data.
Ijgi 05 00111 g011
Figure 12. Gangnam area test results: (a) Q-Q plot for normal; (b) Restaurant themed streets.
Ijgi 05 00111 g012
Figure 13. Themed street cluster detection results in Gangnam: (a) Café themed street; (b) Fashion themed street; (c) Pub themed street.
Ijgi 05 00111 g013
Figure 14. G i * z-score and p-value of road segments of each themes in Gangnam test area: (a) restaurant; (b) café; (c) fashion; (d) pub.
Ijgi 05 00111 g014
Figure 15. Visual assessment test: (a) trade area from the SBDC market analysis report; (b) trade areas from the SBDC (red line) and sum of all the themed street clusters (dashed black line). Blue polygons are buildings that have venues data.
Ijgi 05 00111 g015

