Article

Distribution Pattern of Landslides Triggered by the 2014 Ludian Earthquake of China: Implications for Regional Threshold Topography and the Seismogenic Fault Identification

1
Department of Civil and Structural Engineering, Kyushu University, Fukuoka 819-0395, Japan
2
Department of Geotechnical Engineering, Central South University, Changsha 410075, China
*
Author to whom correspondence should be addressed.
ISPRS Int. J. Geo-Inf. 2016, 5(4), 46; https://doi.org/10.3390/ijgi5040046
Submission received: 16 February 2016 / Revised: 10 March 2016 / Accepted: 11 March 2016 / Published: 30 March 2016

Abstract

:
The 3 August 2014 Ludian earthquake with a moment magnitude scale (Mw) of 6.1 induced widespread landslides in the Ludian County and its vicinity. This paper presents a preliminary analysis of the distribution patterns and characteristics of these co-seismic landslides. In total, 1826 landslides with a total area of 19.12 km2 triggered by the 3 August 2014 Ludian earthquake were visually interpreted using high-resolution aerial photos and Landsat-8 images. The sizes of the landslides were, in general, much smaller than those triggered by the 2008 Wenchuan earthquake. The main types of landslides were rock falls and shallow, disrupted landslides from steep slopes. These landslides were unevenly distributed within the study area and concentrated within an elliptical area with a 25-km NW–SE striking long axis and a 15-km NW–SE striking short axis. Three indexes including landslides number (LN), landslide area ratio (LAR), and landslide density (LD) were employed to analyze the relation between the landslide distribution and several factors, including lithology, elevation, slope, aspect, distance to epicenter and distance to the active fault. The results show that slopes consisting of deeply weathered and fractured sandstones and mudstones were the more susceptible to co-seismic landslides. The elevation range of high landslide susceptibility was between 900–1300 m and 1800–2000 m. There was a generally positive correlation between co-seismic landslides and slope angle, until a maximum for the slope class 40°–50°. The co-seismic landslides occurred preferably on Southeast (SE), South (S) and Southwest (SW) oriented slopes. Results also show that the landslide concentration tends to decrease with distance from the surface projection of the epicenter rather than the seismogenic fault, and the highest landslide concentration is located within a 5–6 km distance of the seismogenic fault. Regarding the epicenter, the largest landslide clusters were found on the SE, northeast by east (NEE) and nearly West (W) of the epicenter. In addition, we also suggest that statistical results of slope gradients of landslides might imply a threshold topography of the study area within a tectonically active background. By analogy with other events, the statistical results of landslides aspects also imply the seismogenic fault of the Ludian earthquake might have been the Northwest (NW)-trending fault, which is consistent with other studies.

1. Introduction

According to the China Earthquake Network Center (CNEC) [1], an earthquake of Mw 6.1 hit the area between the Ludian County, the Qiaojia County and Huize County of Yunnan Province, at 4:30 p.m. (Beijing Time UTC+8) on 3 August 2014. The epicenter of this earthquake was located at 27.11°N, 103.13°E, with a shallow focal depth of 12 km and a maximum intensity of IV in the area around the epicenter. According to China Earthquake Administration (CEA), in total, this earthquake affected 1,088,800 people and as of time 10:30 a.m. on 6 August, the earthquake had caused 589 deaths, 2,401 injuries, 80,900 buildings belonging to 25,800 families to collapse and serious damage to 129,100 buildings belonging to 40,600 families [2]. The Ludian earthquake also triggered extensive landslides, some of which caused serious damage, blocked roads, created landslide dams and threatened infrastructure.
Earthquake-induced landslides have recently drawn increasing attention from researchers in fields of tectonics, geomorphology, natural hazards, geographic information system (GIS) and remote sensing (RS). Damage from earthquake-induced landslides were documented from at least as early as 1789 B.C. in China and 373 or 372 B.C. in Greece [3]. Earthquake-induced landslides have been responsible for the deaths of tens of thousands of people and economic losses of billions of dollars. Particularly in mountainous areas, the damage caused by earthquake-induced landslides and slope collapses might be more severe than the damage caused by the earthquake itself [4]. In the last decade, various studies of earthquake-induced landslides in mountainous areas have been carried out, including on the 2004 Niigata earthquake in Japan [5,6], the 2005 northern Pakistan earthquake [7,8], the 2008 Wenchuan earthquake with a surface wave magnitude (Ms) of 8.0 in China [9,10], 2011 Tohoku earthquake (Mw = 9.0) in Japan [11,12] and 2013 Lushan earthquake (Ms = 7.0) in China [13,14,15].
Compiling of a detailed and comprehensive landslide inventory is the prerequisite for subsequent studies, such as distribution analysis, hazard assessment, and regional topographic evolution research [16,17]. Landslide inventory maps can be produced using different techniques such as field investigation, digitalization of historic landslide inventory, visual interpretation of aerial photos, computer-aided supervised or unsupervised interpretation of remote sensing images [16]. Although field investigation provides more detailed and intuitive landslide information, the significant shortcoming of this method is that landslides that occur in inaccessible areas will be missed, especially in some mountainous areas. In contrast, the photo interpretation method greatly enhances the efficiency of landslide inventory preparation and has become popular since the 1970s [17]. In the last two decades, with the increasing availability of high and very-high resolution sensors, development of computer hardware and remote sensing (RS) technologies, use of satellite images and RS technologies for landslide investigations has increased significantly. Many detailed and comprehensive inventories of earthquake-induced landslides have been reported [5,6,11,12], which have provided a good basis for landslide hazard evaluation and mitigation. Currently, studies on automatic extraction of landslides through remote-sensing images have become important topics in engineering, geology and other related fields. This method depends heavily on image resolution and models and is very suitable for large-scale landslides mapping. However, it might cause errors when applied to smaller landslides [18]. Hence, visual interpretation by well-trained personnel is still believed to be more accurate and reliable than computers, although it is more time-consuming. The quality of results of such visual interpretation methods largely depends on the experience of the interpreters. A better way to minimize the subjectivity of visual interpretation is to carry out some field investigations for validation.
In the past few decades, numerous studies focused on relations between landslide distribution and triggering seismic factors [5,6,11,12]. Early studies of landslide inventory compiling and simple spatial distribution analysis have been summarized by [4], and more recently by [19] through several global or regional inventory of earthquake-induced landslides [20,21,22,23]. In recent years, more and more landslide event-inventories related to single earthquake events have emerged based on GIS and remote-sensing technologies, such as those based on the 1999 Chi-Chi earthquake (Taiwan) [24], 2004 Chuetsu earthquakes (Japan) [5], the 2007 Niigata Chuetsu earthquake (Japan) [25] and the 2008 Wenchuan earthquake (China) [10]. On the one hand, studies on the distribution of earthquake-induced landslides have a major significance for better understandings of landslide mechanism and landslide susceptibility in earthquake-prone areas. On the other hand, transportation and deposition of landslides materials played a fundamental role in regional geomorphology evolution and balance of long-term tectonic growth. High and steep hill slopes usually provided the potential gravitational energy difference, which was the main force of frequent landslide mass movement, regardless of whether a landslide is triggered by earthquake. Meanwhile, landsliding cut into the uplifting rock mass, forcing the overspread of drainages, countering the tectonic mass flux into organic systems, and limiting the mountain relief.
The 2014 Ludian earthquake has provided us a good opportunity to study the spatial distribution of co-seismic landslides. This study focuses on the characterization of the distribution patterns of landslides induced by the Ludian earthquake and makes a comparison of these data with previous observations made during the 2008 Wenchuan earthquake and 2013 Lushan earthquake. The main purposes of this study include: (1) compiling an inventory of the Ludian earthquake-triggered landslides; (2) characterizing the spatial distribution of landslides with respect to various topographic and seismic factors; and (3) contributing to the further understanding of the characteristics of landslides in tectonic-active regions. We first collect some aerial photos and satellite images covering the area around the epicenter of the Ludian earthquake. Then, we performed a visual interpretation of landslides triggered by the Ludian earthquake. Finally, we preliminarily analyze the relationships between these landslides and several topographic and seismic factors. In addition, we discussed the implications of co-seismic landslides distribution to regional threshold topography evolution and the seismogenic fault identification.

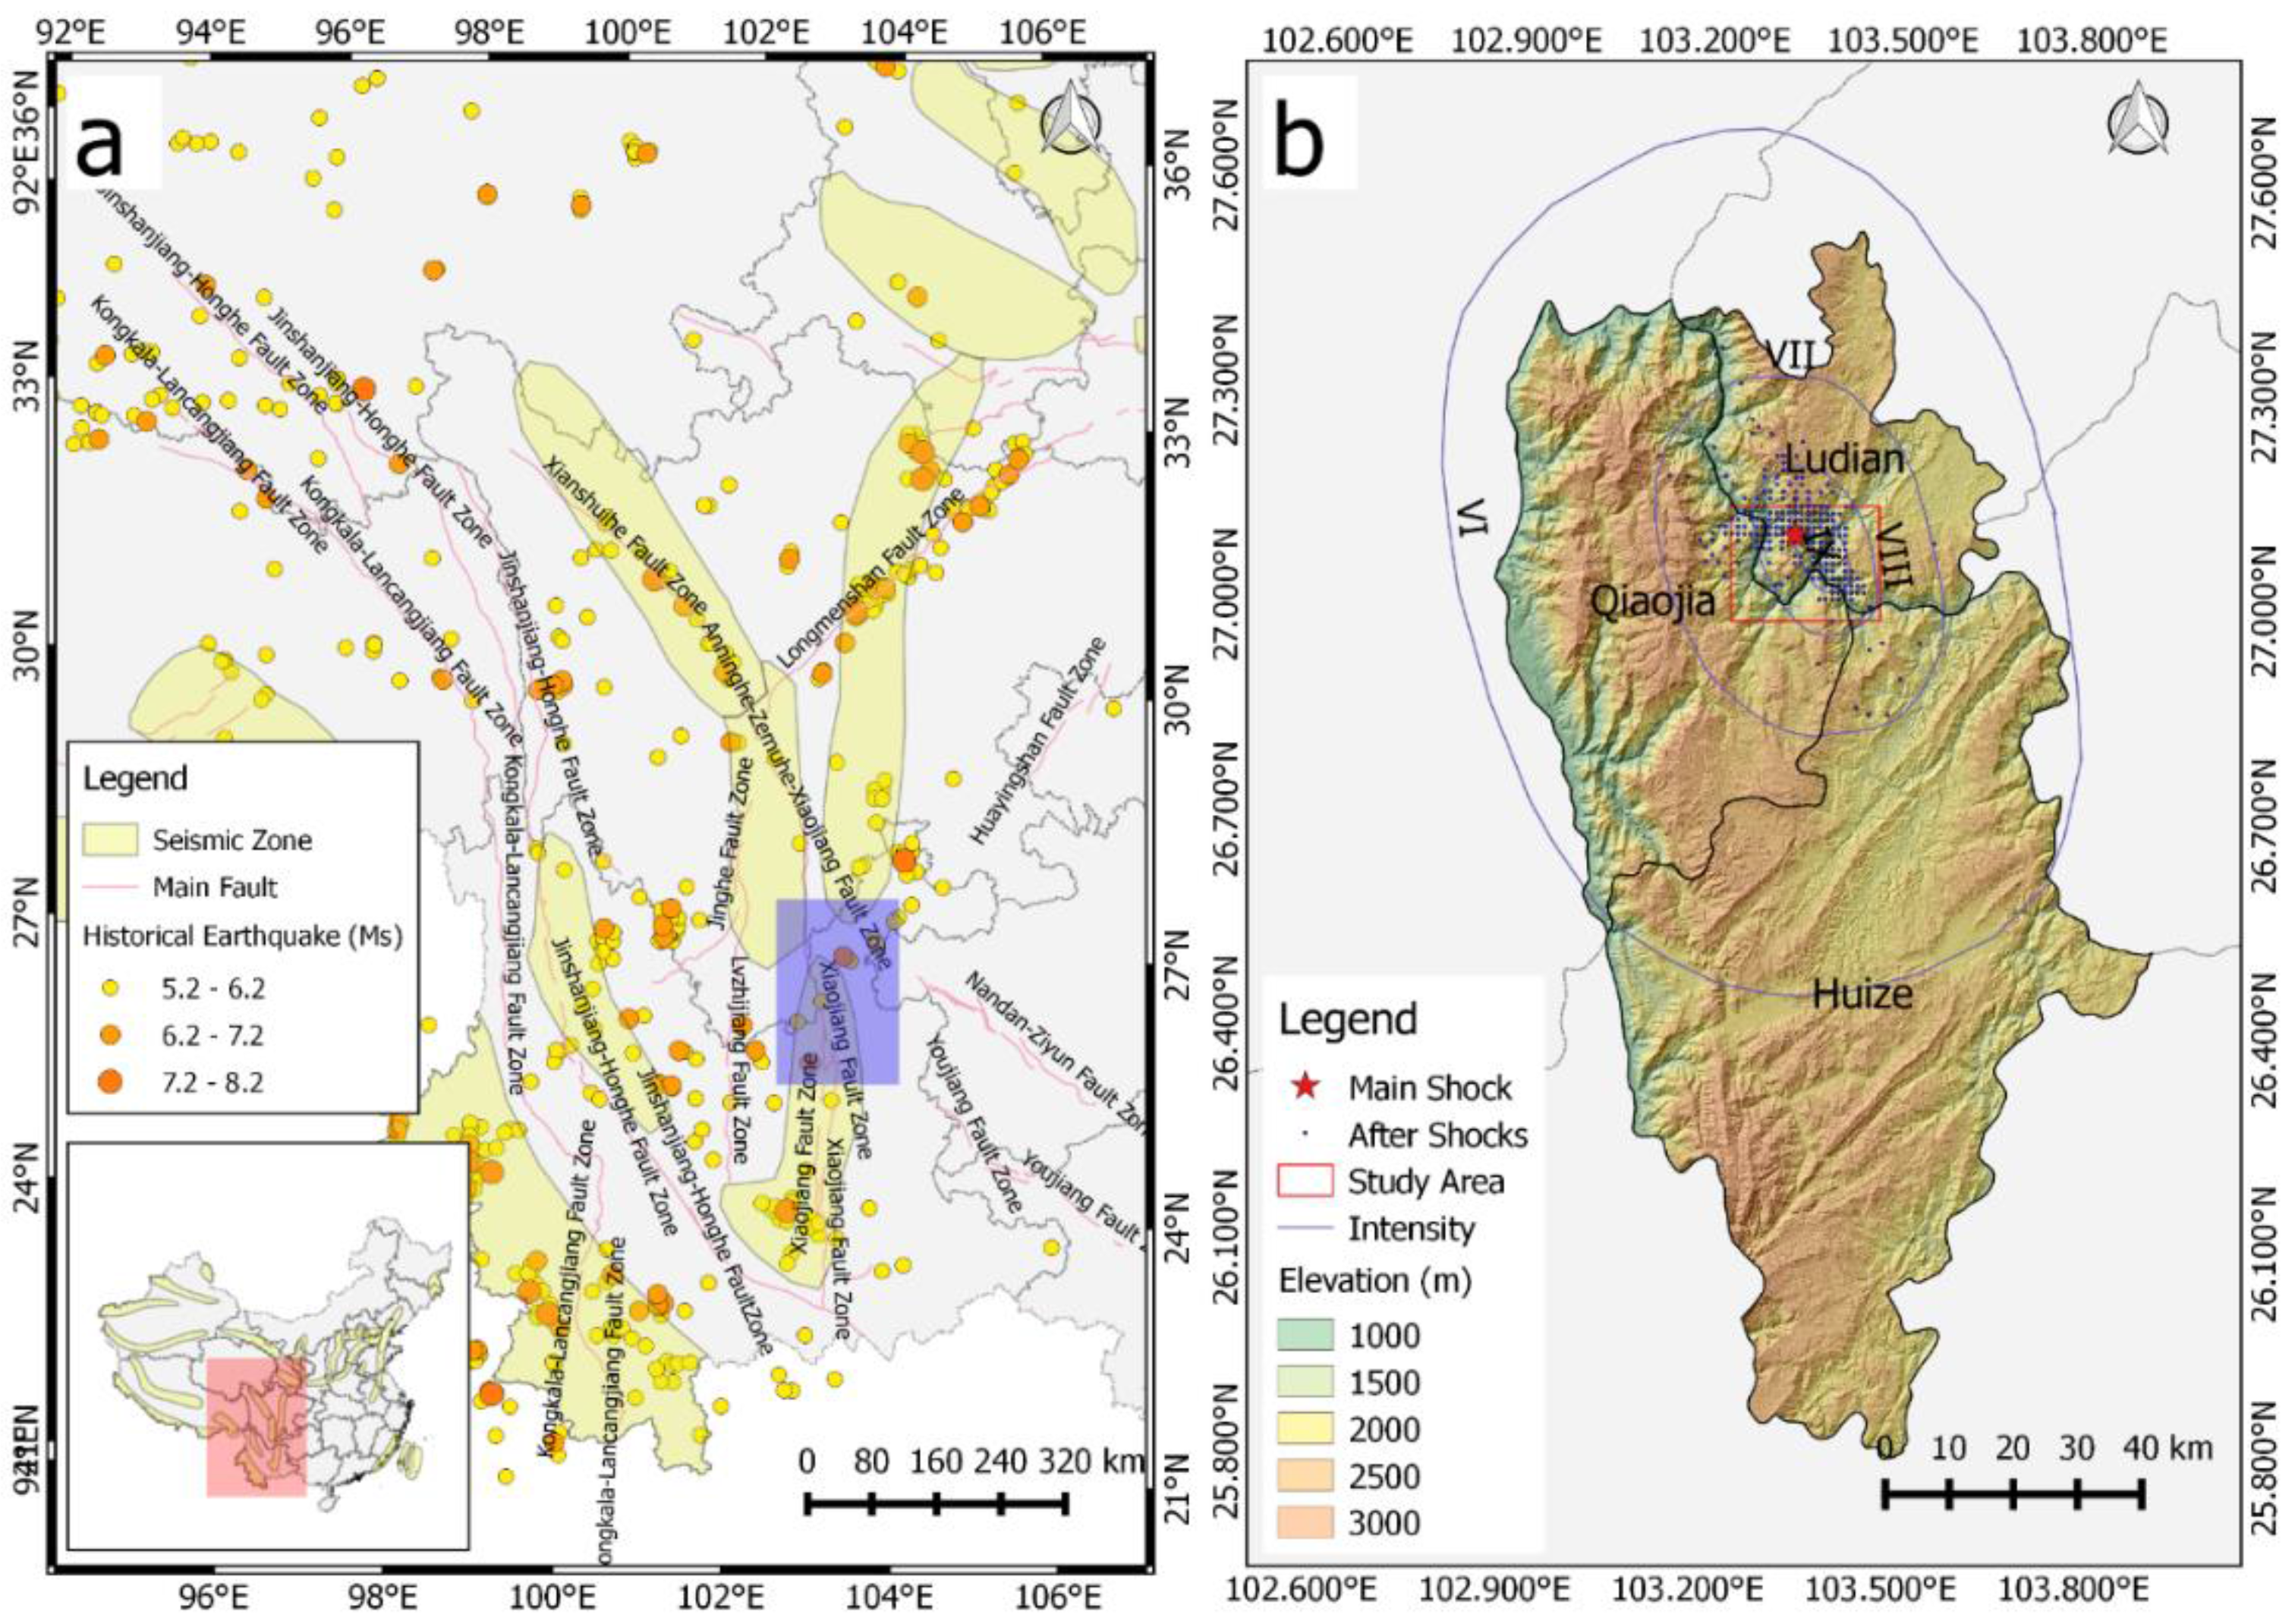
2. Regional Tectonic Background and Seismicity
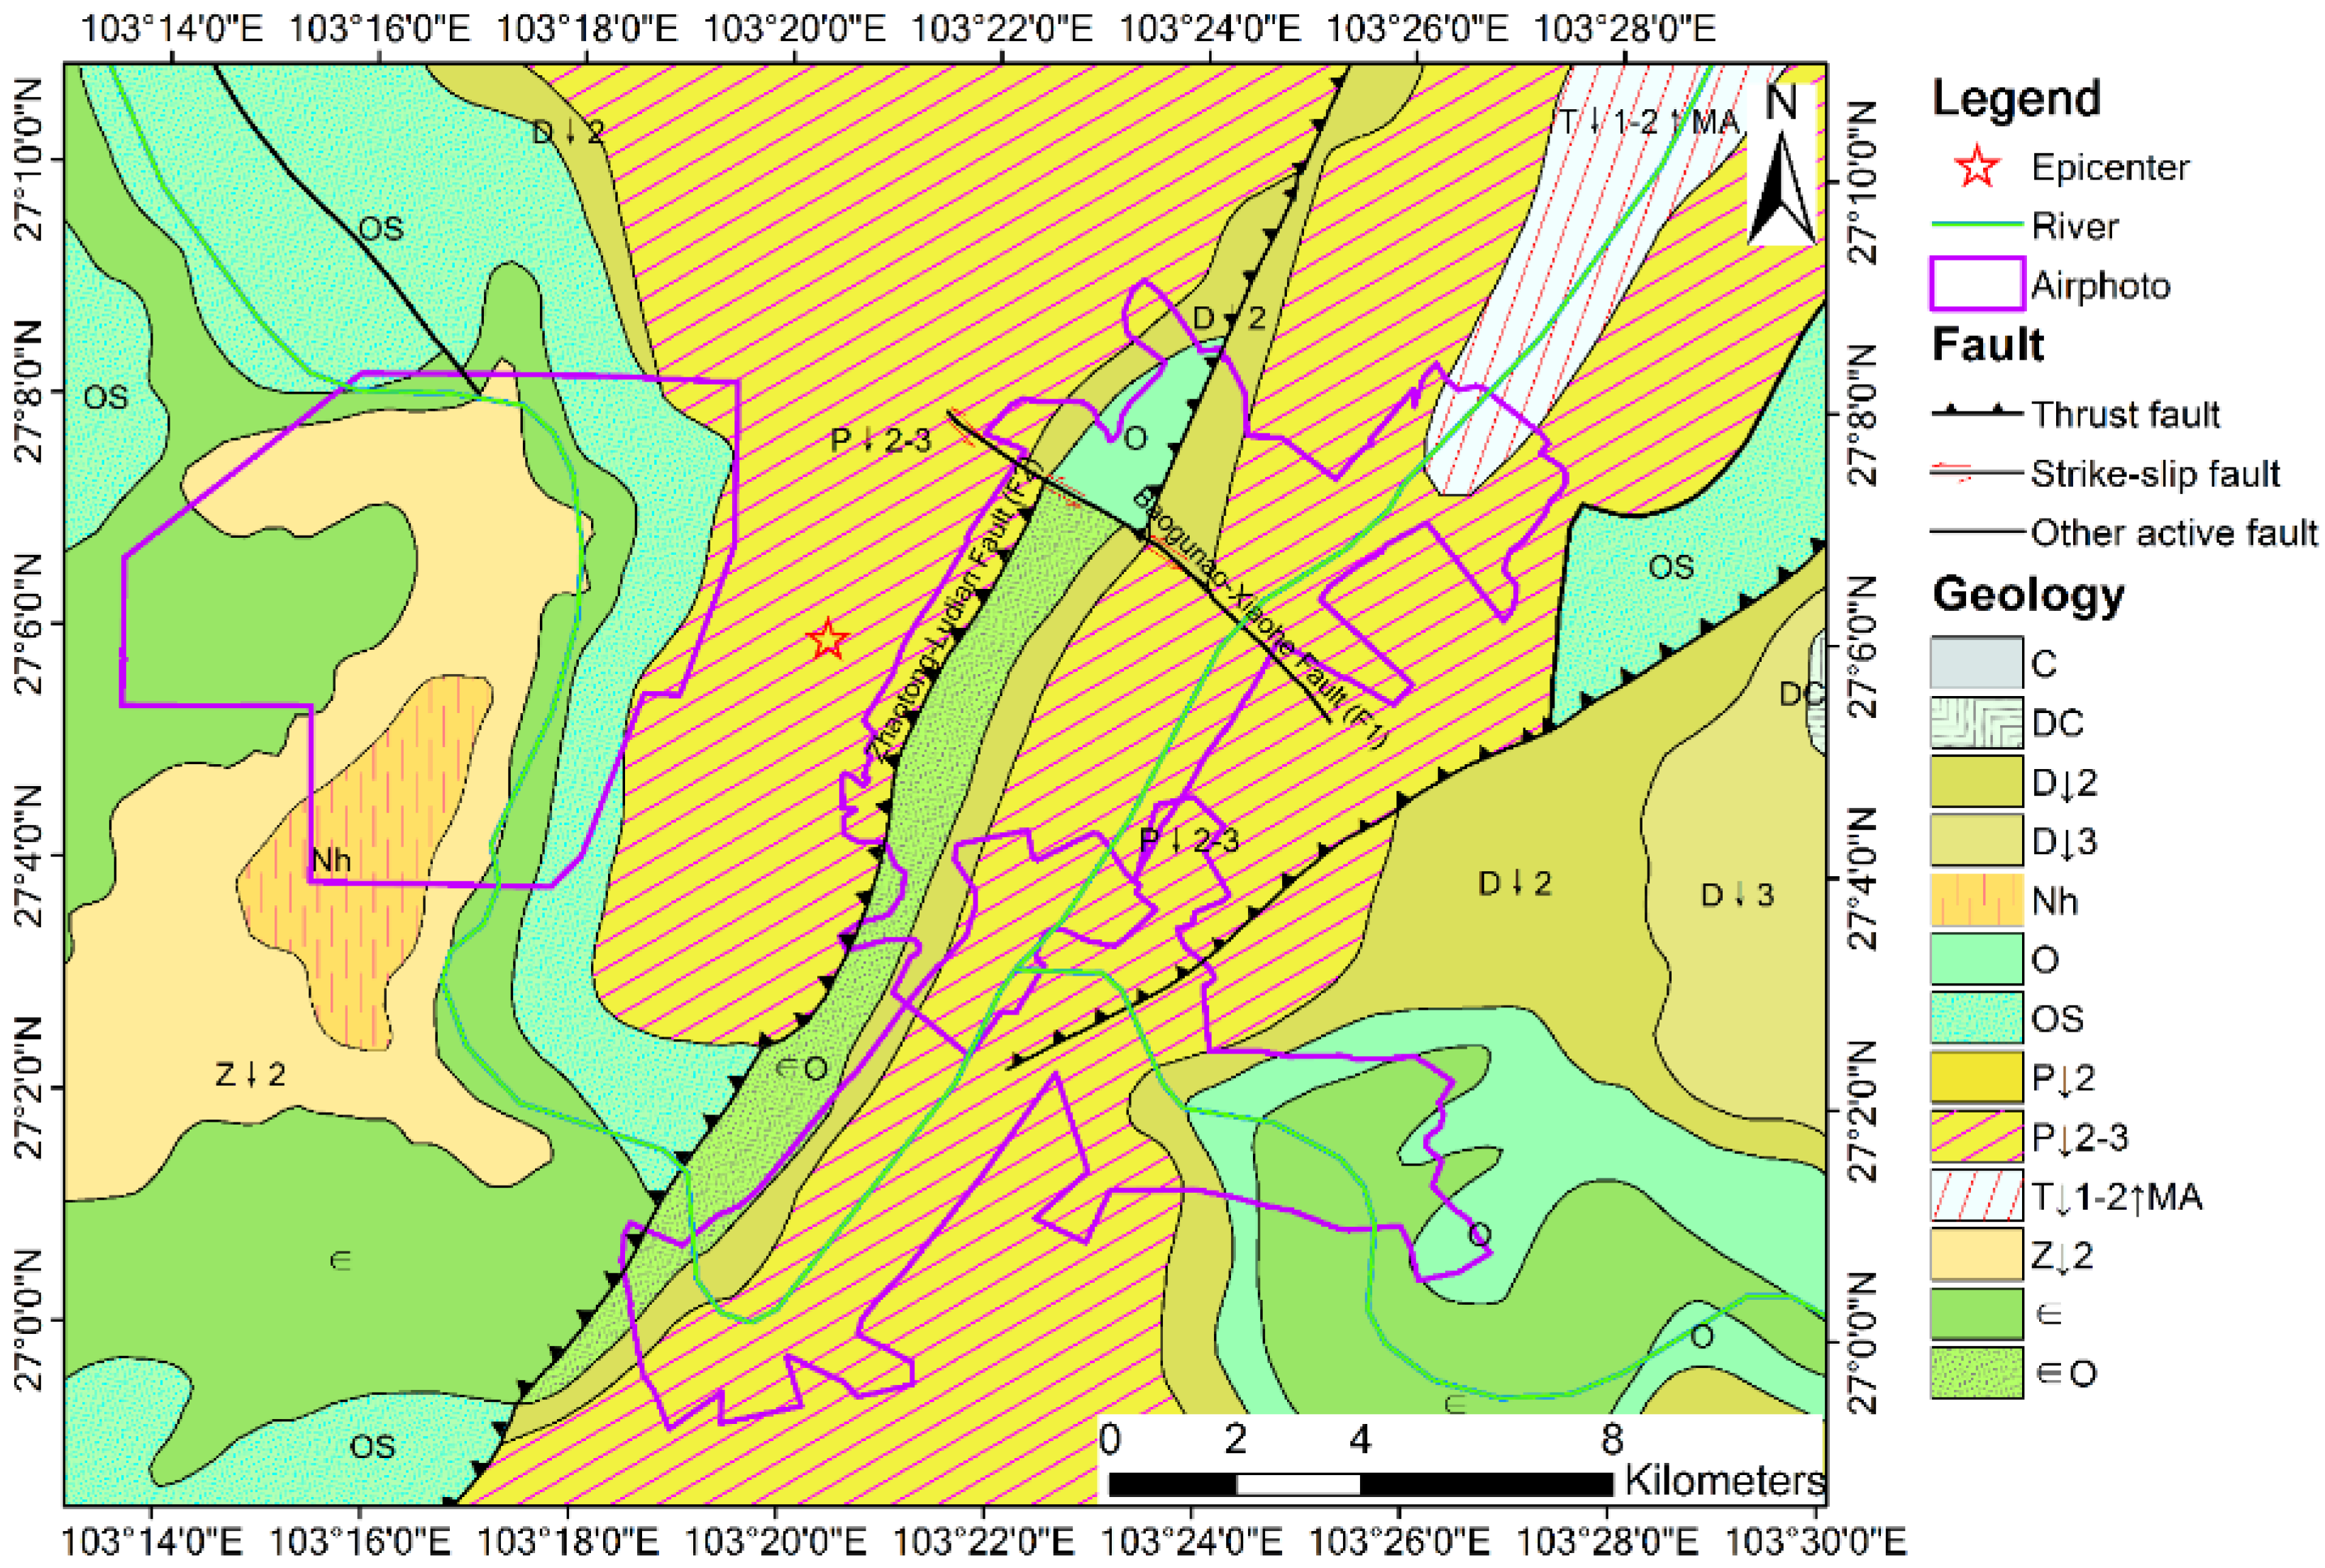
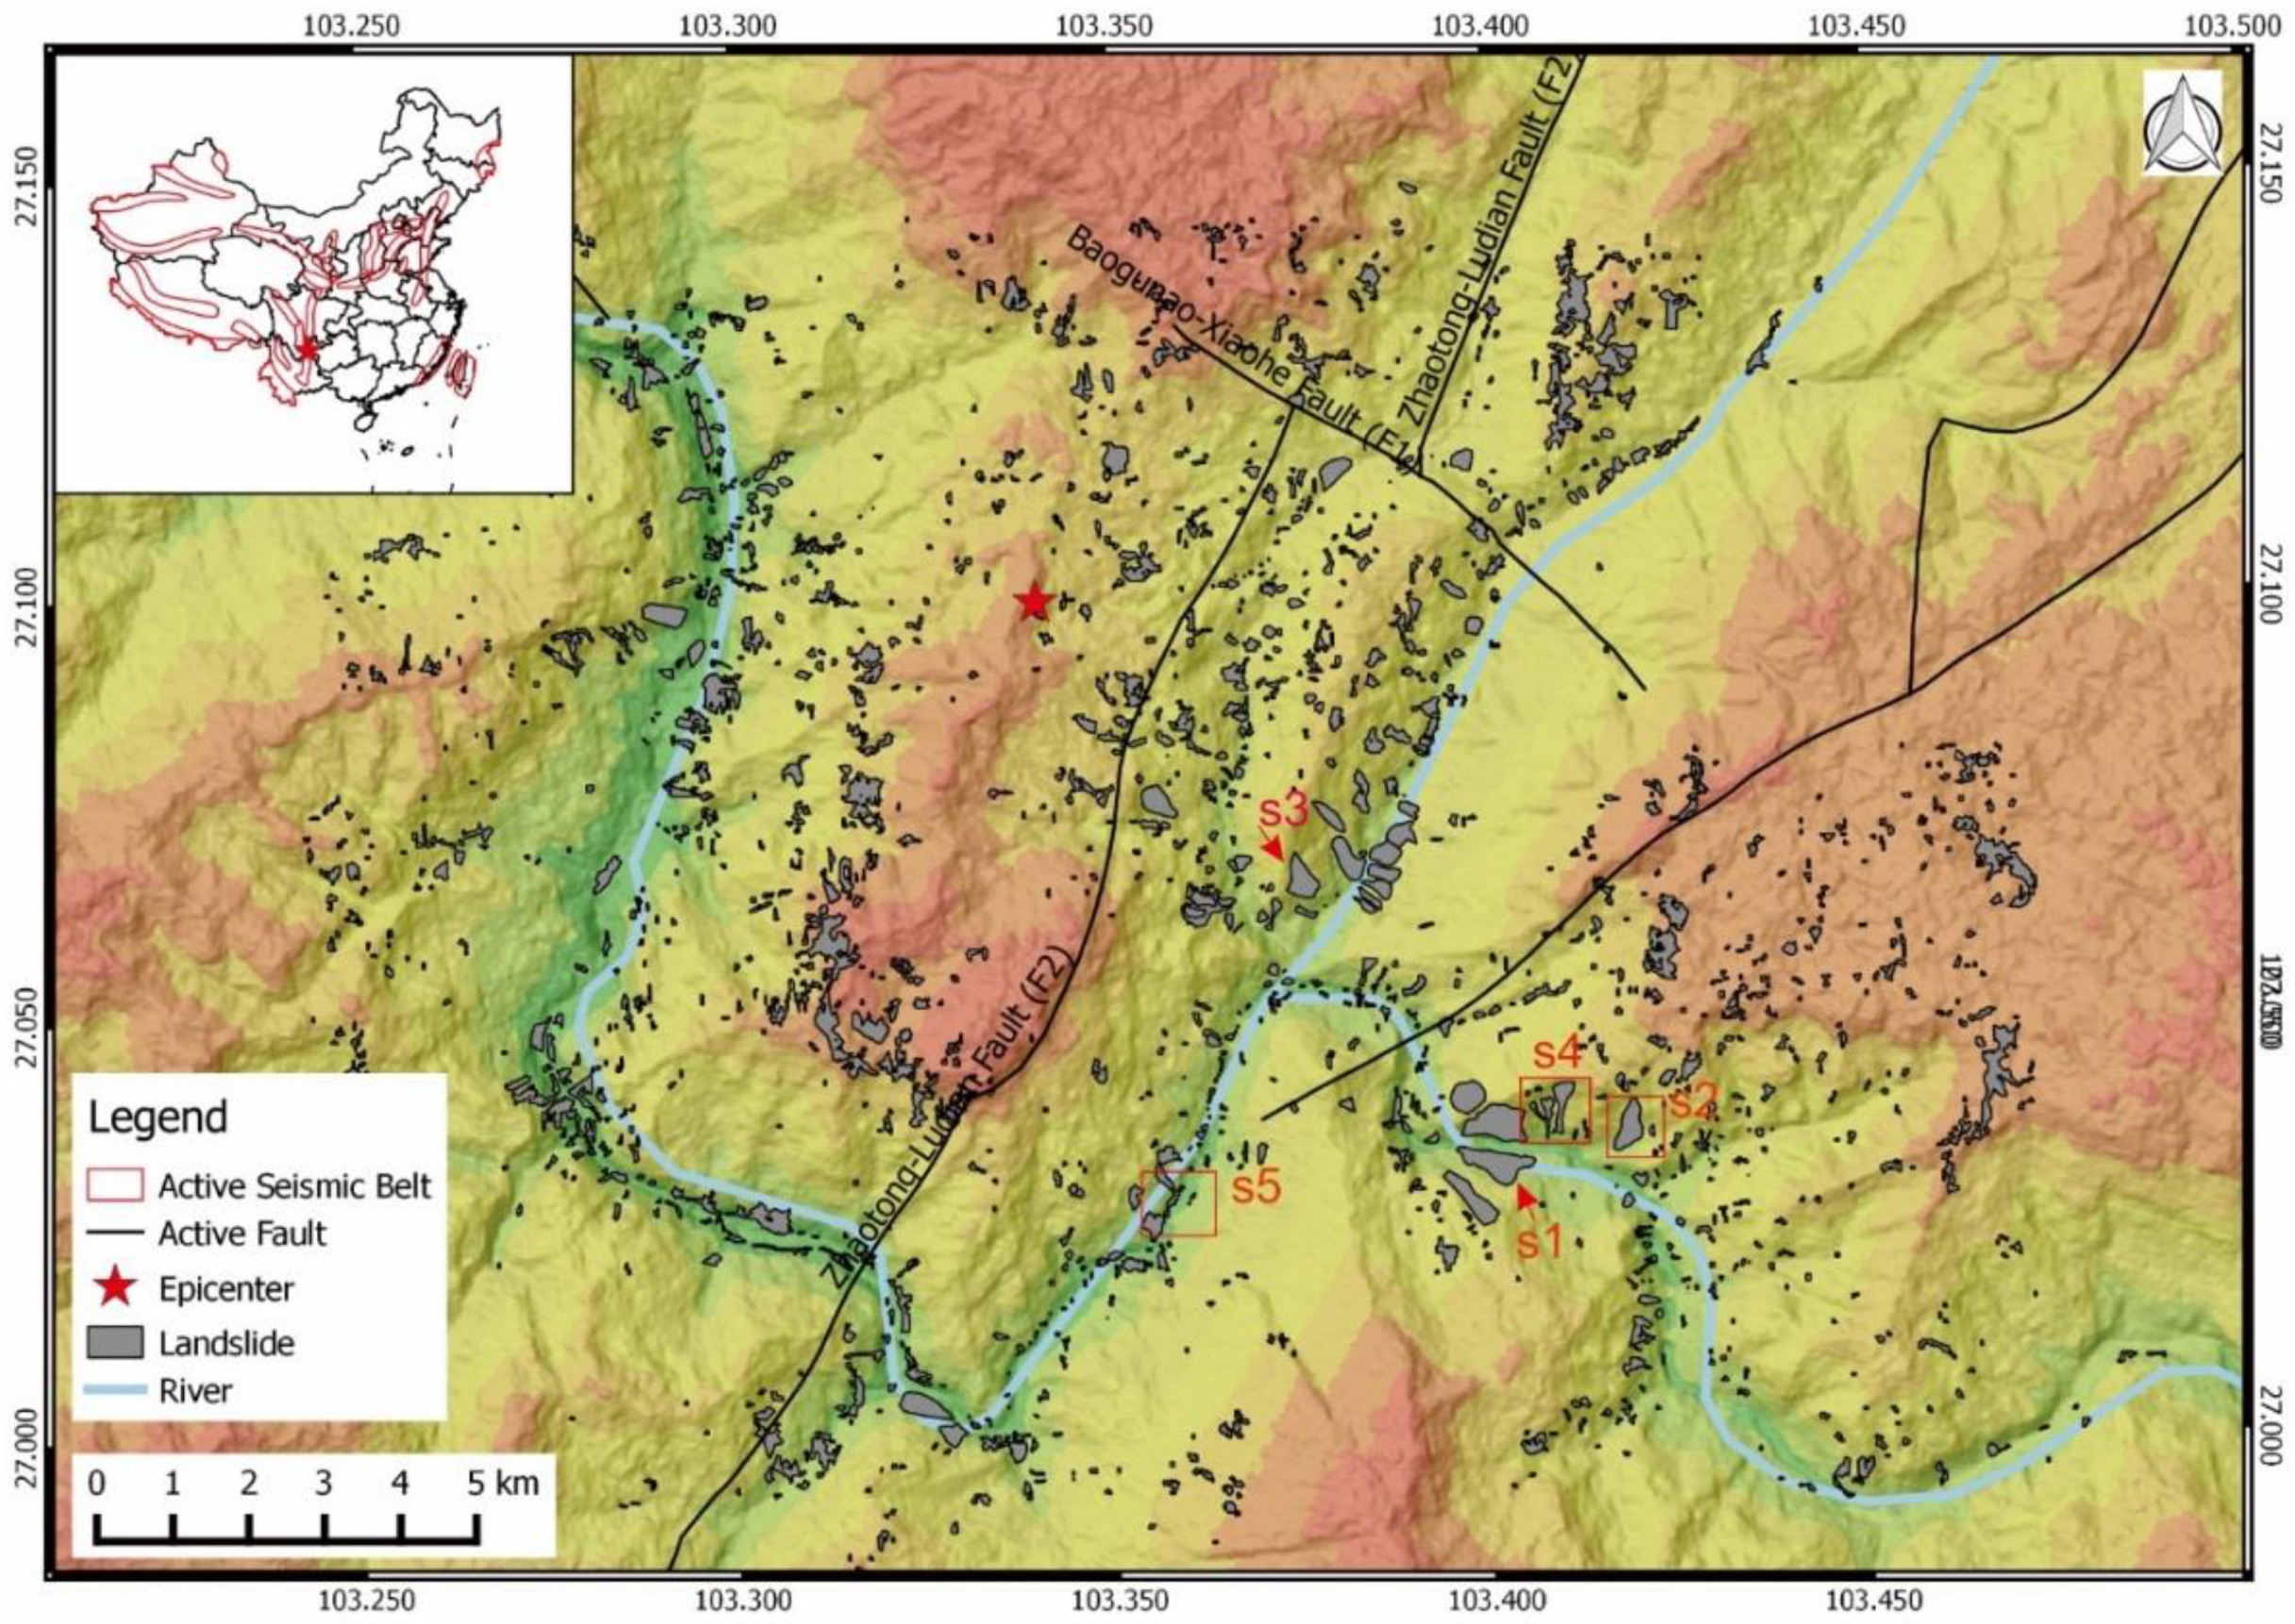
The Ludian earthquake happened at the Baogunao-Xiaohe fault, one of the secondary faults of the Anninghe-Zemuhe-Xiaojiang fault zone, located at the eastern margin of the Qinghai-Tibet Plateau. Active faults are widely distributed throughout this area. A “Y” shaped joint zone composed of the Xianshuihe fault zone, Longmenshan fault zone and Anninghe-Zemuhe-Xiaojiang fault zone dominates the tectonics in this area (Figure 1a) [26]. Within the Anninghe-Zemuhe-Xiaojiang fault zone, there are many right-lateral strike-slip faults trending from NE to SW.
The Anninghe-Zemuhe-Xiaojiang fault zone has been active since 500–600 million years ago, and its activity has induced very frequent seismicity in recent years. As indicated in Figure 1a and Table 1, 14 historical earthquakes of magnitude greater than Ms 5.7 around the Ludian area have been documented since 1970 according to China Earthquake Data Center (CEDA) [27]. Eleven of these earthquakes were greater than Ms 7.0. All of these earthquakes induced a large number of landslides in or around this area. For instance, the great Wenchuan Earthquake in Sichuan province not only caused more than 15,000 landslides distributed within an area of 110,000 km2 [9], it also triggered some huge landslides along the seismogenic faults. For instance, the Daguangbao landslide with an estimated volume of 750 million m3 was the largest one ever in Asia [28]. Similarly, the Longling earthquake containing two main shocks with magnitude of 7.3 and 7.4 also triggered many landslides, distributed within a large area in groups [23]. Even though the epicenter intensity varied with earthquake magnitude, these event inventories showed that earthquake-induced landslides preferably occurred within areas of seismic intensity VII or greater [23]. Note that there are no detailed landslide inventories related to these earthquakes. An empirical estimation of the area affected by earthquake-induced landslides will be discussed in Section 4.

3. Study Area

Earthquake-induced landslides usually distribute in a broad area [4]. The Ludian earthquake happened in a mountainous area; thus, many landslides triggered during this earthquake could not be reached through field investigation. It was thus very difficult to produce a comprehensive inventory of earthquake-induced landslides for the whole coseismic landslide affected area. A rectangular area around the epicenter with a seismic intensity IX and VIII scaled by CEA (Figure 1b) was chosen for this study, although landslides triggered by this earthquake might occur outside of our study area. We assume most of the landslides occurred within this area, according to the combined results of interpretation produced by CEA [2], our investigations, and an empirical upper boundary estimation of co-seismic landslide distribution area proposed by [4].
The study area is characterized by mountainous terrain and elevation difference. Elevation in the study area ranges from 500 to 3900 m above the sea. The main river, Niulan River, passes through the study area from the southeast (SE) to the northwest (NW), while the Shaba River goes from Northeast (NE) to Southwest (SW). Along the rivers, many lower to higher terraces are developed (Figure 2). Geologic composition of the study area varies in age from Cambrian to Ordovician and includes sedimentary, igneous, and metamorphic rocks and unconsolidated lithological units (Figure 2 and Table 2). Steep river valleys, mountainous terrain, widespread thick and loose sediment and highly fractured rocks contributed greatly to landslides during the earthquake.
The main active faults within the study area are the NE–SW striking Zhaotong-Ludian fault and SE–NW striking Baogunao-Xiaohe fault (Figure 2). The Baogunao-Xiaohe fault is one of the secondary strike-slip faults of the Zhaotong-Ludian fault [29]. There was no obvious surface rupture found during post-earthquake field investigations. Right after the earthquake, there were some controversies surrounding the seismogenic fault between Zhaotong-Ludian fault [29] and Baogunao-Xiaohe fault [30]. However, several inversions for this earthquake were carried out based on focal mechanism solution, aftershock distribution and regional seismotectonic environment [29,30]. Results of these inversions suggested that the Ludian earthquake was caused by a left-lateral strike-slip fault trending NW. As of 10 August 2014, the CEDA recorded more than 800 shocks [27]. The main shock was Ms 6.6, and four of the aftershocks were Ms 4.0 and Ms 4.9 (Table 3). Plane distribution of these aftershocks was consistent with the Baogunao-Xiaohe fault strike (Figure 1b).

4. Material and Methods

4.1. Data

In this study, several types of data were gathered for analysis, including remote-sensing images, topographic data, geological data and seismic data. Remote-sensing data included satellite images and high-resolution aerial photos covering the study area. Topographic data were the digital elevation model (DEM) and its derivations, such as slope gradient, aspect and elevation. Geologic data contained regional faults and strata units. Seismic data included the geometry of the co-seismic fault, epicenter locations, seismic intensity, etc. All data were imported into ArcGIS 9.3 for analysis.
Pre- and post-earthquake images of Landsat-8 were downloaded from the United States Geology Survey (USGS) [31]. Due to the resolution limitation of Landsat-8 (15 m for the panchromatic band), they cannot be used for small landslide interpretation. Therefore, we also downloaded aerial photographs covering three serious-damaged sub-regions that were taken right after the earthquake by the National Geographic Information Bureau of Surveying and Mapping (NGIBSM) of China. These aerial photographs had a high-resolution of 0.2 m.
Digital elevation model (DEM) was extracted from ASTER Global Digital Elevation Model (ASTER GDEM) Version 2 [32] with 30 m posting interval to facilitate the subsequent landslide spatial analysis. A series of topographic factor layers such as slope gradient, slope orientation and elevation were then derived from the DEM. Geological data of the study area were provided by the National Geology Archive of China (NGAC) [33].

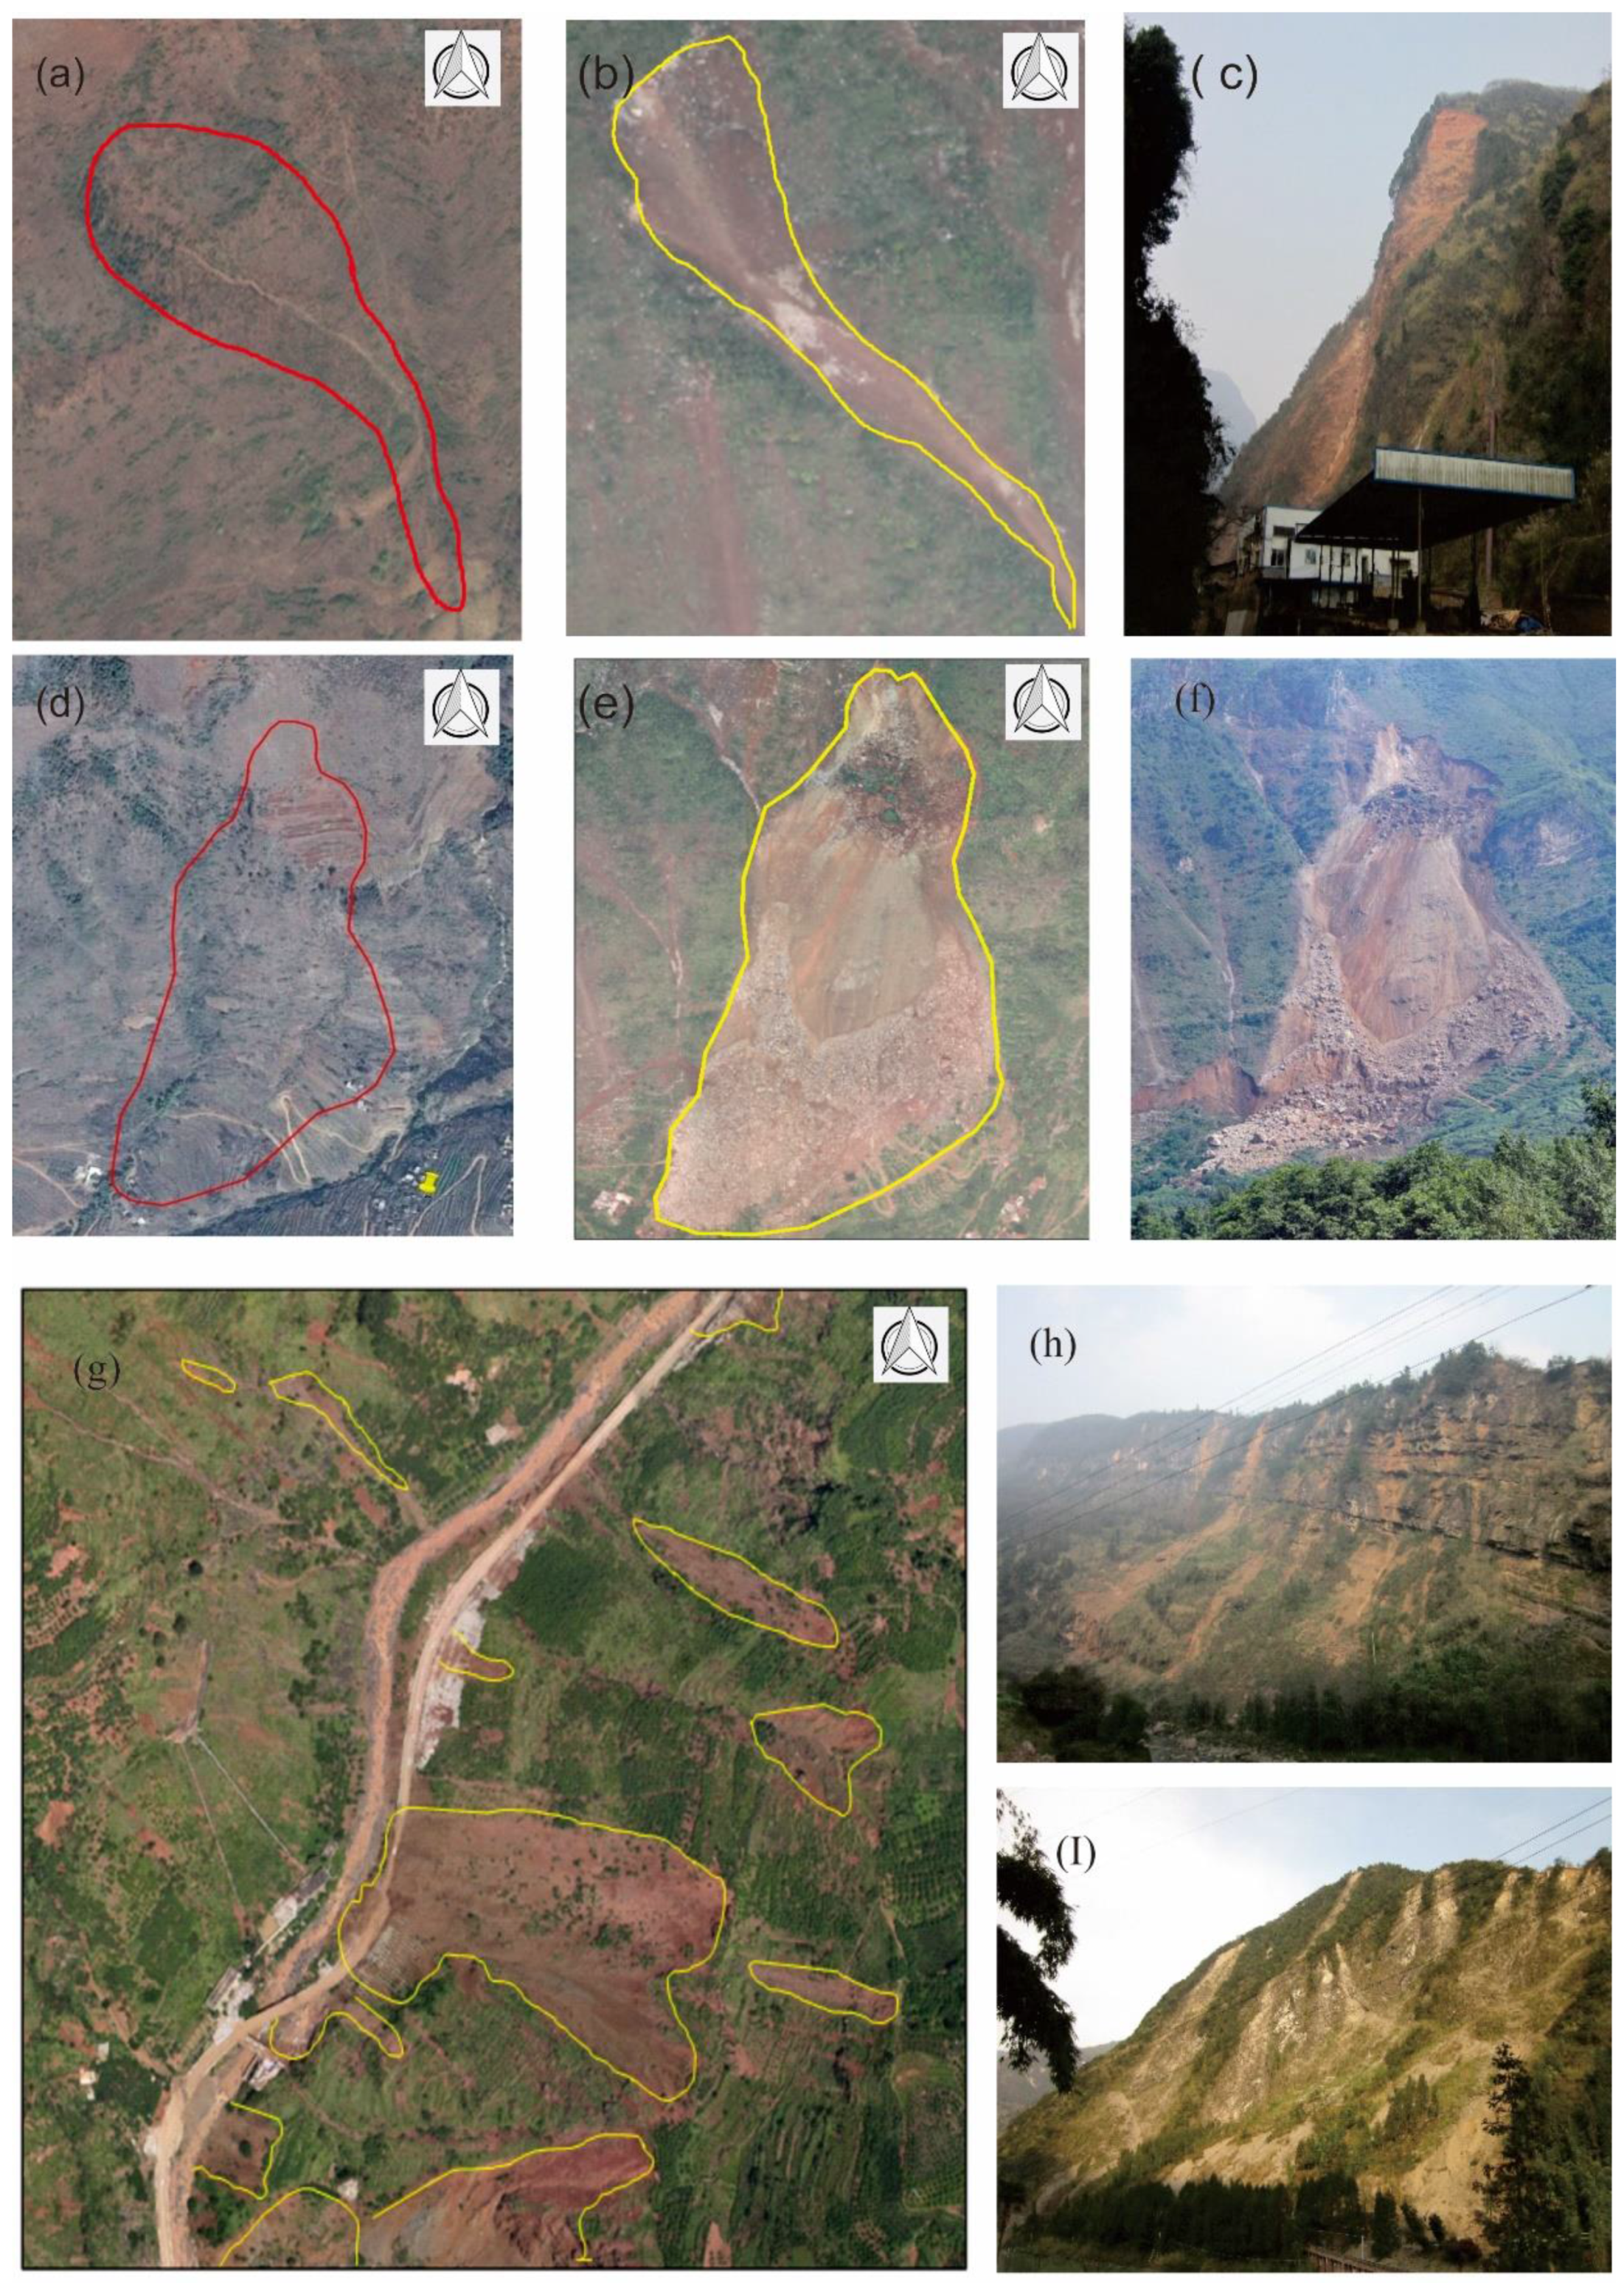
4.2. Visual Interpretation of Landslides

In this study, landslides related to the Ludian earthquake were visually interpreted in the Geographic Information System (GIS) environment. To avoid any subjectivity when visually recognizing landslides on the digital images, some criteria should be pre-determined. In this study, we followed several principles for landslide visual interpretation: (i) all landslides that can be recognized in the images should be mapped; (ii) both landslide boundaries and the positions of landslide source area should be mapped; (iii) landslide complexes should be divided into individual ones; and (iv) any landslides that happened before the earthquake should be excluded. Additionally, since aerial photos did not wholly cover the study area, landslides within no aerial photo coverage area were interpreted from post-event Landsat-8 images. Due to the resolution limitation of Landsat-8 image mentioned before, small landslides (coverage less than 1 pixel in length or width) were omitted in these areas. Based on the principles above, the following criteria were used during landslide visual interpretation processes: (i) if a landslide did not exist on the pre-earthquake image but does exist on post-earthquake images, it is considered a co-seismic landslide; (ii) if a landslide exists on both pre- and post-earthquake images and shows the same morphology and texture, it is considered a pre-earthquake landslide not triggered by the Ludian earthquake; and (iii) since the aerial photographs had a high-resolution of 0.2 m, while Landsat-8 had a resolution of 15 m for panchromatic band, small landslides (coverage less than 1 pixel in length or width) were omitted in the area with non-coverage of aerial photos.
The visual interpretation procedures including the following six sequential steps: (i) Acquisition and pre-process of images of the study area, including system calibration, ortho-rectification, geometric correction, and image fusion. (ii) The geometrically corrected fusion images were then imported into ArcGIS 9.3 software and were specified as the based map. (iii) An empty ArcGIS shapefile layer with the same coordinate system as the base map was created for the storage of landslides. (iv) Pre-event satellite images of the study area were geometrically rectified and matched as a contrast showing the pre-earthquake conditions. (v) Three experts in earthquakes and geo-hazards were called upon to visually interpret the co-seismic location according to their experiences and knowledge. The location and boundaries of the interpreted landslides were delineated on the images and stored as ArcGIS shapefile features. Finally (vi), inventory maps of landslides produced by three experts were cross-validated to reduce the subjectivities and errors.
Because it was the summer when the earthquake occurred, triggered landslides could easily be recognized according to landslide scars and vegetation change. Fresh soil or bare rock is exposed after a landslide event, giving bright appearance to landslide-affected areas in an image. This characteristic of a new landslide can be well captured by aerial photos taken right after a landslide and is used as key markers for landslide identification during visual interpretation. Although it was not possible to carry out detailed field reconnaissance on every landslide triggered by the earthquake, field reconnaissance of a few co-seismic landslides was conducted to identify the types of landslides and check the materials involved. Interpretation and field investigation results of some landslides are introduced in the Results Section.

4.3. Analysis of Co-Seismic Landslide Controlling Factors’ Influence

The distribution of co-seismic landslides was considered to be related to topographic, geologic, and earthquake factors. For the Ludian earthquake-triggered landslides, the correlations of the landslides with controlling factors were performed using three indexes: landslide number (LN); the landslide area ratio (LAR), expressed as a percentage of landslide area within the area affected by landslide activity; and the landslide density (LD), calculated as the number of landslides per square kilometer. Six co-seismic landslide-controlling factors were selected, including three topographic factors (elevation, slope angle and slope aspect), one geological factor (lithology), and two earthquake factors (distance from the epicenter and distance from the active faults).

5. Results and Discussions

5.1. Landslide Inventory

The proposed landslide inventory contained 1826 landslides, distributed unevenly within an elliptical area of 735 square kilometers (Figure 3). The total area of these mapped landslides was 19.12 km2. Accordingly, the LAR was (19.12 km2/735 km2) × 100% = 2.62% and LD was 1826 landslides/735 km2 = 2.48 landslides/km2. Area of these mapped landslides ranges from 76 m2 to 0.45 km2. As indicated in Figure 4a, 368 of these mapped landslides are greater than 10,000 m2 and 76 huge landslides had areas greater than 50,000 m2. Most of the large landslides occurred in the southeast of the epicenter and near the active fault or riverbank (Figure 5b). Only 111 landslides (6.08%) of the landslides were less than 1000 m2 in area.
Following previous classification criterion [4] and in combination with our analysis results and field investigations, landslides triggered by the Ludian earthquake can be categorized as: rock and soil falls, rock avalanches and widely-spread shallow landslides.
Falls usually are surficial in nature and normally associated with first or second order drainage. They generally have very small width in comparison to their length. Therefore, the length/width ratio is high and distance of the median line to the landslide periphery is very low (Figure 5a,b). Rock falls were very common in the study area because there are many steep natural and cut slopes in the study area that are composed of weathered soil or heavily fractured rocks, and are thus very susceptible to seismic-shaking failure (Figure 5a–c). Volumes of these falls vary substantially from single rocks or clumps of soil to massive blocks thousands of cubic meters in size.
A rock avalanche refers to a complex movement of rocks and involves sliding and/or fluid-like flow. Rock avalanches are characterized by large volume, high speed and long run-out distance [4]; consequently, resulting in serious hazards. The source area of a rock avalanche is a rock outcrop and the slope is generally steep. On the one hand, a large avalanche shows an abrupt change in slope morphology, i.e., concavity in the source area and convexity in the deposit area. The crown shape is arcuate and located on or adjacent to the bedrock. In addition, visible cracks can be identified at the start point of a rock avalanche. On the other hand, it is very difficult to distinguish the source and deposit part of deep-seated or large complex slope movements. The boundary between the stable terrain and the failed mass are often transitional. Movement of a rock avalanche down the slope along a planar or undulating surface of rupture. The Ludian earthquake triggered many large landslides, of which the largest three are: Hongshiyan landslide (27°02′17″N, 103°24′00″E) of about 0.4 million square meters, Ganjiazhai landslide (27°04′08″N, 103°22′51″E) of about 0.16 million square meters and Wangjiapo landslide (27°02′20″N, 103°25′07″E) of about 0.18 million square meters (Figure 6d–f). Locations of the three catastrophic landslides are indicated in Figure 3.
Many shallow landslides occurred on both natural and artificial slopes along roads, rivers and valleys. These landslides were mainly composed of loose soil and many of them had a long run-out distance along the slope surface or stream channels. These landslides destroyed the roads and hit cars on the roads, seriously delaying the rescue from outside to the epicenter area. They also ruined the houses and villages in remote mountainous areas. These landslides generally involved failure of the uppermost few decimeters to meters of mass, which cascaded down the steep slopes [18]. At the time of the Ludian earthquake, most slopes were covered by dense vegetation, and these shallow landslides stripped off the dense vegetative cover. Therefore, they could easily be identified on the true-color aerial photographs or satellite images by change of vegetation cover. Two main reasons might account for theses widespread shallow landslides and their long run-out distance. First, after long-term farming, mining, frequent weathering from abundant rainfall and sunshine, the surface composition of these slopes had become very loose. Thus, ground shaking could easily move the topsoil. Second, a rainfall of 63 mm was recorded in the study area from 2–9 August by the National Meteorology Center of China. Saturated mass was then transformed into debris flows in the stream channels and traveled a long distance (Figure 5g–i).

5.2. Analysis of the Landslide Inventory

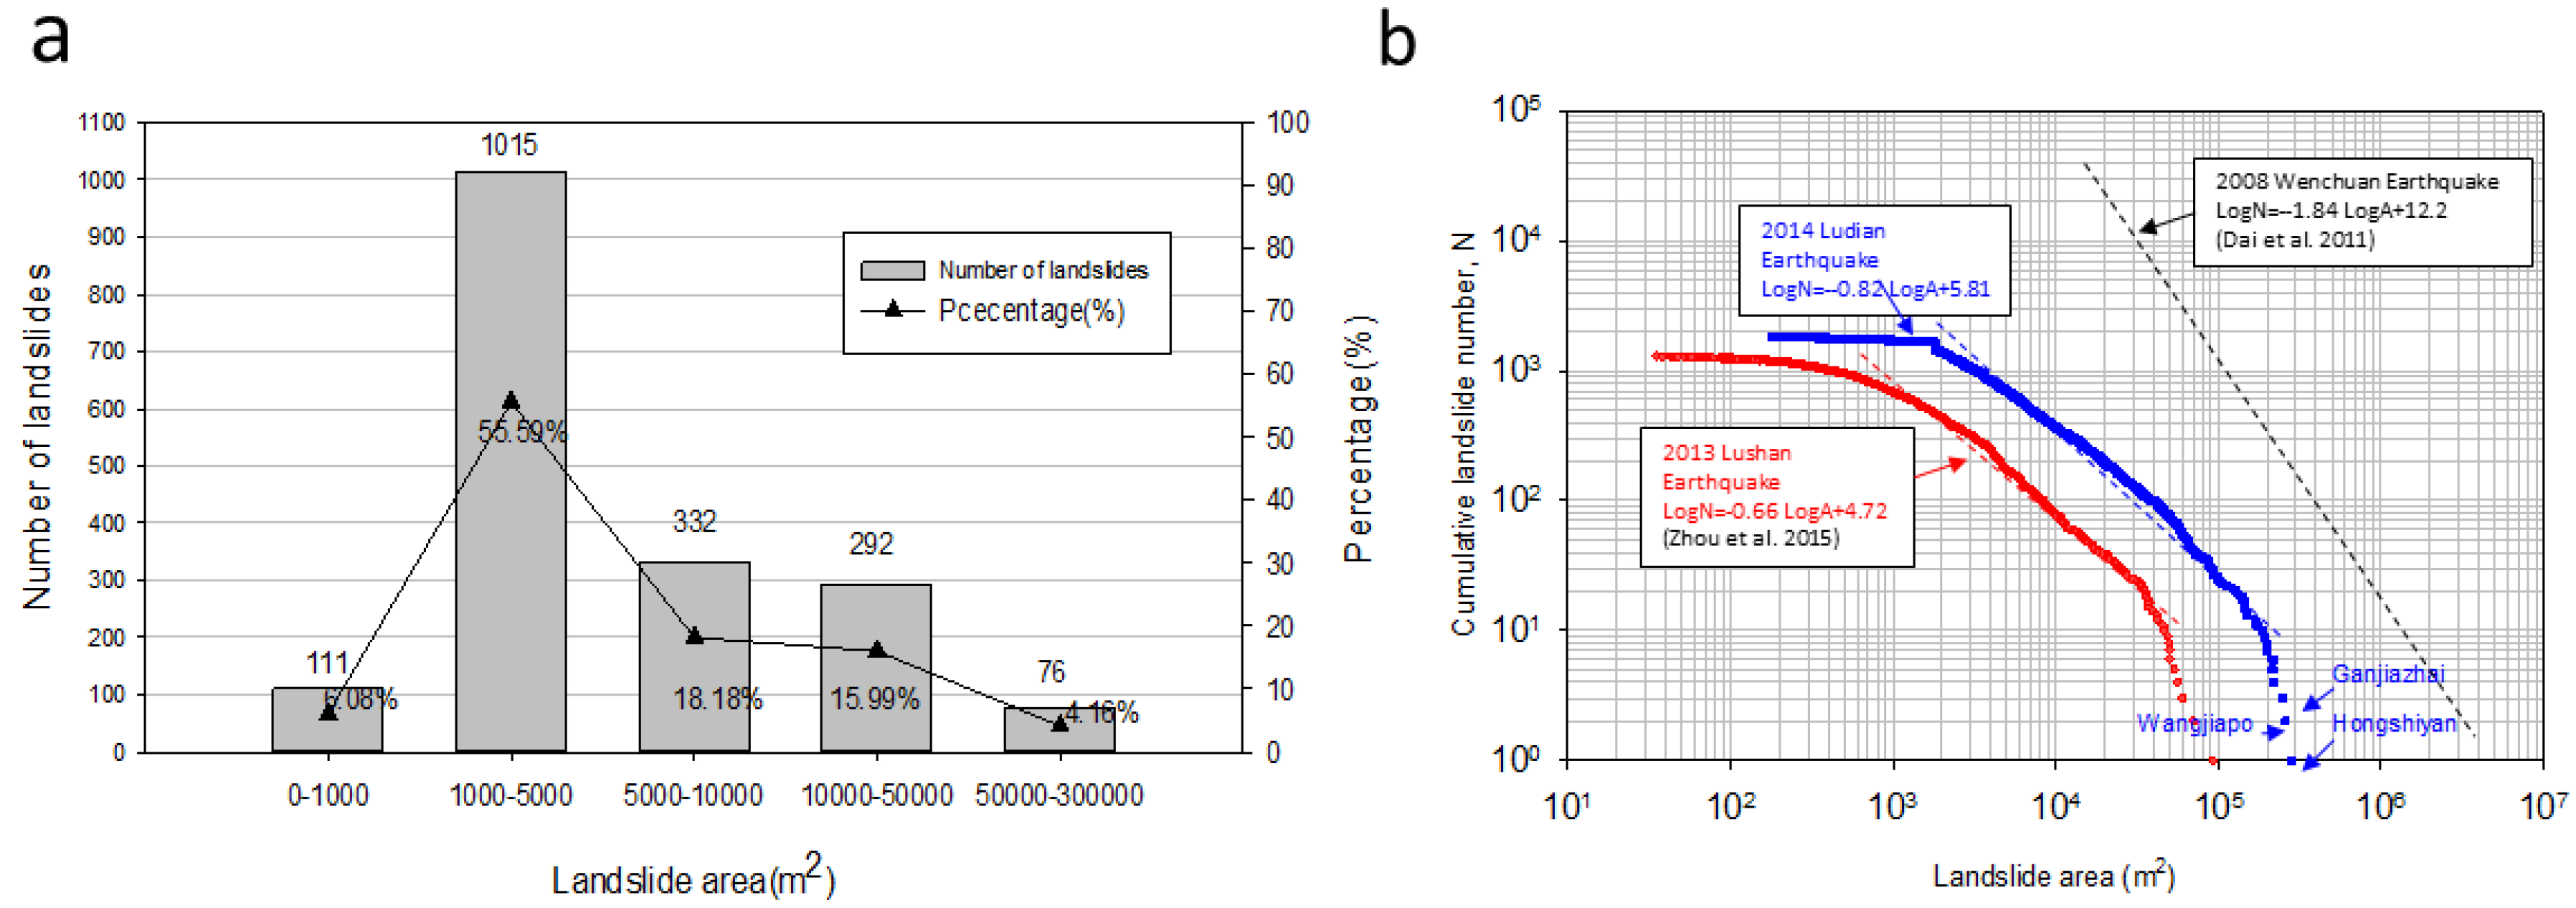
5.2.1. Landslide Size

The frequency-size distribution of landslides is important information to determine landslide hazards and to estimate the contribution of landslides to erosion and sediment yield. Many researchers have examined the frequency-size distribution of landslides induced by different triggers, and consistently noted that the distribution was of a power-law or fractal type. The cumulative number–area relationship for landslides triggered by the earthquake can be represented as the logarithm of the number of landslides with a larger area than a given area A and is linearly related to the area as follows:
log 10 N = a × log 10 A + b
where N is the cumulative number of landslides whose area is larger than or equal to A. a and b are constants. Double-log plot of N and A is shown in Figure 4b. The slope of the power relationship in the linear portion of the curve is determined by linear regression.
The results showed that the few largest landslides and the landslides smaller than 1000 square meters deviated from the linear line on the double-log scale defined by Equation (1), indicating an incompetence of the landslide inventory [34]. Fitting lines for landslides triggered by the 2008 Wenchuan earthquake [34] and the 2013 Lushan earthquake [14] (Location indicated in Figure 1a) were also plotted. All three earthquakes occurred in southwest China in recent years and triggered many landslides. Due to the great magnitude, it was not surprising that the Wenchuan earthquake generated the most landslides and the many of them were extremely large, having volumes of tens of millions of cubic meters. Even though the Ms 6.5 Ludian earthquake was smaller than that of the 2013 Ms 7.0 Lushan earthquake in magnitude [35], it triggered many large landslides, which caused great losses and causalities (Figure 4b), such as the Hongshiyan landslides and Ganjiazhai landslide (Figure 3).

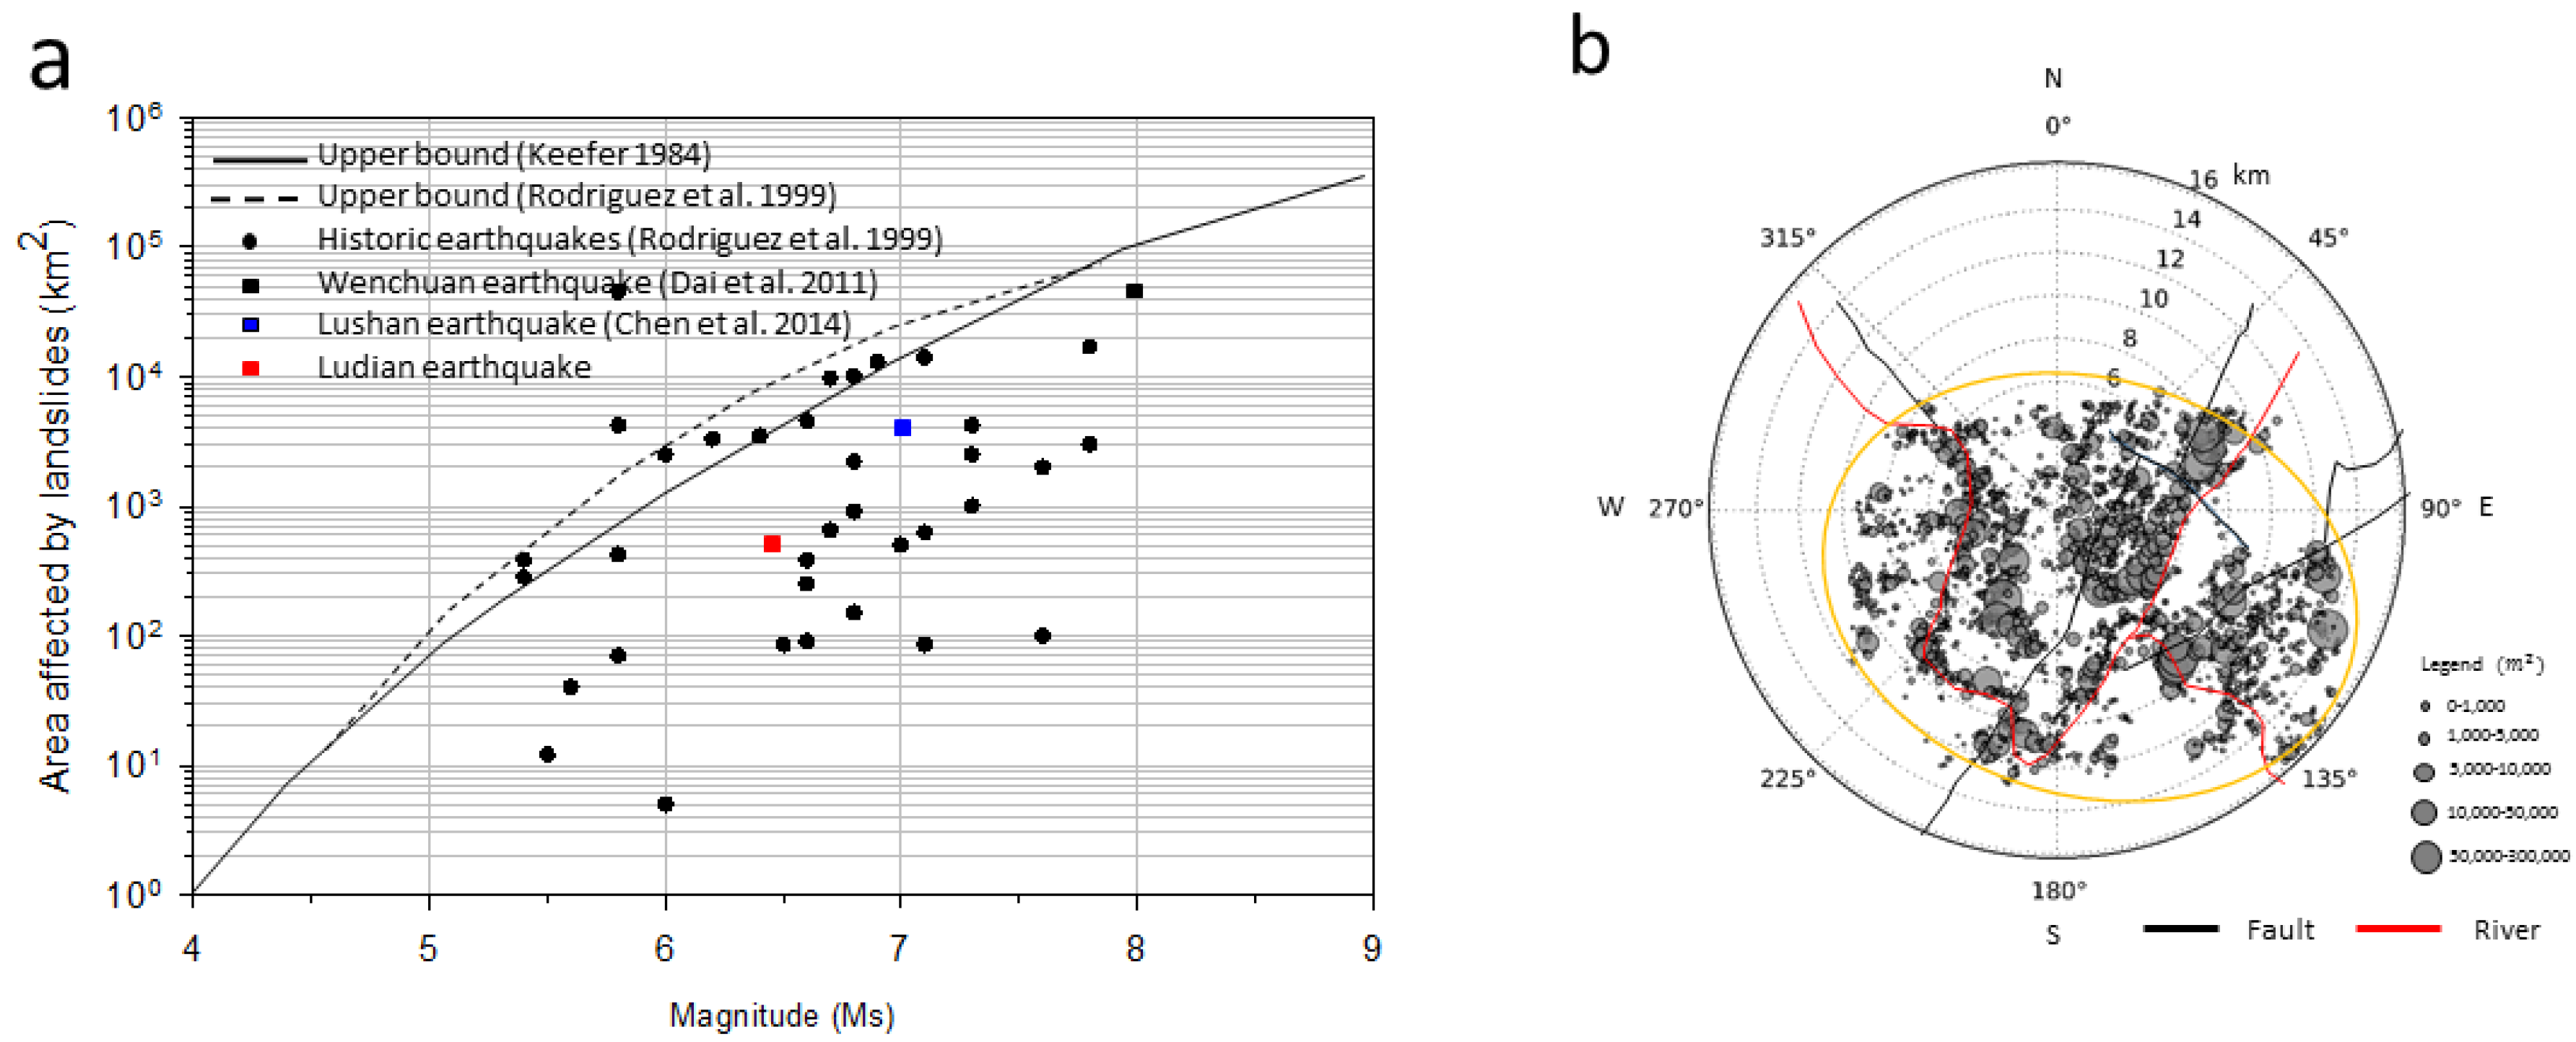
5.2.2. Area Affected by Earthquake-Induced Landslides

The area affected by landslides during an earthquake represents the approximate areal extent that encloses most or almost all landslides triggered by the earthquake. It is difficult to determine the exact extent of such area. However, Keefer (1984) [4] first suggested that the area affected by earthquake-induced landslides can be estimated based on the magnitude of the earthquake. Although it is a bit subjective, this idea has been used for more than 30 years because historical earthquake-induced landslides data are always scarce. Subsequently, least-squares linear regression was used to relate area affected by co-seismic landslides (A) to earthquake magnitude (M) (Equation (2)). Following this idea, the area affected by Ms 6.5 Ludian-earthquake induced landslides fell in the range of 370 km2 to 3235 km2. More recently, Based on observations that earthquake-induced landslides previously occurred within a region with seismic intensity VII or greater in southwest China, Chen et al. [23] used the seismic intensity of VII line to estimate the affected area for historical earthquakes in this area (Table 1). For the Ludian event, the area enclosed by the VII intensity line was 1959 km2, while that enclosed by the VIII intensity line was 374 km2.
log 10 A = M 3.16 ( ± 0.47 )
where A is in square kilometers and M is the magnitude ( 5.5 M 9.2 ). Richter surface-wave magnitude when the magnitude is smaller than 7.5, and M refers to the moment magnitude (Mw) when the magnitude is 7.5 or larger [36].
As indicated in Figure 6a, the total area affected by Ludian earthquake induced landslides was less than the area affected by the 2013 Lushan Earthquake induced landslides (Figure 5a), which had a similar magnitude. This might be related to the rapid attenuation of energy released by the Ludian event as a shallow-focus earthquake. Nevertheless, as mentioned before, the proposed landslide inventory was not regulatory. Limited by the quality and resolution of images and subjectivity of visual interpretations, it is possible that some landslides (especially some small landslides) within the mapped area were not identified or occurred outside the study area. Even though the proposed result showed an acceptable accordance with previous studies, revisions might be made when new information regarding landslides is found, such as newly released images of higher resolution.

5.3. Co-Seismic Landslides Controlling Factors Analysis
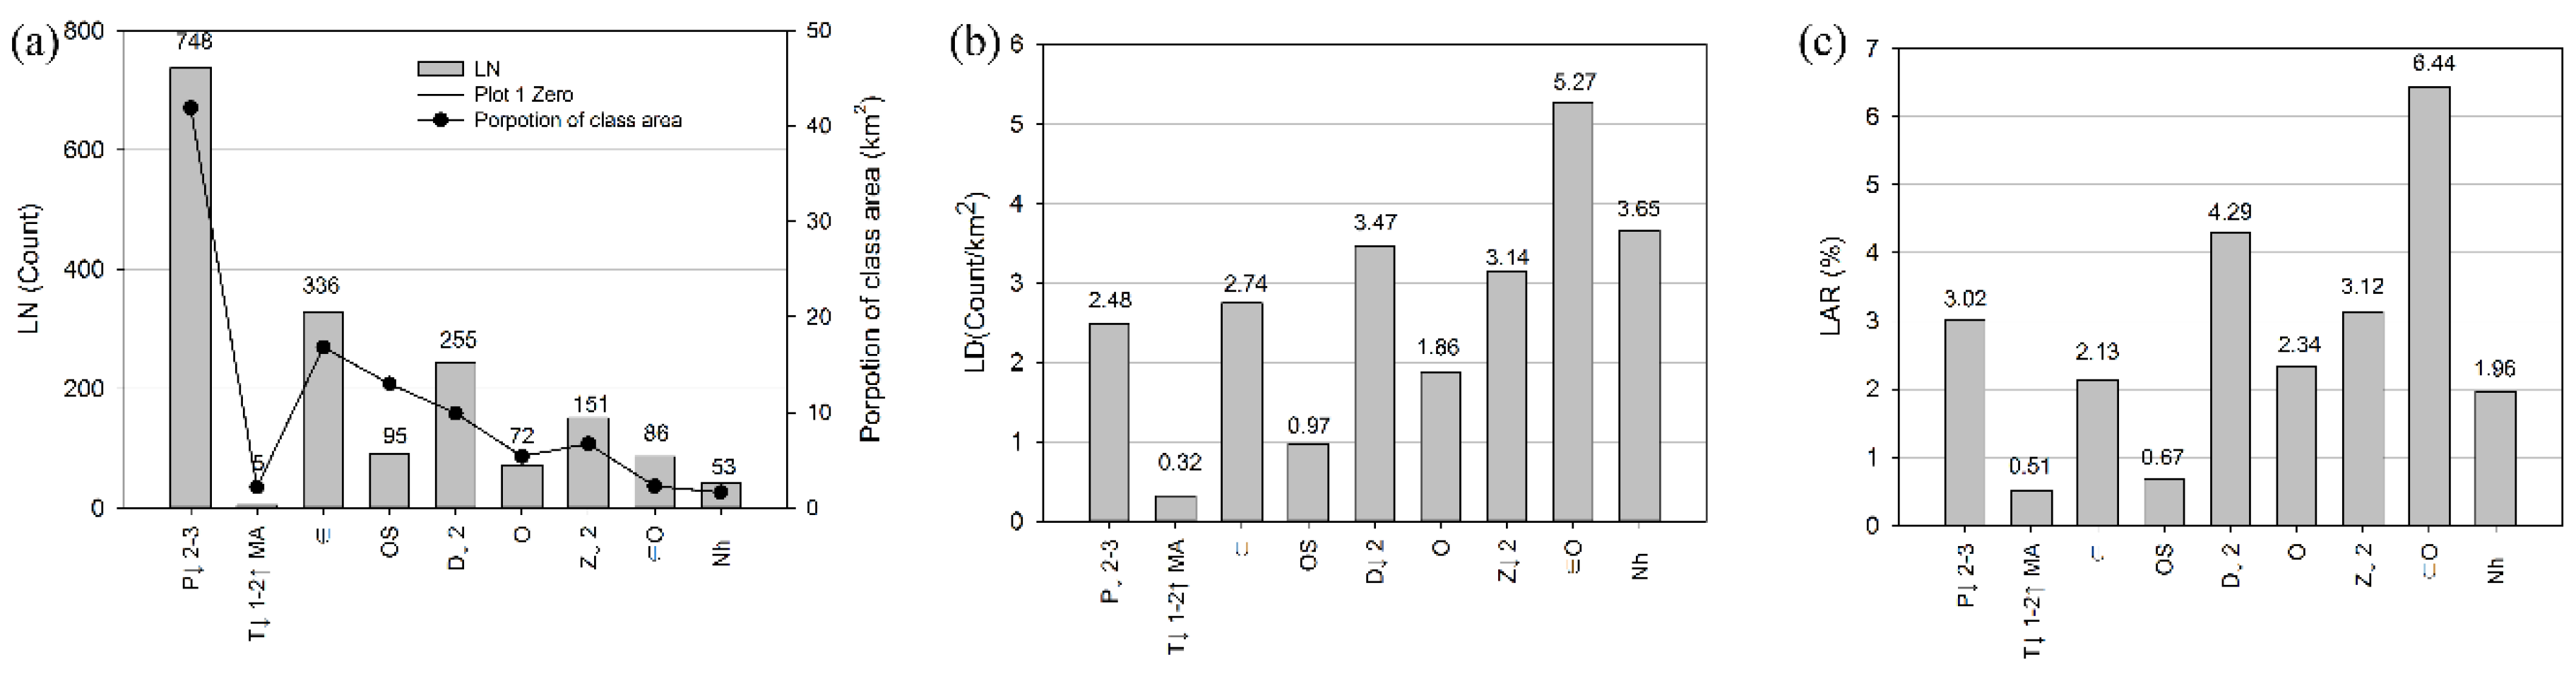
5.3.1. Lithology

Lithology plays an important role in co-seismic landslide occurrence. The study area is covered by sedimentary rocks and igneous rocks. Most of the study area is mainly covered by sedimentary rocks. Correlation of co-seismic landslide abundances with geology units is shown in Figure 7. The class of Permian sedimentary rocks covers the largest area, followed by class Cambrian-Ordovician rocks (Figure 7a). To investigate the relation between lithology and the mapped landslides, the inventory was overlaid on the geology map. Then, the number of landslides in each lithology class was tabulated. The landslide abundance indexes show different patterns corresponding to the 13 classes of lithology. Forty percent of the landslides (738 landslides) occurred in the Middle-upper Permian sandstone and limestone. This was because it occupied 42% of the total study area and both of the seismogenic fault and the main active fault were located within this geologic unit. Cambrian-Ordovician unit with sandstone, limestone and dolomite has the highest density of 5.27 landslide/km2. The second highest density of 3.65 landslides/km2 was recorded in Neoproterozoic rocks. One of the possible reasons for the highest density in Cambrian-Ordovician rocks is that the Zhaotong-Ludian active fault passes through the whole region of this unit. In addition, the upper sinian dolomite rocks located relatively further from the faults also shows a relatively high density of 3.47 landslide/km2. The result shows that Cambrian-Ordovician rocks have the highest LAR (6.43%). The second highest LAR is in the lower-middle Devonian class with 4.29%, followed by Upper Devonian with 3.1%.

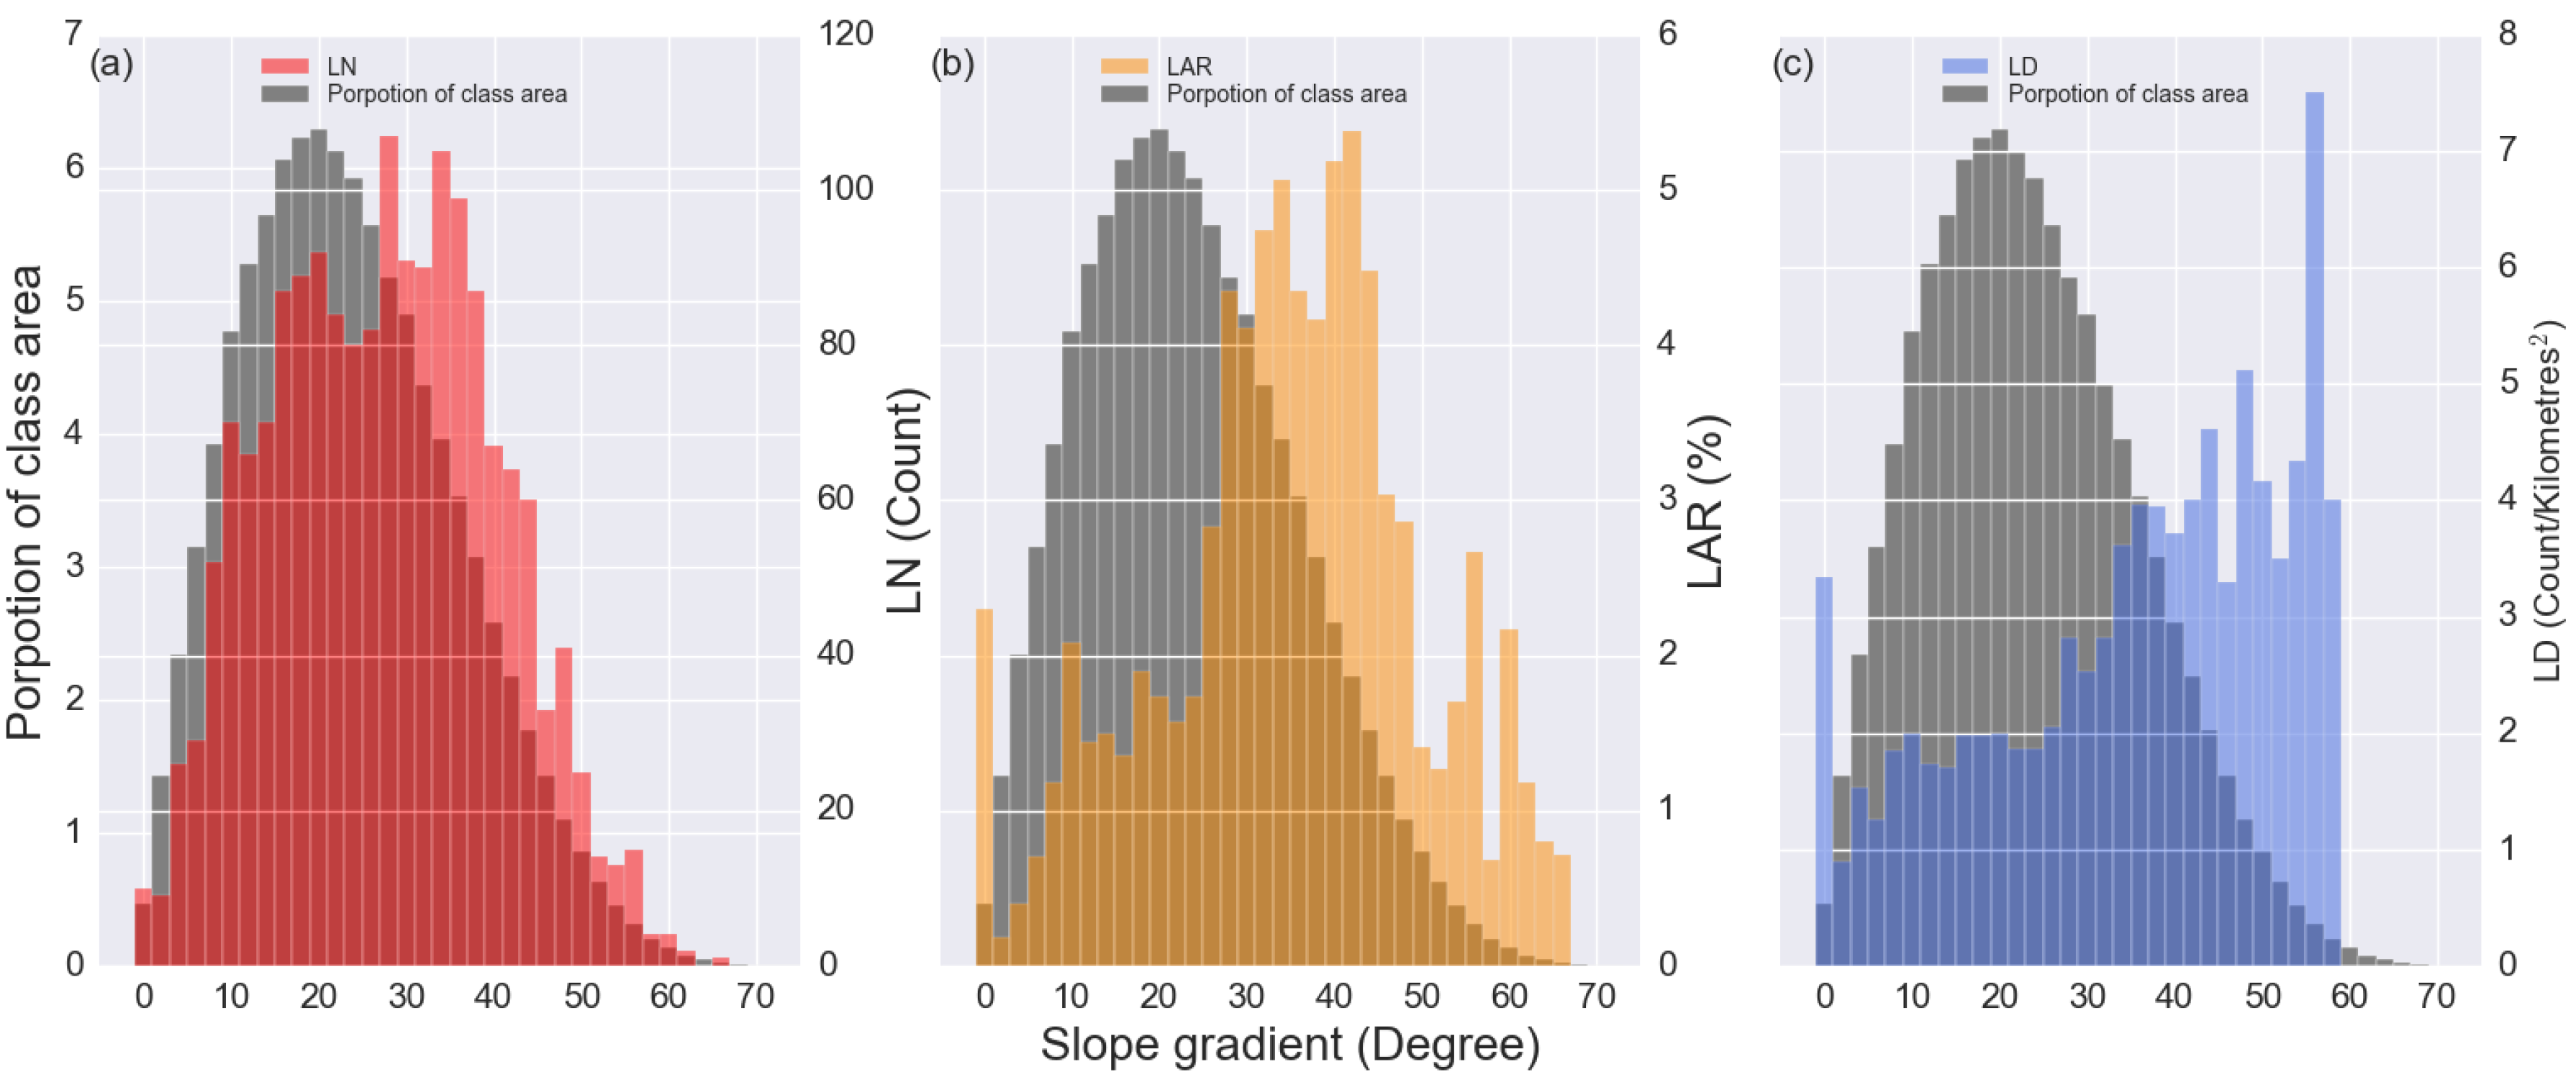
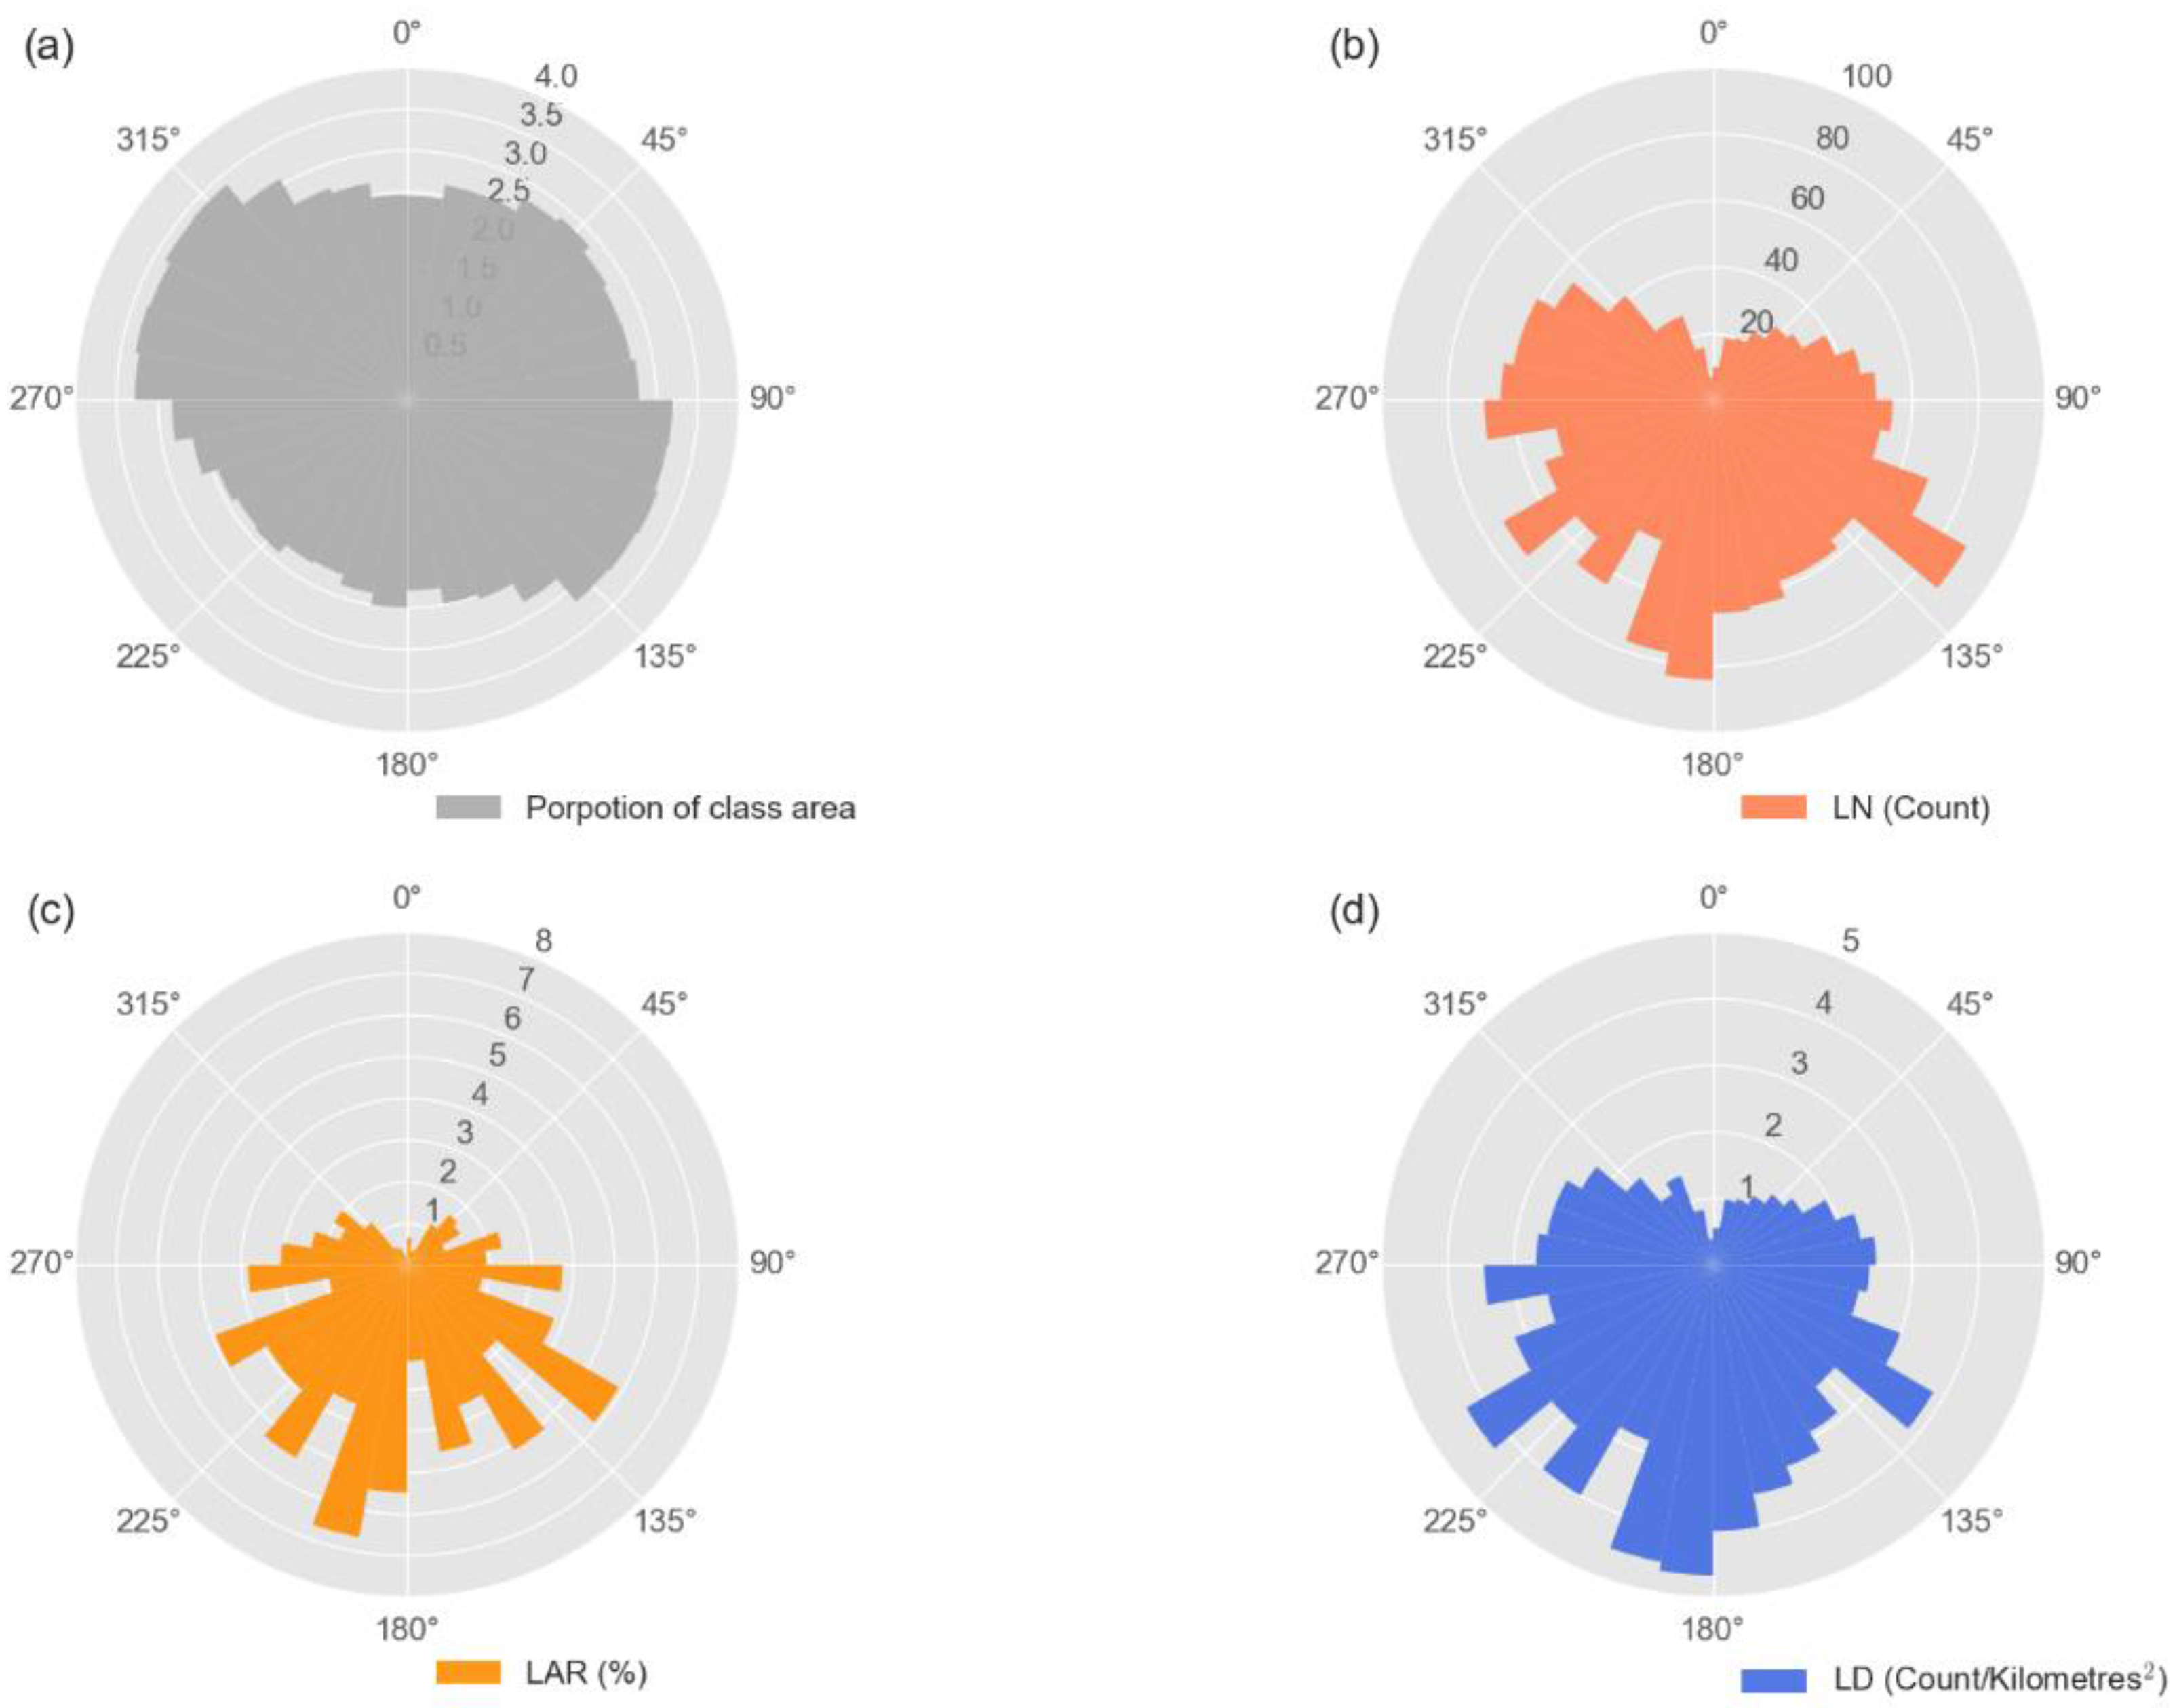
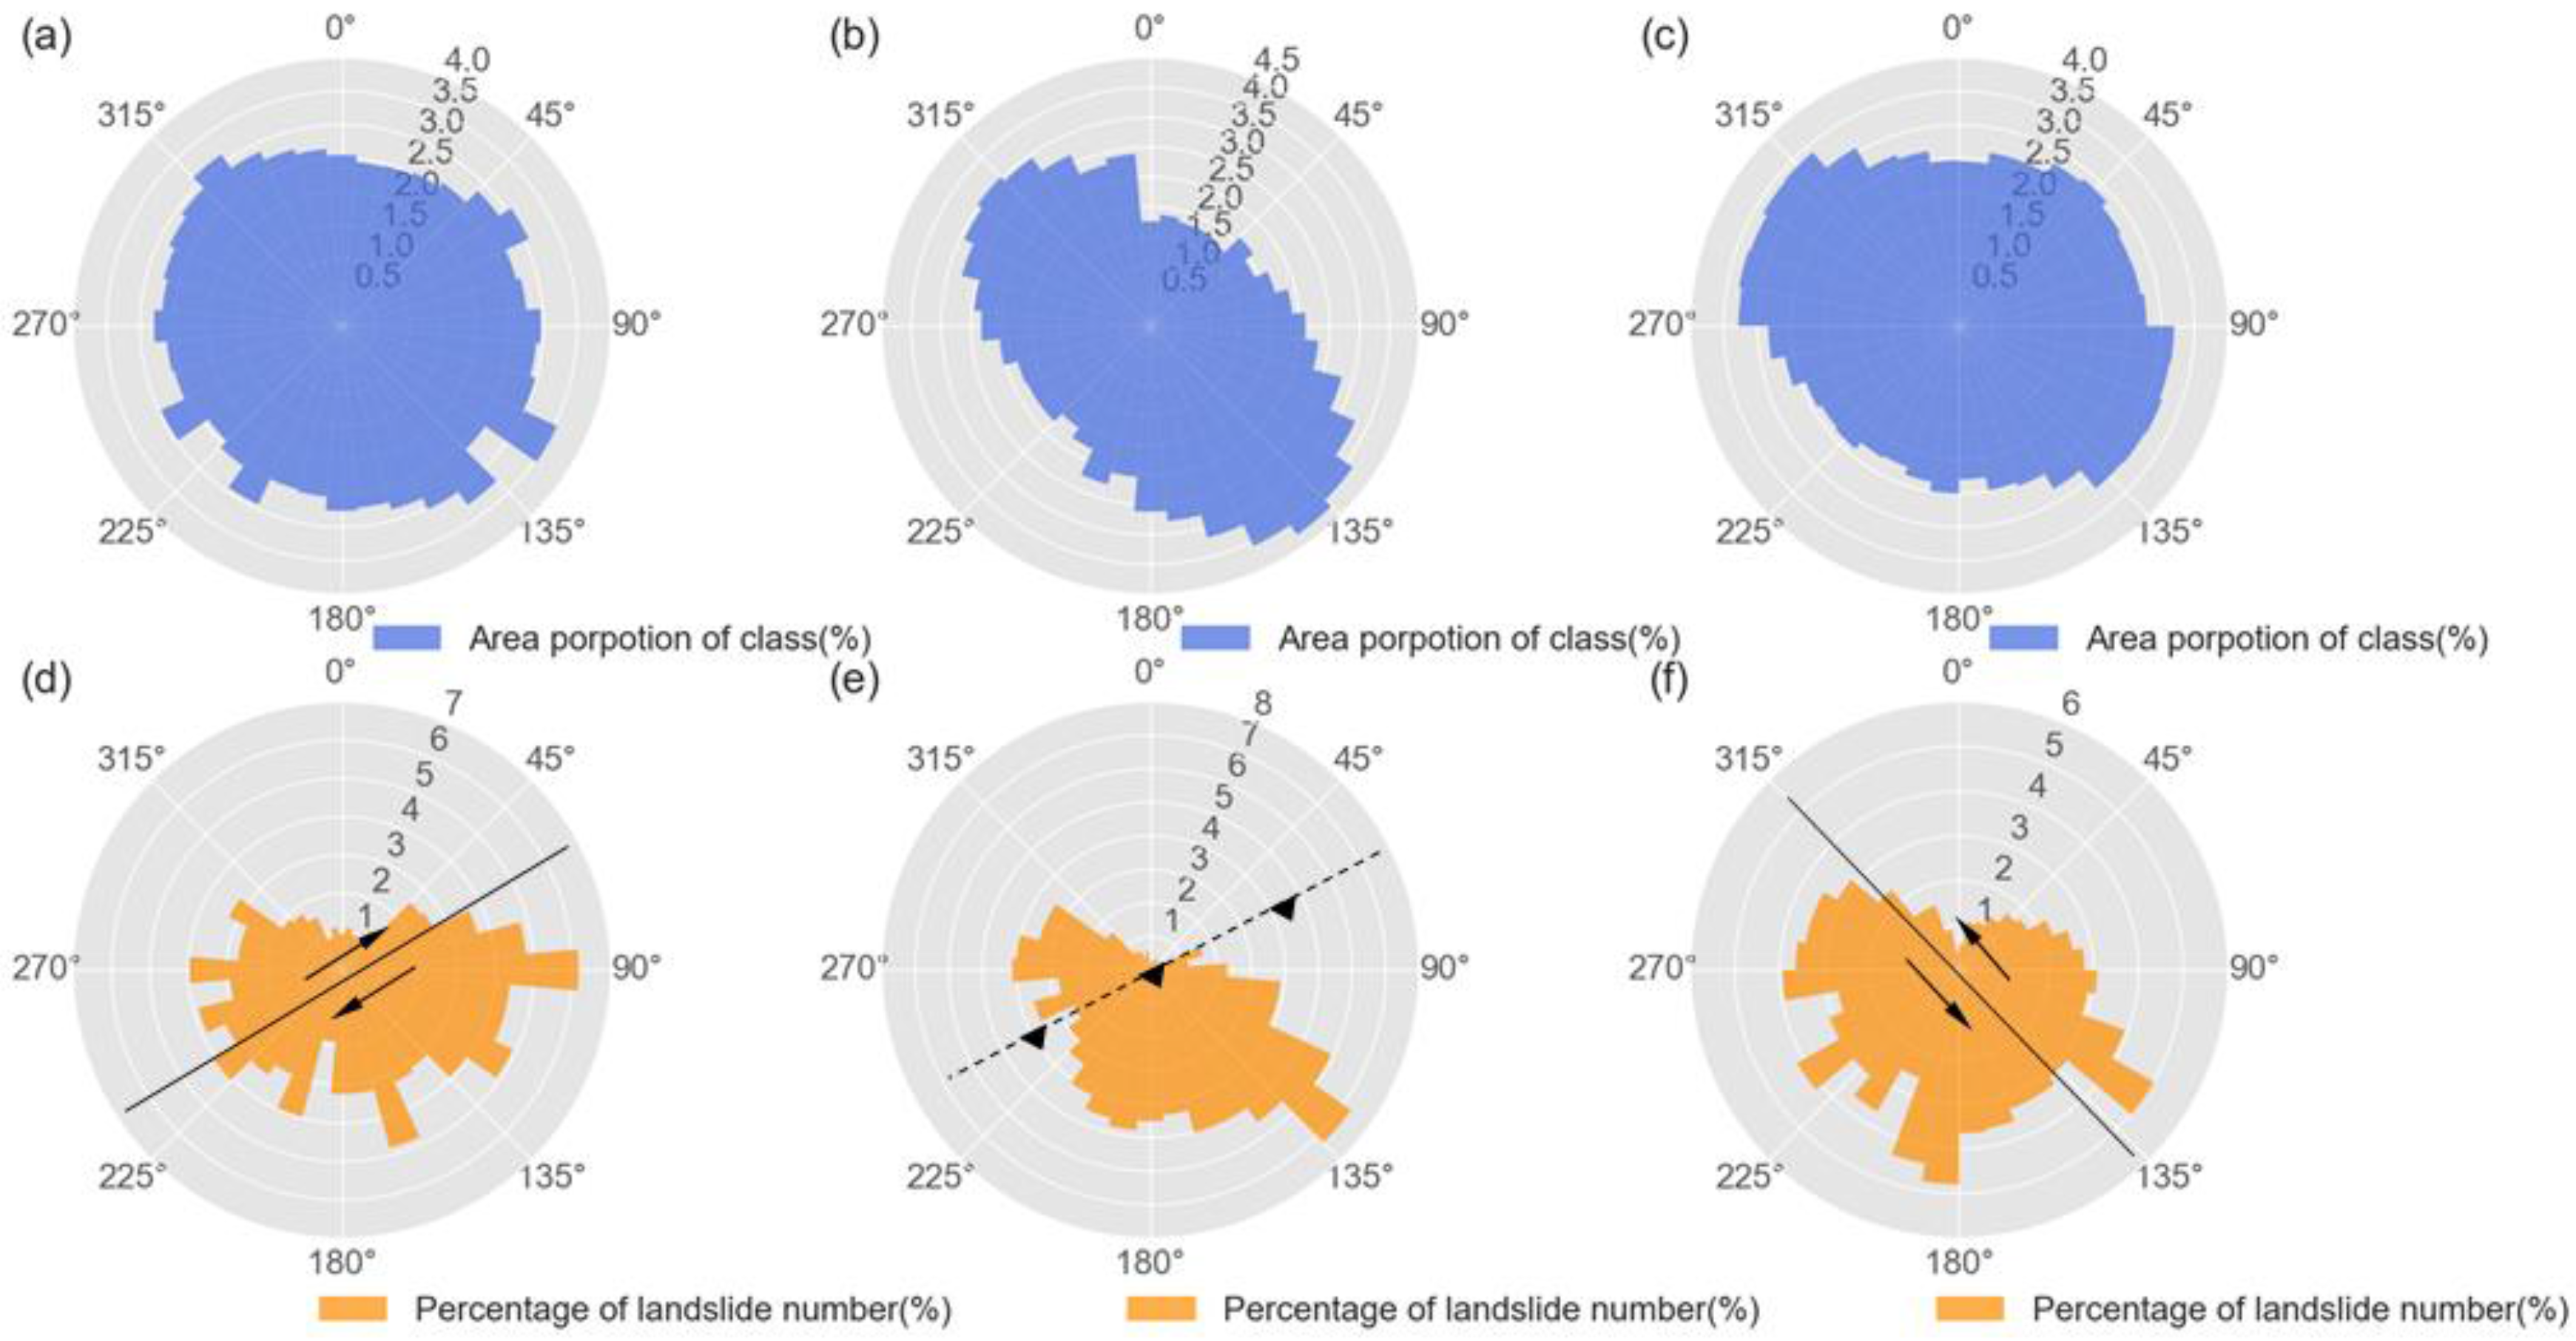
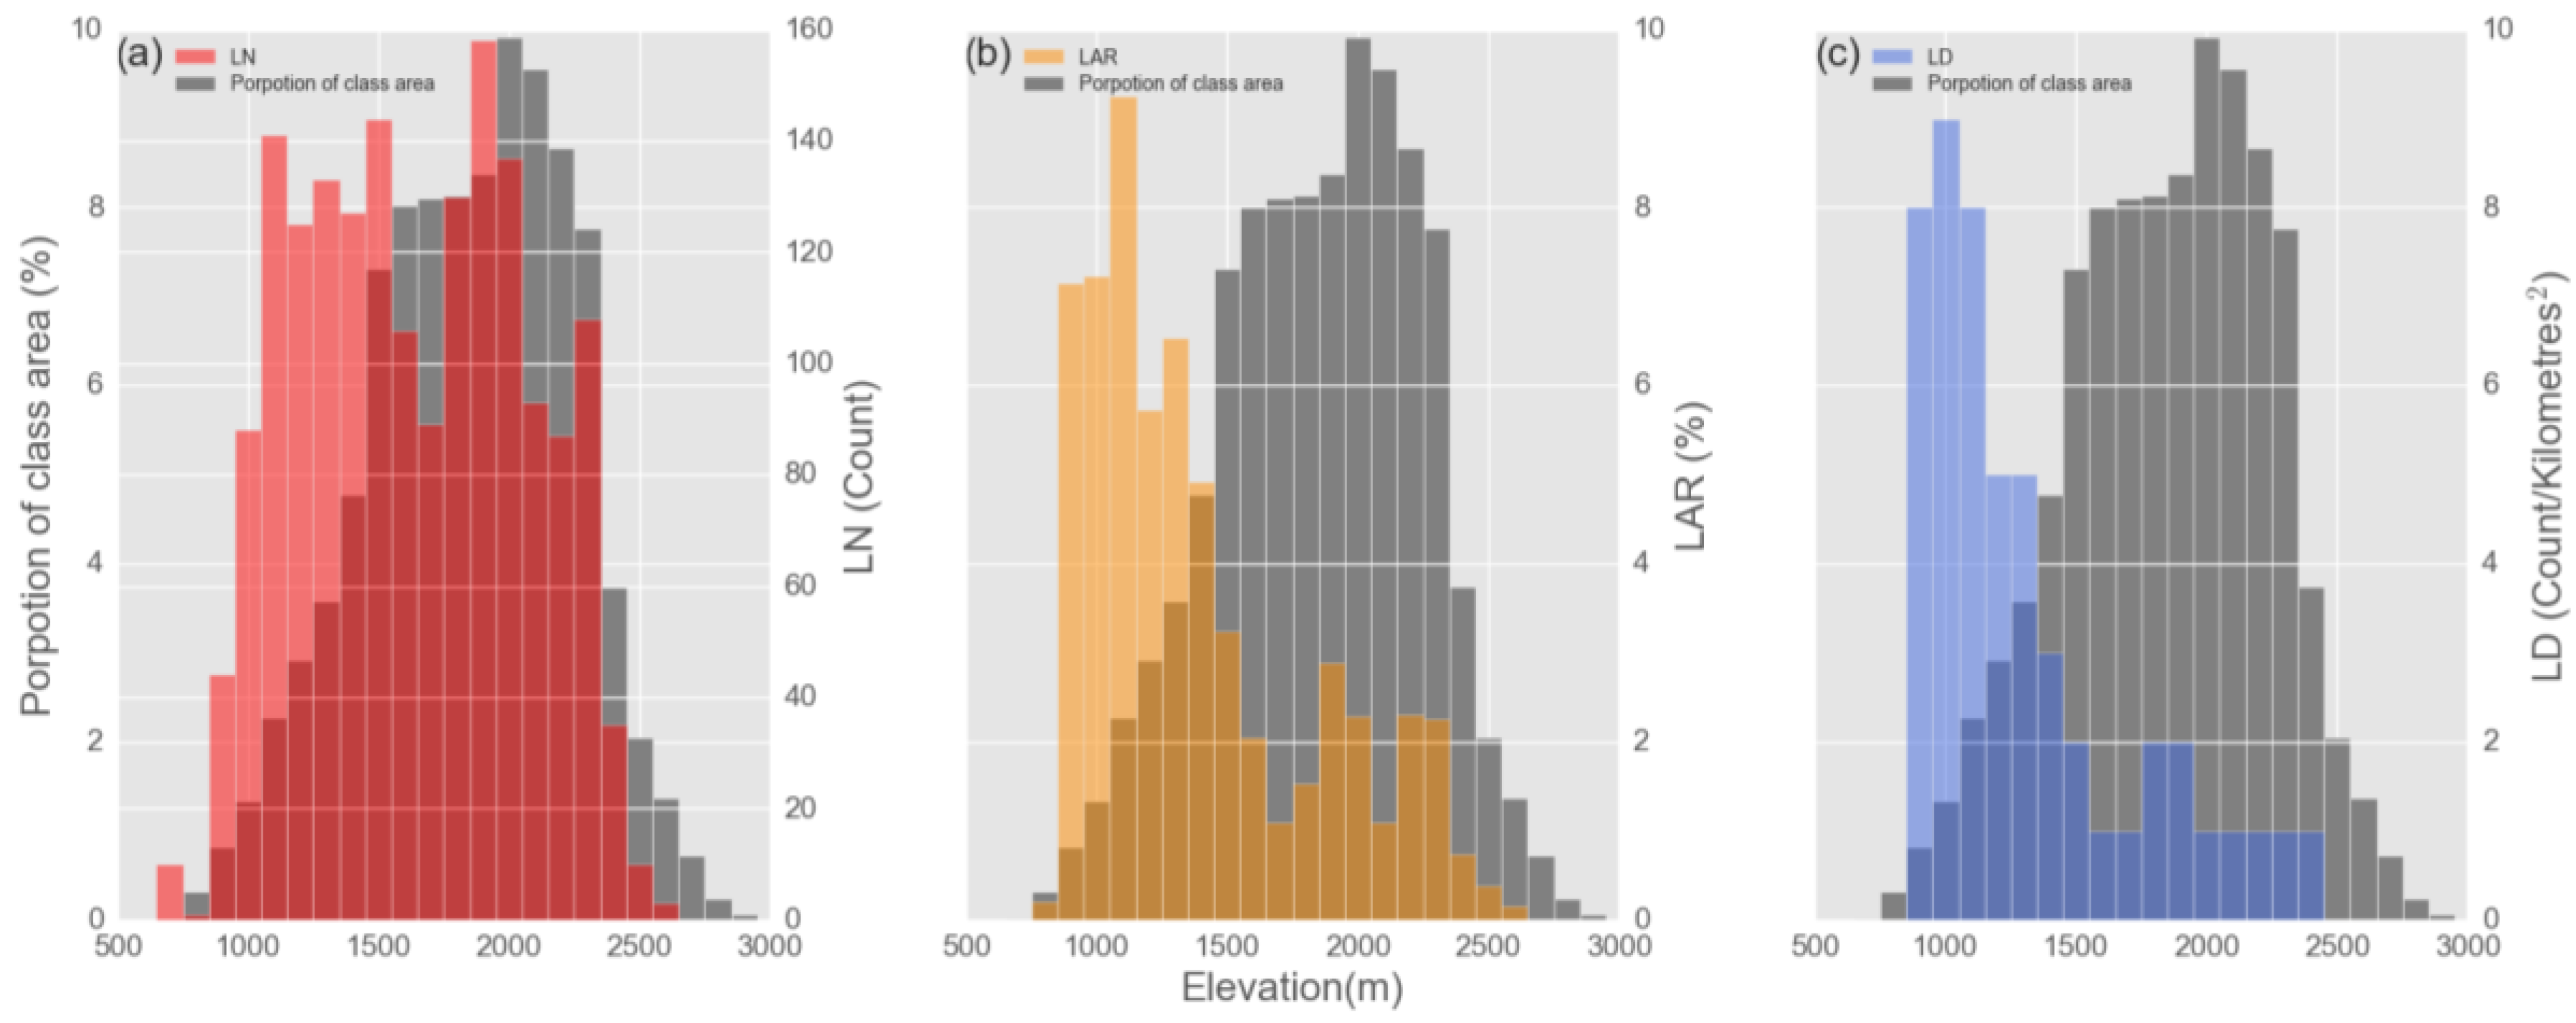
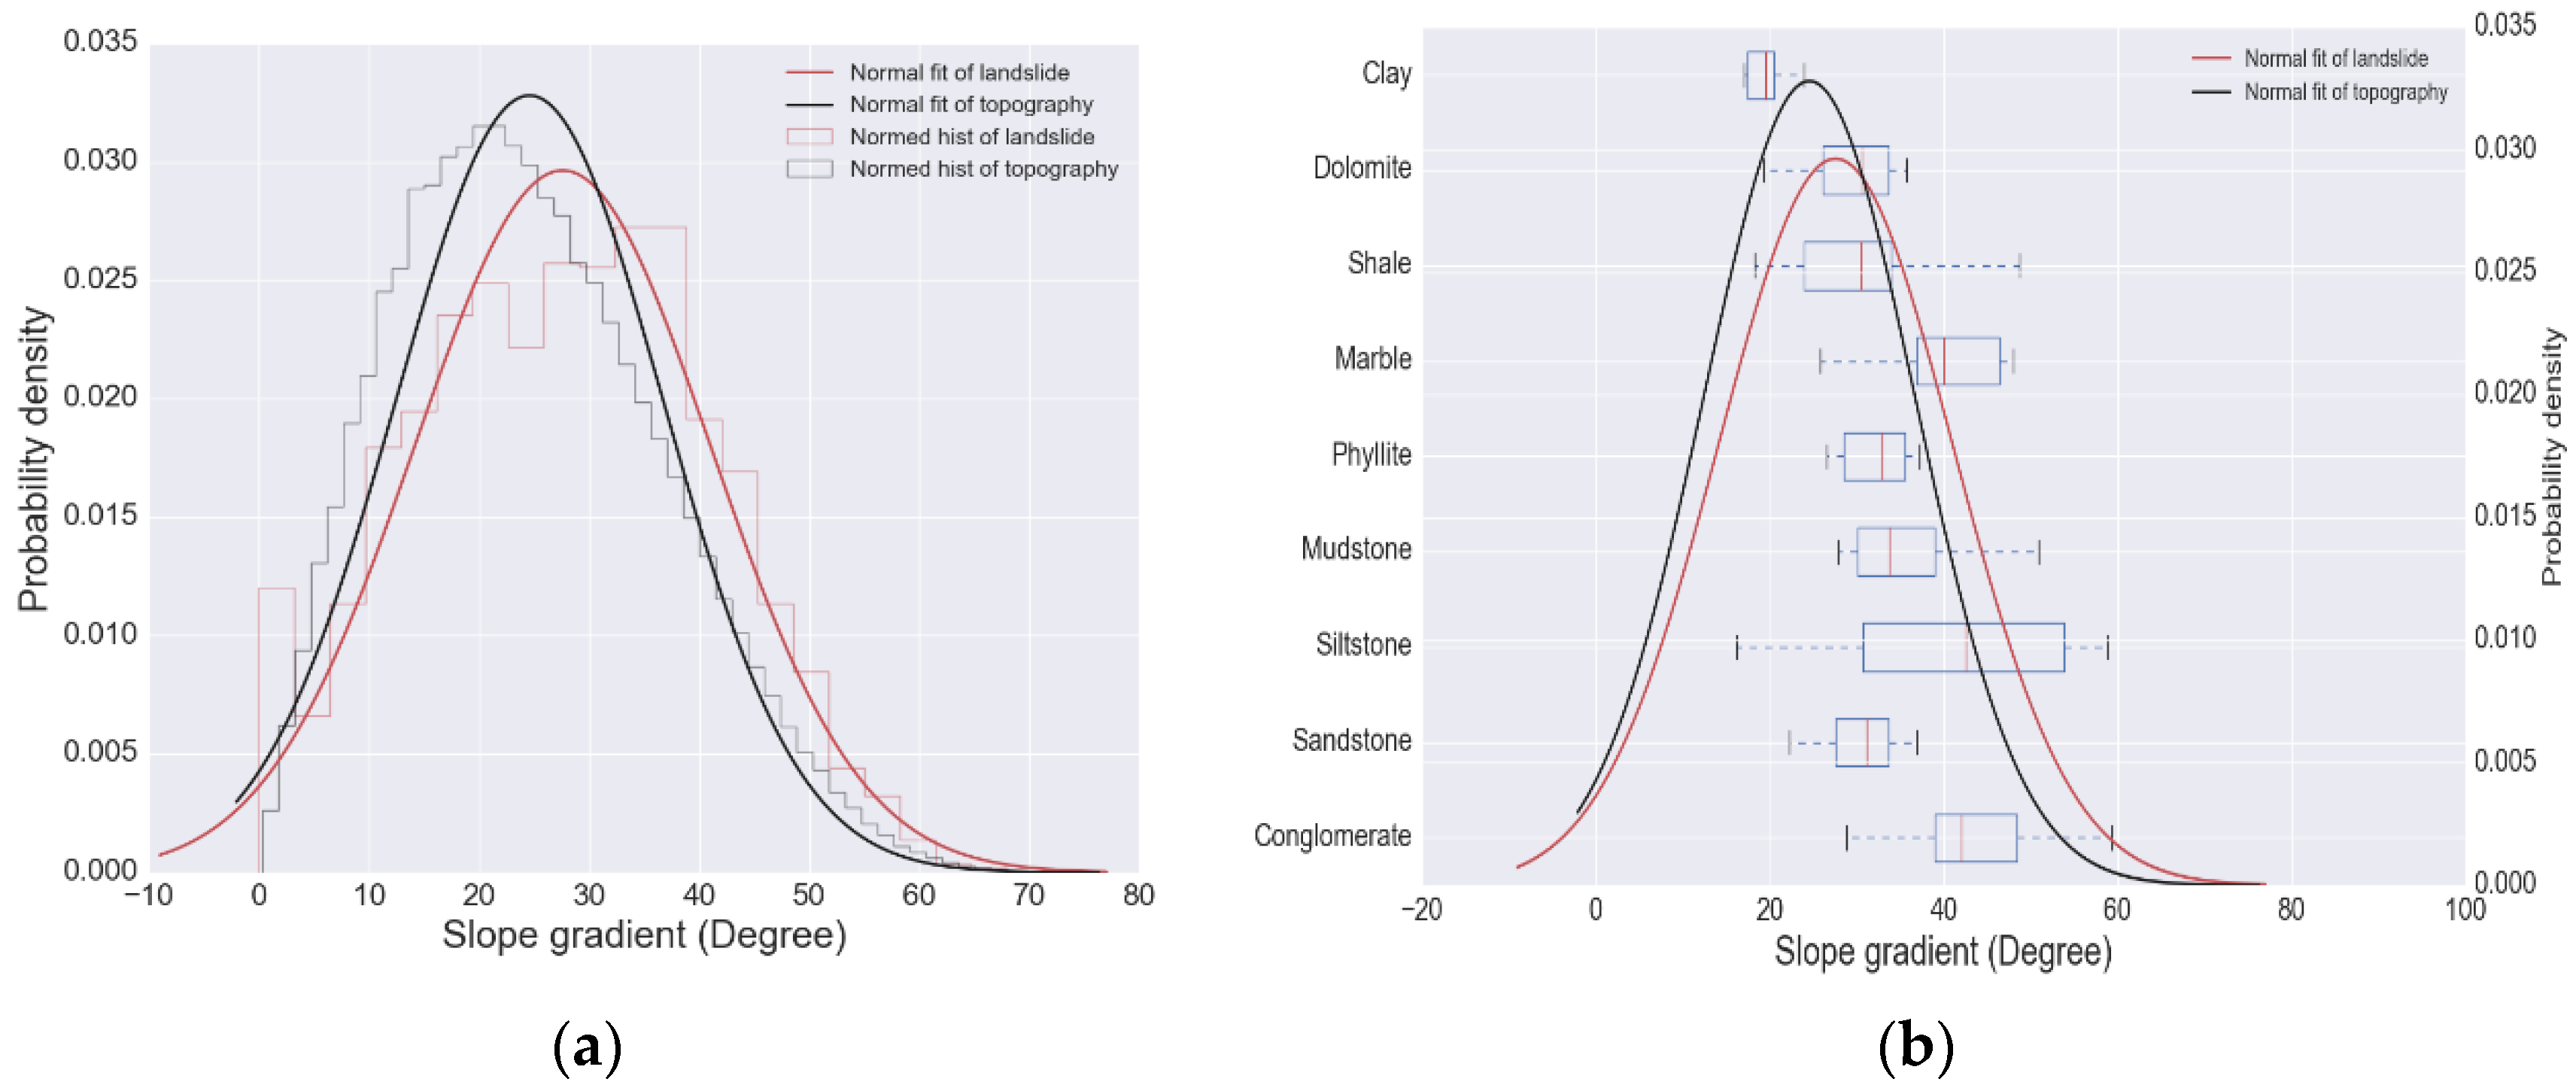
5.3.2. Topographic Parameters

Correlations between terrain and co-seismic landslides were of great significance in many research fields of practical engineering, such as topographic evolution analysis, regional co-seismic landslide susceptibility assessment and co-seismic landslide mechanism investigations. On the one hand, transportation and deposition of the co-seismic landslide materials have fundamental impact on the topographic evolution. On the other hand, the topographic conditions will also affect the susceptibility of landslides [37,38,39,40,41,42]. Additionally, with rapid development of remote sensing (RS) technologies and increasing availability of high-resolution RS images, regional co-seismic landslide recognition and detailed mapping with accuracy have become possible, which has provided great advantages for co-seismic landslide research, including for stability analysis and run out assessment [40,43].
To investigate the influence of topographic factors on landslides thematic maps of elevation, slope angle and slope aspect were first derived from the DEM in ArcGIS 9.3. Then, landslide inventory was overlaid on these factors.
The elevation of the study area ranges from 812 meters to 2961 mters above sea level (a.s.l.) with an average elevation of 1895 meters (a.s.l.). In this study, we divided the study area into 23, 100 m intervals. Figure 8 shows the correlations of elevation with the areas of classes, landslide number, LAR and LD. It can be observed that the area of 1400–2300 m (a.s.l.) takes the majority of the study area. There is no evident correspondence between class area and elevation. Landslide abundances of the elevations of 900–1300 m (a.s.l.) and 1800–2000 m (a.s.l.) show higher values than the other classes. On the one hand, the low altitude areas appear to register more landslide occurrence due to its high LN and LD value and relatively low area portion. On the other hand, distribution of LN, LAR and LD values indicate an uneven characteristic of similar-scale landslides occurrence in different elevation classes, since both the LAR and LD show similar tendency in all elevation classes. Although the largest LN value occurs at the class of 1900–2000 m, the maximum values of LAR and LD are 8.76% at an elevation of 1100–1200 m and 8.6 landslides km2 at an elevation of 900–1000 m, respectively.
Slope gradient is a controlling parameter of co-seismic landslides. The slope angle range of the study area is 0–73.88° and was classified in intervals of 2°. Although areas of slope angle lower than a threshold (such as 5° or 10°) were sometimes excluded from the statistical analysis, many other studies did not mandatorily exclude such areas in order to keep the integrity of the earthquake-affected areas. Therefore, we decided to keep the areas of low slope angle in this study. The average slope angle of the study area is 24.43°, and most slopes of the study area are relatively gentle. According to the 2° interval of slope angle, the study area was divided into 35 classes. Relationships of slope angle with areas of classes and the three landslide abundances are shown in Figure 9. The area of the class increases shapely with increasing slope gradient until 20° and then decreases after. The general tendencies of LAR and LD were similar as the class area with the slope gradient. However, the reverse points in LAR and LD were higher than that of class area. The highest LN was 108 landslides in the class of 28°–30°. As for the LAR, the highest value was 5.39% occurred in the class of 40°–42°, followed by 5.02% in 32°–34°. On the contrary, the LD increases with the slope gradient. These results indicate that on the one hand, co-seismic landslides distributed in all slope angle classes but that steeper slopes are more susceptible to co-seismic landslides; on the other hand, the steep area appears to register small-scale landslides due to its relative high LN but relative low LAR (Figure 9b,c).
Slope aspect may have a fundamental influence on landslide occurrence due to different temperatures, sediment condition, vegetation, etc. For example, south-facing slopes are more open to the sunlight and warm wind and undergo much more mechanical, chemical, and biological weathering than northward-facing slopes [44,45]. We divided slope aspect of the study area by intervals of 10° (clockwise starting from the north set as 0°). The statistical result shows the correlations of co-seismic landslide abundance and slope aspect. As shown in Figure 10, the LN, LAR and LD vary with different slope aspects. In general, slopes facing southeast (SE), south (S) and southwest (SW) register more landslides than other aspects despite southeast and southwest facing slopes occupying more area than the others. The values of LN and LAR, and LD show different trends (Figure 10). This indicates different scaled landslides concentrate in different classes of slope aspect. For example, many large-scale landslides appeared to occur on southeast-facing slopes due to the relative low LD and relative high LAR. The biggest LN appears in the class 120°–130° (Southeast facing), followed by 82 landslides at class 180°–190°. The highest value of LAR was 6.88% found in the class 190°–200°, while the largest LD was 4.56 landslides/km2 in the class 180°–190°.

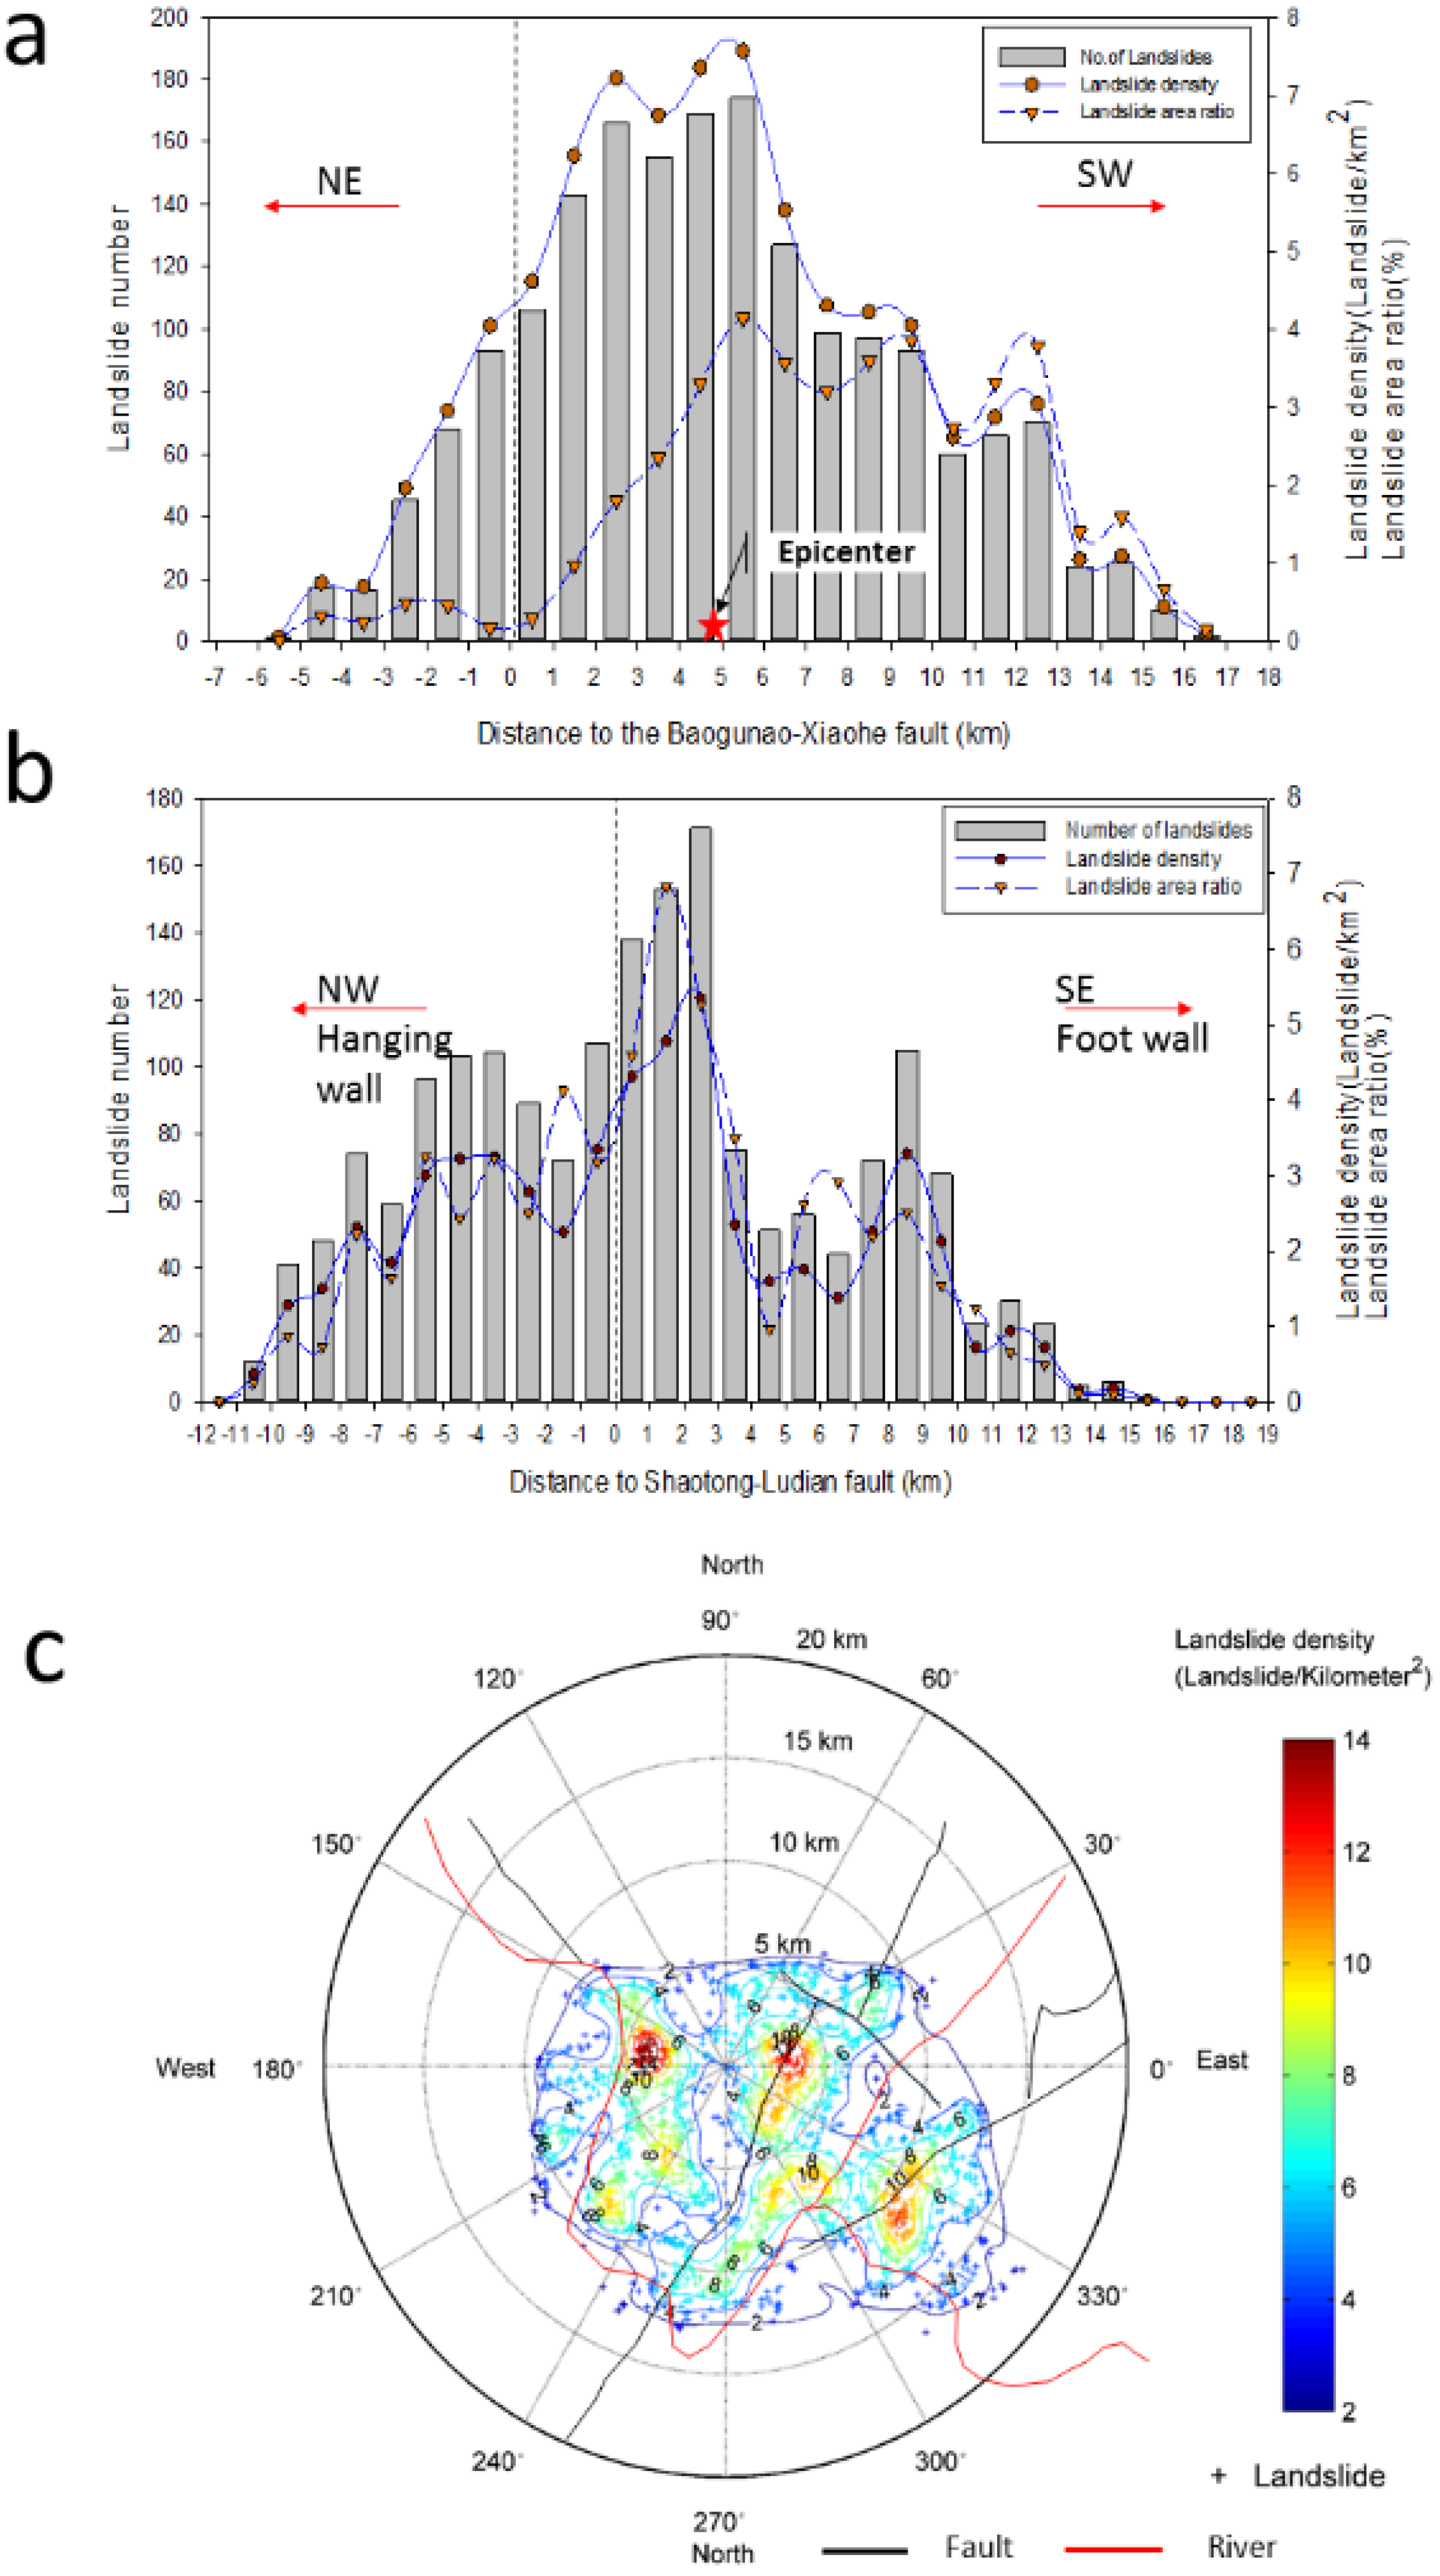
5.3.3. Earthquake-Related Factors

In order to carry out statistics of co-seismic landslide spatial distributions and earthquake factors, we selected two factors, distance from the epicenter and distance from the faults. We constructed buffer zones with the distance from the landslides to the Baogunao-Xiaohe fault and the Zhaotong-Ludian fault. The relative distance and position of landslides towards the earthquake epicenter were also calculated. These distances were calculated as the shortest distances from the centers of landslide polygons to the fault lines or the epicenter point in ArcGIS 9.3. The relative portion of landslides is defined as the pole angle of the landslide polygons’ center to the epicenter point, counter-clockwise starting from the east direction.
The relationship between landslide distribution and distance to the Baogunao-Xiaohe fault is shown in Figure 11a. Most of the landslides were located in the southwest (SW) side of the Baogunao-Xiaohe fault. Category 5–6 km to this fault on the southwest side had the largest concentration of landslides. In addition, a general negative relation between landslide concentration and distance to surface projection of the epicenter (rather than the surface projection up-dip edge of the fault) was found. The LN, LD and LAR values first increased with distance to the fault until 6 km (approximately the location of the epicenter of the main shock) and then showed an inverted tendency.
Alternative to the Zhaotong-Ludian fault, it also had a strong impact on landslide distribution. Figure 11b shows the relationship between landslide distribution and distance to this fault. About 55% of the landslides occurred on the footwall (southeast side) of the Zhaotong-Ludian fault. The highest landslide density and denuded area ratio were recorded in the area 2–3 km to this active fault on the footwall. The results also showed a general negative correction between landslide distribution and distance to the fault. However, there were some departures noticed in the declining tendency in the area across the river or fault. This might suggest a combined effect of topography and trigger force. The steep topography of the river valley in this area provides advantages for landslide occurrence when suffering earthquake shaking.
Relative positions of landslides to the epicenter are plotted in polar coordinates (Figure 11c). Landslides concentrated within an elliptical area with a 25-km NW–SE striking long axis and a 15-km NW–SE striking short axis. Contours of landslide density showed three high-density areas of up to 14 landslides/km2. Landslides concentrated most Southeast (SE), northeast by east (NEE) and nearly West of the epicenter. However, most of the large landslides (greater than 10,000 m2) were located SE of the epicenter (Figure 11b). In addition, landslide distribution was also affected by local topographic and geologic conditions, all three high landslide density areas were located along the riverbank, where steep topography, more frequent human activities and river incisions provided great advantages.

6. Implications from Co-Seismic Landslide Distribution

6.1. Implication for the Threshold Topography

High and steep hillslopes usually provide potential gravitational energy difference, which is the main driving force of landslide mass movement, regardless of the landslide trigger. Meanwhile, landslide plays an active role in cutting into the uplifting rock mass, forcing the overspread of drainages, countering the tectonic mass flux into organic systems, and limiting the mountain relief. Concepts of threshold topography have been incorporated into hillslope evolution models through non-linear transport laws that landslide erosion rate increase rapidly when hillslope approaches the threshold gradient [46,47,48,49]. A sand pile can be used to illustrate the concept of threshold topography. In the steady state of a sand pile, the surface of the sand pile makes on average a constant angle with the horizontal plane, known as the repose angle. At the simplest level, mountain topography evolves as the balance between tectonic processes such as plate convergence or isostasy that tends to build relief and to steep the topography, and erosive processes such as landslides that tend to limit it.
In this study, field investigations and interpretation results revealed that earthquake-induced landslides occurred over the whole range of gradients. Histograms plots of the topography gradients and co-seismic landslides gradients by an interval of 1° showed both of them were approximately normally distributed between 0° and 70° (Figure 12a). To further test this hypothesis, we performed a normal distribution fitting. Mean and variance parameters of normal distribution, as well as 95% confidence interval, were also calculated (Table 4). The results show that the expectation value of the topography gradient is 24.37°, while that of the landslide is 27.58°. Following the threshold hillslope concept, hillslope morphology could affect slope stability by setting a threshold gradient. The threshold gradient is essentially limited by their regional strength properties before they are triggered by an external force. Additionally, we collect some rock shear-test data of historical earthquake-induced landslides from the National Engineering Laboratory for High-speed Railway Construction [50]. Boxplots showing the range of rocks’ friction angle in this area was overlaid on the probability density curves using boxplot (Figure 12b). The result showed that distribution of topography gradient generally agreed with the regional strength. In addition, as the slope gradient approaches its threshold value, the slope becomes more susceptible to landslides. Thus, we may conclude that it is the gap between a slope gradient and its threshold gradient that determined the susceptibility of a slope failure.
As suggested by Larsen and Montgomery (2012) [49], hillslope morphology in eastern Himalaya, where our study area is located, resulted from the coupling effect of frequent rock uplift and river incision, and threshold hillslopes widely occur in this area. Burbank et al. (1996) [51] proposed that in northeastern Himalaya area, the spatial uniformly distributed hillslope angles were at a threshold value for failure, which was also consistent with other tectonically active mountain belts, such as the Southern Alps of New Zealand, despite the rates of uplift, triggers, and erosion, as well as varying rock types. A normal distribution of topography gradients in northwestern Himalaya with mean values close to an angle characterized by regional coarse soils was also evidence for threshold hillslopes.

6.2. Implication for the Seismogenic Fault Identification

Seismogenic faults and their properties (such as location and focal mechanism) strongly controlled the spatial distribution pattern of earthquake-induced landslides. A thrust fault earthquake releases more energy than a strike-slip fault earthquake and subsequently induces a larger number of landslides. Distribution patterns of co-seismic landslides varied with seismogenic faults. Negative correlation between co-seismic landslide concentration and distance to seismogenic fault were found in many thrust-fault events. Landslides triggered by thrust-fault earthquake events occurred most on its hanging wall and attenuated with the increasing distance to the seismogenic fault at a rate significantly lower than that on the footwall. Typical examples of thrust fault earthquakes are 1999 Chi-Chi earthquake (Taiwan) [24], 2004 Chuetsu earthquakes (Japan) [5], the 2007 Niigata Chuetsu earthquake (Japan) [25] and the 2008 Wenchuan earthquake (China) [10]. As a comparison, landslides triggered by a strike-slip fault earthquake had similar distribution patterns on both sides of the seismogenic fault and were usually concentrated close to the seismogenic fault, such as the 1973 Luhuo earthquake (China) [23,35] and the 2010 Yushu earthquake (China) [52].
Slope aspect may also influence co-seismic landslide occurrence because different slope aspect may be differently affected with respect to the slipping direction of the seismogenic fault or the propagating direction of seismic waves. Orientations of earthquake-induced landslides were related to the geometry of seismogenic fault. Tibaldi et al. (1995) [53] found that landslides preferentially occurred on slopes perpendicular to seismogenic fault plane and lying along its strike due to amplification of the ground response, while slopes parallel to the seismogenic fault planes were almost unaffected by landslides regardless of lithology and geological structure conditions.
Nevertheless, regardless of the types of seismogenic fault, the dominant orientation of landslides was not controlled by the general topographic aspect, but generally accorded with the displacement of the earth surface, i.e., the direction of crustal deformation [7]. The distributed nature of earthquake energy release may propagate into the pattern of earthquake-induced landslides [54]. Hence, the distribution pattern of earthquake-induced landslides may also give some implications for seismogenic fault properties. The 2008 Wenchuan earthquake and 2013 Lushan earthquake happened in the eastern margin of the Tibet Plateau. Area affected these two earthquakes registered similar tectonic, topographic and geologic conditions (Figure 1a) as the study area. In order to compare the Ludian earthquake-induced landslides with that of the 2008 Wenchuan earthquake and 2013 Lushan earthquake, basic information of the three events is listed in Table 5 and shown in Figure 1a. For the Wenchuan event, we obtained an inventory of landslides that happened in Qingchuan County. The Wenchuan earthquake was recognized as a thrust-fault event. However, in the northern part of the earthquake-affected area (Qingchuan County), a combined crustal movement type of strike-slip and thrust played a dominant role [34]. The Lushan earthquake produced no obvious fault ruptures. Several recent studies have revealed that the Lushan earthquake was generated by a blind reverse fault [26]. Results show that there were no obvious correlations found between the co-seismic landslide concentrations and regional topographic orientations (Figure 13a–c). However, distributions of landslides triggered by Wenchuan earthquake [42] and Lushan earthquake [14] also show that the dominant orientations of landslides are consistent with the movement direction of the seismogenic fault. In the Qingchuan County, Northeast (NE), east (E) and southeast (SE) facing slopes suffered the majority of the co-seismic landslides. These directions generally agree with striking slip and thrust direction of the seismogenic fault (Figure 13d). In the Lushan earthquake affected area, slopes facing SE and neighbor aspects have the largest percentage of landslides, which was the thrust direction of the blind fault (Figure 13e). By such analogy, based on the aspect distribution of landslides triggered by the Ludian earthquake (Figure 13f), we may generally infer NW–SE crustal deformation during the Ludian earthquake. In addition, the distribution of landslide locations with respect to the epicenter (Figure 13c) indicated that the seismogenic fault was NW–SE trending. The results may be proof of inversion results of the Ludian earthquake focal mechanism that the seismogenic fault of the Ludian earthquake was NW-trending strike-slip Baogunao-Xiaohe fault rather than the NE trending Ludian-Zhaotong fault.

7. Conclusions

In this study, 1826 landslides with a total area of 19.12 km2 triggered by the Ludian earthquake were mapped through visual interpretation of high-resolution aerial photos and Landsat-8 satellite images. A few of these mapped landslides were also validated by field investigation.
These mapped landslides were unevenly distributed within the study area of about 735 km2 and concentrated within an elliptical area with a 25-km NW–SE striking long axis and a 15-km NW–SE striking short axis. The main landslide types mapped were rock and soil falls, rock avalanches, and shallow disrupted landslides. Most of the large landslides (greater than 10,000 m2) were located SE of the epicenter, including three catastrophic large-scale landslides.
Three co-seismic landslide abundance proxies, including landslide number (LN), landslide area ratio (LAR), and landslide density (LD) were used to correlate the co-seismic landslides with landslide controlling factors. The co-seismic landslides show different abundances in different lithology classes. Middle-upper Permian unit suffered the most landslides, while highest LAR and LD were found in Cambrian-Ordovician unit. The elevation range of high landslide susceptibility is between 900–1300 m and 1800–2000 m. There are generally positive correlations between co-seismic landslides and slope angle and steep slopes appear to register more small-scale landslides. The co-seismic landslides occurred preferably on SE, S and SW oriented slopes, probably due to the direction of the seismogenic fault movement. Generally, negative correlations with the distance from the surface projection of the epicenter rather than from the fault were found.
We suggest the topography of the study area within a tectonic-active background was in a state of threshold. Statistical results showed gradients of regional topography and landslide in our study area were normally distributed between 0 and 70° and so was that of landslide occurrence. Distribution may also be controlled by regional surficial rock strength. It was the gap between a slope and its threshold state that determined its susceptibility for landslide. Analog to other recent events that happened around the study area, distribution of landslides orientations also implied the seismogenic fault was the Baogunao-Xiaohe fault, as the earthquake-induced landslides would always be expected to distribute along the seismogenic fault and had most preferable aspects in accordance with the moving direction of the fault. This study provides basic data for research of earthquake-induced landslides disaster prevention, mitigation of future damage and other related fields.
The Ludian area and its vicinity suffered greatly from earthquakes and caused landslides. The landslide inventory provided in this study is of particular significance for regional landslide susceptibility assessment, detailed mechanism analysis of co-seismic landslides and geomorphology evolution studies in tectonically active regions.

Acknowledgments

This study has received financial support from State Key Development Program of Basic Research of China (Grant No. 2011CB710601), and Grant-in-Aid for challenging Exploratory Research (15K12483, G. Chen) from Japan Society for the Promotion of Science. This work was also supported by Kyushu University Interdisciplinary Programs in Education and Projects in Research Development. This financial support is gratefully acknowledged. We also want to express our sincere thanks to the editor and the anonymous reviewers for their valuable comments and suggestions on this research.

Author Contributions

G.C. and L.F. conceived research; S.Z. and G.C. analyzed the data; and S.Z. wrote the paper.

Conflicts of Interest

The authors declare no conflict of interest.

Abbreviations

The following abbreviations are used in this manuscript:
CEAChina Earthquake Administration
CEDCChinese Earthquake Data Centre
GISGeographic Information System
LARLandslide area ratio
LDLandslide density
LNLandslide number
NGACNational Geology Archive of China
USGSUnited States Geology Survey

References

  1. China Earthquake Network Center. Available online: http://www.cmec.ac.cn (accessed 20 January 2016).
  2. China Earthquake Administration. Available online: http://www.cea.gov.cn/ (accessed 20 January 2016).
  3. Li, Z.S. The state of the art of the research on seismic landslide hazard at home and abroad. J. Catastrophol. 2003, 18, 64–70. [Google Scholar]
  4. Keefer, D.K. Landslides caused by earthquakes. Geol. Soc. Am. Bull. 1984, 95, 406–421. [Google Scholar]
  5. Wang, H.B.; Sassa, K.; Xu, W.Y. Analysis of a spatial distribution of landslides triggered by the 2004 Chuetsu earthquakes of Niigata Prefecture, Japan. Nat. Hazards 2007, 41, 43–60. [Google Scholar] [CrossRef]
  6. Sassa, K. Landslide disasters triggered by the 2004 Mid-Niigata Prefecture earthquake in Japan. Landslides 2005, 2, 135–142. [Google Scholar] [CrossRef]
  7. Sato, H.P.; Hasegawa, H.; Fujiwara, S.; Tobita, M.; Koarai, M.; Une, H.; Iwahashi, J. Interpretation of landslide distribution triggered by the 2005 Northern Pakistan earthquake using SPOT 5 imagery. Landslides 2006, 4, 113–122. [Google Scholar] [CrossRef]
  8. Owen, L.A.; Kamp, U.; Khattak, G.A.; Harp, E.L.; Keefer, D.K.; Bauer, M.A. Landslides triggered by the 8 October 2005 Kashmir earthquake. Geomorphology 2008, 94, 1–9. [Google Scholar] [CrossRef]
  9. Yin, Y.; Wang, F.; Sun, P. Landslide hazards triggered by the 2008 Wenchuan earthquake, Sichuan, China. Landslides 2009, 6, 139–152. [Google Scholar] [CrossRef]
  10. Gorum, T.; Fan, X.; van Westen, C.J.; Huang, R.Q.; Xu, Q.; Tang, C.; Wang, G. Distribution pattern of earthquake-induced landslides triggered by the 12 May 2008 Wenchuan earthquake. Geomorphology 2011, 133, 152–167. [Google Scholar] [CrossRef]
  11. Miyagi, T.; Higaki, D.; Yagi, H.; Doshida, S.; Chiba, N.; Umemura, J.; Satoh, G. Reconnaissance report on landslide disasters in northeast Japan following the M 9 Tōhoku earthquake. Landslides 2011, 8, 339–342. [Google Scholar] [CrossRef]
  12. Wartman, J.; Dunham, L.; Tiwari, B.; Pradel, D. Landslides in eastern Honshu induced by the 2011 Tohoku Earthquake. Bull. Seismol. Soc. Am. 2013, 103, 1503–1521. [Google Scholar] [CrossRef]
  13. Zhou, S.; Fang, L. Support vector machine modeling of earthquake-induced landslides susceptibility in central part of Sichuan province, China. Geoenviron. Disasters 2015, 2, 2. [Google Scholar] [CrossRef]
  14. Zhou, S.; Fang, L.; Liu, B. Slope unit-based distribution analysis of landslides triggered by the April 20, 2013, Ms 7.0 Lushan earthquake. Arab. J. Geosci. 2015, 8, 7855–7868. [Google Scholar] [CrossRef]
  15. Yin, Z.; Zhao, W.; Qin, X. Distribution characteristics of geohazards induced by the Lushan Earthquake and their comparisons with the Wenchuan Earthquake. J. Earth Sci. 2014, 25, 912–923. [Google Scholar] [CrossRef]
  16. Qiao, G.; Lu, P.; Scaioni, M.; Xu, S.; Tong, X.; Feng, T.; Wu, H.; Chen, W.; Tian, Y.; Wang, W.; Li, R. Landslide investigation with remote sensing and sensor network: from susceptibility mapping and scaled-down simulation towards in situ sensor network design. Remote Sens. 2013, 5, 4319–4346. [Google Scholar] [CrossRef]
  17. Scaioni, M.; Longoni, L.; Melillo, V.; Papini, M. Remote sensing for landslide investigations: An overview of recent achievements and perspectives. Remote Sens. 2014, 6, 9600–9652. [Google Scholar] [CrossRef]
  18. Guzzetti, F.; Mondini, A.C.; Cardinali, M.; Fiorucci, F.; Santangelo, M.; Chang, K.T. Landslide inventory maps: New tools for an old problem. Earth-Science Rev. 2012, 112, 42–66. [Google Scholar] [CrossRef]
  19. Rodríguez, C.E.; Bommer, J.J.; Chandler, R.J. Earthquake-induced landslides: 1980–1997. Soil Dyn. Earthq. Eng. 1999, 18, 325–346. [Google Scholar] [CrossRef]
  20. Prestininzi, A.; Romeo, R. Earthquake-induced ground failures in Italy. Eng. Geol. 2000, 58, 387–397. [Google Scholar] [CrossRef]
  21. Papadopoulos, G.A.; Plessa, A. Magnitude-distance relations for earthquake-induced landslides in Greece. Eng. Geol. 2000, 58, 377–386. [Google Scholar] [CrossRef]
  22. Bommer, J.J.; Rodríguez, C.E. Earthquake-induced landslides in Central America. Eng. Geol. 2002, 63, 189–200. [Google Scholar] [CrossRef]
  23. Chen, X.L.; Zhou, Q.; Ran, H.; Dong, R. Earthquake-triggered landslides in southwest China. Nat. Hazards Earth Syst. Sci. 2012, 12, 351–363. [Google Scholar] [CrossRef]
  24. Khazai, B.; Sitar, N. Evaluation of factors controlling earthquake-induced landslides caused by Chi-Chi earthquake and comparison with the Northridge and Loma Prieta events. Eng. Geol. 2004, 71, 79–95. [Google Scholar] [CrossRef]
  25. Collins, B.D.; Kayen, R.; Tanaka, Y. Spatial distribution of landslides triggered from the 2007 Niigata Chuetsu-Oki Japan Earthquake. Eng. Geol. 2012, 127, 14–26. [Google Scholar] [CrossRef]
  26. Xu, C.; Xu, X.; Shyu, J.B.H.; Gao, M.; Tan, X.; Ran, Y.; Zheng, W. Landslides triggered by the 20 April 2013 Lushan, China, Mw 6.6 earthquake from field investigations and preliminary analyses. Landslides 2015, 12, 365–385. [Google Scholar] [CrossRef]
  27. China Earthquake Data Centre. Available online: http://data.earthquake.cn/ (accessed 20 January 2016).
  28. Huang, R.Q.; Li, W.L. Analysis of the geo-hazards triggered by the 12 May 2008 Wenchuan Earthquake, China. Bull. Eng. Geol. Environ. 2009, 68, 363–371. [Google Scholar] [CrossRef]
  29. Yong, Z.; Xu, L.S.; Chen, Y.T.; Liu, R.F. Rupture process of the 3 august 2014 ludian, yunnan, Mw 6.1 (Ms6.5) Earthquake. Chinese J. Geophys. Ed. 2014, 9, 3052–3059. (In Chinese) [Google Scholar]
  30. Xu, X.; Jiang, G.; Yu, G.; Wu, X.; Jianguo, Z.; Li, X. Discussion on seismogenic fault of the Ludian MS6.5 earthquake and its tectonic attribution. CHINESE J. Geophys. Ed. 2014, 57, 3060–3068. [Google Scholar]
  31. United States Geology Survey. Available online: http://earthquake.usgu.gov/ (accessed 20 January 2016).
  32. ASTER Global Digital Elevation Model. Available online: http://gdem.ersdac.jspacesystems.or.jp (accessed 20 January 2016).
  33. National Geology Archive of China. Available online: http://www.ngac.cn/ (accessed 20 January 2016).
  34. Dai, F.C.; Xu, C.; Yao, X.; Xu, L.; Tu, X.B.; Gong, Q.M. Spatial distribution of landslides triggered by the 2008 Ms 8.0 Wenchuan earthquake, China. J. Asian Earth Sci. 2011, 40, 883–895. [Google Scholar] [CrossRef]
  35. Tang, B.; Liu, S.; Liu, S. Mountain disaster formation in northwest Sichuan. GeoJournal 1994, 34, 41–46. [Google Scholar] [CrossRef]
  36. Keefer, D.K. Investigating landslides caused by earthquakes—A historical review. Surv. Geophys. 2002, 23, 473–510. [Google Scholar] [CrossRef]
  37. Li, W.L.; Huang, R.Q.; Tang, C.; Xu, Q.; van Westen, C. Co-seismic landslide inventory and susceptibility mapping in the 2008 Wenchuan Earthquake disaster area, China. J. Mt. Sci. 2013, 10, 339–354. [Google Scholar] [CrossRef]
  38. Zhou, J.W.; Cui, P.; Fang, H. Dynamic process analysis for the formation of Yangjiagou landslide-dammed lake triggered by the Wenchuan earthquake, China. Landslides 2013, 10, 331–342. [Google Scholar] [CrossRef]
  39. Li, G.; West, A.J.; Densmore, A.L.; Jin, Z.; Parker, R.N.; Hilton, R.G. Seismic mountain building: Landslides associated with the 2008 Wenchuan earthquake in the context of a generalized model for earthquake volume balance. Geochemistry, Geophys. Geosystems 2014, 15, 833–844. [Google Scholar] [CrossRef] [Green Version]
  40. Chen, Q.; Cheng, H.; Yang, Y.; Liu, G.; Liu, L. Quantification of mass wasting volume associated with the giant landside Daguangbao induced by the 2008 Wenchuan earthquake from persistent scatterer InSAR. Remote Sens. Environ. 2014, 152, 125–135. [Google Scholar] [CrossRef]
  41. Hasegawa, S.; Dahal, R.K.; Nishimura, T.; Nonomura, A.; Yamanaka, M. DEM-Based analysis of earthquake-induced shallow landslide susceptibility. Geotech. Geol. Eng. 2009, 27, 419–430. [Google Scholar] [CrossRef]
  42. Qi, S.; Xu, Q.; Lan, H.; Zhang, B.; Liu, J. Spatial distribution analysis of landslides triggered by 2008.5.12 Wenchuan Earthquake, China. Eng. Geol. 2010, 116, 95–108. [Google Scholar] [CrossRef]
  43. Huang, Y.; Yu, M.; Xu, Q.; Sawada, K.; Moriguchi, S.; Yashima, A.; Liu, C.; Xue, L. InSAR-derived digital elevation models for terrain change analysis of earthquake-triggered flow-like landslides based on ALOS/PALSAR imagery. Environ. Earth Sci. 2014, 73, 7661–7668. [Google Scholar] [CrossRef]
  44. De Guidi, G.; Scudero, S. Landslide susceptibility assessment in the Peloritani Mts. (Sicily, Italy) and clues for tectonic control of relief processes. Nat. Hazards Earth Syst. Sci. 2013, 13, 949–963. [Google Scholar] [CrossRef]
  45. Ren, Z.; Zhang, Z.; Dai, F.; Yin, J.; Zhang, H. Co-seismic landslide topographic analysis based on multi-temporal DEM-A case study of the Wenchuan earthquake. Springerplus 2013, 2, 544. [Google Scholar] [CrossRef] [PubMed]
  46. Dietrich, W.E.; Montgomery, D.R. Scale Dependence and Scale Invariance in Hydrology; Sposito, G., Ed.; Cambridge University Press: New York, NY, USA, 1998. [Google Scholar]
  47. Tucker, G.E.; Bras, R.L. Hillslope processes, drainage density, and landscape morphology. Water Resour. Res. 1998, 34, 2751. [Google Scholar] [CrossRef]
  48. Egholm, D.L.; Knudsen, M.F.; Sandiford, M. Lifespan of mountain ranges scaled by feedbacks between landsliding and erosion by rivers. Nature 2013, 498, 475–478. [Google Scholar] [CrossRef] [PubMed]
  49. Larsen, I.J.; Montgomery, D.R. Landslide erosion coupled to tectonics and river incision. Nat. Geosci. 2012, 5, 468–473. [Google Scholar] [CrossRef]
  50. National Engineering Laboratory for High-speed Railway Construction. Available online: http://hsrlab.csu.edu.cn/index.aspx (accessed 20 January 2016).
  51. Burbank, D.W.; Leland, J.; Fielding, E.; Anderson, R.S.; Brozovic, N.; Reid, M.R.; Duncan, C. Bedrock incision, rock uplift and threshold hillslopes in the northwestern Himalayas. Nature 1996, 379, 505–510. [Google Scholar] [CrossRef]
  52. Xu, C.; Xu, X.; Yu, G. Landslides triggered by slipping-fault-generated earthquake on a plateau: an example of the 14 April 2010, Ms 7.1, Yushu, China earthquake. Landslides 2012, 10, 421–431. [Google Scholar] [CrossRef]
  53. Tibaldi, A.; Ferrari, L.; Pasquarè, G. Landslides triggered by earthquakes and their relations with faults and mountain slope geometry: an example from Ecuador. Geomorphology 1995, 11, 215–226. [Google Scholar] [CrossRef]
  54. Meunier, P.; Uchida, T.; Hovius, N. Landslide patterns reveal the sources of large earthquakes. Earth Planet. Sci. Lett. 2013, 363, 27–33. [Google Scholar] [CrossRef]
Figure 1. (a) Tectonic framework of the eastern margin of Qinghai-Tibet Plateau; (b) Locally enlarged tectonic setting of the Ludian earthquake.
Ijgi 05 00046 g001
Figure 2. Geology of the study area (Formation symbols can be found in Table 2).
Ijgi 05 00046 g002
Figure 3. Inventory of landslides triggered by the Ludian earthquake (S1: Hongshiyan Landslide; S2: Ganjiazhai Landslide and location of Figure 6d–f; S3: Wangjiapo Landslide; S4 location of Figure 6a–c; and S5: location of Figure 6g–i).
Ijgi 05 00046 g003
Figure 4. (a) Frequency distribution of landslides by area; and (b) curve depicting correlation of landslide number and the landslide area and its comparison with Wenchuan earthquake and Lushan earthquake (Data of Wenchuan earthquake and Lushan earthquake in Figure 4b was reproduced from [14]).
Ijgi 05 00046 g004
Figure 5. Examples of landslides detected by visual interpretation: (ac) pre-event images, post-event images and field view of a rock fall; (df) pre-event, post-event and field view of a large avalanche; (g) pre-event images showing the wide-spread shallow landslides; and (h,i) field reconnaissance.
Ijgi 05 00046 g005
Figure 6. (a) Comparison of area affected by landslides with upper bound limits. Data is adapted based on the original table/figure in [14,15]. (b) distribution of landslides with respect to the earthquake epicenter. Yellow line shows the areal extent of mapped landslides.
Ijgi 05 00046 g006
Figure 7. (ac) Correlation of co-seismic landslide abundances with geology units.
Ijgi 05 00046 g007
Figure 8. (ac) Correlation of co-seismic landslide abundances with elevation.
Ijgi 05 00046 g008
Figure 9. (ac) Correlation of co-seismic landslide abundances with slope gradient.
Ijgi 05 00046 g009
Figure 10. (ad) Correlation of co-seismic landslide abundances with aspect: 0° (North), 90° (East), 180° (South) and 270° (West).
Ijgi 05 00046 g010
Figure 11. Correlation of landslide distribution with: (a) distance to the Baogunao-Xiaohe fault; (b) distance to the Zhaotong-Ludian fault; and (c) distance to the epicenter.
Ijgi 05 00046 g011
Figure 12. (a) Histogram and probability density plot of gradients of slope units at 1 interval. (b) Boxplot of friction angles of some main rocks in the study area overlain with probability density curves of slope unit gradients.
Ijgi 05 00046 g012
Figure 13. Distribution of regional topography in: (a) Qingchuan County affected by the Wenchuan earthquake-induced landslides; (b) area affected by the Lushan earthquake-induced landslides; and (c) area affected by Ludian earthquake-induced landslides. Slope aspects of landslides triggered by: (d) Wenchuan earthquake (in Qingchuan County); (e) Lushan earthquake; and (f) Ludian earthquake. Solid lines indicate the approximate seismogenic fault strikes and dash-line is the blind fault. Arrows indicate the movement direction of the fault. For the sake of normalization, all data are plotted in percentage (0° (North), 90° (East), 180° (South) and 270° (West)).
Ijgi 05 00046 g013
Table 1. Historical earthquake events around the Ludian area (Ms ≥ 5.7) since 1970 [23].
DateLocationMsDepth (km)E.I.L.I. aM.A (km2)
5 January 1970Tonghai, Yunnan7.813XVII
5 February 1973Luhuo, Sichuan7.611XVIII1200
11 May 1974Zhaotong, Yunnan7.114IXVII900
16 August 1976Songpan, Sichuan7.215IXVII
23 August 1976Songpan, Sichuan7.223VIIIVII
29 May 1976Longling, Sichuan7.324IXVI1500
29 May 1975Longling, Sichuan7.421IXVI
7 November 1976Yanyuan, Sichuan6.715IXVII400
24 January 1981Daofu, Sichuan6.912VIIIVII450
16 November 1988Lancang, Yunnan7.613XVII1500
16 November 1988Gengma, Yunnan7.28XVIII1800
12 May 2008Wenchuan, Sichuan8.033XIVII21,000
7 September 2012Yiliang, Yunnan5.714VIIIVII792
20 April 2013Lushan, Sichuan7.013IXVII
E.I.: Epicenter Intensity; L.I. Lowest intensity for landslide occurrence; M.D.: Maximum distance of landslide from epicenter; M.A.: Maximum area of landslide distribution. a L.I. was from Institute of Geology, China Earthquake Administration.
Table 2. List of geologic units and their descriptions of the study area.
SymbolsStratumLithology Description
CCarboniferous rocksLower part: sandstone, shale with charcoal shale;
Upper part: dolomite
DCDevonian-Carboniferous rocksSandstone and slate
D↓2Lower-middle Devonian rocksSandstone, siltstone with mudstone and limestone
D↓3Upper DevonianDolomite
NhNeoproterozoic rocksSandstone, limestone with glutenite
OOrdovician rocksLower part: shale and sandstone;
Upper part: dolomite and limestone
OSOrdovician-Silurian rocksShale, siltstone, dolomitic limestone with sandstone and dolomite
P↓2Middle Permian rocksLimestone
P↓2-3Middle-upper Permian rocksSandstone with shale, coal bed, limestone and basalt
T↓1-2-MALower-middle Triassic rocksLower part: conglomerate, sandstone and limestone;
Upper part: dolomite with breccia
Z↓2Upper simian rocksDolomite and algal dolomite
ЄCambrian rocksShale, sandstone, limestone and dolomite
ЄOCambrian-Ordovician rocksLower part: shale, sandstone, limestone and dolomite;
Upper part: shale, sandstone and dolomitic limestone
Table 3. Catalog of main shocks (Ms ≥ 4.0, till 10 August 2014).
DateTimeLongitudeLatitudeDepth (km)Magnitude (Ms)
3 August 201416:30:12.0103.33°E27.11°N10.06.6
3 August 201419:07:21.2103.37°E27.08°N21.04.1
3 August 201421:47:10.2103.39°E27.10°N10.04.1
3 August 201422:28:30.5103.34°E27.11°N8.04.2
4 August 201403:30:31.6103.36°E27.09°N5.04.4
10 August 201412:39:12.1103.39°E27.05°N10.04.0
# Data obtained from China Earthquake Data Center [27].
Table 4. Normal distribution parameters of gradients (°) of topography and landslide.
TopographyMeanVariance95% Confidence Range
MeanVariance
Topography24.37°13.46°(23.95°, 24.62°)(13.10°, 13.88°)
Landslide27.58°12.16°(27.22°, 28.10°)(11.49°, 12.37°)
Table 5. Basic information of the Wenchuan, Lushan and Ludian earthquakes.
EventMagnitude (Ms)Seismogenic FaultReference
2008 Wenchuan8.0Thrust (Strike-slip in north part)
2013 Lushan7.0Blind thrust[26]
2014 Ludian6.5Strike-slipCEA #
# China Earthquake Administration.

