
A Global Inventory of Urban Corridors Based on Perceptions and Night-Time Light Imagery


Abstract
:1. Introduction
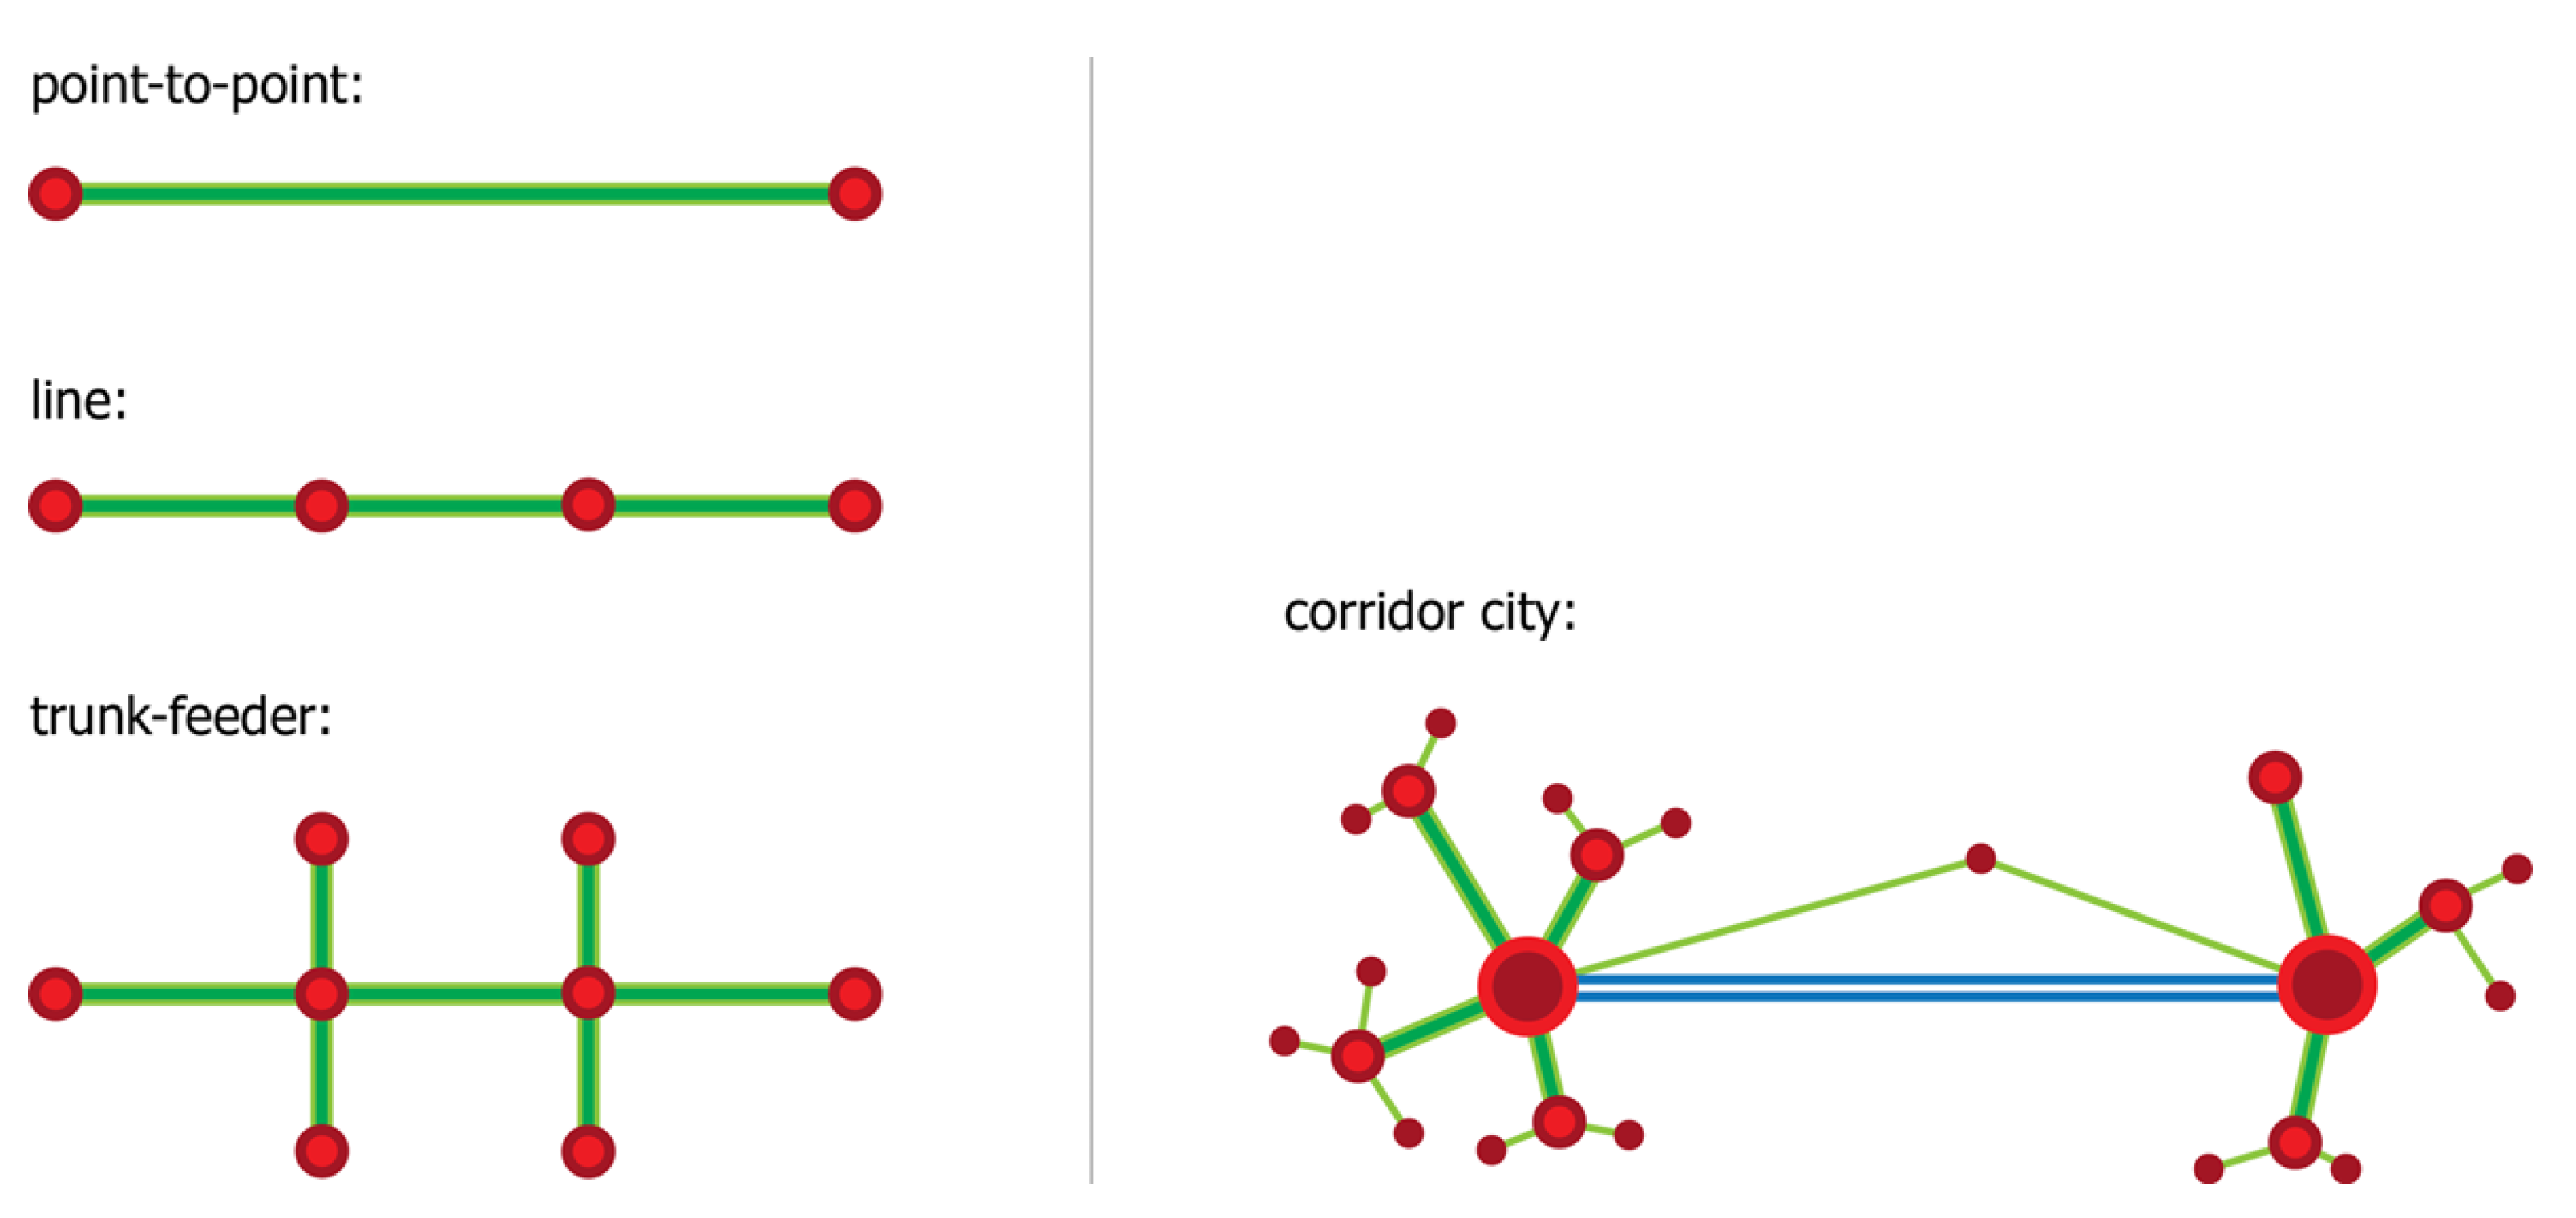
2. Conceptual Framework
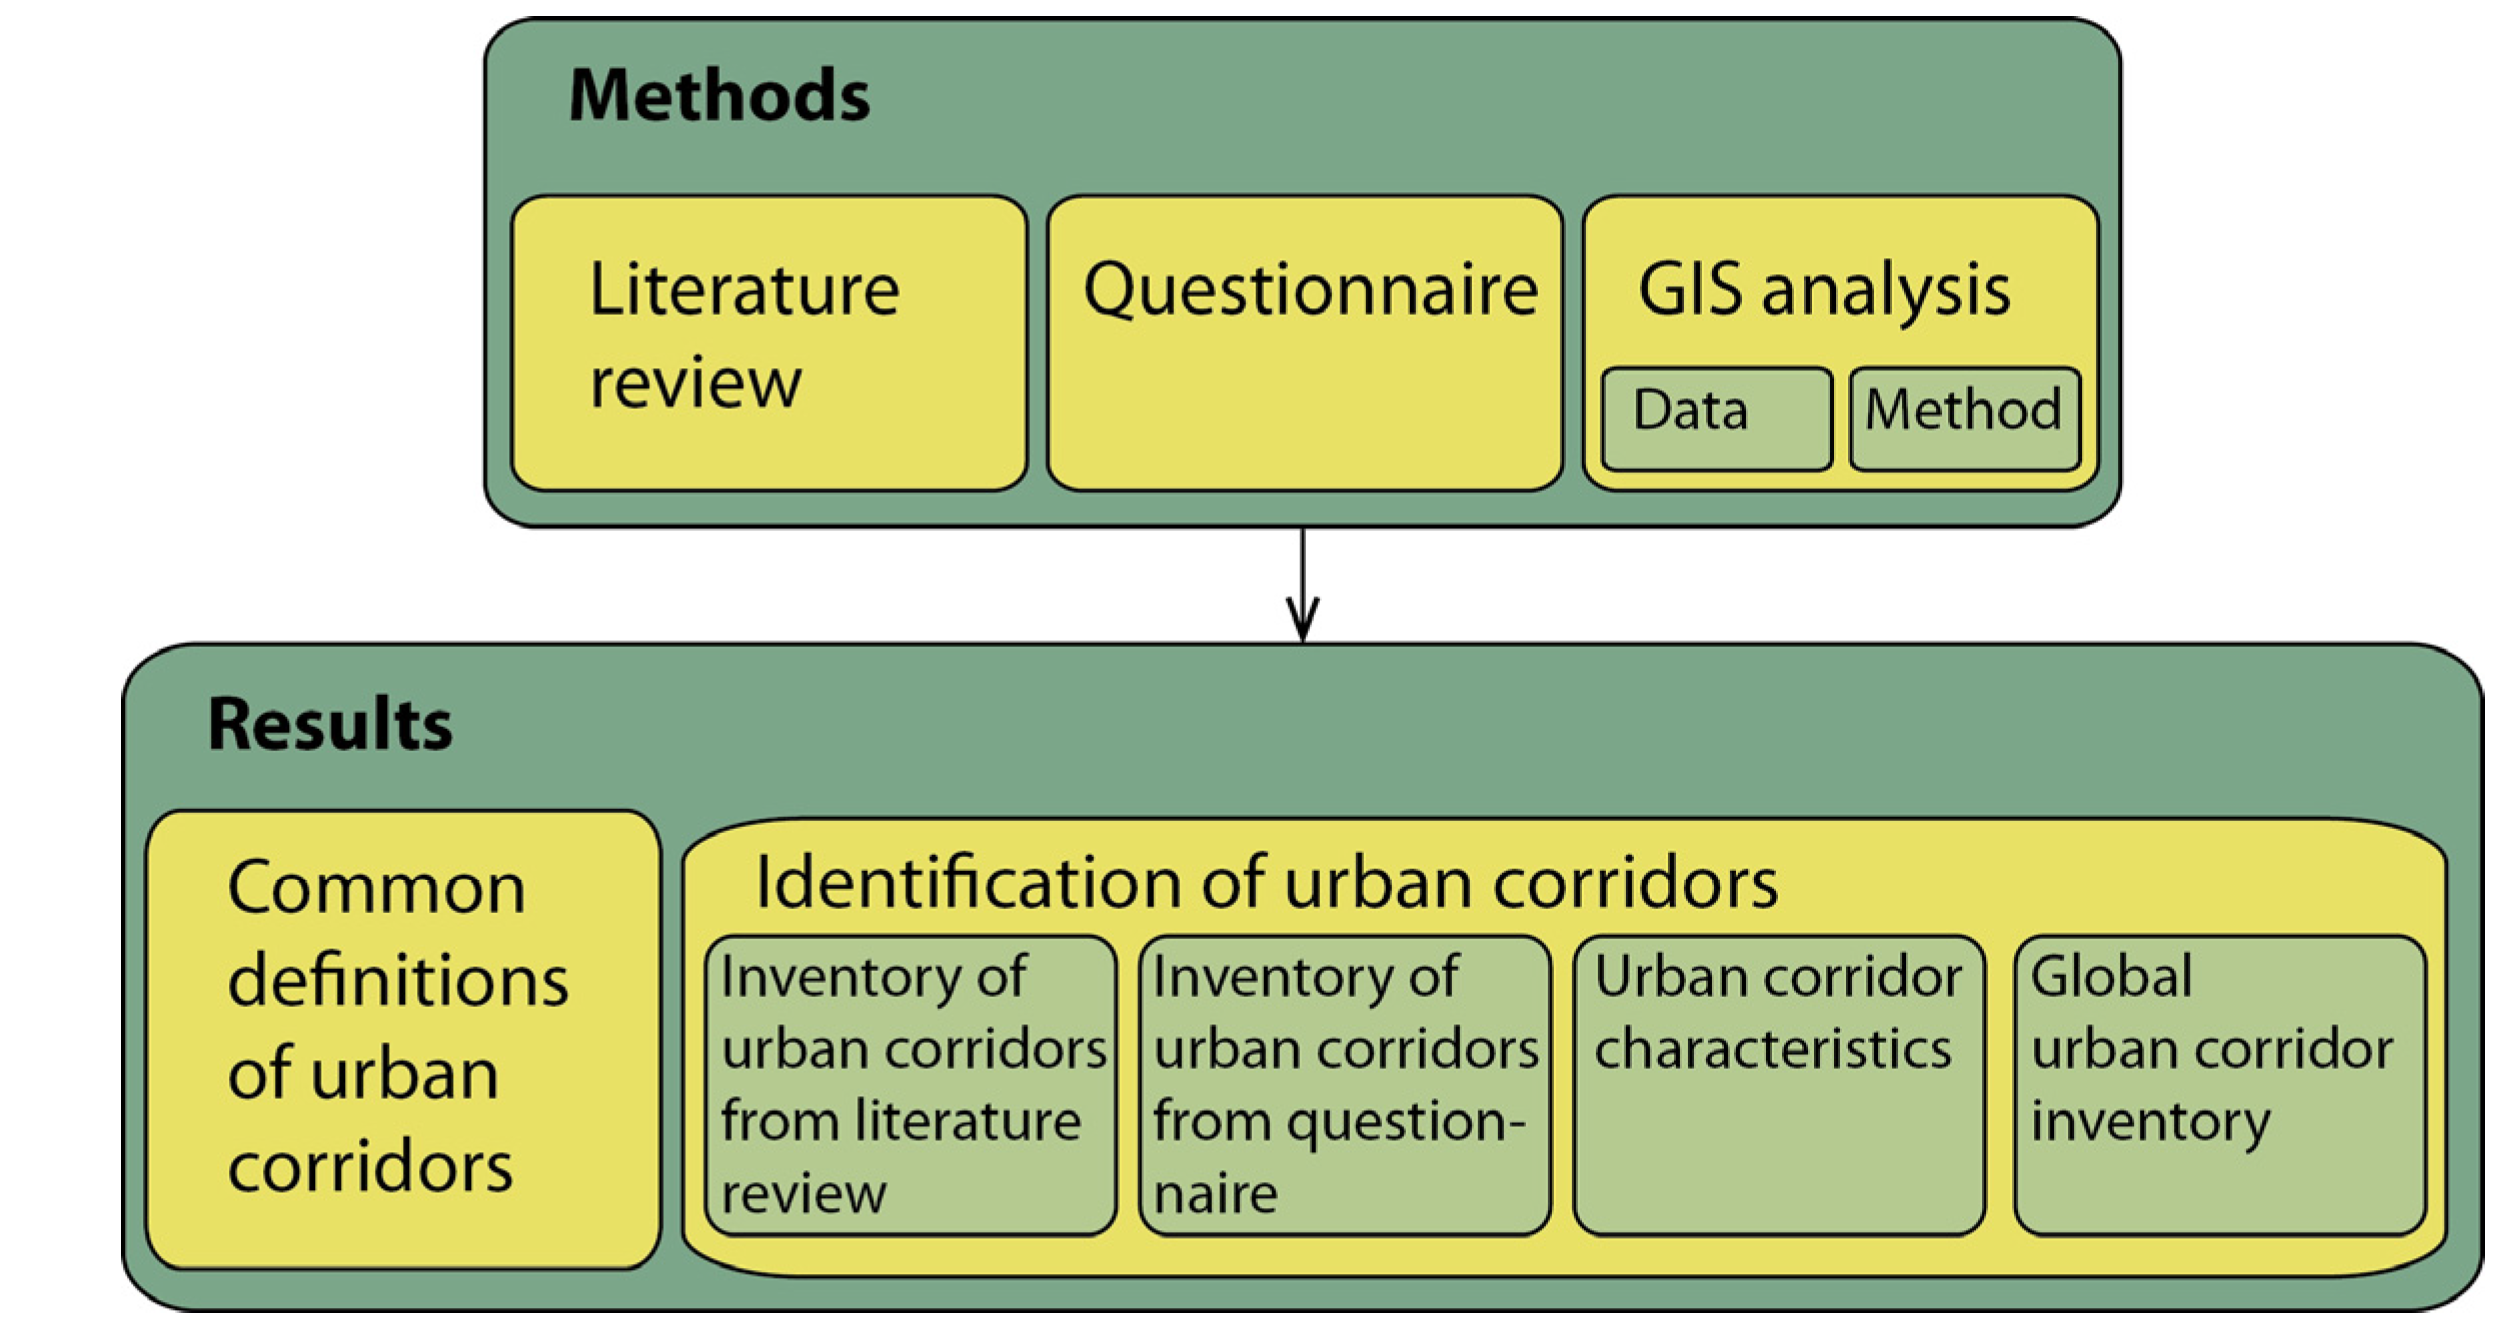
3. Data and Methods
3.1. Literature Review
3.2. Questionnaire
3.3. GIS-based Analysis
3.3.1. Data
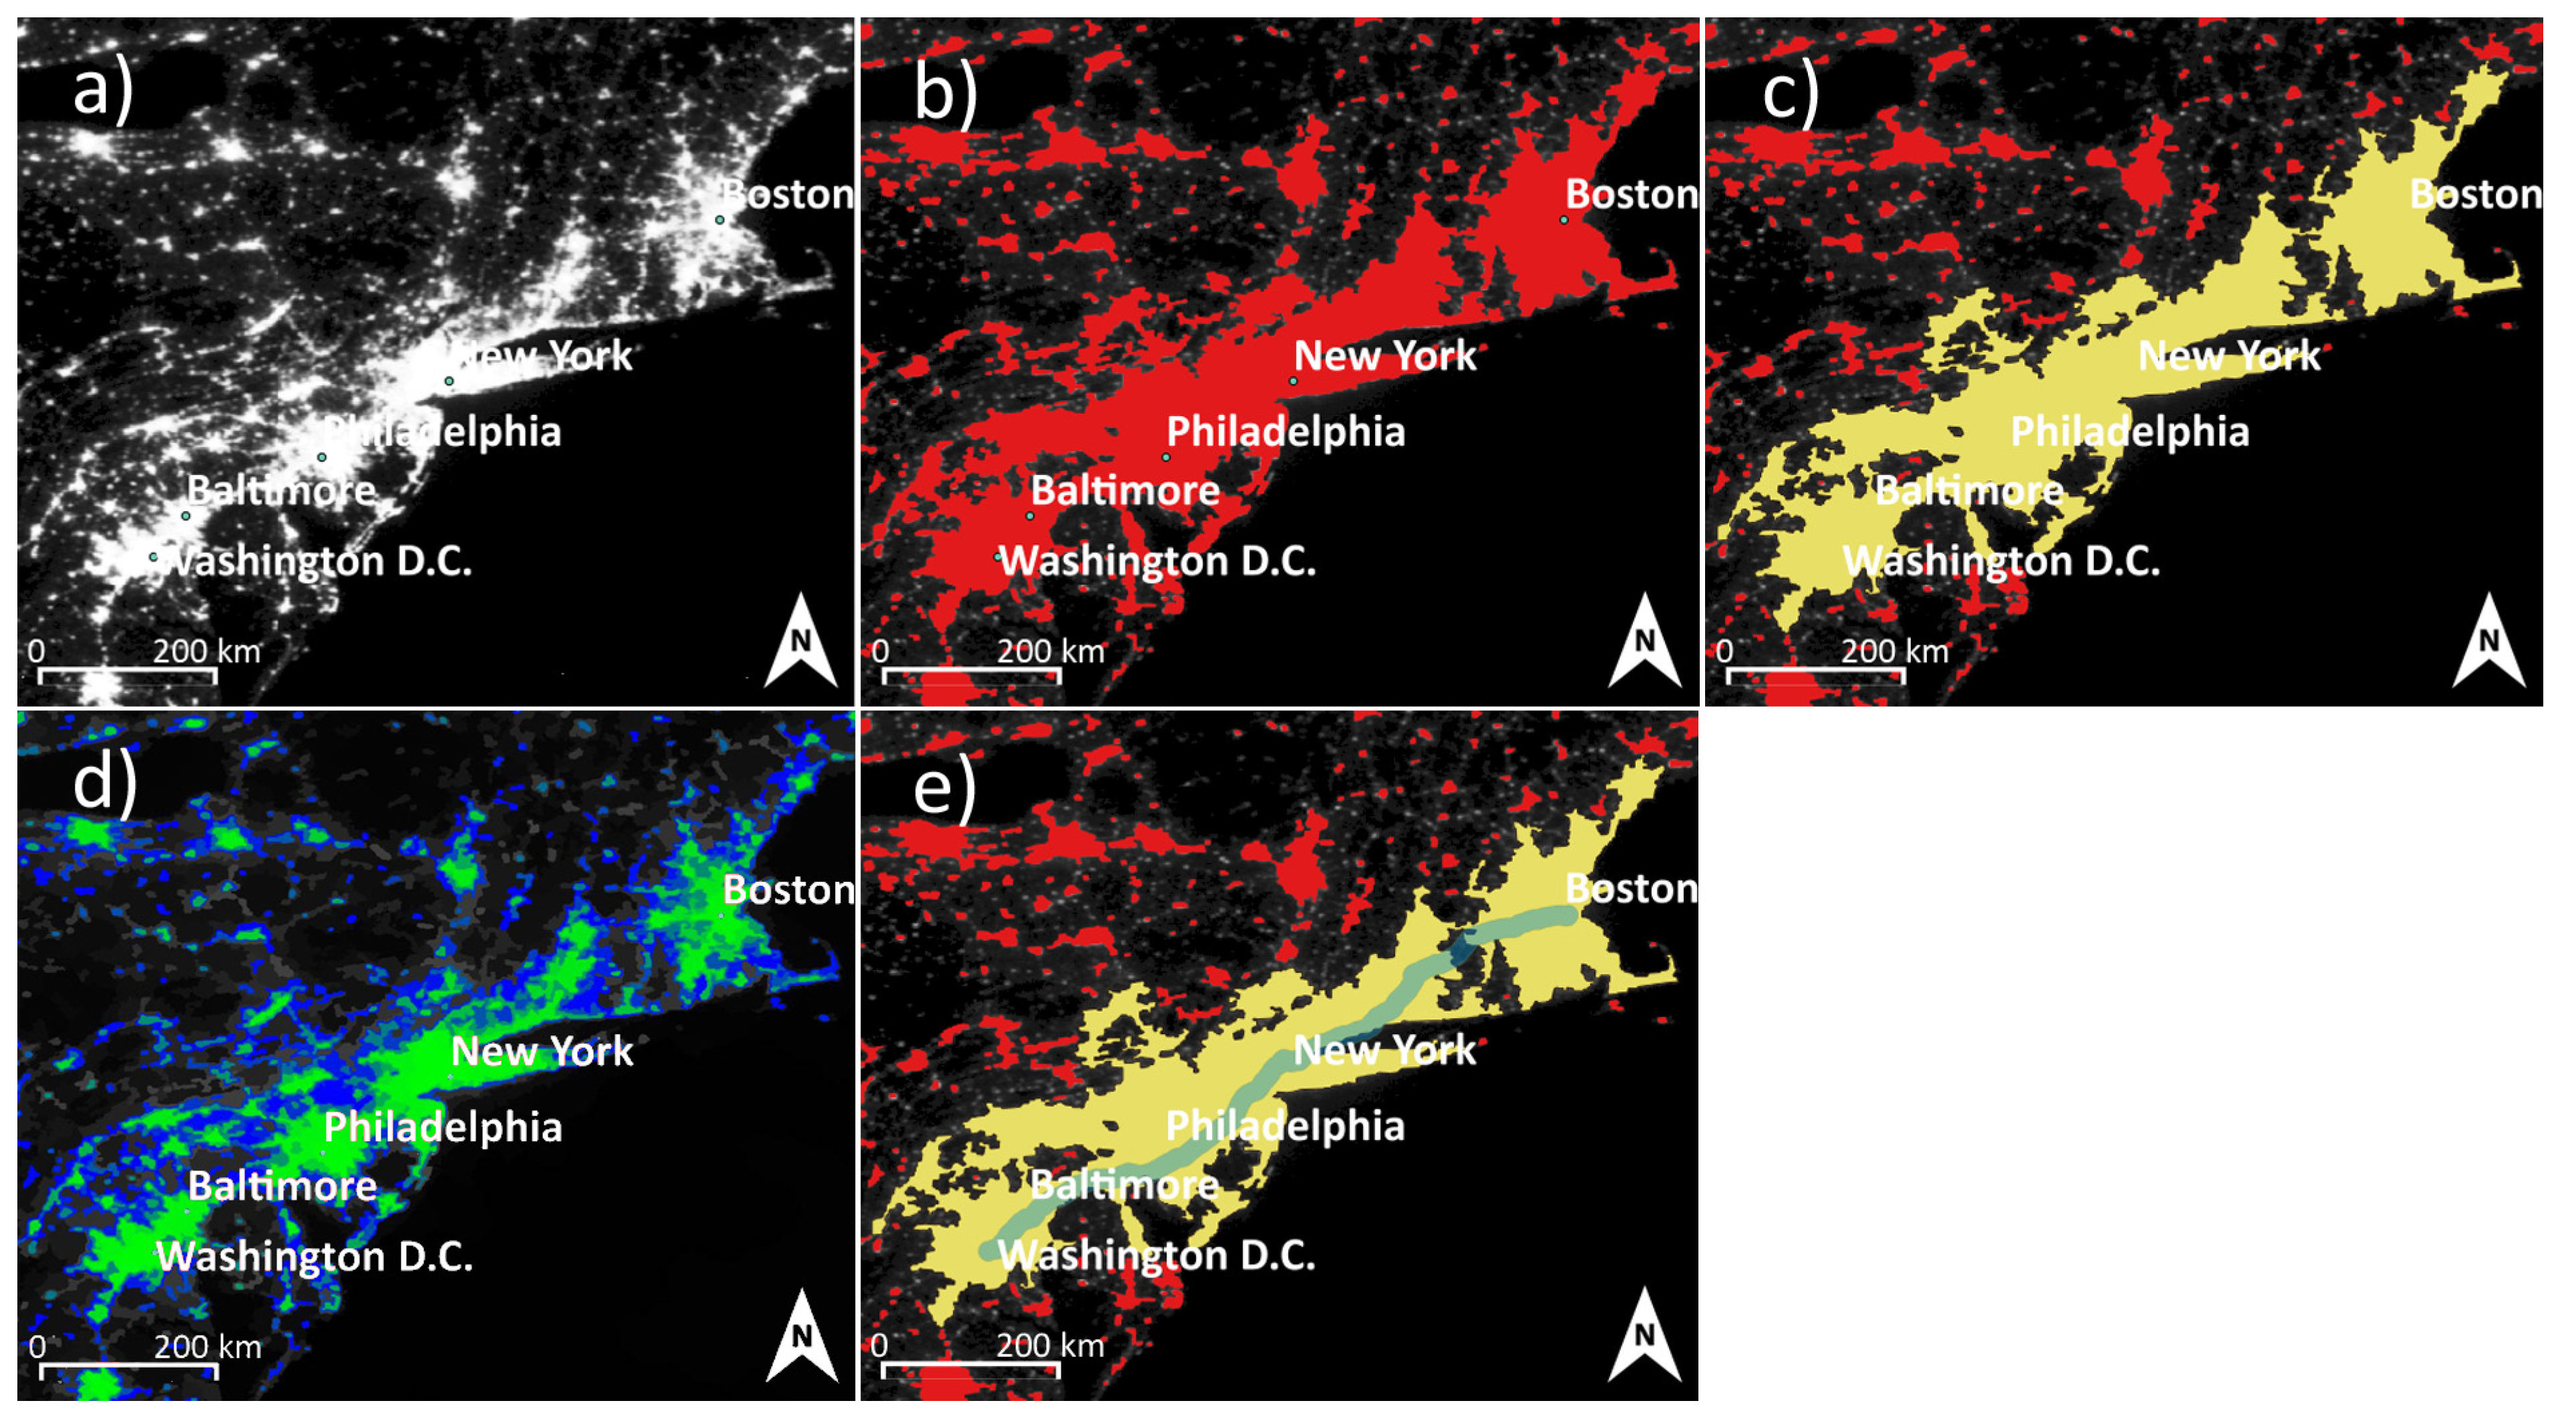
3.3.2. Methods
- It represents a well-studied area which fulfils a first rough definition of an urban corridor (a number of (large) cities, connected by transport infrastructure, linear in shape).
- It is the area most frequently recognized as an urban corridor in our survey and widely accepted in literature.
- Total urban area (calculated from the total area of all night-lit patches of a corridor classified as “urban”).
- Length and width (manual measurement).
- Length-to-width ratio (calculated from measurements).
- Number of gaps along the route (manual count of how many times the route passes through non-urban areas).
4. Results
4.1. Results of Literature Review
4.1.1. Common Definitions of Urban Corridors
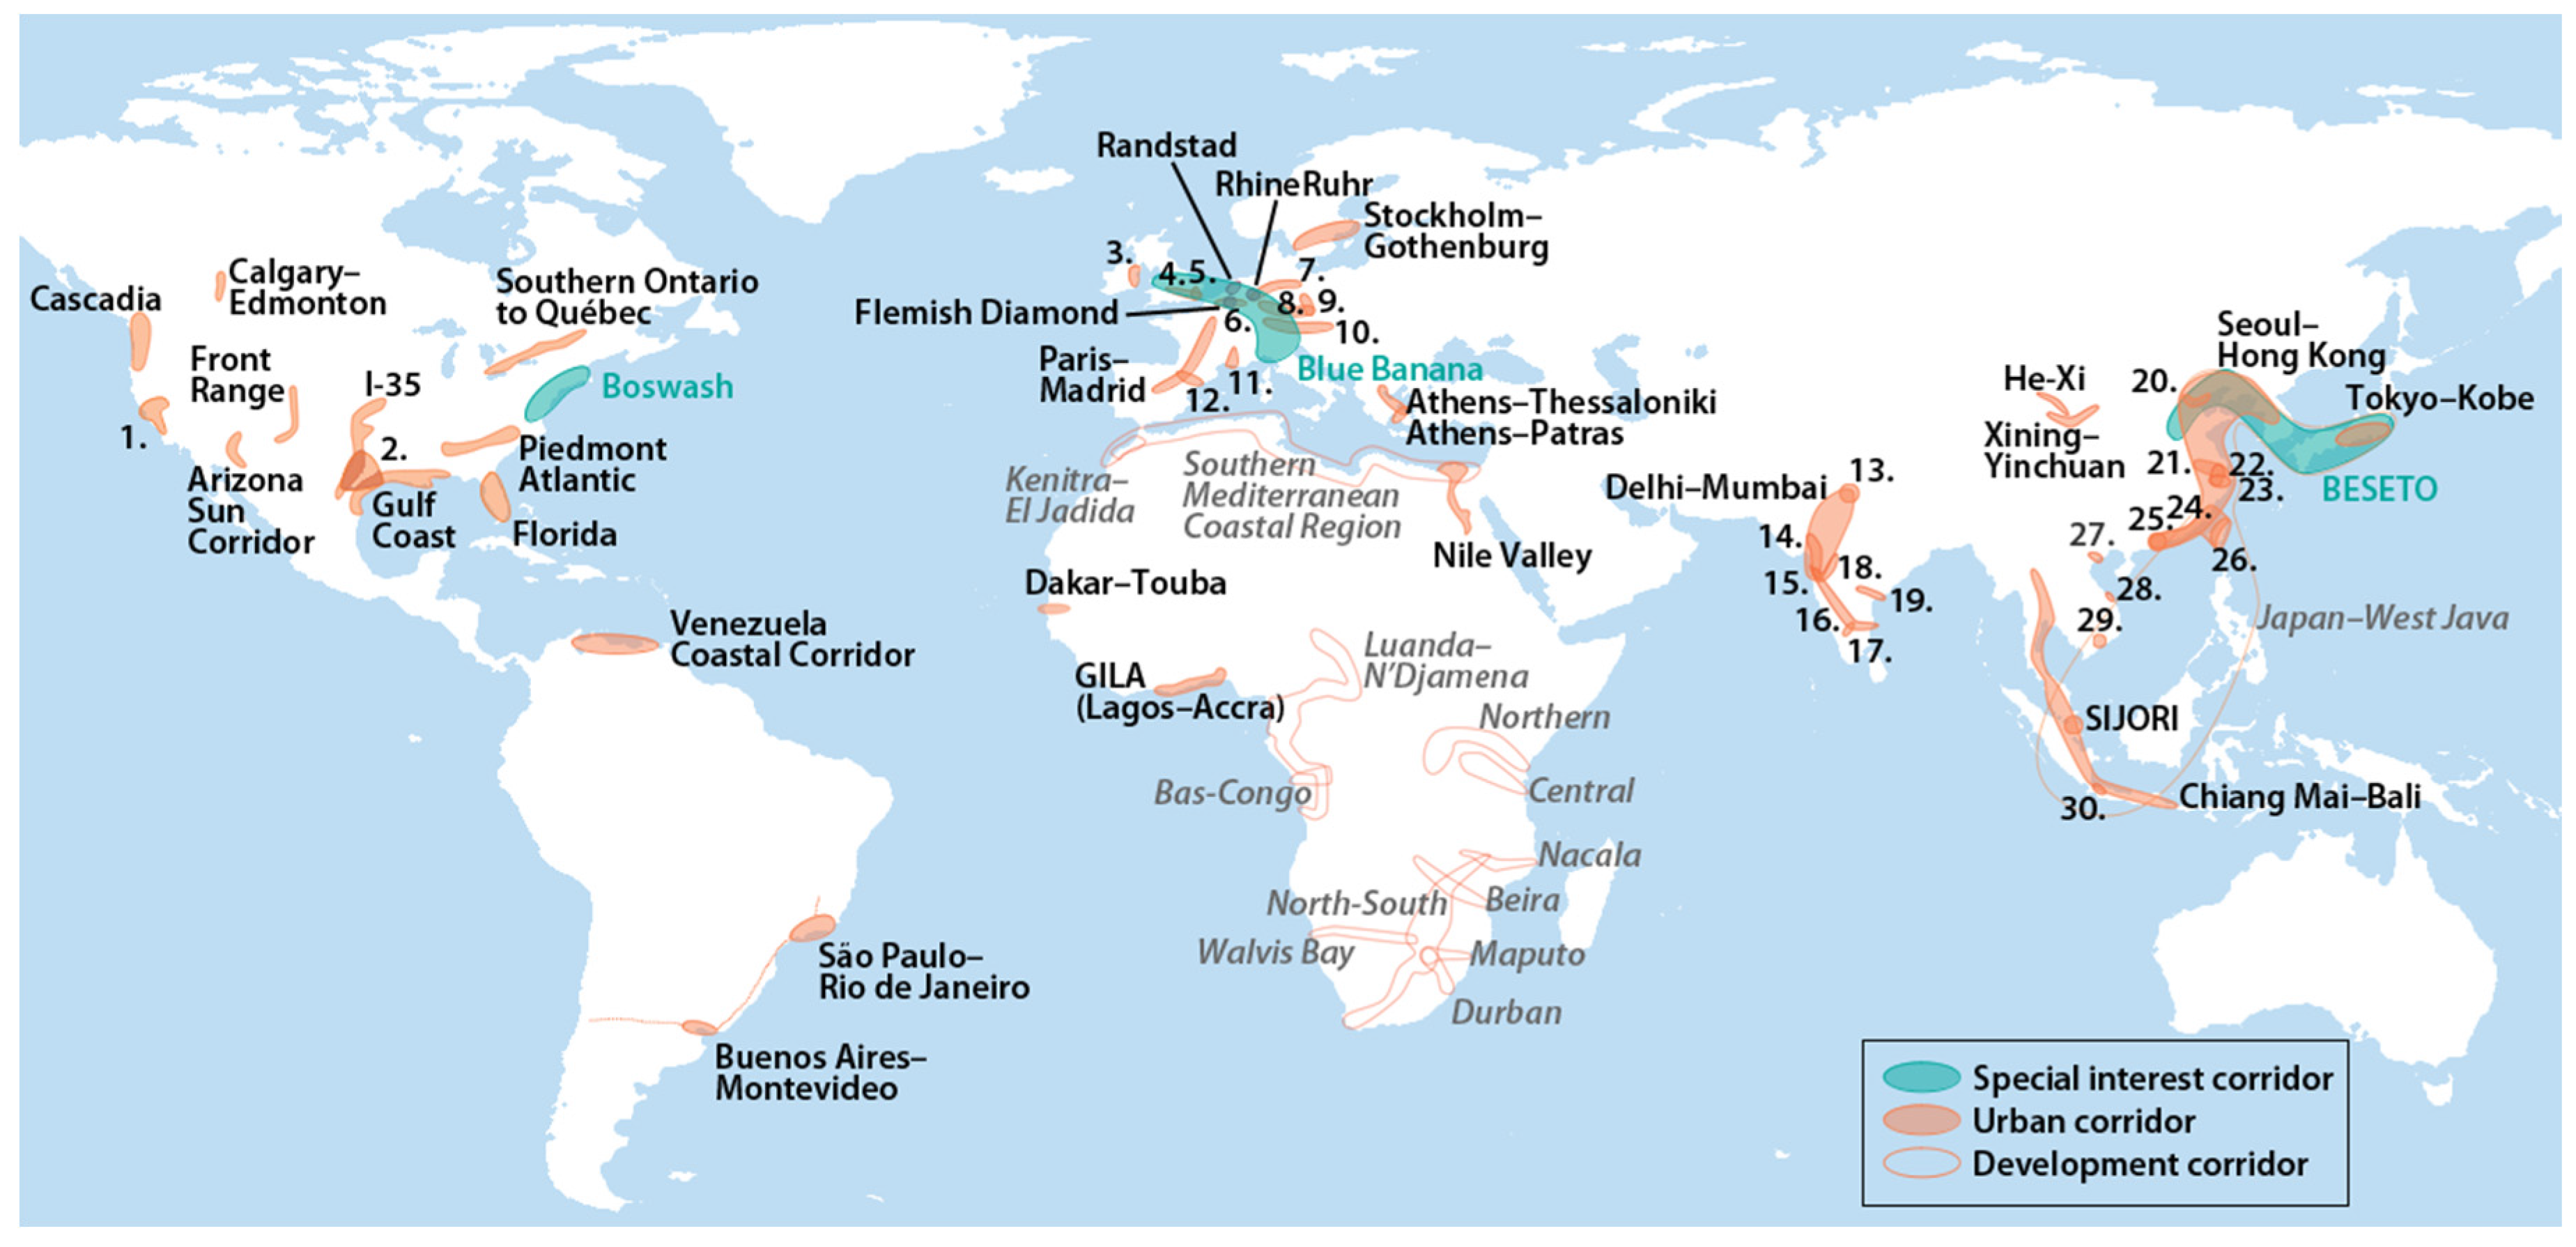
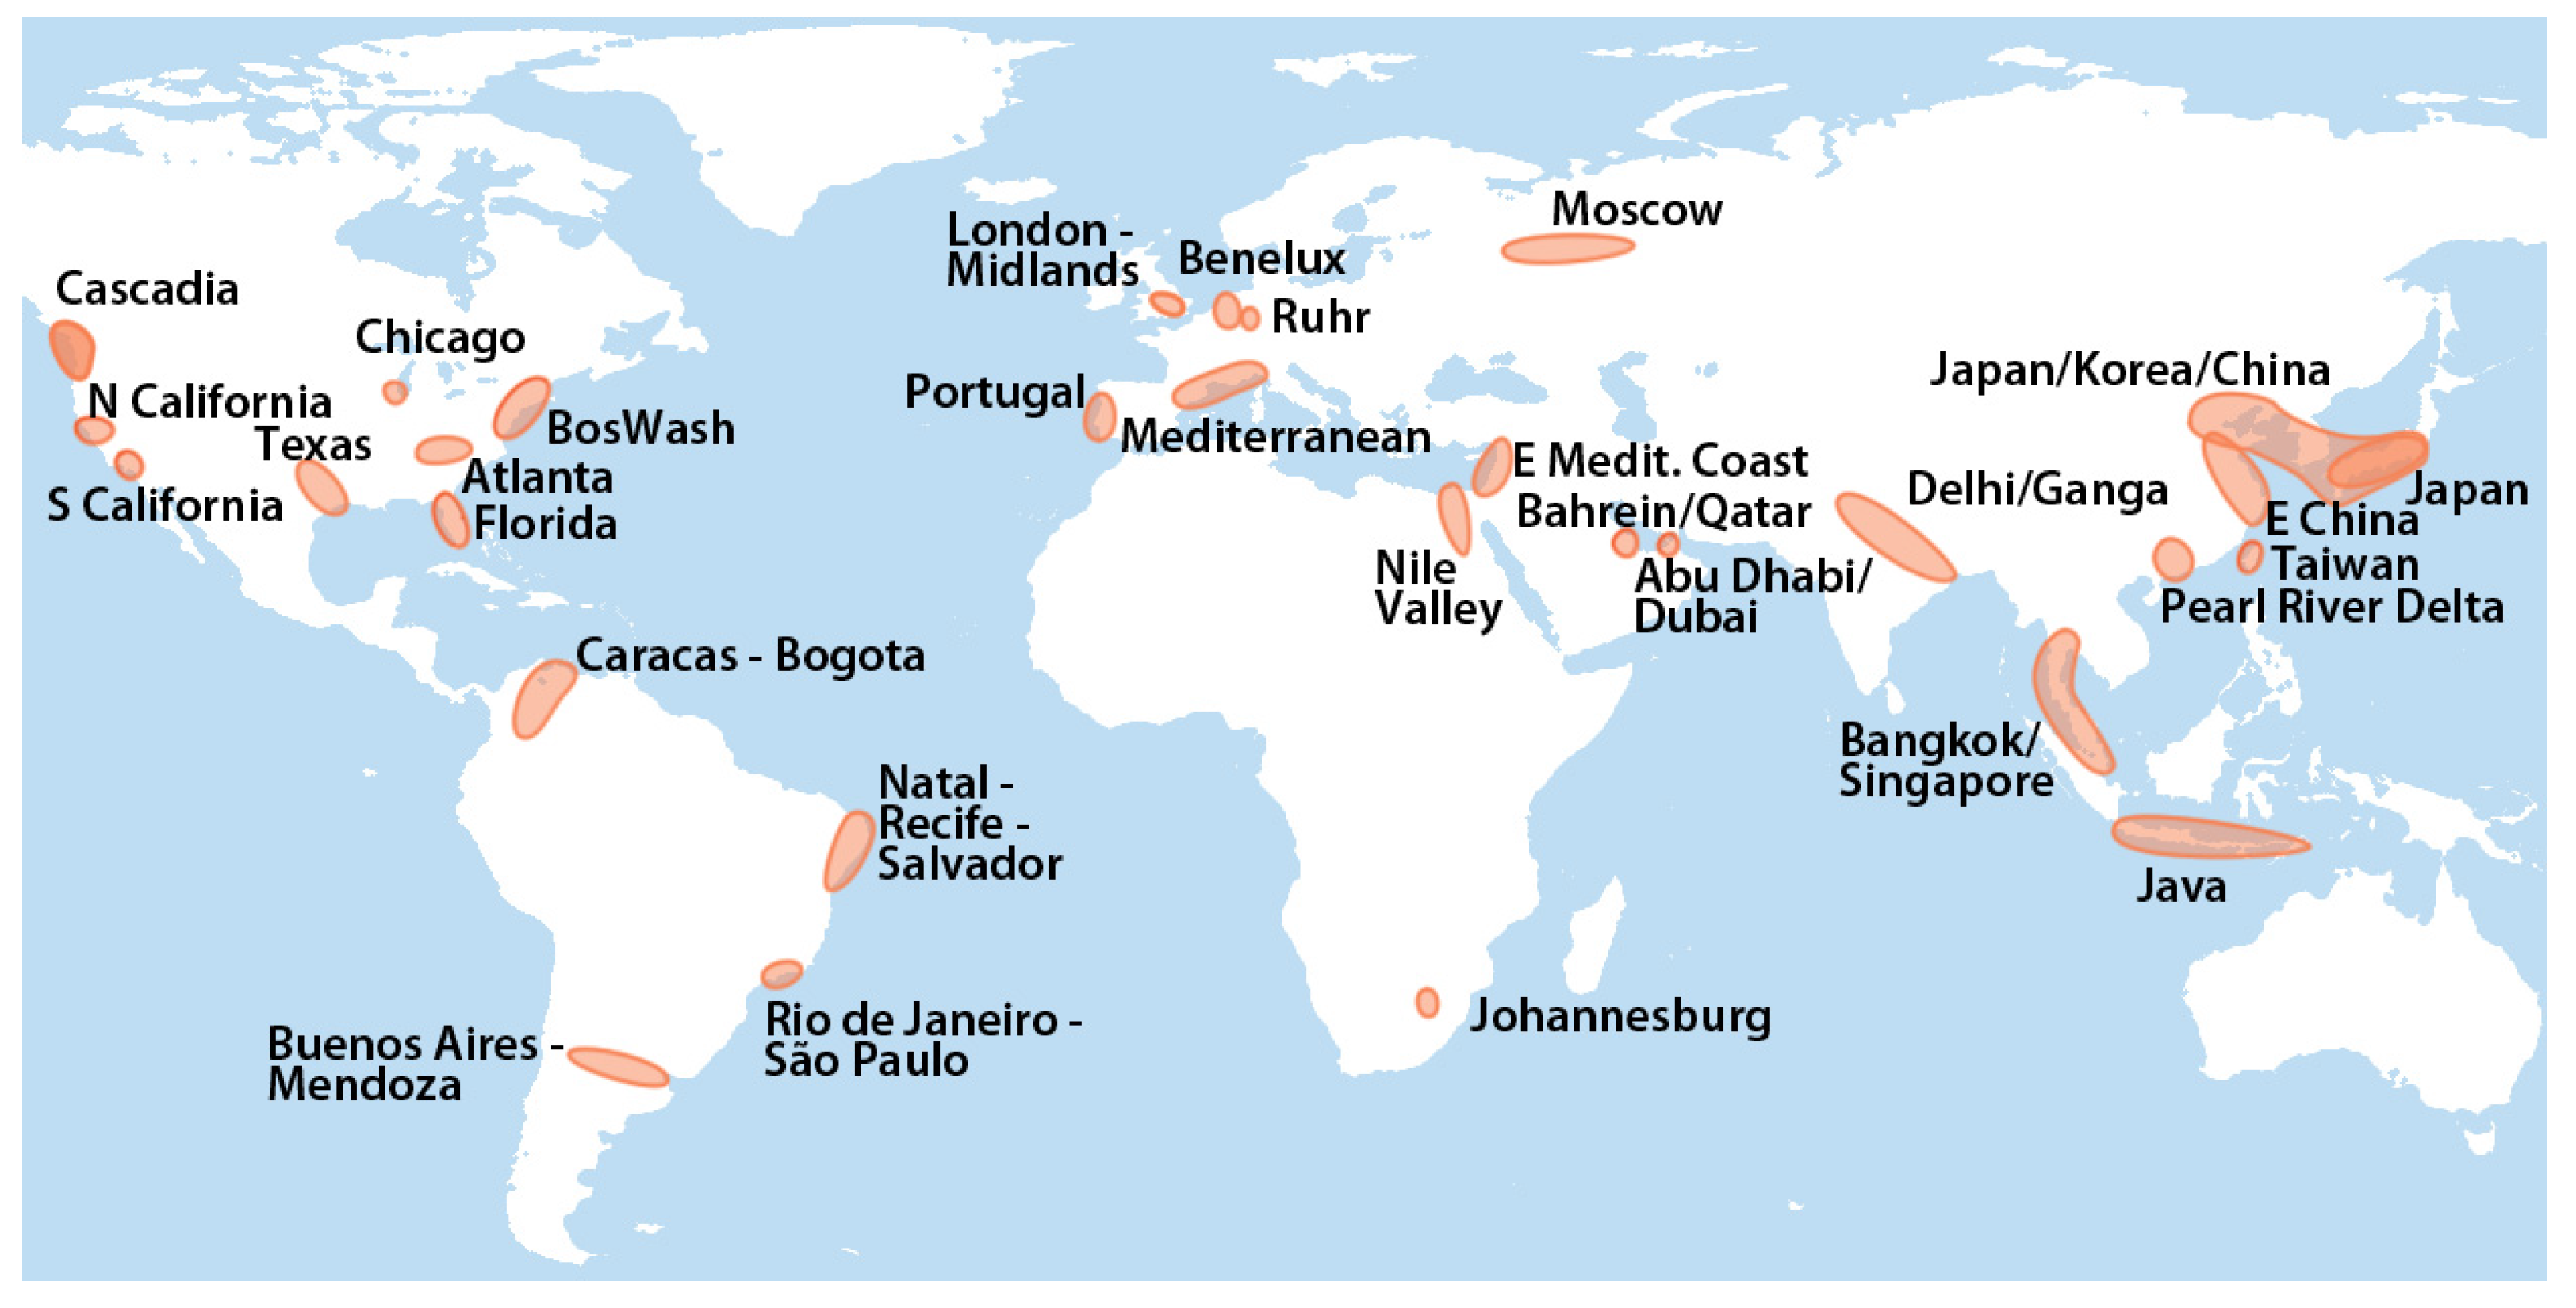
4.1.2. Global Map of Examples from Literature
4.2. Results of Questionnaire
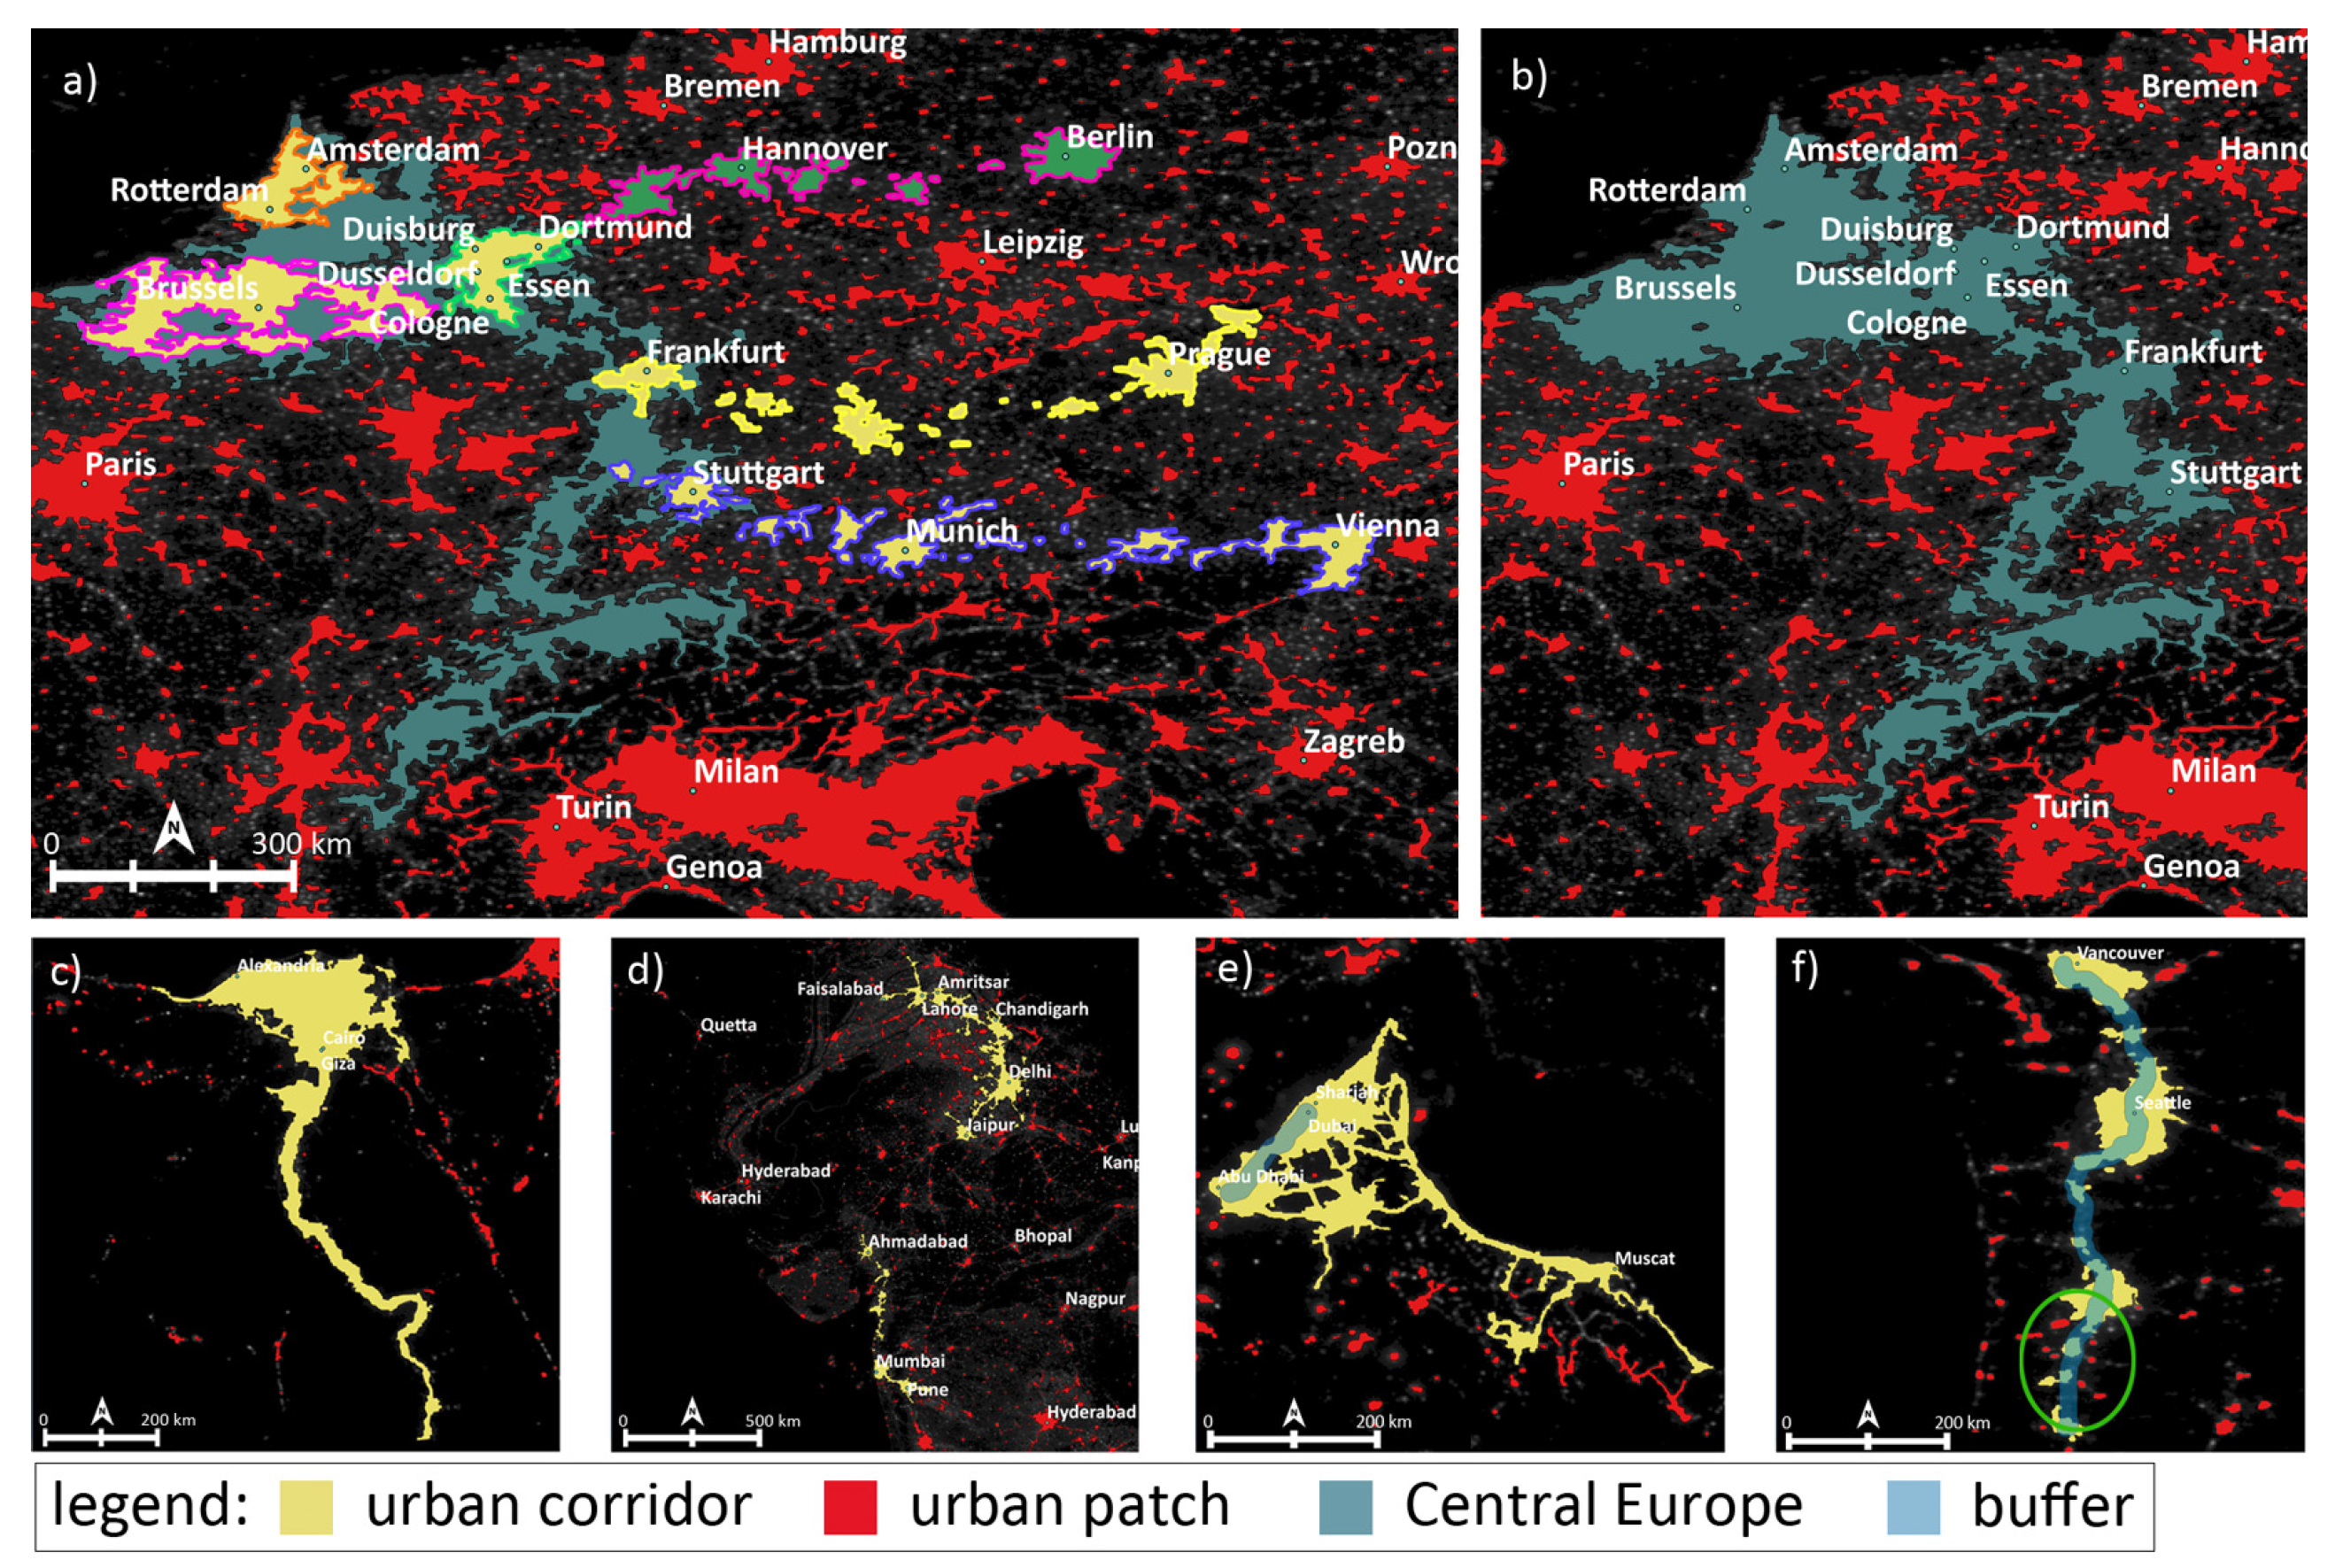
4.3. Results of the Spatial Characterization of Settlement Patterns for Urban Corridors
4.4. Overall Result: Quantification of Urban Corridors
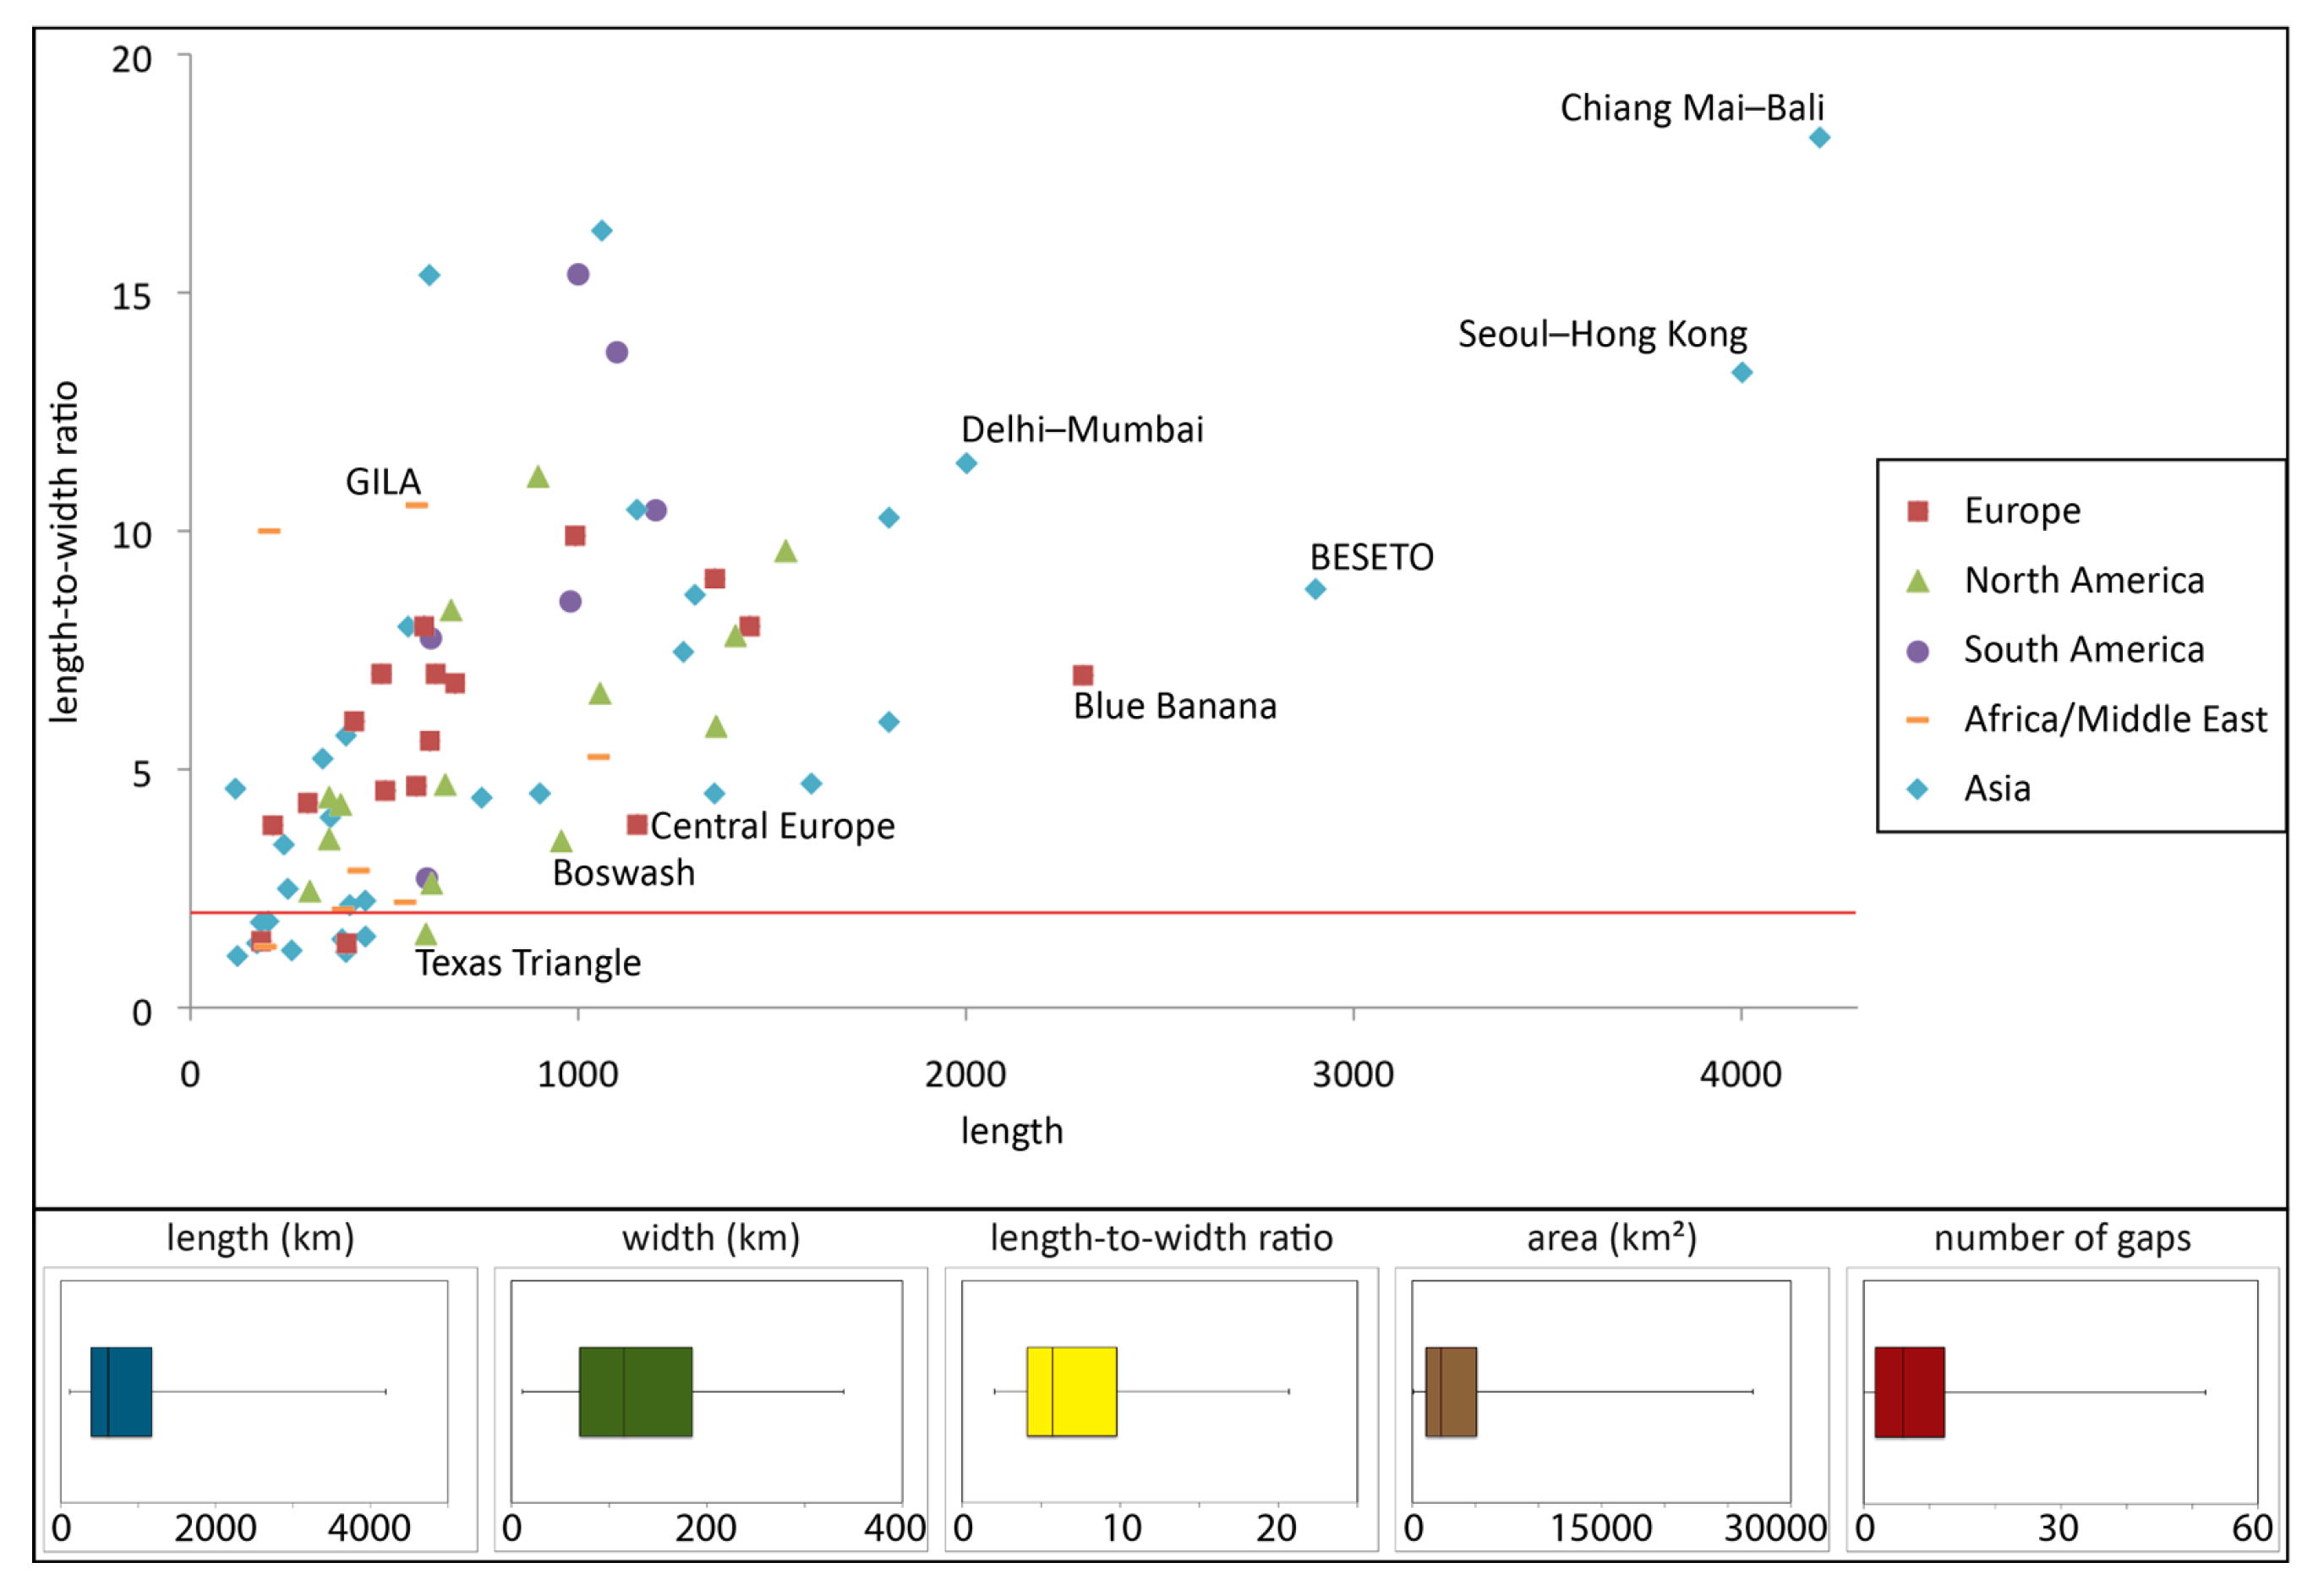
4.4.1. Typical Measures of Urban Corridors
4.4.2. Categories of Urban Corridors
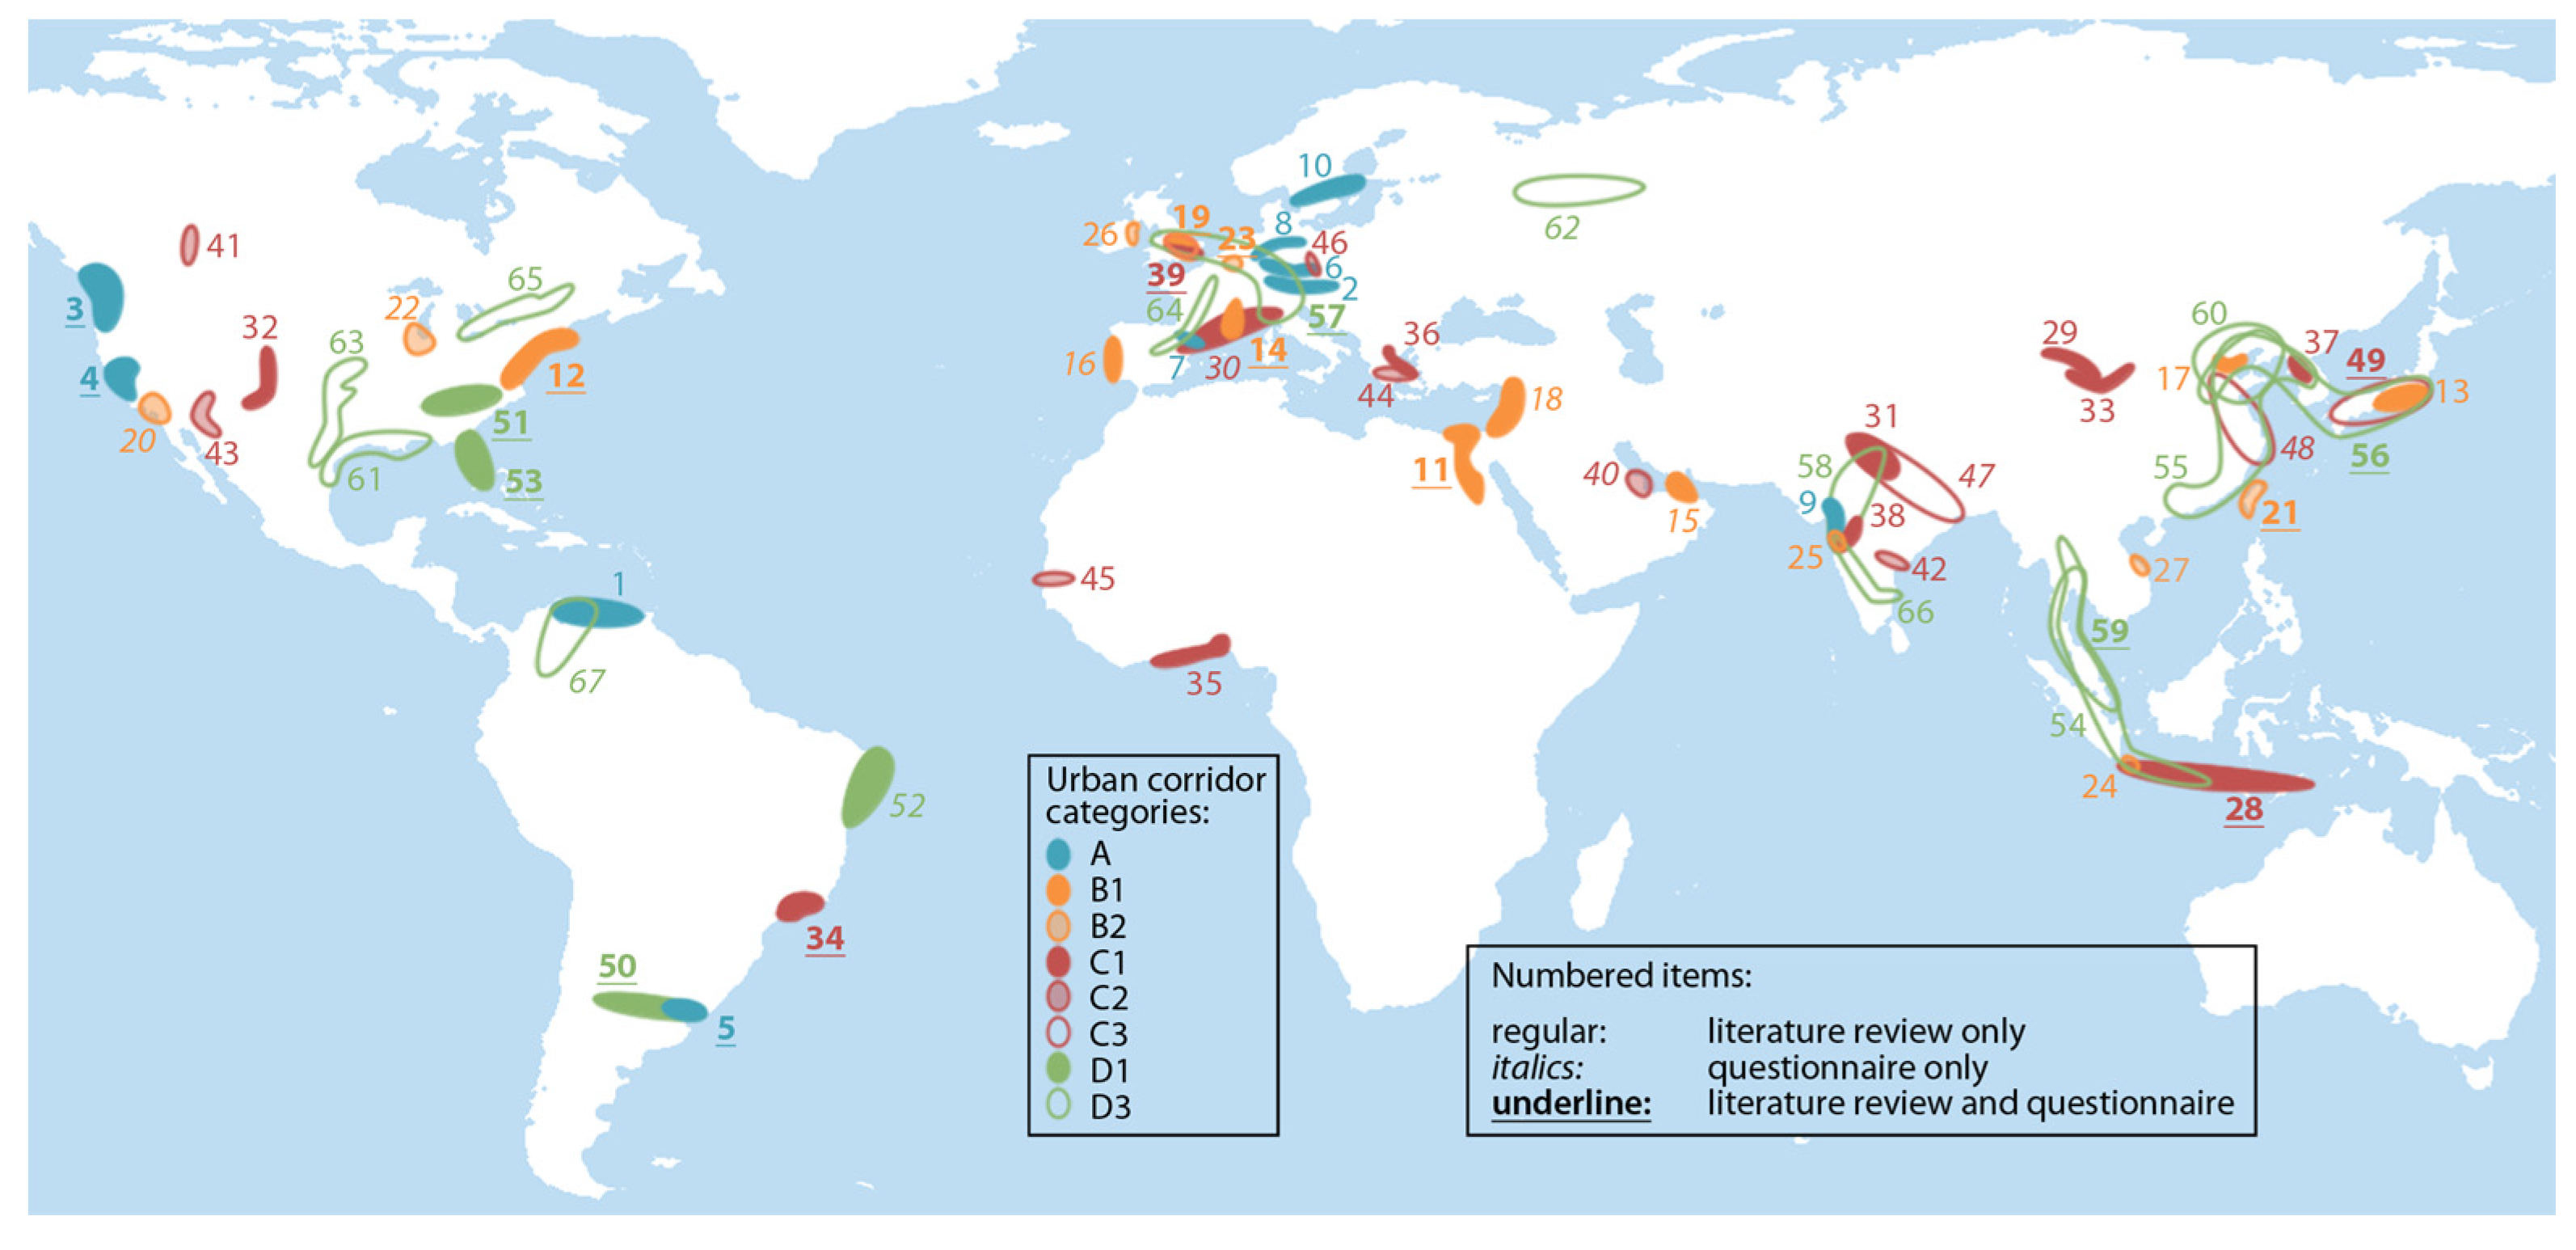
4.4.3. Global Map of Urban Corridors
5. Discussion
6. Conclusions
Supplementary Materials
Acknowledgments
Author Contributions
Conflicts of Interest
References
- Lang, R.E.; Dhavale, D. Beyond Megalopolis: Exploring America’s New “Megapolitan” Geography; Metropolitan Institute, Virginia Technical University: Alexandria, VA, USA, 2005. [Google Scholar]
- UN-Habitat. Planning Sustainable Cities. Global Report on Human Settlements 2009; Earthscan: London, UK; Sterling, VA, USA, 2009. [Google Scholar]
- Morrison Institute. Megapolitan: Arizona’s Sun Corridor; Morrison Institute for Public Policy, Arizona State University: Tempe, AZ, USA, 2008. [Google Scholar]
- Georg, I.; Blaschke, T.; Taubenböck, H. New spatial dimensions of global cityscapes: From reviewing existing concepts to a conceptual spatial approach. J. Geogr. Sci. 2016, 26, 355–380. [Google Scholar] [CrossRef]
- Goldstein, S. Demographic issues and data needs for mega-city research. In Mega-City Growth and the Future; United Nations University Press: Tokyo, Japan; New York, NY, USA; Paris, France, 1994; pp. 32–61. [Google Scholar]
- Bontemps, S.; Defourny, P.; Bogaert, E.V.; Arino, O.; Kalogirou, V.; Perez, J.R. GLOBCOVER 2009. Products Description and Validation Report; Université Catholique de Louvain (UCL): Louvain-la-Neuve, Belgium; European Space Agency (ESA): Paris, France, 2011. [Google Scholar]
- Bartholomé, E.; Belward, A.S. GLC2000: A new approach to global land cover mapping from Earth observation data. Int. J. Remote Sens. 2005, 26, 1959–1977. [Google Scholar]
- Loveland, T.R.; Reed, B.C.; Brown, J.F.; Ohlen, D.O.; Zhu, Z.; Yang, L.; Merchant, J.W. Development of a global land cover characteristics database and IGBP DISCover from 1 km AVHRR data. Int. J. Remote Sens. 2000, 21, 1303–1330. [Google Scholar] [CrossRef]
- Hansen, M.C.; DeFries, R.S.; Townshend, J.R.; Sohlberg, R. Global land cover classification at 1 km spatial resolution using a classification tree approach. Int. J. Remote Sens. 2000, 21, 1331–1364. [Google Scholar] [CrossRef]
- Gamba, P.; Lisini, G. Fast and efficient urban extent extraction using ASAR wide swath mode data. IEEE J. Sel. Top. Appl. Earth Obs. Remote Sens. 2013, 6, 2184–2195. [Google Scholar] [CrossRef]
- Schneider, A.; Friedl, M.A.; Potere, D. Mapping global urban areas using MODIS 500-m data: New methods and datasets based on ‘urban ecoregions’. Remote Sens. Environ. 2010, 114, 1733–1746. [Google Scholar] [CrossRef]
- Esch, T.; Marconcini, M.; Felbier, A.; Roth, A.; Heldens, W.; Huber, M.; Schwinger, M.; Taubenböck, H.; Müller, A.; Dech, S. Urban footprint processor—Fully automated processing chain generating settlement masks from global data of the TanDEM-X mission. IEEE Geosci. Remote Sens. Lett. 2013, 10, 1617–1621. [Google Scholar] [CrossRef] [Green Version]
- Pesaresi, M.; Huadong, G.; Blaes, X.; Ehrlich, D.; Ferri, S.; Gueguen, L.; Marin-Herrera, M.A. A Global human settlement layer from optical HR/VHR RS data: Concept and first results. IEEE J. Sel. Top. Appl. Earth Obs. Remote Sens. 2013, 6, 2102–2131. [Google Scholar] [CrossRef]
- Angel, S.; Parent, J.; Civco, D.L.; Blei, A.M. Making Room for a Planet of Cities; Policy Focus Report; Lincoln Institute of Land Policy: Cambridge, MA, USA, 2011. [Google Scholar]
- Taubenböck, H.; Esch, T.; Felbier, A.; Wiesner, M.; Roth, A.; Dech, S. Monitoring urbanization in mega cities from space. Remote Sens. Environ. 2012, 117, 162–176. [Google Scholar]
- Miyazaki, H.; Shao, X.; Iwao, K.; Shibasaki, R. An automated method for global urban area mapping by integrating ASTER satellite images and GIS data. IEEE J. Sel. Top. Appl. Earth Obs. Remote Sens. 2013, 6, 1004–1019. [Google Scholar] [CrossRef]
- Taubenböck, H.; Wiesner, M. The spatial network of megaregions—Types of connectivity between cities based on settlement patterns derived from EO-data. Comput. Environ. Urban Syst. 2015, 54, 165–180. [Google Scholar]
- Bagan, H.; Yamagata, Y. Landsat analysis of urban growth: How Tokyo became the world’s largest megacity during the last 40 years. Remote Sens. Environ. 2012, 127, 210–222. [Google Scholar] [CrossRef]
- Trip, J.J. The corridor as a transport network. In Megacorridors in North West Europe. Investigating a New Transnational Planning Concept; Delft University Press: Delft, The Netherlands, 2003; pp. 17–23. [Google Scholar]
- Li, P.; Cao, X.-S. Evolution and development of Guangzhou-Hong Kong corridor. Chin. Geogr. Sci. 2005, 15, 206–211. [Google Scholar] [CrossRef]
- Chapman, D.; Pratt, D.; Larkham, P.; Dickins, I. Concepts and definitions of corridors: Evidence from England‘s Midlands. J. Transp. Geogr. 2003, 11, 179–191. [Google Scholar] [CrossRef]
- Florida, R.; Gulden, T.; Mellander, C. The rise of the mega-region. Camb. J. Reg. Econ. Soc. 2008, 1, 459–476. [Google Scholar] [CrossRef]
- Laquian, A.A. The planning and governance of Asia’s mega-urban regions. In Population Distribution, Urbanization, Internal Migration and Development: An International Perspective; United Nations Publication: Vienna, Austria, 2011; pp. 302–322. [Google Scholar]
- The Organisation for Economic Co-operation and Development (OECD). Redefining “Urban”: A New Way to Measure Metropolitan Areas; OECD Publishing: Paris, France, 2012. [Google Scholar]
- Lang, R.E.; Nelson, A.C. Beyond the Metroplex: Examining Commuter Patterns at the “Megapolitan” Scale; Working Paper; Lincoln Institute of Land Policy: Cambridge, MA, USA, 2007. [Google Scholar]
- UN-Habitat. State of the World’s Cities 2010/2011: Bridging the Urban Divide; Earthscan: London, UK; Sterling, VA, USA, 2008. [Google Scholar]
- Earth Observation Group (EOG). Available online: https://www.ngdc.noaa.gov/eog/index.html (accessed on 8 September 2016).
- Welch, R. Monitoring urban population and energy utilization patterns from satellite data. Remote Sens. Environ. 1980, 9, 1–9. [Google Scholar] [CrossRef]
- Elvidge, C.; Imhoff, M.L.; Baugh, K.E.; Hobson, V.R.; Nelson, I.; Safran, J.; Dietz, J.B.; Tuttle, B.T. Nighttime lights of the world: 1994–1995. ISPRS J. Photogramme. Remote Sens. 2001, 56, 81–99. [Google Scholar] [CrossRef]
- Imhoff, M.L.; Lawrence, W.T.; Stutzer, D.C.; Elvidge, C.D. A technique for using composite DMSP/OLS “city lights” satellite data to map urban area. Remote Sens. Environ. 1997, 61, 361–370. [Google Scholar] [CrossRef]
- Doll, C.N.; Muller, J.P.; Morley, J.G. Mapping regional economic activity from night-time light satellite imagery. Ecol. Econ. 2006, 57, 75–92. [Google Scholar] [CrossRef]
- OSRM. Available online: http://map.project-osrm.org (accessed on 8 September 2016).
- Shafizadeh Moghadam, H.; Helbich, M. Spatiotemporal urbanization processes in the megacity of Mumbai, India: A Markov chains-cellular automata urban growth model. Appl. Geogr. 2013, 40, 140–149. [Google Scholar] [CrossRef]
- Vaz, E.; Jokar Arsanjani, J. Crowdsourced mapping of land use in urban dense environments: An assessment of Toronto. Can. Geogr./Le Géogr. Can. 2015, 59, 246–255. [Google Scholar] [CrossRef]
- Crooks, A.; Pfoser, D.; Jenkins, A.; Croitoru, A.; Stefanidis, A.; Smith, D.; Karagiorgou, S.; Efentakis, A.; Lamprianidis, G. Crowdsourcing urban form and function. Int. J. Geogr. Inf. Sci. 2015, 29, 720–741. [Google Scholar] [CrossRef]
- Elvidge, C.D.; Tuttle, B.T.; Sutton, P.C.; Baugh, K.E.; Howard, A.T.; Milesi, C.; Bhaduri, B.L.; Nemani, R. Global distribution and density of constructed impervious surfaces. Sensors 2007, 7, 1962–1979. [Google Scholar] [CrossRef]
- Whebell, C.F. Corridors: A theory of urban systems. Ann. Assoc. Am. Geogr. 1969, 59, 1–26. [Google Scholar] [CrossRef]
- Priemus, H. Szenarien und Konzepte für die Entwicklung von Korridoren in den Niederlanden und in der Europäischen Union. Inf. Raumentwickl. 2004, 1–2, 35–48. [Google Scholar]
- Priemus, H.; Zonneveld, W. What are corridors and what are the issues? Introduction to special issue: The governance of corridors. J. Transp. Geogr. 2003, 11, 167–177. [Google Scholar] [CrossRef]
- Albrechts, L.; Tasan-Kok, T. Corridor and axis development. In International Encyclopedia of Human Geography; Kitchin, R., Thrift, N., Eds.; Elsevier Science & Technology: London, UK, 2009; pp. 298–304. [Google Scholar]
- Trip, J.J. The corridor as an axis of economic development. In Megacorridors in North West Europe. Investigating a New Transnational Planning Concept; Zonneveld, W., Trip, J.J., Eds.; Delft University Press: Delft, The Netherlands, 2003; pp. 24–35. [Google Scholar]
- Batten, D.F. Network cities: Creative urban agglomerations for the 21st century. Urban Stud. 1995, 32, 313–327. [Google Scholar] [CrossRef]
- Kunzmann, K.R. World city regions in Europe: Structural change and future challenges. In Globalization and the World of Large Cities; Lo, F.C., Yeung, Y.-M., Eds.; United Nations University Press: Tokyo, Japan; New York, NY, USA; Paris, France, 1998; pp. 37–75. [Google Scholar]
- Neuman, M. Regional design: Recovering a great landscape architecture and urban planning tradition. Landsc. Urban Plan. 2000, 47, 115–128. [Google Scholar] [CrossRef]
- UN-Habitat. State of the World’s Cities 2012/2013: Prosperity of Cities; Earthscan: London, UK; Sterling, VA, USA, 2013. [Google Scholar]
- UN-Habitat. The State of African Cities 2008; A Framework for Addressing Urban Challenges in Africa; UN-Habitat: Nairobi, Kenya, 2008. [Google Scholar]
- UN-Habitat. The State of African Cities 2010; Governance, Inequality and Urban Land Markets; UN-Habitat: Nairobi, Kenya, 2010. [Google Scholar]
- Dharmapatni, I.A.I.; Firman, T. Problems and challenges of mega-urban regions in Indonesia: The case of Jabotabek and the Bandung metropolitan area. In The Mega-Urban Regions of Southeast Asia; McGee, T.G., Robinson, I.M., Eds.; UBC Press: Vancouver, BC, Canada, 1995; pp. 296–314. [Google Scholar]
- McGee, T.G. The emergence of Depakote regions in Asia: Expanding a hypothesis. In The Extended Metropolis: Settlement Transition in Asia; Ginsburg, N., Koppel, B., McGee, T.G., Eds.; University of Hawaii Press: Honolulu, HI, USA, 1991; pp. 3–26. [Google Scholar]
- Choe, S.C. Urban corridors in Pacific Asia. In Globalization and the World of Large Cities; Lo, F.C., Yeung, Y.M., Eds.; UNU Press: Tokyo, Japan, 1998; pp. 155–173. [Google Scholar]
- Doxiadis, C.A. Ecumenopolis: Tomorrow’s City; Britannica Book of the Year; Encyclopaedia Britannica: Chicago, IL, USA, 1968. [Google Scholar]
- Lo, F.-C.; PMarcotullio, P.J. Globalization and urban transformations in the Asia Pacific region. In Globalization and the Sustainability of Cities in the Asia Pacific Region; Lo, F.-C., Marcotullio, P.J., Eds.; United Nations University Press: Tokyo, Japan; New York, NY, USA; Paris, France, 2001; pp. 21–67. [Google Scholar]
- Yeung, Y.-M.; Lo, F.-C. Global restructuring and emerging urban corridors in Pacific Asia. In Emerging World Cities in Pacific Asia; Lo, F.-C., Yeung, Y.-M., Eds.; UNU Press: Tokyo, Japan, 1996; pp. 17–47. [Google Scholar]
- Small, C.; Pozzi, F.; Elvidge, C.D. Spatial analysis of global urban extent from DMSP-OLS night lights. Remote Sens. Environ. 2005, 96, 277–291. [Google Scholar] [CrossRef]
- Elvidge, C.D.; Baugh, K.E.; Zhizhin, M.; Hsu, F.C. Why VIIRS data are superior to DMSP for mapping nighttime lights. Proc. Asia-Pac. Adv. Netw. 2013, 35, 62–69. [Google Scholar] [CrossRef]
- Coscieme, L.; Pulselli, F.M.; Bastianoni, S.; Elvidge, C.D.; Anderson, S.; Sutton, P.C. A thermodynamic geography: Night-time satellite imagery as a proxy measure of energy. Ambio 2014, 43, 969–979. [Google Scholar] [CrossRef] [PubMed]
- GaWC. Available online: http://www.lboro.ac.uk/gawc/ (accessed on 8 September 2016).
- Global Cities 2016. Available online: https://www.atkearney.com/research-studies/global-cities-index (accessed on 8 September 2016).


| Category | Description | ||||
|---|---|---|---|---|---|
| Number of Gaps | Length | Width | Length-to-Width Ratio | Area | |
| A | within IQR | within IQR | within IQR | within IQR | within IQR |
| B1 | within Q1 | within IQR | Q1, IQR or Q3 | Q1, IQR or Q3 | Q1, IQR or Q3 |
| B2 | within Q1 | within Q1 | Q1, IQR or Q3 | Q1, IQR or Q3 | Q1, IQR or Q3 |
| B3 | within Q1 | within Q3 | Q1, IQR or Q3 | Q1, IQR or Q3 | Q1, IQR or Q3 |
| C1 | within IQR | within IQR | Q1, IQR or Q3 | Q1, IQR or Q3 | Q1, IQR or Q3 |
| C2 | within IQR | within Q1 | Q1, IQR or Q3 | Q1, IQR or Q3 | Q1, IQR or Q3 |
| C3 | within IQR | within Q3 | Q1, IQR or Q3 | Q1, IQR or Q3 | Q1, IQR or Q3 |
| D1 | within Q3 | within IQR | Q1, IQR or Q3 | Q1, IQR or Q3 | Q1, IQR or Q3 |
| D2 | within Q3 | within Q1 | Q1, IQR or Q3 | Q1, IQR or Q3 | Q1, IQR or Q3 |
| D3 | within Q3 | within Q3 | Q1, IQR or Q3 | Q1, IQR or Q3 | Q1, IQR or Q3 |
| No. | Cat. | Corridor Name | Length (km) | Width (km) | Length-to-Width Ratio | Area (km2) | Number of Gaps | Lit. Review | Ques-Tionnaire |
|---|---|---|---|---|---|---|---|---|---|
| 1 | A | Venezuela Coastal Corridor | 980 | 115 | 8.52 | 18,405 | 10 | x | |
| 2 | A | Karlsruhe–Vienna | 680 | 100 | 6.8 | 23,895 | 10 | x | |
| 3 | A | Cascadia | 665 | 80 | 8.31 | 26,665 | 8 | x | x |
| 4 | A | Northern California | 650 | 140 | 4.64 | 23,854 | 6 | x | x |
| 5 | A | Buenos Aires–Montevideo | 620 | 80 | 7.75 | 15,860 | 9 | x | x |
| 6 | A | Frankfurt–Prague | 615 | 110 | 5.59 | 15,533 | 8 | x | |
| 7 | A | Ebro Corridor | 600 | 75 | 8 | 20,270 | 9 | x | |
| 8 | A | Cologne–Berlin | 580 | 125 | 4.64 | 27,200 | 8 | x | |
| 9 | A | Mumbai–Ahmedabad | 560 | 70 | 8 | 16,706 | 6 | x | |
| 10 | A | Stockholm–Gothenburg | 490 | 70 | 7 | 15,311 | 9 | x | |
| 11 | B1 | Nile Valley | 1050 | 200 | 5.25 | 66,294 | 0 | x | x |
| 12 | B1 | Boswash * | 950 | 275 | 3.45 | 142,452 | 0 | x | x |
| 13 | B1 | Tokyo–Kobe | 750 | 170 | 4.41 | 60,263 | 0 | x | |
| 14 | B1 | Rhône | 630 | 90 | 7 | 33,152 | 1 | x | x |
| 15 | B1 | Abu Dhabi–Dubai | 550 | 250 | 2.2 | 35,789 | 0 | x | |
| 16 | B1 | Porto–Lisbon | 500 | 110 | 4.55 | 30,180 | 0 | x | |
| 17 | B1 | Beijing–Qinhuangdao | 450 | 200 | 2.25 | 41,785 | 1 | x | |
| 18 | B1 | Beirut–Gaza | 430 | 150 | 2.87 | 36,505 | 0 | x | |
| 19 | B1 | London–Midlands | 400 | 300 | 1.33 | 88,121 | 0 | x | x |
| 20 | B2 | South California | 350 | 100 | 3.5 | 23,481 | 0 | x | |
| 21 | B2 | Taipei–Kaoshiung | 340 | 65 | 5.23 | 18,881 | 0 | x | x |
| 22 | B2 | Chicago | 300 | 125 | 2.4 | 34,125 | 0 | x | |
| 23 | B2 | Flemish Diamond | 300 | 120 | 2.5 | 29,051 | 0 | x | x |
| 24 | B2 | Jakarta–Bandung | 250 | 100 | 2.5 | 10,698 | 1 | x | |
| 25 | B2 | Mumbai–Pune | 240 | 70 | 3.43 | 8611 | 0 | x | |
| 26 | B2 | Dublin–Belfast | 210 | 55 | 3.82 | 8509 | 1 | x | |
| 27 | B2 | Danang–Hue | 115 | 25 | 4.6 | 891 | 1 | x | |
| 28 | C1 | Java | 1150 | 110 | 10.45 | 24,352 | 10 | x | x |
| 29 | C1 | He-Xi | 1060 | 65 | 16.31 | 4408 | 12 | x | |
| 30 | C1 | Mediterranean | 990 | 100 | 9.9 | 52,228 | 5 | x | |
| 31 | C1 | Delhi | 900 | 200 | 4.5 | 50,673 | 5 | x | |
| 32 | C1 | Colorado Front Range | 890 | 80 | 11.13 | 16,271 | 9 | x | |
| 33 | C1 | Xining–Lanzhou–Yinchuan | 615 | 40 | 15.38 | 6761 | 9 | x | |
| 34 | C1 | São Paulo–Rio de Janeiro | 610 | 225 | 2.71 | 32,152 | 4 | x | x |
| 35 | C1 | GILA | 580 | 55 | 10.55 | 6324 | 4 | x | |
| 36 | C1 | Thessaloniki–Volos–Athens | 420 | 70 | 6 | 10,535 | 11 | x | |
| 37 | C1 | Shinuiju–Kaesong | 410 | 190 | 2.16 | 44,049 | 2 | x | |
| 38 | C1 | Mumbai–Jalgaon | 400 | 70 | 5.71 | 9811 | 4 | x | |
| 39 | C1 | M4 (London–Bristol) | 400 | 300 | 1.33 | 88,914 | 2 | x | x |
| 40 | C2 | Bahrain–Qatar | 390 | 190 | 2.05 | 22,474 | 4 | x | |
| 41 | C2 | Calgary–Edmonton | 380 | 90 | 4.22 | 22,760 | 4 | x | |
| 42 | C2 | Hyderabad–Vijayawada | 360 | 90 | 4 | 8185 | 3 | x | |
| 43 | C2 | Arizona Sun Corridor | 350 | 80 | 4.38 | 12,418 | 4 | x | |
| 44 | C2 | Athens–Patras | 300 | 70 | 4.29 | 7132 | 2 | x | |
| 45 | C2 | Dakar–Touba | 200 | 20 | 10 | 772 | 2 | x | |
| 46 | C2 | Dresden–Prague | 180 | 130 | 1.38 | 10,344 | 3 | x | |
| 47 | C3 | Delhi–Ganga (Kolkata) | 1800 | 175 | 10.29 | 61,913 | 12 | x | |
| 48 | C3 | East China (Beijing–Shanghai) | 1350 | 300 | 4.5 | 137,795 | 10 | x | |
| 49 | C3 | Taiheiyō Belt (Tokyo–Fukuoka) | 1270 | 170 | 7.47 | 81,822 | 3 | x | x |
| 50 | D1 | Buenos Aires–Mendoza | 1100 | 80 | 13.75 | 14,987 | 13 | x | x |
| 51 | D1 | Piedmont Atlantic | 1050 | 160 | 6.56 | 73,394 | 16 | x | x |
| 52 | D1 | Natal–Recife–Salvador | 1000 | 65 | 15.38 | 14,510 | 21 | x | |
| 53 | D1 | Florida | 615 | 240 | 2.56 | 48,973 | 17 | x | x |
| 54 | D3 | Chiang Mai–Bali | 4200 | 230 | 18.26 | 90,258 | 52 | x | |
| 55 | D3 | Seoul–Hong Kong | 4000 | 300 | 13.33 | 269,731 | 32 | x | |
| 56 | D3 | BESETO | 2900 | 330 | 8.79 | 196,244 | 14 | x | x |
| 57 | D3 | Blue Banana | 2300 | 330 | 6.97 | 444,883 | n/a | x | x |
| 58 | D3 | Delhi–Mumbai | 2000 | 175 | 11.43 | 67,899 | 14 | x | |
| 59 | D3 | Bangkok–Singapore | 1800 | 300 | 6 | 61,431 | 19 | x | x |
| 60 | D3 | Bohai Rim | 1600 | 340 | 4.71 | 109,754 | n/a | x | |
| 61 | D3 | Gulf Coast | 1530 | 160 | 9.56 | 51,995 | 22 | x | |
| 62 | D3 | Moscow–Ufa | 1440 | 180 | 8 | 78,885 | 19 | x | |
| 63 | D3 | I-35 | 1400 | 180 | 7.78 | 51,031 | 25 | x | |
| 64 | D3 | Paris–Madrid | 1350 | 150 | 9 | 47,364 | 20 | x | |
| 65 | D3 | Québec–Windsor (Southern Ontario) | 1350 | 230 | 5.87 | 108,071 | 20 | x | |
| 66 | D3 | Chennai–Bangalore–Mumbai | 1300 | 150 | 8.67 | 24,713 | 20 | x | |
| 67 | D3 | Caracas–Bogota | 1200 | 115 | 10.43 | 16,793 | 15 | x |
© 2016 by the authors; licensee MDPI, Basel, Switzerland. This article is an open access article distributed under the terms and conditions of the Creative Commons Attribution (CC-BY) license (http://creativecommons.org/licenses/by/4.0/).
Share and Cite
Georg, I.; Blaschke, T.; Taubenböck, H. A Global Inventory of Urban Corridors Based on Perceptions and Night-Time Light Imagery. ISPRS Int. J. Geo-Inf. 2016, 5, 233. https://doi.org/10.3390/ijgi5120233
Georg I, Blaschke T, Taubenböck H. A Global Inventory of Urban Corridors Based on Perceptions and Night-Time Light Imagery. ISPRS International Journal of Geo-Information. 2016; 5(12):233. https://doi.org/10.3390/ijgi5120233
Chicago/Turabian StyleGeorg, Isabel, Thomas Blaschke, and Hannes Taubenböck. 2016. "A Global Inventory of Urban Corridors Based on Perceptions and Night-Time Light Imagery" ISPRS International Journal of Geo-Information 5, no. 12: 233. https://doi.org/10.3390/ijgi5120233