Article

Data Association at the Level of Narrative Plots to Support Analysis of Spatiotemporal Evolvement of Conflict: A Case Study in Nigeria

Geography Spatial and Cyber Information Processing and Application Laboratory, Institute of Electronics, Chinese Academy of Sciences, North Fourth Ring Road West 98, Beijing 100190, China
*
Author to whom correspondence should be addressed.
ISPRS Int. J. Geo-Inf. 2016, 5(10), 188; https://doi.org/10.3390/ijgi5100188
Submission received: 16 February 2016 / Revised: 26 September 2016 / Accepted: 30 September 2016 / Published: 10 October 2016
(This article belongs to the Special Issue Intelligent Spatial Decision Support)

Abstract

:
Open data sources regarding conflicts are increasingly enriched by broad social media; these yield a volume of information that exceeds our process capabilities. One of the critical factors is that knowledge extraction from mixed data formats requires systematic, sophisticated modeling. Here, we propose using text mining modeling tools for building associations of heterogeneous semi-structured data to enhance decision-making. Using narrative plots, text representation, and cluster analysis, we provide a data association framework that can mine spatiotemporal data that occur in similar contexts. The framework contains the following steps: (1) a novel text representation is presented to vectorize the textual semantics by learning both co-word features and word orders in a unified form; (2) text clustering technology is employed to associate events of interest with similar events in historical logs, based solely on narrative plots of the events; and (3) the inferred activity procedure is visualized via an evolving spatiotemporal map through the Kriging algorithm. Our results demonstrate that the approach enables deeper discrimination into the trends underlying conflicts and possesses a narrative reasoning forward prediction with a precision of 0.4817, in addition to a high consistency with the conclusions of existing studies.

1. Introduction

New media and public datasets have demonstrated that armed conflict and terrorist activities have been prevalent across the continent of Africa [1,2]. Conflict hotspots attract a wide range of reporters or local civilians to report the latest progress of the conflict. Realistic amounts of data, which are provided from multitudinous nongovernmental information sources, facilitate the surveillance and prediction of conflicts. Usually, consulting services are mainly in the form of studying reports that focus on monthly or quarterly statistics for every aspect of a conflict [3,4,5]. The rough time scale of an investigation is inadequate to support concrete actions directly but is helpful in decisions regarding the macroscopic viewpoints, e.g., the action plot of trade or transport for a specified region within a specified period of time. For this reason, geographical information retrieval and text mining technologies have been developed for the field of homeland security [6], although their modeling remains a challenge for automatically extracting deeper knowledge from an overwhelming volume of data. Specifically, the extraction of relationships between targets and events still primarily relies on manual labeling and expert knowledge [7].
Those raw logs that involve armed conflicts or political violence events have been reorganized for investigating the behavior patterns and evolvement of the actors. One of these common datasets is the Armed Conflict Location and Event Dataset (ACLED) [8]. This dataset is updated almost daily in over 60 developing countries in Africa and Asia. The content includes the dates, locations of conflict events, textual content, actors and reported fatalities. The scope covers all African countries from 1997 to the present, in addition to South and Southeast Asia, in real-time. These types of datasets have become valuable references for investigating regional issues due to their substantial text and geographical coordinates and their reliable date precision. For example, analysis of violence against civilians (VAC) has been used to assess the efficacy of peacekeeping forces in reducing VAC across Africa since 2000 [9]. The link between armed conflicts and climate variability is investigated based on the ACLED database [10]. For some security evaluations, this dataset is applied to recognize the behavioral patterns [11] of unidentified armed groups in addition to generate maps of crisis events, e.g., the ACLED monthly conflict trends reports [12,13,14]. They also serve as web applications via the visualization of dynamic and static info-graphics [15].
In practice, such types of datasets include the most common features, such as the timestamp, location and criticality of an event, whereas the text component and the relationships between the events are typically omitted. The deficiency of text semantic analysis restricts their applications to additional study areas. First, conflict evolution [2,16] involves a narrative process of related events [17]; this process enables one to organize timeline-based or actors-oriented events as narrative plots to facilitate the reasoning regarding when-where-what for the actors [18,19,20]. Second, the analytic conclusions from [4,5,12,13,14] are qualitative, with a lack of both quantitative analysis and predictions regarding armed conflict emergencies. Without quantitative instruction, these approaches are insufficient for estimating the trend of event sequences in terms of the time and place. Third, the organization of the data items depends mainly on human intervention, e.g., discrimination of event types and extraction of fatalities and participators [21,22]. The textual content of a conflict event has been rarely considered in similar types of datasets [23] because of its non-uniform organizational form. The text that is contained in the dataset has substantial descriptions that require deeper analysis, e.g., the words that describe criminal behaviors, the features of the victims and the environment.
This study specifically proposes a data-mining framework to predict the trends in the conflict event sequence of interest. Within this framework, all interrelated data in the logs will contribute to support decision-making regarding the spatiotemporal evolution of the conflict. We organize multiple types of data at the narrative plot level, where the evolution of events is treated using a narrative plot. This approach aims at providing a narrative-based data association approach to support near real-time spatiotemporal surveillance and forecasting. The study case uses the Nigerian part of the ACLED dataset. The note portion in the ACLED database is considered the core for data organization linking with the remaining data elements, such as the date and location and actor. Common sense indicates that an event sequence of a specified actor has a certain narrative within a period of time. We use this feature to associate similar event evolutions that might be performed by the same actor or someone else in history. Under the support of such data associations, the date, location and behavior, in addition to other types of data, can be organized together to enhance the reasoning capability regarding when-where-what. Our contributions are as follows:
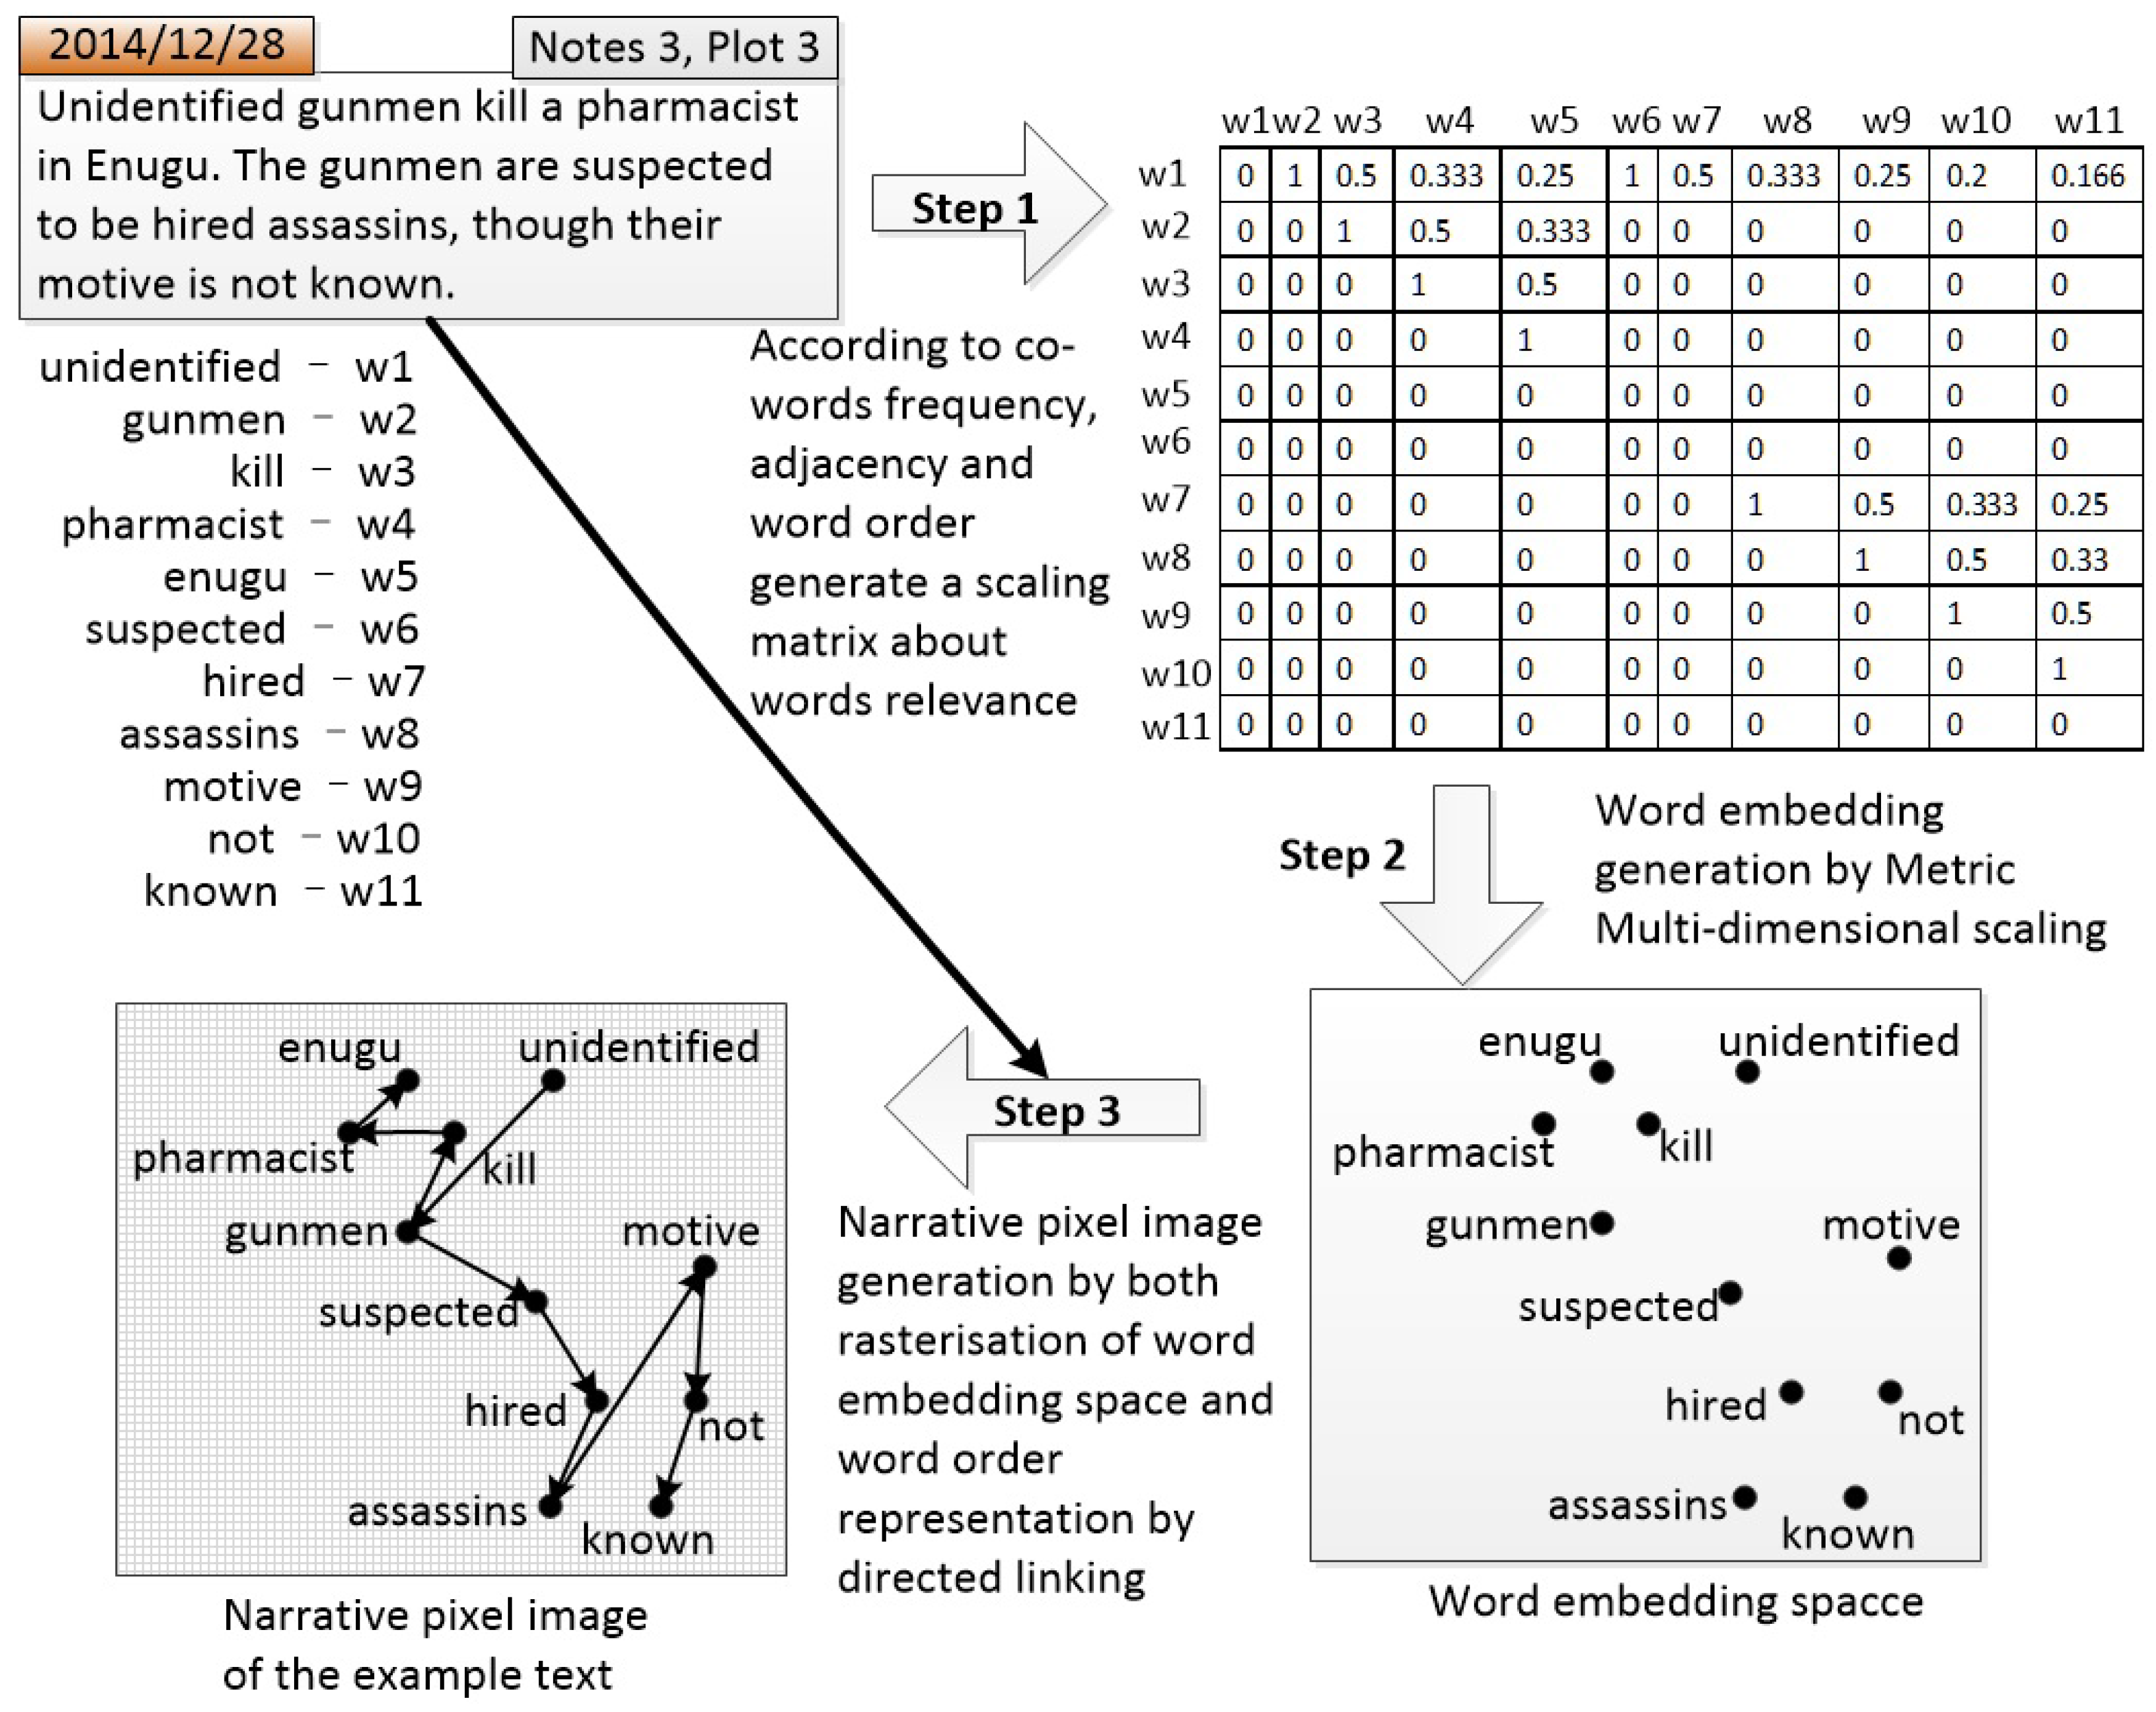
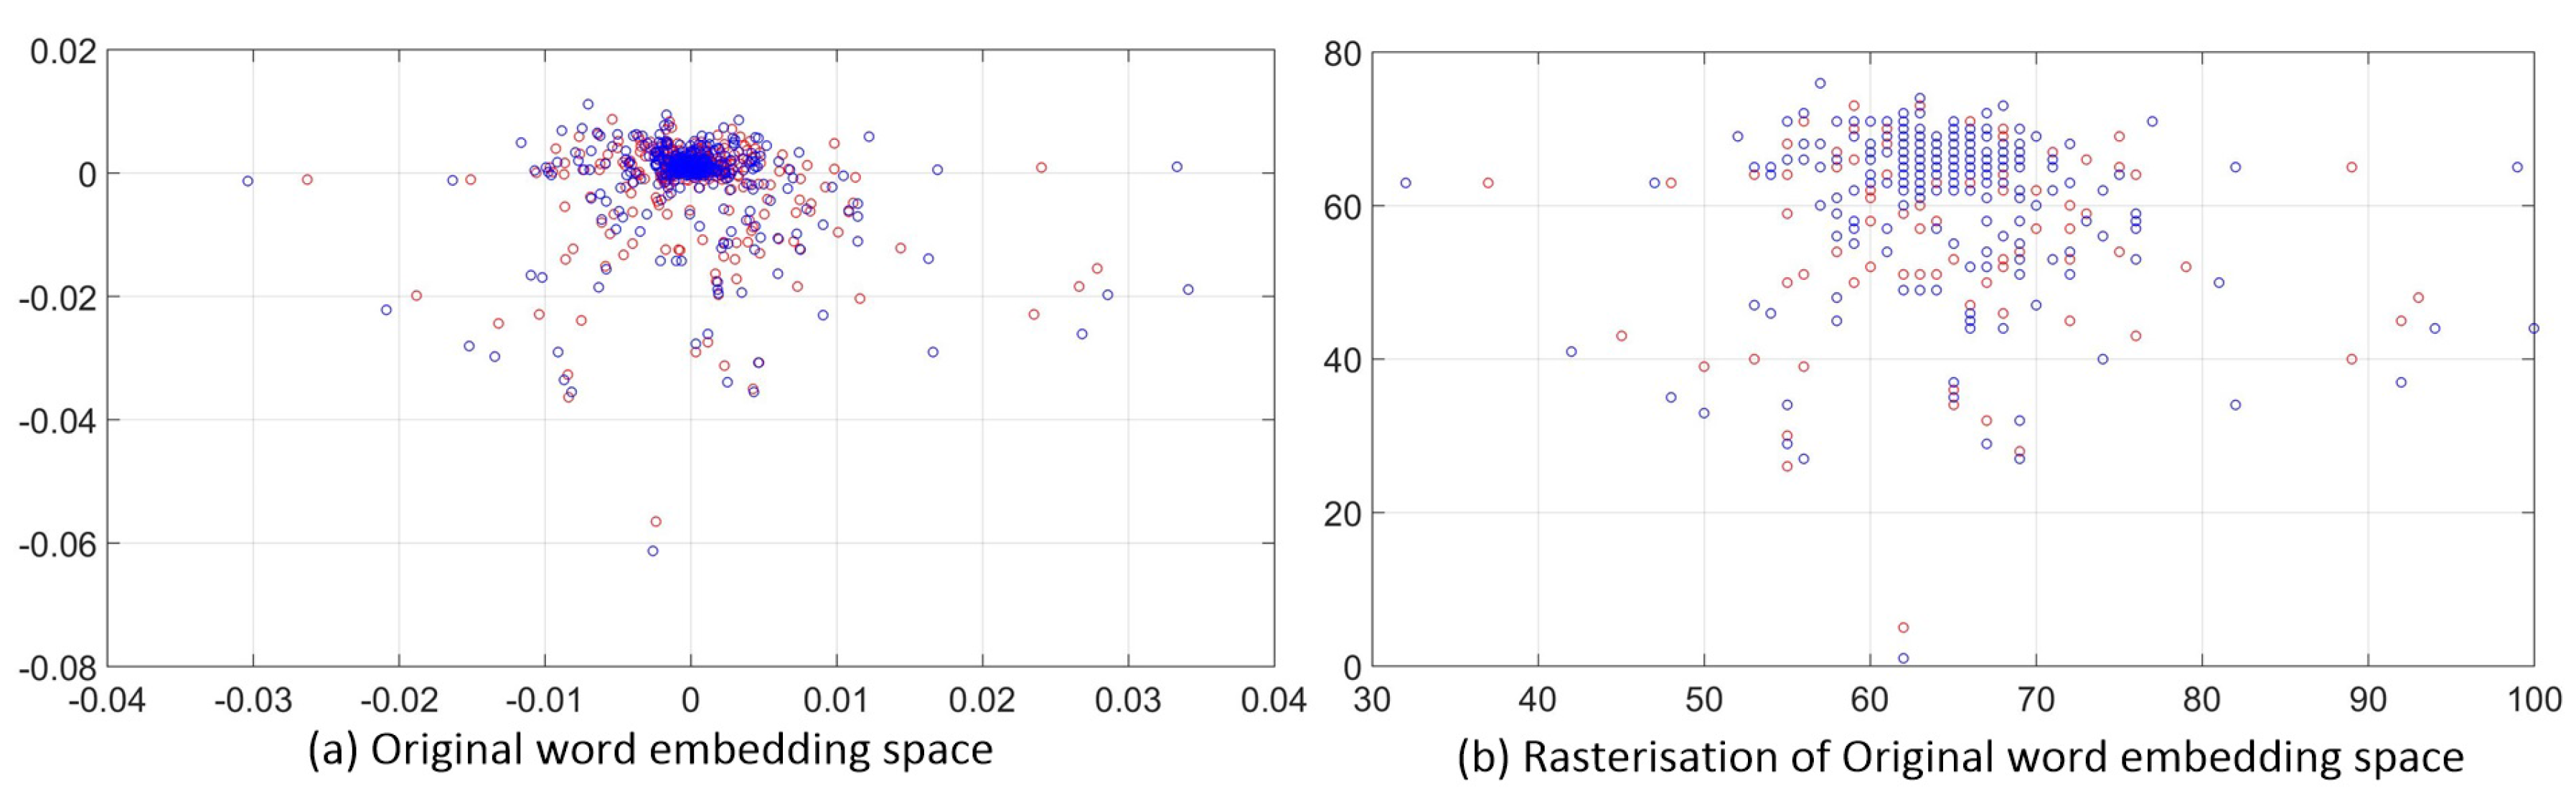
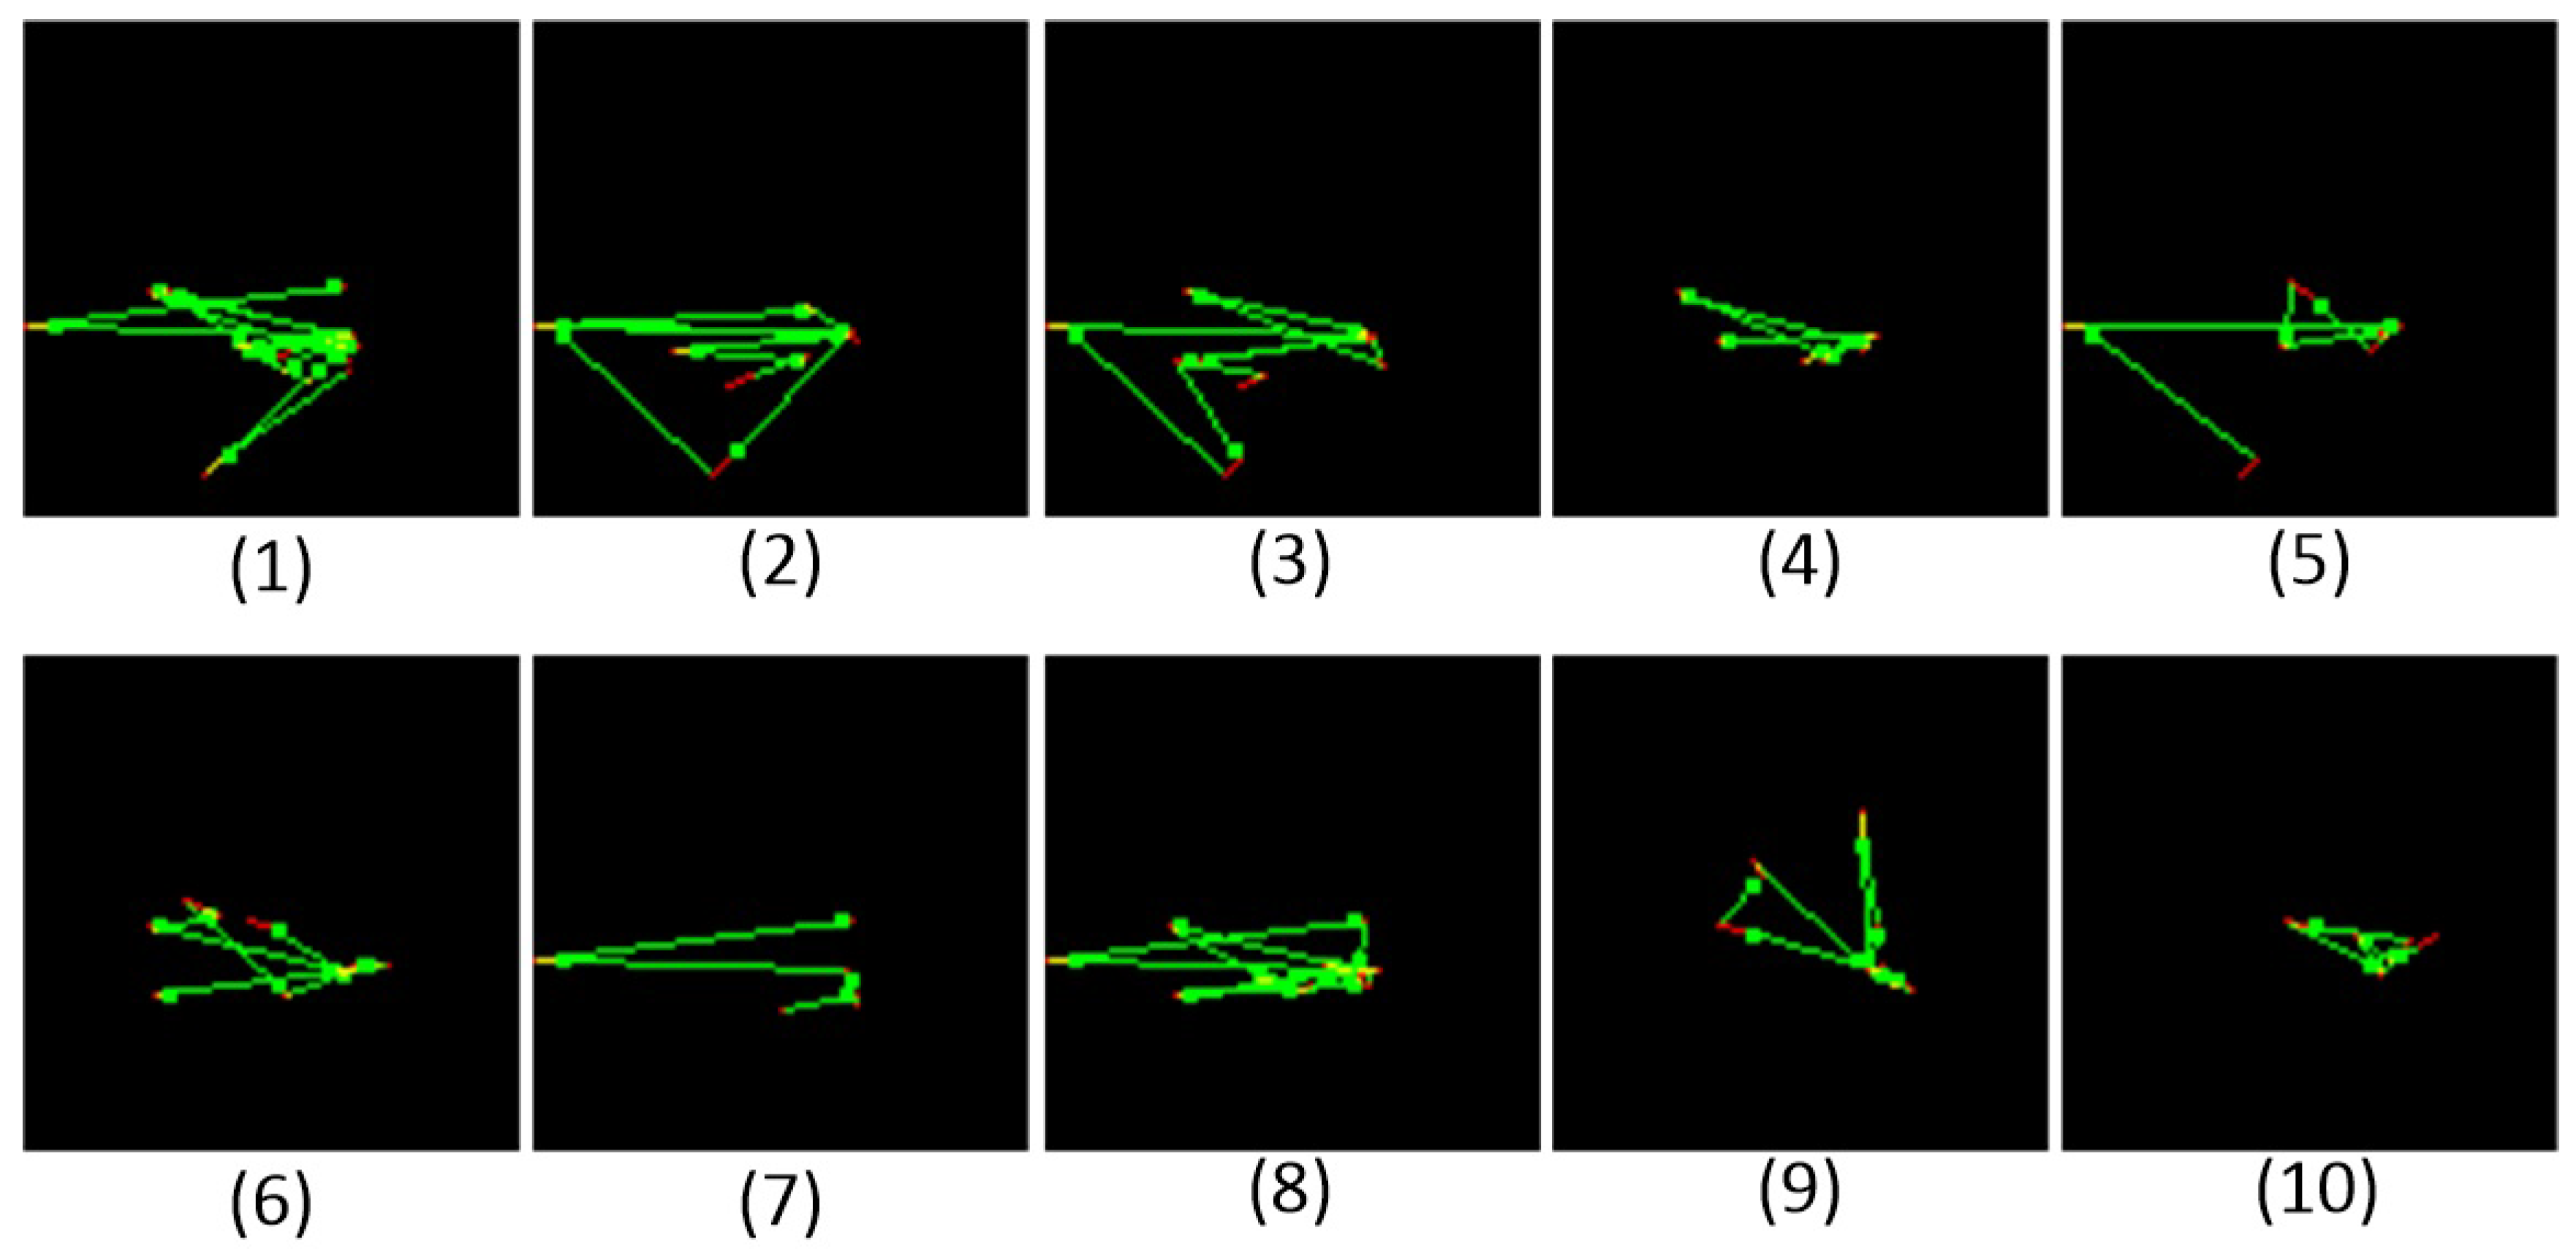
  • We present an image-based textual representation that learns both the distribution of the feature words and the word orders in each event by a square pixel image.
  • Based on the proposed representation, a hierarchy cluster process tool is employed to mine homologous historical events that have similar semantics as the events of interest.
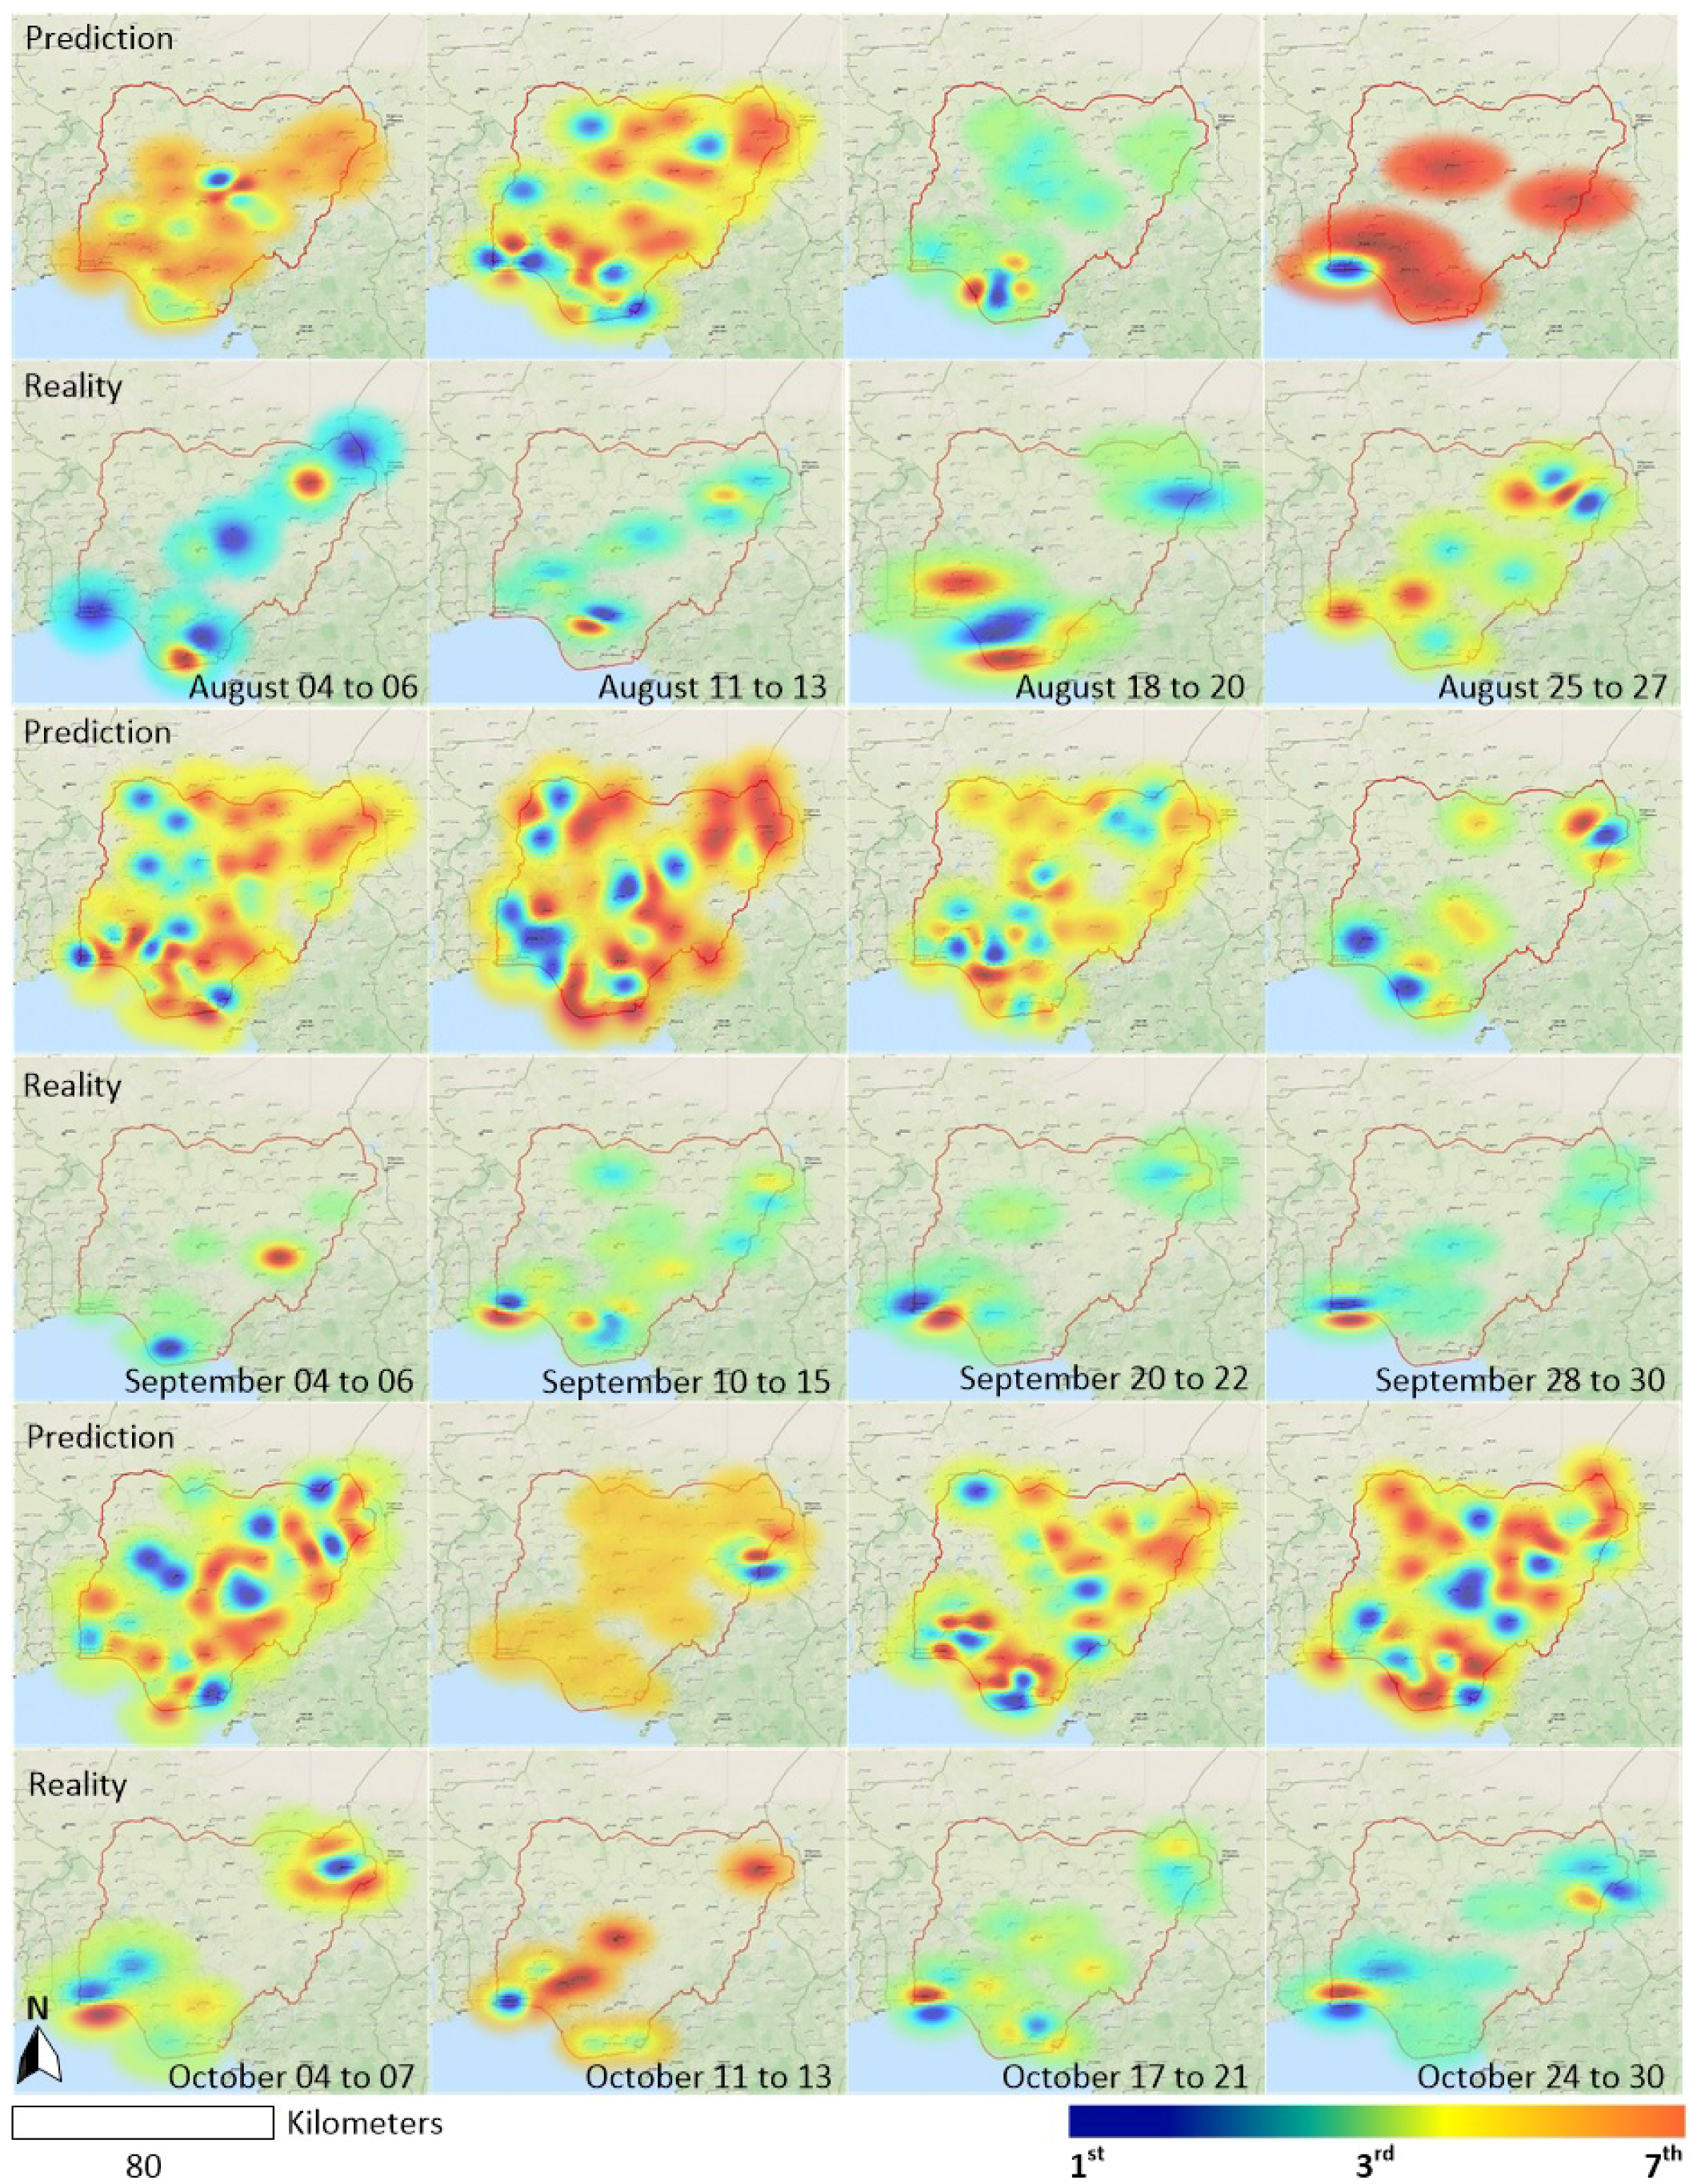
  • A spatiotemporal evolution map, which is generated by the Kriging algorithm, is presented to promote understanding of the development of a series of conflicts. The results demonstrate that our approach has the potential to provide a timely spatiotemporal predictor for the near real-time forecasting task.
This article is organized as follows: Section 2 reviews the related background. Section 3 describes the experimental data sources. Section 4 presents the methodology that is constructed by the event text representation (Section 4.2), narrative plot cluster-based data association (Section 4.3) and inferred spatiotemporal evolution map generation (Section 4.4). Section 5 and Section 6 present a discussion and the conclusions, respectively.

2. Review

2.1. Modelling of Conflict Dynamics

The study of conflict dynamics has always been of interest to the geographic information systems (GIS) and data mining communities because understanding a conflict requires multidisciplinary collaboration. The related active topics of research include modeling the conflict process and aspects of geographical information sources, such as data access, dissemination and quality. In conflict modeling, a point process statistics framework for heterogeneous datasets that can conduct spatiotemporal inferences, such as diffusion and advection effects in conflict data, has been presented [24]. Generally, conflict dynamics studies model the underlying processes as the phenomena of diffusion and advection [25,26]. To model both continuous and discrete observations, a descriptive statistical method based the variational-Laplace approach has been presented for inference regarding spatiotemporal processes [24,27]. For visualization of spatiotemporal distributions, the geostatistical approach called Kriging has been applied widely to develop monthly predictive maps [28]. From the presented works, statistical and data visualization methods play important roles in the estimation of conflict evolution but are applicable to limited data types, such as geographical coordinates, timestamps and single attributes. Specifically, the text semantic and context relations that are inherent in logs are rarely considered in the modeling of conflict dynamics. Such text usually provides a detailed description about the conflict, which could reveal the essence of the conflict in terms of the why-where-when-what-how.
On the other hand, as a response to conflicts, emergency management has been developed accordingly. For the estimation of damages and losses from a conflict, geospatial information sources have been demonstrated to be useful in developing emergency management systems. Volunteered geographic information, which is created by amateurs using map-sharing services such as OpenStreetMap, has become a promising data source in the support of time-critical situations [29]. This crowdsourcing of data generation can be disseminated through social networks [30]. For good reason, conflict modeling will meet various types of data to reflect a conflict process in different views. This means that the using of conflict data may need some sophisticated models or information systems.

2.2. Association Analysis

Data association is an intermediate step of GIS-assisted applications and bridges the bottom data arrangement to the top task planning. It is expected to integrate various heterogeneous data sources [31] to serve as geographical-related analysis. For example, to know the population density of an urban region, the corresponding data in a specified area must be prepared according to the geographical scope and time span in the national population database. For two or three studied objects, the following methods have been applied widely for association analysis. The correlation coefficient is a common criterion for detecting a binary association [32]. Some linear regression models have been applied for two or more facets [33]. A timeline-based data organization has been used for the analysis of successive impacts [34]. A cross-correlation function provides a perspective regarding studying the relationships between cities in a regional urban system [35]. However, these approaches are unsuitable for modeling unclear objects, and they must mine notable items in a preprocessing step through the use of data mining techniques [36], e.g., the Apriori association rule mining [37]. For data organization based on more general semantics, the narrative framework is often taken as a platform for shipping various types of data [17]. When integrating data at the semantic level, such a framework can provide an effect similar to storytelling. One of the common aspects is the narrative method of the news, which is often used to organize event elements (e.g., circumstances and participators) to restore a scenario that occurred, to stimulate the memory of the audience. More general association analysis at the narrative level is qualitative reasoning, such as evidential reasoning [20] and ontological reasoning [18], which have also been regarded as approaches to knowledge discovery.

2.3. Computational Model of Narrative

In the data space, each data item can be organized at the semantic level. With this context, the event evolvement has a certain narrativity. It is better comprehended by humans than simple merged datasets, which lack correlations among the data. Some of the methods of narratology have been employed to geo-related document depositing and retrieval. A juxtaposition mode of narrative is used to visualize several elements of a narrative, such as time, space, and emotions in life paths [38]. The combination of heat maps and story topic words provides geo-navigation of a very large corpus [39]. In [19], the authors propose a model of story intention graphing from narrative meaning for both corpus annotation and computational inference. These presented studies depend on a formalization method [19,38] and build numerical relations on definite objects [39]. An inconvenience is that the prior knowledge is inflexible to adapt to varying requirements. Using the technologies of data mining, it appears that the underlying knowledge of the narratology could be applied to the fields of knowledge summary [40] and extraction [41]. We intend to provide a knowledge learning method that bypasses the assistance of domain experts.

2.4. Short Text in Narrative

Narrative exists in common vehicles of information, such as corpora, video, audio and comic strips. In social networks, short text is the most effective means of interaction. For example, in the massive messaging on Twitter, the tweets are short, no more than 140 characters [42,43], and often contain complete event elements, e.g., actors, behaviors and result. Using the concept of data association, numerical textual representation and cluster tools are used jointly to assist in information retrieval [44]. For numerical text representation, the bag-of-words model is a fundamental approach for extending other variants [45]:
  • The vector space model (VSM), which represents each event text as a bag-of-words vector. The similarity computing method must be designed for comparing the representation vectors, which are sparse in high-dimensional space [45].
  • The topic model is a Bayesian statistics-based algorithm that learns the topic components and mixture coefficients of each text. The conventional topic models reveal the latent topics in a corpus by capturing the word co-occurrence patterns at the document level [46].
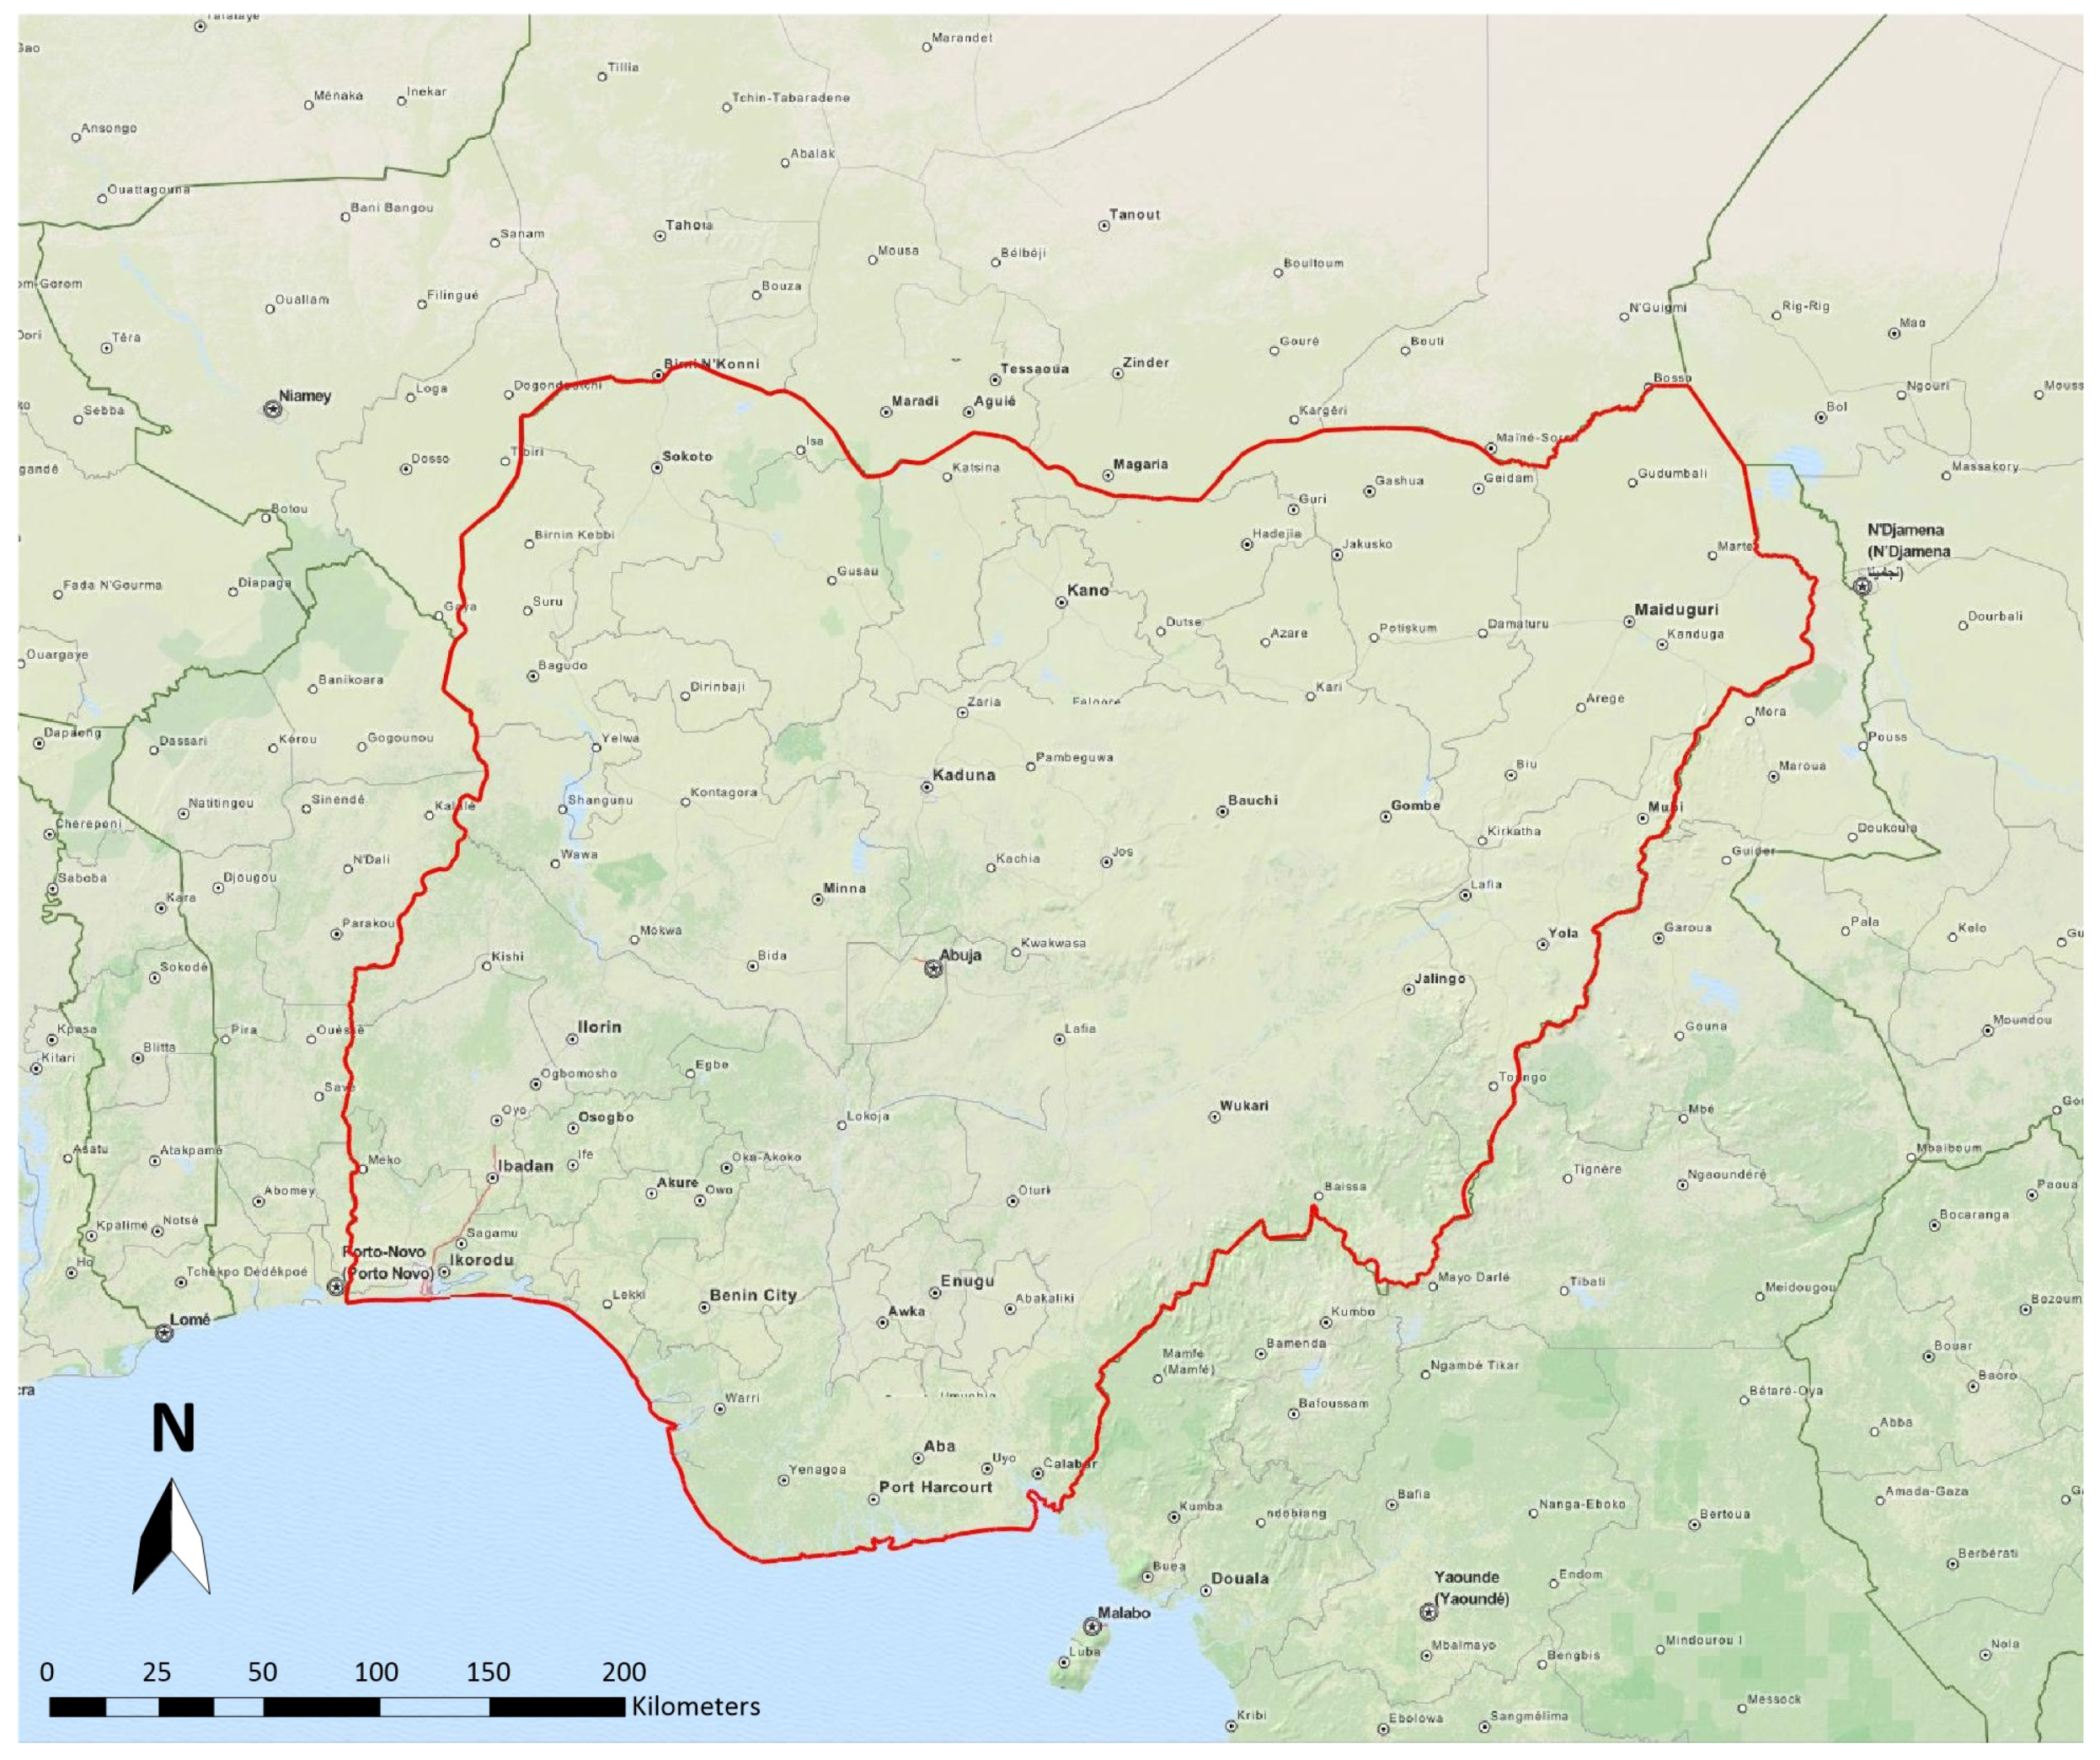
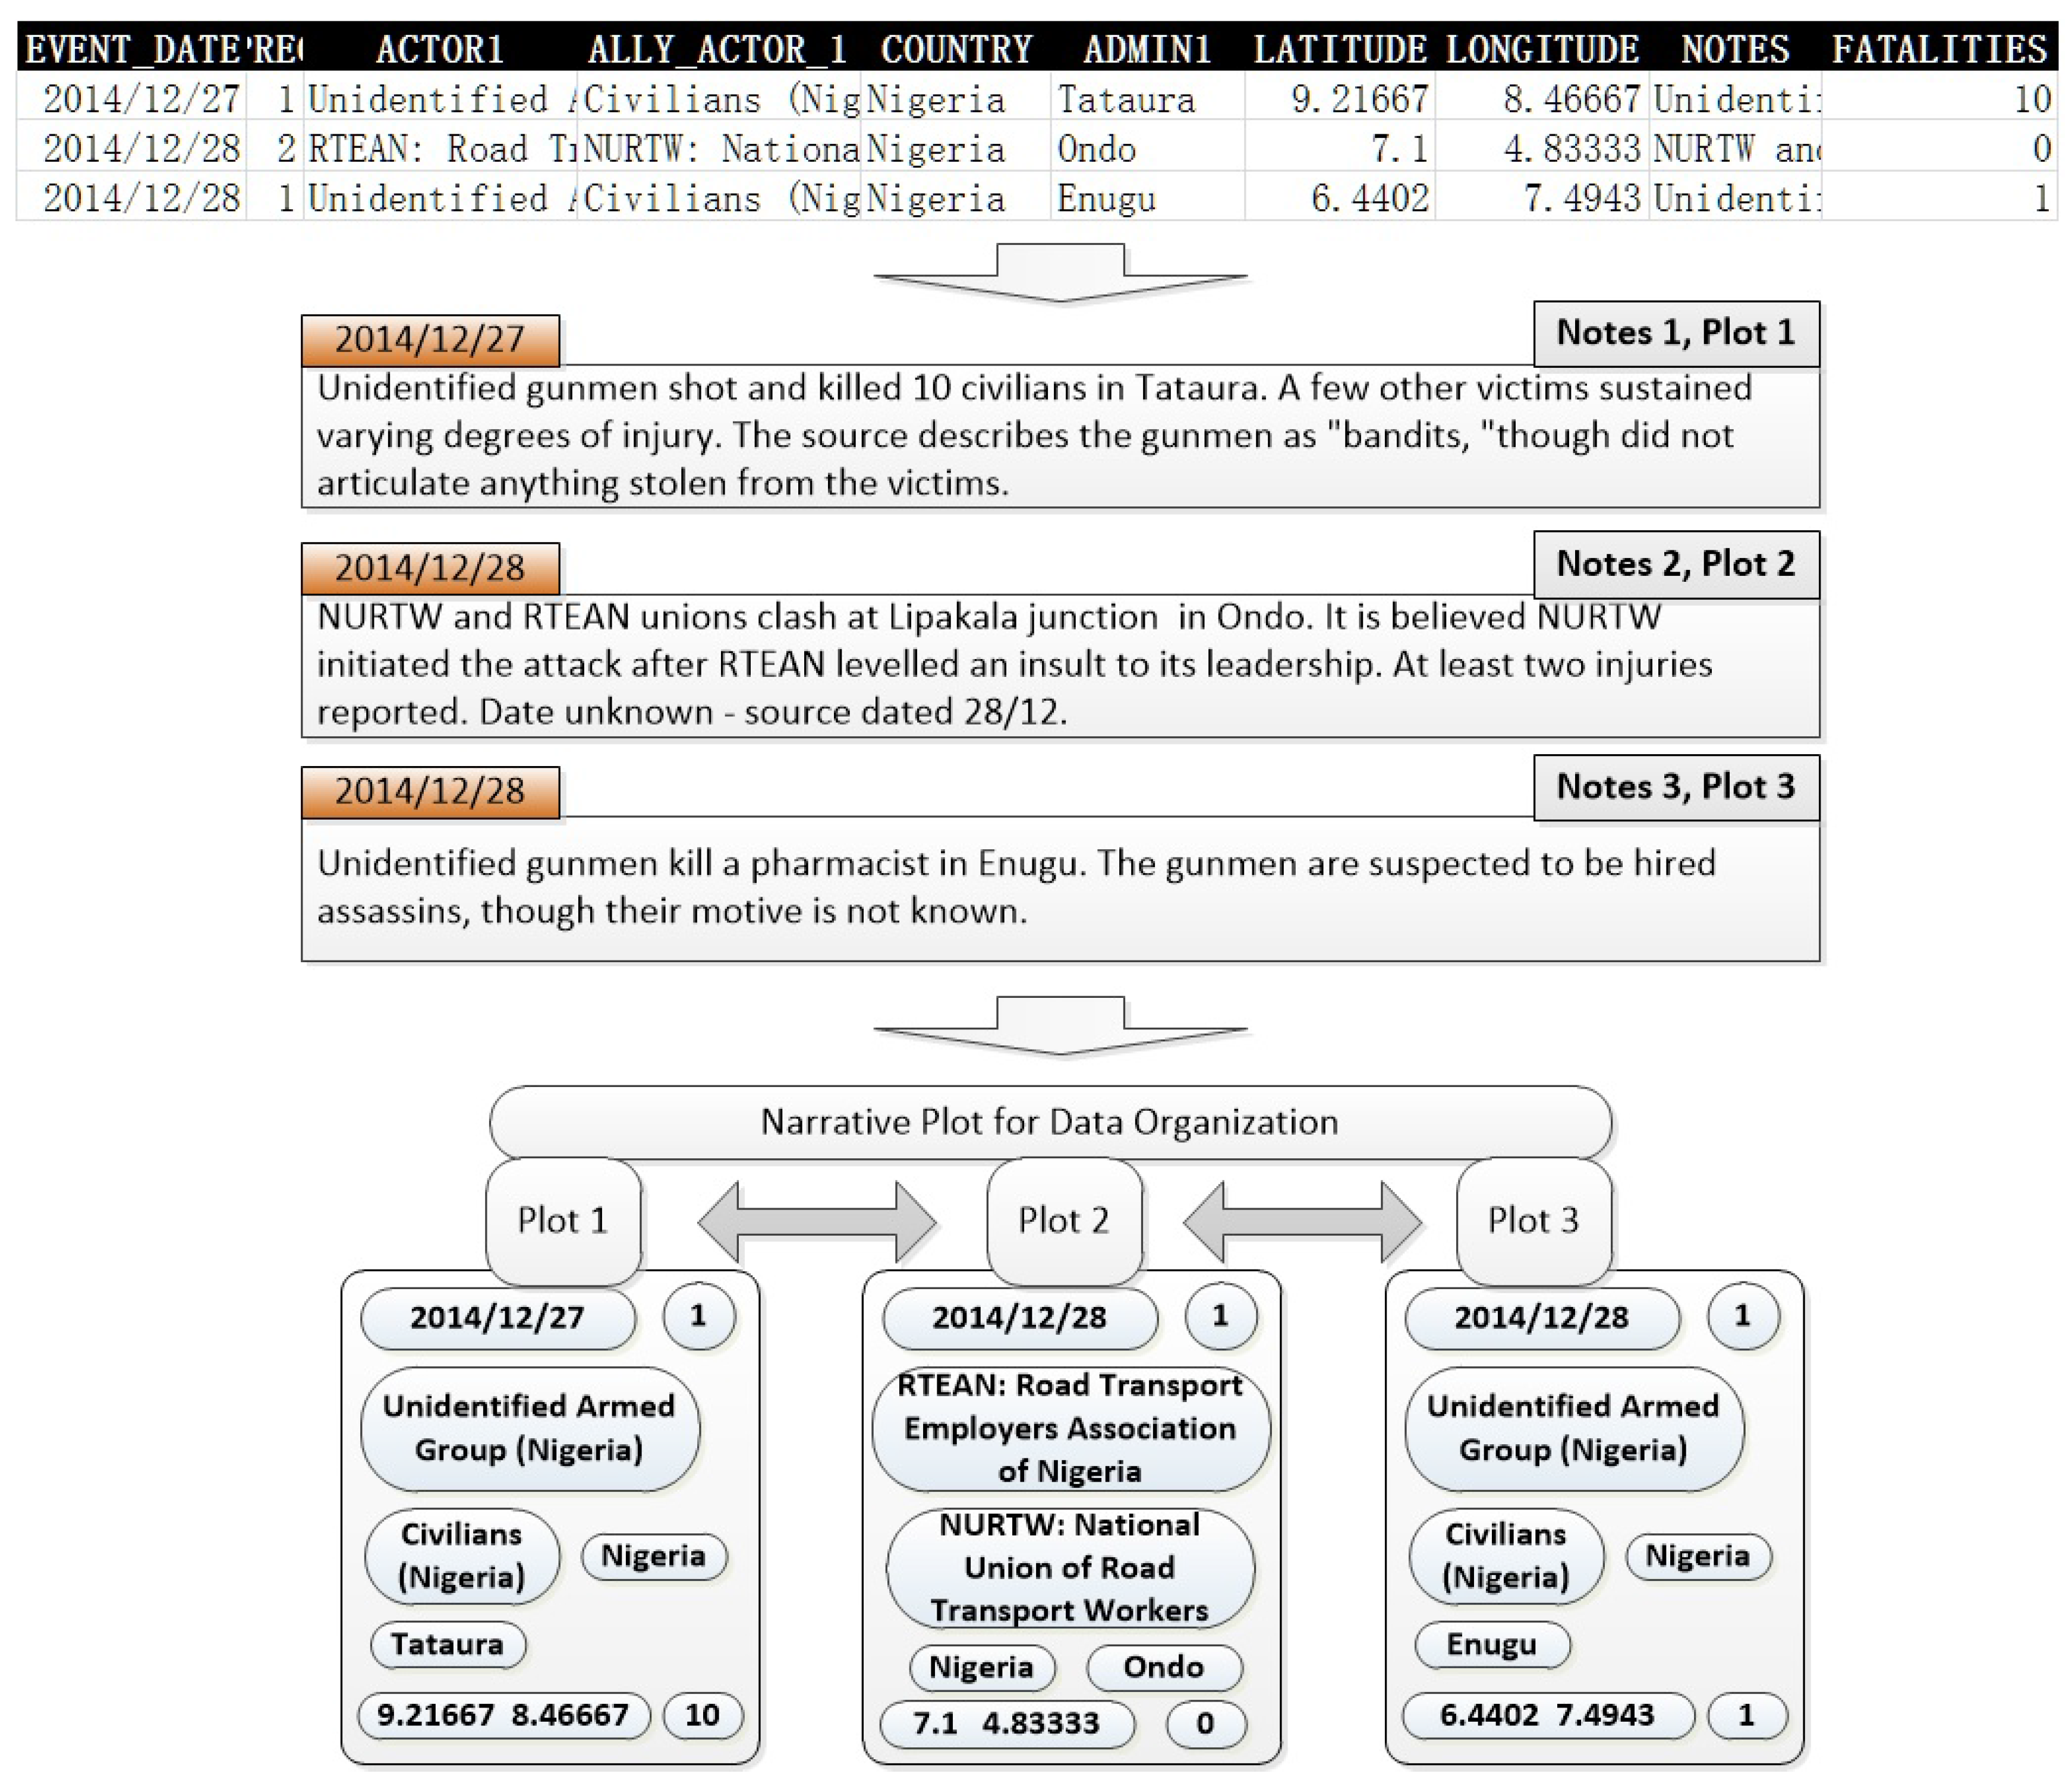
However, these two models have considered only the frequency feature of selected words but neglect the word order, which is the principal feature used in representing a narrative plot. For this reason, we present a novel short text representation that contains the features of both the co-word frequencies and word orders. It is important to note that we focus on the use of the proposed text representation model instead of performing a comparison with other similar models.

3. Data Sources

ACLED is designed for analysis of disaggregated conflict and crisis mapping. This dataset codes the dates and locations of almost all reported political violence and protest events. The event data are derived from a variety of sources, including reports from developing countries and local media, humanitarian agencies, and research publications, such as the Xinhua News Agency and Reuters [8]. The dataset covers all African countries from 1997 to the present, in addition to South and Southeast Asia, in real time. These data contain information regarding the following: the dates and locations of the conflict events; the specific types of events, such as battles and civilian killings; events by a range of actors, such as rebels and governments; changes in territorial control; and reported fatalities. Specifically, the event data indicate the positional precision of the coordinates according to the scale of conflict influence. The geographical precision is graded into three levels as follows: district, chiefdom and towns, which follow a descending order of the sizes of the conflict regions [22].
To use the idea of historical scenario mining to support decision-making, the dataset, which contains 6781 logs about the Nigerian conflicts from 1997 to 2014, was extracted from ACLED to learn the vectorial representations of the data. Based the cluster filtering of such representations, historical log sequences that refer to the same or close similarity of meaning can be indexed for the input of the log sequences of interest. The context of the geographical coordinates that are associated with the textual content of the indexed logs is assumed to be the inferred result to predict the spatiotemporal evolution of the conflict sequences. For example, a conflict sequence about protests to education cuts is proceeding in the capital of Nigeria, and we focus on the future overall situation of Nigeria by referring to the inferred result of historically similar events that occurred in an adjacent area. The evaluation of our method is performed by experimentation on the 1690 logs from 2015. All the armed conflict events occurred in the inland area, where we color-the boundary of the land of Nigeria in red (Figure 1). The background map is screen captured from the Wiki OpenStreetMap source [47] with both the coordinate information file (.pgw) and the projection file (.prj).
From the original 25 data types, we select 10 data types, which include “EVENT_DATE”, “TIME_PRECISION”, “ACTOR1”, “ALLY_ACTOR1”, “COUNTRY”, “ADMIN1”, “LATITUDE”, “LONGITUDE”, “NOTES” and “FATALITIES”. Most of them can be understood by their labels. For more explanation, the authors of [21,22] list a detailed instruction for each item. The data of each event is organized as, for example, “2014/12/30; 1; Boko Haram; Civilians (Nigeria); None; Nigeria; Kautakari; 10.83981; 13.02201; Suspected Boko Haram attack Kautakari, kills fifteen residents. Witnesses said scores of insurgents armed with rifles and petrol bombs stormed Kautakari approximately 7 am. Kautakari is in the Chibok area; 15”. The “NOTES” part involves the narrative plots of conflicts as the core data for cluster analysis. The indexed sequence of coordinates is used to generate a spatiotemporal evolvement map.
A basic situation of the data that are quantified is shown in Figure 2. In Figure 2a, we depend on the “EVENT_TYPE” to census the number of events in every year (1997 to 2014). The top three event types are “Violence against civilians”, “Battle - No change of territory” and “Riots/Protests”. The result roughly corresponds to the conclusion of [11]. From Figure 2b, the “Unidentified Armed Group” has the highest proportion among the organizations, and the famous terrorist organization "Boko Haram" is also prominent. The lack of a definite actor increases the analytical difficulty of the conflict. The “NOTES” part has rich details to understand the conflict because the narrative plots in the logs can promote the thinking and reasoning of humans. Using the idea of narrative plots points in a direction of modeling with more heterogeneous data [18,19].

4. Methodology

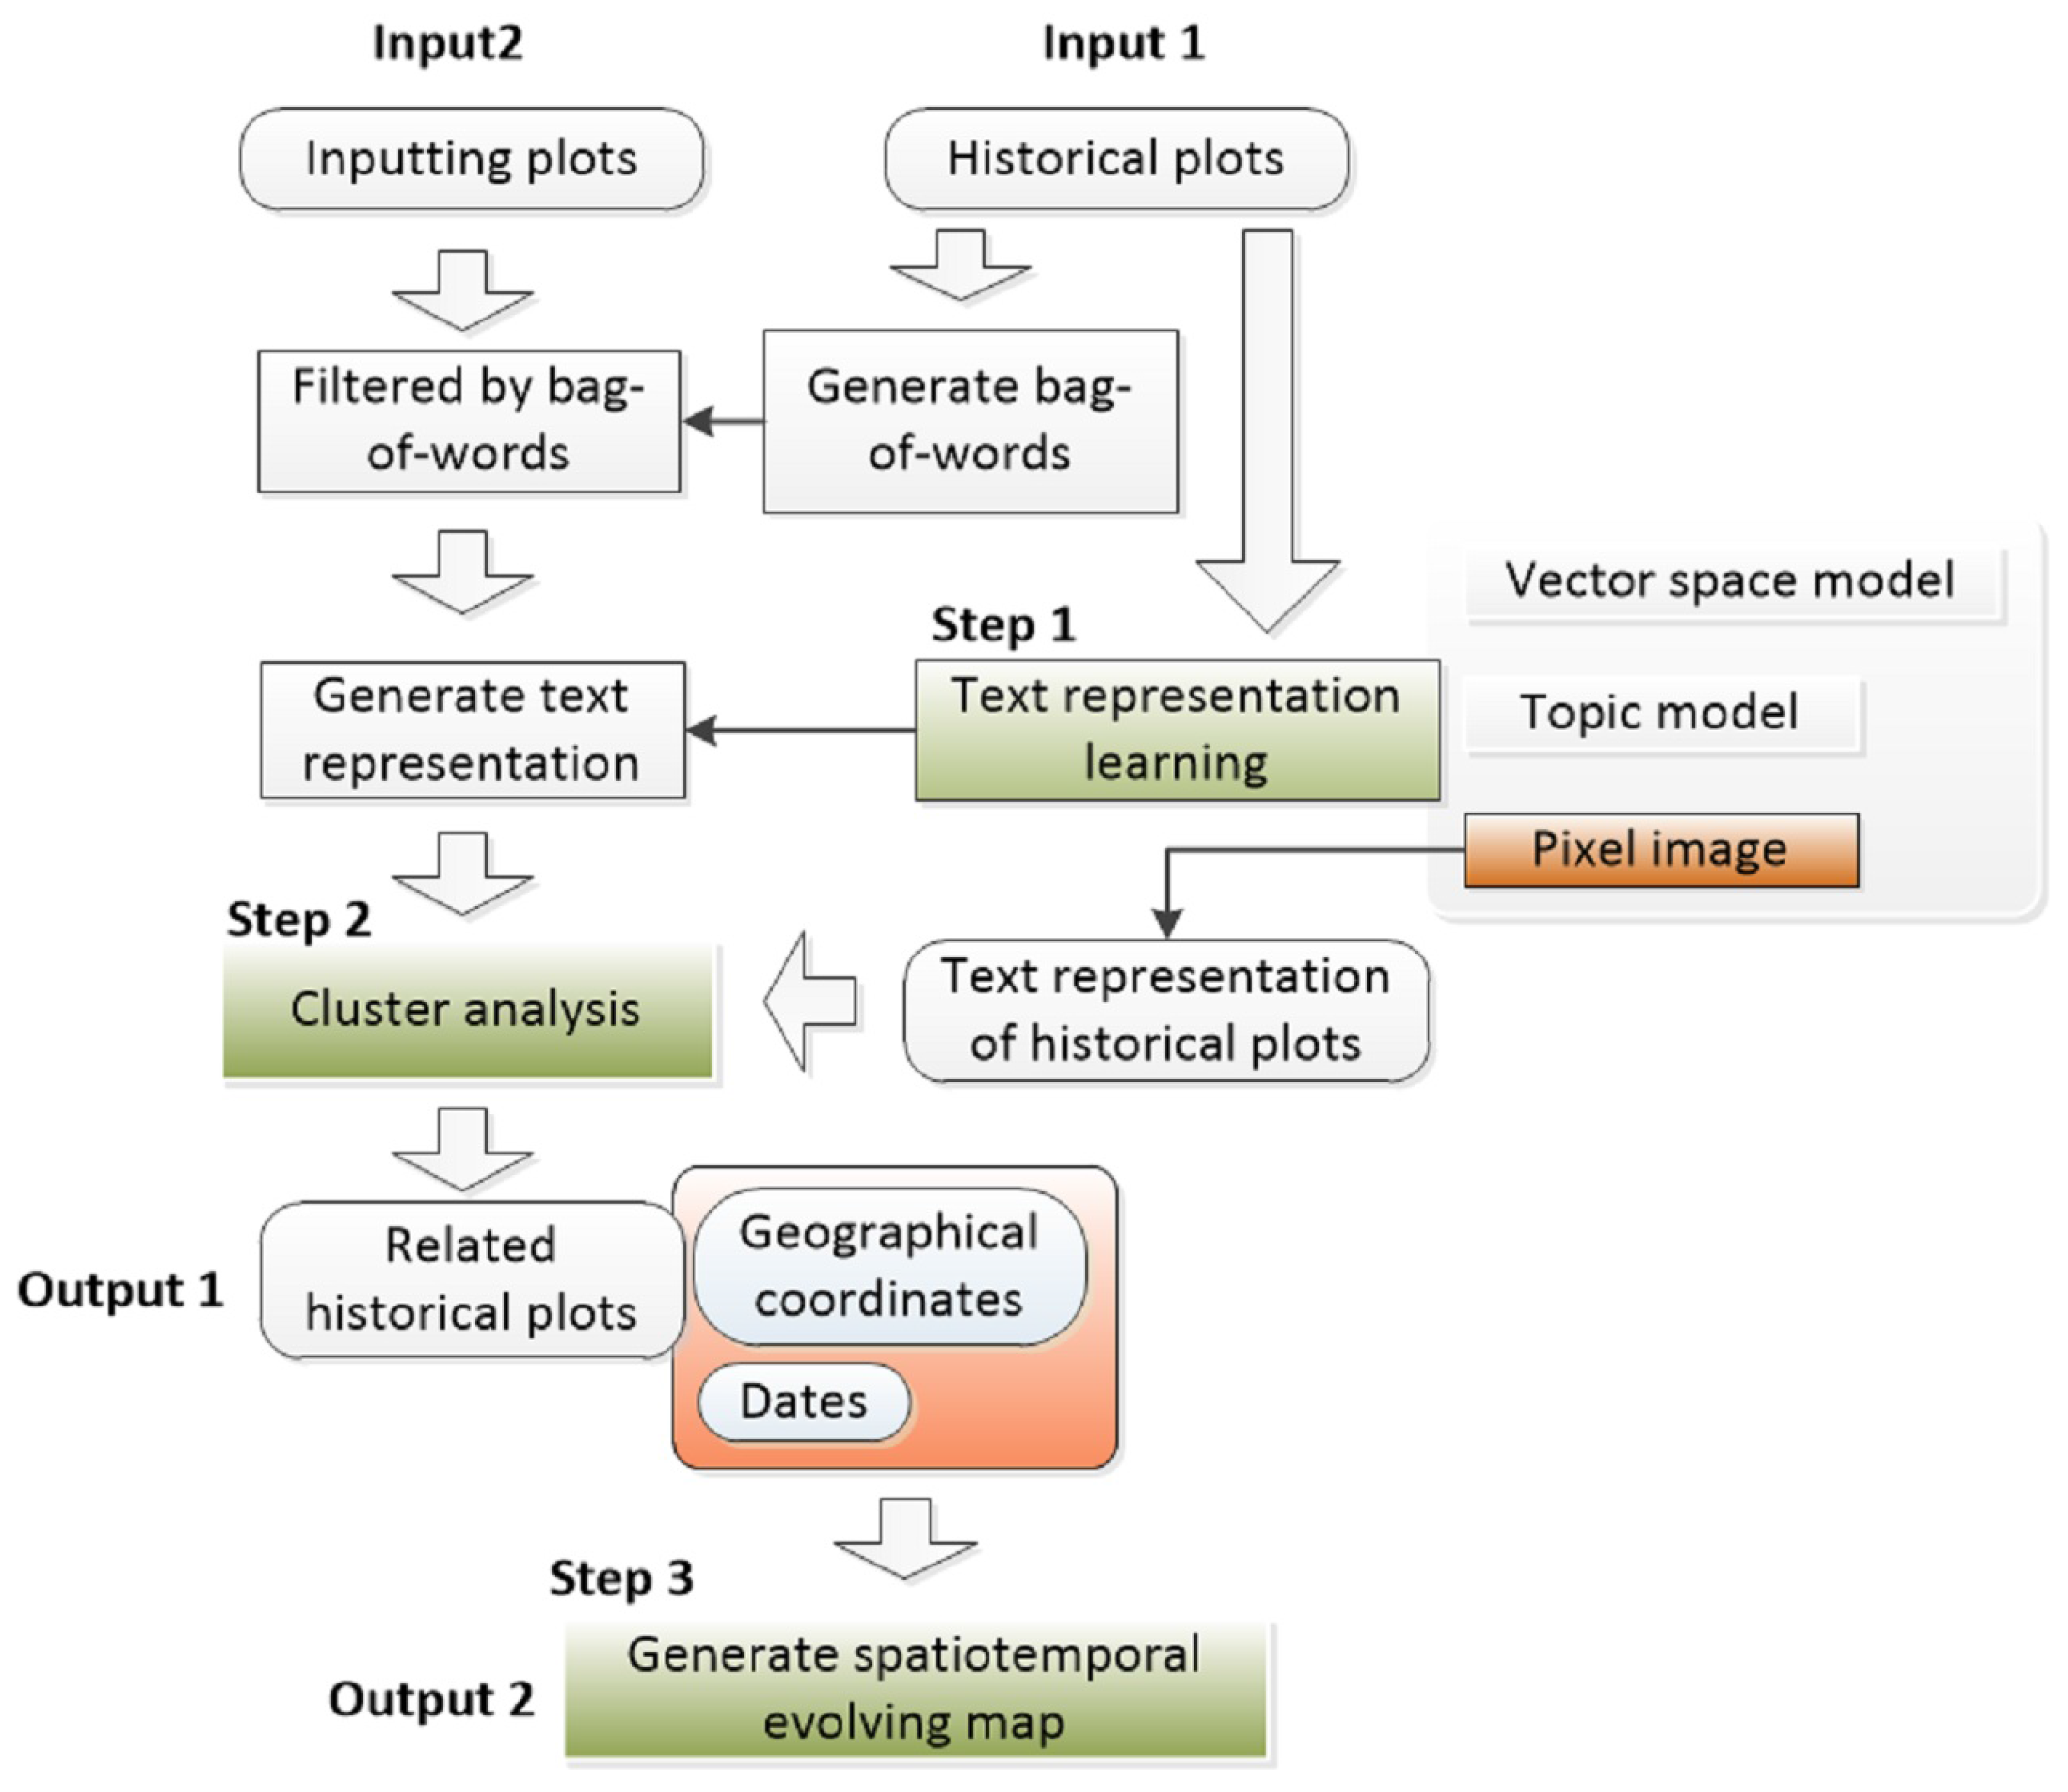
4.1. Processing Framework

The modeling framework is illustrated in Figure 3. In Step 1, the textual data (Input 1) require the transformation of vectorization by the representation learning method. To overcome the flaw that is in both the vector space model and topic model, we propose a novel pixel image to learn the meaning of the text. In Step 2, the text of inputting conflict events (Input 2) is expressed as the corresponding pixel image. Combined with the historical event texts, the input data are clustered to index similar historical scenarios, based solely on the similarities of the narrative plots. In Step 3, we use the indexed data context for the reasoning of the spatiotemporal evolution. Both the associated geographical coordinates and the time order are used to generate a spatiotemporally evolving map, which facilitates the understanding and prediction of conflicts.
The narrative plots-based data association is shown in Figure 4. In the beginning, the input data are simplified as the ten predefined data Ψ. The selected data Ψ are deposited into a table file. Next, the “NOTES” regarding each event must be analyzed through the clustering method. We assume that the events sequence of interest contains the underlying relations. We use narrative plots to represent such interrelationships. Through the data association, other types of data that refer to a similar context scenario can be indexed together. Formally, let ψ N Ψ , ψ N = n 1 , n 2 , , n i denotes a discrete-time sequence of "NOTES", which implies a type of narrative plot, whereas n i denotes the note part associated with a conflict event. We then defined the cluster process as λ : φ N k ψ N i , where φ N k = o 1 , o 2 , , o k denotes the input sequence of events and ψ N i is the indexed set. Following the features of the cluster process, it is known that the existing n i ψ N i is close to o k φ N k in terms of the distance of the vectors. Assuming that the context of ψ N i is denoted by δ N j , the context δ N j is the inferred result of our approach; in addition, the related temporal and spatial data are the reasoning result of the conflict evolution.
To model the above process, we study the following: transformation of the text data into a vector representation (Section 4.2); a method to associate an input text sequence with the collection of historical text based on the clustering method (Section 4.3); and an approach to visualize the inferred result of the spatiotemporally evolving process (Section 4.4).

4.2. Event Text Representation

We start with a vector representation learning of the text. As shown in Figure 5, we must build a bag of words W . Each word w i W is to be transformed to a 4-dimensional vector via the multidimensional scaling (MDS) methodology [48]. In step 1, we slice the input text to sample the 2-grams phrase, which results in the feature matrix D , which can present a statistical feature between two words. The goal of representation learning is to find a word vector space χ in which the distances between the word vectors can approximate the distances in A as much as possible. This process is called word embedding. For word embedding, the asymmetric distance matrix D must be decomposed as
D = M + N
where M = D + D / 2 reflects the frequency features of two words and N = D - D / 2 indicates the textual feature of word order [49]. We employ the asymmetric MDS method [49] to obtain the two vector spaces of M and N . We then combine the two spaces into a 4-dimensional vector space χ using the method of [49]. The short lines represent the corresponding words shown in Step 2.
After obtaining the word feature vector, we propose a novel document representation called the narrative pixel image, which subtly rasterizes the word vector space and draws directed links between neighborhood words (see Step 3). Such a representation can express the semantics of the various lengths of the sentences by a unified size of vectorial form. Based on the word vector space, both the text data of n i ψ N i and o k φ N k must be transformed before proceeding to the next stage. As shown in Figure 6, we learned an original word vector space (a), and then, we applied rasterization to the space (b), which consists of 3832 words. The coordinate values of red points X r e d R 2 × 1 and blue points X b l u e R 2 × 1 are determined by the MDS operation with M and N in Equation (1), respectively. The MDS solution to M is a classical multi-dimensional scaling process, such that X r e d can be obtained by
X r e d = Q + Λ +
where Λ + is a diagonal matrix of the two biggest positive eigenvalues and Q + is a matrix whose columns are corresponding orthonormal eigenvectors in the MDS solution. For X b l u e , we use the asymmetric MDS method in [49] to transform X b l u e into the same coordinate space with X r e d . A pair of red and blue points represents a 4-dimensional word vector. Those words that do not appear in this bag-of-words W will be filtered. A group of realistic narrative pixel image representations is shown in Figure 7. The red lines indicate a word in the input sentence, and the green lines indicate the word order of two words arranged in the sentence. Next, we will show how this representation can be used for data association.

4.3. Cluster Analysis for Data Association

To retrieve similar event sequences, we use the hierarchy cluster method [50] with the presented text representation. Given a sequence of conflict text φ N k , the output of the pixel image transformation of φ N k is ρ N k = p 1 , , p k , where p i R 100 × 100 . The text-image sequence ρ N k must be reduced to a group of 2-dimensional points ρ N k - 2 by the dimensional reduction method. We then implement the clustering tool on the union of ρ N k - 2 and Ψ 2 , where Ψ 2 is the 2-dimensional reduction result of Ψ. Specifically, we set the maximum number of members to 20 because we assume that 20 searched events for each input can provide a sufficient number of conflict scenarios.
Some associated events whose coordinates are far away from the input conflicts are considered to have a low relation with the areas of interest. We must filter the result by both the “ADMIN1-3” items and their geographical precision. The filtered result ψ N i is used as the reference for conflict reasoning. We select the subsequent conflicts ϕ that occurred after ψ N i within two or three days. The reasons are that (i) the activity patterns of conflict have the characteristics of burstiness [51], which most often lasts one or two days; (ii) we focus on the response to an emergency, where the prediction of a couple of days could be more suitable for emergency management.

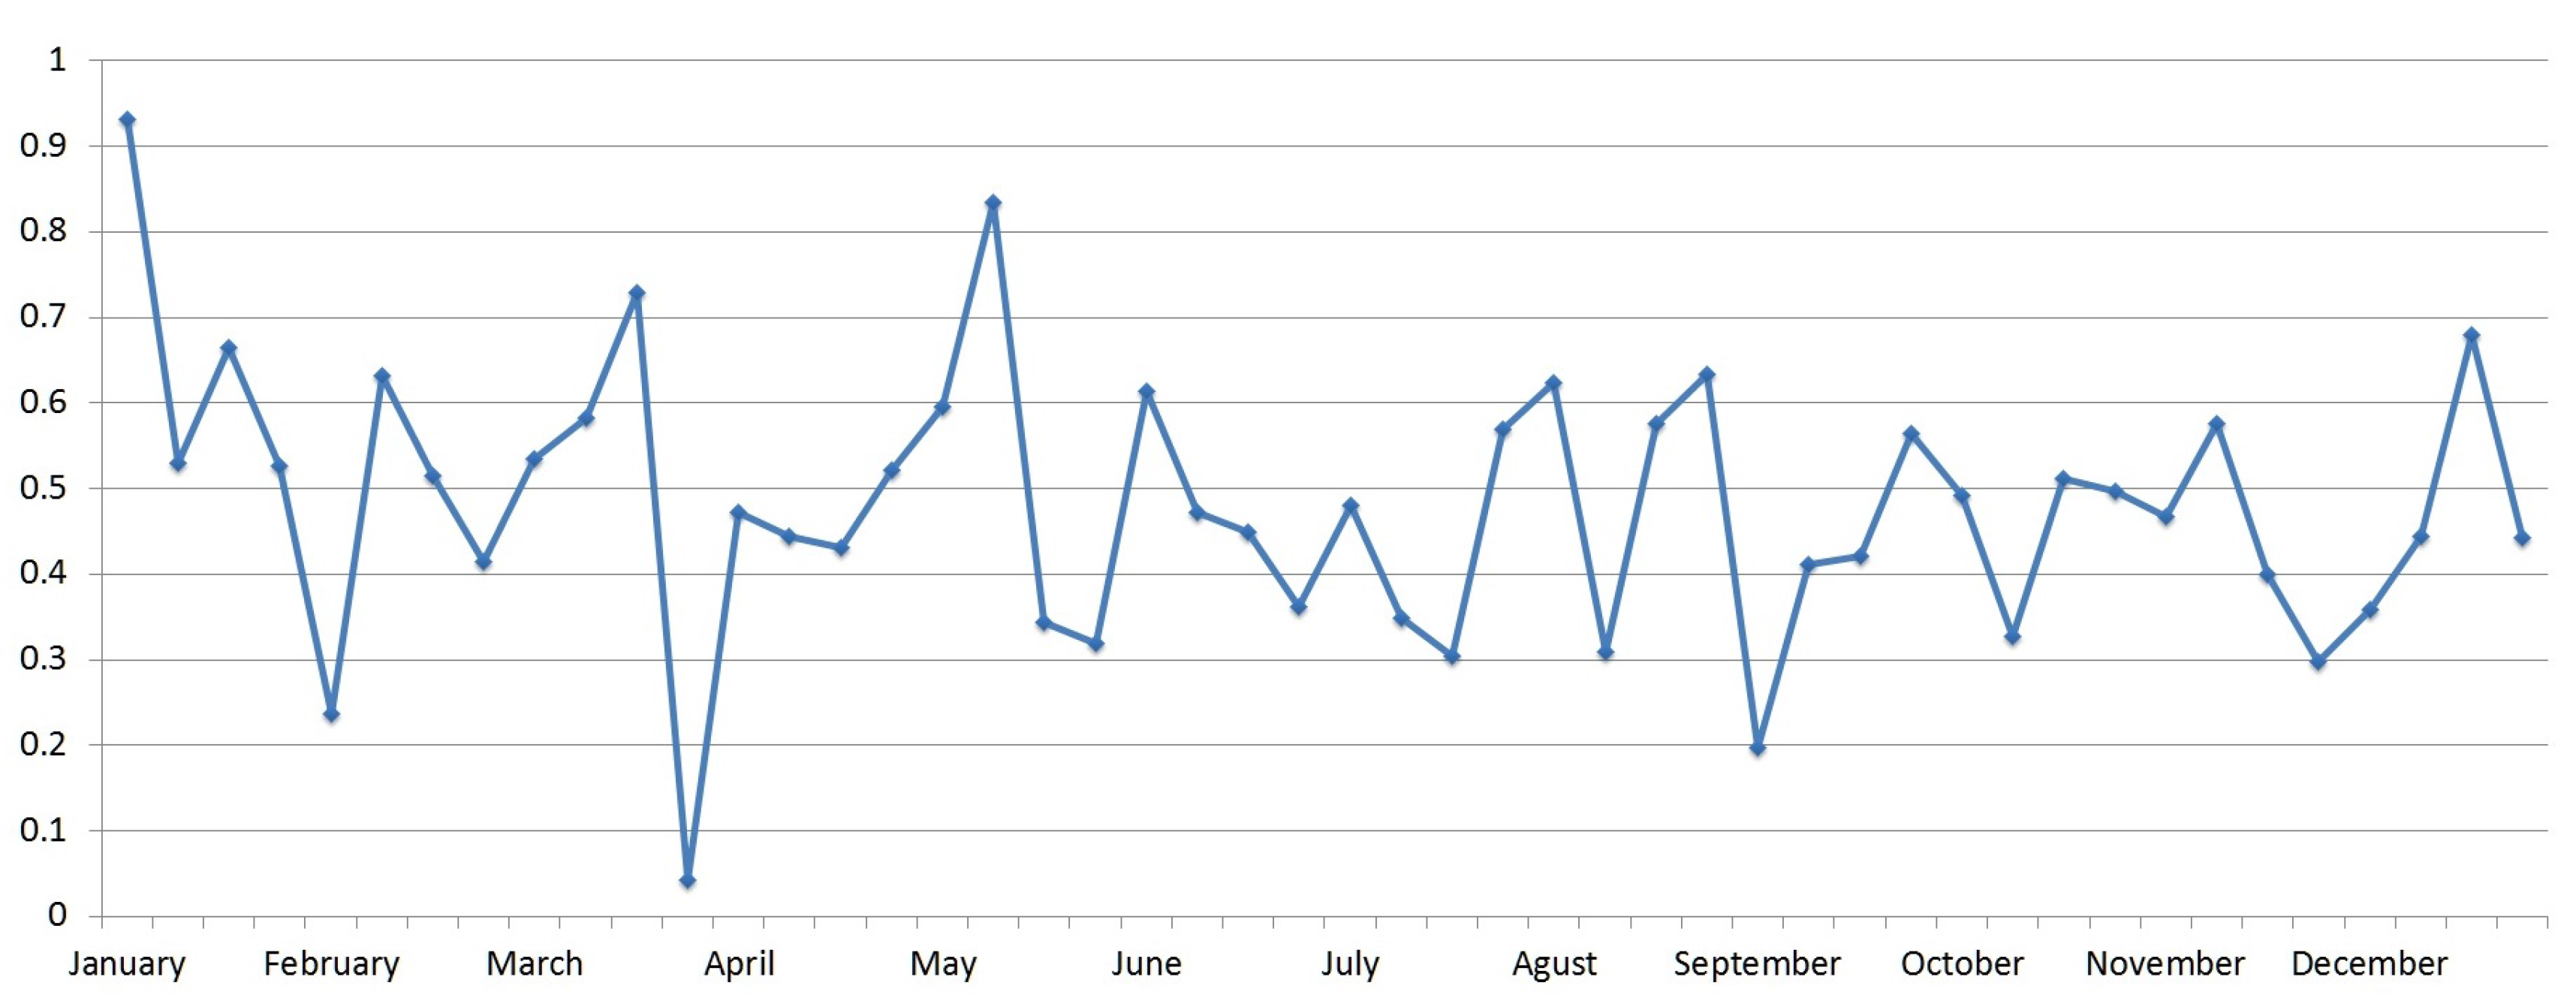
4.4. Evaluation Method

For the evaluation, we design three criteria as follows: first, we propose a spatiotemporally evolving map to represent conflict developments with respect to a spatial and temporal expansion. The map visualization of event points using simple colors is not intuitive for understanding the process of the conflicts. We use the Kriging tool [52] to interpolate the interspaces between these points. The conflict process can be shown at a higher level to facilitate decision-making. Assuming the inferred events to be ϕ and the real events to be γ , the data of geographical coordinates and the events issuing order that are involved are denoted by L ϕ , T ϕ and L γ , T γ , respectively. If there exists a mapping T = Z L , then the two groups of observations L ϕ , T ϕ and L γ , T γ have the functions T ϕ = Z L ϕ and T γ = Z L γ . We expect to estimate T * = Z * L * for the other points L * in the two maps, which include L ϕ and L γ , respectively. Briefly, the temporal relationships of the other geographical coordinates can be estimated based on the observations. The estimation can be expressed as a linear combination that is to be solved as
Z * L * = i = 1 n λ i Z L i
where λ i is the coefficients required to be solved.
The typical solution of Equation (2) is a classic problem of a geographical statistical model [53]. Hence, we use the Kriging process to compute the estimate. The interpolated result must then be filtered to eliminate the unrelated area. For example, the generated map and corresponding mask are shown in Figure 8. The transition of the colored regions from warm to cool are intended to represent the temporal process of the events, whereas the color coverage represents the spatial impact of the events. For example, the deep blue regions indicate earlier events, and the red regions represent the final phases of the conflicts. The masks (b) and (d) are determined by filtering the exceptional values that are generated from the Kriging interpolation. The Kriging here can not only give the prediction value Z * ( L * ) but also can evaluate the variance of prediction value σ 2 ( L * ) by
σ 2 ( L * ) = i = 1 n λ i γ L i - L * + μ
where γ is the semi-variagram function that we chose the Gaussian regression function, and μ is the Lagrange coefficient that can be obtained by the Kriging solution. Those prediction values that the maximum variance corresponding to, are determined as the exceptional values.
Accordingly, we use the intersection area of the coverage between the prediction map and the realistic map to evaluate the predicting precision.
p = P 1 P 2 P 1
where P 1 denotes the area of the inferred map and P 2 denotes the area of the real conflicts map. The intersection area is obtained by the image operation P 1 P 2 . The coverage value p gives an intuitive result for describing the underlying conflict regions.
Under the condition of lacking prior estimation, we count the distribution of the volume of events in every district of Nigeria in addition to the fatality distribution. Compared with the difference between the inferred and real data, we can evaluate the effectiveness of the presented method from other angles. We normalize the inferred event distribution to D ϕ and the real event distribution to D γ , in addition to the inferred fatalities distribution to F ϕ and the real fatalities distribution to F γ . The evaluation can be simply written as
d e v e n t = D γ - D ϕ n
d f a t a = F γ - F ϕ n
where d e v e n t and d f a t a are the average difference in the event and fatality distributions, respectively, and n is the number of districts in Nigeria.

5. Results and Analysis

We learn the data association on the data from 1997 to 2014 and evaluate the framework using the data from 2015. The approach focuses on the use of the data-mining technology on a couple days of conflicts prediction. We divide the data from 2015 into 48 datasets to perform the evaluations. Generally, in each dataset, the data from the first three or four days is used as input because the date in ACLED may be discontinuous. We hope that input data should be enough to restore conflict process. We then associate similar events from historical data based on narrative plots and infer future events within a couple days depending on the arrangement of the date in ACLED. The spatiotemporal evolving maps are generated for both inferred events and realistic future events. We evaluate the prediction using Equation (3). A section of the visualization result from August to October is shown in Figure 9, and the result regarding the prediction precision is shown in Figure 10.
From an intuitive comparison, we obtain the prediction results of 4–6, 18–20 and 25–27 August; 28–30 September; and 11–13 October, which obviously present a strong connection with the corresponding real data regarding the hotspots regions. The transition in the color regions can express the spatiotemporal process of conflict evolution. The inferred conflict evolution can be visualized through the interpolation of geographical coordinates and events issued orders. We adopt only the time order of the inferred date from different periods while omitting their occurrence dates because the appositional mode of narrative can be more suitable to organizing relatively independent conflict sequences. For example, if the inferred result comes from the two phases of 6 August 2004 to 10 August 2004 and 22 Octorber 2012 to 26 November 2012, the corresponding temporal attributes are both set as the time sequence 1 , 2 , 3 , 4 , 5 .
In Figure 10, the average precision is 0.4817, whereas the minimum value is 0.0426, which appears in the fourth week of March, and the maximum value is 0.9315, which appears in the first week of January. The occurrence of the lowest value is due to the lack of inferred events. The result shows that the average precision is not very high, but we obtained some appropriate prediction results that exceed 0.7 in some weeks of January, March and May. The two results can allow us to provide a valuable reference for the spatiotemporal decision making of conflict activities based solely on the narrative plots in the data. For more evaluations, we counted the distributions of both event issued frequencies and fatalities in every district of Nigeria. The results are shown in Figure 11 and Figure 12.
We obtain an average difference of 0.0112 from the distributions shown in Figure 11 and an average difference of 0.0171 from the distributions shown in Figure 12. The distributions are counted in the 37 districts of Nigeria, which belong to the first level of administrative divisions. The statistical results show that the variation tendencies regarding both the inferred events frequencies and the inferred fatalities almost correspond to the real statistical results. The consistencies can verify the effectiveness of the data association framework and the assumption of which conflict logs include certain narrative plots of structure that underlie various types of data.

6. Discussion

The most striking result of our analysis is the ability to predict conflict evolutions via a narrative plot-reasoning concept that is based on the vectorization representation learning of text semantics in conflict events. With a numerical representation, the data association framework enables us to utilize historical cases to support the prediction of a spatiotemporal process of emergencies. We select the good and bad results of a prediction to analyze the application range of the approach. From the result of 0.9315, the clustered narrative plots exhibit a relatively higher similarity than the real events sequence in conflict textual description, which both depict the bloody conflicts that occurred in the terrorist organization of Boko Haram against the civilians and military of Nigeria. Our approach predicts a sharp decline with a precision of 0.0426 because the actors involved in similar events are very different, e.g., the clustered events involve Muslims, police and militants, whereas the real events involve democratic party members, rioters and military. The types of actors in the clustered events obviously play an important role and impact the reasoning results. Learning the representation of the relationships between the narrative plots and actors could be a direction to obtain further improvement in these methods. The result that presented in Figure 9 demonstrates certain relevance between the predicted and observed spatial patterns, but cannot give a relatively accurate temporal pattern prediction. This problem may have little effect on short time conflicts, which last within a week, while the predicted regions that are used for warning may be more referable in practice.
Compared with our approach, some investigations depend on geo-spatial or spatiotemporal association analysis to study, such as the relationship between adverse birth outcomes and arsenic in the groundwater [32] and the county potential [35]. These parametric modeling approaches [40,44,46] focus on a few data members, whereas our framework can associate more extensive data types that include more than spatial and temporal data. In this case, the information about the actors and fatalities can be associated using narrative plots to support decision-making. The data regarding the actors have been investigated to recognize the behavioral patterns of undefined armed groups [11] and violent Islamist groups [6]. The fatalities have been utilized to evaluate the severity of the conflicts in [12,13,14]. Based on the fundamentals of textual representation learning, we can reduce the range of usable data to facilitate multi-factor correlation analyses.
The average values of the prediction result from August to October (see Figure 13) are prominent, which is consistent with the intensity of conflict provided by [12,13,14]. In [12,13,14], which is about Nigeria, the intensity successively follows “Escalating” (August), “Decreasing” (September) and “Ongoing” (October), where the severity order is "Escalating" > “Ongoing” > “Decreasing”. All the spatiotemporal evolution maps show the activity scope of Boko Haram agreeing with the result presented in [3]. Furthermore, our approach can be fundamental for a higher level of information extraction, such as a manual arrow trend chart, which can be used as an intuitive conflict evolution assessment. An example of the application is shown in Figure 14.

7. Conclusions

This study proposes a data association framework for spatiotemporal predictions of armed conflict events. A novel text representation of event text, which is called a narrative pixel image, is presented. The numerical representation can express both co-word features and word orders into a unified form. When using the implemented hierarchical cluster tool, multiple types of data can be associated together within similar conflict scenarios. We infer the geographical coordinates and dates of the cluster events, which are used to generate the spatiotemporal evolution maps based on the Kriging interpolation method. The evaluation results indicate that our approach can support spatiotemporal decision-making regarding emergencies and conflicts.

Acknowledgments

We would like to thank the editors and anonymous referees for their constructive comments.

Author Contributions

Size Bi, Xiaoyu Han, Jing Tian and Tinglei Huang are the lead authors of this paper who have conducted data processing and analysis, and also wrote the draft paper. Both the authors Xiao Liang and Yang Wang contribute to provide valuable feedbacks and guidance during the process of writing this paper.

Conflicts of Interest

The authors declare no conflict of interest.

References

  1. Owutu, I.U. Globalization and management of regional conflicts and security in Africa: The case of ECOWAS. Net J. Soc. Sci. 2014, 2, 37–43. [Google Scholar]
  2. Raleigh, C.; Dublin, T.C. Violence against civilians: A disaggregated analysis. Int. Interact. 2012, 38, 462–481. [Google Scholar] [CrossRef]
  3. Mundell, J. Africa Conflict Monthly Monitor; A Consultancy Africa Intelligence (CAI) Publication: Gauteng, South Africa, 2014. [Google Scholar]
  4. West Africa Monitor Quarterly Issue 3. Available online: http://www.afdb.org/fileadmin/uploads/afdb/Documents/Publications/Quarterly_West_Africa_Monitor_-_Issue_3.pdf (accessed on 13 February 2016).
  5. West Africa Monitor Quarterly Issue 4. Available online: http://www.afdb.org/fileadmin/uploads/afdb/Documents/Publications/Quarterly_West_Africa_Monitor_-_Issue_4.pdf (accessed on 13 February 2016).
  6. MacEachren, A. Spatio-Temporal Event Detection, Automated Event Detection Based on Document Content, Spatial, and Temporal Attributes. Available online: http://www.geovista.psu.edu/resources/flyers/NEVAC_Event_Detection.pdf (accessed on 13 February 2016).
  7. Sun, Y.; Han, J. Meta-path-based relationship prediction. In Proceedings of the ACM SIGKDD International Conference on Knowledge Discovery and Data Mining, Beijing, China, 12–16 August 2012.
  8. Raleigh, C. ACLED (Armed Conflict Location & Event Data Project). Available online: http://www.acleddata.com/data/ (accessed on 13 February 2016).
  9. Raleigh, C.; Dowd, C. ACLED Working Paper No. 9 Peacekeeping and Civilian Protection. ACLED (Armed Conflict Location & Event Data Project). Available online: http://www.acleddata.com/wp-content/uploads/2015/10/ACLED-Working-Paper-No.-9_Peacekeeping-and-Civilian-Protection_2015.pdf (accessed on 13 February 2016).
  10. Raleigh, C.; Kniveton, D. Come rain or shine: An analysis of conflict and climate variability in East Africa. J. Peace Res. 2012, 49, 51–64. [Google Scholar] [CrossRef]
  11. ACLED (Armed Conflict Location & Event Data Project). Unidentified Armed Groups. Available online: http://www.acleddata.com/wp-content/uploads/2012/07/ACLED_Unidentified-Armed-Groups-Working-Paper_July-2012.pdf (accessed on 11 February 2016).
  12. Raleigh, C.; Dowd, C.; Moody, J. ACLED Conflict Trends Report No. 40 August 2015. ACLED (Armed Conflict Location & Event Data Project). Available online: http://www.acleddata.com/wp-content/uploads/2015/08/ACLED_Conflict-Trends-Report-No.40-August-2015_pdf.pdf (accessed on 13 February 2016).
  13. Raleigh, C.; Dowd, C.; Moody, J. ACLED Conflict Trends Report No. 41 September 2015. ACLED (Armed Conflict Location & Event Data Project). Available online: http://www.acleddata.com/wp-content/uploads/2015/09/ACLED_Conflict-Trends-Report-No.41-September-2015_pdf.pdf (accessed on 13 February 2016).
  14. Raleigh, C.; Dowd, C.; Moody, J. ACLED Conflict Trends Report No. 42 October 2015. ACLED (Armed Conflict Location & Event Data Project). Available online: http://www.acleddata.com/wp-content/uploads/2015/10/ACLED_Conflict-Trends-Report-No.42-October-2015_pdf.pdf (accessed on 13 February 2016).
  15. ACLED (Armed Conflict Location & Event Data Project). Available online: http://www.acleddata.com/visuals/trends/ (accessed on 13 February 2016).
  16. Clionadh, R.; Choi, H.J.; Kniveton, D. The devil is in the details: An investigation of the relationships between conflict, food price and climate across Africa. Global Environmental Change. Glob. Environ. Chang. 2015, 32, 187–199. [Google Scholar]
  17. Bhatt, M.; Wallgrun, J.O. Geospatial Narratives and Their Spatio-Temporal Dynamics: Commonsense Reasoning for High-Level Analyses in Geographic Information Systems. ISPRS Int. J. Geo-Inf. 2014, 3, 166–205. [Google Scholar] [CrossRef]
  18. Damiano, R.; Lieto, A. Ontological representations of narratives: A case study on stories and actions. In Proceedings of the Workshop on Computational Models of Narrative 2013, Hamburg, Germany, 4–6 August 2013.
  19. Elson, D.K. Detecting story analogies from annotations of time, action and agency. In Proceedings of the Third Workshop on Computational Models of Narrative, Istanbul, Turkey, 26–27 May 2012.
  20. Vlek, C.S.; Prakken, H.; Renooij, S.; Verheij, B. Representing and evaluating legal narratives with subscenarios in a Bayesian network. In Proceedings of the Workshop on Computational Models of Narrative 2013, Hamburg, Germany, 4–6 August 2013.
  21. ACLED (Armed Conflict Location & Event Data Project). Annex 2—Separating AFRC/RUF Violence in the NPWJ Conflict Mapping Report. Available online: http://www.acleddata.com/wp-content/uploads/2015/01/SLL-Appendix_Specific-Notes-on-seperation-AFRC-RUF-Violence.pdf (accessed on 11 February 2016).
  22. ACLED (Armed Conflict Location & Event Data Project). Annex 1—Codebook for NPWJ Conflict Mapping Report. Available online: http://www.acleddata.com/wp-content/uploads/2015/02/Annex-1_Codebook_Main.pdf (accessed on 11 February 2016).
  23. Ralph, S.; Lindgren, M.; Padskocimaite, A. UCDP Georeferenced Event Dataset(GED) Codebook Version 1.5. Available online: http://www.ucdp.uu.se/ged/data/ucdp-ged-points-v-1-5-codebook.pdf (accessed on 13 February 2016).
  24. Zammit Mangion, A.; Sanguinetti, G.; Kadirkamanathan, V. Variational estimation in spatiotemporal systems from continuous and point-process observations. IEEE Signal. Process. 2012, 60, 3449–3459. [Google Scholar] [CrossRef]
  25. Schutte, S.; Weidmann, N.B. Diffusion patterns of violence in civil wars. Polit. Geogr. 2011, 30, 143–152. [Google Scholar] [CrossRef]
  26. Zhukov, Y.M. Roads and the diffusion of insurgent violence: The logistics of conflict in Russia’s North Caucasus. Polit. Geogr. 2012, 31, 144–156. [Google Scholar] [CrossRef]
  27. Zammit-Mangion, A.; Dewar, M.; Kadirkamanathan, V.; Sanguinetti, G. Point process modelling of the Afghan War Diary. Proc. Natl. Acad. Sci. USA 2012, 109, 12414–12419. [Google Scholar] [CrossRef] [PubMed]
  28. Tran, C.C.; Yost, R.S.; Yanagida, J.F.; Saksena, S.; Fox, J.; Sultana, N. Spatio-temporal occurrence modeling of highly pathogenic avian influenza subtype H5N1: A case study in the Red River Delta, Vietnam. ISPRS Int. J. Geo-Inf. 2013, 2, 1106–1121. [Google Scholar] [CrossRef]
  29. Goodchild, M.F. Citizens as sensors: The world of volunteered geography. GeoJournal 2007, 69, 211–221. [Google Scholar] [CrossRef]
  30. Li, L.; Goodchild, M.F. The role of social networks in emergency management: A research agenda. Int. J. Inf. Syst. Crisis Response Manag. 2010, 2, 49–59. [Google Scholar] [CrossRef]
  31. Perumal, M.; Velumani, B.; Sadhasivam, A.; Ramaswamy, K. Spatial data mining approaches for GIS—A brief review. Adv. Intell. Syst. Comput. 2015, 2, 579–592. [Google Scholar]
  32. Shi, X.; Ayotte, J.D.; Onda, A.; Miller, S.; Rees, J.; Gilbert-Diamond, D.; Onega, T.; Gui, J.; Karagas, M.; Moeschler, J. Geospatial association between adverse birth outcomes and arsenic in groundwater in New Hampshire, USA. Environ. Geochem. Health 2015, 37, 333–351. [Google Scholar] [CrossRef] [PubMed]
  33. Carlson, J.A.; Saelens, B.E.; Kerr, J.; Schipperijn, J.; Conway, T.L.; Frank, L.D.; Chapman, J.E.; Glanz, K.; Cain, K.L.; Sallis, J.F. Association between neighborhood walkability and GPS-measured walking, bicycling and vehicle time in adolescents. Health Place 2015, 32, 1–7. [Google Scholar] [CrossRef] [PubMed]
  34. Luong, N.V.; Tateishi, R.; Hoan, N.T. Analysis of an Impact of Successionin Mangrove Forest Association Using Remote Sensing and GIS Technology. J. Geogr. Geol. 2015, 7, 106–116. [Google Scholar]
  35. Mei, Z.; Xu, S.; Ouyang, J. Spatio-temporal association analysis of county potential in the Pearl River Delta during 1990 C2009. J. Geogr. Sci. 2015, 25, 319–336. [Google Scholar] [CrossRef]
  36. Li, D.; Deogun, J.; Harms, S. Interpolation techniques for geo-spatial association rule mining. In Proceedings of the 9th International Conference, RSFDGrC 2003, Chongqing, China, 26–29 May 2003; pp. 573–580.
  37. Qin, S.; Liu, F.; Wang, C.; Song, Y.; Qu, J. Spatial-temporal analysis and projection of extreme particulate matter (PM10 and PM2.5) levels using association rules: A case study of the Jing-Jin-Ji region, China. Atmos. Environ. 2015, 120, 339–350. [Google Scholar] [CrossRef]
  38. Chen, A.T.; Yoon, A.; Shaw, R. People, Places and Emotions: Visually Representing Historical Context in Oral Testimonies. In Proceedings of the Third Workshop on Computational Models of Narrative, Istanbul, Turkey, 26–27 May 2012.
  39. Broadwell, P.M.; Tangherlini, T.R. TrollFinder: Geo-semantic exploration of a very large corpus of Danish folklore. In Proceedings of the Third Workshop on Computational Models of Narrative, Istanbul, Turkey, 26–27 May 2012.
  40. Batal, I.; Fradkin, D.; Harrison, J.; Moerchen, F.; Hauskrecht, M. Mining recent temporal patterns for event detection in multivariate time series data. In Proceedings of the 18th ACM SIGKDD Conference on Knowledge Discovery and Data Mining, Beijing, China, 12–16 August 2012.
  41. Matsubara, Y.; Sakurai, Y.; Faloutsos, C.; Iwata, T.; Yoshikawa, M. Fast mining and forecasting of complex time-stamped events. In Proceedings of the 18th ACM SIGKDD Conference on Knowledge Discovery and Data Mining, Beijing, China, 12–16 August 2012.
  42. Han, B.; Baldwin, T. Lexical normalisation of short text messages: Makn sens a twitter. In Proceedings of the 49th Annual Meeting of the Association for Computational Linguistics, Portland, USA, 19–24 June 2011.
  43. Hua, W.; Wang, Z.; Wang, H.; Zheng, K.; Zhou, X. Short text understanding through lexical-semantic analysis. In Proceedings of the 2015 IEEE 31st International, Seoul, Korea, 13–17 April 2015; pp. 495–506.
  44. Yin, J.; Wang, J. A dirichlet multinomial mixture model-based approach for short text clustering. In Proceedings of the 20th ACM SIGKDD Conference on Knowledge Discovery and Data Mining, New York, NY, USA, 24–27 August 2014.
  45. Song, Y.; Roth, D. Unsupervised Sparse Vector Densification for Short Text Similarity. NAACL 2015. Available online: http://aclweb.org/anthology/N/N15/N15-1138.pdf (accessed on 13 February 2016).
  46. Yan, X.; Guo, J.; Lan, Y.; Cheng, X. A biterm topic model for short texts. In Proceedings of the International World Wide Web Conference, Rio de Janeiro, Brazil, 13–17 May 2013.
  47. OpenStreetMap. Available online: http://www.openstreetmap.org/#map=5/44.277/10.942 (accessed on 13 February 2016).
  48. Steyvers, M.; Shiffrin, R.M.; Nelson, D.L. Semantic Spaces based on Free Association that Predict Memory Performance. Available online: http://lsa.colorado.edu/LexicalSemantics/SteyversShiffrinNelson.pdf (accessed on 14 February 2016).
  49. Borg, I.; Groenen, P.J.F. Modern Multidimensional Scaling, Theory and Applications; Springer: Berlin, Germany, 2005. [Google Scholar]
  50. Christian, B.; Fiedler, F.; Oswald, A.; Plant, C.; Bianca, W.; Peter, W. ITCH: Information-theoretic cluster hierarchies. In Proceedings of the Conference: Machine Learning and Knowledge Discovery in Databases, Barcelona, Spain, 20–24 September 2010.
  51. Taha, Y.; Robert, S.; Rung, A.; Kornai, A. Dynamics of conflicts in wikipedia. PLoS ONE 2012, 7. [Google Scholar] [CrossRef] [Green Version]
  52. Lophaven, S.N.; Nielsen, H.B. A MATLAB Kriging Toolbox Version 2.0, August 1, 2002. Available online: http://citeseerx.ist.psu.edu/viewdoc/summary?doi=10.1.1.73.5824 (accessed on 14 February 2016).
  53. Quinonerocandela, J.; Edwardrasmussen, C. A unifying view of sparse approximate Gaussian process regression. J. Mach. Learn. Res. 2005, 6, 1935–1959. [Google Scholar]
Figure 1. The study area—The entire land of Nigeria.
Ijgi 05 00188 g001
Figure 2. The statistical information about the Nigerian part of the Armed Conflict Location and Event Dataset (ACLED) database. (a) The numbers of all varieties of conflict event types, covering from 1997 to 2014; (b) the top 9 armed conflict organizations ranked by the number of events.
Ijgi 05 00188 g002
Figure 3. Modeling framework.
Ijgi 05 00188 g003
Figure 4. Narrative plot for data organization.
Ijgi 05 00188 g004
Figure 5. Modeling procedure of a narrative pixel image.
Ijgi 05 00188 g005
Figure 6. The generated word embedding space (a); and its rasterization (b). A total of 3832 words was used, and each word was represented by a pair of red and blue points.
Ijgi 05 00188 g006
Figure 7. An example of 10 narrative pixel images generated from the item “EVENT_ID_NO_CNTY” 53,233 to 53,241.
Ijgi 05 00188 g007
Figure 8. An example of the comparison between the prediction map and the reality map: (a) the map interpolated by the inferred spatial and temporal data; (b) the filtering mask of (a); (c) the map generated from the subsequent realistic spatial and temporal data; (d) the filtering mask of (c).
Ijgi 05 00188 g008
Figure 9. A comparison of spatiotemporal evolving of conflicts from August to October.
Ijgi 05 00188 g009
Figure 10. Near-weekly prediction precision.
Ijgi 05 00188 g010
Figure 11. Comparison between the ratios of the event-issued frequencies.
Ijgi 05 00188 g011
Figure 12. Comparison between the ratios of the issued fatalities.
Ijgi 05 00188 g012
Figure 13. The trend of the prediction from August to October is similar to the result presented in [12,13,14].
Ijgi 05 00188 g013
Figure 14. An example of an arrow trend chart comparison for the week of 1 October.
Ijgi 05 00188 g014

