Article

Optimized Route Selection Method based on the Turns of Road Intersections: A Case Study on Oversized Cargo Transportation

School of Remote Sensing and Information Engineering, Wuhan University, 129 LuoyuRoad, Wuhan 430079, China
*
Author to whom correspondence should be addressed.
ISPRS Int. J. Geo-Inf. 2015, 4(4), 2428-2445; https://doi.org/10.3390/ijgi4042428
Submission received: 31 July 2015 / Revised: 5 October 2015 / Accepted: 14 October 2015 / Published: 6 November 2015

Abstract

:
For oversized cargo transportation, traditional transportation schemes only consider road length, road width, the transportation cost as weight values in analysis and calculation of route selection. However, for oversized trucks, turning direction at road intersections is also a factor worth considering. By introducing the classical algorithm of Dijkstra into the model of road network, this research considers the size of turning angle at intersections as the weight value of the edge in the auxiliary network based on the weight values of road corners, upon which the shortest path analysis is performed. Then, an optimal path with minimum time cost was eventually obtained. The proposed algorithm was analyzed and compared with the traditional shortest path algorithm and it reported that our method could reduce the time for oversized trucks to pass through intersections. In addition, the proposed algorithm could be adapted to the complex and diverse road networks and provide a reliable scheme for route selection of oversized trucks.

Graphical Abstract

1. Introduction

In recent years, the industry of oversized cargo transportation has developed because of the rapid development and increasing construction efforts of industries such as electric power, energy, chemicals, and building materials in China [1]. Compared with the traditional mode of transport, oversized cargo transportations refer to those that transport overlong, oversized, or overweight equipment [2]. Generally, the route of oversized cargo transportation is longer, and the prices of the materials and equipment to be transported are relatively expensive; thus, designing a reasonable transportation scheme can greatly improve its efficiency [3]. On the one hand, as the main mode of oversized cargo transportation, highway transportation is flexible such that the devices can be directly transported to their destination by avoiding secondary transportation, and hence, it saves transportation costs [4]. On the other hand, even if waterways or railways are used for transporting important objects, the journey from or to the pier or train station will finally be covered by highway transportation [4]. Therefore, designing an optimal path for oversized cargo transportation schemes on the highway is not only an urgent need for many transportation carriage units, but it can also provide an important guarantee for the security and reliability of transporting equipment in large-scale projects. The optimization of route selection of oversized cargo transportation scheme on highways has currently become a topic with practical significance [2].
Conducting a plan of traveling routes in a road network can always be achieved through the shortest path analysis. An associated weight value, such as the time spent by vehicles to pass through a road segment [5], is set to the edge of each path that corresponds to a road, and the shortest path with respective weight values can be obtained by using the traditional Dijkstra algorithm. However, as to the route selection of oversized cargo transportation scheme, due to its characteristics of being extremely high, long, and heavy, oversized trucks will encounter restrictions while traveling on roads with obstacles, such as the ground bearing capacity of the road, bend radius requirements of the road, the maximum longitudinal pavement, the width of the curve on the road, and the requirements of cross slope [1]. Only considering the influence of the length of the road upon the total running time is insufficient. In fact, there are quite a few significant differences in the amount of time spent on steering and in restrictions with different transportation trucks at different road intersections in the traffic system in the urban areas [6]. For oversized trucks on highways, large flat trailers or trailers that have longer bodies are commonly used; some even use bridge trailers to connect groups of flatbed trailers [7]. Steering becomes very inconvenient for large trucks at intersections within the road network in urban areas, which is particularly true for articulated lorries; large trucks, therefore, need to spend much more time at intersections compared with common cars. Caldwell [8] proposed that the delay caused by steering restrictions at road intersections by transportation trucks can reach 17%–35% of the total traveling time. If steering restrictions were ignored during route planning and route selection, the basic characteristics of the road network will be lost; thus, the optimal route obtained is not practical or does not consider traffic rules. Nielsen [9] proposed that the road intersection is an important part of a road network, and the delay at road intersections caused by steering indicates the continuity on the node within the transportation network, which will influence the total traveling time. Therefore, in designing route of highway transportation scheme for oversized cargos, the cost of steering at road intersections in the city is a factor that cannot be ignored. In particular, for oversized trucks, the delay effect brought by steering restrictions at road intersections should be emphasized. Gutiérrez and Medaglia [10] tried to find the shortest path with steering limitation by means of improving the Dijkstra algorithm. Schmid and Zeiler [
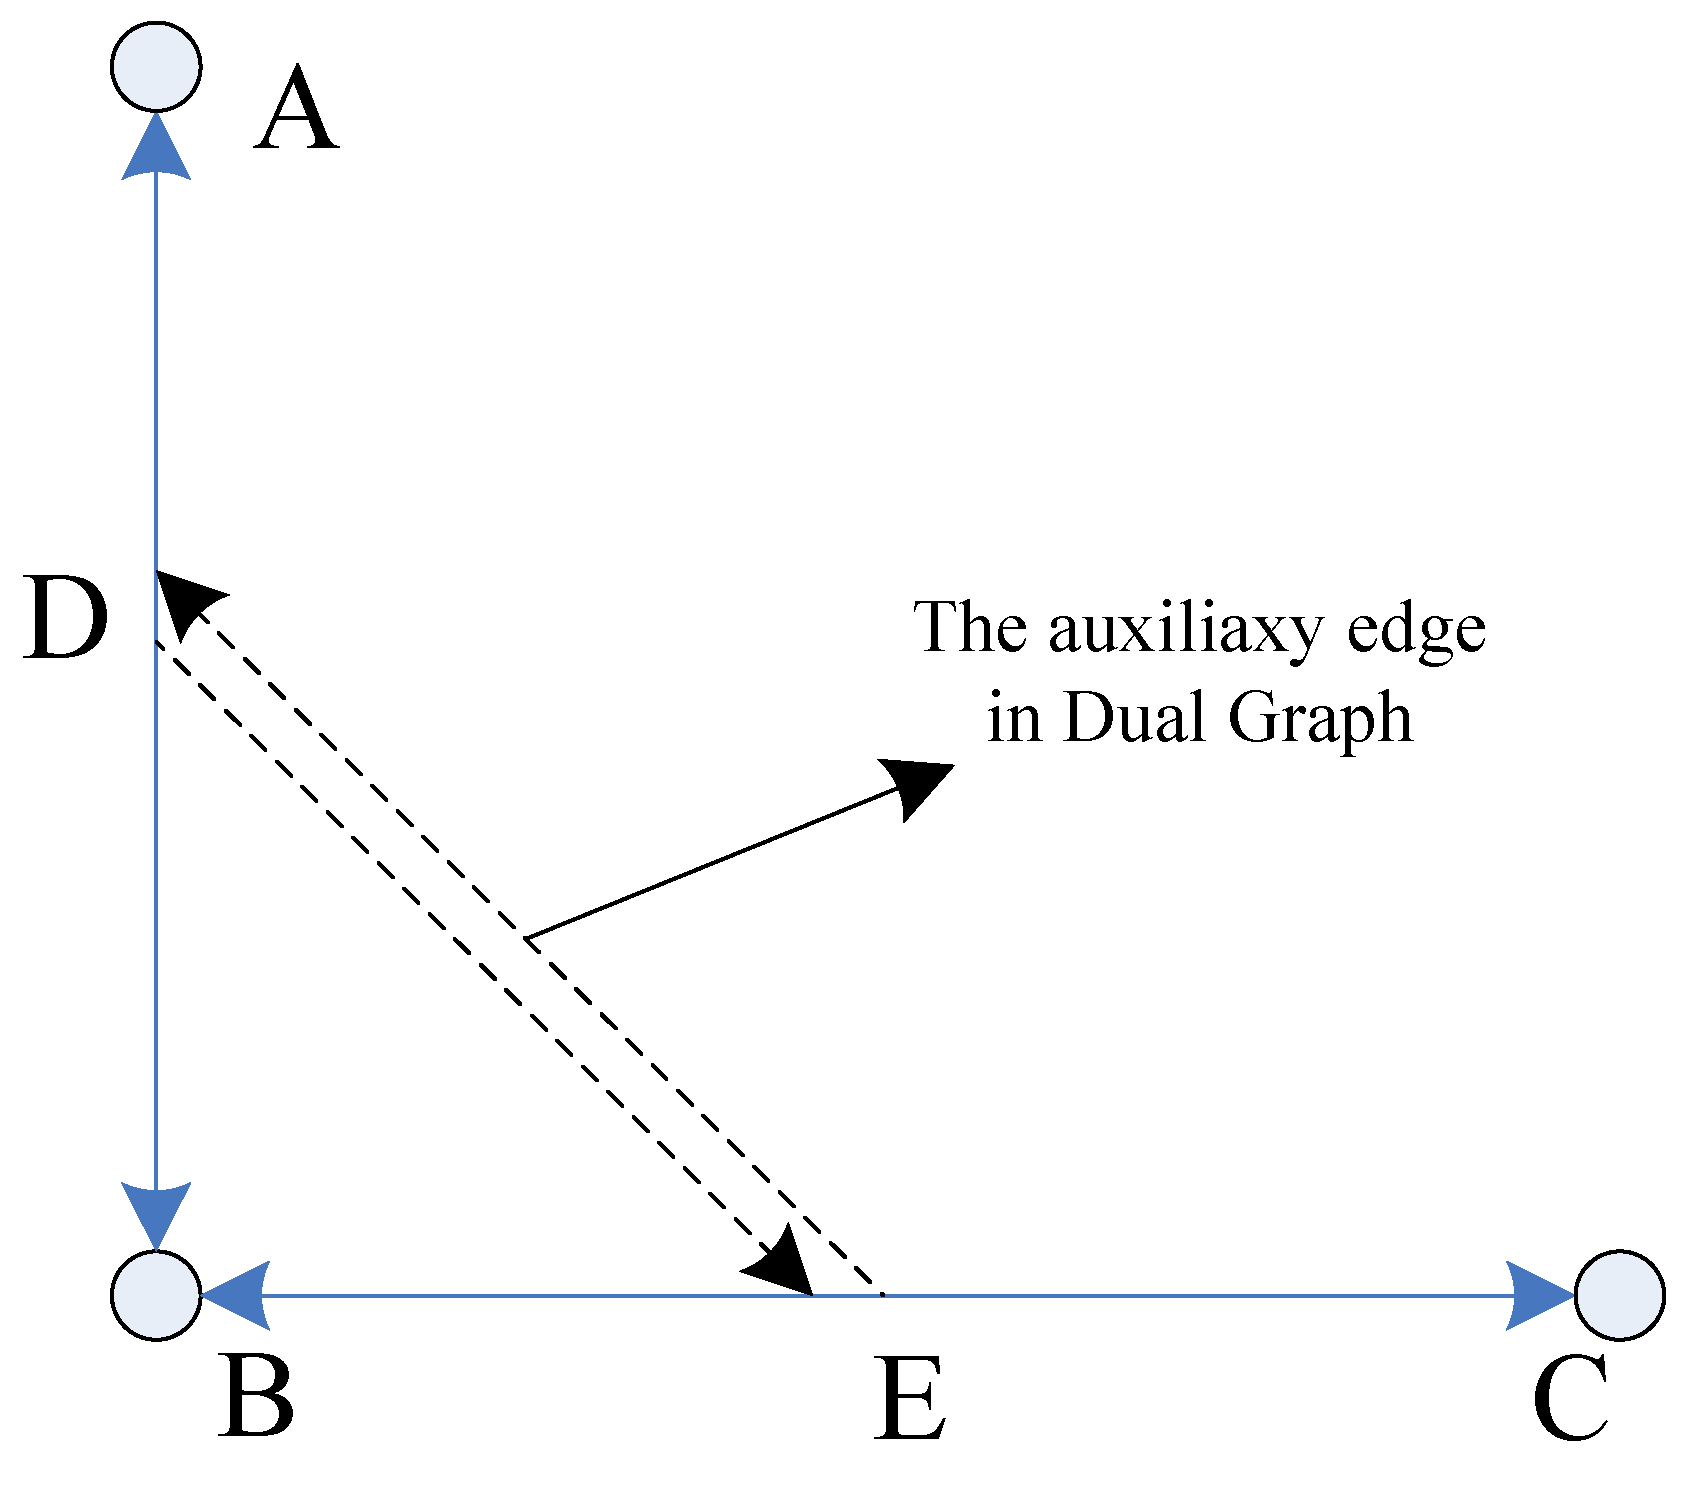
11] proposed to split each node in the road network into four subnodes and the path where each road is located was replaced by three arcs that show connectivity to represent the cost of steering by trucks at road intersections. However, the increase in number of nodes and links will lead to great reduction in efficiency of computing the optimal path. In addition, de la Barra [12] proposed a data structure called dual graph to describe the transportation network model with steering limitations. Dual graph uses arcs that express the relationship of the turning to represent turning relationship (or restrictions) at nodes within the model of the road network, which can not only fully express the connectional relationship and steering restrictions but also greatly reduce data redundancy [13].
The traditional plan for an oversized cargo transportation scheme simply considers some fundamental factors of transportation cost and the driving possibility, such as the length and width of the road and the conditions of the road, without making a comprehensive consideration about the required time consumed by oversized trucks when they make turns at intersections in the road network. As for highway transportation scheme for oversized cargos, many planners choose nighttime for transportation to avoid peak traffic. Thus, the volume of the road traffic has relatively low influence on the scheme. In addition, many traffic lights at intersections in urban areas will be automatically set in yellow after midnight. Therefore, the delay effect of waiting for traffic lights at the crossroads can be also ignored. Based on the model of road network and the traditional Dijkstra algorithm, this present study comprehensively considers both the running time to go through the road and the traveling cost of making turns at road intersections, and established a data model of network based on the weight values of road corners. Then, an algorithm of the shortest path analysis based on the size of the turn angle was proposed to optimize the shortest path algorithm existed. By analyzing and comparing with the traditional shortest path algorithm, which treats the actual length of the road as the value of running weight, we concluded that the turning model based on the road corners at intersections has a better design of operational routes for oversized trucks and that it can provide a reliable theoretical basis and technical support to highway transportation scheme for oversized cargo. The algorithm of the shortest path analysis based on the model of weight values of the road corners presented in this paper has promising future application and will effectively help to design and plan the operating routes for oversized cargo transportation in industries such as electric power, energy, chemicals, and building materials. Such algorithm will greatly reduce the cost and the price of transportation on highways, and provide a strong theoretical foundation and feasibility analysis in the route design for oversized cargo transportation schemes.
The rest of this paper is organized as follows: Section 2 introduces the model of network based on weight values of steering. Section 3 describes the process of the algorithm with examples. Section 4 presents the comparative experiments and the analysis of the results. Finally, Section 5 contains the conclusions and the prospective application of the proposed algorithm.

2. Model of Network based on Weight Values of Steering

2.1. Dual Graph

A geographical network describes and expresses the entity of a geographical target within the geo-space through the concept of network in the graph theory [14]. A geographical network is a mesh structure that is composed of several interconnected linear entities and includes both spatial data and attributes. Spatial data are used to mark the location of objects on the ground and their correlation. Attribute is used to show related information of features (such as the name or the length of the road). If the concept of geographical network is introduced into the construction of the model of urban road network, a transportation network will be generated. Usually, people use the Directed Graph Model with weight values to represent the general structure of the road network, namely, G = (V, E), where G represents the data model of transportation network, V is the vertex set of the transportation network, also known as nodes, which represents the intersections or endpoints of roads in the transportation network, and E is the set of edges in the network of traffic, known as arcs, which represents the cables between junctions within the transportation network.
Finding the optimal path means finding a path with the least obstructive intensity between the two nodes specified in the network. The generation of the optimal path is based on the weight values set on each road segment in the network. Weight values are the costs paid by passing through an edge or an endpoint in the network, which are also known as the strength of obstruction. They reflect the obstacles or restrictions (distance or time delay, among others) of the road when vehicles pass by [15]. The optimal path refers not only to the path with the shortest distance, but also to a path that uses other means of measurement, such as the waiting time, the traveling cost, and the traveling speed based on significant differences in traffic conditions among different roads and to the different definitions of obstructive strength [6,16]. Accordingly, solving the problem of finding the shortest path is equivalent to finding the fastest path or path with the lowest cost and so on [17].
In the past, the time spent by trucks on traveling through a certain road segment or the length of the road is assigned as the weight value; however, this old model is not always effective in actual situations [18]. The turn of the road has become an important attribute in the transportation network when performing route planning or selection for the scheme of the oversized cargo transportation. Therefore, it is necessary to take the steering delay at road intersections into consideration in the process of establishment of the model of urban road network and choose appropriate property value as weight values for the passage of transportation trucks.
Considering that the weight value of steering describes a binary relationship between every two continuous roads, it cannot be stored directly in the original structure of the road network [19]. Different from the method of splitting a node [12], the dual graph uses an auxiliary arc to describe the steering relationship and restrictions between adjacent roads. In the model of the dual graph, the original edge where the road is located becomes a node that contains some attribute information of the original road edge, and the turning direction in the original road map is represented by an edge in the dual graph. Thus, the traditional directed graph model is converted to G = (V’, E’, R), where V’ is the set of nodes in the dual graph, which represents the real roads in the original road network. E’ is the set of edges in the dual graph, which represents the connectivity of adjacent roads in the original road network. R represents the steering relationship or the steering restrictions between two adjacent roads in the primitive road network model, as shown in Figure 1.
In the dual graph, the node (such as nodes D, E) represents the original road. The starting node represents the road on which trucks drive before making a turn, whereas the termination node represents the road on which trucks drive after making a turn. The attribute information of the original road (such as arc AB and BC) is included in the attribute of the auxiliary node; meanwhile, new property values, such as the steering weights and steering restrictions, are included in the arc (such as arc DE) of the dual graph. Moreover, the trend of the edge in the network based on the weight values of corners indicates the direction of the turn. For example, in Figure 1, arc DE indicates that trucks make a left turn at node B from road AB into road BC, whereas arc ED indicates that trucks make a right turn at Node B from road CB into the road BA. After the optimal path is obtained from the auxiliary network based on the weight values of corners using the algorithm of the shortest path analysis, it is easy to derive the optimal path in the original road network with the information of the auxiliary edge and the direction of the turn on the road.
Figure 1. Model of the dual graph.
Ijgi 04 02428 g001

2.2. Establishing the Model of the Network

Roads in the city are complex and diverse. There are elevated roads, tunnels, rotary interchange, etc. In the process of modeling the road network in the city, we simplify the complex road network in urban areas into three parts, namely, nodes, segments, and corners [20,21]. Furthermore, we do not consider the situation of complex sections of bridges and tunnels or viaducts. At the same time, because of the existence of differences between unidirectional and bidirectional roads in the city [6], if no necessary process is performed, a unidirectional road may also be involved in path analysis upon a prohibited direction, which will result in inconsistencies between the path analysis findings and the actual situation. Therefore, the pros and cons weight values of steering are set in the steering attribute table. Thus, if the steering at road intersection is bidirectional, the positive and negative steering weight values are set respectively; if the steering is a unidirectional turn, the actual steering weight is set on the direction upon which a turn can be made, whereas the reverse direction is set to infinity, which means that the steering is impassable. Once different weight values are set for the different turns, a weighted auxiliary network with direction is formed [22].
As shown in Figure 2, edge de in the auxiliary network based on road corners stores not only the weight value of the turn from road ab to road bc, but also the weight value of the turn from road bc to road ab. They are both functional values related to the value of the turn angle. Meanwhile, the auxiliary arc in the auxiliary network based on road corners also stores the real distance covered by the trucks when making the turn. For example, when passing through intersections b, the red solid line indicates the actual distance that the trucks traveled when making the turn.
Figure 2. Construction of the auxiliary network based on road corners.
Ijgi 04 02428 g002
The shortest path with the minimum weight value of steering between the starting point and the end point, which is also a path with the least delay at road intersections, can be calculated using the model of weight values of the road corners. However, routes with the least delay when making turns are always longer than those with the shortest physical length. In fact, routes with the least turn delays match with the shortest routes only when the road network meshes in a regular grid [23], but in real life, such roads are almost non-existent. This research comprehensively considered the steering delay and the length of the route as basis in route selection for oversized cargo transportation scheme. Table 1 shows the storage structure of the auxiliary network based on corners.
Table 1. Storage structure of the auxiliary network based on the corners.
NumberField NameField TypeField Description
1Diversion NamestringName of the arc in the auxiliary network, composed of two road names involved in steering
2From_To_WeightintWeight value of making turns from the road where trucks drive before making the turn to the road after making the turn
3To_From_WeightintWeight value of making turns in the opposite direction as mentioned above
4LengthdoubleThe actual distance running through the auxiliary arc
5LimitedHeightdoubleThe maximum height permitted by the road
6LimitedWeightdoubleThe maximum weight permitted by the road

2.3. Setup of the Weight Values

2.3.1. Calculation of the Value of the Corner

In planning the oversized cargo transportation scheme, turning direction becomes a non-negligible factor in the process of path selection because of the characteristics of the transportation trucks themselves. The turning direction is not only a transition from one arc segment to another in the road network, which identifies the connectivity between sections, but also restricts the transport efficiency of the oversized trucks throughout the whole process of traveling. In real traffic situations, the impedance value (weight value) produced by the steering angle of various sizes is different. This article presents a model of the steering cost by giving different resistant values to different steering angles.
Figure 3 shows the definition of the model of roads, the steering rules, and the steering angles. In the figure, A, O0, and O1 are nodes of the road, and A–O0 and O0–O1 are road sections. At road intersections, the steering rule is described via “start node–intersection node–terminal node,” which divides the turn into four kinds, namely, turning left, going straight, turning right, and turning back [20]. The steering angle is defined as a chamfer formed from the road edge where the starting point is located to the edge where the end point is located in a counterclockwise rotation with the road intersection as the rotation center. As shown in Figure 3, O2–O0–A has a leftward direction, and the value of the angle is φ. A–O0–O1 has a forward direction, and the value of the angle is 0 degree. O2–O0–O1 has a rightward direction, and the value of the angle is ε. O2–O0–O2 shows a turning direction, and the value of the angle is 180 degrees.
Figure 3. The turning model at road intersections.
Ijgi 04 02428 g003
Figure 4. The calculation of the value of turn angles: (a) case a, (b) case b (c) case c and (d) case d.
Ijgi 04 02428 g004
Based on the discussion above, the actual value of the turning angle of trucks would be derived as ΦA−ΦB, where ΦA denotes the angle covered by the north direction toward the direction the truck travels in before making the turn and ΦB denotes the angle covered by the north direction toward the direction the truck travels in after making the turn. Therefore, the following are derived (Figure 4):
(a) The vehicle turns to the left and the value of the turn angle is ΦAΦB + 360° when angle ΦA ∈ (−180°, −90°] and angle ΦB ∈ [90°, 180°).
(b) The vehicle turns to the left and the value of the turn angle is ΦAΦB (°) when angle ΦA ∈ (−90°, 0°) and angle ΦB ∈ (−180°, −90°].
(c) The vehicle turns to the left and the value of the turn angle is |ΦAΦB| (°), when angle ΦA ∈ (0°, 90°) and angle ΦB ∈ [90°, 180°).
(d) The vehicle turns to the left and the value of the turn angle is ΦBΦA + 360° when angle ΦA ∈ [90°, 180°) and angle ΦB ∈ (−180°, −90°].
In addition, when the trucks go straight at road intersections, the value of the angle is considered 0°; and when the vehicle turns around, the value of the angle is 180°. Considering these various situations of steering mentioned above, the following is derived:
{ ϕ A ϕ B < - 180 ° 180 ° < ϕ A ϕ B < 0 ° t u r n i n g   r i g h t , t h e   c o r n e r   s i z e   i s   ϕ A ϕ B + 360 ° t u r n i n g   l e f t , t h e   c o r n e r   s i z e   i s | ϕ A ϕ B | 0 ° 0 ° < ϕ A ϕ B < 180 ° g o i n g   s t r a i g h t t u r n i n g   r i g h t , t h e   c o r n e r   s i z e   i s   ϕ A ϕ B ϕ A ϕ B = ± 180 ° t u r n i n g   a r o u n d t h e   c o r n e r   s i z e   i s   180 ° 180 ° < ϕ A ϕ B t u r n i n g   l e f t , t h e   c o r n e r   s i z e   i s   ϕ B ϕ A + 360 °

2.3.2. Time-consuming Model for Steering

The obstructive strength of the optimal path based on the size of the corners at road intersections comprises section blockings and junction resistances [24]. The impedance value of road sections, namely, traveling time along a road, is the main factor for selecting the route after the travel destination is decided, which is also the factor considered by many algorithms of the shortest path analysis. For junction resistance of the road, this research used GPS tracked data at road intersections in a city to fit the relationship between the size of the turning angle at road intersections and the delay of making a turn by oversized trucks to analyze its internal rules, after excluding a number of errors in the data because of objective factors.
Figure 5. Calculation of the time consumed by making turns: (a) test area and (b) the definition of the time consumed by oversized trucks to make turns.
Ijgi 04 02428 g005
The experiment below used tracked data selected from a crossroad area (where the width of the road platform available is 24 m and the number of traffic lanes is 4) with a radius of 250 m for experimental samples, as shown in Figure 5a. The function of the polynomial fitting is used for interpolation to obtain the speed of the transportation trucks (which are 4 meters in height, 6 meters in width and 70 meters in length with one flatbed trailer) at any time. Then, time t1 and t2 can be computed, which correspond to the inflection points of the speed around road intersections by the oversized trucks. This paper assumes that the time for oversized trucks to run through a certain intersection is T = t2 − t1 (Figure 5b). Multiple statistics analysis was conducted on the time consumed by making turns using the tracked data recorded at the intersections of a city. The scatter plot obtained using MATLAB is shown in Figure 6.
Figure 6. Fitting result of turning delay at road intersections: (a) delay of oversized trucks when making left turns at intersections; and (b) delay of oversized trucks when making right turns at intersections.
Ijgi 04 02428 g006
Under normal circumstances, transportation trucks often choose to travel at nighttime when the traffic lights at road intersections in many cities have turned yellow. Thus, the delay influenced by traffic lights is relatively insignificant. As a result, combined with the characteristics of oversized trucks, the time to go straight at intersections is the shortest, which means that its cost is also the smallest as well. Although not as convenient as going straight, the cost of turning right at road junctions is still relatively small, based on regulations that vehicles on the road move uniformly on the right side in China. However, as the size of the angle increases, the time required significantly increases. For turning left at junctions, not only do the vehicles and vehicles turning left on the other side or vehicles going straight in the opposite direction conflict at junctions, the influence of the conflict point crossed is also much larger than that of confluence and diversion point upon the traffic safety at the road intersections [25]. Therefore, the cost will be relatively higher when trucks turn left.
As shown in Figure 6, the turn delay when making a left turn at road intersections by transportation trucks shows a linear relationship with the increasing steering angles. In terms of making a right turn, when the angle of the steering angle is small, the time to make a turn is relatively short, and the increments of the turn delay is also small. However, as the steering angle increases, particularly when the size of the corner reaches more than 80°–90°, the increments of the turn delay increased significantly, the overall trend shows a parabolic growth. As also shown in Figure 6, with the same size of the corner, the cost of turning left by oversized trucks is consistently higher than that of turning right. As the steering angle increases, the difference of time in steering delay becomes smaller, but the delayed time to turn left is still higher than that when turning right. Thus, the size of the turn angle has great significance for oversized trucks.
Using the experimental data and the fitted curve, this article proposes a steering-consumed model based on the turn angles at road intersections, as shown in Table 2, to fit and estimate the consumed time by oversized trucks when making turns at road intersections, participated in the analysis and calculation of routing selection. Thereby, it provides a reliable experimental basis for the route planning of oversized cargo transportation.
Table 2. Time-consuming model by steering based on the corners at road intersections.
Value of Turning Angle (°)[0,10)[10,20)[20,30)[30,40)[40,50)[50,60)[60,70)
Turn left (″)153046627894110
Turn right (″)15162229384758
Value of turning angle (°)[70,80)[80,90)[90,100)[100,120)[120,135)[135,150)[150,180)
Turn left (″)126142158190214238286
Turn right (″)708498131159189259

3. Examples and Verification of the Algorithm

Based on the aforementioned cost model, we design an algorithm to calculate the shortest path, which is shown in Figure 7.
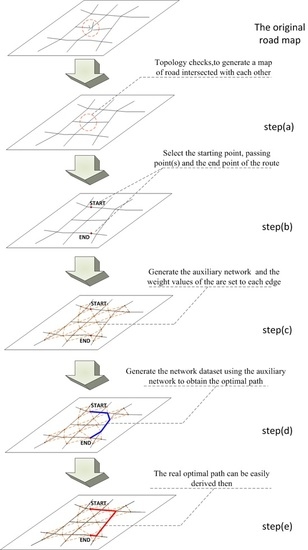
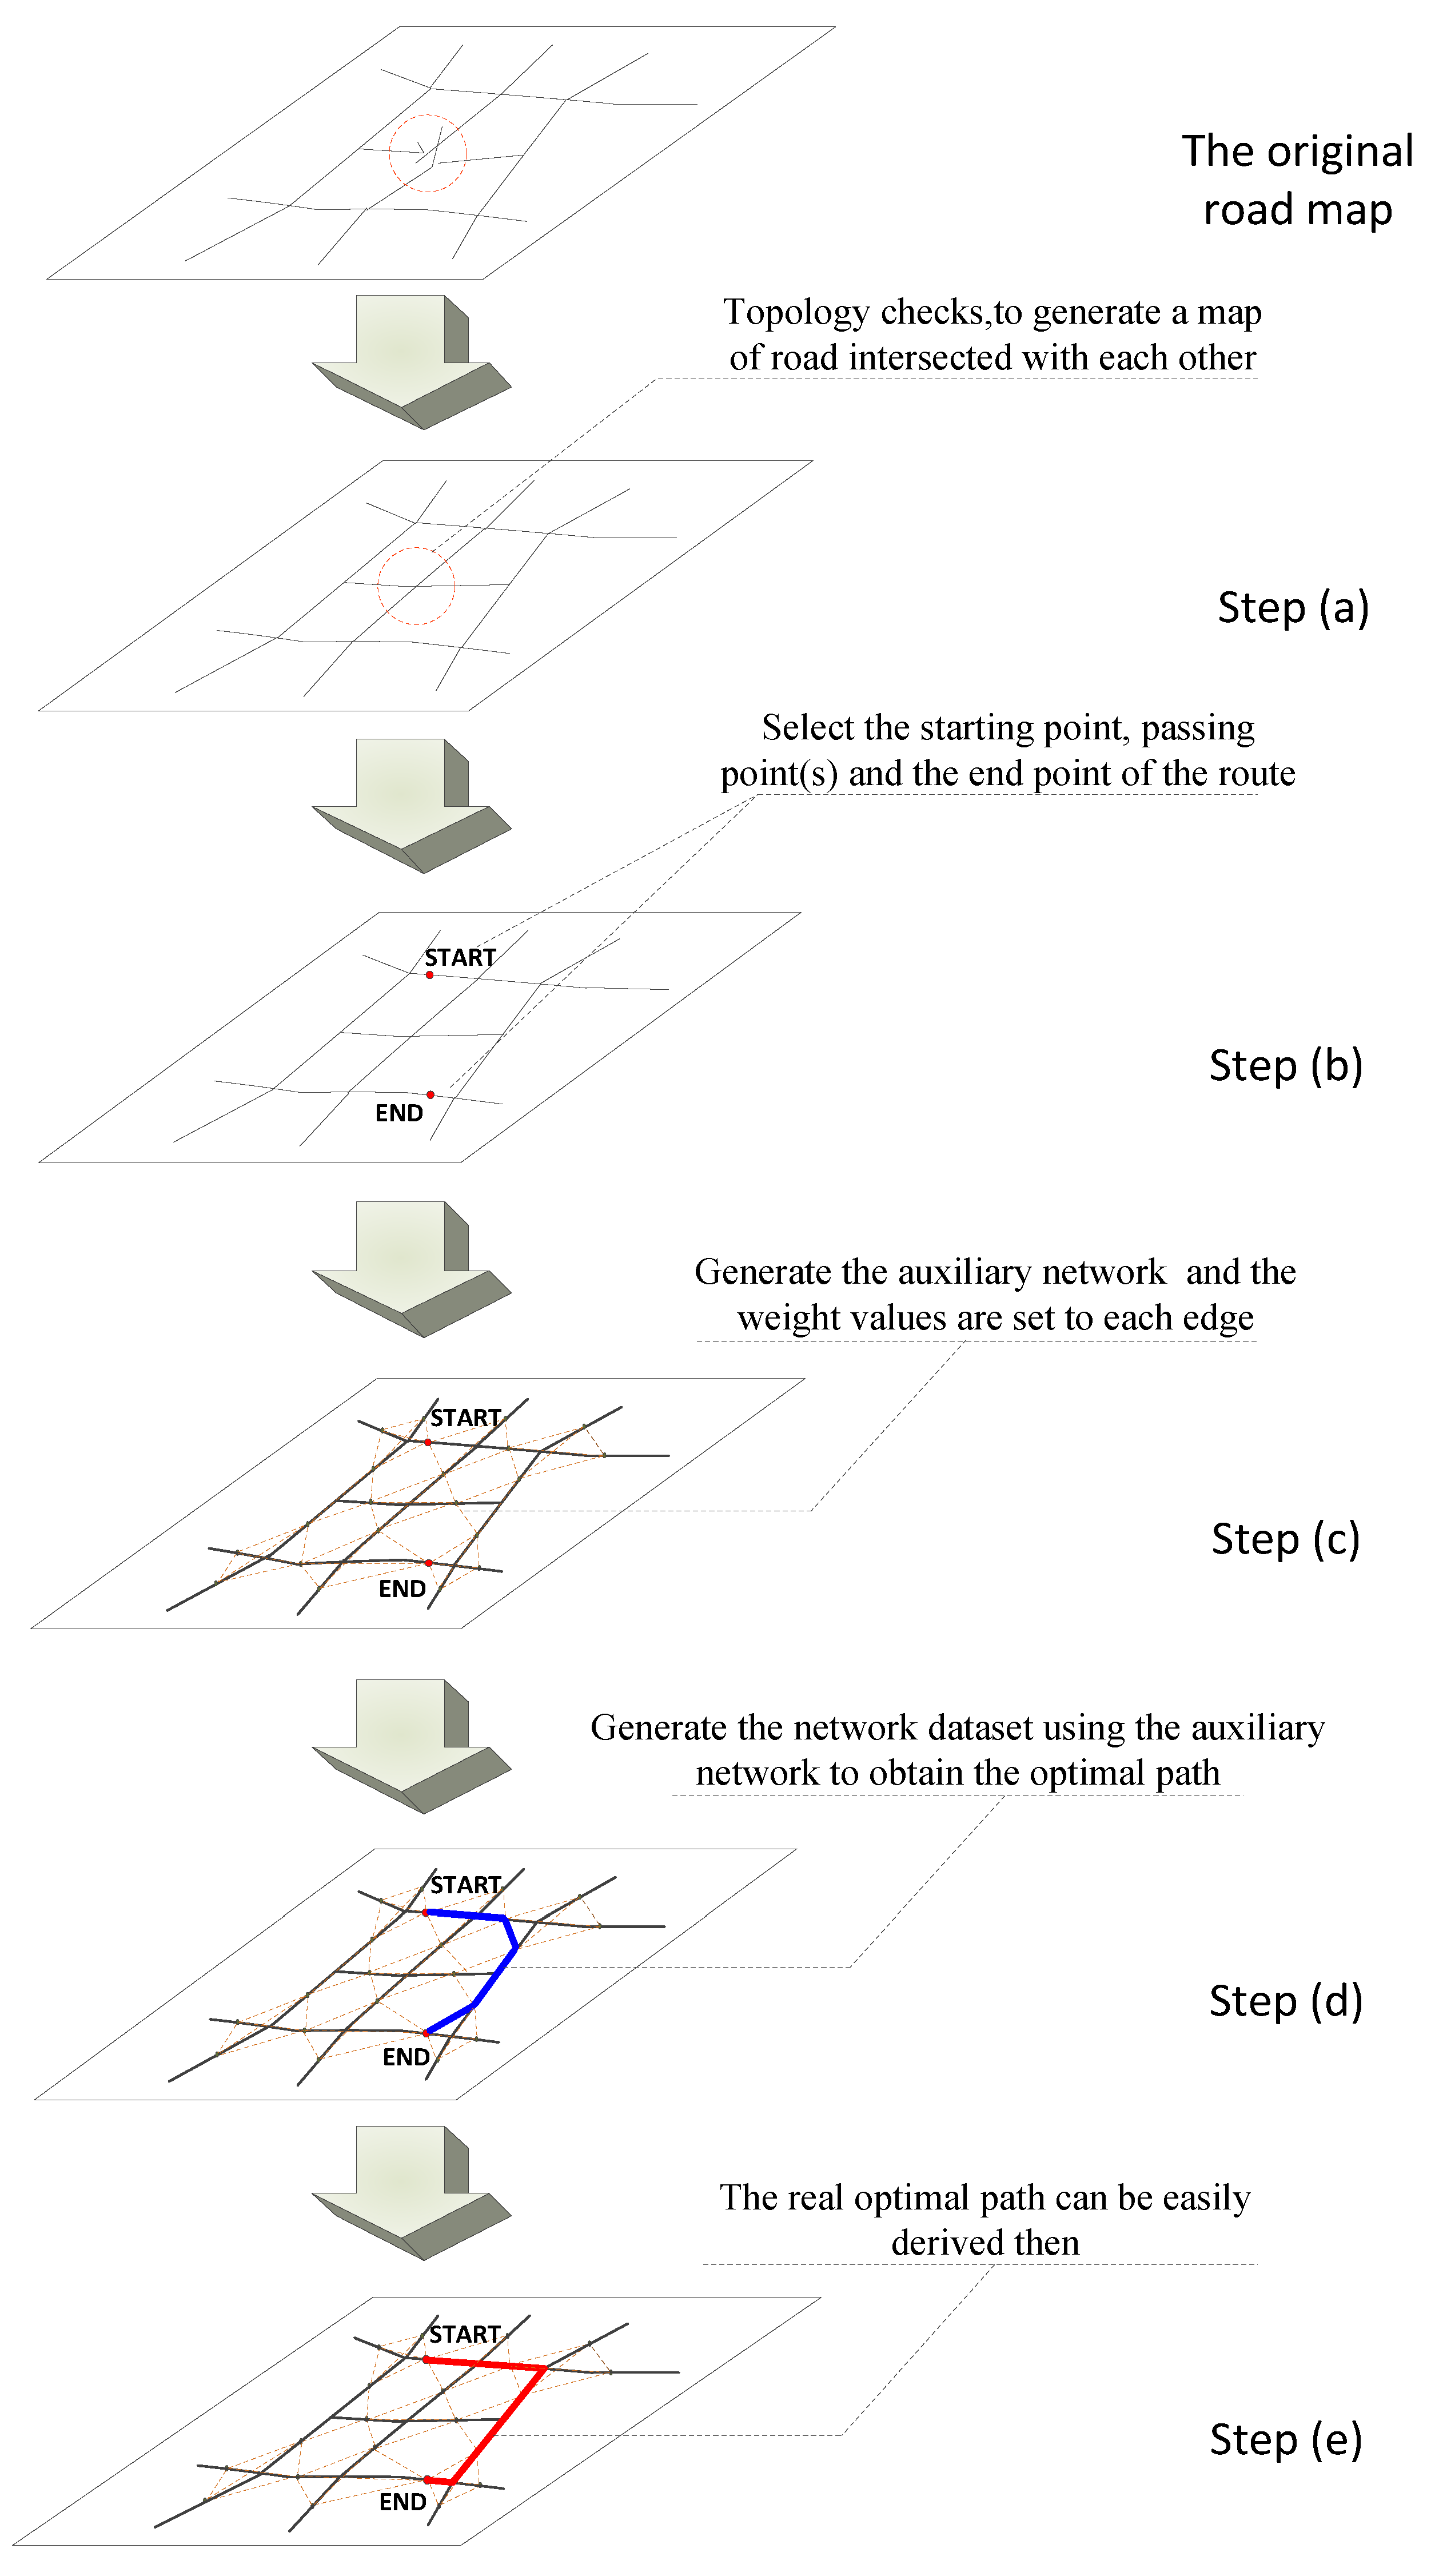
(a) For the existing layer data of urban roads, the process of editing is first conducted (preprocessing), making the road in the model consistent with the actual roads. Topology checks is necessary to generate a map of roads whose sections are intersected with each other [26]. The contents of preprocessing include checking the accuracy, completeness, and consistency of the roads. Accuracy checking mainly refers to the error message that exists at the endpoint of the road that should be deleted. Integrity checks include roads that should intersect at a road intersection do not intersect at one point, which should be intersected by manual handling. Consistency checks are for the presence of some multiple overlapping lines, in which case unwanted sections should be deleted. Finally, all roads have to be interrupted at road intersections to facilitate the construction of the model of road network, which is made up of connected sections, as shown in Figure 8a.
Figure 7. Basic flow of algorithm
Ijgi 04 02428 g007
(b) Via human interaction, the starting point, passing point(s), and the end point of the route are assigned in the road network.
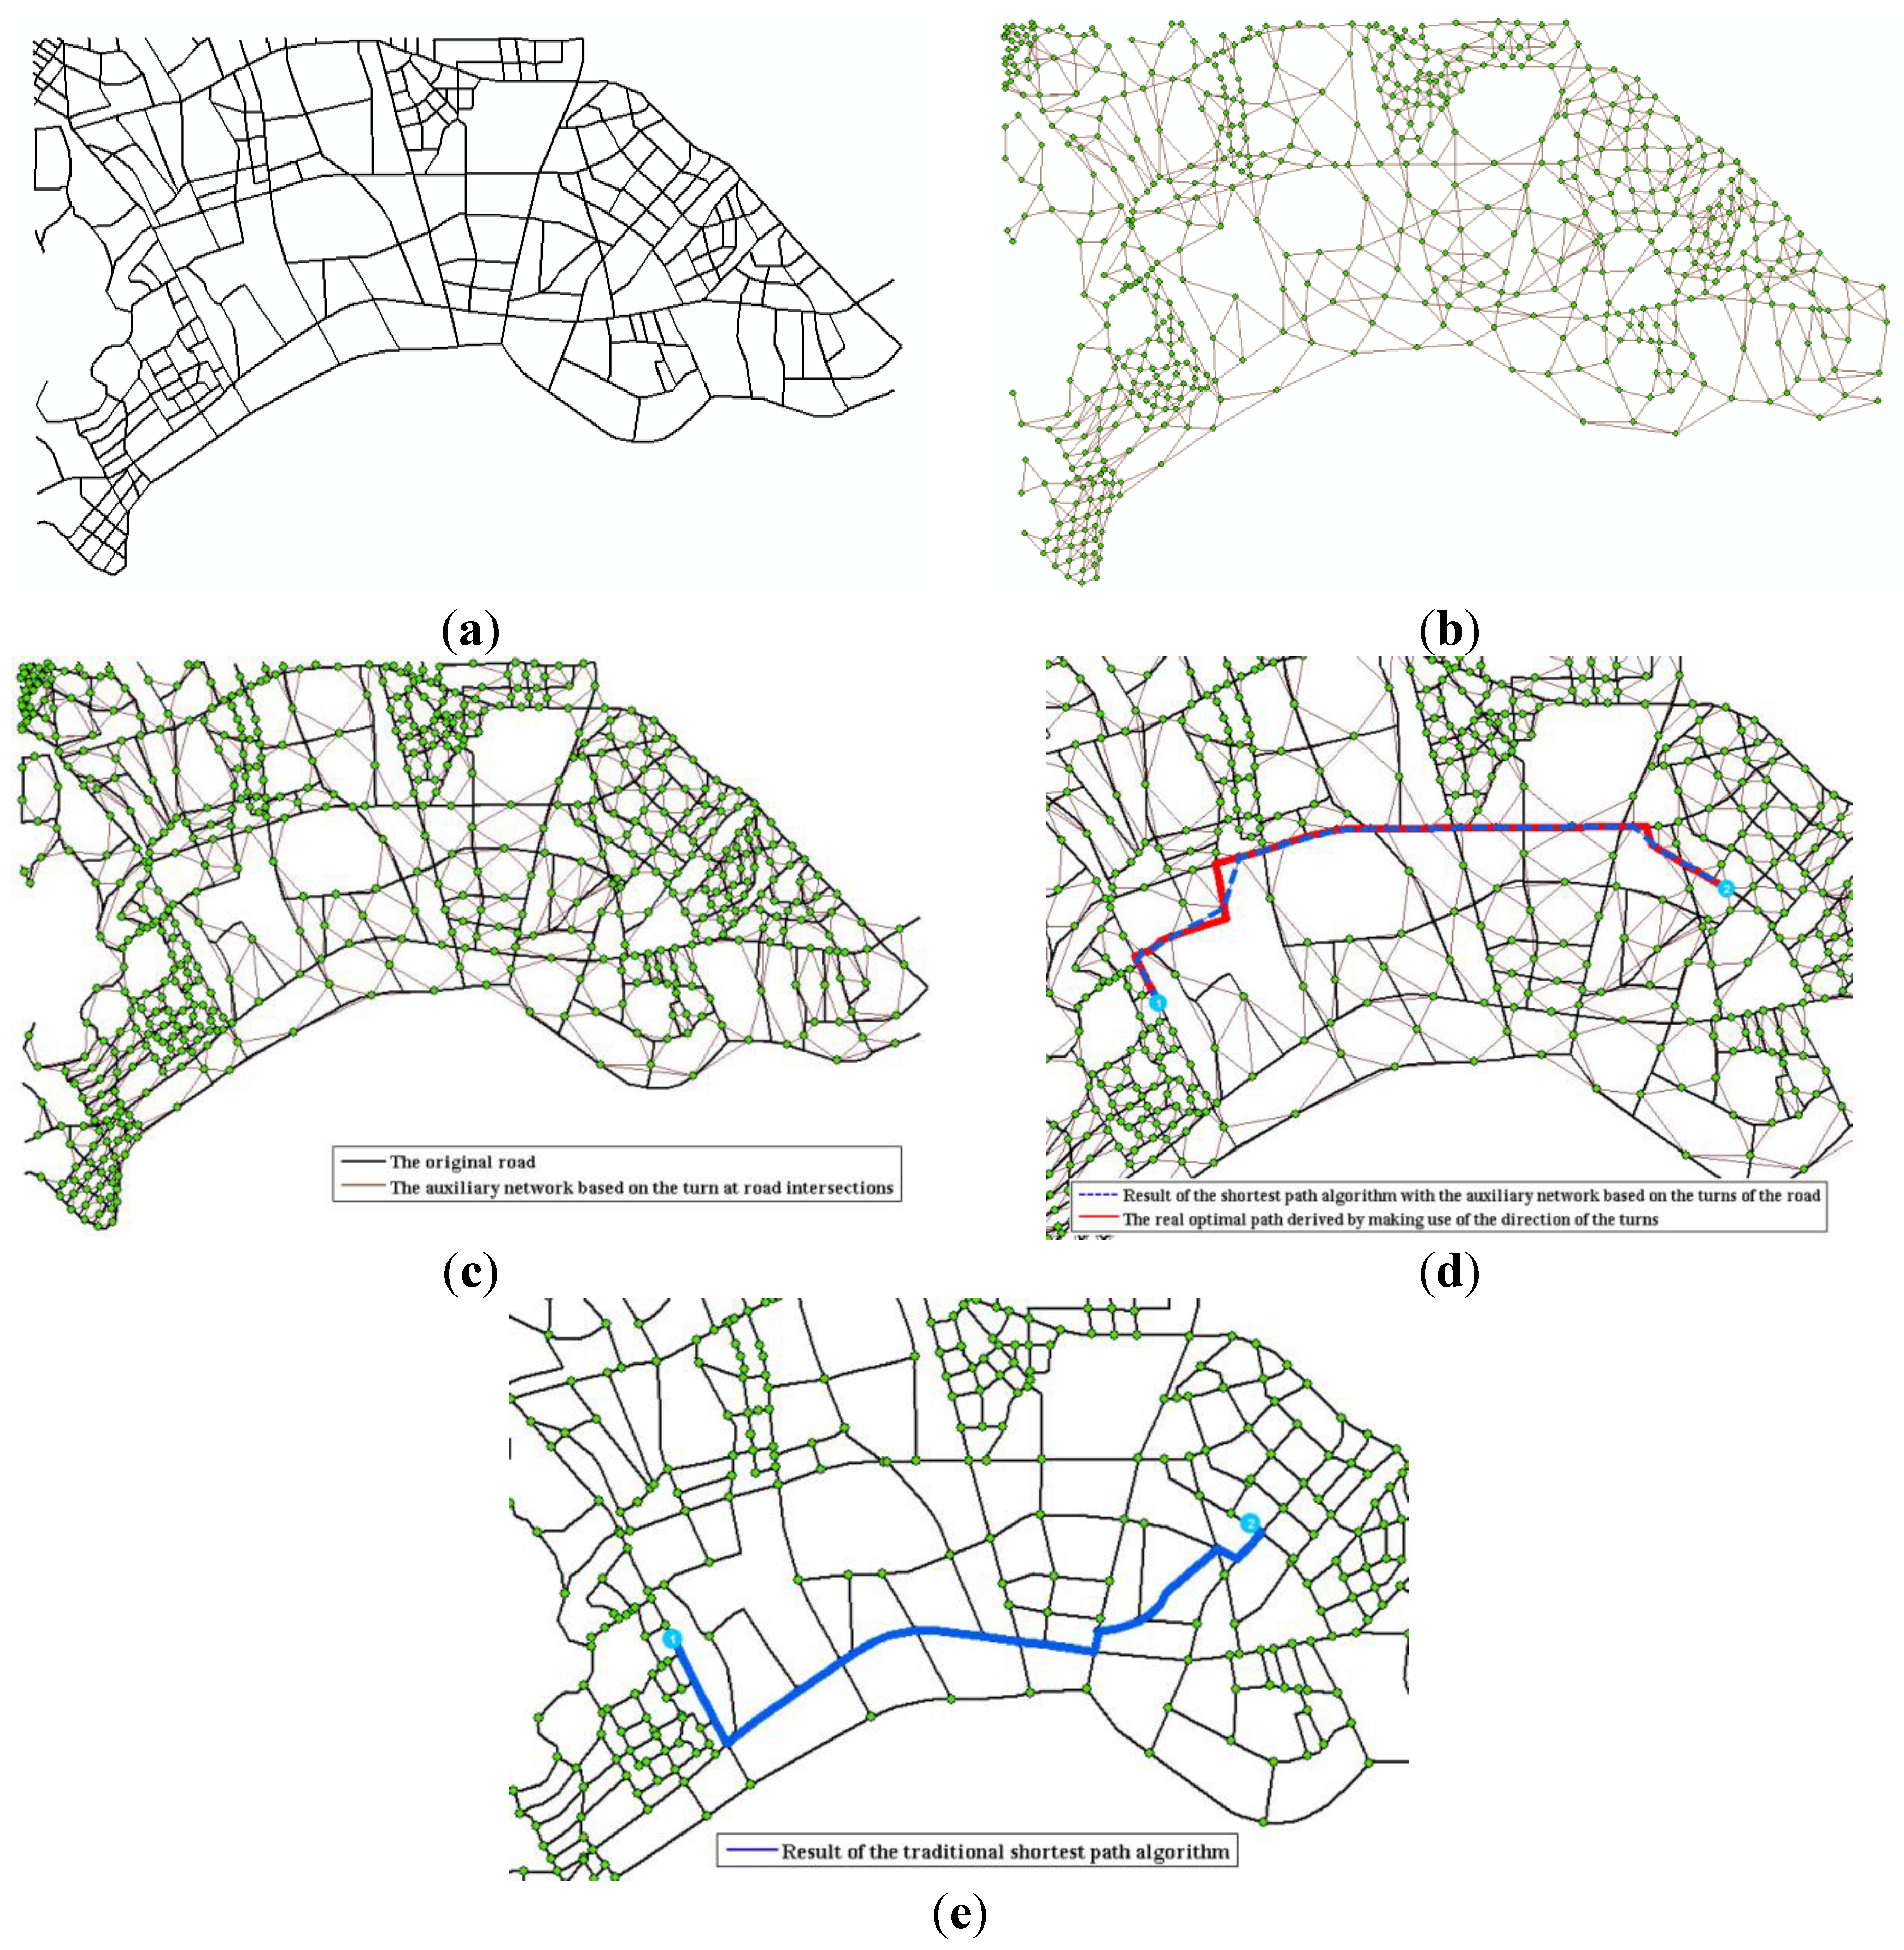
Figure 8. Comparison of the results of the traditional algorithm and the one based on the weighted model of corners: (a) road map of a city in Qingdao; (b) network based on the weight values of the corners at road intersections; (c) superimposed renderings; (d) result of the shortest path analysis with the weighted model of corners; and (e) result of the existing traditional algorithm.
Ijgi 04 02428 g008
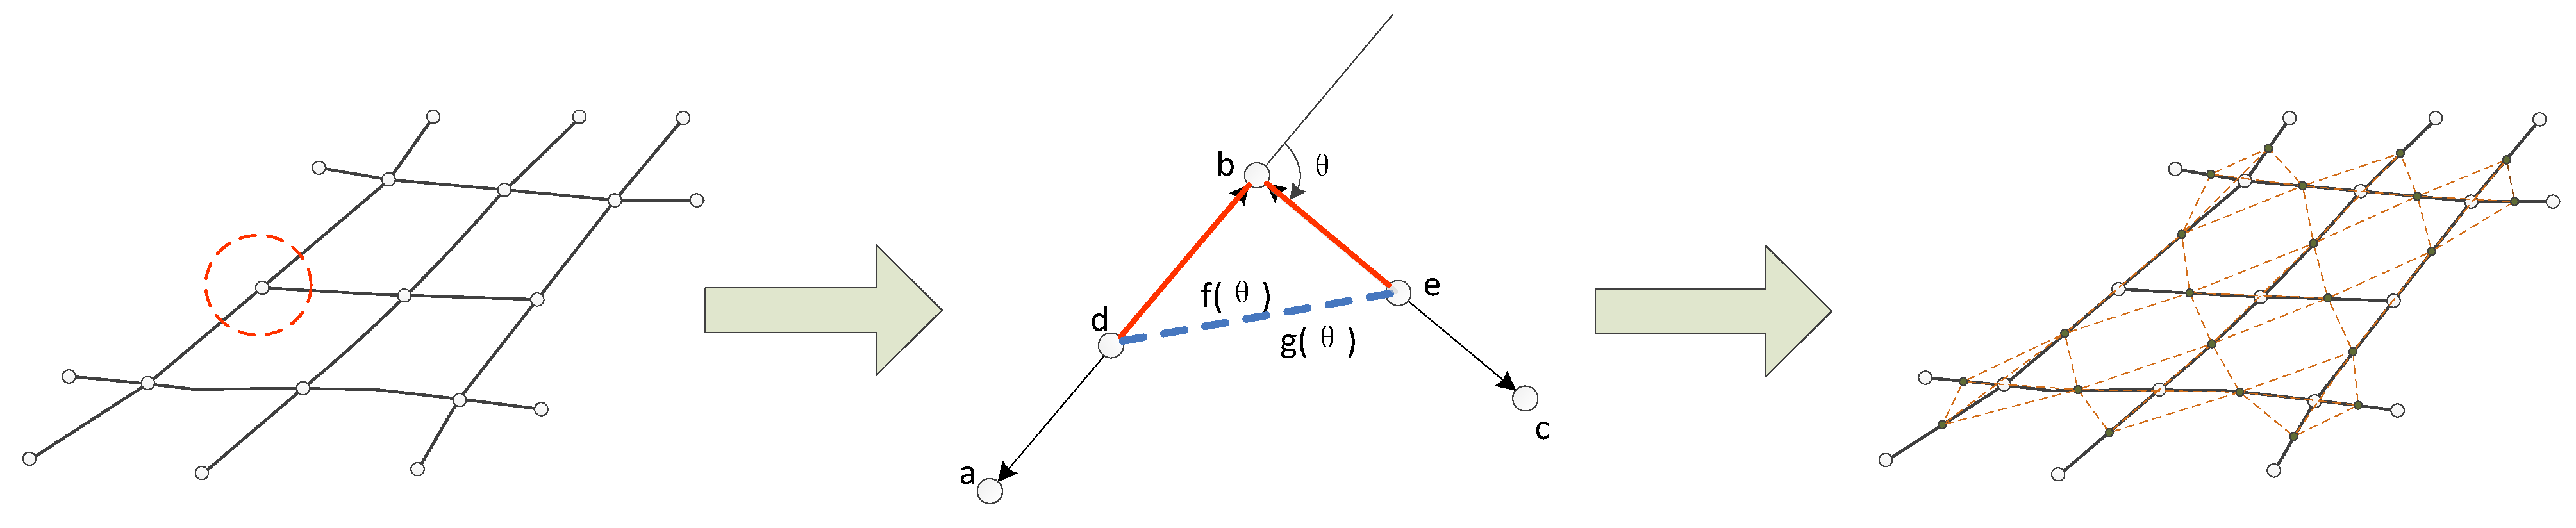
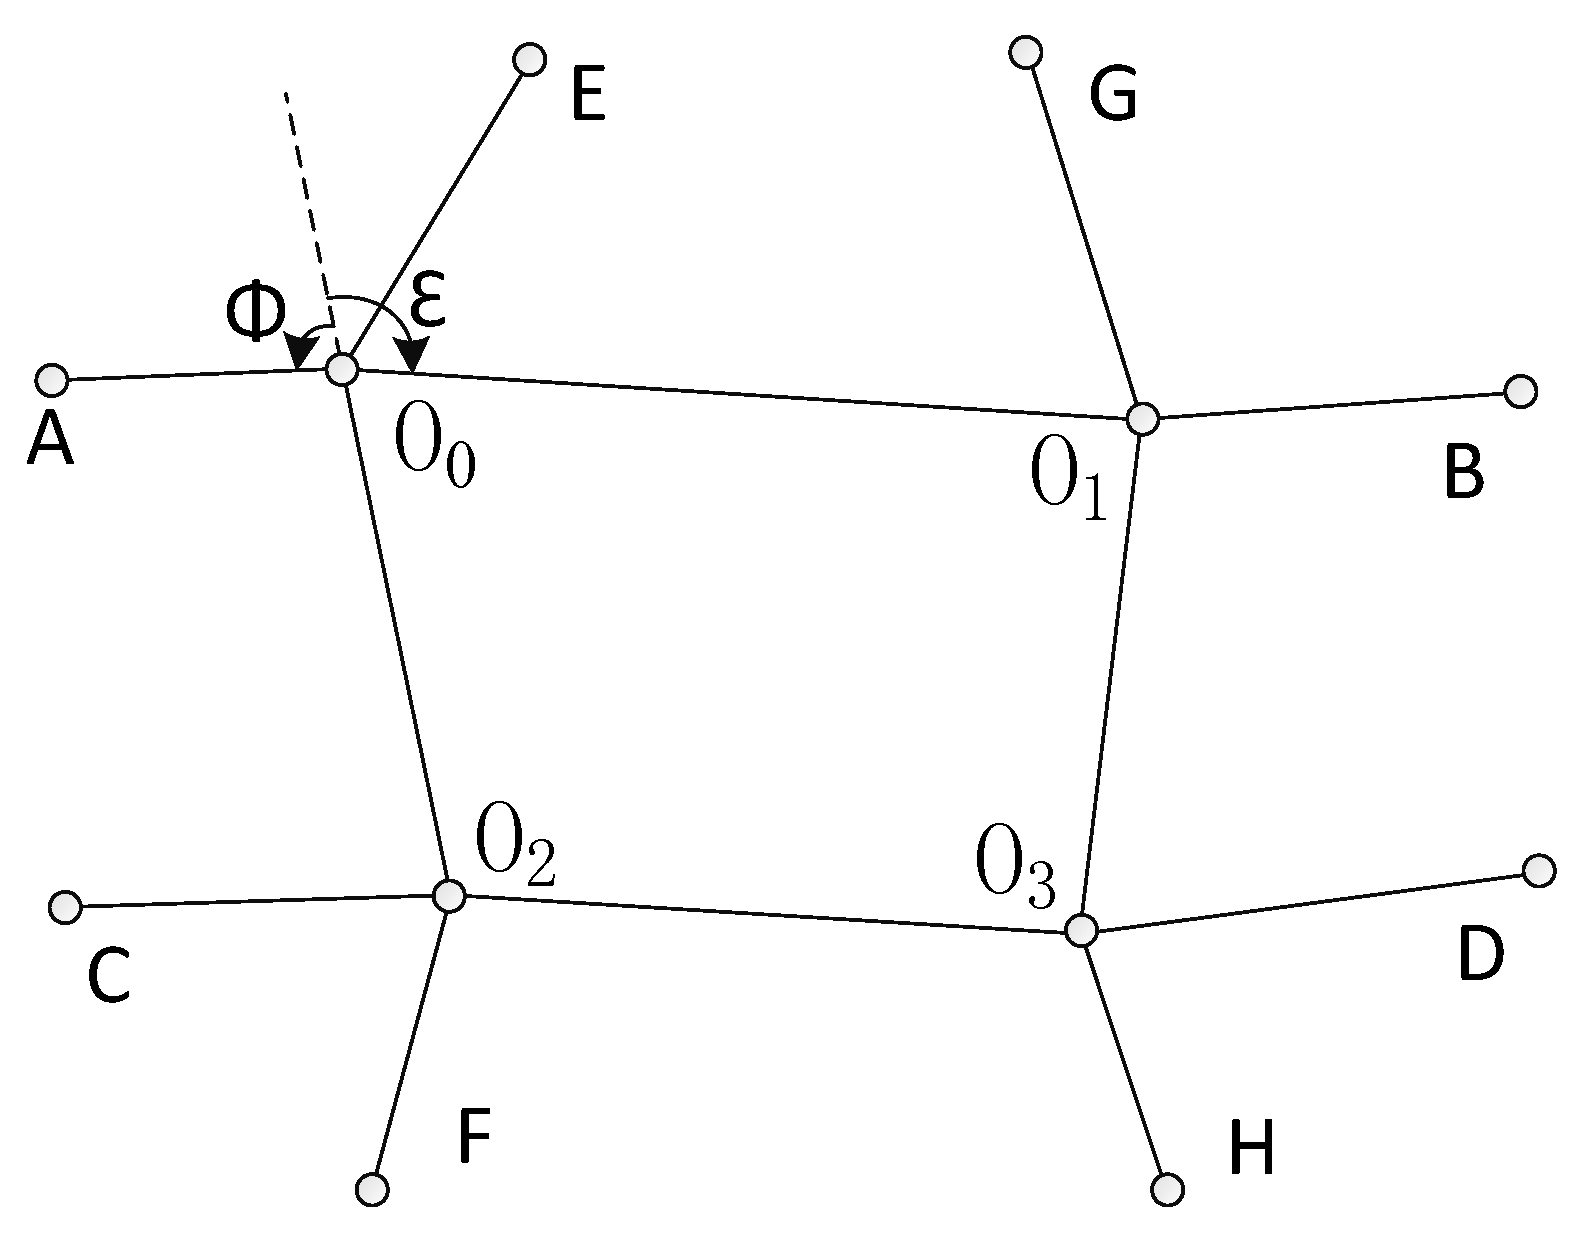
(c) The existing layer data of roads, the starting point, the end point, and the passing point(s) of the route to be selected were used to generate the auxiliary network based on corners and the weight values of the corners are set to each auxiliary edge of the network. For all roads, except the one where the starting point, end point, or the passing point(s) is located, the midpoint is taken as the secondary node in the auxiliary network of the road. For roads where the starting point, ending point, or passing point(s) is located, the assigned node, instead of the midpoint, is taken as the secondary node to facilitate the construction of the auxiliary network based on the weight values of the corner. Connecting the corresponding secondary nodes located on roads that are linked together in the actual road network will generate a new network, namely the auxiliary network based on the weight values of the corners, as shown in Figure 8b. Figure 8c shows the renderings of the stacking effect of the auxiliary network based on the weight values of the corner and the original road map.
(d) Finally, the network dataset is generated using the auxiliary network based on the weight values of the corner, and both the cost value of steering and the actual length of the road are set as passing costs. The shortest path analysis would be performed on the network dataset generated, and then, the optimal path will be obtained, as shown by the blue dotted routes in Figure 8d.
(e) Depending on the direction of the turn angle and the optimal path generated, the real optimal path can be easily derived from the real road network, as shown by the red solid route in Figure 8d. This result is compared with the one using the algorithm of the shortest path analysis based on the length of the road as its traveling cost, as shown by the blue route in Figure 8e.
As shown in Figure 8, the shortest path obtained by using the traditional shortest path algorithm may have the shortest length in geometry (4001.9 m). However, multiple situations occurred where trucks turn left or turn right, which increases the total time spent by oversized trucks on the road. Using the algorithm proposed in this article, although a longer geometric distance is covered (4009 m), more instances of going straight or turning right at the road intersections were recorded. Even though cases of left turns exist, the steering angle is relatively small. Thus, transportation trucks can effectively save time that spent on the road.

4. Comparative Experiments and Analysis

To verify the effectiveness and superiority of the algorithm of the shortest path analysis based on the network with weight values of road corner in the route selection of oversized cargo transportation scheme, this paper randomly selected another 10 blocks of areas of roads as the experimental samples, where the traditional algorithm and improved algorithms were compared from the derived shortest path. Table 3 shows the results from our experiment.
Compared with the traditional algorithm, the improved algorithm offers obvious advantages for oversized trucks when making turns, even though it does not provide the shortest geometric distance. As shown in the table, when the network of roads has a regular grid distribution, the path computed by the optimal path algorithm proposed in this article is basically consistent with the one made by the traditional algorithm. However, when the roads are in the form of an irregular grid, the optimal path algorithm effectively reduces the number of left turns made by oversized trucks in the process of running, under the premise of not significantly increasing the total length of the route, and the number of straight-going has also been improved to some extent. Considering all factors, the optimal path algorithm proposed in this article has better adaptability.
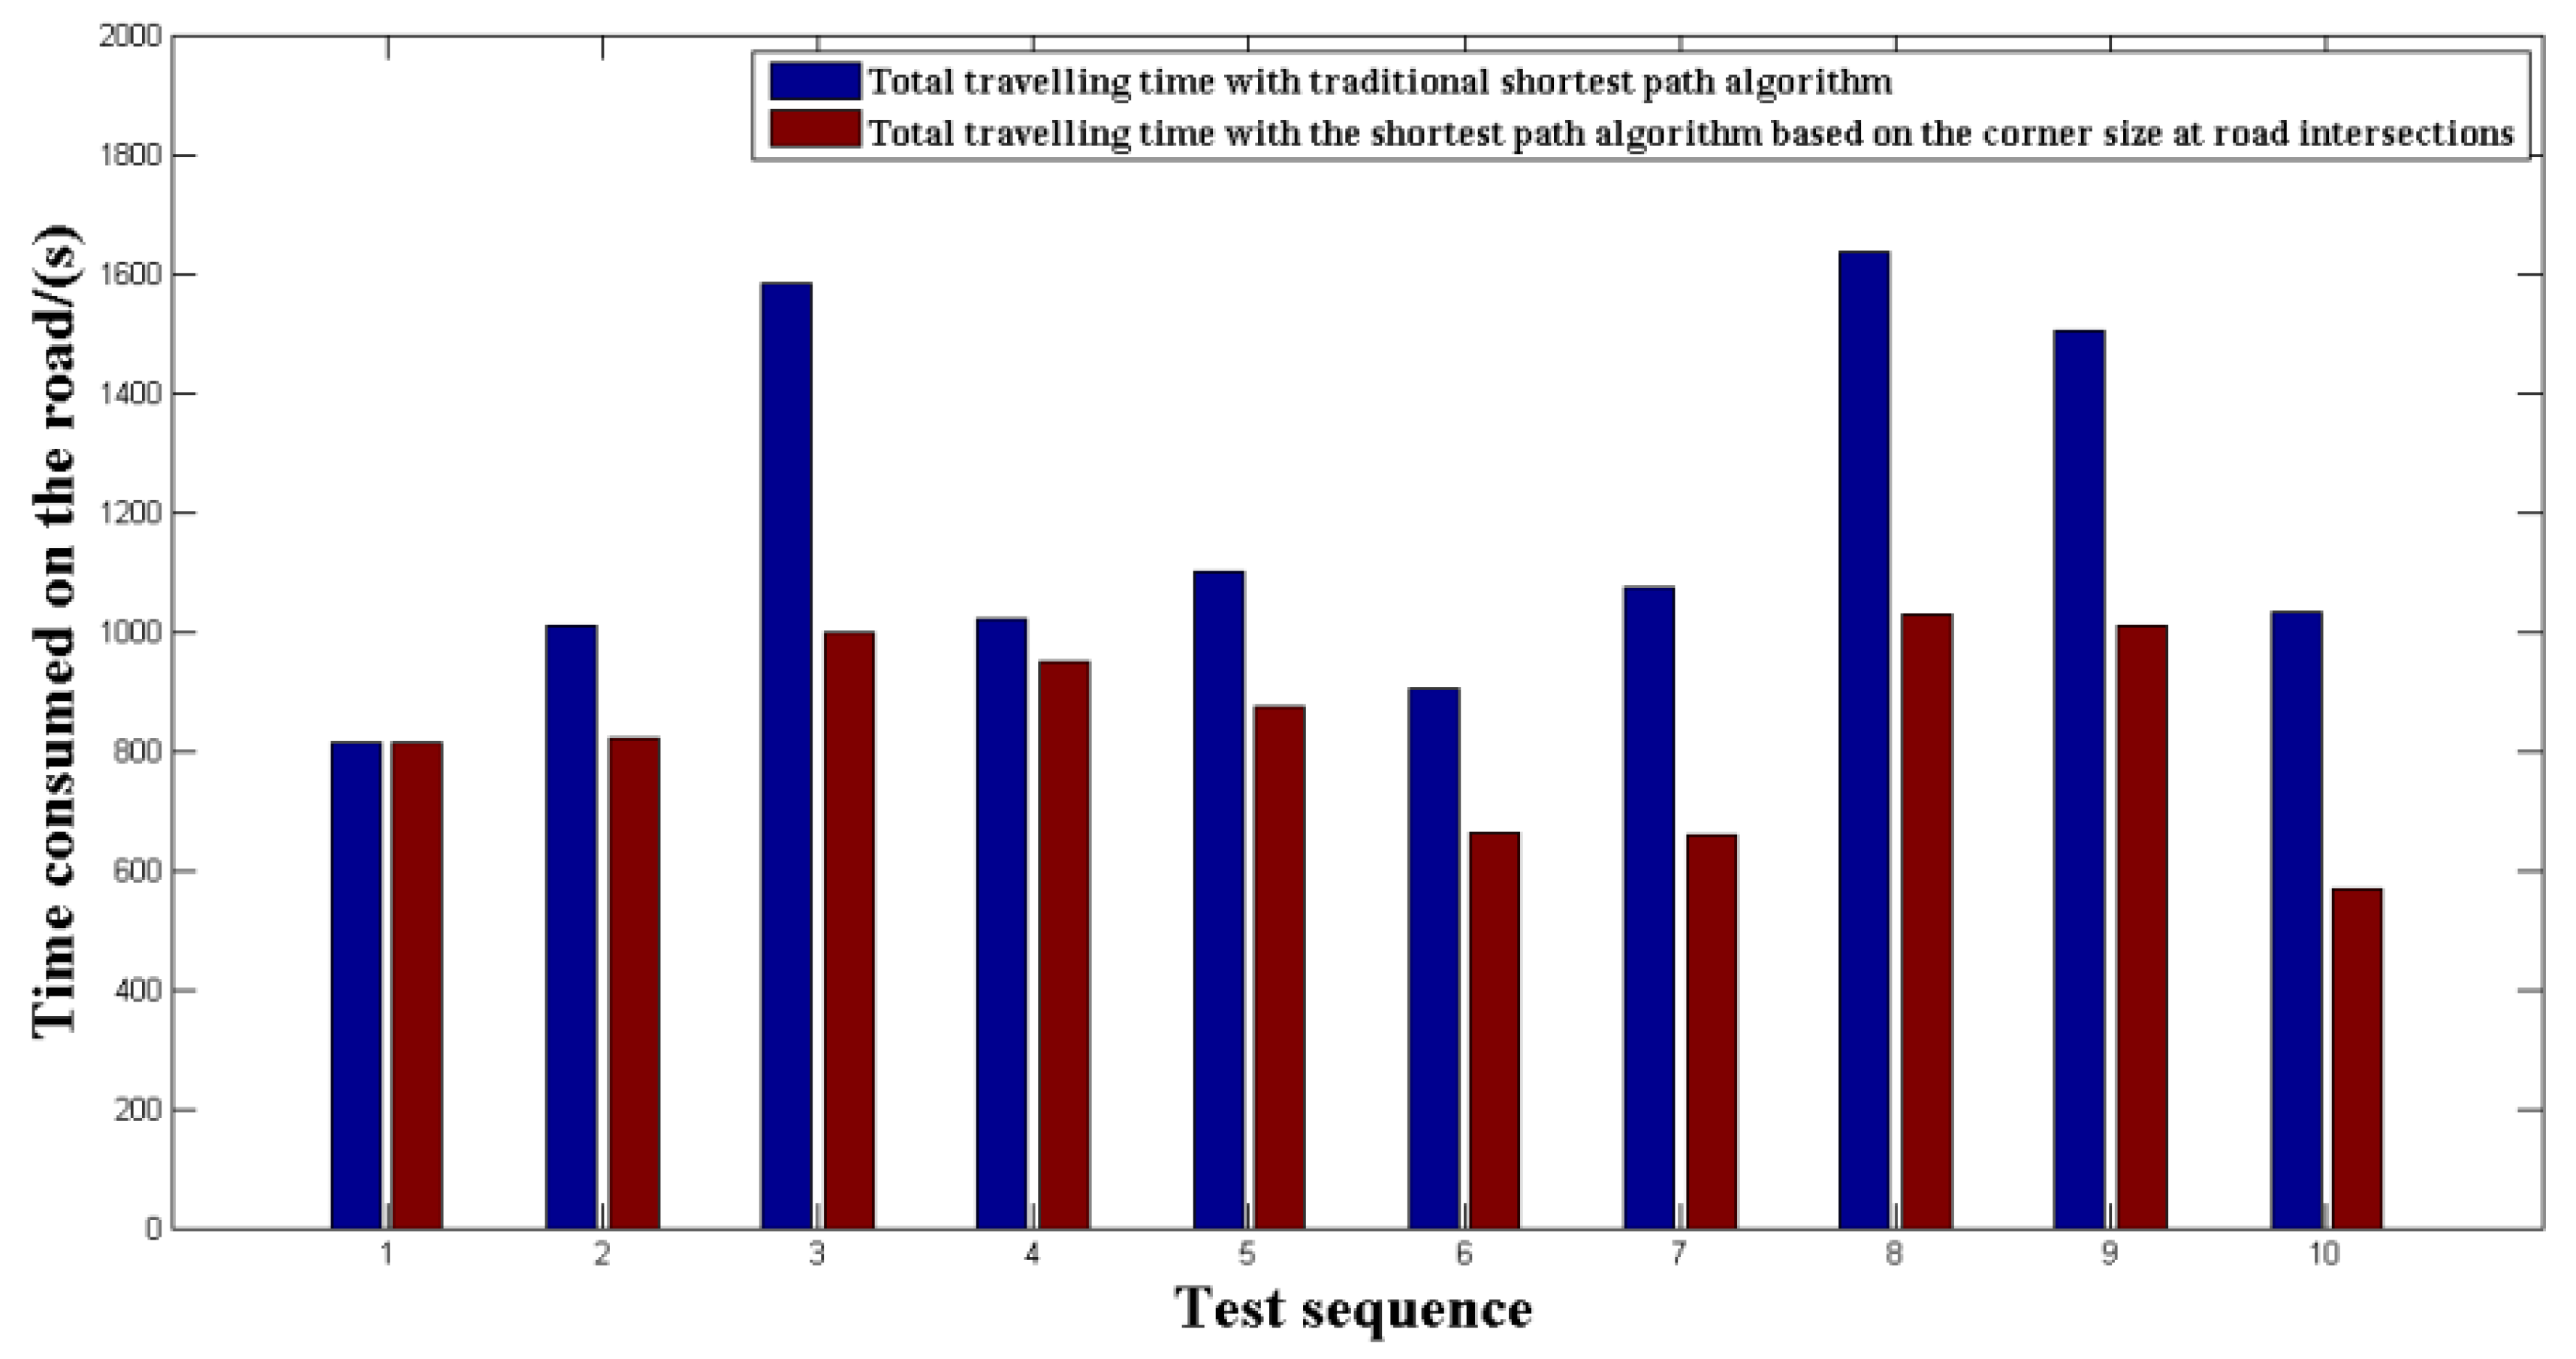
The comparison of the time consumed to pass through all routes in the experiments mentioned above is shown in Figure 9, with the traditional algorithm and the steering-consumed model based on the corners at road intersections proposed in this paper (assuming that the oversized trucks will travel at an average speed of 15 km/h).
As shown in Figure 9, the total time spent to pass through the route using the shortest path algorithm based on the size of the corner is less than that with the traditional shortest path algorithm. The advantage of using the algorithm is also quite obvious then.
Table 3. Statistics results of the analysis of test areas that were randomly sampled.
SequenceDistance (m)Number of Turning LeftNumber of Turning RightNumber of Going StraightTotal Time Spent (s)Screenshot of the Route
Line 1Traditional algorithm806.6233811.6 Ijgi 04 02428 i001
Improved algorithm806.6233811.6
Line 2Traditional algorithm1582.93161010.9 Ijgi 04 02428 i002
Improved algorithm1591.2127818.9
Line 3Traditional algorithm2078.55341581.8 Ijgi 04 02428 i003
Improved algorithm2087.6135999.0
Line 4Traditional algorithm2253.72161021.9 Ijgi 04 02428 i004
Improved algorithm2254125948.0
Line 5Traditional algorithm1883.23211099.0 Ijgi 04 02428 i005
Improved algorithm1888126875.1
Line 6Traditional algorithm1379.6226903.1 Ijgi 04 02428 i006
Improved algorithm1382116662.7
Line 7Traditional algorithms15892421075.4 Ijgi 04 02428 i007
Improved algorithm1615.9026659.8
Line 8Traditional algorithm2235.35351643.5 Ijgi 04 02428 i008
Improved algorithm2276.512101028.4
Line 9Traditional algorithm2195.44371504.9 Ijgi 04 02428 i009
Improved algorithm2207.52161010.8
Line 10Traditional algorithm1222.63271030.4 Ijgi 04 02428 i010
Improved algorithm1228026566.7
Figure 9. Total time spent by oversized trucks to pass through different routes with the traditional shortest path algorithm and the one based on the size of the corners.
Ijgi 04 02428 g009
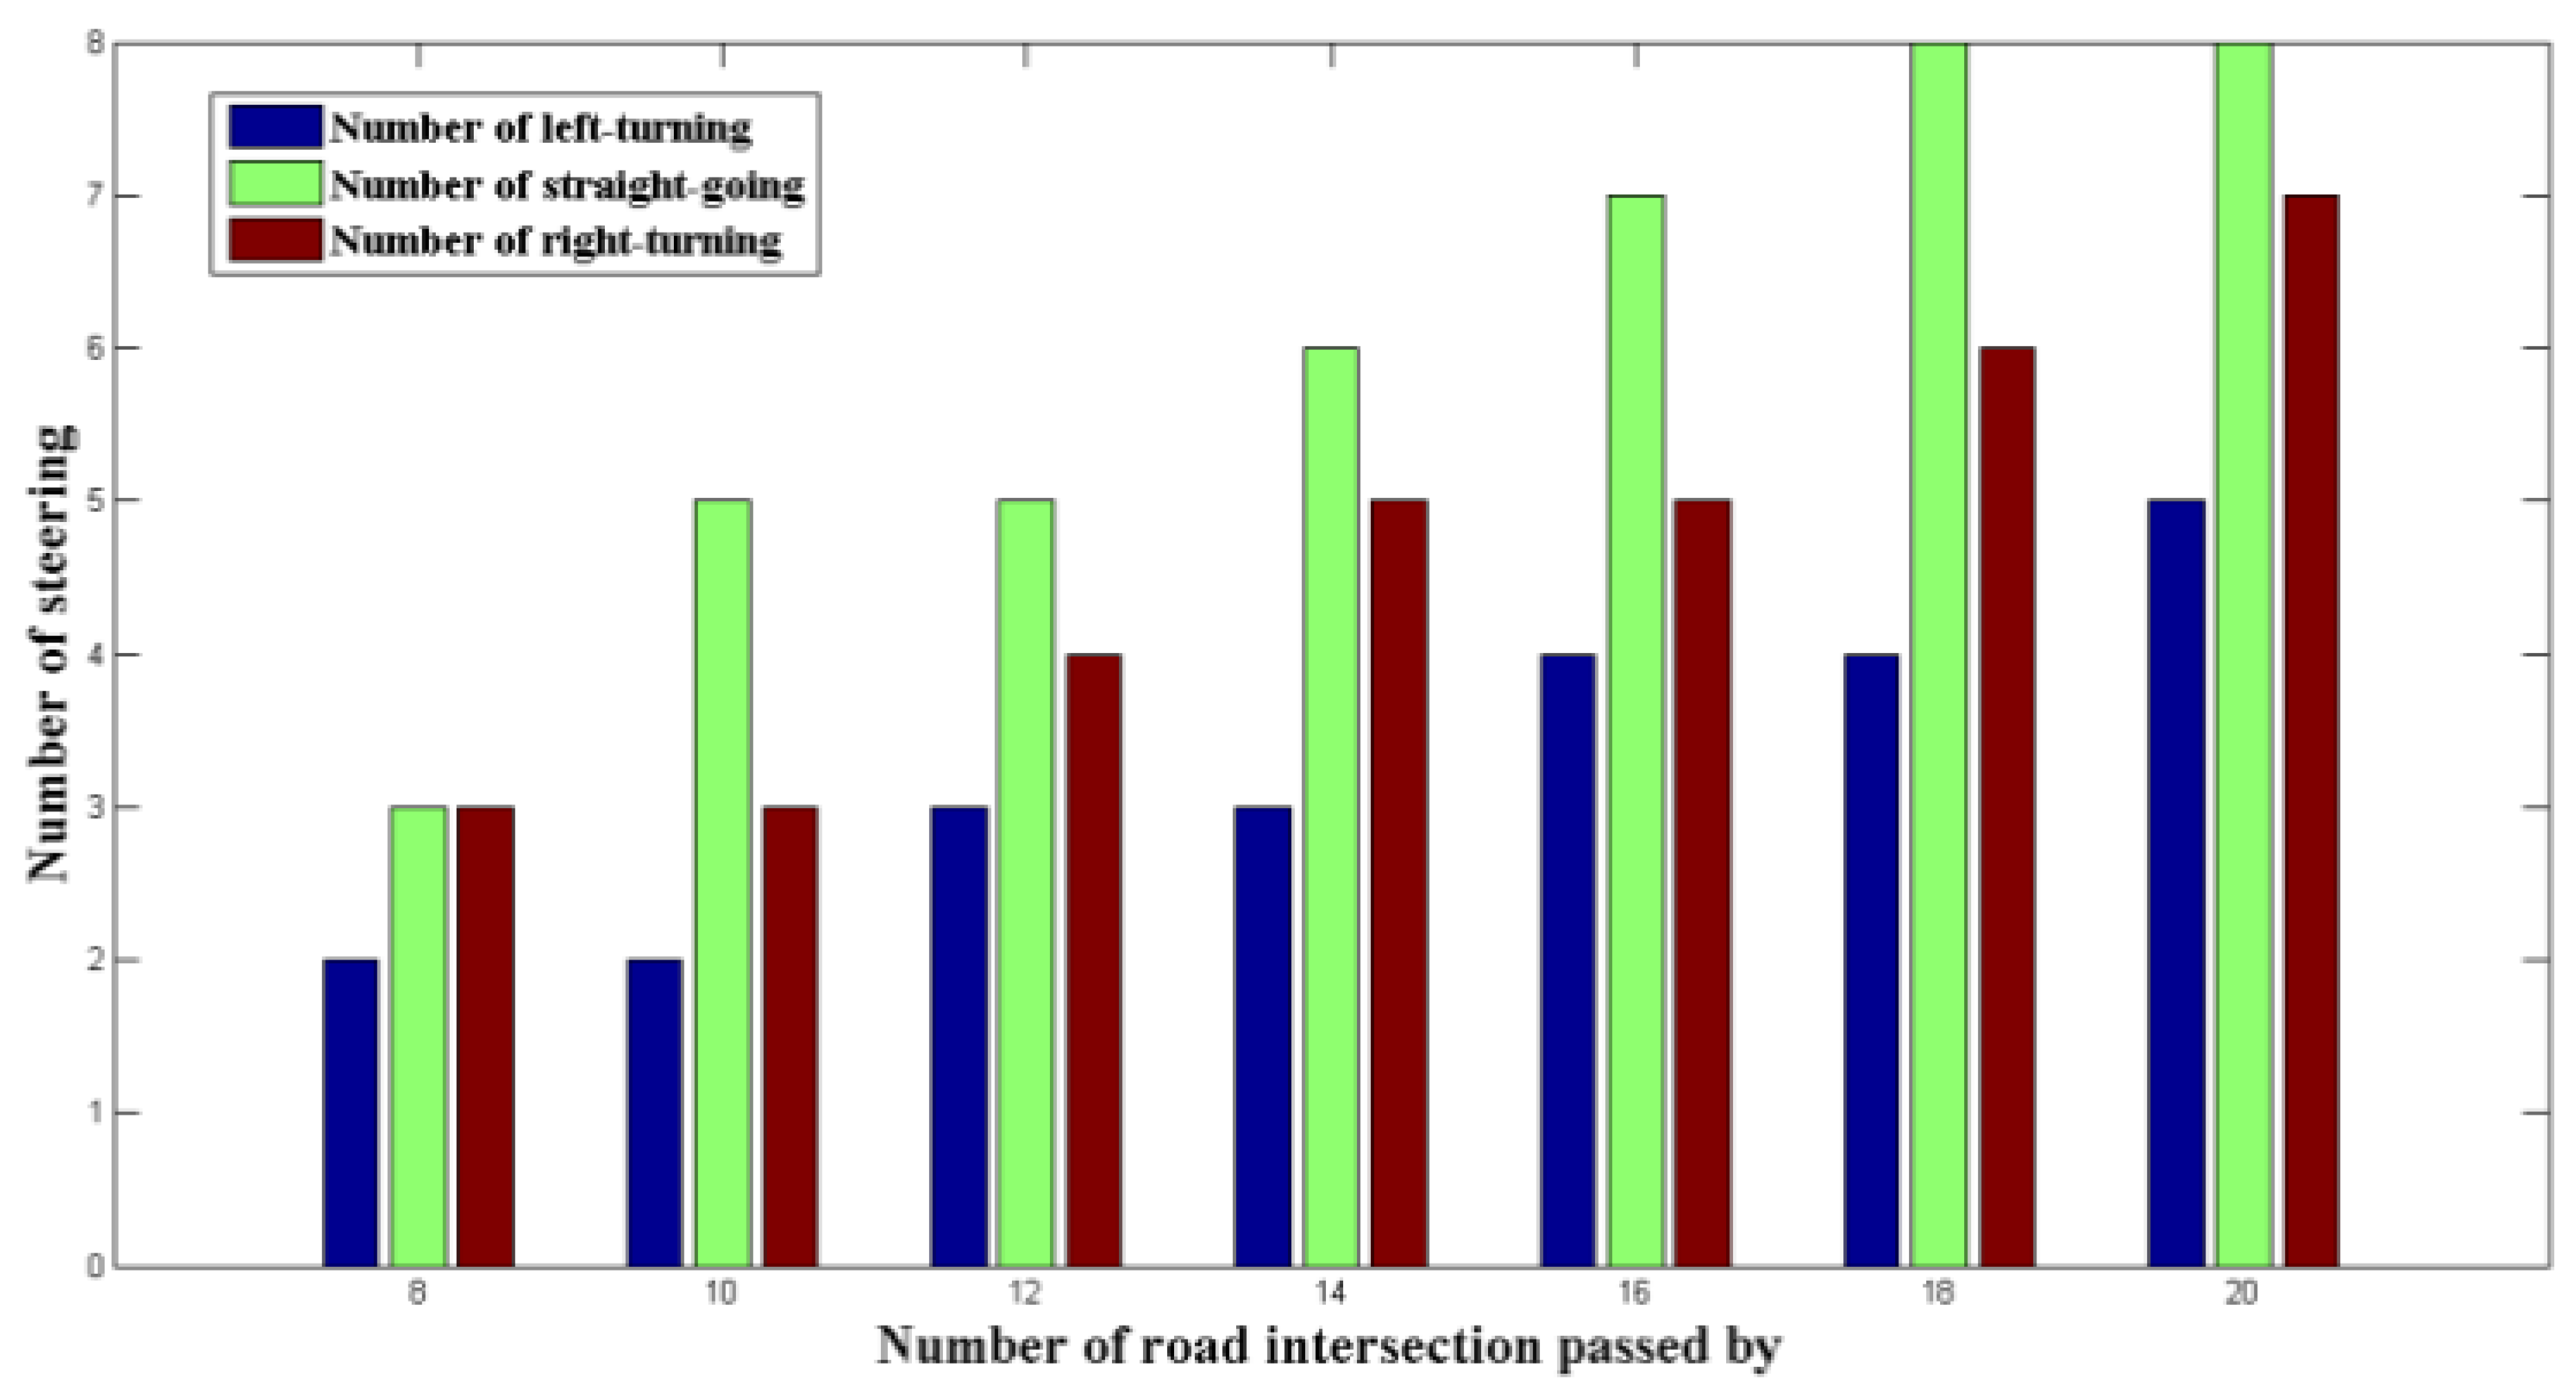
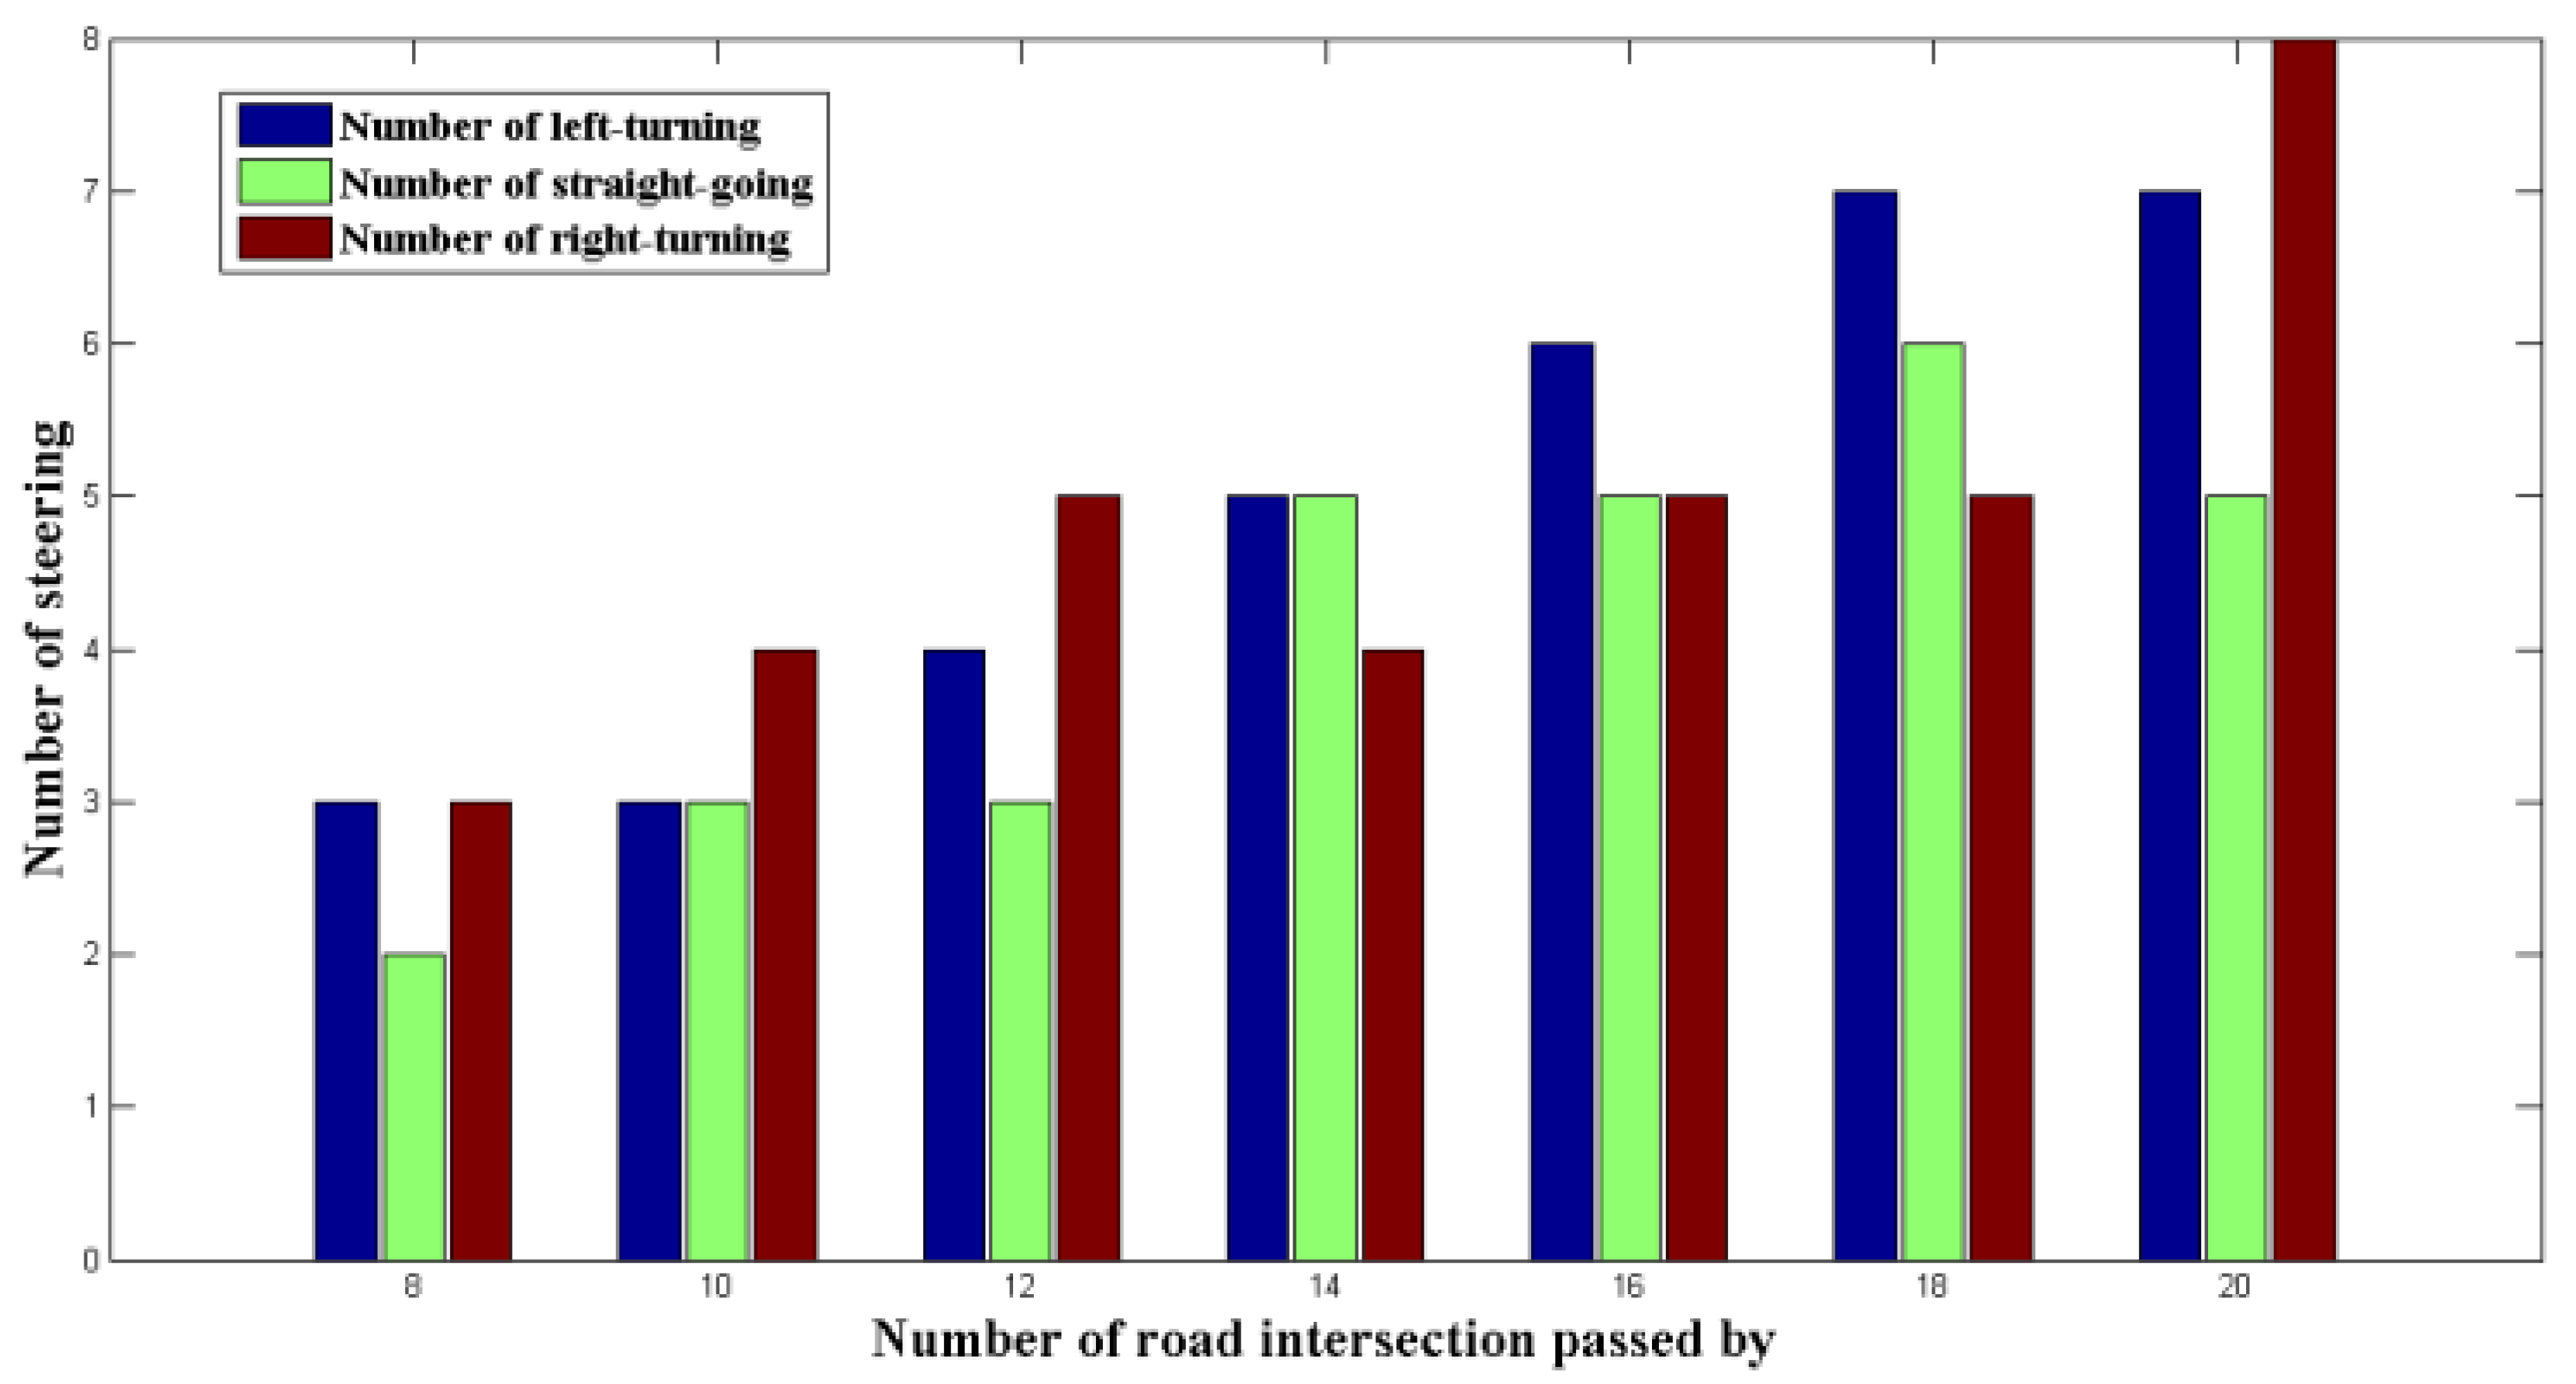
To further verify that the shortest path algorithm based on the corners has better characteristics for oversized trucks to pass through road intersections than that of the traditional shortest path analysis, statistical analysis was performed. A comparison of the possibility of turning left, going straight, and turning right is also shown in the result of the routes selected based on both the algorithms mentioned above, considering a condition with the same number of intersections passed through by the oversized trucks (Figure 10 and Figure 11).
Figure 10. Statistics of the number of turns made at road intersections using the shortest path algorithm based on the size of the corner.
Ijgi 04 02428 g010
Figure 11. Statistics of the number of turns made at road intersections based on the traditional shortest path algorithm.
Ijgi 04 02428 g011
As shown in Figure 10 and Figure 11, for the route obtained by the shortest path algorithm based on the size of the corners on the road, the likelihood of going straight is greatly improved, and the number of left turns has been effectively reduced compared with the traditional shortest path algorithm, which can significantly shorten the time spent by transportation trucks to make turns at road intersections. The more intersections passed through by trucks, the more obvious this characteristic becomes.
In summary, the shortest path algorithm based on the weight values of corners at road intersections proposed in this article can calculate an optimal path that offers the shortest time for transportation trucks to make turns, according to the corner size at road intersections along the path. It not only effectively reduces the traffic pressure of transportation trucks at road intersections, which shortens the total running time spent by transportation trucks on the road, but also meets the need of complex peculiarities within the road network and assists in solving the problems related to route selection with the industry of oversized cargo transportation in China.

5. Conclusions

By processing and modeling the data of urban road network, this research, combined with the operational need of oversized cargo transportation system, has designed a weighted model that is based on the size of the corner at road intersections. Through the analysis of the traditional shortest path algorithm, the model is introduced to the classical Dijkstra algorithm, and an algorithm of the optimal path analysis is presented with detailed discussion on the theory and the realization. The model abandons the drawbacks of the traditional algorithm that only considers the length or the width of the road. Experimental results have shown that the algorithm can reduce the time for trucks to make turns at road intersections in complex transportation networks, which is feasible in the actual planning of driving routes for oversized trucks.
The operational route for transportation trucks computed by the optimal path algorithm proposed in this article can not only serve as a new strategy to ease congestion, but can also improve the dysfunctional transportation systems in urban areas today and guide in route planning in cities. Traffic flows concentrated in a few roads will also increase the pressure on road traffic. Accordingly, using the optimal path algorithm presented in this paper to develop running route for vehicles could reform the urban transportation system, which will play a role in traffic diversion in certain ways. The shortest path algorithm based on the size of the corner at road intersections proposed in this article achieves good results in practice and represents potential applications.

Acknowledgments

We would like to thank the constructive comments from the anonymous referees, whose efforts greatly improved the quality of this paper. We appreciate the financial supports from National Natural Science Foundation of China (No. 41201406; No. 61172175) and National Science and technology support program (No.2012BAJ15B04).

Author Contributions

Lingkui Meng, Zhenghua Hu and Changqing Huang designed the study. Zhenghua Hu performed the experiments. Zhenghua Hu and Changqing Huang wrote the paper. Wen Zhang and Tao Jia reviewed and edited the manuscript. All authors read and approved the manuscript. Lingkui Meng, Zhenghua Hu and Tao Jia were in charge of revising the manuscript.

Conflicts of Interest

The authors declare no conflict of interest.

References

  1. Rong, X.F. The Desigh of Out-size Cargo Transportation Path Selection Support System about J Company. Master’s Thesis, Chang’an University, Xi’an, China, 2013. [Google Scholar]
  2. Zhang, Y.K. A Research on Optimization of Large-Cargo Transportation Programs Based on the Cross-Entropy. Master’s Thesis, Chang’an University, Xi’an, China, 2013. [Google Scholar]
  3. Li, H. Study on Selection and Optimization of Bulky Cargo Logistics Based on Genetic Algorithms. Master’s Thesis, Ocean University of China, Qingdao, China, 2011. [Google Scholar]
  4. Yang, P. Study On Large-scale Equipments Transportation Route Selection of Highway. Master’s Thesis, Xihua University, Chengdu, China, 2013. [Google Scholar]
  5. Geisberger, R.; Vetter, C. Efficient routing in road networks with turn costs. In Proceedings of the 10th International Symposium of Experimental Algorithms, Crete, Greece, 5–7 May 2011.
  6. Xiao, H.P.; Chen, L.L.; Peng, T. On analysis method for the shortest path of urban roads based on ArcGIS engine. Metal Mine 2008, 12, 98–100. [Google Scholar]
  7. Shi, Y. Optimization Research on Transport Solutions of Project Logistics. Master’s Thesis, Dalian Maritime University, Dalian, China, 2013. [Google Scholar]
  8. Caldwell, T. On finding minimum routes in a network with turn penalties. Commun. ACM 1961, 4, 107–108. [Google Scholar] [CrossRef]
  9. Nielsen, O.A.; Frederiksen, R.D.; Simonsen, N. Using expert system rules to establish data for intersections and turns in road networks. Int. Trans. Oper. Res. 1998, 5, 569–581. [Google Scholar] [CrossRef]
  10. Gutiérrez, E.; Medaglia, A.L. Labeling algorithm for the shortest path problem with turn prohibitions with application to large-scale road networks. Ann. Oper. Res. 2008, 157, 169–182. [Google Scholar] [CrossRef]
  11. Feng, J.; Mukai, N.; Watanabe, T. Representation of transportation network and continuous nearest neighbor search. DBSJ Lett. 2003, 2, 1–4. [Google Scholar]
  12. Anez, J.; de La Barra, T.; Perez, B. Dual graph representation of transport networks. Transp. Res. Part B 1996, 30, 209–216. [Google Scholar] [CrossRef]
  13. Gang, H.; Jiang, J.; Chen, J.; Cao, Y. An arc based dijkstra algorithm for road turning penalty in vehicle navigation system. Acta Geod. Cartogr. Sin. 2002, 31, 366–368. [Google Scholar]
  14. DʼAngelo, G.; DʼEmidio, M.; Frigioni, D. A loop-free shortest-path routing algorithm for dynamic networks. Theor. Comput. Sci. 2014, 516, 1–19. [Google Scholar] [CrossRef]
  15. Liu, Q.Y.; Du, W.Z. Design and implementation of shortest path analysis system of the logistics distribution based on ArcGIS Server. Sci. Surv. Mapp. 2010, 35, 197–198. [Google Scholar]
  16. Wen, H.; Liu, Y.F.; Zheng, J.H.; Yan, L. Study on data model for public transport networks based on time chain. Geogr. Geoinform. Sci. 2005, 3, 35–38. [Google Scholar]
  17. Wang, H.M.; Zhou, X.Z. Shortest path analysis and its application in network systems. Acta ArmamenT. 2006, 3, 515–518. [Google Scholar]
  18. Vanhove, S.; Fack, V. Route planning with turn restrictions: A computational experiment. Oper. Res. Lett. 2012, 40, 342–348. [Google Scholar] [CrossRef]
  19. Winter, S. Modeling costs of turns in route planning. GeoInformatica 2002, 6, 345–361. [Google Scholar] [CrossRef]
  20. Sun, W.W.; Liu, C.; Lin, H.F.; Xie, S.M. T-GIS data model for urban complex road network. J. Tongji Univ. 2012, 1, 127–132. [Google Scholar]
  21. Prasad, V. Geographic information systems for transportation—Principles and applications. Photogramm. Rec. 2005, 20, 394–395. [Google Scholar] [CrossRef]
  22. Huang, D.F. The key algorithm research in GIS shortest path analysis. Urban Geotech. Investi. Surv. 2007, 4, 68–71. [Google Scholar]
  23. Jiang, B.; Liu, X.T. Computing the fewest-turn map directions based on the connectivity of natural roads. Int. J. Geogr. Inf. Sci. 2011, 25, 1069–1082. [Google Scholar] [CrossRef]
  24. Lei, M. The Analysis and Research on Shortest Path of Regional Road Network Based on Expenses. Master’s Thesis, Changsha University of Science & Technology, Changsha, China, 2007. [Google Scholar]
  25. Luo, R.F. Research on the Organization and Management of Left-turn Traffic at the urban Road Signalized Intersections. Master’s Thesis, Chang’an University, Xi’an, China, 2010. [Google Scholar]
  26. Xu, Z.H.; Liang, J.G. Design and Implementation of the Shortest Path Analysis Algorithm Based on Skyline. Urban Geotech. Investig. Surv. 2008, 4, 31–33. [Google Scholar]

