1. Introduction
Contemporary research on the human dimensions of environmental hazards typically falls into three paradigms: (1) the exploration of social vulnerability that potentially contributes to enhanced disaster impact; (2) the exploration of disaster resilience, the capacity for communities and individuals to ameliorate and recover from the impact of a disaster; and (3) exploration of social perceptions that can enhance or mitigate the impact of a disaster [
1,
2,
3,
4,
5,
6]. While efforts in all three areas advance our understanding of the human component of environmental hazards and disasters, social vulnerability has the longest record of research in the environmental hazards discipline of the three paradigms [
2].
Social vulnerability, as presented by Cutter [
2,
3], focuses on identification of vulnerability as it is constructed through social systems through exploration of demographic data to create a Social Vulnerability Index (SoVI). Exploration of this data to determine the factors that contribute to social vulnerability for an area, typically a U.S. Census enumeration unit, is conducted using Principal Components Analysis (PCA), which allows the data to drive factor selection for vulnerability. The loaded demographic variables in the PCA are identified to have specific representations of vulnerability based on our existing understanding of the role of social inequality on social vulnerability, and the PCA-identified factors are used to calculate the SoVI score for each enumeration unit. The SoVI has been demonstrated at a variety of scales, from the census block level to the county level across the United States [
3,
7] and at the county level in Norway [
8], though the PCA approach has only been demonstrated at the county level [
3,
8].
While the SoVI appears to be the most ubiquitous social vulnerability assessment in the literature of the last decade and a half, it is not the only method by which vulnerability assessments can be made. Füssel [
6] and Adger [
9] have identified several approaches to vulnerability over the years, each with fundamental differences that have separated the approaches into niche-like areas of research based on initial assumptions, initial objectives, and end-point goals. Further, it is clear from Füssel [
6] that there is a need for acceptance of a variety of valid frameworks for vulnerability assessment and appropriate use of the frameworks for given problems. The aim of this paper is not to limit advancement of vulnerability assessment to just one example of one approach at the expense of others, or to suggest the superiority of one method over another. The SoVI is of interest in this study as a linear assessment tool that offers the easiest test for the application of a non-linear method.
While the current method of SoVI construction has served analysts well for more than a decade, there are still areas for potential improvement. The PCA used in SoVI is a linear statistical method that can present problems for often-non-linear geographic human data. An approach to address this problem may lie in using an Artificial Neural Network (ANN). An ANN is a data-driven method similar to PCA, however it is a classification method, when used in a supervised capacity, which may eliminate complications from non-linear data [
10,
11].
This study compared the traditional SoVI approach with a modified SoVI approach with an ANN classification extension using a case study for the state of Utah. More specifically, the comparison between the traditional SoVI method and the ANN-classified SoVI identified how the two differed.
Through conducting this study we sought to answer the following questions:
How does an ANN SoVI result compare to the result of a traditional SoVI for a given region?
How and where do the results differ and why?
How can the ANN classification be interpreted relative to the traditional method regarding its strengths and weaknesses?
A point of concern in this approach is the use of the traditional SoVI result for a given region as a valid reference for the ANN SoVI. A common concern that arises in the discussion of the use of indices, in a broader sense, is that such indices are independent of their source data, that a given index has no direct relationship with what it is representing. The use of indices continues in spite of this challenge, however, as stronger alternatives often do not exist. Getting back to the concern of using one index to serve as the valid basis for a new index—basing the ANN SoVI on the traditional SoVI—it is important to note that the purpose of this study is not to make claims of index validity and appropriateness in a broader, theoretical sense. Such deliberation is beyond the scope of this project. As such, this study will proceed as though the traditional SoVI is a valid method, supported by more than ten years of use in the literature [
2,
3,
7,
8]. This is central to the purpose of assessing the viability of the use of an ANN to improve upon the traditional methodology.
2. Background
The concept of SoVI is a component from Susan Cutter’s Hazards of Place (HoP) model, which seeks to integrate physical vulnerability and social vulnerability in an intuitive way [
2,
3]. The approach fuses two concepts in a novel way: vulnerability has to do with both proximity to hazards and political-economic factors. Cutter took this fusion a step further, however, and describes the concept of HoP as vulnerability that is a place-based characteristic of the vulnerable population where they live [
2,
7]. Vulnerability therefore varies at different scales, and takes into consideration generalization principles: the smaller the analysis scale, the more locally relevant the model will be for the population in that place. Place is implied to mean a human occupied space, an occupied location [
2].
Cutter first introduced the HoP model with William Solecki in a 1989 paper on patterns of U.S. airborne toxic releases [
12]. Cutter continued to work with the HoP concept through the 1990s, where the model expanded to include broader physical and social characteristics of hazard vulnerability [
2]. The vulnerability model came to include hazard potential as a combination of risk and mitigation, which itself was broken into the related parts of social fabric, geographic context, biophysical vulnerability (akin to the proximity to hazard school of thought), and social vulnerability—similar to the social vulnerability aspects of political-economic concepts of social vulnerability) [
2] (p. 78). Social fabric in this model represents the social and political background of the place and how that impacts social vulnerability, while geographic context accommodates more the physical characteristics of the place landscape as they operate together with biophysical hazards. The HoP model integrates these characteristics which results, when applied to a place, in a holistic assessment of its vulnerability. The joining of physical risk with a SoVI as the social vulnerability component has been done in several works by Cutter and others in the years following the creation of the HoP model to demonstrate its capabilities [
2,
3,
7].
Further work involving the SoVI has gone on to explore how robust the SoVI is in terms of sensitivity and variance at different scales [
3,
13]. Schmidtlein
et al. [
13] determined that scale and minor changes in variable selection had little impact on the efficacy of the SoVI, a concern noted in Cutter’s work. However, Tate [
14] challenged that statistical bias, precision, and uncertainty are intrinsically part of the general hierarchical SoVI, thereby insisting that sensitivity analysis be included in the creation of a vulnerability index. Holand and Lujala [
8] followed with an approach to adapt the SoVI to a new geographic context, in their study’s case translating the United States-centric SoVI to apply to Norway. Holand and Lujala [
8] altered the variable selection for the SoVI to better reflect the cultural, social, and political context of Norway. Taken together, this literature suggests that the SoVI is flexible in its construction and viable for results provided care is taken in construction of indices.
With the adaptive element identified by Holand and Lujala [
8] coupled with index sensitivity analysis by Schmidtlein
et al. and Tate [
13,
14], new possibilities are opened for advancing the power of the SoVI. One such opportunity becomes apparent when considering Stephen and Downing’s [
15] assessment of vulnerability to famine and food insecurity in Ethiopia in a comparison between three methods. The authors compared the commonly used Household Food Economy Approach and RiskMap (HFE) and Classification and Regression Tree (CART) methods, and then compared those two to a new approach utilizing an ANN.
An ANN is a machine-learning computation method capable of performing data exploration (in an unsupervised mode) and data classification (in a supervised mode), among other applications [
16,
17]. The method has a basic structure of three node layers: one layer of inputs with one node per variable input; one hidden layer of nodes that perform the analysis in the model, commonly one plus the number of input nodes; and one output layer, with the number of nodes equal to the number of class outputs desired [
10,
11,
16]. The input nodes pass their values to each of the hidden nodes, which then perform the relationship analysis of the inputs, and then pass the classification out to the output nodes [
10,
11,
16]. A common modification to this basic structure in modern studies using ANNs is the inclusion of back-propagation, whereby the result of the analysis in the hidden nodes is passed back to the network links between the input and hidden layers to apply an auto-adjusting weight to the network links to enhance the performance of the ANN [
10,
16]. The structure of the ANN and its relationship algorithm has been determined to implicitly capture non-linear relationships in data applied to an ANN [
10,
11,
16]. The method does have a significant drawback with respect to social applications; training an ANN can require a significant amount of sample data, which, when considering a single-case model as SoVI has frequently been applied, could be problematic due to the reduction in dataset size for classification from training [
17]. This problem could be alleviated with the use of a trained ANN for other case studies using the same input parameters, whereby data would only need to be reserved for model validation rather than for training. The convention put forth by Shahin
et al. [
17] recommends an optimal training set to be 70% of the data with 30% used for testing.
The direct application of ANNs in social problems has little presence in the literature. However, the use of ANNs in physical systems modeling is quite extensive. Examples in geography include, but are not limited to: rainfall estimation [
18], landslide susceptibility [
19], water quality [
20], and solar energy potential [
21]. These applications have utilized the classification potential for an ANN in developing predictive models for evaluating physical phenomena using input variables identified as key to understanding those phenomena. The SoVI is the product of attempting to parameterize social vulnerability with quantitative social data, which makes the SoVI not dissimilar to the physical phenomena in form. This similarity between SoVI and other analyses of physical phenomena, taken with the demonstration by Stephen and Downing [
15] of an ANN in a vulnerability application, suggests that an ANN may be useful for assessing vulnerability.
Stephen and Downing [
15] found that the ANN could produce comparable results to the commonly used HFE and CART methods, but more importantly performed some diagnostics on the functionality of the ANN in a vulnerability context. They found that their ANN was not sensitive to spatial scale and further determined that their ANN could accommodate data sets with different scales, which could suggest a possible way to address the Modifiable Areal Unit Problem in SoVI construction [
15,
22,
23]. The ANN was also identified as having captured non-linear relationships in their data, even when the data were autocorrelated [
15], consistent with statements about ANN performance by Fischer and Abrahart [
16]. As noted by Stephen and Downing [
15] and Fischer and Abrahart [
16], topology between observations can also be maintained in some applications of the ANN. Ultimately, Stephen and Downing [
15] opened up a new pathway for social vulnerability and the SoVI through integration of an ANN.
3. Experimental Section
To explore the modification of the SoVI method, we constructed an experiment to first assess vulnerability for Utah using the traditional method. From that point an ANN was constructed to expand the SoVI with a non-linear method to enhance the results. The following sections describe in greater detail the procedure used to explore this application of ANN to expanding SoVI. We chose the SoVI method to test an ANN as existing literature on SoVI [
3,
4,
6,
8,
13,
14,
15] appears to provide a clear avenue for exploration.
3.1. Study Area
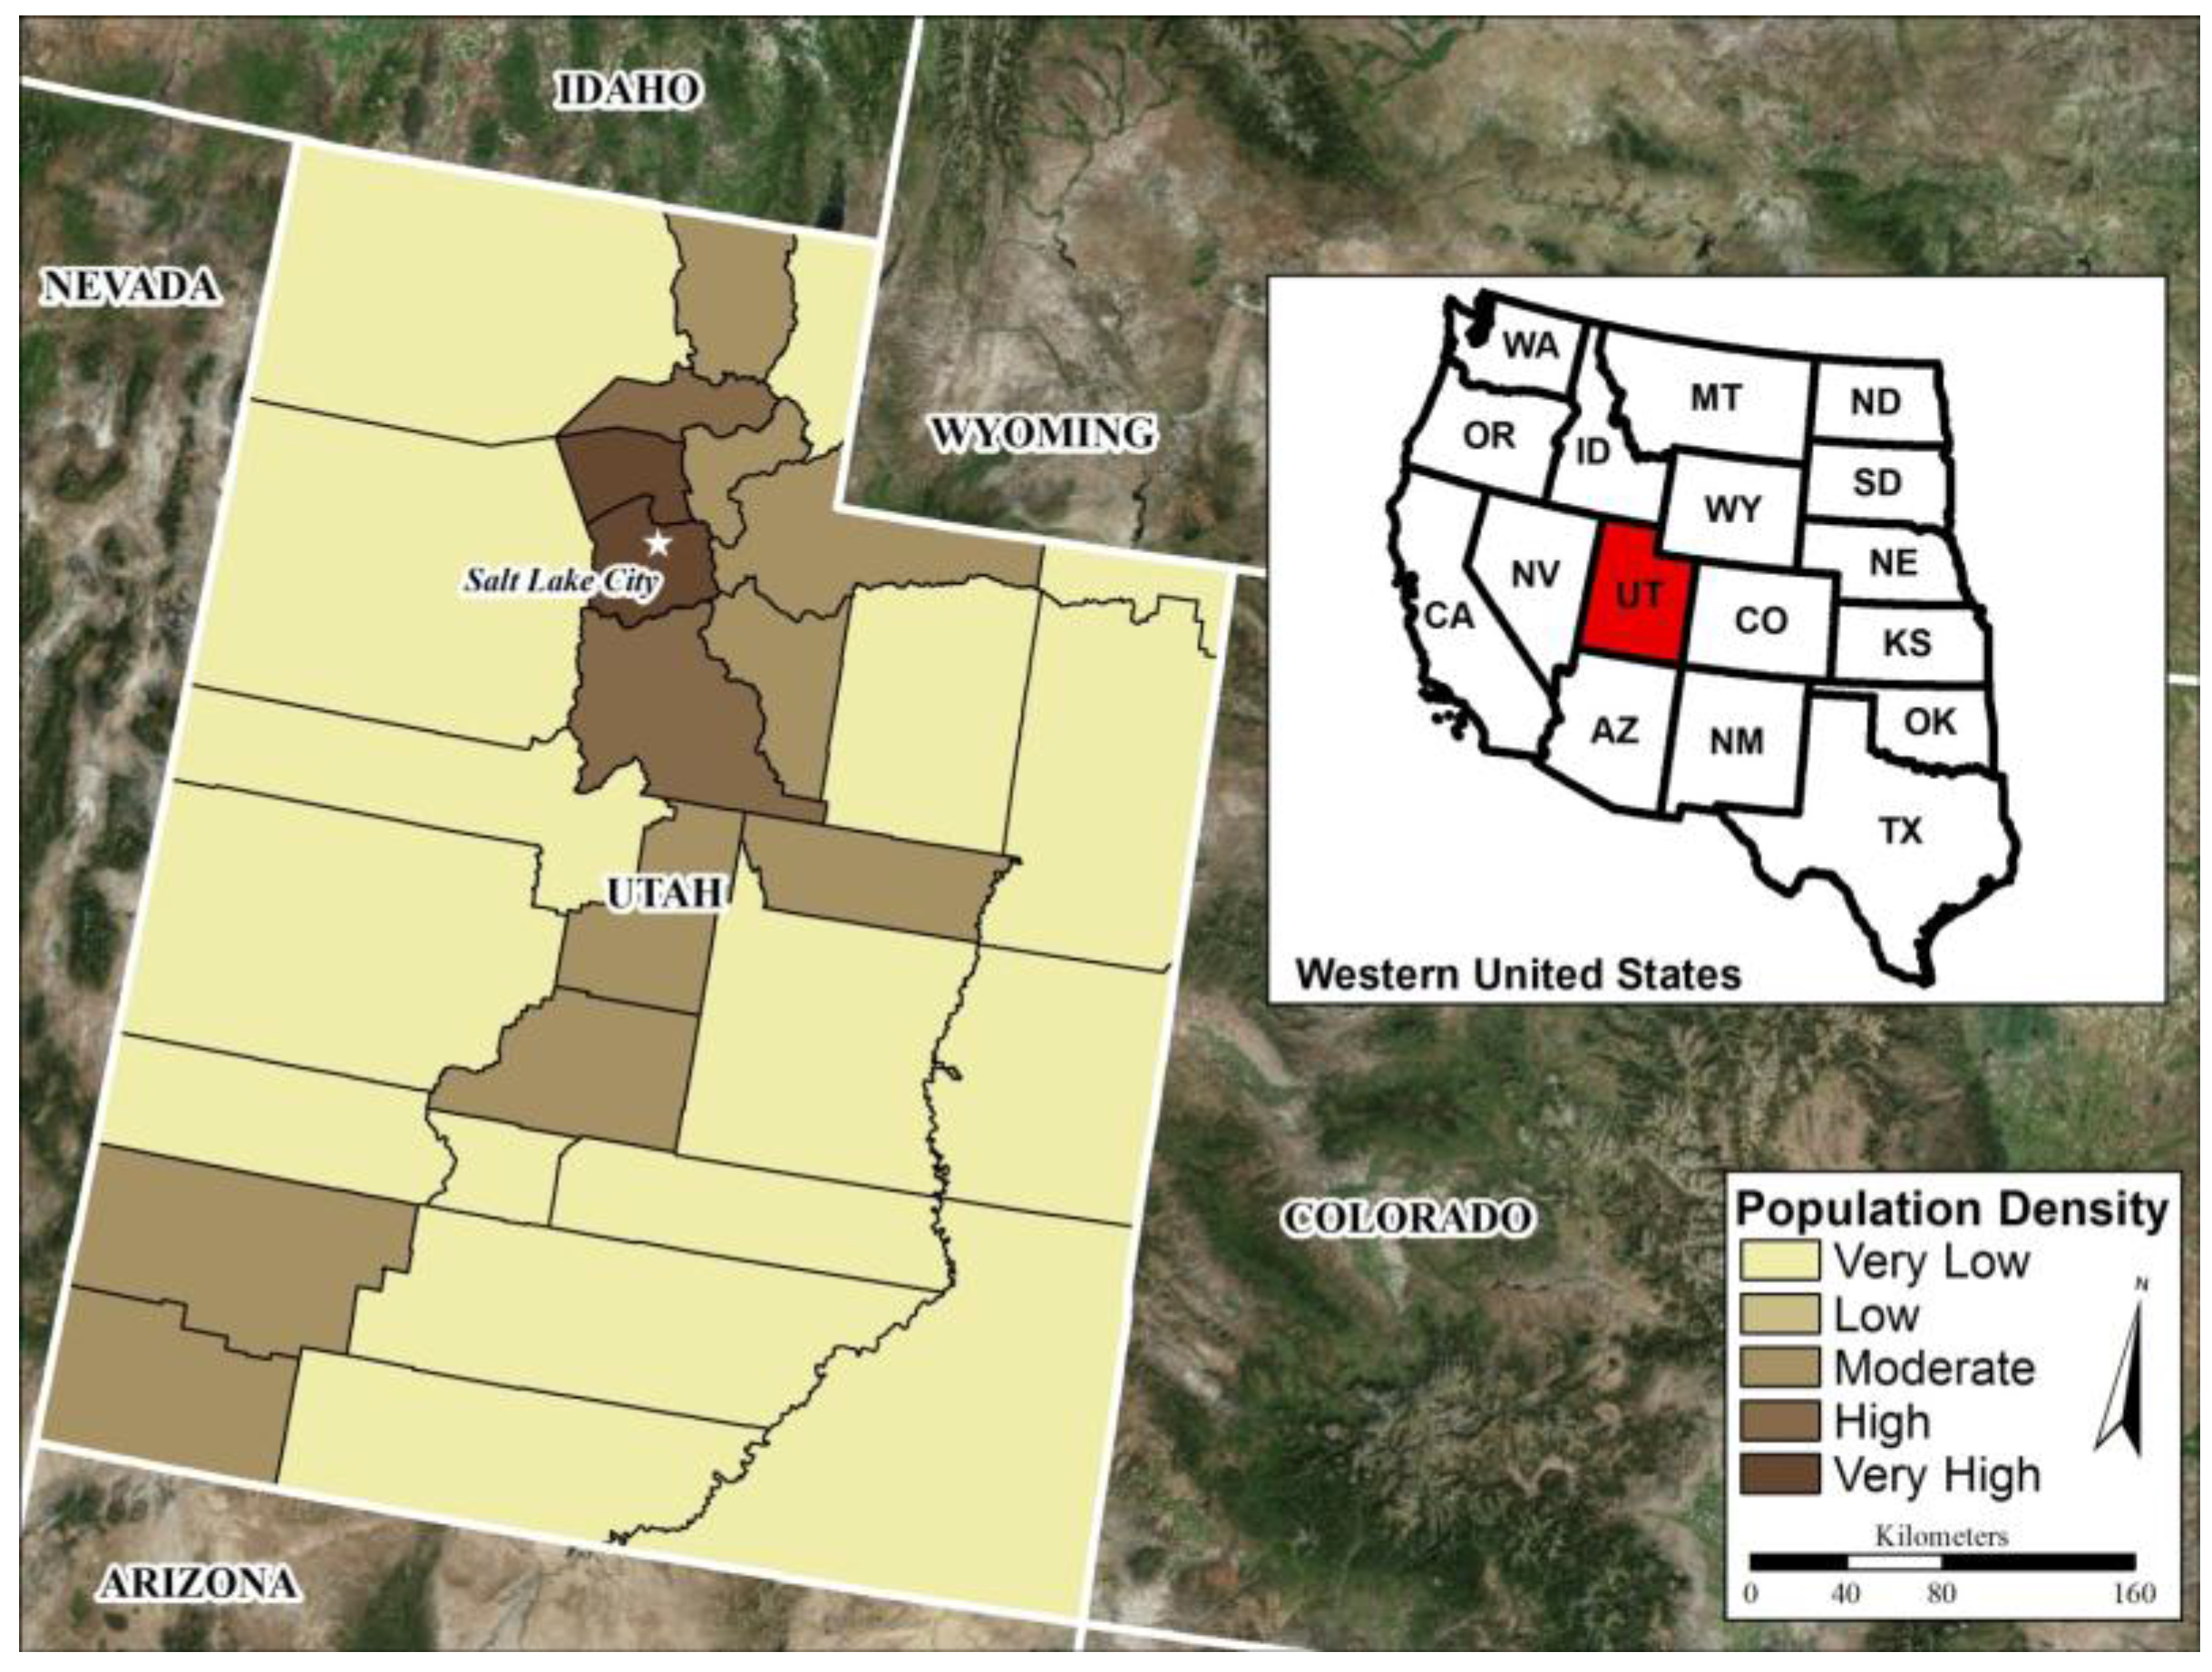
Utah is a state located in the Rocky Mountain West with a population in 2010 of 2,763,885 (
Figure 1) [
24]. The state has 29 counties, 18 of which have a population of 25,000 or fewer. Utah’s capital is Salt Lake City, located in Salt Lake County, which is also the largest city in the state with a municipal population of 186,440 as of the 2010 decennial census [
24]. The population distribution is non-uniform throughout the state, as a large portion of the population of the state is centered in the Ogden-Salt Lake-Provo corridor of the Wasatch Front, with the remainder of the state mostly rural.
Figure 1.
The state of Utah in the Western United States with county population by land area shown.
Figure 1.
The state of Utah in the Western United States with county population by land area shown.
3.2. Population Data
To conduct our study, we took a subset of the United States Census Bureau’s American Community Survey (ACS) data for the state of Utah for a five year period to account for as many social factors as possible from the traditional SoVI method [
3]. The ACS surveys a small sample of the population each year to supplement and expand on the decennial census and to provide other statistics products useful for planners in a variety of contexts [
25]. We selected the five year data for this study to reduce the effects of error, which is reduced through the combination of the samples from each of the years, thereby increasing the sample size. The period of our dataset is from 2008 to 2012.
The ACS data is aggregated at a variety of levels for different needs. We selected the smallest aggregation level that the ACS is published in for this study, the census block group level—the second smallest aggregation unit the Census Bureau uses in published data. This was done to capitalize on two key benefits: a relatively fine spatial scale to assess vulnerability and the largest possible number of aggregation units for the study area. The relative quality of the ACS is less important study than the ready availability of a large number of demographic variables no longer collected in the U.S. Census Long Form, particularly as the internal consistency of the data is the only validity concern for this study.
The five-year ACS data for Utah at the census block group level is composed of 1690 census block groups and contains a total of 2739 variables with respective margins of error. The subset of the variables used in this study totaled 60 variables from the ACS and 1 variable from the census block group geometry (
Table 1). Some of the variables were combined where appropriate to produce more broadly descriptive variables, such as with public education attainment. The variables chosen for this study approximate a basic index covering the broadest themes of social vulnerability as presented by Cutter
et al. [
3]. These data provide a basic skeleton by which to test the ability of an ANN to perform as a classification method, rather than as a complete and accurate vulnerability assessment.
Table 1.
Subset of the United States Census Bureau’s American Community Survey (ACS) variables used in the study with descriptions and whether the variable was derived from a larger group of variables from the ACS data.
Table 1.
Subset of the United States Census Bureau’s American Community Survey (ACS) variables used in the study with descriptions and whether the variable was derived from a larger group of variables from the ACS data.
| Variable Name and Number | Derived | Variable Description |
|---|
| MEDIAN_AGE (1) | No | Median age |
| PER_CAPITA_INCOME (2) | No | Per capita income |
| MED_VAL_OWN_OCC_HOUSING (3) | No | Median value of owner occupied housing |
| MED_RENT_RENT_OCC_HOUSING (4) | No | Median rent of renter occupied housing |
| NON_WHITE (5) | Yes | Proportion of population that is non-white |
| PC_POP_UNDER_5 (6) | Yes | Proportion of population under the age of 5 |
| PC_POP_OVER_65 (7) | Yes | Proportion of the population over the age of 65 |
| PC_CIVIL_LABOR_UNEMPLOYED (8) | Yes | Proportion of the civil labor force that is unemployed |
| AVG_PEOPLE_HOUSE (9) | No | Average number of housing occupants |
| PC_HOUSE_EARN_MORE_75K (10) | Yes | Proportion of population earning more than $75,000 per year |
| PC_POVERTY (11) | Yes | Proportion of population living below the poverty level |
| PC_RENT_OCC_HOUSING (12) | Yes | Proportion of housing occupied by renters |
| PC_MOBILE_HOME (13) | Yes | Proportion of occupied housing as mobile homes |
| PC_POP_OVER_25_NO_DIPLOMA (14) | Yes | Proportion of population over 25 with no high school diploma |
| NUM_HOUSING_SQ_MI (15) | Yes | Housing density by square mile |
| PC_POP_IN_LABOR_FORCE (16) | Yes | Proportion of population in labor force |
| PC_EMP_EXTRACTIVE (17) | Yes | Proportion of labor force employed in extractive industry occupations |
| PC_EMP_TRANSCOMMUTIL (18) | Yes | Proportion of labor force employed in transportation, communications, and utilities occupations |
| PC_EMP_SERVICE (19) | Yes | Proportion of labor force employed in service occupations |
| PC_FEMALE (20) | Yes | Proportion of population that is female |
| PC_FEM_ONLY_HOUSE (21) | Yes | Proportion of households headed by a female with no spouse present |
| PC_HOUSE_SS_INCOME (22) | Yes | Proportion of households receiving social security income |
These data were joined to the census block groups polygons in a Geographic Information System (GIS) and the final variables were calculated within the database. The joined data were exported from the GIS to the statistical software package R to perform further analysis.
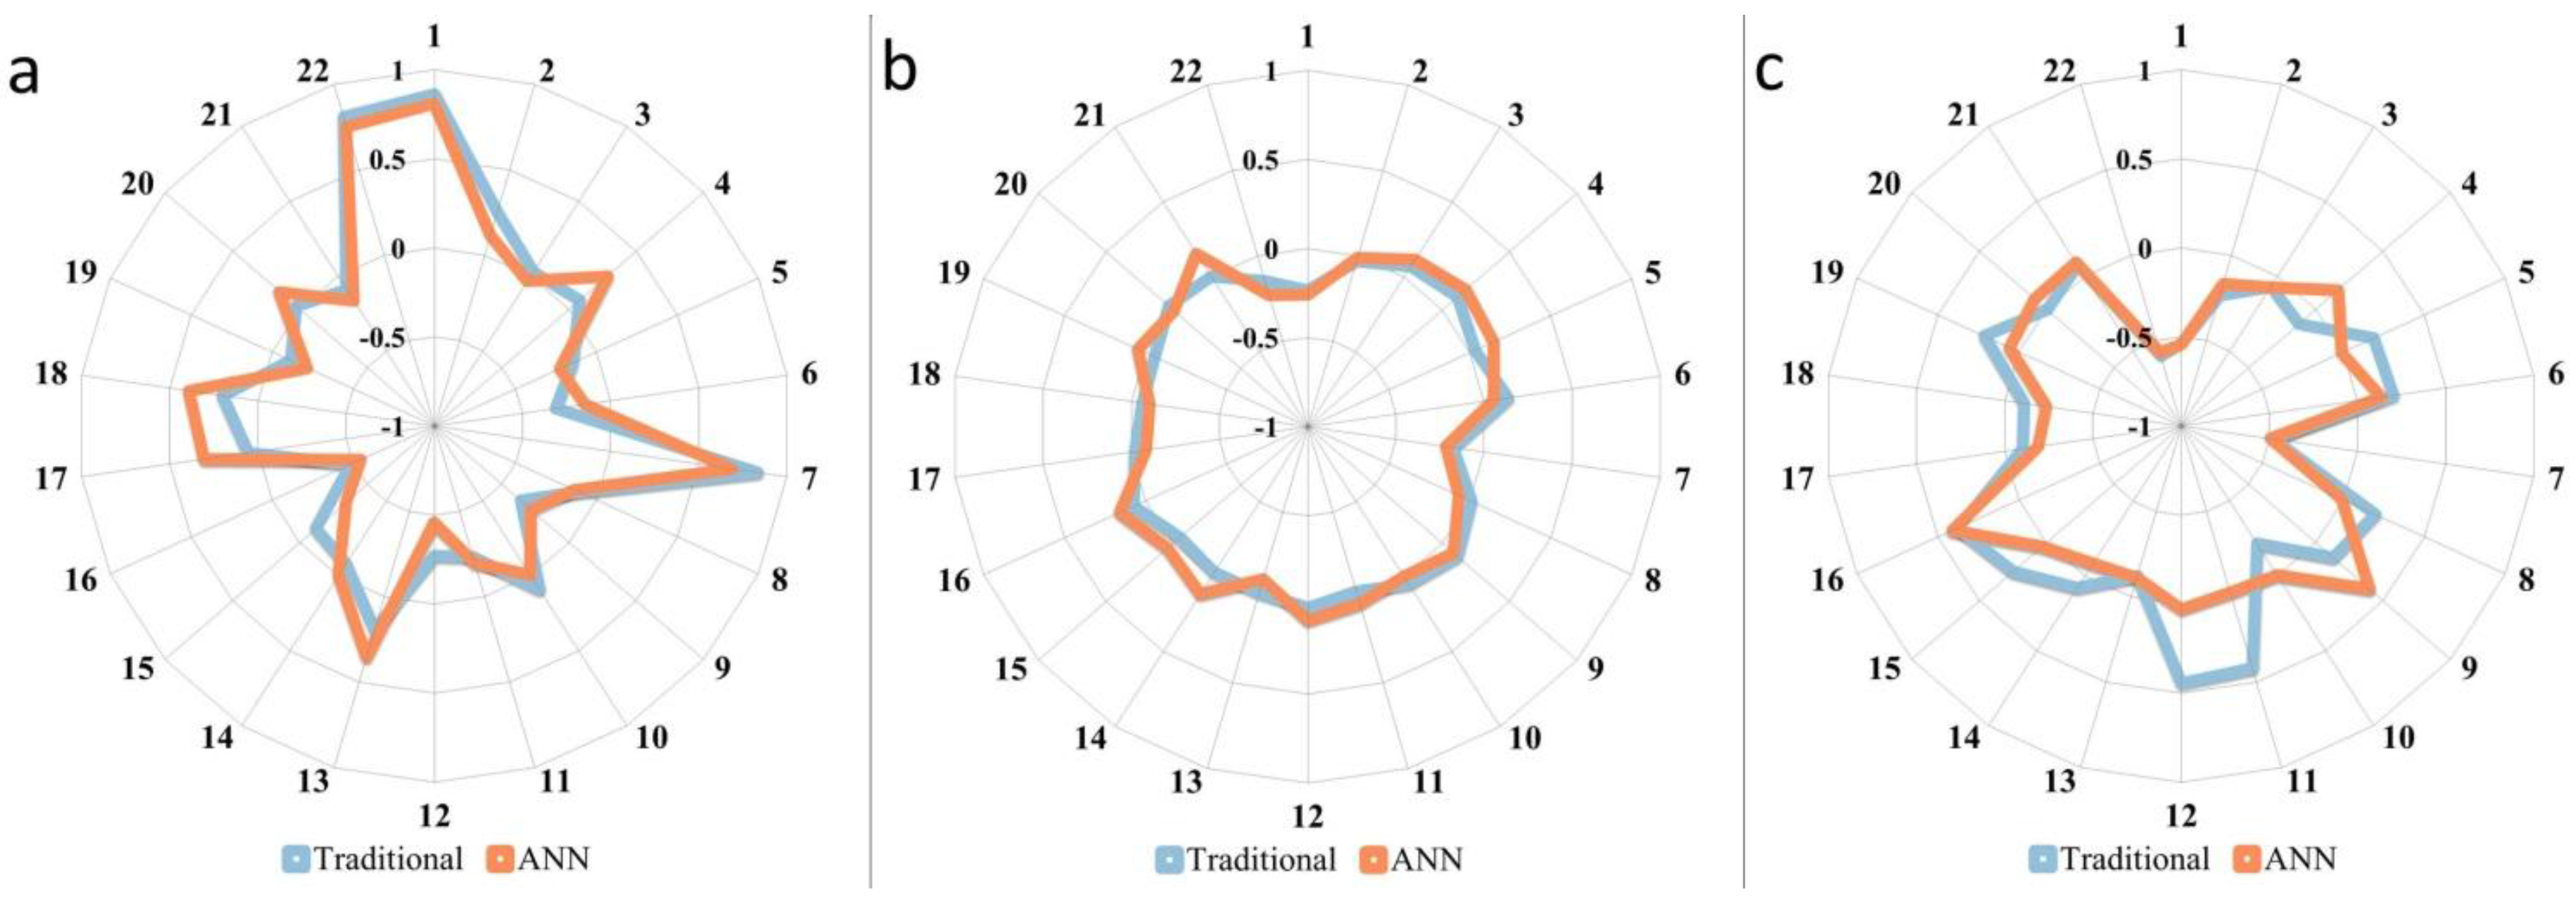
3.3. Traditional SoVI Construction
The ACS variables attached to the census block groups for Utah were exported from the GIS into a shapefile format and read into R using the “maptools” package. The database table containing the variables for the state was translated into a data frame in R. Once the data were in the correct internal format in R, PCA was run on the data using the “prcomp” function. The data were scaled in the function to center all of the variables and to ensure the variance was not skewed by differences in variable magnitude. The resultant PCA analysis produced a total of 22 principal components of which 13 were selected as social factors with 87.8% of the variance explained (
Table 2).
Table 2.
Traditional Social Vulnerability Index (SoVI) factors with cardinality, factor name and proportion of variance explained (rounded), and dominant social variables with factor loading cardinality.
Table 2.
Traditional Social Vulnerability Index (SoVI) factors with cardinality, factor name and proportion of variance explained (rounded), and dominant social variables with factor loading cardinality.
| Factor 1 (−) | Factor 2 (+) | Factor 3 (+) | Factor 4 (+) | Factor 5 (+) | Factor 6 (abs) | Factor 7 (−) |
| Wealth (22) | Elderly (13.9) | Extractive (8.9) | Female (6.9) | Disadvantaged (5.5) | Employment (4.9) | Housing (4.4) |
| per capita (−) | med age (+) | renters (+) | female (+) | non-white (+) | unemployed (−) | median rent (−) |
| earn >75K (−) | over 65 (+) | house sqmi (−) | fem only home (+) | under 5 (+) | avg house size (−) | |
| | SSI receive (+) | extract emp (+) | | female (+) | extract emp (+) | |
| | | | | | service emp (+) | |
| Factor 8 (−) | Factor 9 (+) | Factor 10 (+) | Factor 11 (−) | Factor 12 (+) | Factor 13 (+) | |
| Housing (4.1) | Race and Employment (4) | Disadvantaged (3.6) | Employment (3.5) | Disadvantaged (3.1) | Extractive Employment (3) | |
| median rent (−) | non-white (+) | mobile homes (+) | service emp (−) | under 5 (−) | mobile homes (+) | |
| | unemployed (−) | extract emp (+) | | unemployed (−) | extract emp (−) | |
| | | fem only home (+) | | fem only home (+) | | |
From this selection of social factors, a function was created to additively combine the factors—using the variable loadings—into the final SoVI score. The function used to add the loadings is shown below:
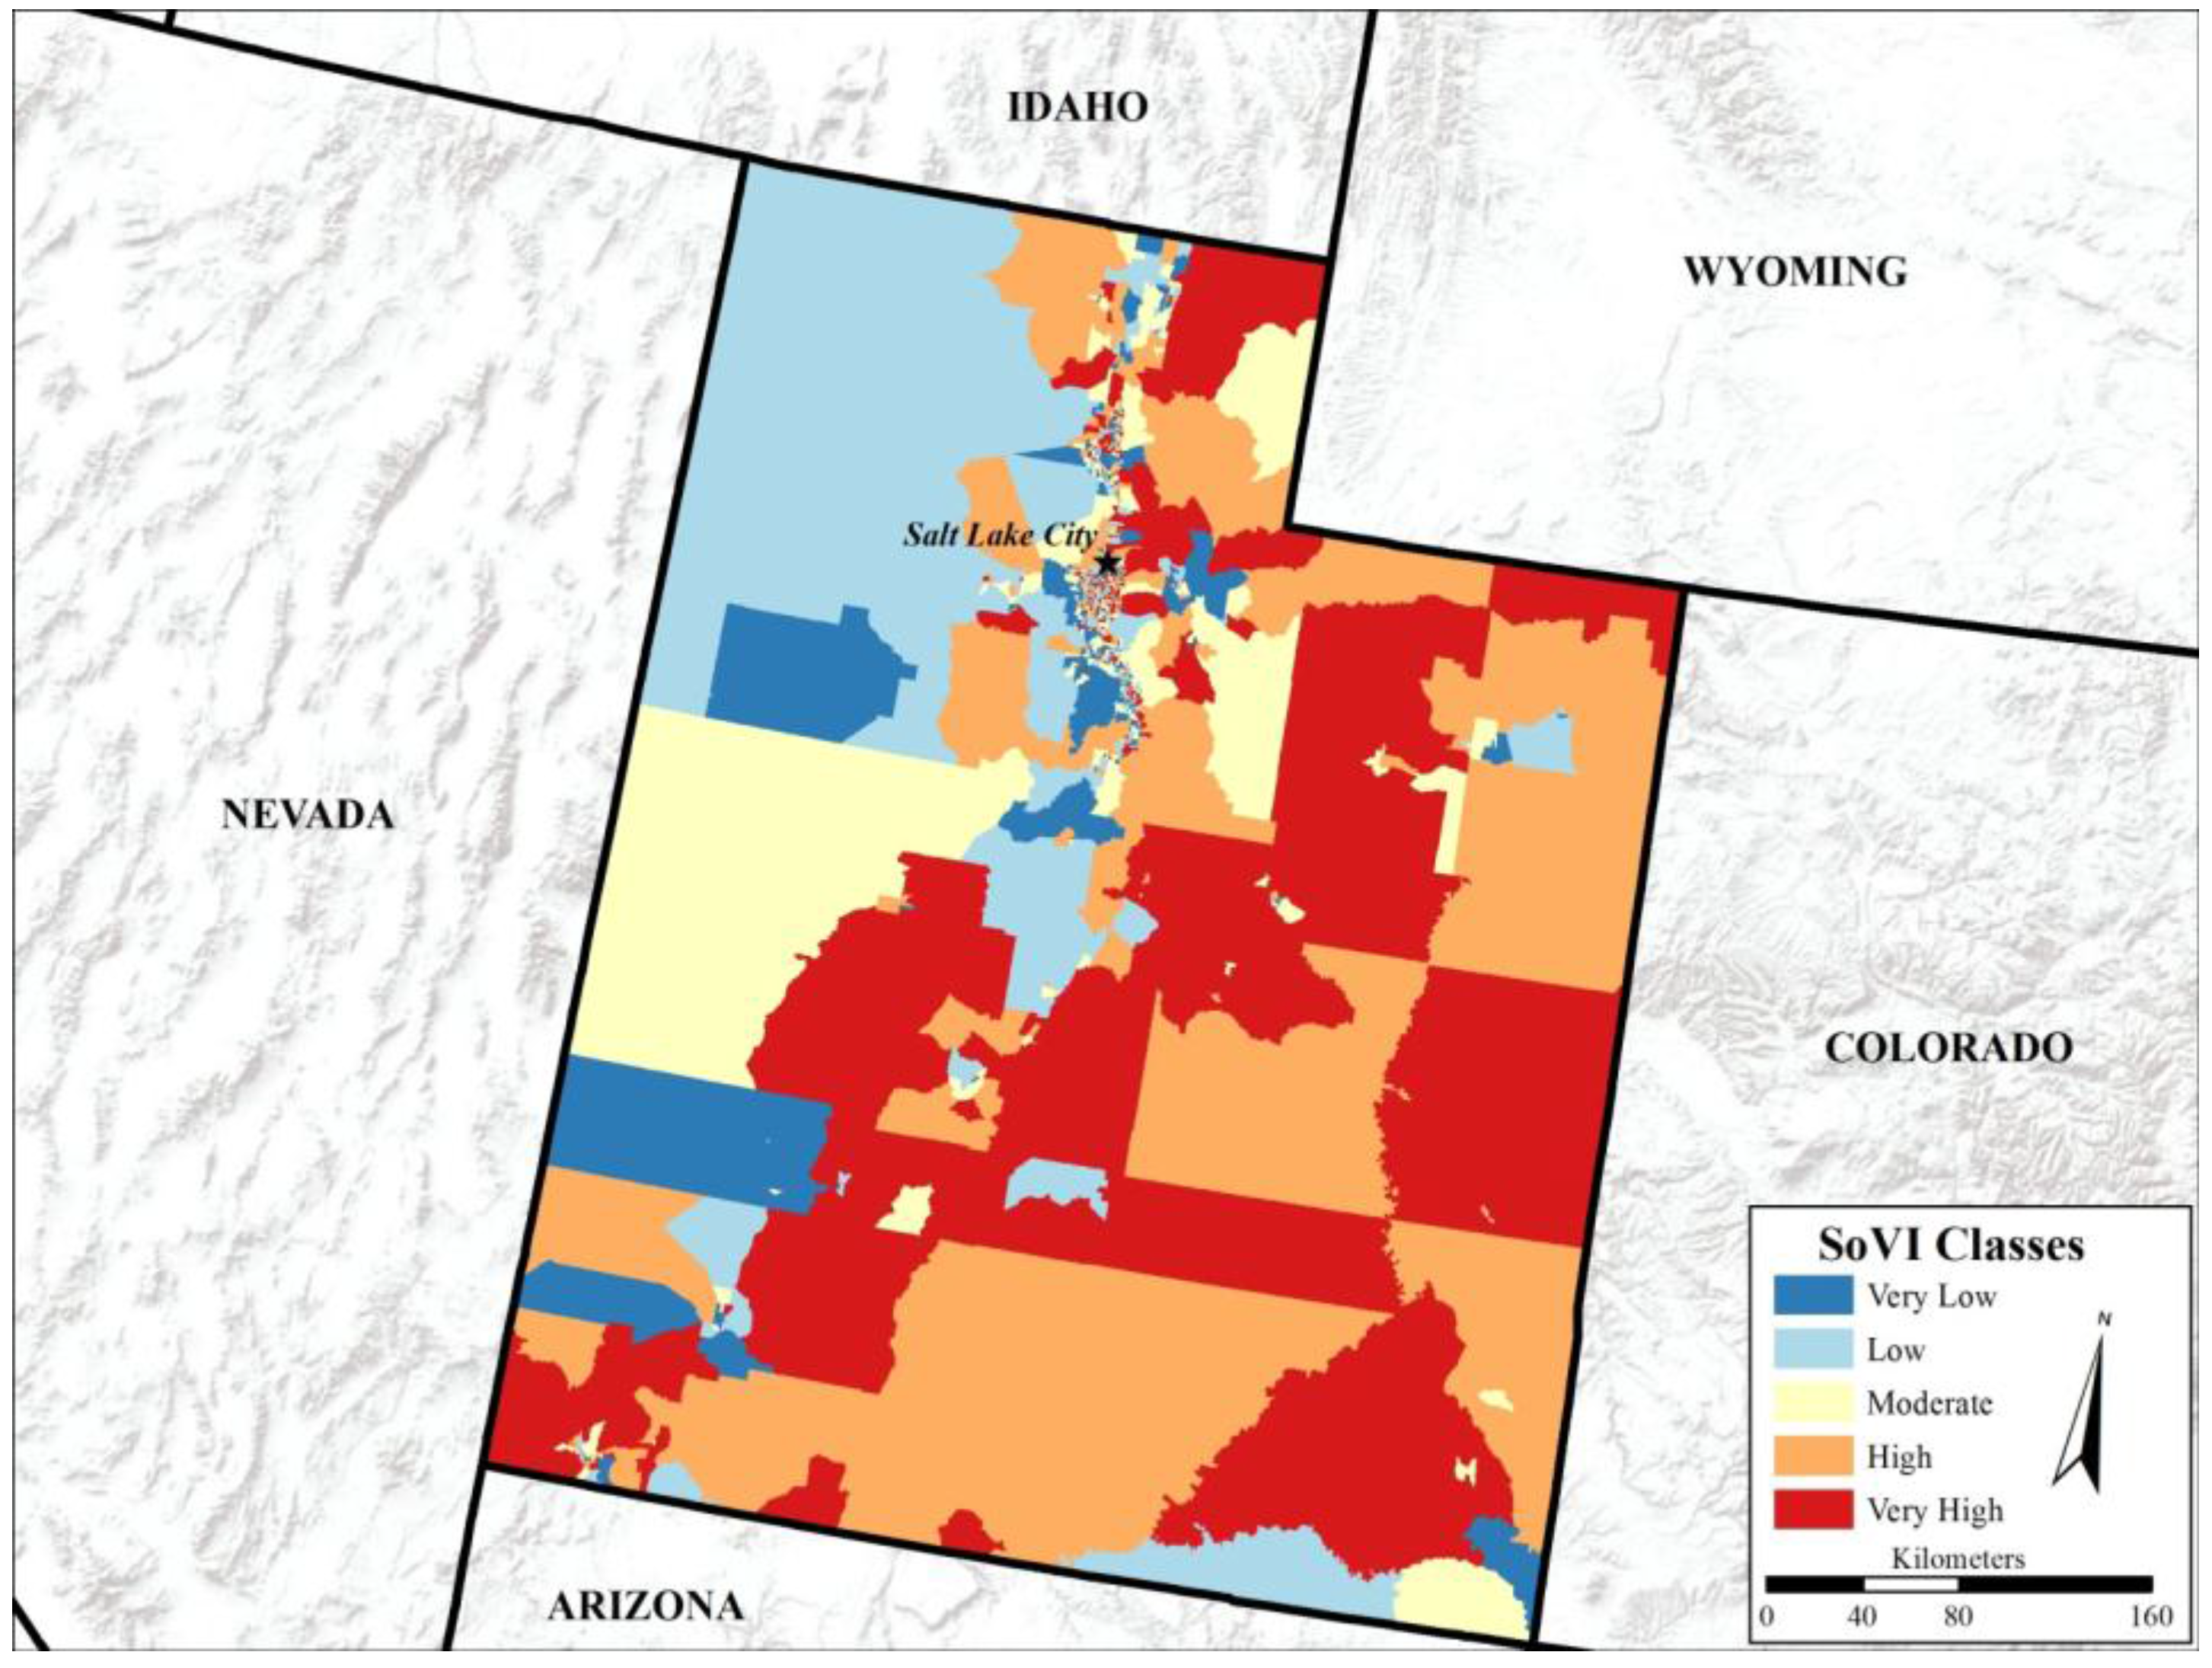
The data were exported back to GIS to visualize social vulnerability for the state. The SoVI scores were symbolized using quantiles with five breaks. The breaks represent categorical vulnerability (
Table 3).
Table 3.
Vulnerability categories and their respective quantile break upper bound value.
Table 3.
Vulnerability categories and their respective quantile break upper bound value.
| Upper Bound of Category | Category |
|---|
| −1.59 | Very Low |
| 0.62 | Low |
| 2.44 | Moderate |
| 4.60 | High |
| 22.77 | Very High |
A new field was added to the database table to include the SoVI categories. The data were exported with the categories included into shapefile format to be read into R once more.
3.4. ANN SoVI Construction
The data were loaded into R using the “maptools” package once again. The database table was loaded into a data frame in R and unnecessary fields were stripped from the table (
i.e., the SoVI score table, GIS-generated fields,
etc.). The data were then partitioned into two sets, one training set and one prediction set. The training set was 70% of the data, totaling 1183 census block groups, with the remaining 507 census block groups used for ANN classification. This training and testing set division was used following the convention established by Shahin
et al. [
17].
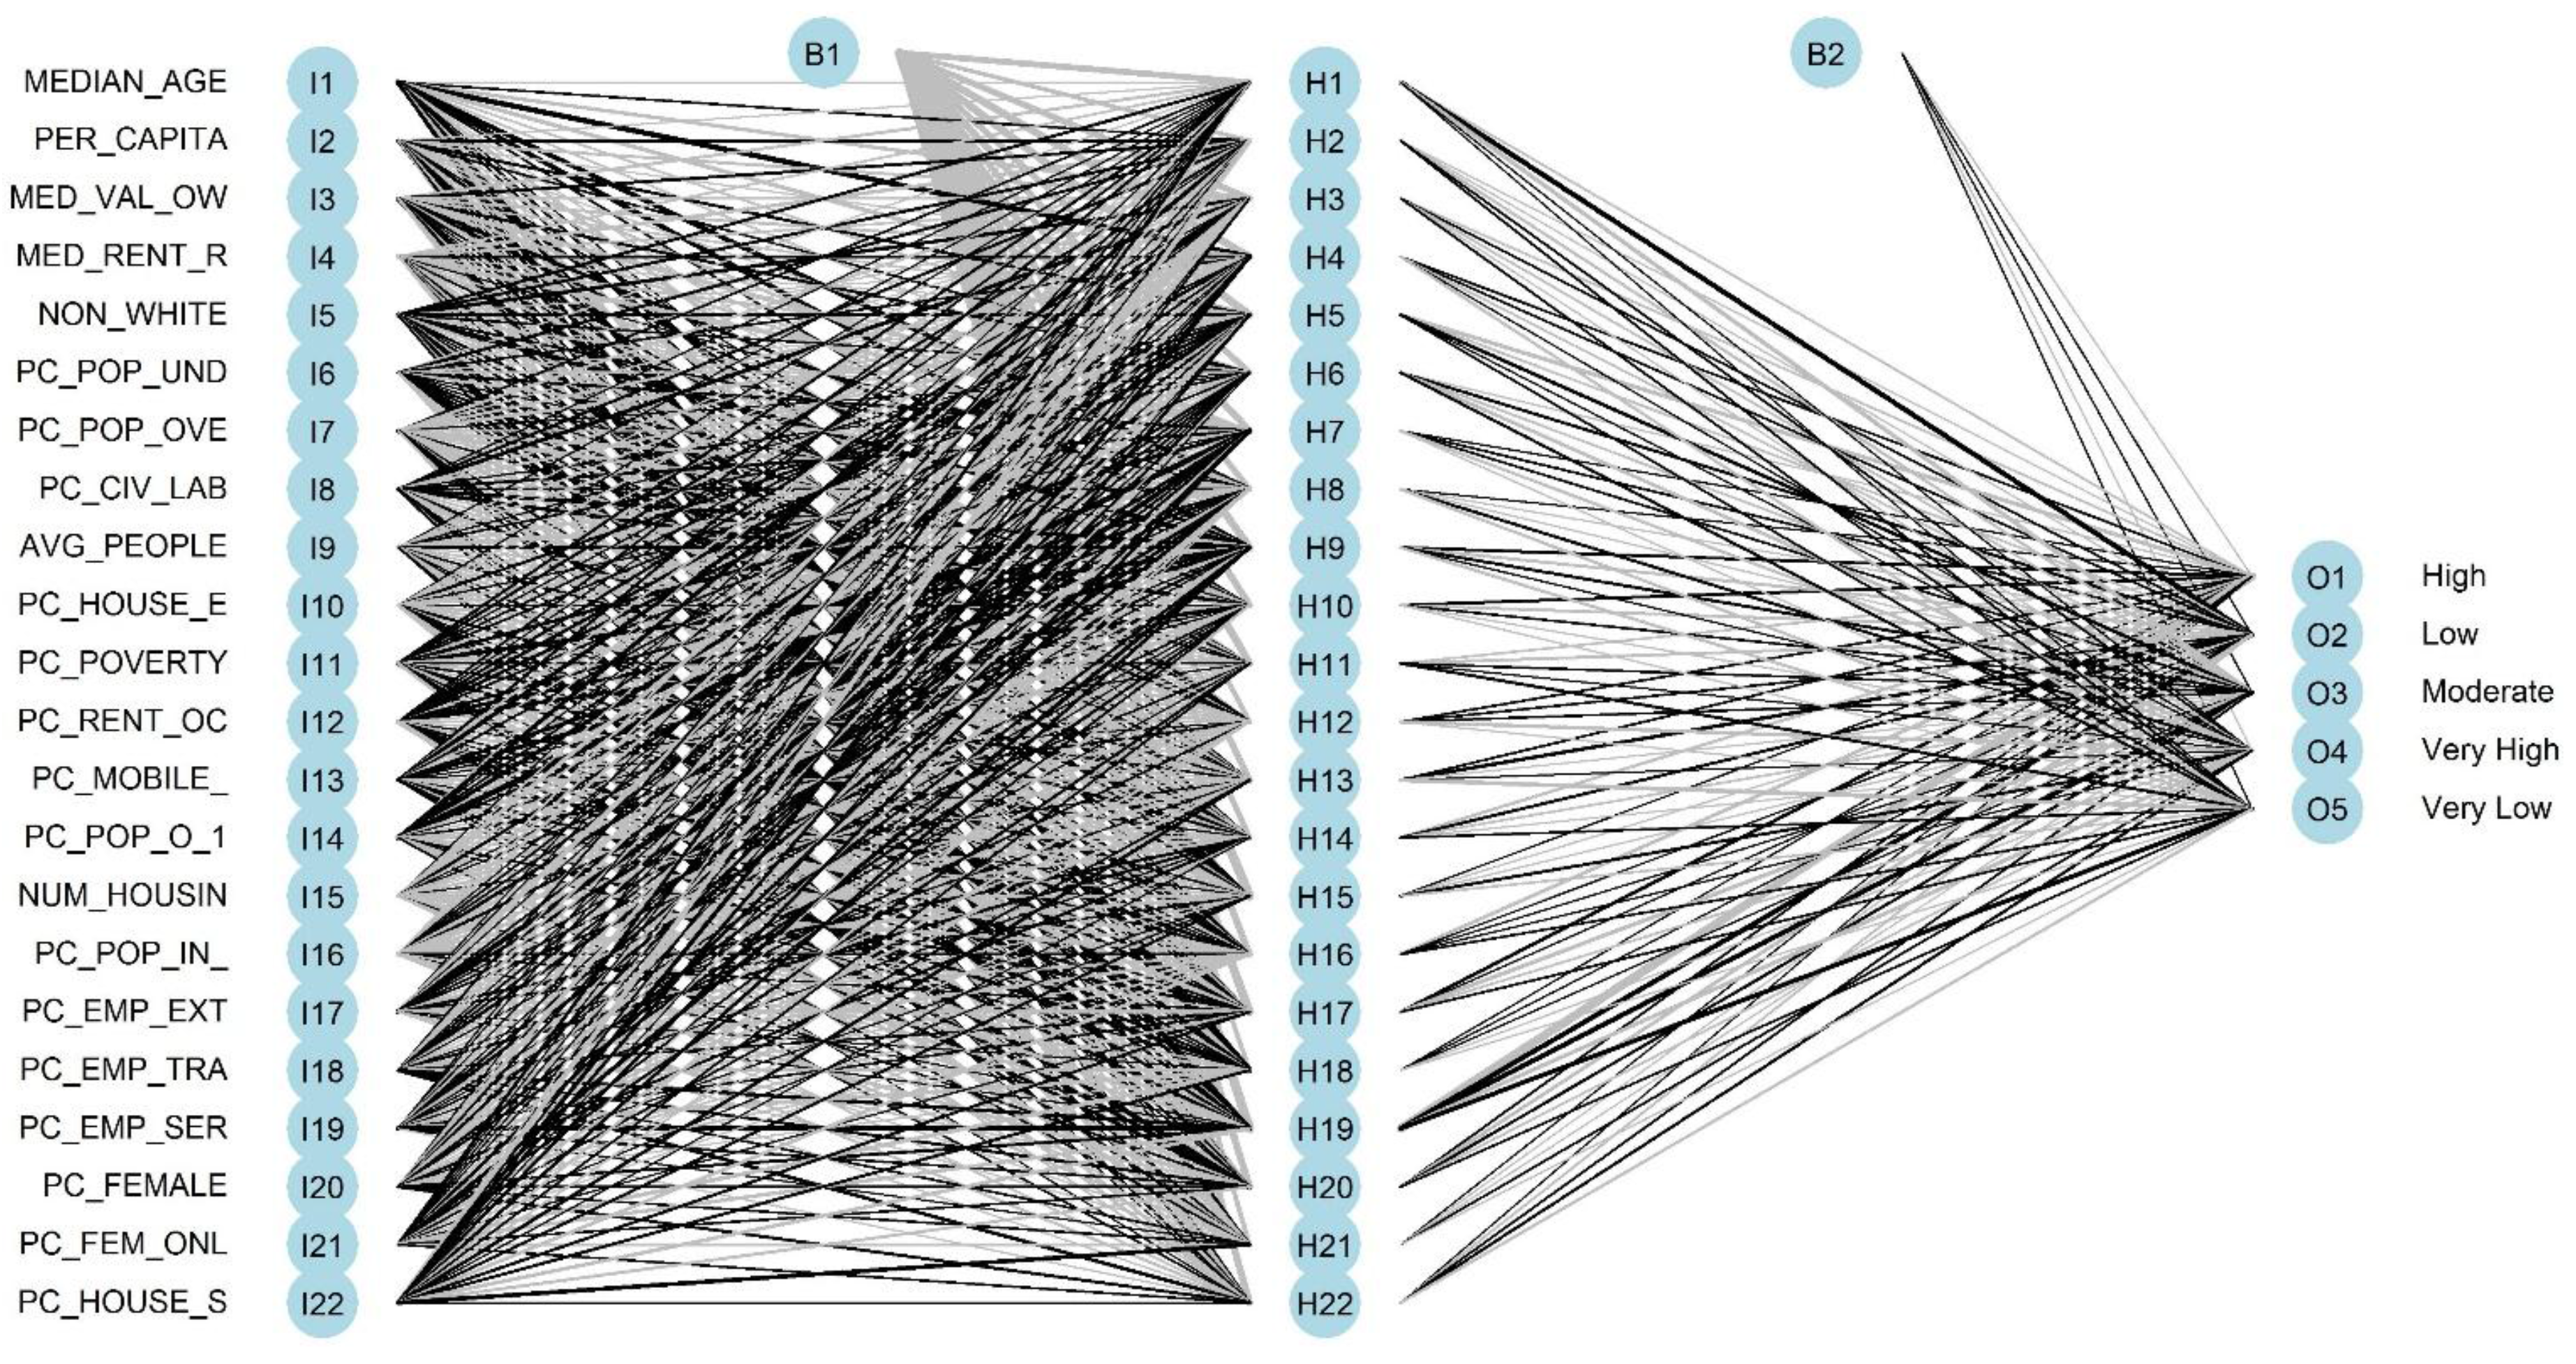
The ANN was created using the “nnet” package. The network had 22 input nodes, equal to the number of input variables. The hidden layer had a number of nodes equal to the input nodes plus one, or 23. The output layer had five nodes, equal to the number of social vulnerability categories (
Figure 2).
The final ANN was run five times for categorical classification to find a common convergence value to determine that the model was running consistently and producing consistent results. A static seed value was also set in the process to ensure consistency in output. All of the classification runs converged at the same value, even when the model was run on other machines. The ANN was run multiple times with slight variations to the structure, however the structure presented here performed the best of the test cases.
3.5. Comparison of Traditional and ANN SoVIs
The comparison of the PCA-driven SoVI against the ANN-extended SoVI was conducted using change detection and radar plot comparisons of how each method handled the input social variables. For this study we focused primarily on the similarity between the PCA and ANN results, and we compared the performance of the methods based on the relative similarity of the results.
Figure 2.
Structure of the neural network used to classify SoVI for Utah. The network contains 22 input nodes, 23 hidden nodes, and five output nodes.
Figure 2.
Structure of the neural network used to classify SoVI for Utah. The network contains 22 input nodes, 23 hidden nodes, and five output nodes.
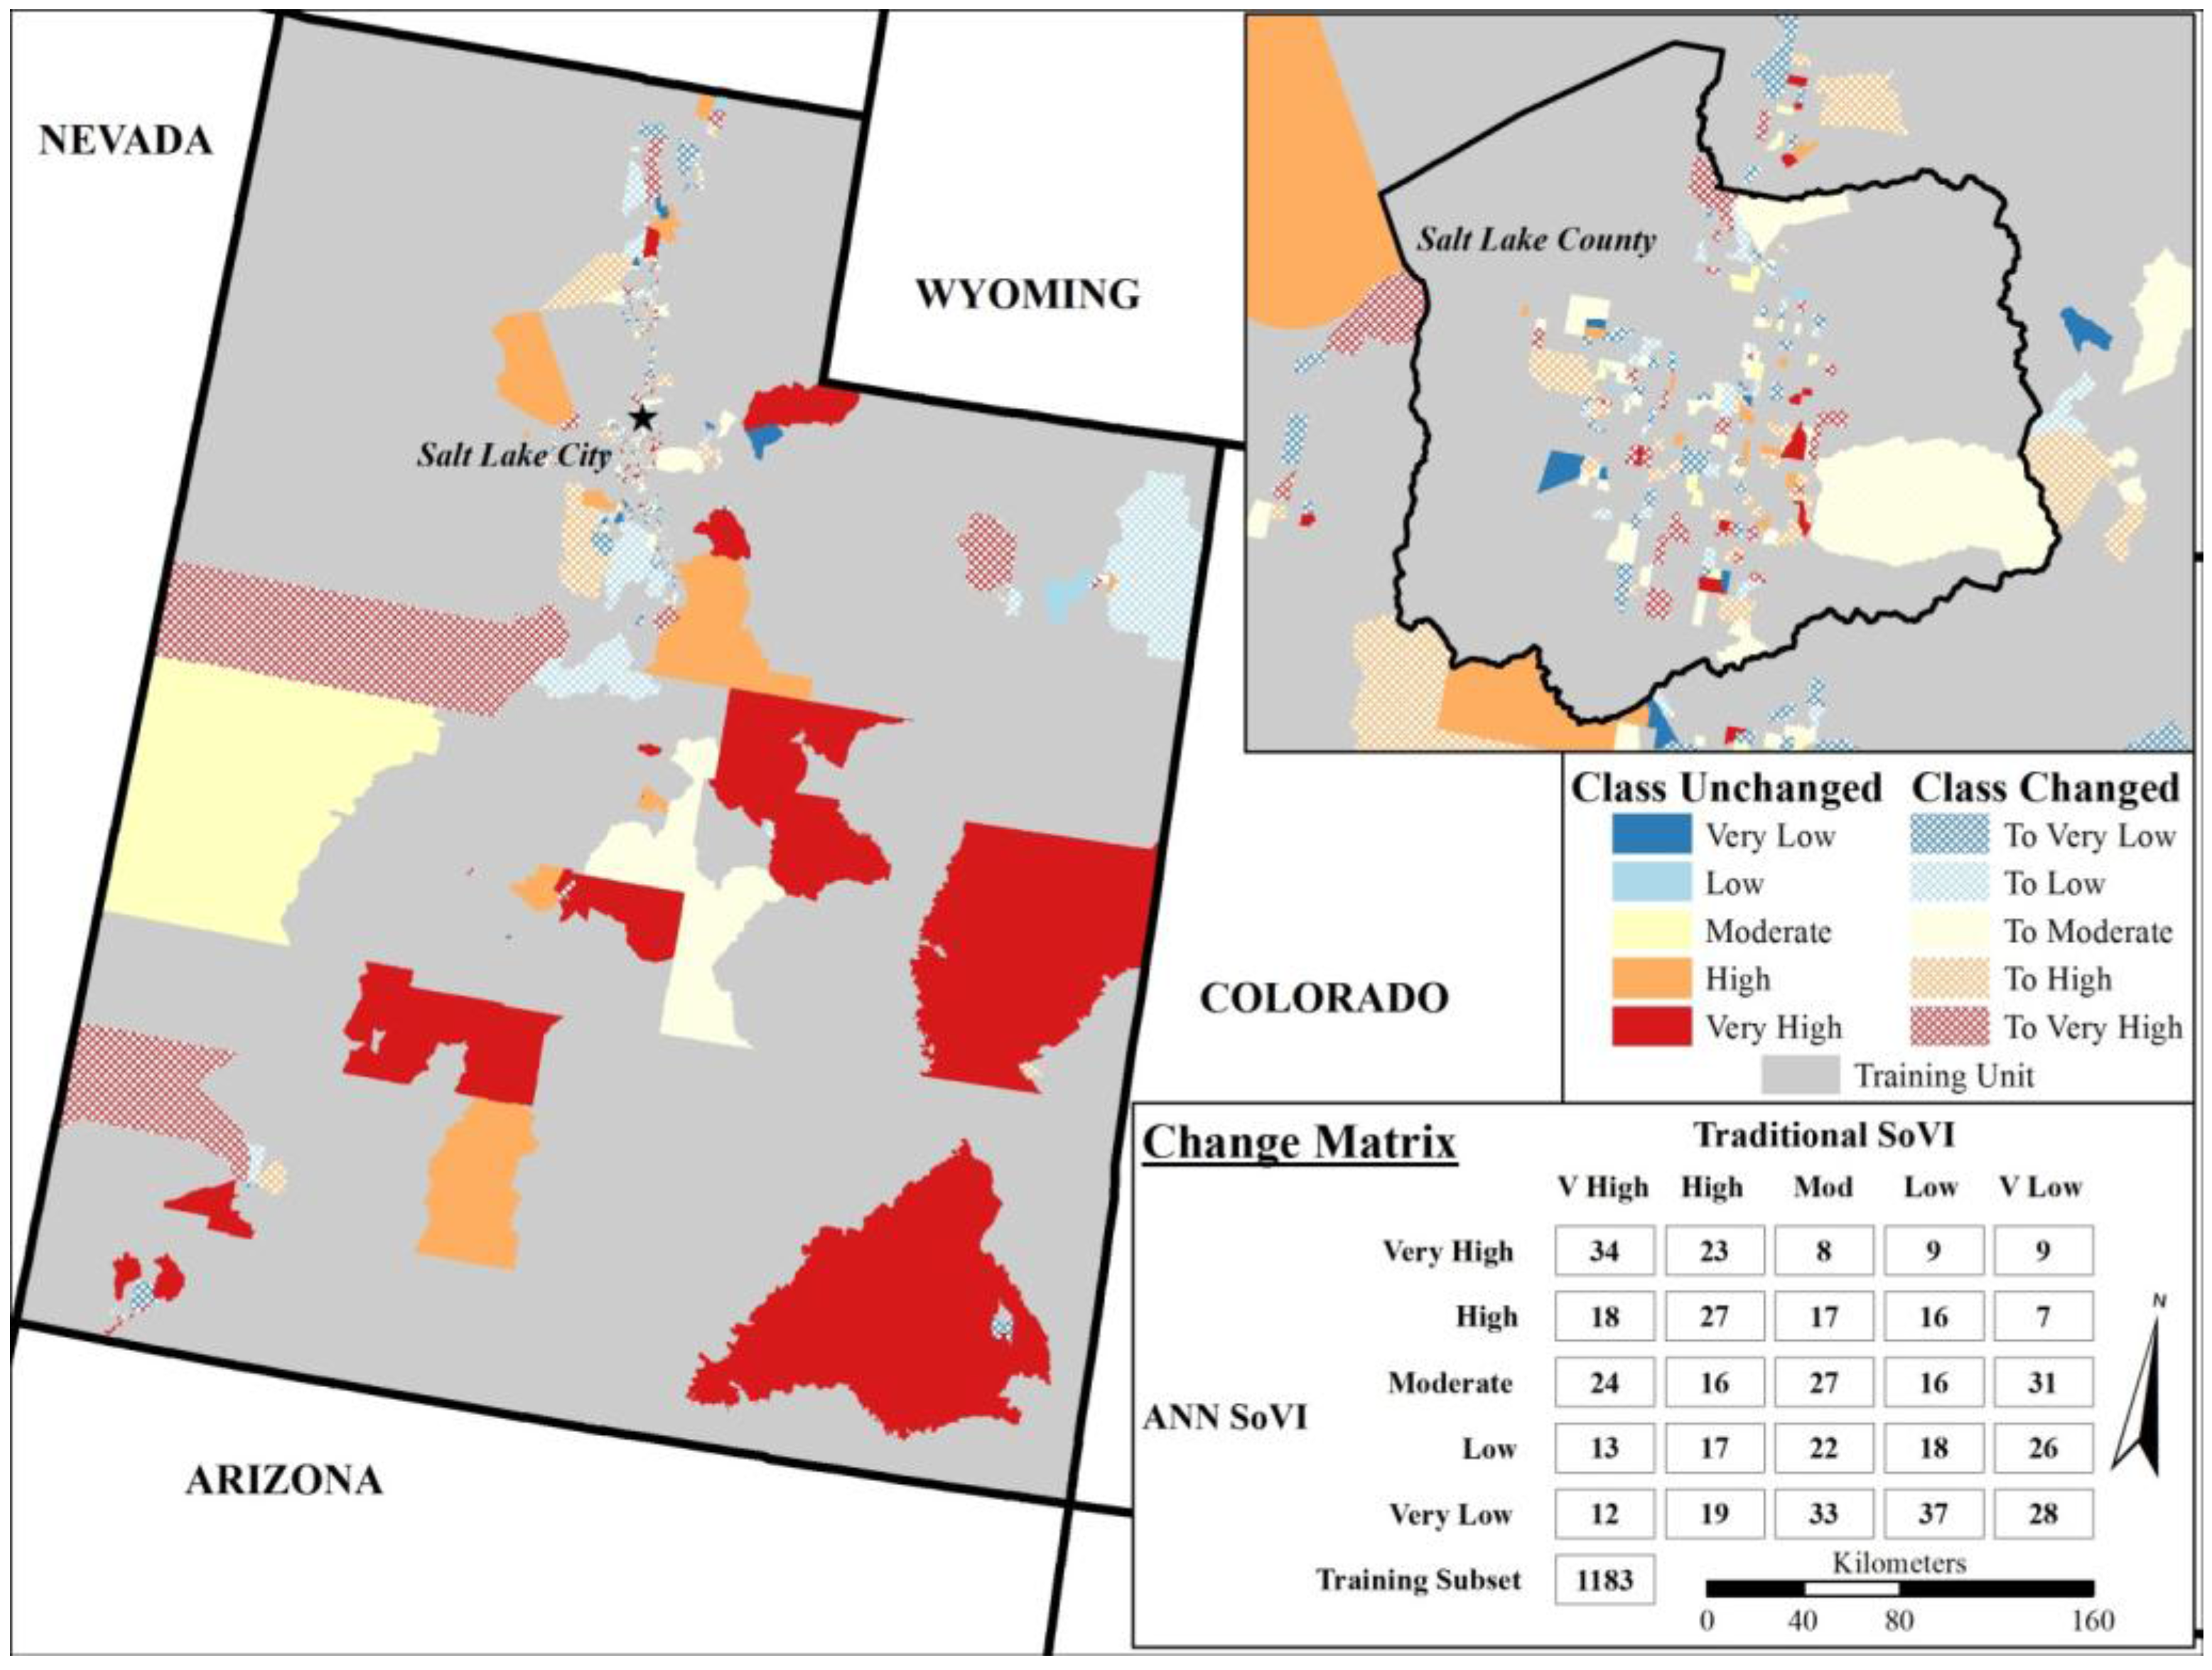
The change detection employed identified a ‘from–to’ relationship between the traditional SoVI and the ANN-extended SoVI. A change detection matrix was created showing which blocks changed between methods and how the blocks were reclassified in the ANN-extended SoVI. The change detection matrix helped in determining the nature of classification between the two methods and visualized the differences between the methods.
The construction of radar plots allowed us to visualize the relative importance of each variable in each vulnerability class for both the traditional SoVI and the ANN-extended SoVI. Comparison of variable handling, the importance of each variable in each vulnerability class, allowed us to assess how both methods classified vulnerability and to determine if significant deviations in variable handling were present.
5. Conclusions
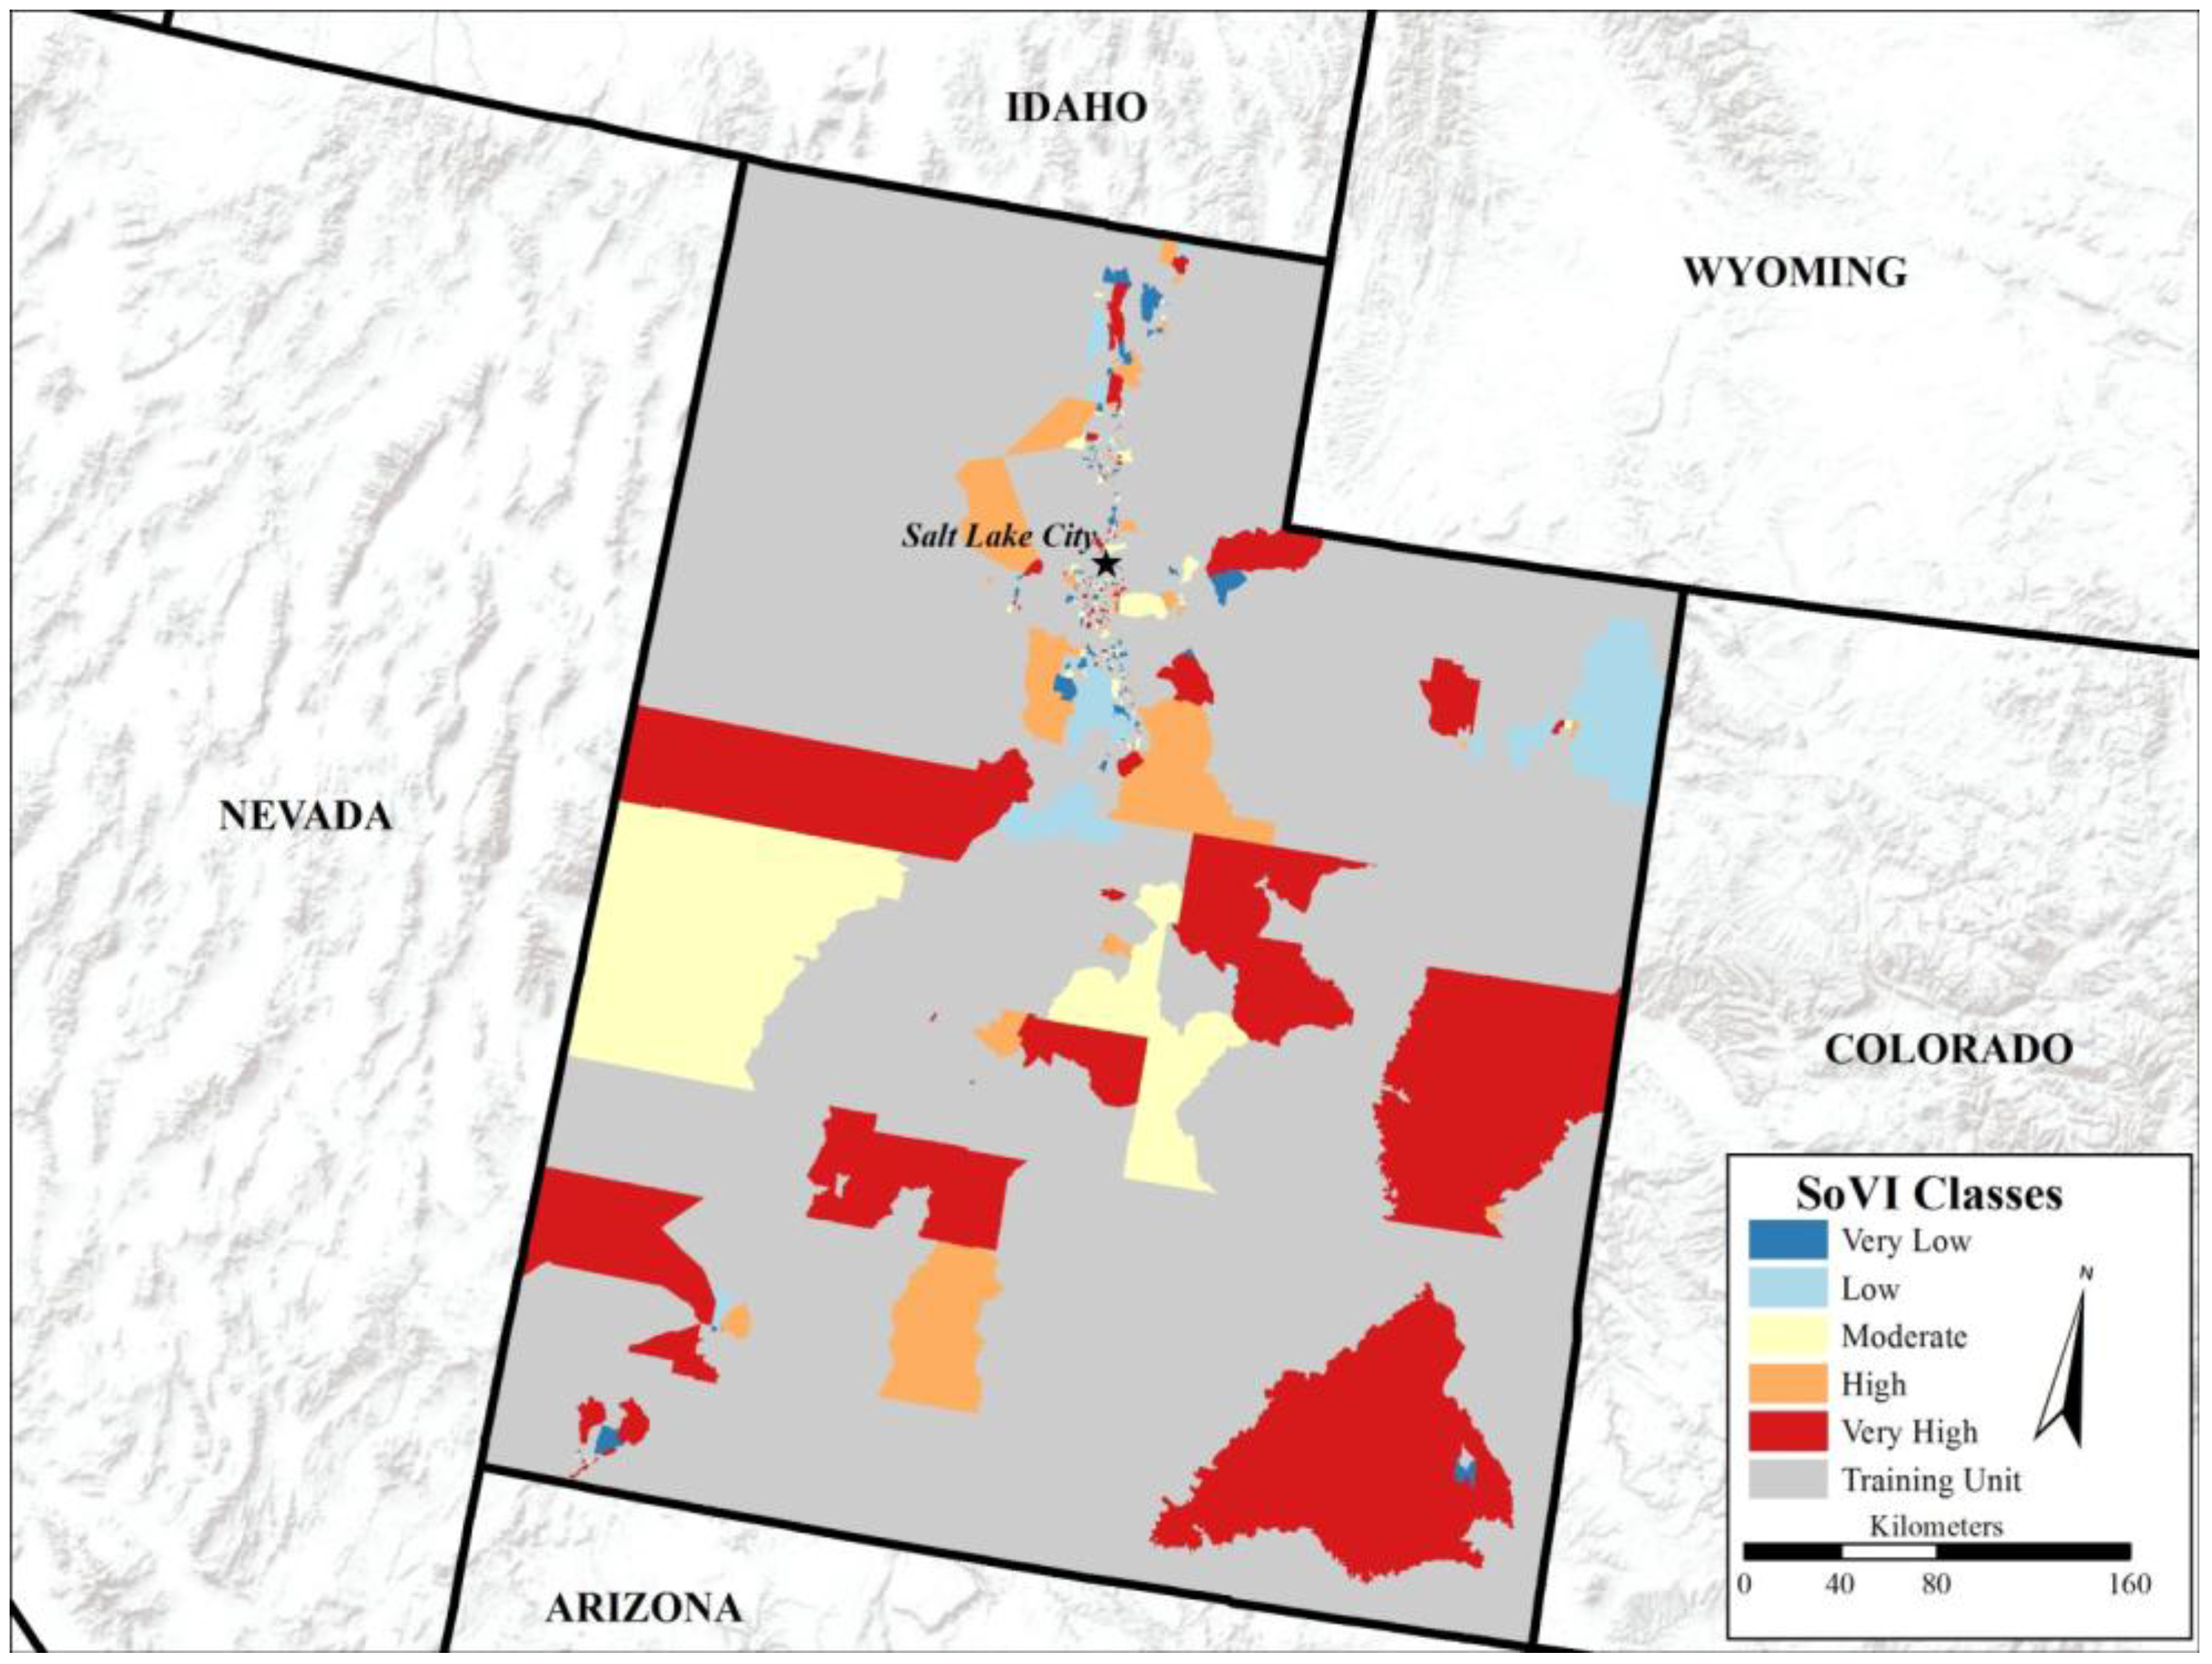
This study compared the traditional SoVI method of vulnerability classification with a modified form utilizing an ANN. Both the traditional approach and the ANN approach produced reasonable vulnerability classifications for the state of Utah with respect to the basic parameterization used for this study. The methods were in agreement for 26% of the common block groups. This partial agreement shows that both methods are capable of identifying some of the same relationships between the input variables; the difference in how relationships were handled demonstrates that the ANN captured non-linear relationships that the PCA could not. Further, agreement between the methods for the invalid block groups, classed as high vulnerability in both approaches, demonstrates cross-method consistency—the ANN was forced to classify the invalid block groups the same as the traditional approach, likely due to the out-of-ordinary nature of variable values for those block groups.
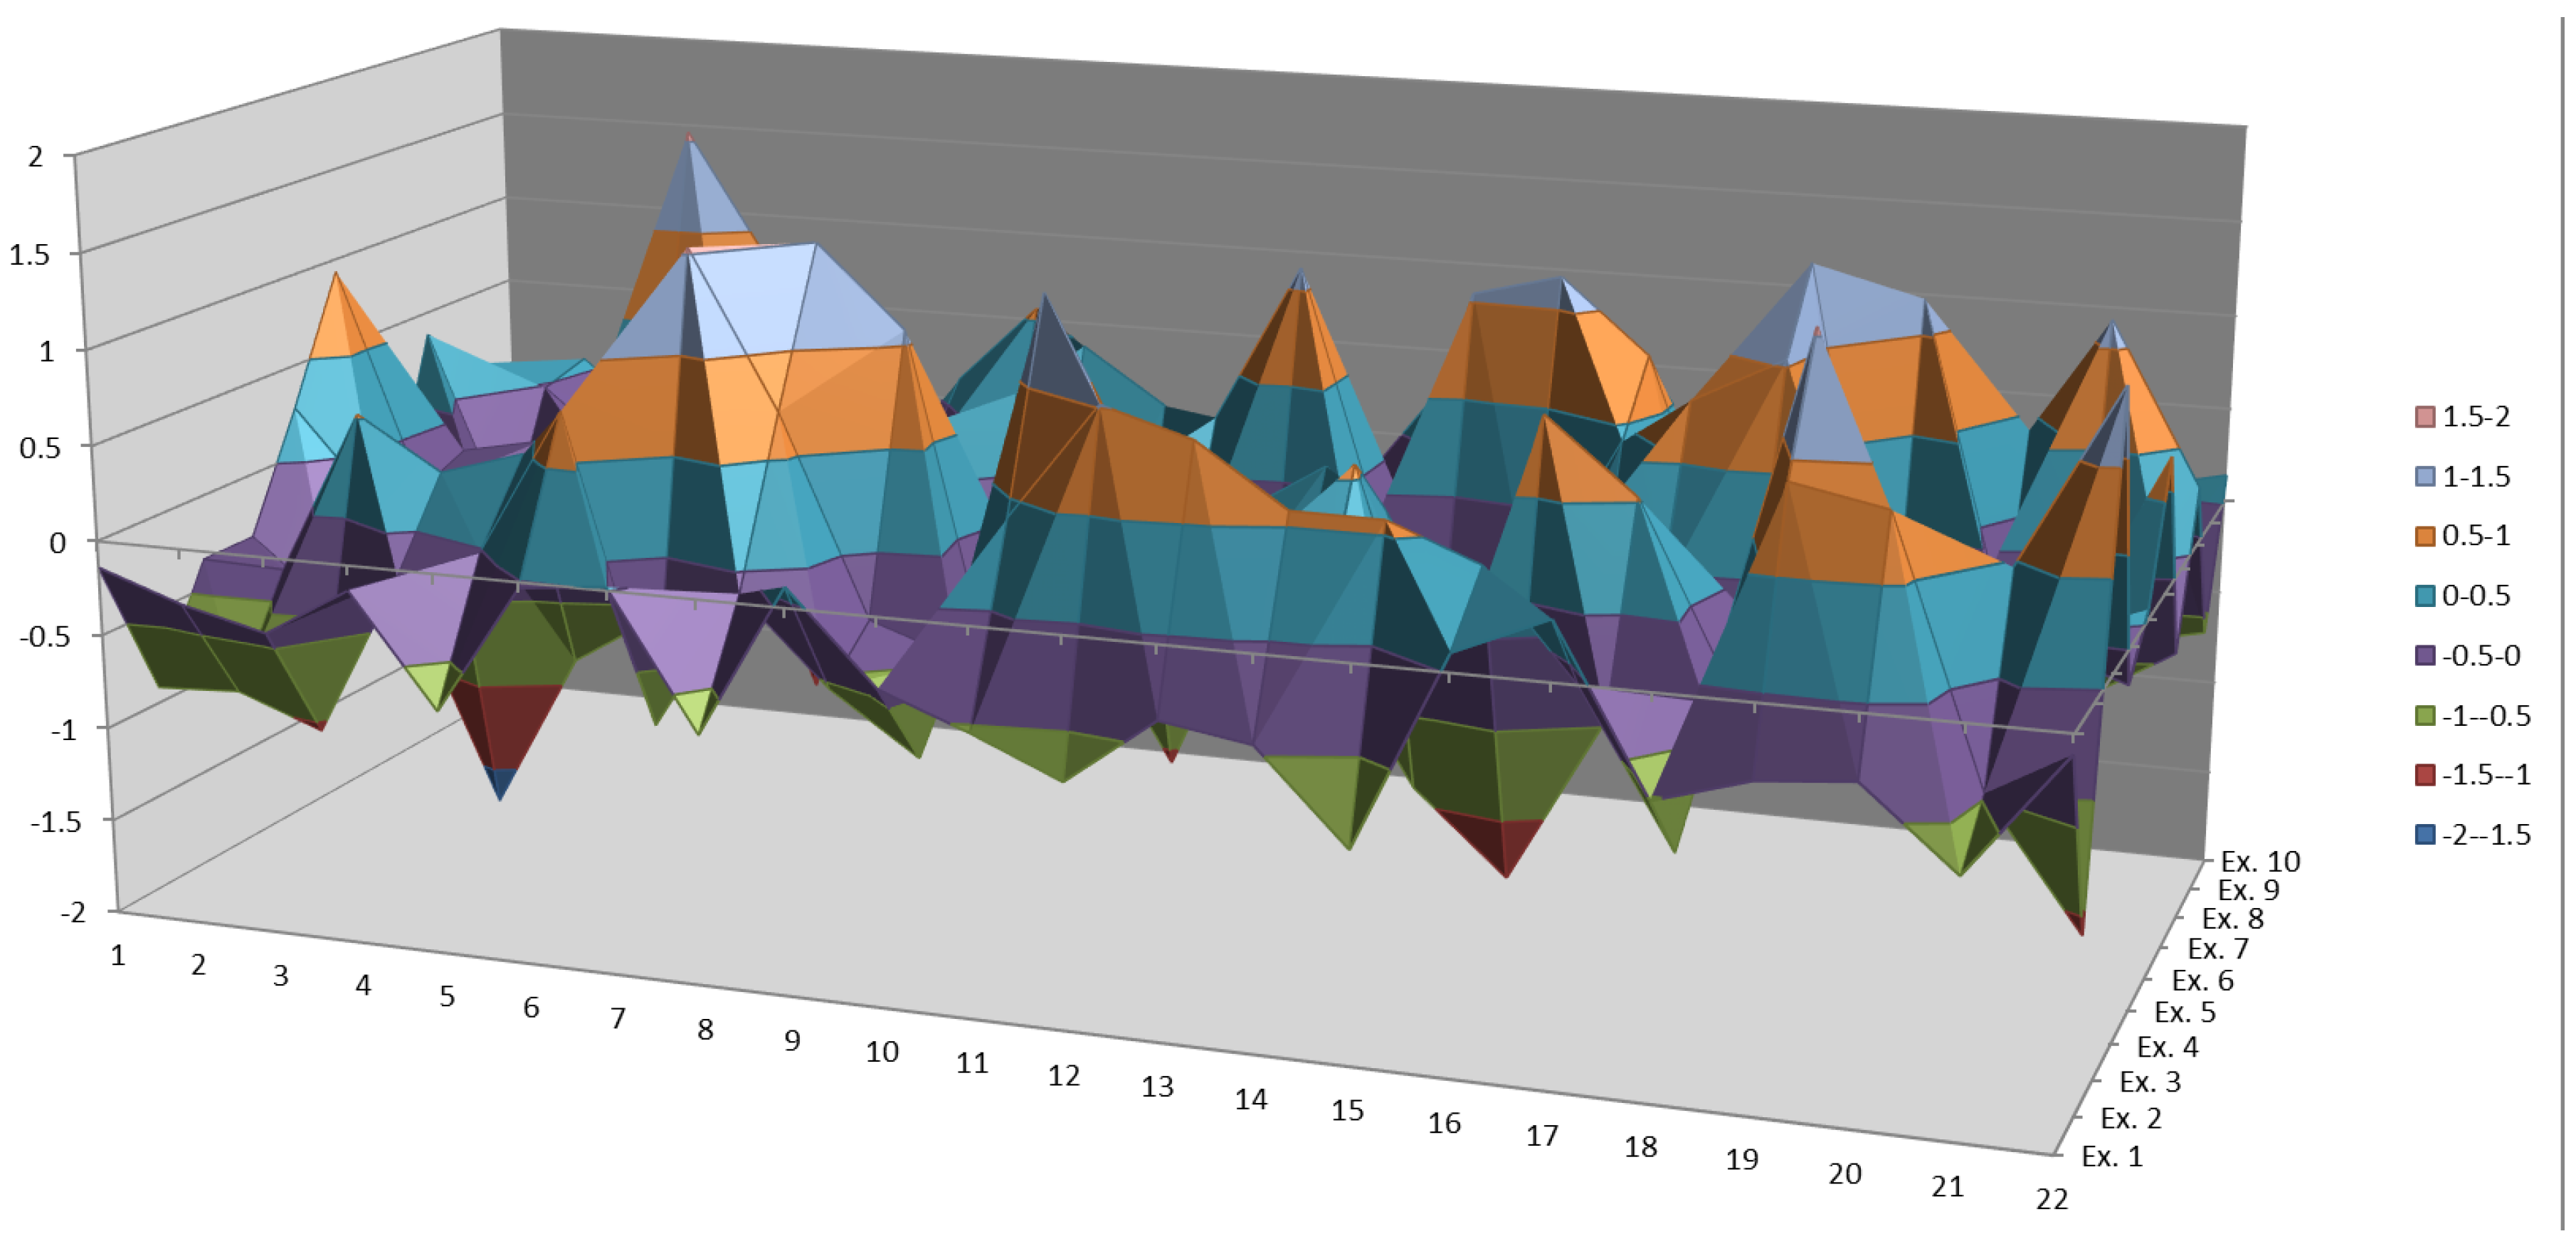
The ANN-extended SoVI demonstrated some bias in classification in the high and very low vulnerability classes, with noticeable differences in how the traditional classification and the ANN classification handled variables for those classes. The radar plots of the social variables for each vulnerability class reveal that the ANN handled the variables for the other three classes similarly to the traditional approach. This internal data-handling consistency between the methods strengthens the finding that the ANN captured non-linearity between the variables, consistent with statements in the literature [
10,
11,
16], as can be seen below (
Figure 8). Consistency between model runs of the ANN further strengthen the classification result, as there was no variation in the results between runs and the convergence was identical in each test run.
Using the methodology outlined in this paper, we can summarize our findings with respect to our study questions. Firstly, the traditional SoVI and the ANN-extended SoVI both produced reasonable results for the state of Utah—the classifications of vulnerability from both methods were reasonable for the population when compared to existing work in the region [
26,
27]. Secondly, the results between the methods were different, but partially consistent. The ANN classified 26% of the classification subset consistently with the traditional SoVI, indicating that both methods were able to capture similar relationships between input variables. However, the ANN classified the remaining subset differently, in some cases to one vulnerability class away from the original (e.g., from very high to high). Analysis of the variable tendencies in the vulnerability classes for both methods (using the radar plots) shows that both methods handled the variables in largely the same way, with some notable differences. The divergence between the two methods indicates that the ANN was able to capture non-linear relationships in the variables which were not captured with linear PCA. Finally, because the ANN did capture non-linearity in the variables for its classification, the ANN should be a viable pathway to enhancing the way SoVI is constructed in the future, and could be useful in other quantitative vulnerability assessment methodologies. The consistency between the methods shows that the ANN was able to capture the linear relationships identified with PCA, which means that the strengths of the PCA method can be preserved when using an ANN. Invalid data, however, presents problems for both methods, despite the strength of consistency found using invalid data; analysts will need to be vigilant to ensure quality data is used when using the ANN, as is the case with the traditional approach.
Figure 8.
Evidence of non-linear relationships between the input variables. Ten examples were selected: two of each class from the traditional SoVI that changed to the two most distant classes in the ANN-extended SoVI (e.g., one high to low, one high to very low, one moderate to very high, etc.).
Figure 8.
Evidence of non-linear relationships between the input variables. Ten examples were selected: two of each class from the traditional SoVI that changed to the two most distant classes in the ANN-extended SoVI (e.g., one high to low, one high to very low, one moderate to very high, etc.).
The methods to explore the use of ANN to enhance the SoVI method outlined in this study demonstrate that this approach can produce a viable alternative to the well-established approach to creating a SoVI for a region. Indeed, the ANN retains the strengths of the existing method with few of its weaknesses, in addition to its own strengths, particularly the handling of non-linear data-relationships. Further exploration of this method will demonstrate how capable the ANN can be for SoVI analysis, as well as how it may best be implemented for creating a SoVI. Future exploration of implementing an ANN in other vulnerability assessment methodologies has the potential to progress the field of vulnerability assessment as a whole.


