1. Introduction
Reproducibility is a fundamental requirement of science. Scientists need access to all tools used in published research to fully reproduce and verify results and conclusions. If the software used in a research study is a “black box” and the code and algorithms cannot be scrutinized, then the results will not be verifiable and reproducible in the long run. Therefore, in science, the use of free and open source software has been considered a high priority (and often stated as mandatory by funding agencies), as it is fully transparent [
1,
2] and more accessible for institutions, individual students and scientists than proprietary software [
3].
The emerging field of open science calls for greater transparency and free sharing of knowledge, methods, data and code, so that science is accessible to all. By requiring open source software, data and access [
4], open science approaches ensure that scientists have access to the same methods, data and code used in a published study. Open science perspectives, such as open access and open data, are being increasingly adopted in research, but free and open source software is surprisingly less reflected in universities’ educational programs, despite its wide adoption in industry [
5,
6].
Open software, open data, open standards and open education are the key components of the open GIS framework proposed by Sui [
7]. There is great demand for open geospatial education, as spatial thinking and GIS concepts can be applied across disciplines. The popularity of massive open online courses (MOOC) is growing [
8], including those focused on open geospatial education [
9] and free and open source geospatial software [
10]. Open education concepts, such as accessible teaching materials and the usage of free and open source software, are not limited to online courses and have also been applied to traditional on-campus education [
11]. Several educators have suggested that open education concepts should be applied throughout the geospatial curriculum [
12].
The application of geospatial concepts should be emphasized in education more than software-specific tasks. If students understand not only the implementation, but also the underlying science and technology, then they will be able to do better research and develop more flexible solutions. However, students who learn and use particular software packages as part of their classes inevitably mix general concepts with software-specific implementation. Teaching a diverse set of software packages may help to untangle the general concepts of geospatial analytics from software-specific features and issues. Free and open source software readily allows students to compare how scientific tools are implemented in different software packages; it is harder to make such comparisons when using proprietary software, because the source code and algorithms are concealed [
13]. Moreover, easy access enables students to explore new technologies without requiring the university or their instructors to provide the software. This is especially beneficial for project-based classes and independent studies where students solve real-world problems in which unique or custom capabilities are required.
Throughout this paper, we use the term free and open source software (FOSS) in which “free” stands for software freedom as defined by Stallman [
14] and “open source” stands for a type of development model [
15]. Proprietary software refers to software developed and licensed by a particular software vendor. It is sometimes referred to as commercial or enterprise software, which is incorrect, because both proprietary software and FOSS can be used commercially and in enterprise settings.
In this paper, we begin with an overview of newly-developed educational concepts and the associated online resources for courses in geospatial analytics at North Carolina State University (NCSU). These courses combine FOSS GIS and proprietary GIS to emphasize general concepts and techniques in geospatial science [
16]. The NCSU OSGeo Research and Education Laboratory (OSGeoREL), established in 2012 as the founding member of the world-wide GeoForAll initiative in North America [
17], provides the infrastructure to update and redesign teaching materials, expand courses and incorporate the latest visualization and collaborative technologies in classes.
In Section 2, we describe the design of our courses, including the technical solution for our teaching materials used by both on-campus and distance education students. Section 3 describes several examples of these courses. We conclude with a discussion of our experience offering open science education, and we outline future directions for moving the field forward.
2. Approach to Course Design and Implementation
The general concept for integrating FOSS into geospatial information science and technology (GIST) education was inspired by common real-world situations when GIST professionals need to combine various software tools and techniques to solve complex problems. This approach was used to develop graduate level geospatial science courses serving Master of Science (MS) and PhD students in the NCSU GIST program, as well as the students from a broad range of disciplines, such as natural resources management, Earth systems (marine, Earth and atmospheric sciences), landscape architecture, civil engineering and anthropology. The courses are designed for students with very diverse sets of skills and backgrounds and can be taken on-campus or through the NCSU distance education program.
2.1. General Course Design
The courses have three standard components: lectures, in-class assignments with homework and a project. The lectures are software independent (to the extent possible) and focus on concepts, methods and algorithms. Each lecture is accompanied by a hands-on assignment to demonstrate the implementation of the concepts presented in the lectures in two software packages: the FOSS package GRASS GIS and the proprietary package ArcGIS. This teaching model gives students the opportunity to improve their knowledge of software that they already know (as most students taking the courses are already familiar with ArcGIS) and, at the same time, challenges them with different software that uses a similar, but not identical approach and solves some of the tasks using different algorithms. Our goal is to ensure that students can more easily distinguish between GIS concepts and the specifics of GIS software, become true experts in GIS, rather than a particular software, and become more flexible when choosing solutions for their independent work in the future.
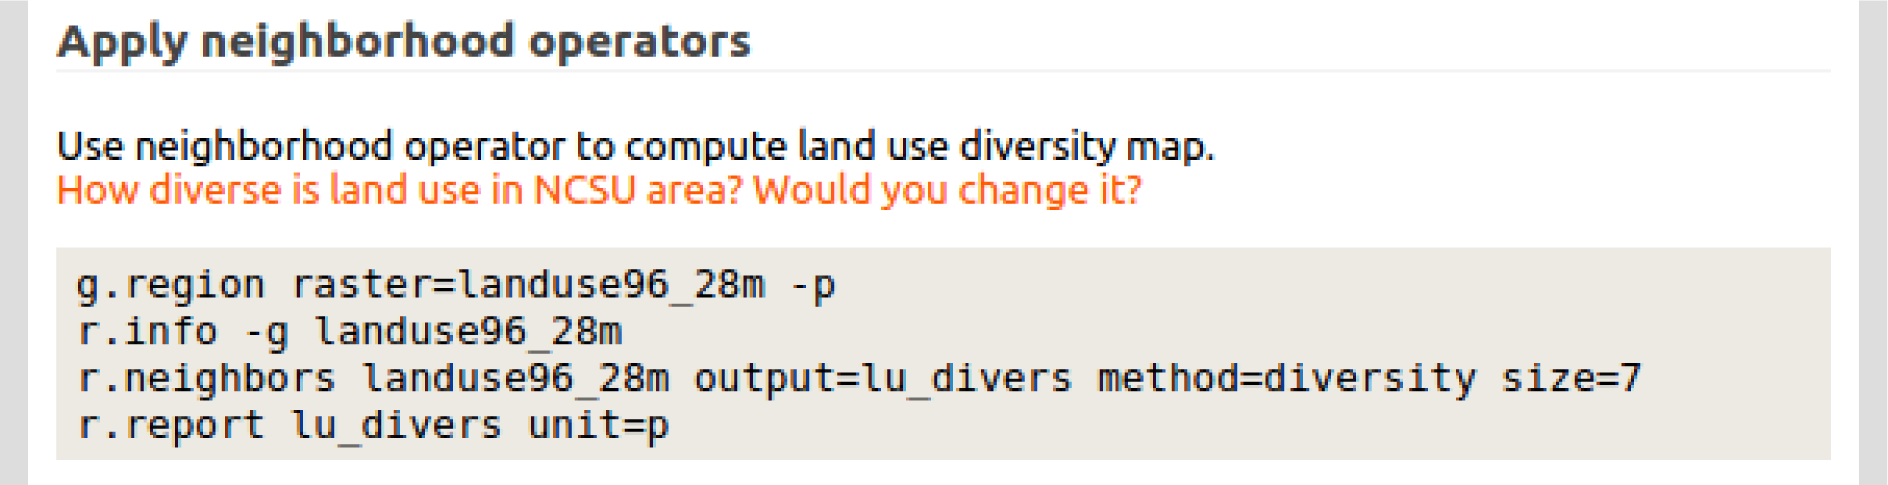
One of the important assignment features is a flipped approach. Rather than giving the students a task for which they are supposed to find a workflow, the students are given step-by-step instructions for a workflow (see
Figure 1), and their task is to explain what this workflow does, which methods or algorithms are used and then to interpret the results. Small experiments that require the design of independent workflows are also included. The assignments are then submitted in the form of short papers. Each paper includes a software-independent section describing the methods and techniques used in the analysis and results in the form of graphical output with relevant interpretation and evaluation. The software-specific issues are addressed in a special subsection of the discussion, so software is not ignored, but rather clearly distinguished from the data and methods.
The midterm exam includes the design of independent workflows for given geospatial problems; students can implement their workflows in either GRASS GIS or ArcGIS. It is not unusual for students to do at least part of the exam in both. Most of the independent work in the courses is performed in the course project, which starts early in the semester. The students can use any suitable software, as along as they are working on a project related to the course material or their thesis.
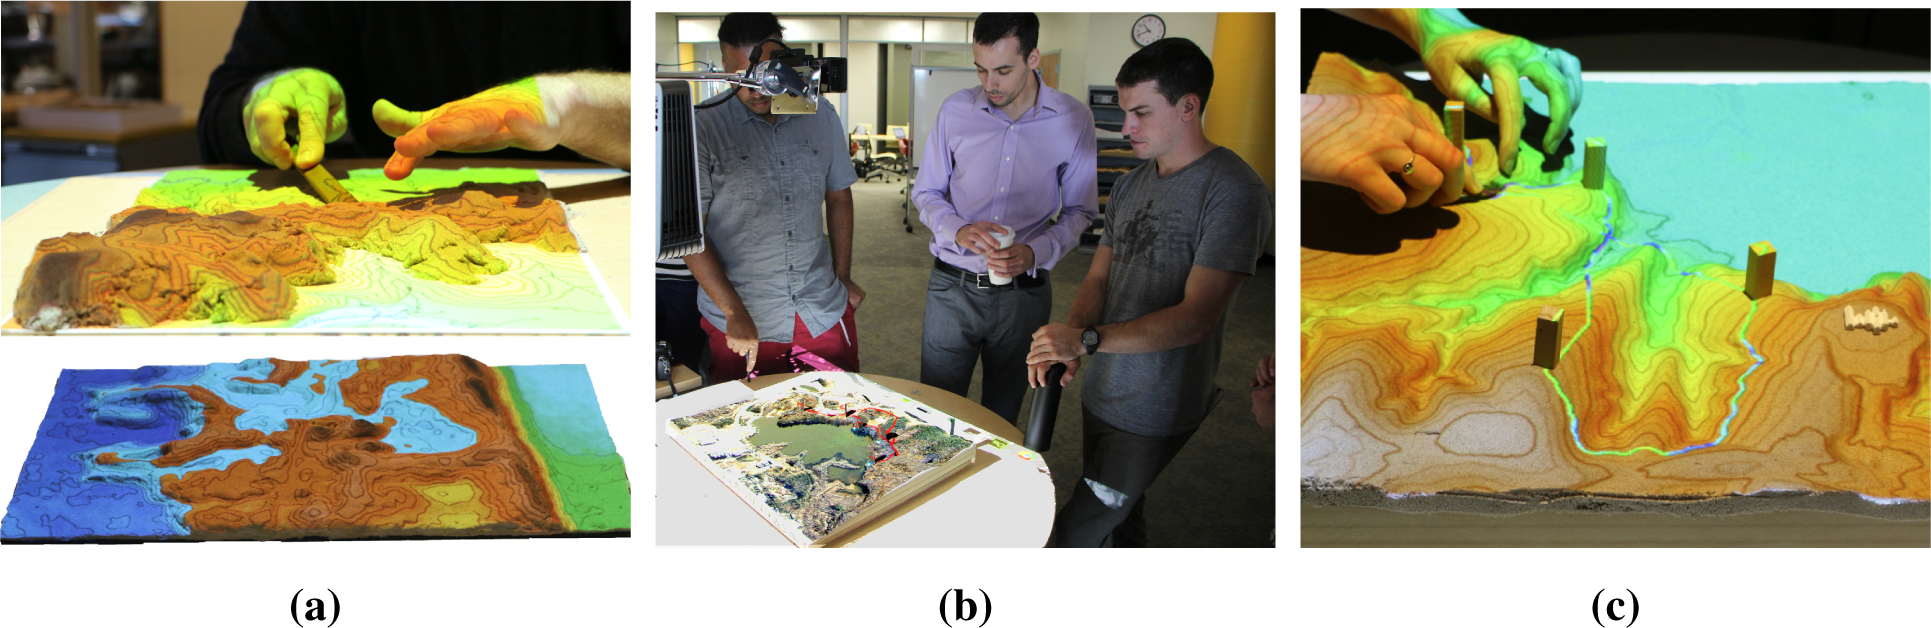
In the more advanced courses with smaller numbers of students, we experiment with emerging visualization and human-computer interaction technologies with special focus on dynamic landscape processes. Examples of the technologies explored by students in their projects include Tangible Landscape [
18], panoramic visualization and eye tracking.
2.2. Educational Content Management
Currently, there is no standardized system for publishing and sharing course material in geospatial science and technology. One of the few examples of a sustained effort is GIS e-learning project GITTA [
9], which is largely limited to the contributors from the Swiss universities. The newest MOOC effort by GeoAcademy [
19], described in this issue, is one of the most promising current developments. Based on the past efforts and discussions in the OSGeo education community [
20], it appears that it would be difficult to fulfill the needs of the very diverse worldwide community of GIST program educators using any single technical solution. Repositories of FOSS geospatial education content, such as ELOGeo [
21] or the OSGeo Educational Content Inventory [
22], provide many valuable contributions, but without collaborative and versioning infrastructure, the material becomes obsolete relatively quickly.
Thus, in order to share and collaboratively develop educational content, standardized formats and collaborative environments are important. Often, more than one instructor and their teaching assistants work on the course material. Thus, managing the content in a revision control system, a practice widely adopted for software development by FOSS projects, offers several advantages. It facilitates collaboration, includes a full history of changes and inherently supports the reuse of the materials, either by the author (for example, for a different course with customized modifications) or by others in the community if the repository is public.
The easiest way to share source material for courses with others is through revision control hosting services such as GitHub, GitLab or Bitbucket. These web-based tools together with desktop graphical tools make revision control systems accessible for users who are not familiar with using revision control tools in the command line. We use Git as a revision control system, because it allows us to work offline and to easily switch hosting providers for remote repositories. We use a remote repository hosted at GitHub because collaboration is a priority for us and GitHub is well established in the FOSS community. It is important to say that with Git vendor lock to any particular hosting service is minimal due to the fact that everything is also stored locally.
2.3. Teaching Material for Assignments
The common revision control systems are designed to work best with text files, and thus, the formats should be text-based, not binary. The text files are independent from specific text editors; therefore, they can be changed by anyone, anytime, even if the original software used to create them no longer exists. Text files are also easy to modify using scripts.
We have considered several formats for text documents,
i.e., markup languages, including LaTeX, DocBook, reStructuredText, Markdown and Textile (see the
Appendix for a more complete discussion on format selection). After careful evaluation of these options, we decided to keep our teaching materials as a set of HTML files. This allows us to publish our material as a website and to take full advantage of HTML capabilities, such as CSS classes. The fact that our old course materials were already in HTML also contributed to this decision and made the transition easier. Eventually, our goal is to use the HTML5 standard, although not all of our pages have the correct HTML5 semantics yet.
The assignments are managed in individual files, which include only the assignment text component of the HTML documents. The sections of the HTML documents that are common to all pages (e.g., navigation) are kept separately, and we use scripts in Bash and Python to create a complete HTML document. The script builds a static website, which does not require any server-side application, so it can be published anywhere. We use a dedicated university server for courses, but the static pages can be published also using solutions, such as GitHub pages or websites on Bitbucket.
Our solution with custom scripts requires several steps to produce the web pages, but for the simple pages for which we are aiming, the amount of work and complexity is very low. More importantly, the scripting allows us to add new features. For example, we have developed a script that extracts examples from GRASS GIS assignments, which are then converted into a script executable in GRASS GIS. The script allows us to efficiently test all examples in assignments for each new release of GRASS GIS. This proved helpful when several module parameter names were changed just before the release of GRASS GIS 7. We also use the scripts to ensure that everything published on the website is also stored in a repository, i.e., the script for publishing checks that proper revision control commands were executed. Custom scripting allows us to accommodate different formats, such as reStructuredText, in the future.
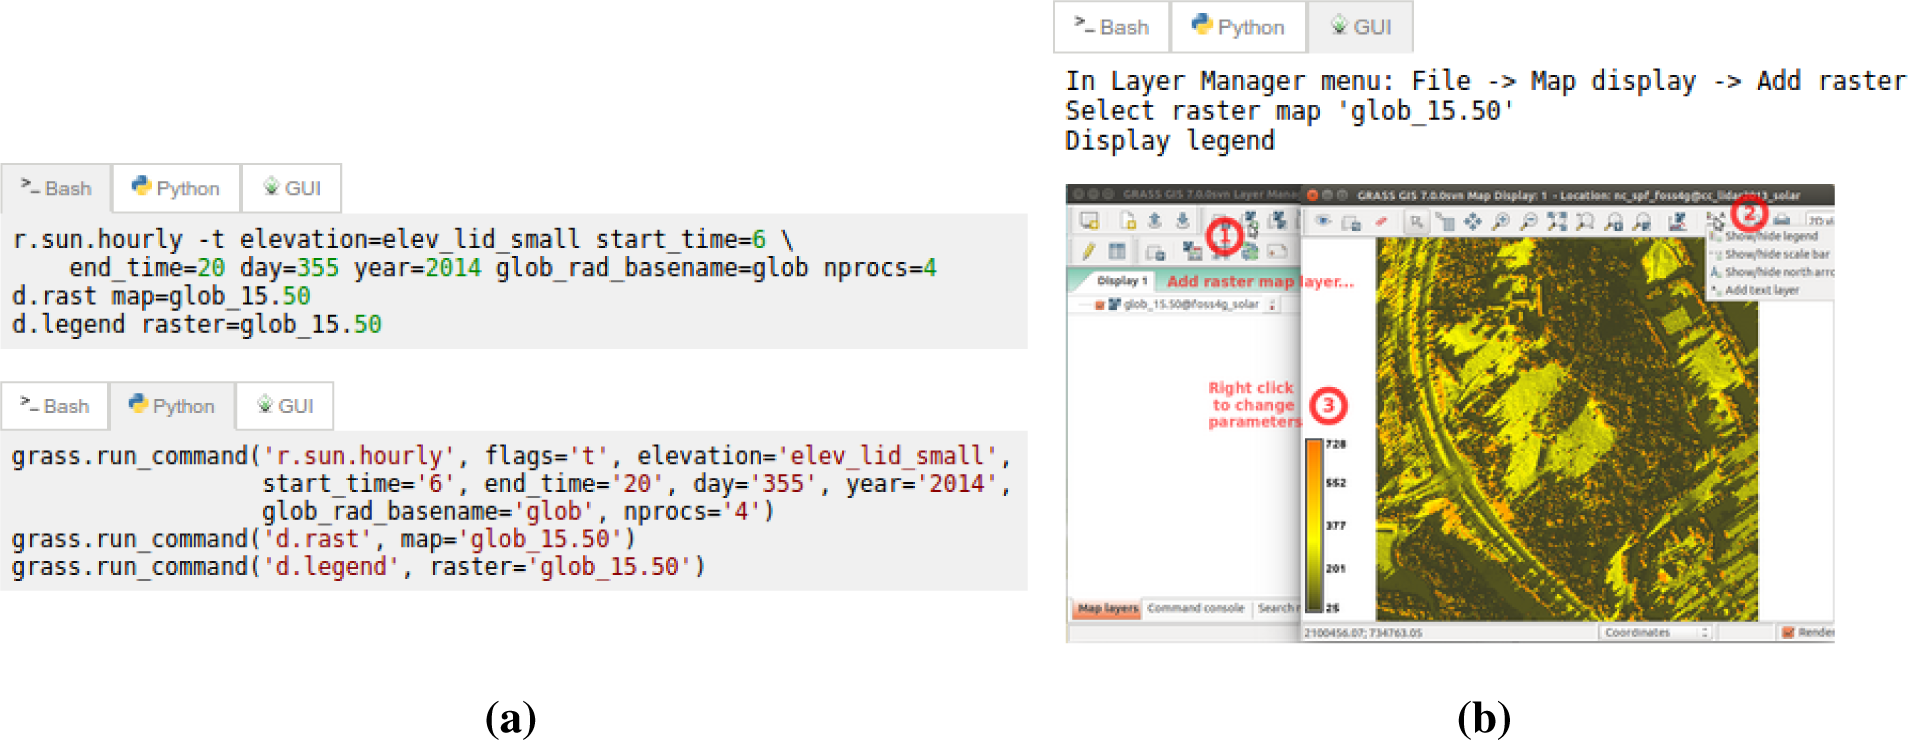
Using HTML for both source and published material gives us the opportunity to use more sophisticated HTML formatting and JavaScript for interactivity. For example, in one of our tutorials, we show students how to do the same operation in the GRASS GIS command line, using the Python API or the graphical user interface. The page then consists of a general text description followed by an example box with tabs to switch between the different methods (
Figure 2). This shows students several possible ways to interact with the software and may help them to transition between these approaches. For example, students can learn how to develop a Python script from a series of commands. The same method could be applied to provide instructions for different software packages.
2.4. Teaching Material for Lectures
The choice of format and technology for lecture materials is not straightforward; it depends on the focus of the lectures, as well as personal preferences. Besides the standard desktop presentation tools, HTML5-based presentations and various cloud-based presentation services are being used more frequently. Our lectures were originally prepared in the PPTX format using PowerPoint and are available as presentation slides, as well as a screencast of the presentation accompanied by audio. The current format for slides has serious limitations in terms of updates and collaborative development, and thus, several options have been considered for redesigning the lecture material (see the discussion of different formats and tools, such as LibreOffice, LaTeX and HTML5, in Appendix 5).
We decided to use HTML5-based presentations, since they are plain text files and HTML5 supports dynamic and interactive content, including animated pictures, video files, automatically highlighted code, equations (through MathJax) and even embedding websites. HTML5 presentations, such as Reveal.js, lack the ability to freely position elements on a slide or add decorations, such as arrows connecting text and pictures, in a simple way. Today, however, lecturers can take advantage of touch screens and use a stylus to draw directly on the slides to make their presentations more engaging for students. Based on these considerations, we are currently experimenting with the open source presentation framework Reveal.js to see whether it is suitable for our lectures. We created a set of templates for different slide layouts, so that only a basic knowledge of HTML is needed to create presentations with images and text in different positions.
2.5. Licensing
When sharing teaching materials, the choice of license is critical, since choosing an inappropriate license or not stating the license at all prevents others from using the material. There are standardized licenses that support sharing; Creative Commons (CC) licenses are the most used ones. Among the CC licenses, the best for sharing open education teaching materials are the Creative Commons Attribution-ShareAlike (CC BY-SA) and the Creative Commons Attribution (CC BY). The other CC licenses, such as the Creative Commons Attribution-NonCommercial-NoDerivs (CC BY-NC-ND), do not allow modification or commercial use and, thus, conflict with the values of FOSS, such as the freedom of reuse. We share both the material and the source files under the CC BY-SA license.
3. Course Implementation
The core components of the presented approach have been used to develop three courses focused on geospatial analysis, modeling and design.
3.1. GIS/MEA582: Geospatial Modeling and Analysis
The first course based on this concept, Geospatial Analysis and Modeling, was offered in 2008 and started as an on-campus special topics course with a small enrollment of 10 students. The distance education section was added in 2009, and today, the number of students has grown to around 50 per semester. It is one of two choices for a mandatory, core course in the GIST MS program and serves as an elective in several MS and PhD programs across NCSU colleges.
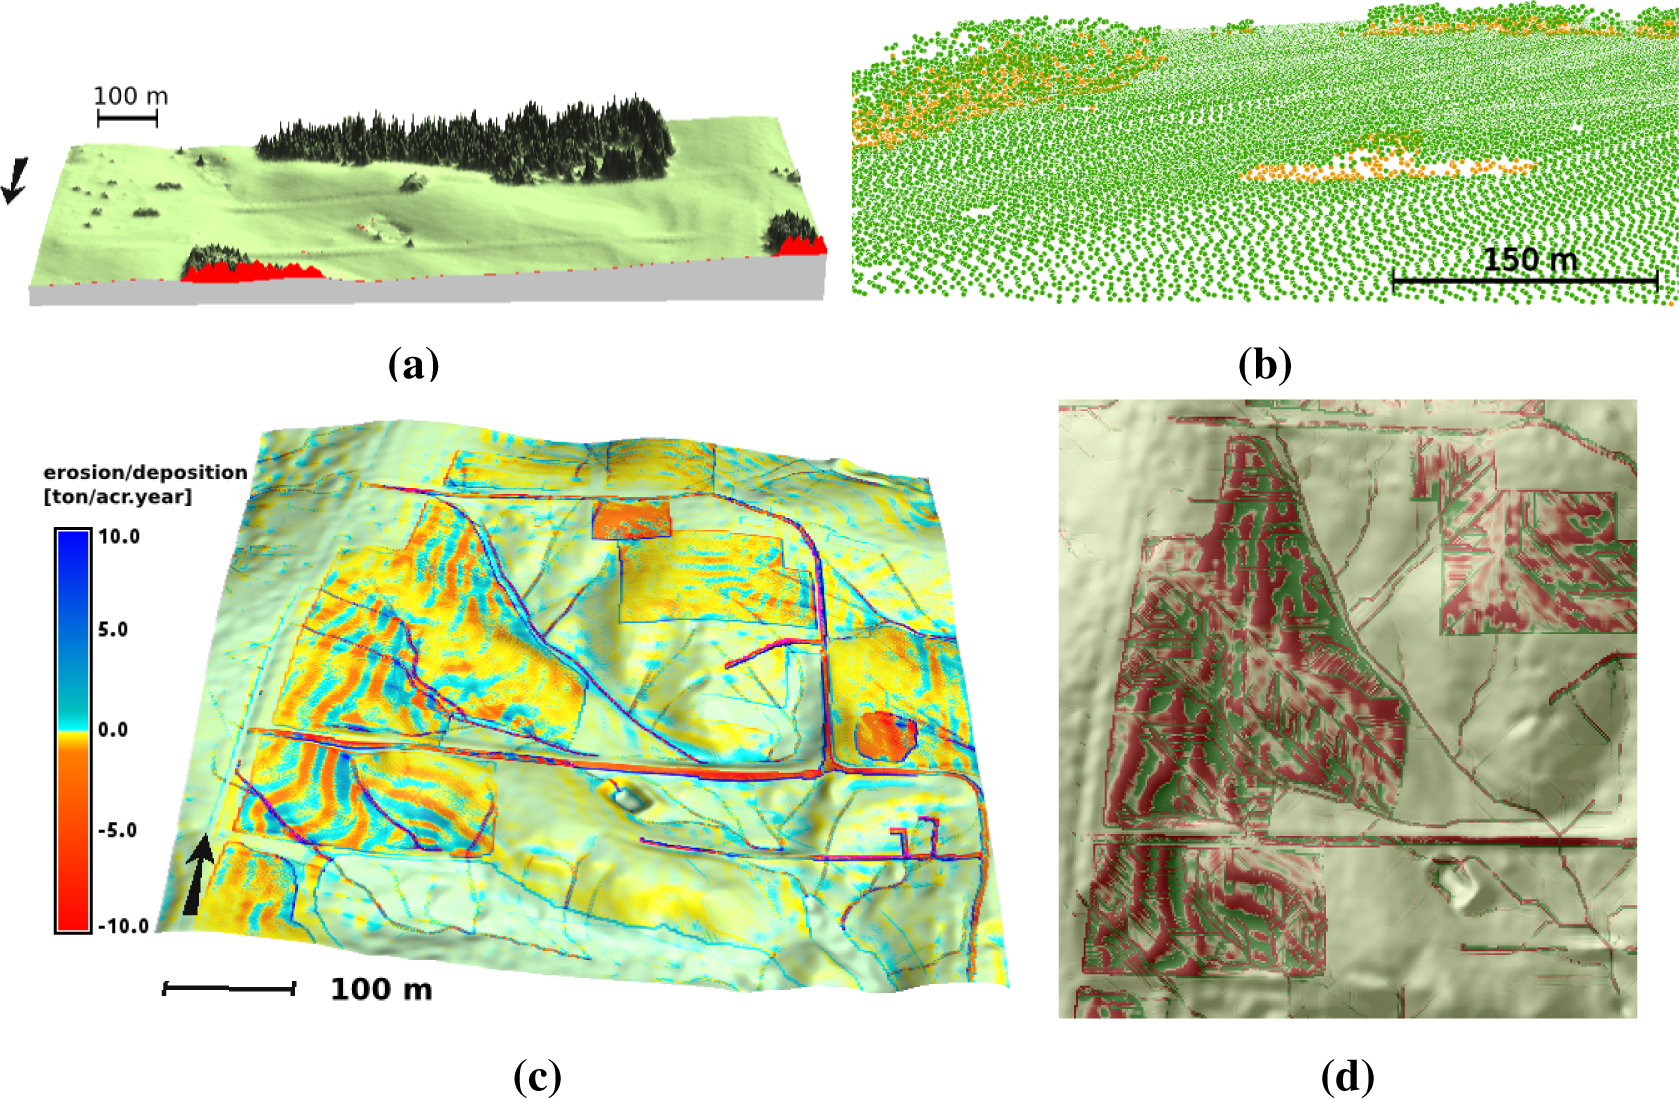
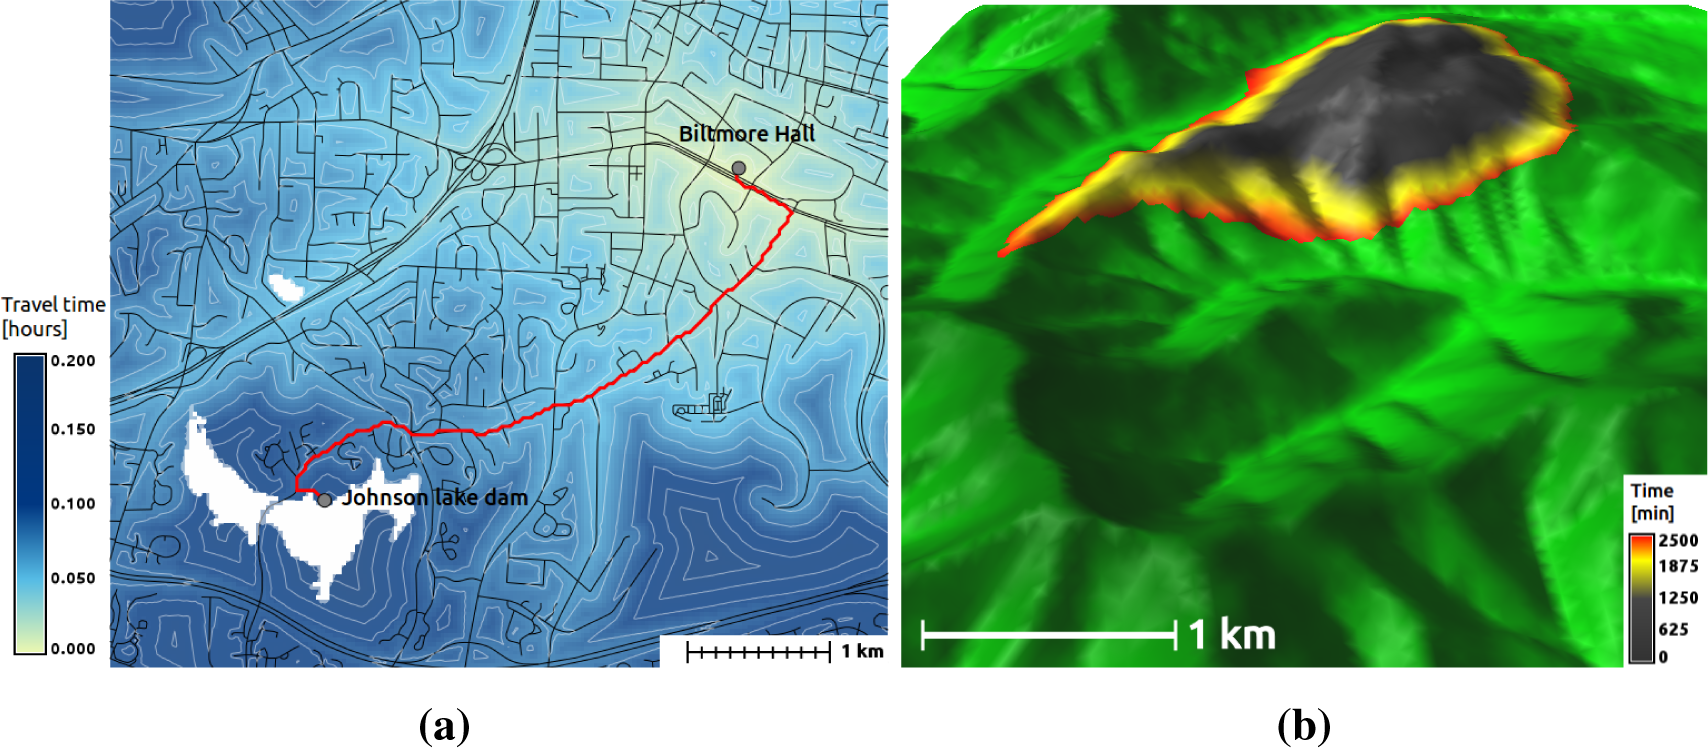
While the course topics are relatively stable, the teaching material is very dynamic, with assignments updated every semester based on the latest software releases. The topics covered include the digital representation and analysis of geospatial phenomena represented by continuous fields with a special focus on cost surfaces, terrain modeling, geomorphometry, watershed analysis and introductory GIS-based modeling of landscape processes. Perspective 3D visualizations and working with LiDAR data are an integral part of the course material.
Figures 3 and
4 show examples of students’ course work.
The take-home midterm exam consists of theoretical and practical sections. In the practical part, students develop their own workflow using ArcGIS, GRASS GIS or both to solve a given task. Project topics are typically chosen by students depending on their interests or masters theses research and, include, for example, the estimation of solar radiation and energy potential, coastal applications related to beach erosion or sea level rise, hazard mapping, designing trails using cost surfaces and, also, occasionally, free and open source software development or testing.
On-campus sections are offered in a collaborative classroom with groups of students clustered around tables equipped with a computer with a large screen. Most students, however, use their own laptops, running GRASS GIS on different operating systems, including Microsoft Windows, Mac OS X and various Linux distributions. FOSS enables students to continue using the software installed on their computers, even after they have finished their university studies.
The online course material includes lecture slides with audio and associated assignment workflows used by both distance education and on-campus students. The course website with all of the assignments was redesigned to improve navigation, readability and management of content. Students can interact with the instructor and teaching assistants through a private forum set up for the course, and they get feedback on their assignment reports and their project progress. The course is available at
http://courses.ncsu.edu/gis582/common/.
3.2. GIS595/MEA592: Multidimensional Geospatial Modeling
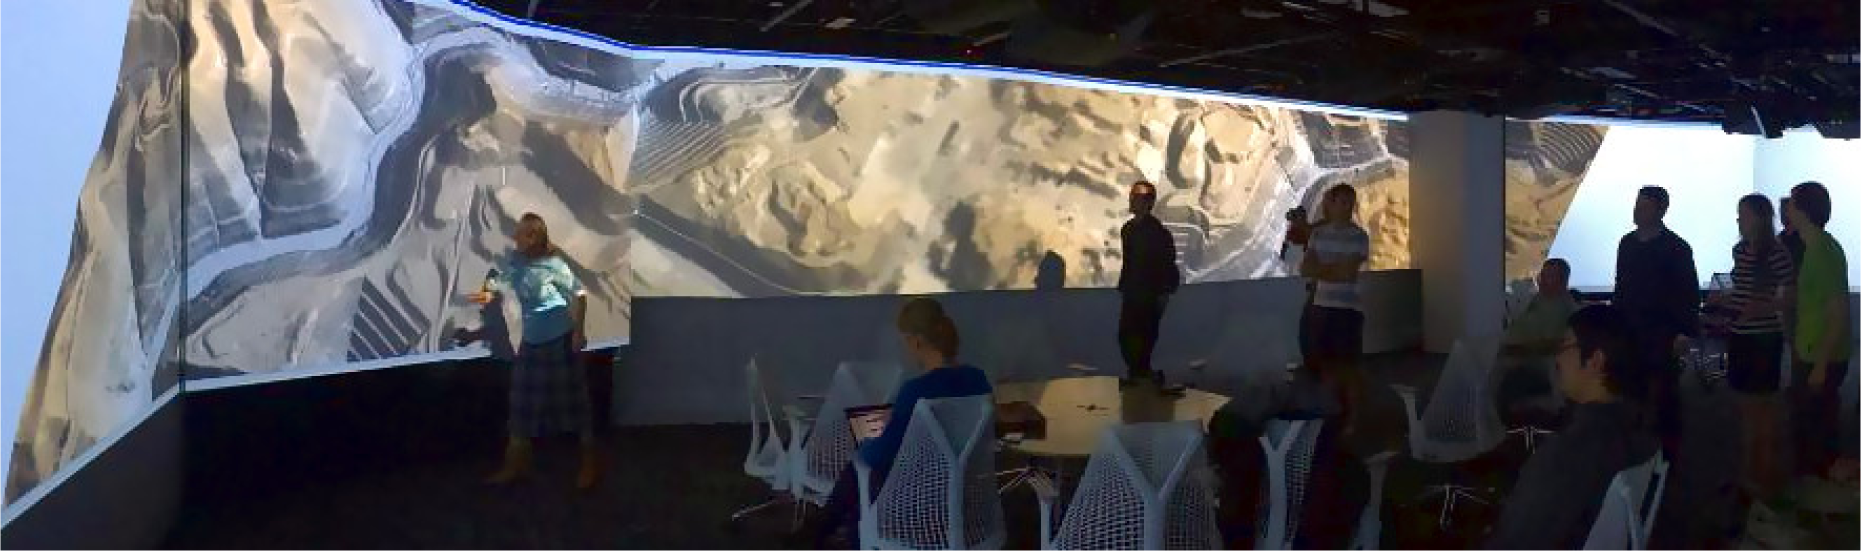
The second, more advanced course is aimed at PhD students and highly skilled MS students. The focus is on working with 3D rasters, time series, dynamic models and simulations and multiple return LiDAR data. This course has a stronger focus on the advanced applications of free and open source GIS and GRASS GIS in particular. Programming (scripting) skills are useful, but not required. The first half of the course is led by the instructor, and the second half is led by students who have to prepare both a lecture and a working assignment on a topic of their choice while making sure that the other students in the class can successfully complete the assignment. Based on the students’ interests, the topics change each year. In
Figures 5 and
6a, students present their data and analysis in the Hunt Library Teaching and Visualization Lab and develop applications for the Tangible Landscape system. The course is available at
http://courses.ncsu.edu/mea592/common/GIST_MEA592004.html.
3.3. LAR582: GIS for Designers
This course, GIS for Designers, aims to teach landscape architecture students how to use GIS as an integral part of the creative design process, rather than simply as an analytical tool. Students learn how to generate and develop the seed of a design in GIS as part of an iterative design process. They use conceptual and logical models to structure and generate designs, linking creative abstraction, computational exploration, structured decision-making and expression. As part of an iterative design process, students learn workflows linking 3D GIS, 3D modeling and rapid prototyping, i.e., 3D printing, computer numeric controlled (CNC) fabrication and laser cutting.
Topics for this course include terrain modeling, hydrological modeling, map overlay analysis, trail routing using least cost paths, 3D visualization and rapid prototyping. All topics are taught in both ArcGIS and GRASS GIS.
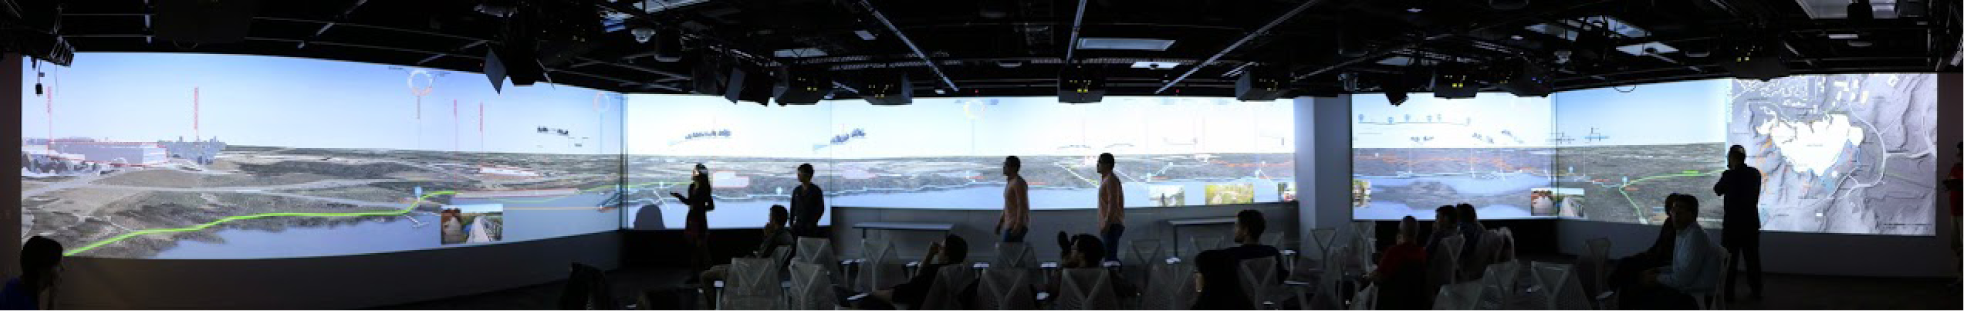
In a series of charrettes (
i.e., design workshops), students plan and design a trail network for Lake Raleigh Woods, a landscape on NCSU’s Centennial Campus, using GIS and 3D modeling (
Figure 6b,c). In the charrettes, student teams model environmental impacts and risks, identify potential trail routes and then develop a series of trail scenarios. Each team designs scenarios for differing and potentially conflicting stakeholder objectives, such as accessibility, aesthetics and conservation. For each scenario, they compute a trail network using map overlay analysis, iterative least cost path analysis and network analysis using either ArcGIS, GRASS GIS or the Tangible Landscape system, which uses GRASS GIS in the background. For their final review, students present their designs to a jury in the Teaching and Visualization Lab in Hunt Library using blended projectors, stereoscopic 3D and CNC routed models (
Figure 7). The course is available at
http://courses.ncsu.edu/lar582/common/.
4. Future Directions
The integration of FOSS into geospatial education is largely driven by its suitability for science and its future potential in geospatial disciplines [
12], following the success of FOSS in software engineering and business [
5,
23].
Students enrolling in our courses have very diverse backgrounds, often with limited programming skills when entering our GIST programs. Although the MS GIST curriculum includes the Geospatial Programming course, more programming experience is needed to introduce students to more advanced learning opportunities, including dynamic modeling and analysis techniques and to benefit from FOSS by examining or modifying source code [
12,
24]. The opportunity to study source code is an advantage often overlooked outside the computer science domain, yet important for geospatial science.
In our courses, we plan to introduce more opportunities for students to take advantage of the “open source” aspect of FOSS. Geospatial science, like any other science, requires an understanding of underlying processes, as well as the ability to verify results. To understand underlying processes, we continue to emphasize the importance of learning algorithms and how they are implemented in software; only with FOSS will this frontier in geospatial science education be reached. For example, to help students gain an understanding of the manner in which geospatial algorithms are implemented, we will ask students to find and study the segments of code in GRASS GIS that underlie the geospatial analyses discussed in a lecture, such as computing slope and aspect or bilinear interpolation between raster cells. We are also experimenting with ways to encourage students to connect equations and algorithms with the code, another benefit to education that is only possible with open source systems.
We are exploring the possibility of using a web-based tool that would allow students to interactively explore algorithm behavior as they study the teaching materials provided. The interactive tool would be linked with our teaching materials, standard user manual and, most importantly, the source code. With GRASS GIS as the back-end of analyses, online analyses and those done on students’ computers would match the linked source code. If we limit the functionality of the tool, there will be no need to manage access rights for students, and we can keep the access open for everybody.
Another advantage of using open science and FOSS in education is the opportunity to interact with members of the community and to influence the FOSS development. Although we would like to see individual students getting involved in the community, we think that the direct involvement of the instructors is more important. The instructors can provide students with insights into the open source development process, how the community supports users and encourage student participation in the community later on. We, as instructors, have benefited from interaction with GRASS GIS developers, and the GRASS GIS project has been enhanced by our feedback and contributions.
Finally, we are planning a new course solely dedicated to the important role FOSS plays in science and how open science perspectives can lead to new geospatial solutions in research and decision making. Such training is essential for preparing next generation students for successful careers in open science and leaders across many fields.
5. Conclusions
We have demonstrated how free and open source software can be integrated into geospatial education to encourage a culture of openness, clearly differentiate between science and software and enable greater reproducibility in science. By using multiple software packages with different computational approaches, students can learn to decouple science and software and, thus, come to understand both the underlying concepts and their implementation. By understanding the concepts and their implementation, students will become better scientists, who are able to generate, reproduce, critique and improve research and analysis. Furthermore, by learning to switch between computational tools, students may learn to be more flexible in developing strategies for research or analysis.
The method and tools we are using for the teaching materials are available to all, as all the dependencies are free and open source and the overall requirements are kept to minimum. The materials can be, if desired, easily combined with other more complicated solutions based on similar principles. Teaching materials are shared under a CC BY-SA license at
https://github.com/ncsu-osgeorel.


 ,
, 

