1. Introduction
Independent mobility is an important aspect of quality of life for people with disabilities (PWDs). In particular, people who use wheelchairs and are blind or visually impaired frequently encounter unique challenges when traveling outdoors [
1]. Navigation systems/services could play an important role in assisting PWDs with their mobility needs and references. Meyers
et al. interviewed some wheelchair users for the types of obstacles they usually encounter when traveling outdoors and found that narrow sidewalks, no ramps, steep ramps, no sidewalk curb cuts, poor sidewalk surfaces, and sidewalk obstructions, are among obstacles [
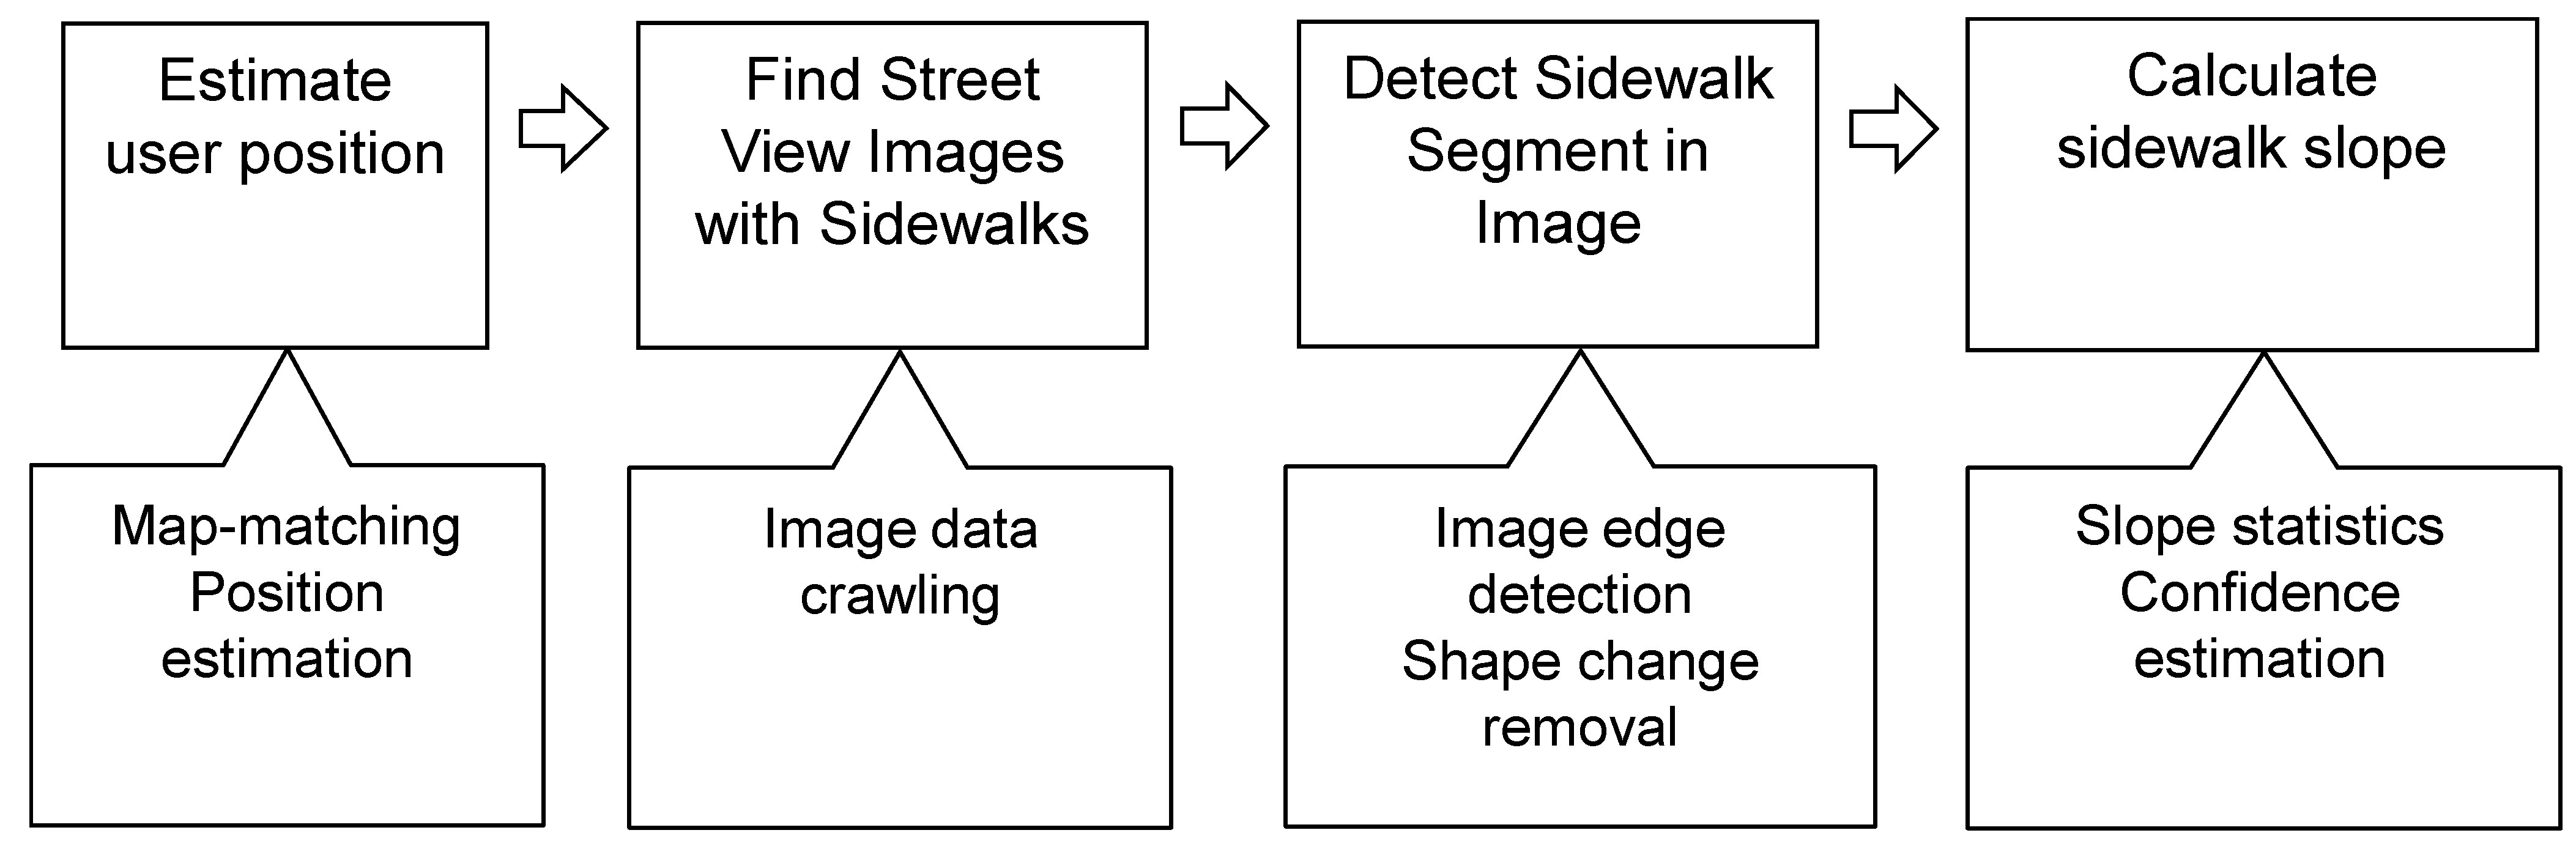
2]. A navigation system/service designed to address the mobility challenges of PWDs would include information about the accessibility of the sidewalks in its database and assist in avoiding obstacles. In this paper, we present a technique to calculate sidewalk slope, one type of obstacle that when it is steep would impede travel by PWDs, in real time. In our technique, the user trajectory is used to access nearby sidewalk images from the Google Street View image data set, and the slope of the sidewalk is calculated utilizing edges, detected by our technique, of buildings in the background. An important feature of our technique is that slope is calculated using only a single image.
Our proposed technique is novel and its major contribution is providing a service for PWDs to avoid steep slopes through calculating sidewalk slope by image data, analyzing the trajectory to determine user’s preference, and recommending a suitable route close to the user. The technique can be incorporated into existing or new navigation systems/services. We demonstrate the feasibility and accuracy of this technique through an experiment. The structure of the paper is as follows. Related works are discussed in
Section 2. The proposed technique, integrating GPS trajectory data and image data, to calculate sidewalk slope in real time is described in
Section 3. A recommendation method considering both the slope and the route length is proposed in
Section 4. In
Section 5, the result of an experiment using the technique is discussed. Conclusion and future research are discussed in
Section 6.
2. Relate Works
Smith
et al. proposed a novel framework that processes, identifies, and classifies sidewalks in Google Street View images [
3]. They use image processing techniques to determine the horizontal and vertical components, and consider the color, location, and presence of lanes as the cues to detect sidewalks. Senlet
et al. developed a framework to construct sidewalk and crosswalk maps from satellite images [
4]. These works differ from the work in this paper in that they only detect sidewalks in images, while our contribution is calculating slope of a sidewalk after detecting it in images.
Alexandra
et al. developed the Automated Sidewalk Quality Assessment Tool, a low-cost system that can be used to automatically assess sidewalk quality and can be deployed by agencies on a large scale [
5]. Their system requires installation of App-equipped tablets on wheelchairs, so that when a wheelchair is roving, the tablet records video, GPS location, accelerometer, and gyroscope data. Then the video and vibration data are analyzed for areas requiring repair. Through image processing techniques, they calculated the parameters of sidewalks including width, pavement type, surface quality (e.g., roughness, discontinuities, and gaps), grade, and number of obstructions. They also developed a complete sidewalk quality index for the city of Atlanta. Their work differs from ours in that they utilized specific devices to collect composite data about sidewalks, while we only make use of sidewalk network and Google Street View image data to calculate sidewalk slope in real time.
Ren and Karimi developed a navigation application on Android to assist wheelchair users with navigating on sidewalks. They employed GPS, accelerometer, compass, and camera on Android devices to find real-time position of wheelchair users [
6]. Their work is different than ours in that they do not calculate sidewalk slope in real time.
In summary, while in some existing works sidewalks in images are detected and camera images are used to map match user’s position to sidewalk segments, there is a void in literature on calculating sidewalk slopes in real time. In this paper, we address this gap by developing a sidewalk slope calculation technique.
4. Slope Network Profile
Once the slope of a segment is calculated in real time, it is recorded as part of the user’s GPS trajectory, formed by a sequence of adjacent sidewalk segments. As the user continues traveling on new segments, the slopes on the new segments are calculated and a slope network profile for each trajectory can be constructed. The constructed slope network profile can assist in tracking user’s position and predicting best possible routes for the user during real-time navigation.
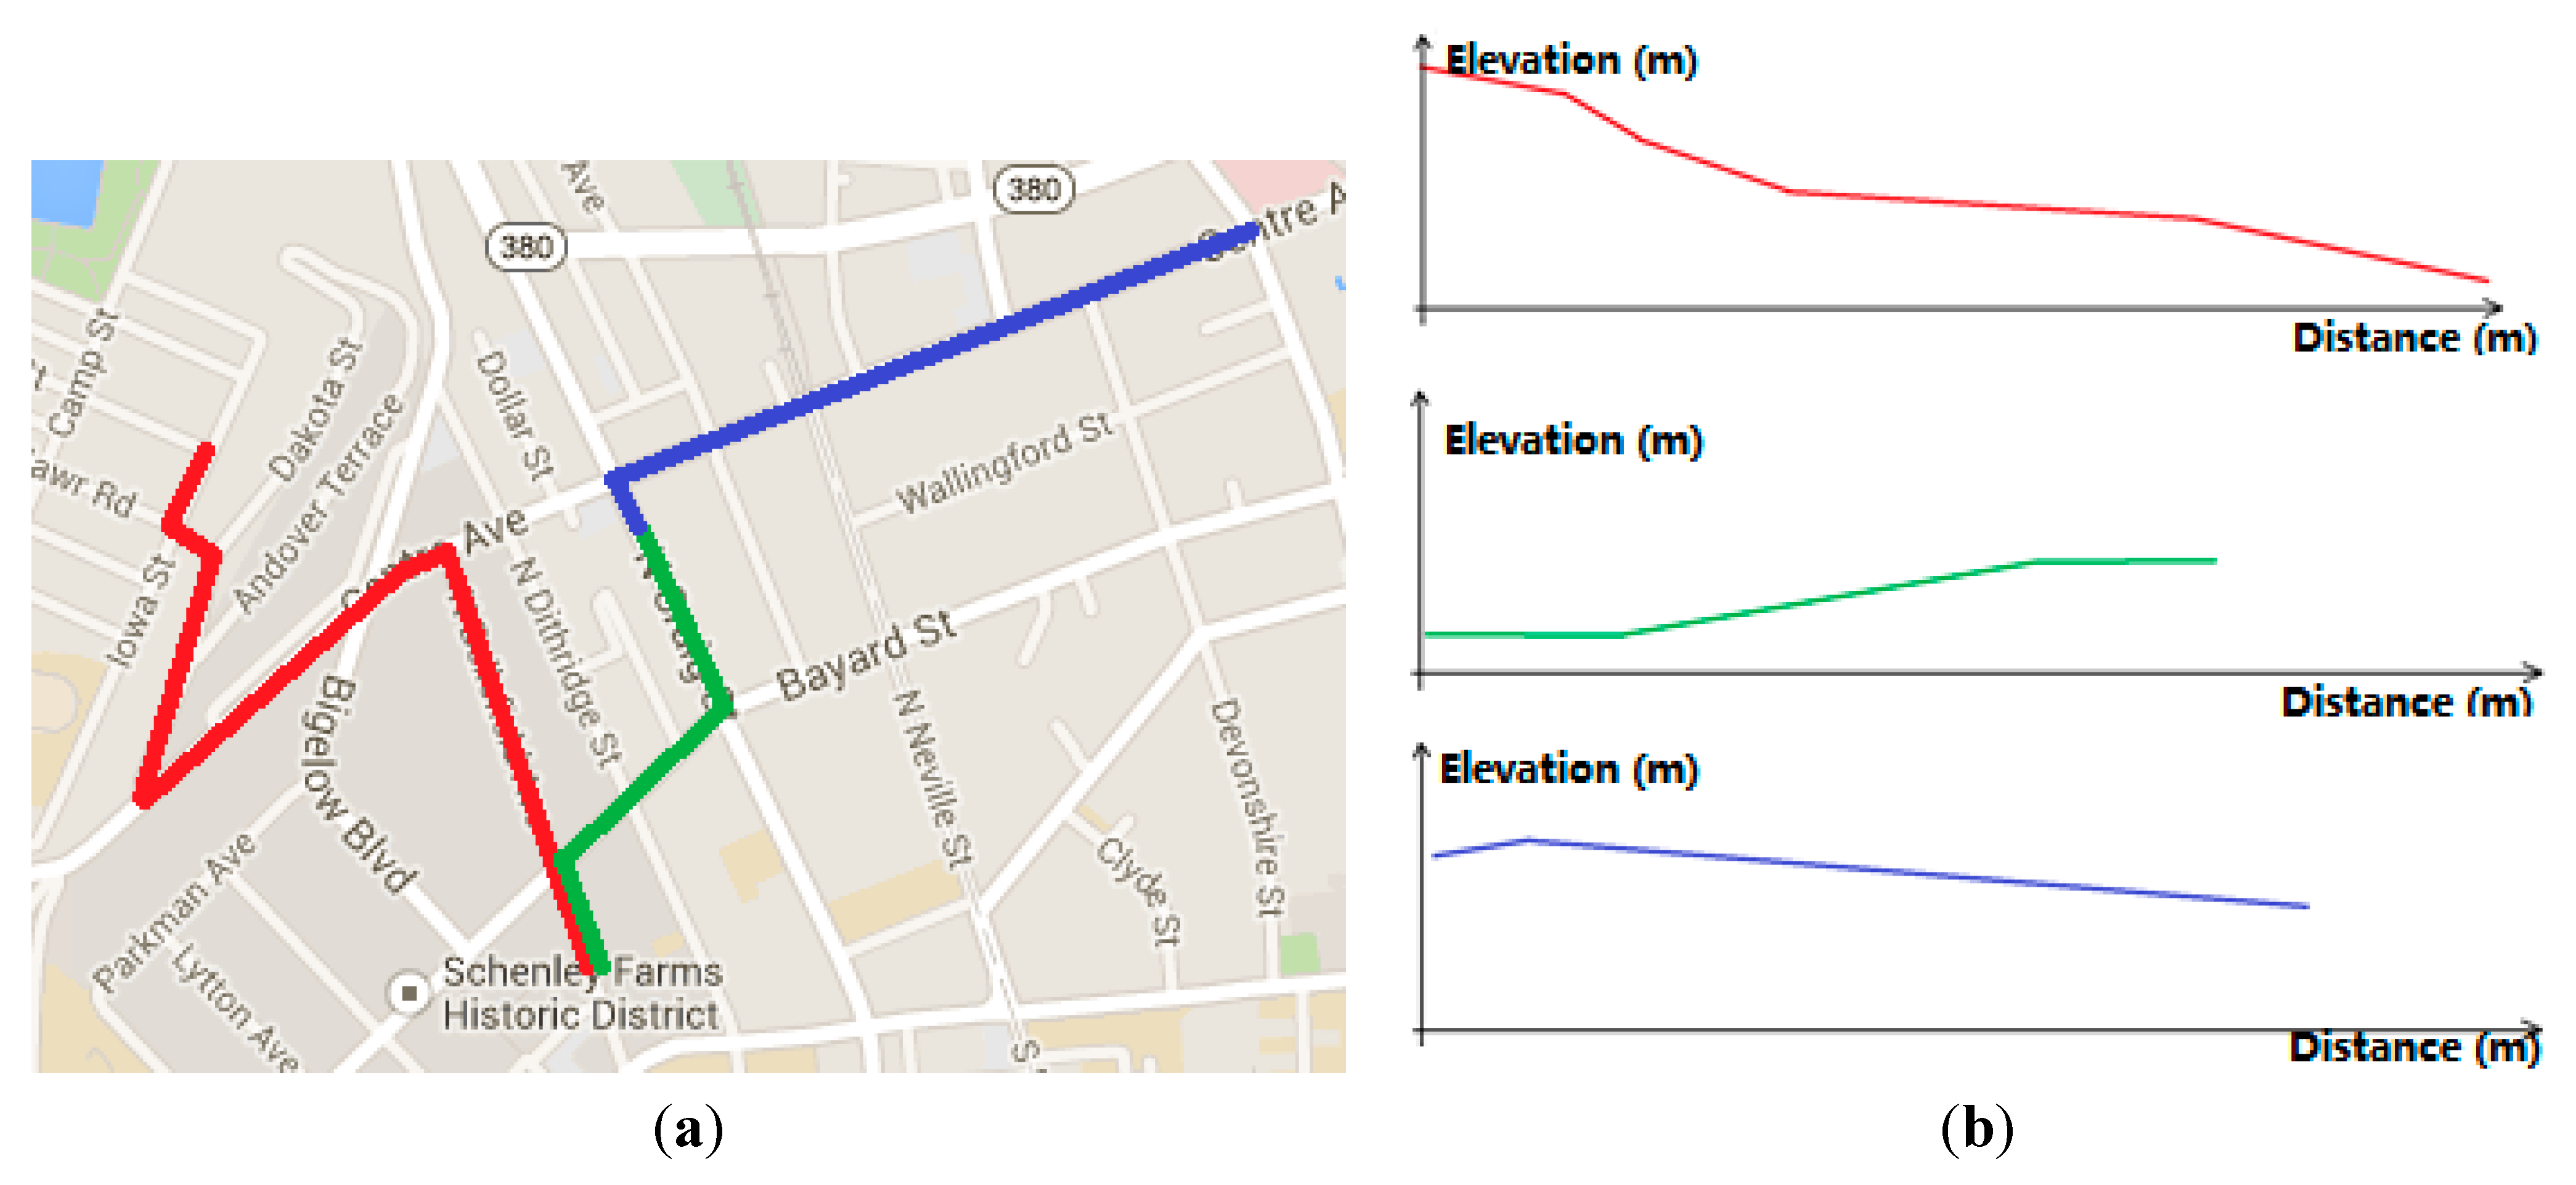
Figure 7 shows an example of a user’s trajectory along with three slope network profiles, each for a different segment of a route. These examples are generated manually to show how slope network profiles can be used in predicting routes.
Figure 7.
(a) Example trajectory history for a user; (b) An elevation trend curve indicating user’s pattern of slope usage.
Figure 7.
(a) Example trajectory history for a user; (b) An elevation trend curve indicating user’s pattern of slope usage.
Trajectory history of a user includes slope network profiles that indicate the user’s slope pattern of usage and preference. Such patterns of usage and preference of slope can be used in finding and recommending personalized routes in real time. It is worth noting that for evaluating trajectory slopes and finding and recommending personalized routes, it is important to pay attention to slope trends in routes and identify those with relatively uniform trends.
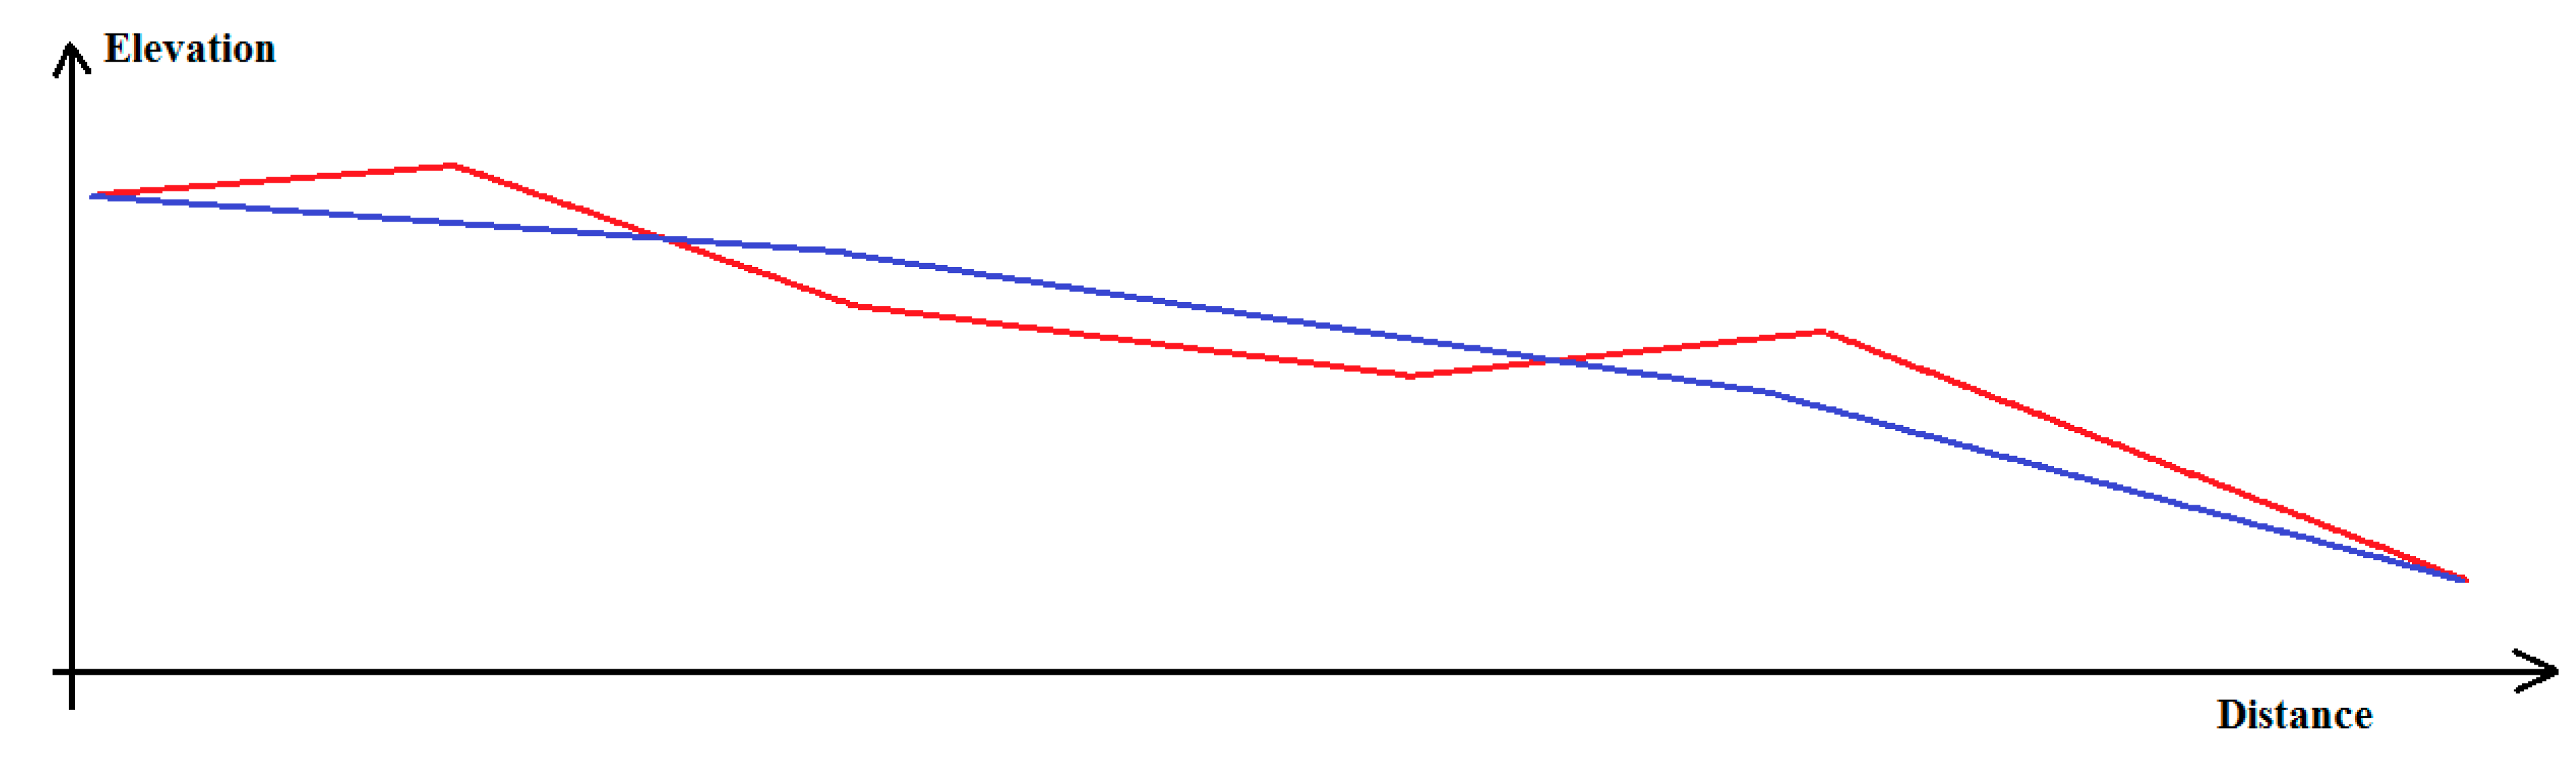
Figure 8 shows two routes with the same origin and destination. Although both origin and destination locations are at the same elevation, the slope of the route in blue is relatively uniform, while the route in red has more steep segments. In this example, the route in blue is more suitable for PWDs compared to the route in red.
Figure 8.
Two example routes with the same pair of origin and destination.
Figure 8.
Two example routes with the same pair of origin and destination.
The proposed approach above requires development of a method to calculate a value to represent the slope trend of routes, while avoiding the bias caused by the total length of the route and the general elevation of the route. Based on this observation, the variance of the slope can correctly represent the trend of a trajectory, which can be expressed as follows:
where
x is the distance from the location of the origin and
Ex is the elevation at position
x.
μ is the average slope, calculated as follows:
where
Ed and
Eo are the elevations at the destination and origin, respectively, and
l is the total length of the route.
In Equation (1), the lower Var is, the smoother the slope of the route will be. After calculating the Var values for multiple trajectories of the same user, the slope that the user prefers can be estimated which in turn can be used in updating routes.
By integrating the user’s preferred slope with other route attributes, a method to recommend personalized routes can be developed. Of various route attributes, route length is of particular importance for developing such a method. In our method, we integrate length, slope variance, and user’s preference to find and recommend personalized (with respected to preferred slope) routes. The method is based on a weight that integrates user’s history preference, length, and slope.
Assume there are n route options with different lengths and slope variances between a given pair of origin and destination locations, the index value
R, which is for evaluating different routes, is calculated as follows:
where
lk is the length of route
k;
lmin is the length of the shortest route;
Vark is the slope variance of route
k;
Varmin is the lowest slope variance among all n options;
VarHistorycurrent is the average
Var of the user; and
VarHistorymax is the highest average
Var among all the user’s trajectories. The lower
R value is for a route, the higher probability it will be recommended.
5. Experiment
We evaluated the proposed technique for calculating slopes in real time in this work by conducting an experiment. We did not evaluate the proposed slope network profile technique since its proper evaluation requires PWD subjects willing to travel on different segments with varying slopes, a task which was beyond the scope of this work.
In the experiment conducted, we used existing GPS-based map-matching algorithms and image data to calculate the sidewalk slope. For image processing, we used Matlab, where the RGB of Google Street View images were used as input and the outputs were the edges, the straight lines, and the slope value. The image processing tools utilized in Matlab included rgb2gray, imrotate, edge functions, and hough functions. The experiment and its result are discussed below.
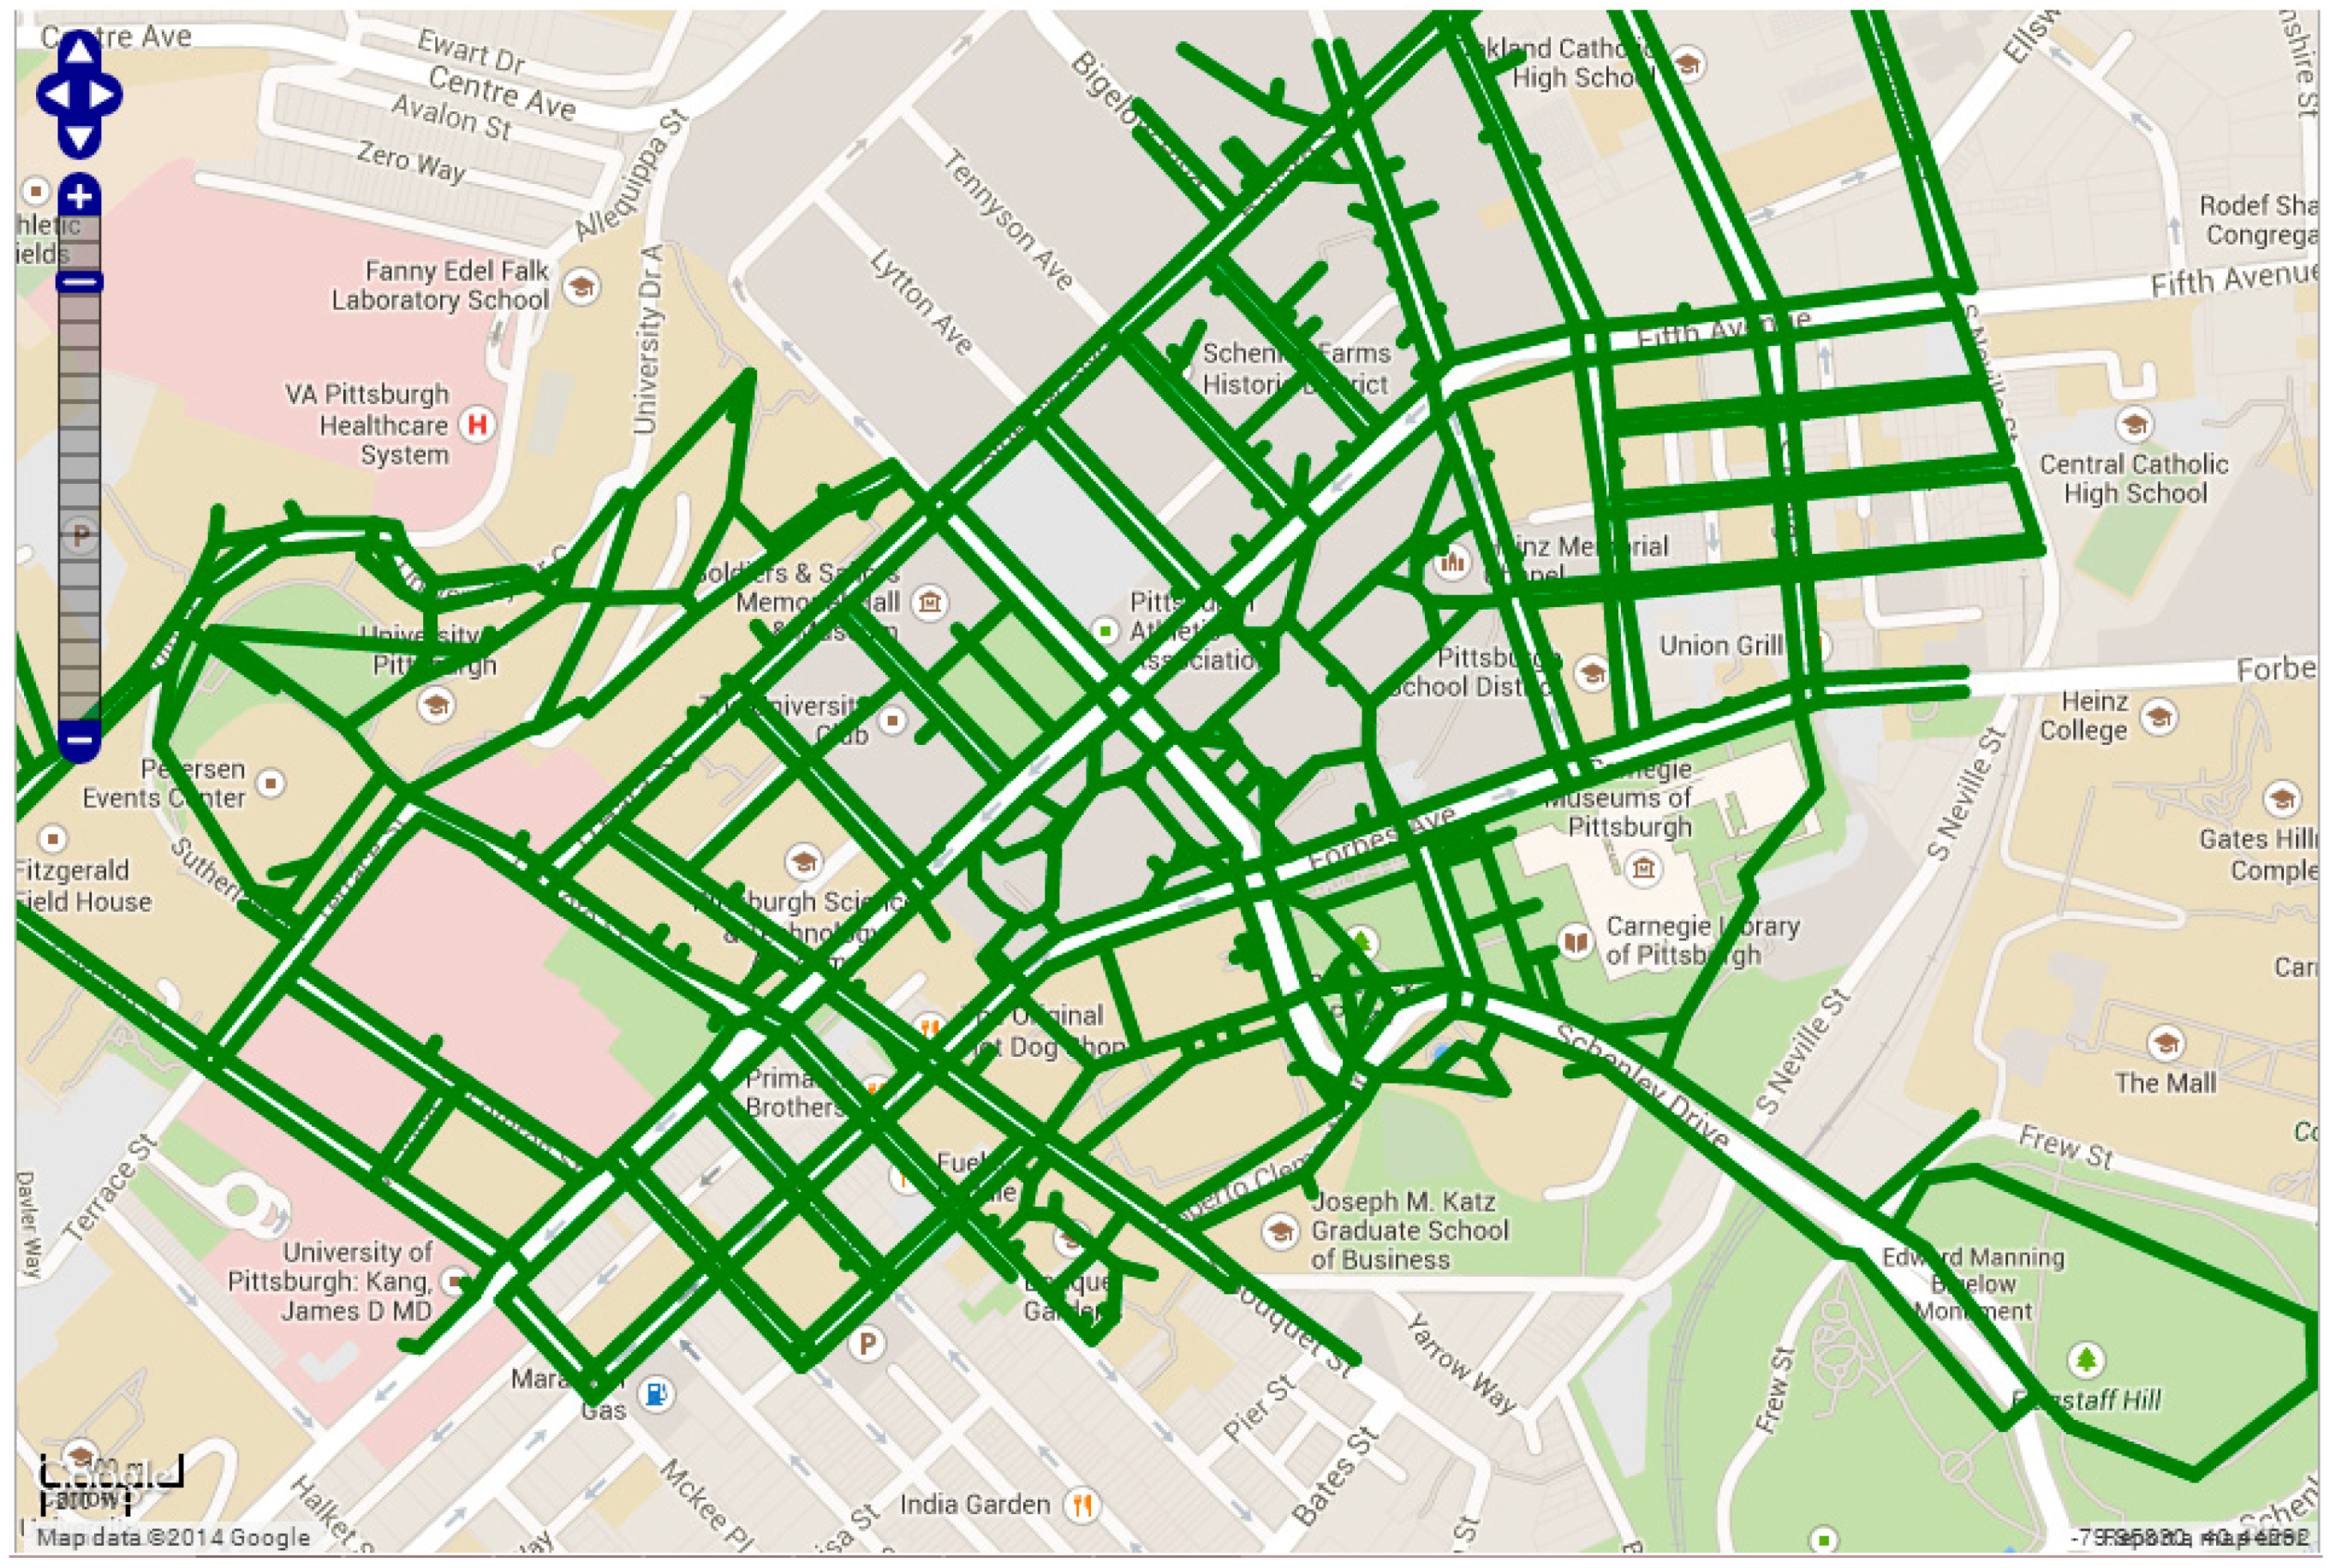
We randomly selected 100 sidewalk segments in the campus area of the University of Pittsburgh’s main campus using PAM’s database and searched for 10 images from Google Street View for each segment. The images provided by Google Street View are geo-referenced, each with 800*800 pixels and contains 5–10 meters of the sidewalk according to the width of the road.
In the slope calculation experiment, of the 1000 images used, 117 images resulted in errors below 2 degrees and 52 images resulted in errors below 1 degree, and only 1% of all images produced accurate results. While this is a small number of images with high level of accuracy, we were able to find at least one image for each sidewalk segment of interest in the experiment with an acceptable level of accuracy; 64 out of 100 sidewalk segments have at least one image whose slope calculation error is below 2.0 degrees and 44 out of 100 sidewalk segments have at least one image whose calculation error is below 1.0 degree.
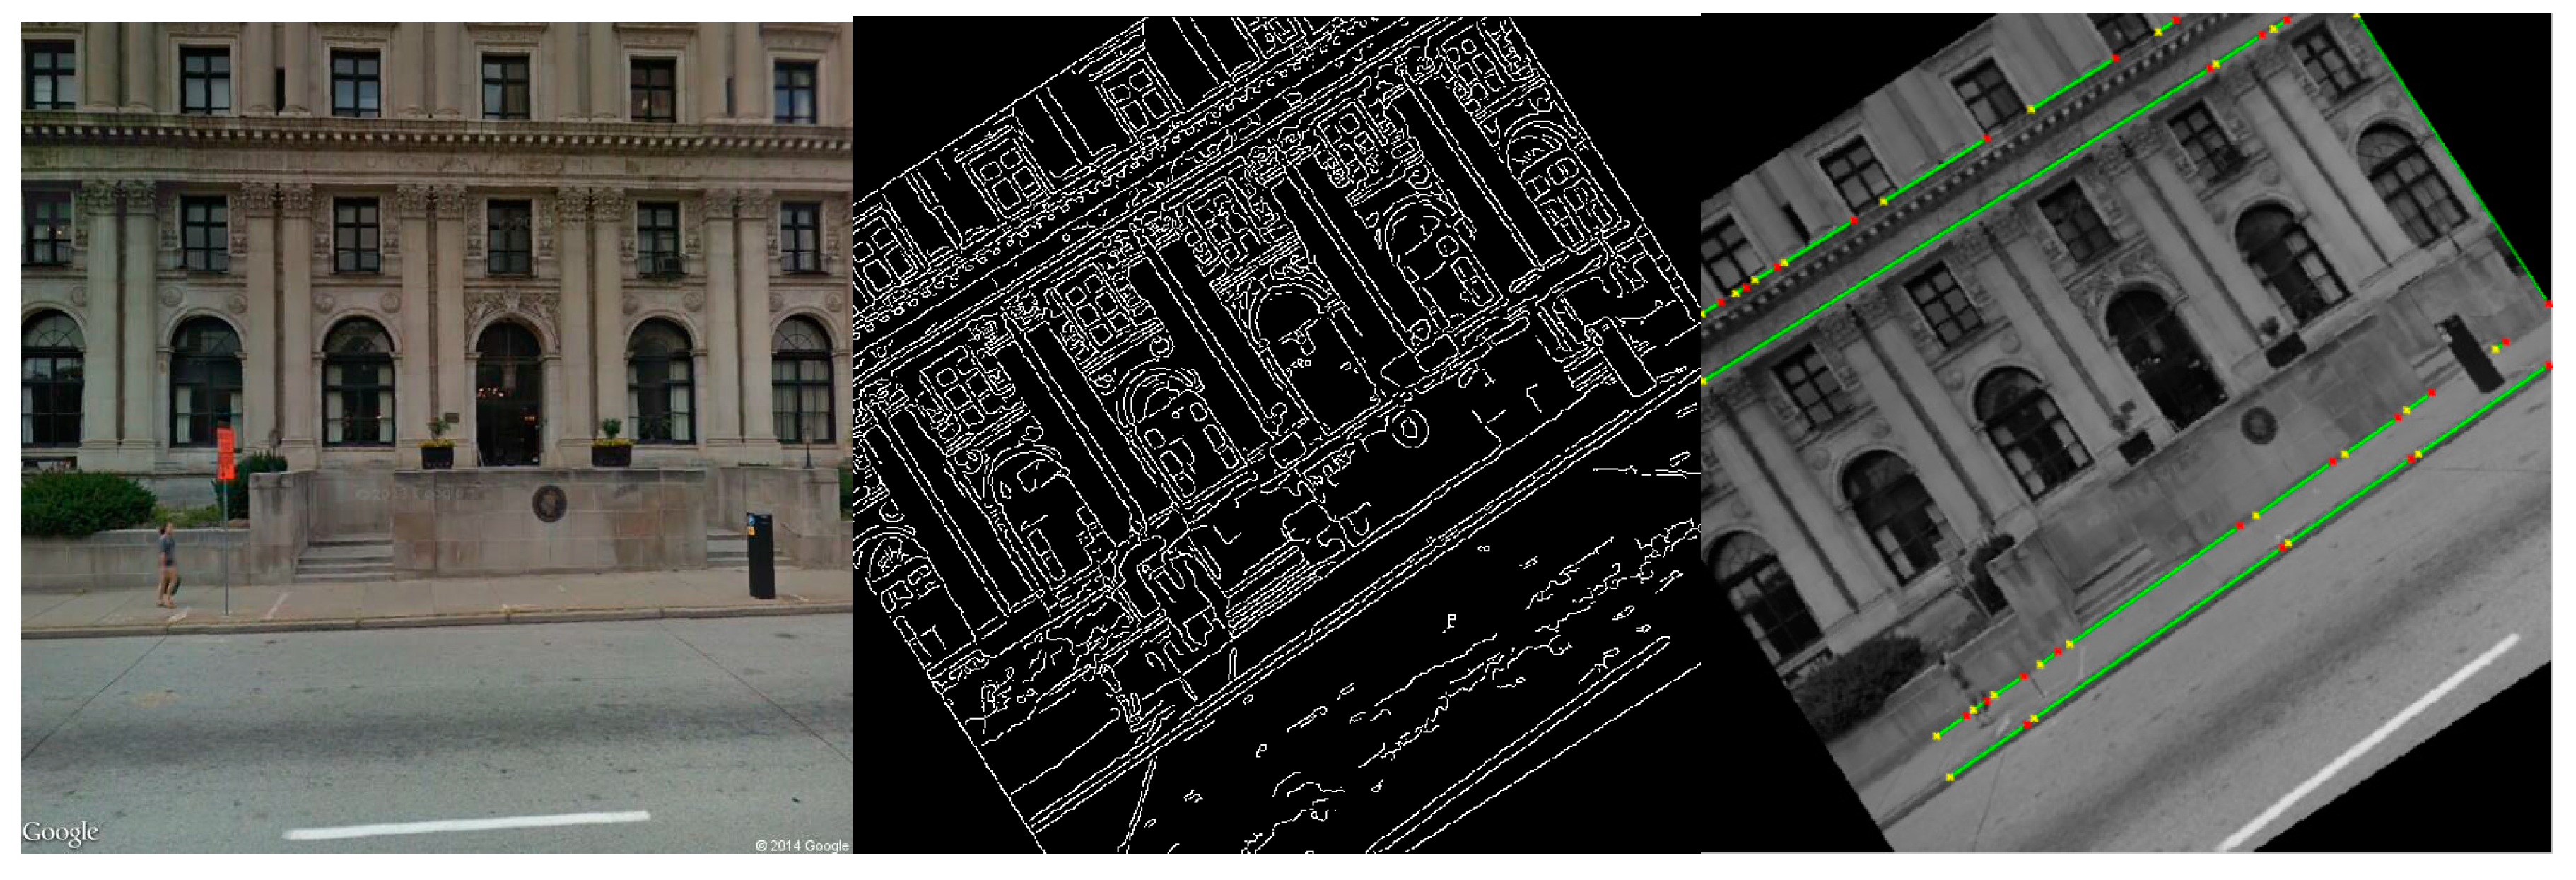
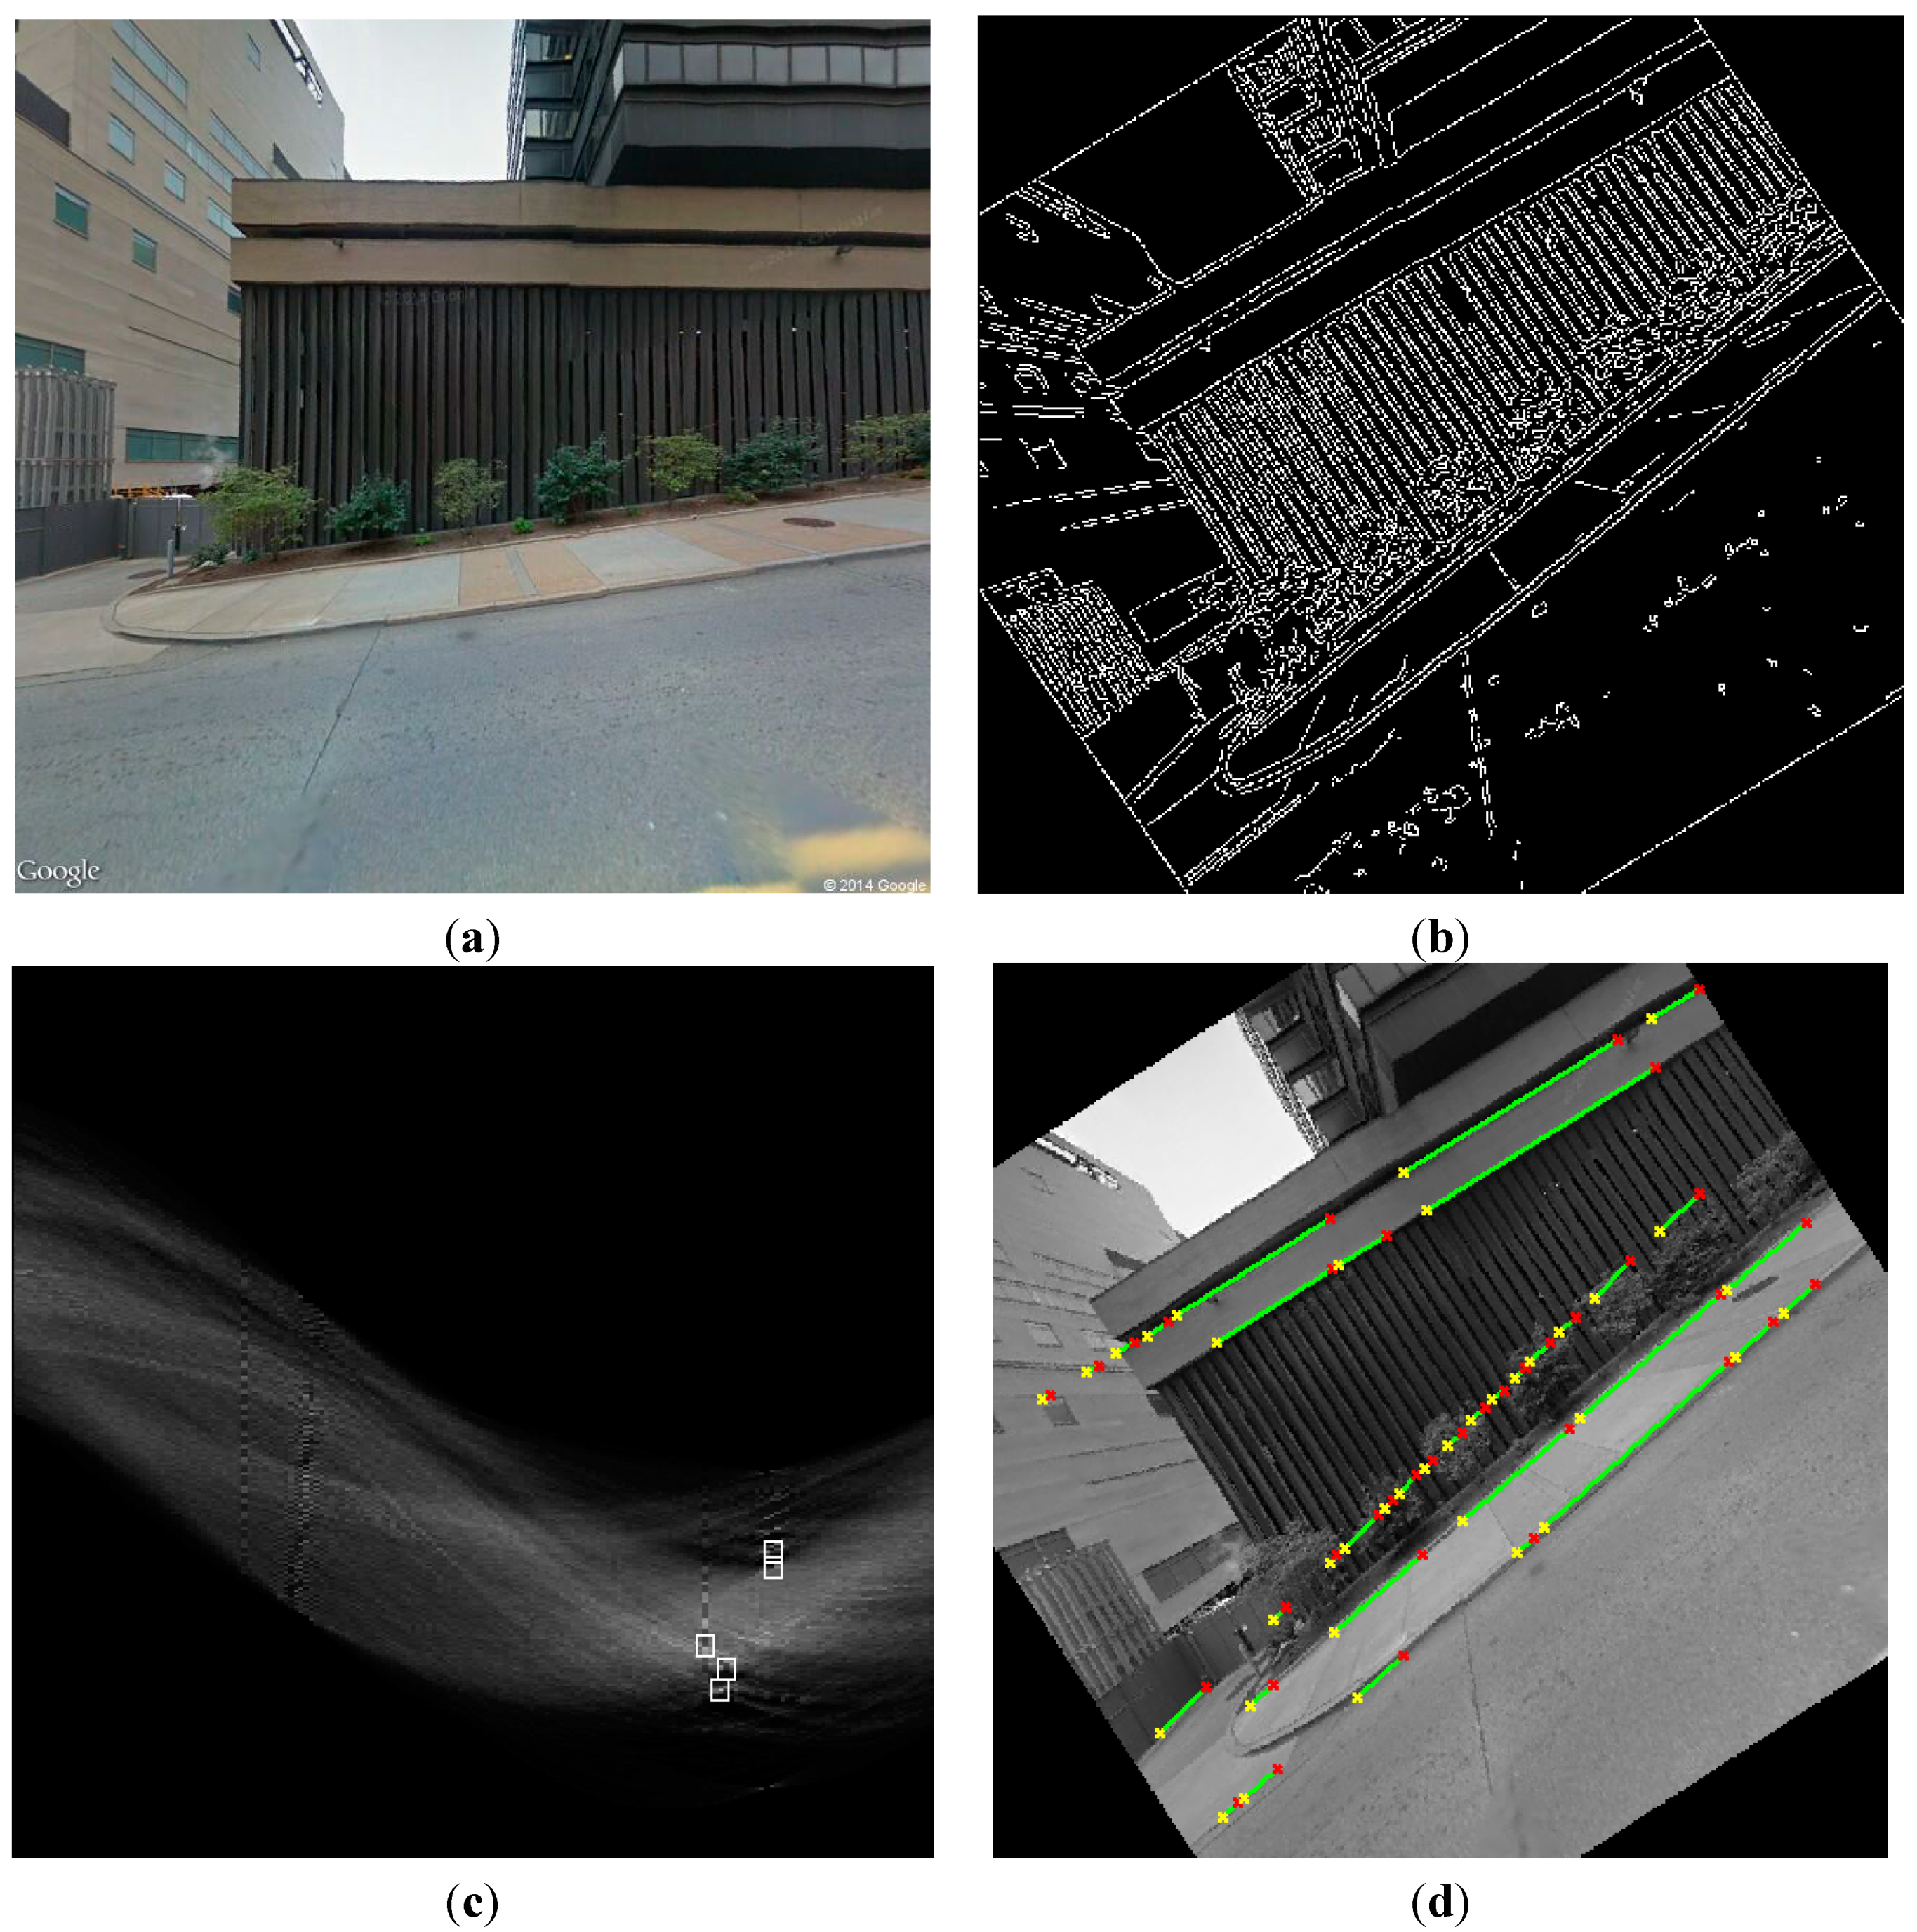
Figure 9 shows an example of the calculated slope. After applying the Canny edge detection algorithm and Hough transform, five lines were detected as highlighted in
Figure 9c [
10,
11,
12]. These lines include those representing the sidewalk and the background building. Considering the lowest line representing the sidewalk and the highest line representing the background building, the slope angle is calculated as 8.5 degrees, which is very close to the actual angle 8.42 degrees stored in the PAM database.
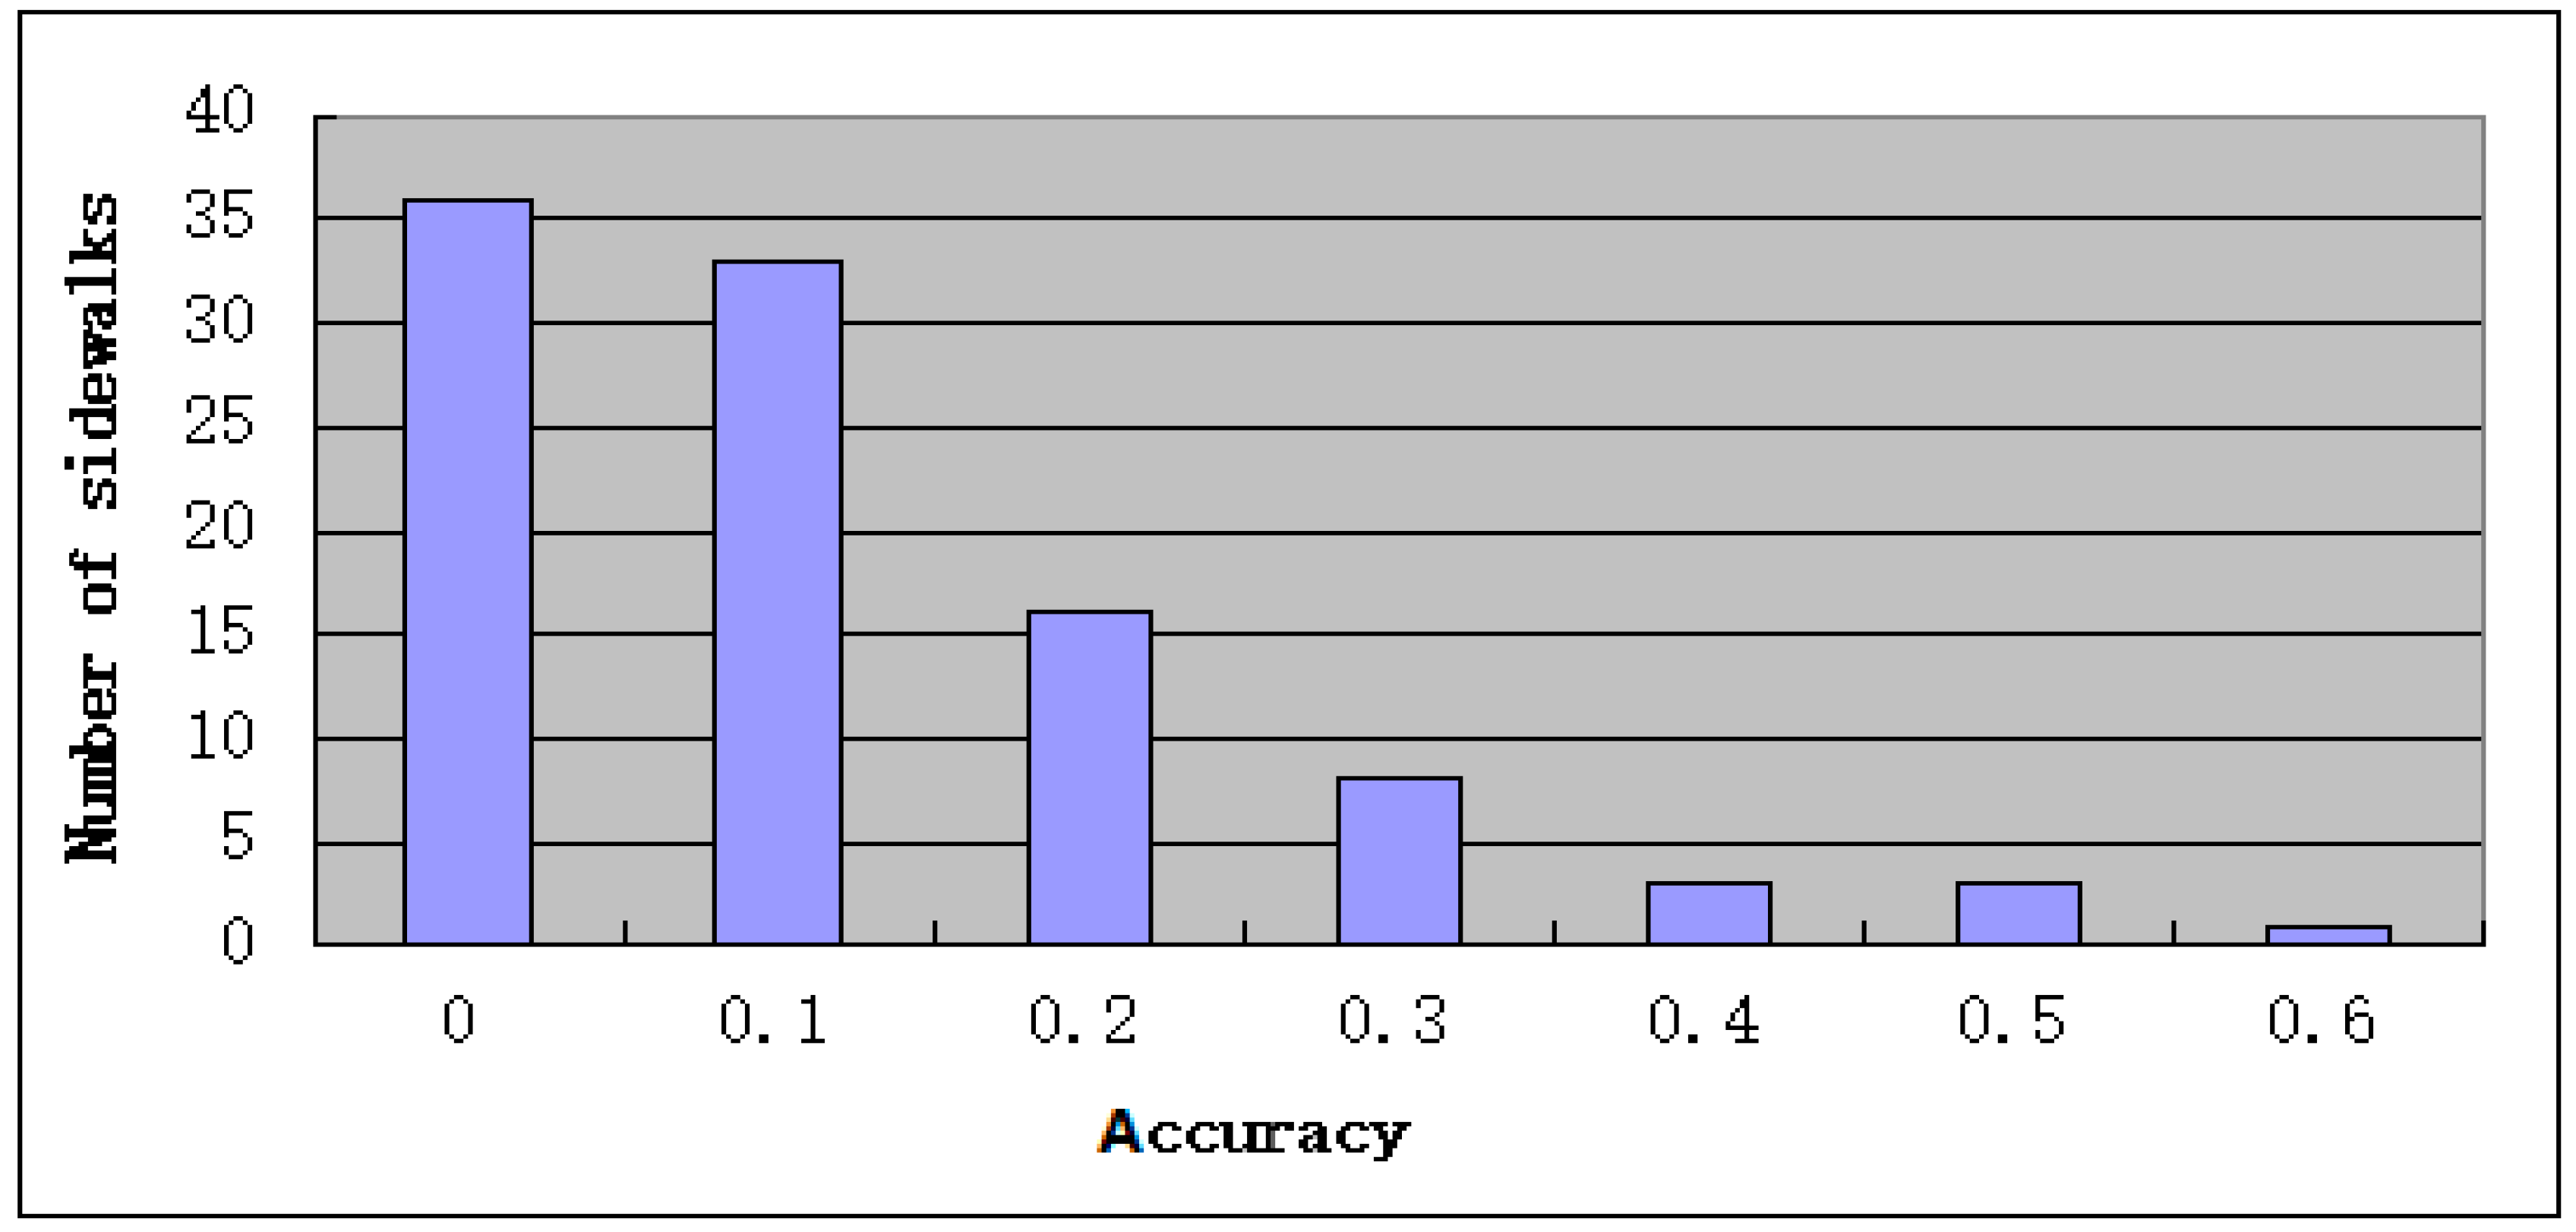
Figure 10 shows the overall accuracy of the proposed technique evaluated by comparing the slope calculation result of each image with the actual slope value recorded in PAM’s database. The sidewalk accuracy indicates the percentage of images that resulted in accurate slope for the sidewalk. The result shows that 64 segments in total have at least one image that correctly calculated slope (slope error < 1.0 degree), and 33 segments only have 1 image that correctly calculated slope. Although the technique requires only one image to calculate slope, there were cases in which the experiment did not produce accurate results; only 1% of all images in the experiment produced accurate results.
Figure 9.
Example sidewalk slope calculation: (a) original image; (b) result of Canny’s edge detection algorithm; (c) result of Hough transform, five straight lines detected and shown as light spot circles; (d) straight lines detected in the original image.
Figure 9.
Example sidewalk slope calculation: (a) original image; (b) result of Canny’s edge detection algorithm; (c) result of Hough transform, five straight lines detected and shown as light spot circles; (d) straight lines detected in the original image.
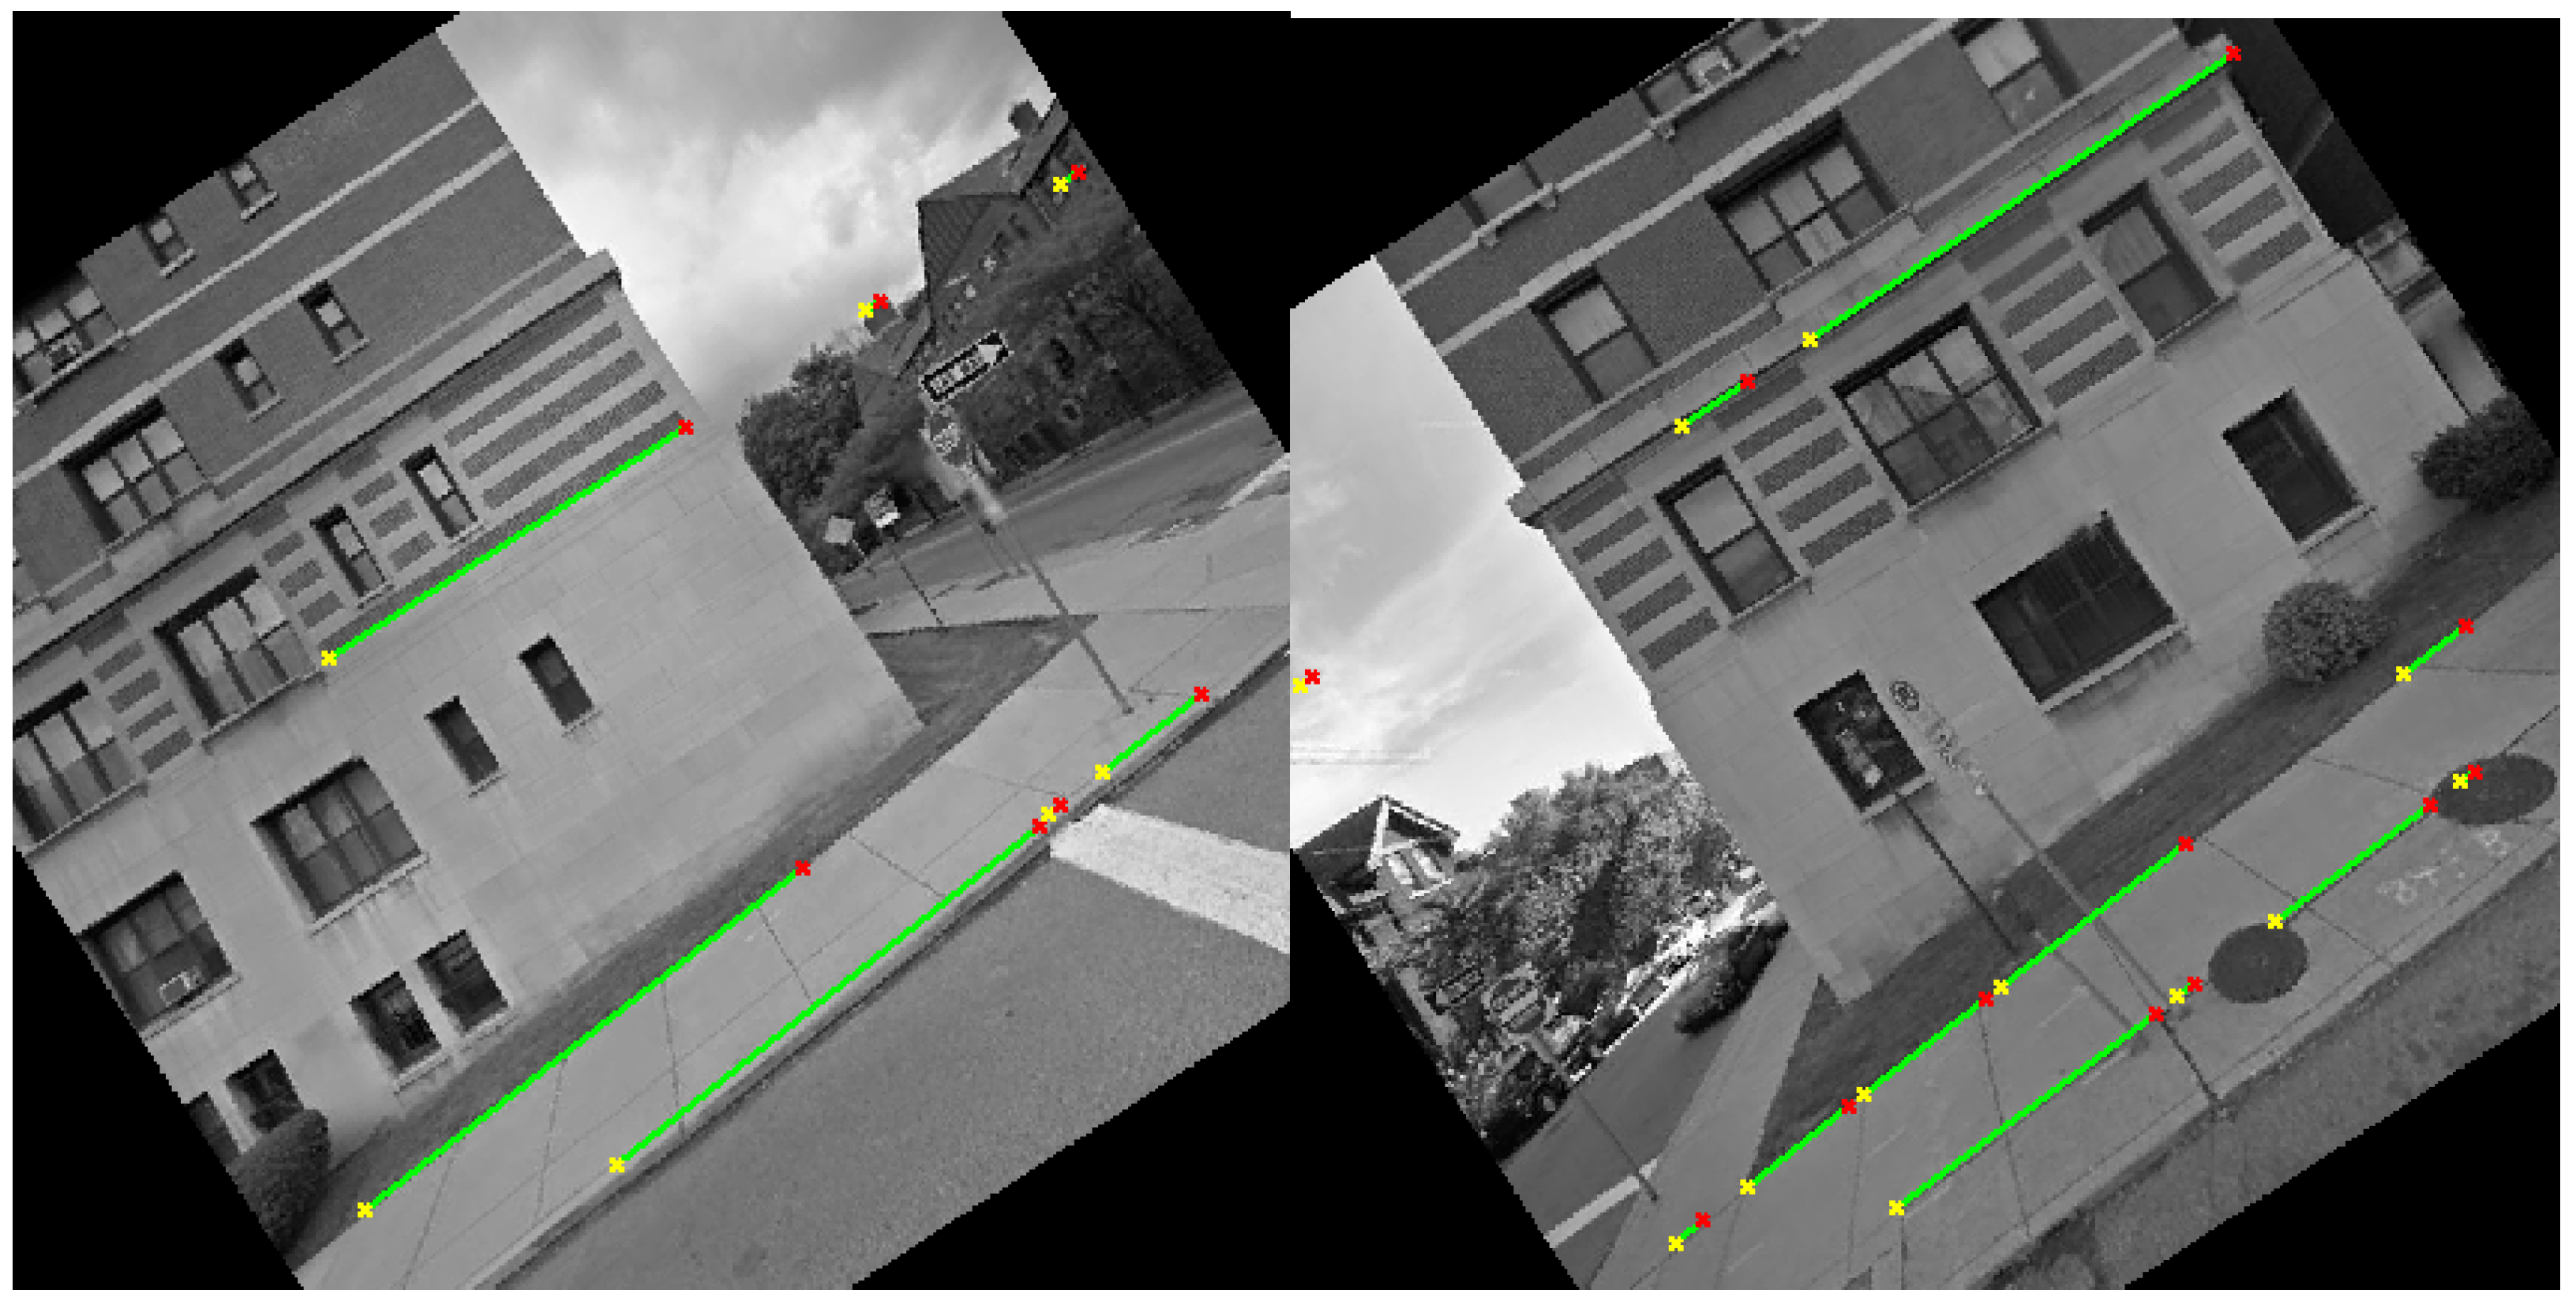
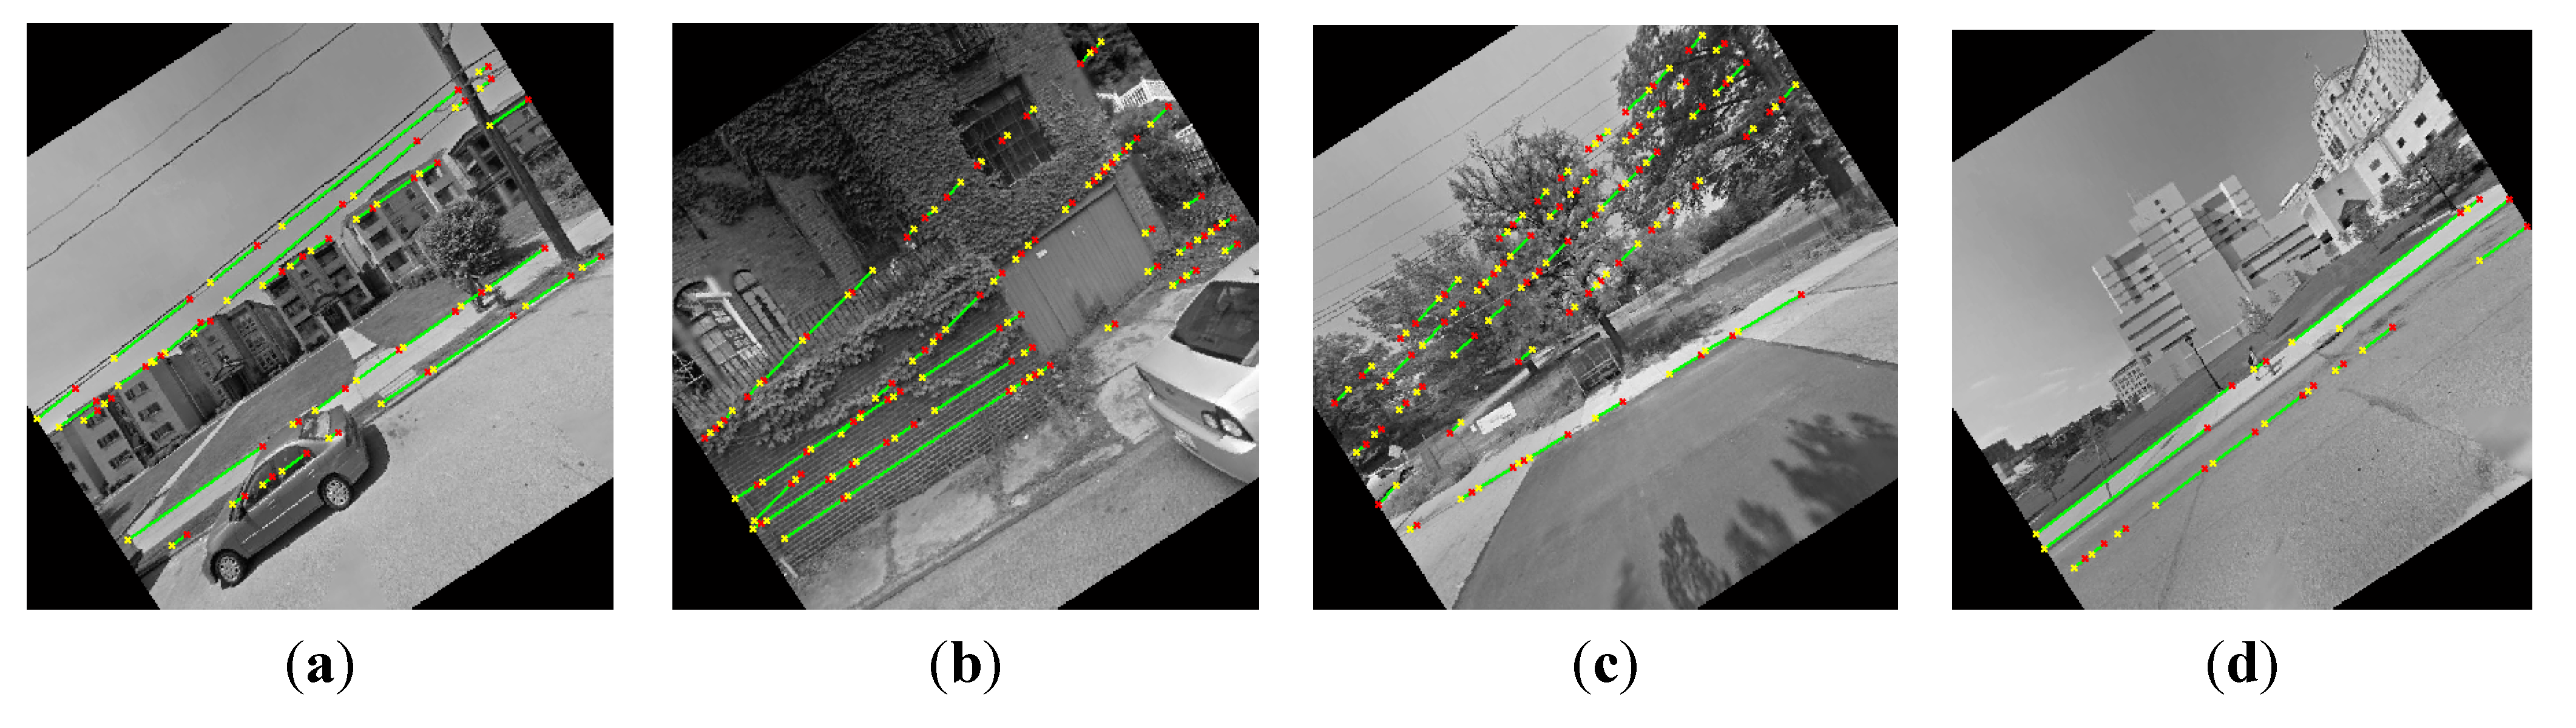
Figure 11 shows four examples with incorrect results, each for a different reason. In
Figure 11a, the straight lines are detected successfully, however the highest straight line belongs to electric wire which is not suitable for calculating slope. In
Figure 11b, due to the surface of sidewalk, which is unrecognizable, the correct sidewalk is not detected. In
Figure 11c, there is no building in the background, so slope could not be calculated. In
Figure 10d, due to the long distance between the background building and the camera, slope could not be calculated.
These cases above may be addressed by applying different techniques. In one technique, level of confidence in detection, where confidence is high on long continuous straight lines, usually man-made architectures, and on short lines, usually complex backgrounds, cab be an option. Another technique is based on voting. As it is not expected that all images result in correct detection, a feasible technique to avoid incorrect detection is considering multiple images for each sidewalk to calculate slope of the same segment. By analyzing the slope results from all images, the mode of the slope values is considered as the most reliable result, and the frequency of the mode value also indicates the level of confidence on calculation.
Figure 10.
Number of sidewalks and level of accuracy (out of 10 sample images per sidewalk).
Figure 10.
Number of sidewalks and level of accuracy (out of 10 sample images per sidewalk).
Figure 11.
Example cases with incorrect or no slope calculation: (a) unsuitable background data; (b) unclear sidewalk segment; (c) no building in background; (d) background building far away.
Figure 11.
Example cases with incorrect or no slope calculation: (a) unsuitable background data; (b) unclear sidewalk segment; (c) no building in background; (d) background building far away.
6. Conclusion and Future Research
Our technique utilizes GPS trajectory data and Google Street View image data to calculate slope of sidewalks, and recommend suitable routes in real time. An experiment was conducted to evaluate the proposed technique. The experiment result indicates that the technique does not work in all cases and a few cases in which the technique does not work were identified.
While the proposed technique is promising, the work in the paper provided insights into several new research questions. One is about finding a larger number of trajectories and images to test the technique to determine its appropriateness for calculating slopes. Another research question concerns users behavior to further understand their preferences. To address this research question, new image processing techniques to detect additional route features from images, such as sidewalk surface, material, and obstacles, need to be investigated. Coupling these features with user preferences, navigation services appropriate for assisting PWDs can be developed.

