Article

GIS-Based Borderlands Modeling and Understanding: A Perspective

1
National Geomatics Center of China, Beijing 100830, China
2
School of Geography, Beijing Normal University, Beijing 100875, China
*
Author to whom correspondence should be addressed.
ISPRS Int. J. Geo-Inf. 2015, 4(2), 661-676; https://doi.org/10.3390/ijgi4020661
Submission received: 19 August 2014 / Revised: 27 October 2014 / Accepted: 3 February 2015 / Published: 20 April 2015
(This article belongs to the Special Issue Borderlands Modeling and Analysis)

Abstract

:
Borderland regions are special areas and deserve more attention in global sustainable development. Reliable geo-information and effective analysis tools are requested to support borderlands studies through the integrated utilization of geospatial analysis, web service, as well as the other domain-specific expertise. This paper has reviewed the state-of-the-art of geospatial information sciences, (GIS)-based borderlands modeling, and understanding. From the perspective of GIS, integrated data modeling, comprehensive analysis, and collaborative information service are identified as the three major challenges in this filed. A research agenda is further proposed with four topics, i.e., classification and representation of borderland information, derivation of neighborhood information, development of synergetic analysis, and design and development of a geo-portal for borderlands studies. This interdisciplinary study requires a closer and in-depth collaboration of geopolitics, international relation, geography and geo-spatial information sciences.

1. Introduction

On 22 June 2012, world leaders renewed their commitment to sustainable development and reaffirmed the promotion of an economically, socially, and environmentally sustainable future of our earth for present and future generations [1]. A set of Sustainable Development Goals (SDGs) was agreed to, such as poverty eradication, changing unsustainable practices, promoting sustainable patterns of consumption and production, protecting and managing the natural resource base of economic and social development. An official United Nation (UN) paper entitled “The Future We Want” was issued [2]. The preparation of a post-2015 development agenda is in progress for the operational implementation of the SDGs. This has stimulated intense discussion and research in all three of its dimensions, economic, environmental and social, such as green growth [3], Biodiversity [4], and global understanding [5]. A number of initiatives have been proposed by various organizations and societies, such as the Future Earth Initiative by International Council of Science [6], United Nations Initiative on Global Geospatial Information Management (UN-GGIM) [7].
From global point of view, border regions are special areas with specific sustainable development requirements and deserve more attention. A borderland region generally refers to the land area adjoining and outside state boundary lines, or the ocean area among maritime neighbors [8,9]. It is the natural transition and convergence area where people, goods, services and ideas flow across boundaries or sea from state to state [10]. Borderland cooperation has increased dramatically in the last ten years in many fields, such as cross-border infrastructure development, trans-boundary water management, and agricultural development [11]. Border regions may also have different characteristics or geographic conditions than the inner or central parts of the neighboring nations. Less attention and investments are devoted to some remote border regions. This has led to some special problems occurring in the border regions, such as cross-border pollution, conflicts in un-delimitated boundary areas, and non-traditional security issues as well as under-development in some areas. Mutual cooperation and collective problem solving in border regions will reinforce the UN SDGs and should be put into the post-2015 UN sustainable development agenda.
A good understanding of the nature of border regions is a fundamental necessity for well-coordinated cooperation. This depends critically on the availability of reliable information and the capacity of analysis and forecasting, as recognized by the UN paper “The Future We Want”. During the last twenty years, earth observation and geospatial information sciences (GIS) as well as enabling platforms have enhanced our capability to analyze, monitor and report on sustainable development and other key concerns. Having efficient integration and effective analysis of all the socio-economic and environmental information of a given border region will help to achieve a better understanding of its historical context, critical evolution, cooperation as well as conflict management [12]. This is a multi-disciplinary task and requires a good combination of geo-political thinking, international relation theory, geographic analysis, and geo-spatial information technology as well as some other related subjects. New concepts, methods, and algorithms as well as advanced computing platforms need to be developed.
To advance scientific research in this field and to provide reliable geo-spatial information service, a joint workshop on borderlands modeling and understanding for global sustainability was co-organized by the International Society of Photogrammetry and Remote Sensing (ISPRS), International Geographical Union (IGU) and International Cartographic Association (ICA) from 5–6 December 2013 in Beijing, China. The workshop addressed topics, including scientific challenges and perspectives in borderlands studies; analytical and quantitative methods for borderlands; understanding of borderlands features; understanding cross-border communication and security; and modeling and representation of digital borderlands. On the basis of the fruitful presentations and discussions of the workshop, this paper examines the major challenges of GIS-based borderlands modeling and understanding for global sustainability in a digital age. Section 2 gives a literature review about the state-of-the-art in this field. Section 3 examines the three major challenges in borderlands modeling and understanding. A research agenda is proposed in Section 4.

2. Literature Review

The state-of-the-art of borderlands modeling and understanding is reviewed here with a GIS perspective, i.e., from borderlands data acquisition, theme spatial analysis and visualization, to borderlands monitoring and management.

2.1. Borderlands Data Acquisition

Borderlands modeling and understanding depends on both spatial (e.g., vector boundary, geo-referenced remotely sensed imagery) and non-spatial (e.g., socio-economic census) data. The development of borderlands data sets started from international boundary areas in the beginning of the 1990s, and GIS was found to be very useful for managing the voluminous boundary records [13]. A GIS-based digital boundary database was designed and developed to integrate all the multi-media, multi-temporal and multi-scale boundary documents and data since the middle of the 1990s [14]. By the end of 2010, China had completed its digital boundary with a length of over 22,000 kilometers [15]. The European Union has also developed a boundary data model to integrate both geometric and theme data of European nations.
The second type of borderlands data sets is focused on the adjacent administrative units from the neighboring nations. For instance, a dataset for United States-Mexico border regions was compiled, which comprises 25 U.S. counties in four states and 38 Mexican municipios in six states, touching the two countries [16]. As the political boundaries of counties and municipios are used for the geographical definition, the data are only limited to the census data from the decennial censuses of population and housing taken from 1950 to 2000, along with estimates of a few variables for which there are no census reports (e.g., local income). Since some important phenomena do not necessarily follow state boundaries or administrative units strictly, such as environmental influences. Efforts have been devoted to develop borderlands data sets along international rivers, cross-border zones, etc. Typical examples include the international river boundaries database [17], trans-boundary environments data [18], and cross-border disaster relief data [19]. International Water Events Database produced in the Basins at Risk project by the Department of Geosciences, Oregon State University is a widely used water event database fortrans-boundary freshwater dispute studies [20].
The third type of borderlands data sets developed has a global scale, but limited mainly to the digital representation of international systems. A typical work is CShapes, which is a data set on the historical maps of state boundaries and capitals in the post-World War II period [21]. Two different types of change of the shape and configuration of a state’s core territory over time are represented. One is the territorial change occurring when states merge or dissolve, and the other is the change of the state configurations in the absence of emergence or disappearance of states. The “Geo-referencing of ethnic groups” (GREG) dataset was developed on the basis of the classical Soviet Atlas Narodov Mira to represent group territories as polygons, supporting a spatial framework to integrate the ethnic, language, religion and culture [22].
Field surveying and mapping, remote sensing, and census are among the conventional means to obtain borderland-related data. Some new techniques and approaches have been developed and applied tothree-dimensional borderland data acquisition. For instance, stereo panorama has been used for obtaining borderlands landscape by using two cameras combined with pose and position sensors [23]. The method provides three-dimension information of the environment embedded position and direction measurement. Volunteered geographic information (VGI) or crowd sourcing is another borderland-related data acquisition approach. A dynamic integration and updating method was proposed by converting open street map (OSM) data to user data model using machine learning mechanism [24]. However, data quality of VGI remains a major concern of its application [25].

2.2. Theme Spatial Analysis and Visualization

GIS-based spatial analysis was introduced to international boundary making in the middle of the 1990s. The demarcation of the Iraq-Kuwait boundary and the Israel-Jordan boundary was among the earlier applications [13]. Two special GIS-based analysis systems were developed to support international boundary making by combining boundary legal knowledge with GIS spatial analysis [15]. The first one was a boundary delimitation analysis system, aiming to bring the boundary in the real world to the negotiation table and to facilitate the settling of differences and boundary delimitation on digital maps. The basic functionalities comprised the assembling, assessment and presentation of evidence, difference analysis of disputed areas, preparation of attached maps, and boundary treaty. It served as an operational system during China-Vietnam land boundary delimitation from 1996 to1999, and the major users were diplomats, lawyers and political advisers. The second was a boundary demarcation system that aimed at facilitating the transformation of the boundary defined on the map onto the digital landscape model and then to the real terrain. The major functionalities consist of transforming analysis of boundary lines, site selection of boundary markers, recording demarcation results and generation of an attached treaty map. It was used for supporting the entire demarcation process of China-Vietnam land boundary from 2002 to 2009, as well as the inspection of the China-Nepal boundary.
Currently, there are efforts to develop new spatial analysis models for boundary making. For instance, used a least-cost path analysis to conduct an automatic match between delimitation line and real terrain [26]. Using this new method, the cost layer can be derived from the old delimitation line through straight-line distance analysis and terrain line network. The new delimitation line will be generated from the least-cost path analysis with the consideration paid to resource allocation, including water, land area, raw oil, coal and iron ore.
Some boundary areas are characterized by extreme diversity in terms of geology, topology, demography, economy, as well as culture. Specific spatial analysis has been conducted to examine the unique phenomena. For instance, the nature of the contiguous borders that link enduring rivalry dyads was analyzed by modeling the ease of interaction and salience using GIS data [27]. Another example is the identification of the areas of high porosity or high permeability for pedestrians along the southern national border region in Carinthia, Austria, using geo-computational analysis and terrain, land use, and road system data [28].The impact of border policy effect on people’s daily life for border management was studied with the help of GIS-based analysis, such as a case study of cross-border ethnic areas of China-Burma [29]. Land use and cover change in border areas were also analyzed, such as twin-cities on the Russian-Chinese border [30], land cover change in China’s neighboring countries from 2001 to 2009 [31] .
There has been an increase of theme analysis devoted to border regions during the past few years. For instance, trans-boundary water pollution analysis within two divergent cultural regions (western Washington and southern British Columbia) was conducted by using a newly developed Trans-boundary Environmental Management Index (TEMI) [32]. Quantitative analysis was conducted for analyzing and understanding cross-border cooperation in the economic integration of the border regions European Union [33,34]. Security analysis was conducted with event data for the international river, Yarlung Zangbo-Brahmaputra, which connects South Asia countries such as China, India, Bhutan and Bangladesh [35].
The analysis and visualization of social network websites and web-based media data has been used in borderlands studies. Web crawler data mining technology was applied to analyze Huang Yan Island incident with web-based text, word frequency, sentiment tendency, and dissemination path [36]. It is assumed that the public-contributed data can help the characterisation of geo-events and reveal implications of these phenomena on the era of “big data”. In addition, new visualizations means have been explored to represent borderlands information. Different than traditional thematic maps, cartogram, or value-by-area maps was employed by Liao and Dong [37] to visualize countries’ competitiveness to gain a better understanding of the distribution of national strength although the effectiveness of such visualizations has been doubted [38,39]. Li et al. presented a tag cloud-based visualization forgeo-referenced text information [40].

2.3. Borderlands Monitoring and Management

The border and the borderlands between certain countries are very extensive and dynamic [41]. Earth observation can play an important role in borderlands monitoring and management. Airborne digital multispectral imagery and interactive image analysis techniques have been used to monitor cross-border trails [42]. The European Commission (EC) and the European Space Agency (ESA) have launched a joint program, namely Global Monitoring for Environment and Security (GMES), to monitor the marine and land environment in an operational context [43]. It is designed to generate and deliver environmental information to decision makers by gathering and processing satellite, in situ and, socio-economic data. One of the GMES components is security service, which aims to provide intelligence and early warning services to support root-cause analysis of regional crises, such as weapons proliferation, fighting for natural resources, population pressure, land degradation, and illegal activities in the domains of migration and border monitoring natural resources and conflicts, nuclear and treaties monitoring and critical assets.
Some institutions conducted the collection of situation information about boundary and borderlands. For instance, the International Boundaries Research Unit (IBRU) at the University of Durham collected information on boundary events and territorial disputes around the world through a variety of international news and information sources [44]. US and Canada agreed to work together, “not just at the border, but beyond the border to enhance the security and accelerate the legitimate flow of people, goods and services”. Improving cooperative law enforcement capacity and national intelligence- and information-sharing are among the specific measures in implementing this “Beyond the Border action plan” [45]. A surrounding transaction plotting and management system has been reported [46]. It analyzes the common electronic map service platform by taking into account the surrounding affairs plotting aid management system and provides the efficient real-time online map plotting and sharing tools.

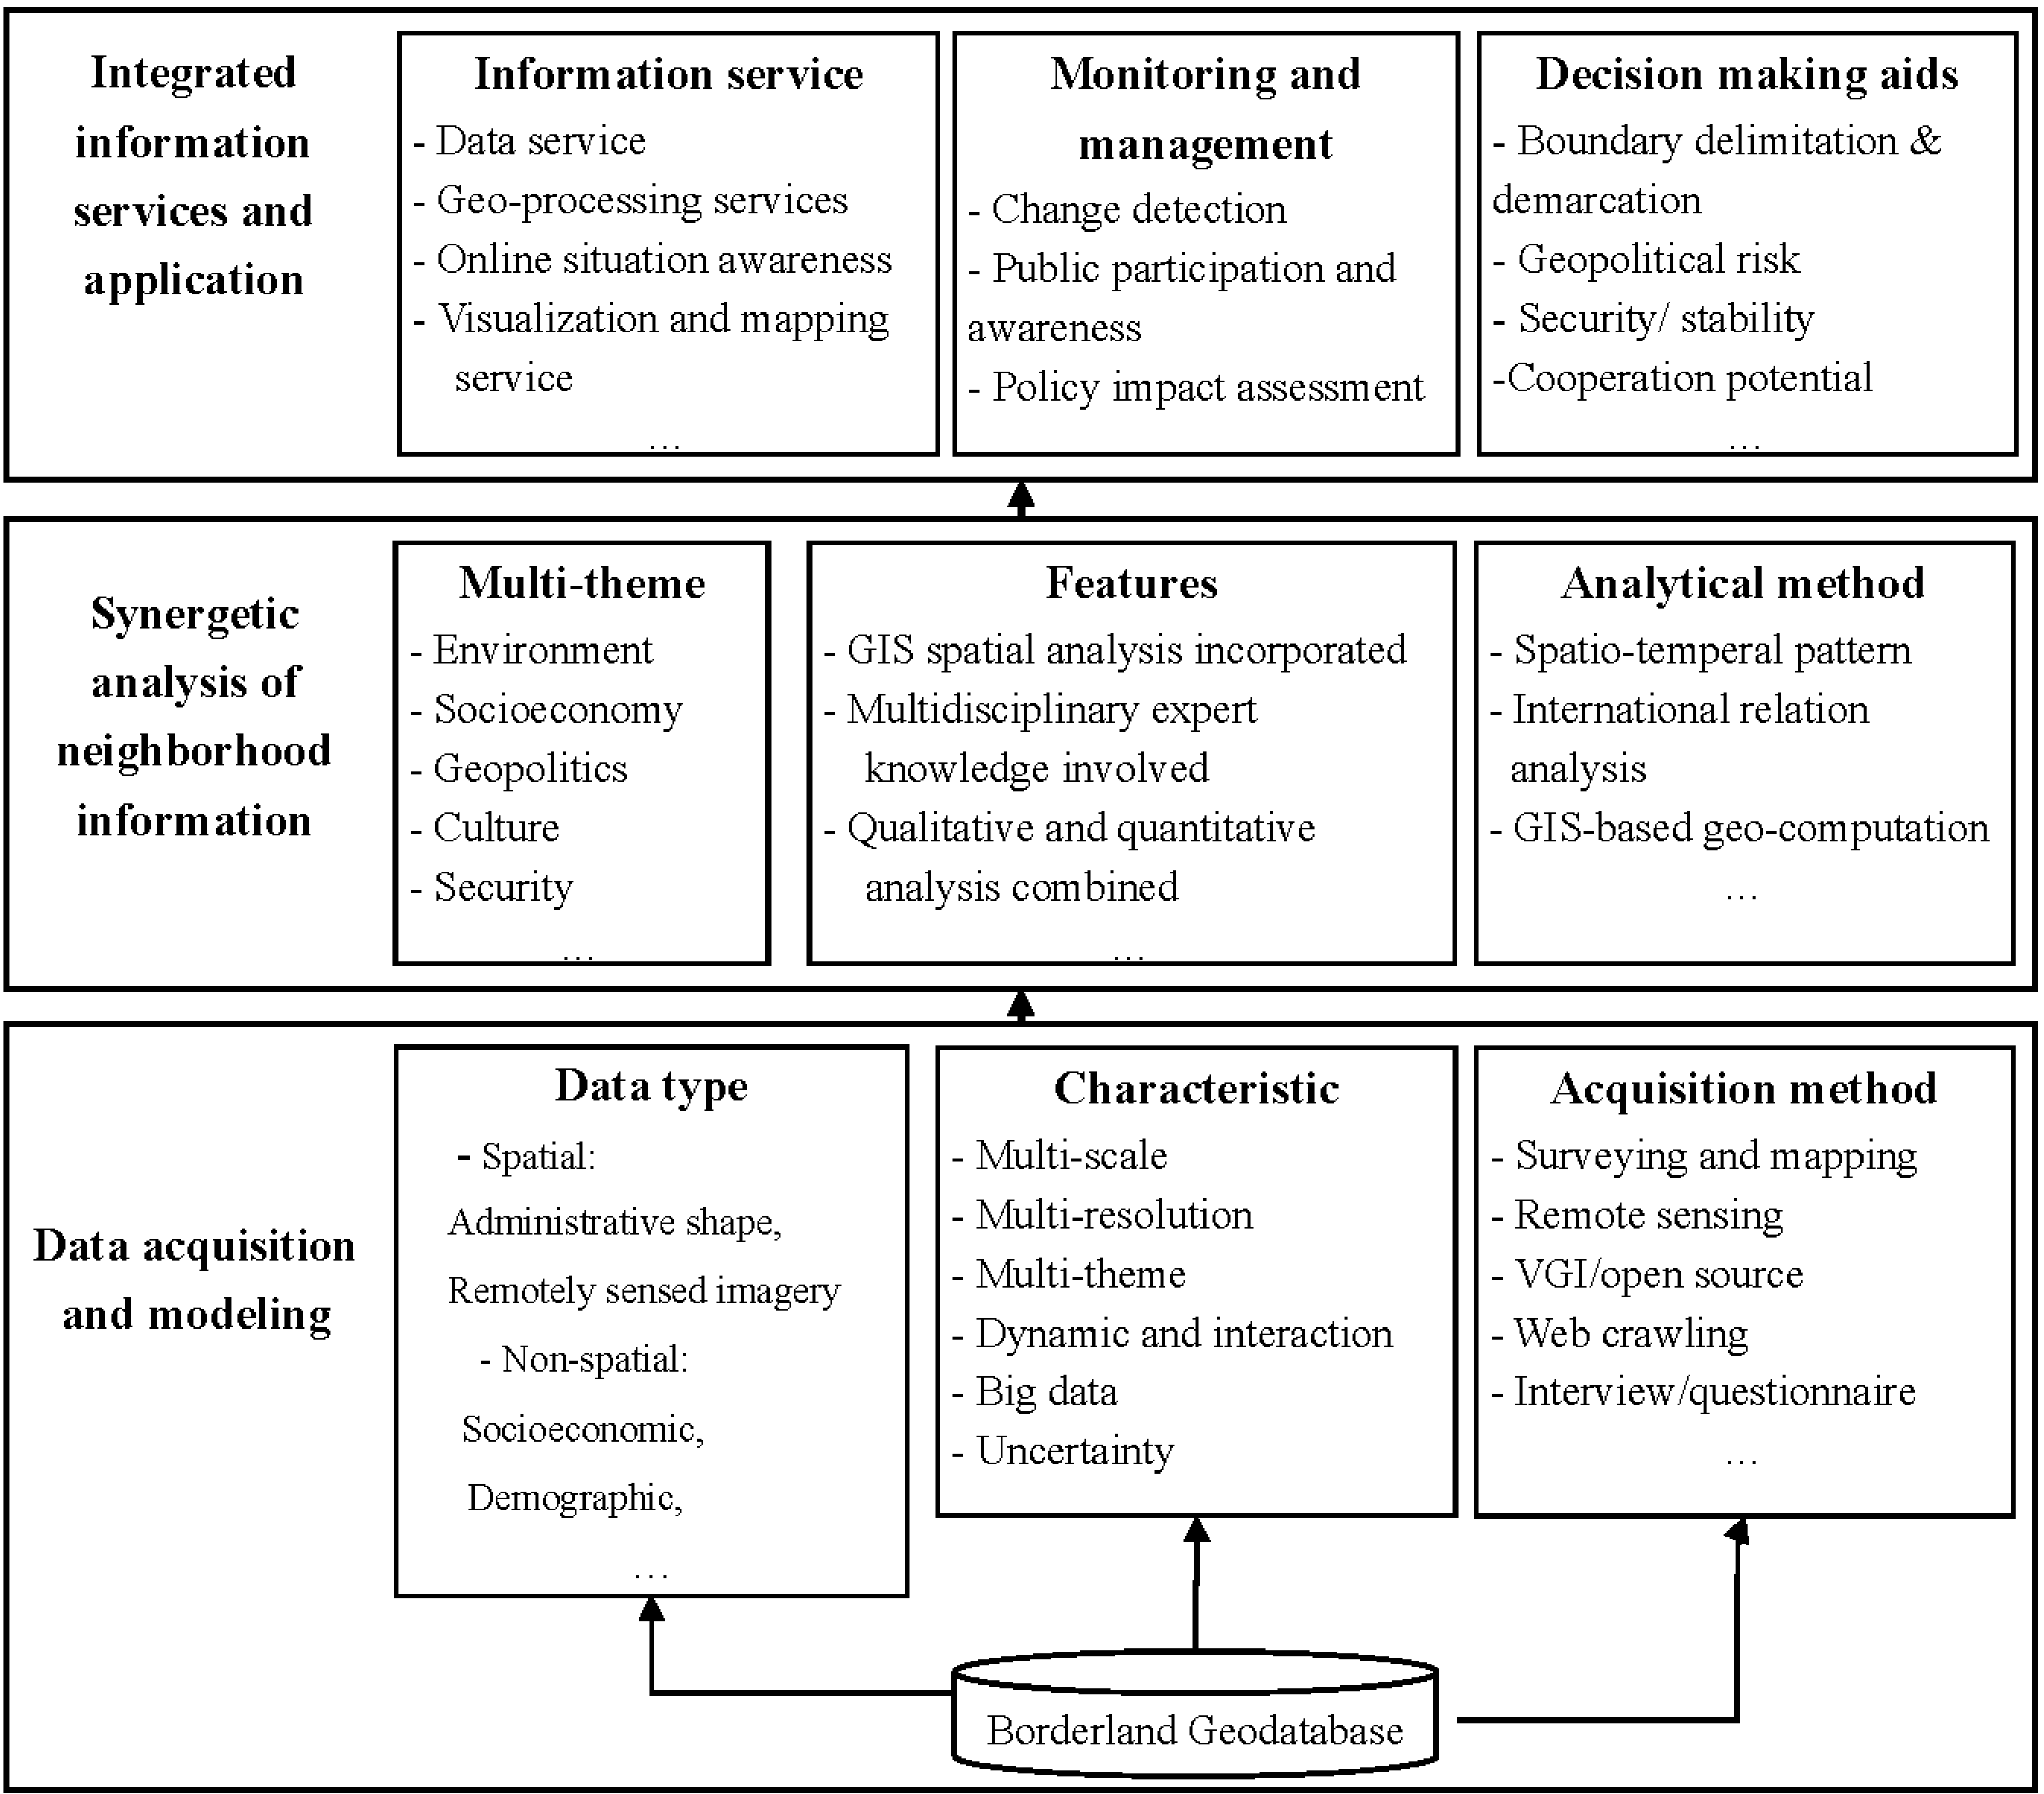
3. Challenges in GIS-Based Borderlands Modeling and Understanding

Nowadays there is an awareness gap between borderlands challenges and UN SDGs. This can be mediated by advancing borderlands studies through a new level of research collaboration among the social, natural and engineering sciences. Three major challenges can be identified in terms of GIS-based borderlands modeling and understanding (Figure 1).
Figure 1. The framework of GIS-based borderlands modeling and understanding.
Ijgi 04 00661 g001

3.1. Integrated Borderlands Data Modeling

The representation of borderlands phenomena and events in a digital environment is one of the major tasks of borderland modeling, and the natural environment and socioeconomic activities of borderlands should be taken into consideration. In comparison with the previously mentioned boundary data modeling, the abstraction and representation of borderlands features (objects) and their relationships take different ways. Some researchers may need basic datasets of directly observed phenomena, while some others might prefer to utilize derived forecast products. It is therefore essential to understand the diverse and evolving range of user needs to identify critical borderlands features (objects). This will lead to the development of a borderland-specific spatial data model for the representation of the borderlands phenomena and events. Due to the extensive and dynamic nature of borderlands, the formulation of borderlands models for analytical concerns is difficult. Brunet-Jailly had suggested a general framework of borders with four major components, i.e., market forces and trade flows, policy activities of multiple levels of governments on adjacent borders, the particular political clout of borderland communities, and the specific culture of borderland communities [10]. This Canada-US-border based research result can provide us with some useful thoughts for the conceptual modeling of borderlands phenomena. However, the definition and representation of the key borderlands features (objects) and neighborhood variable needs more in-depth investigation. The following are three factors to be considered:
  • Multi-scale: since the geographical extent of borderlands does not follow an absolute area, there are significant differences of natural phenomena and human activities in different geographical scales (national-, regional-, and sub-regional scale). Borderlands data modeling should represent spatial information and related properties in various scales [47]. Non-spatial data should be organized hierarchically. Due to the data accessibility and availability, upscaling or downscaling processes are necessary under specific conditions. For example, a downscaling method should be applied to produce population density grids from the country- or province-level census data [48]. As the border regions are much larger than the boundary strip areas, a multi-scale and multi-resolution data modeling strategy is becoming necessary to meet different user requirements or priorities from their specific applications.
  • Dynamic interaction: the natural process (e.g., seasonal variation of water resources of international rivers) and anthropological activities (e.g., migration over borders) are highly dynamic and interactive over time and space. The dynamic interaction between humankind and environment (e.g., resulting in land use/cover changes) and between different peoples (e.g., migration, trade, cultural exchange, conflicts, etc.) raises difficulties in data acquisition and modeling, which should support the analysis of drivers, development and impacts of such dynamics and interactions. Some regression models were developed to represent the interaction between build-up land and population density [49] and to simulate interaction between carbon footprint and environment [50]. A focused web crawler has been developed and used to collect the dynamic borderlands situation information [36], and to derive those news reports about the borderland events to dynamically create borderland-situation charts, both in spatial- and time-series.
  • Harmonization of dataset: borderlands data collection and processing can be achieved through the utilization of earth observation, crowdsourcing information, and conversion and harmonization of existing open data sets at global, regional and national scales. However, many existing social-economic and geo-political data often lack a clear spatial context referent, and the specific units and boundaries are often not the same [22]. The integration of all the available data sets for consistent and reliable borderlands data sets remains one of the most difficult tasks. New technical standards and data processing methods need to be investigated.

3.2. Comprehensive Borderlands Analysis

Cross-border co-operation and its win-win reciprocity depend significantly on a combination of various facilitating factors, including political leadership, economic competitiveness, cultural interaction, and geographical conditions [34,51]. A better understanding of these border issues can be realized through historical trend analysis, operational tactical decision analysis, as well as strategic planning and forecasting. Currently, most borderlands analysis are single theme-oriented, such as economic integration of the border regions [33,34], cross-border cultural diversity and dynamism [41], trans-boundary environmental issues [52] , combat against cross-border crime [53], and foreign diplomatic presence [54]. A comprehensive analysis of the effects of geographical conditions and its synergy with social, economic, political and cultural analysis in borderlands affairs is still missing [55,56]. The development of such comprehensive borderlands analysis is becoming another big challenge. Both GIS-based analysis and multi-disciplinary knowledge need to be incorporated into borderlands studies.
  • GIS-based spatial analysis: The geographical location and other geographical conditions have significant impacts or effects on the neighboring environment and borderlands policy. With advanced GIS-based spatial analysis, it is possible to compute their effects or evaluate the impacts, such as the differences of accessibility with or without geographical obstacles [34], spatial interaction among various (political, economic, or cultural) neighboring units [57], spatial heterogeneity of landscape, and neighborhood [58]. There are a number of GIS spatial analysis methods available, such as multi-criteria decision analysis [59], spatial relation computation [60], etc. For instance, neighboring countries share common boundaries or have other kinds of adjacent relations. A Voronoi-based k-order relation model may be used for a quantitative and qualitative analysis modeled [61].
  • Multidisciplinary expert knowledge: Some borderlands phenomena and affairs require a synergetic analysis of both geographic condition and other socio-economic, cultural and environmental factors. For instance, international or regional emergency rescue and peacekeeping activities are based on geopolitical risk analysis and forecasting. The security and stability status, potential for cooperation and possible conflicts are among other subjects of synergetic analysis. This requires an integration of multi-disciplinary expert knowledge from academia, government sectors, and international organizations. Effort has been made to model geo-political influence among nations using a set of indicators and multi-variables estimate method [62]. The geo-political influence of China and the United States (US) in South Asia during 2007–2012 was also modeled [63]. The geo-advantages of border-cities in cross-border industrial and enterprise cooperation were studied to reveal a geo-political and geo-economic mode for border-cities [64]. The framework for analyzing re-scaling processes was proposed and applied to a case study of the Dutch-German EUREGIO cross-border region [65].

3.3. Collaborative Borderland Geospatial Service

At present, most research institutions and organizations in the field of borderlands studies have kept their developed data sets for internal use, for both historical and sensitive reasons. However, there are a few websites where some common data sets are published and can be downloaded, such as CShapes dataset, international river boundaries database [17], U.S.-Mexico Border Dataset [66], Shared River Basin Database [67], and international freshwater treaties database [68]. From the point view of web services, the data and services provided by these websites are fragmented in terms of coverage and are not connected, forming de facto “information islands”. In addition, they provide only static or snapshot-based borderlands information. As border regions have a dynamic nature, a number of natural features or social-economic phenomena change over time, such as the changes in boundary watercourse bed, expansion of built up areas, economic growth, population increase, biodiversity degradation as well as territorial change. Establishing collaborative geospatial services that provide data sharing, analysis, visualization and mapping services in an efficient way is becoming the third challenge in borderlands modeling and understanding. This can be supported by a web service-based collaborative borderland geospatial service platform that provides geospatial resource, geo-processing and mapping tools [69].
  • Distributed borderland data sharing: The first objective of such a collaborative borderland geospatial service platform is to connect all the borderlands related open data sources scattered around the world and to provide “one stop” information sharing. This will enable researchers and users to have an easy access to historical and up-to-date borderlands data and to share their own data with the others. One of the key challenges is how to ensure a continuous updating of these borderlands data sets. While earth observation approaches can be used for spatial change detection [70], some other situation changes can be collected using topic-specific web crawlers from the huge source of information contained in the Internet [71].
  • Borderlands geo-processing services: While data sharing is a lower level of collaborative geospatial services, the analytical models or paradigms of data processing and analysis from different borderland research groups and relevant scientific communities can be shared through geo-processing services. Visualization and mapping service can be one of the geo-processing services that will facilitate the interactive data exploration and efficient presentation of analysis results. A high performance of geo-computation infrastructure is required to achieve this goal [72].

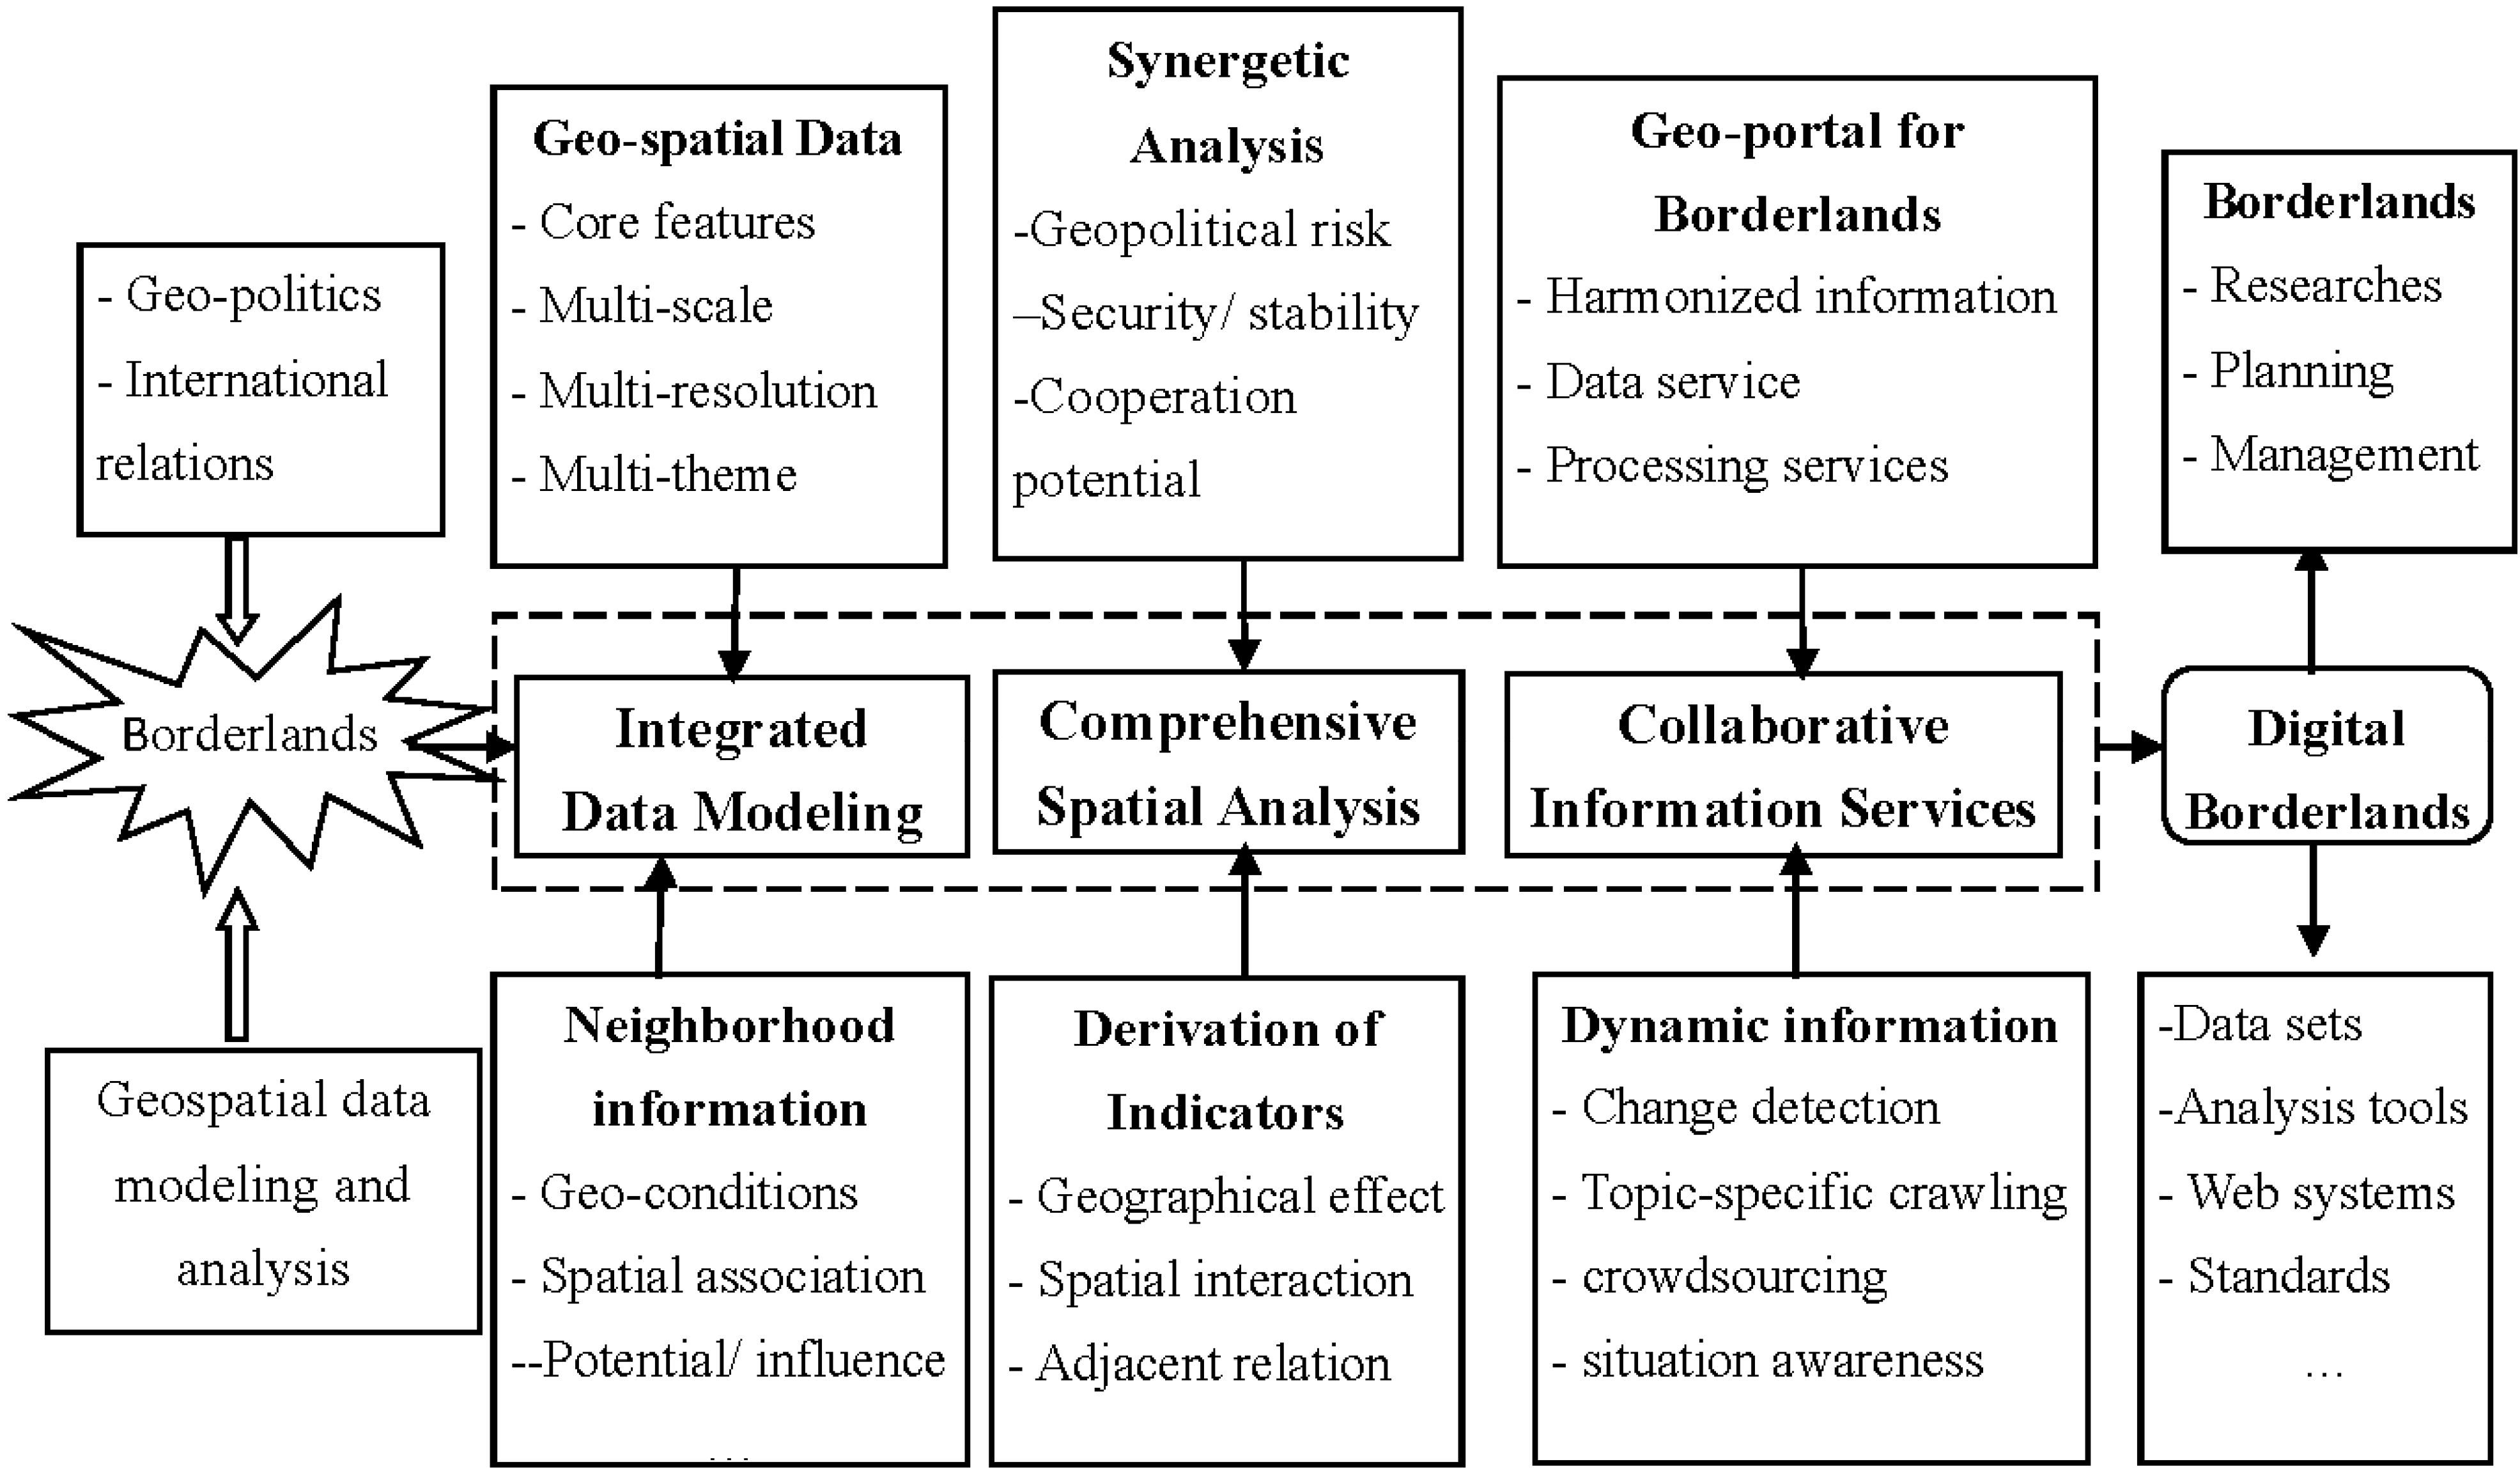
4. A Research Agenda

In order to address the abovementioned challenges, it is natural to expend the study areas from the traditional narrow strip area (normally 5–10 km wide) of an international boundary to a much larger surrounding area (about several tens to hundreds of kilometers wide). In addition, more kinds of information are required to support regional emergency rescue, peacekeeping activities, natural disaster assessment, and other borderlands studies. This leads to a natural move from previous “digital boundary” to “digital borderlands” with the advance of Earth Observation, GISs and Web technologies [15,73]. The so-called “digital borderlands” refer to a digital representation of borderlands phenomena and events, special borderlands analysis and simulation tools, as well as “one stop” information portal [74]. It aims at providing more reliable information and more efficient tools to support borderlands studies, cross-boundary planning, development and management. Several theoretical and technological issues need further investigation.

4.1. Classification and Representation of Borderland Information

Geo-spatial data and neighborhood information are two major kinds of data in “digital borderlands” [74]. The former consists of multi-scale topographic data, multi-resolution imagery and land cover data, geographic names, as well as core borderlands features. The latter comprises geo-conditions, spatial association and geo-potential or influence. Their conceptual representation and logical data modeling all require sound formal classification and description of the core features (objects), relationships, operations and rules.
While topography, space imagery, land cover and land use, place names, administrative and other political units serve as the basic geo-spatial data, there are some core features (objects) and relations that are specific for borderlands studies. Some of these features (objects) are critical for a particular field, and others support a broad range of borderlands studies. This gap can be filled by a cross-sectoral meta-analysis of borderlands study priorities from the perspective of users [75]. As far as the neighborhood information is concerned, a set of spatial association indicators need to be identified for representing integration in different domains, such as population migration, trans-boundary ethnics/religion/transportation for social association, bilateral trade, regional groups and FDI (I/O) for economic association, trans-boundary water, energy and minerals for resource association.
It is known that information uncertainty exists during the process of data generation, acquisition, modeling, analysis and visualization. For example, public generated data (e.g., OSM, social network data) produce uncertainties because of lacking data quality control mechanism. In addition, the process of data handling (e.g., upscaling and downscaling) can also bring and propagate uncertainties [76]. Therefore, components of uncertainty and their relationships should be understood and how information uncertainty affect analysis and decision-making should be addressed [77].

4.2. Derivation of Neighborhood Information

The derivation of neighborhood information raises some methodological and technical questions. Firstly, some neighborhood phenomena do not necessarily follow state boundaries, such as economic association and environmental influences. Well-designed multi-granular neighborhood tessellations as the basic spatial units will facilitate the collection, aggregation and processing of the indicators of the geo-conditions, spatial association and geo-potential or influences. Secondly, special algorithms and approaches remain to be developed for deriving these indicators through the calculation or derivation of socio-economic statistics and other theme data.
Recently, the world’s first 30 m-resolution global land cover dataset, GlobeLand30, wasdeveloped [78,79] and released for open access (www.globeland30.org). It has been used to derive neighborhood information, such as spatial relations of ethnic groups and their land cover activities, and the impact of borderlands land cover changes on ecological environment as well as cross-border influence.

4.3. Development of Synergetic Analysis

There are increasing demands for synergetic analysis of geopolitical risk, security and stability status, cooperation potentials for an entire neighborhood region, a specific transportation lifeline, or some other specific areas. Domain-specific analysis models should be developed, including the definition of appropriate evaluation criteria and models, comparison of alternative actions and the formulation of policy advices. This will depend on the understanding of the borderlands phenomena or affair concerned and can be supported by a good combination of geopolitical thinking, international relation analysis and GIS-based geo-computation.
Figure 2. Technical architecture of geo-portal for borderland studies.
Ijgi 04 00661 g002
For example, comprehensive key indicators need to be developed for the quantitative measurement of the geo-influence among countries by taking into account of the hard power, soft power and interdependent power factors. In addition, the comprehensive distance system (centroid distance, boundary distance, time distance and friction distance), the relationship and geo-political structure should also be incorporated into the study of geo-influence.

4.4. Design and Development of a Geo-Portal for Borderlands Studies

The harmonized borderlands information and collaborative information service can be embedded through the design and development of a geoportal, which is a special type of web portal, dealing with geospatial data and geospatial processing services [80].
This geo-portal will not only serve as a data dissemination platform, but also as an open system that supports the discovery, exchange, advertisement and delivery of borderlands information resources on the Web [56,75]. Highest level of semantic interoperability, crowdsourcing information collection, topic-specific web crawling, change monitoring with multi-temporal imagery, and ontology-based online situation awareness are among the key issues to be investigated. Some of the key technical design and implementation issues of such a geo-portal is shown in Figure 2.

5. Summary

Border regions are very important areas in our changing world and deserve more attention in the global sustainable development. A clearer awareness and well-coordinated development of the border regions will reinforce the UN SDGs and benefit humanity. This can be advanced by promoting borderlands modeling as well as understanding with new modeling and analysis capabilities. This paper identified integrated data modeling, comprehensive analysis and collaborative information service as the three major challenges in this field from a GIS perspective. A research agenda was further proposed with four major topics, i.e., classification and representation of borderland information, derivation of neighborhood information, development of synergetic analysis, and design and development of a geo-portal for borderlands studies.
GIS-based borderlands modeling and understanding is an interdisciplinary study. A new level of research collaboration among the social, natural and engineering sciences is requested to develop innovative concept, methods, algorithms, as well as advanced computing platforms. In particular, a closer and in-depth collaboration of geo-politics, international relation, geography and geo-spatial information sciences is obligatory.

Acknowledgments

This study was funded by Ministry of Science and Technology of China (Project No. 2012BAK12B00). All the authors gratefully thank the reviewers and editors.

Author Contributions

Jun Chen designed the framework of this paper, drafted and finalized the manuscript. Ran Li contributed to the Section 3 and Section 4. Weihua Dong contributed to Section 2. Yuejing Ge and Yang Cheng contributed to Section 3.2 and Section 4.3.

Conflicts of Interest

The authors declare no conflicts of interest.

References

  1. Hecht, A.D.; Fiksel, J.; Fulton, S.; Yosie, T.; Hawkins, N.; Leuenberger, H.; Golden, J.; Lovejoy, T. Creating the future we want. Sustain. Sci. Pract. Policy 2012, 8, 62–75. [Google Scholar]
  2. Join the Global Conversation and Share Your Ideas on What a Sustainable Future Might Look Like—For You, Your Family and Your Community. Available online: http://www.un.org/futurewewant (accessed on 2 April 2015).
  3. Bartelmus, P. The future we want: Green growth or sustainable development? Environ. Dev. 2013, 7, 165–170. [Google Scholar] [CrossRef]
  4. Pereira, H.M.; Ferrier, S.; Walters, M.; Geller, G.N.; Jongman, R.H.G.; Scholes, R.J.; Bruford, M.W.; Brummitt, N.; Butchart, S.H.M.; Cardoso, A.C.; et al. Essential biodiversity variables. Science 2013, 339, 277–278. [Google Scholar] [CrossRef] [PubMed] [Green Version]
  5. The IGU Initiative of Global Understanding. Available online: http://www.global-understanding.info/ (accessed on 2 April 2015).
  6. Future Earth—ICSU. Available online: http://www.icsu.org/future-earth (accessed on 2 April 2015).
  7. United Nations Initiative on Global Geospatial Information Management. Available online: http://ggim.un.org/ (accessed on 2 April 2015).
  8. Anderson, M. Frontiers: Territory and State Formation in the Modern World; John Wiley & Sons: New York, NY, USA, 2013. [Google Scholar]
  9. Brunet-Jailly, E. Borders, borderlands and theory: An introduction. Geopolitics 2011, 16, 1–6. [Google Scholar] [CrossRef]
  10. Brunet-Jailly, E. Theorizing borders: An interdisciplinary perspective. Geopolitics 2005, 10, 633–649. [Google Scholar] [CrossRef]
  11. Bernal, J.M.; Sols, A.H. Conflict and cooperation on international rivers: The case of the Colorado River on the US-Mexico border. Int. J. Water Resour. Dev. 2000, 16, 651–660. [Google Scholar] [CrossRef]
  12. Houtum, H.V. The Geopolitics of borders and boundaries. Geopolitics 2005, 10, 672–679. [Google Scholar] [CrossRef]
  13. Adler, R. Geographical Information in Delimitation, Demarcation, and Management of International Land Boundaries; Ibru: Durham, England, 2001. [Google Scholar]
  14. Chen, J.; Li, J.; He, J.; Li, Z.-L. Development of Geographic Information Systems (GIS) in China: An overview. Photogramm. Eng. Remote Sens. 2002, 68, 325–332. [Google Scholar]
  15. Chen, J.; Hua, Y.-X.; Wang, F.-L.; Chen, H.-B.; Liu, W.-Z.; Zhou, Z.-W.; Zhang, Y. Research and establishment of China’s digital boundary. Acta Geideica Cartogr. Sin. 2012, 41, 791–796. [Google Scholar]
  16. Anderson, J.B.; Gerber, J. A dataset for U.S.-Mexico border research. J. Borderl. Stud. 2007, 22, 113–118. [Google Scholar] [CrossRef]
  17. Donaldson, J.W. Where rivers and boundaries meet: Building the international river boundaries database. Water Policy 2009, 11, 629–644. [Google Scholar] [CrossRef]
  18. Parris, T.M. Managing transboundary environments. Environ. Sci. Policy Sustain. Dev. 2004, 46, 3–4. [Google Scholar]
  19. Lai, A.Y.-H. Towards a collaborative cross-border disaster management: A comparative analysis of voluntary organizations. J. Comp. Policy Anal. Res. Pract. 2012, 14, 217–233. [Google Scholar] [CrossRef]
  20. Yoffe, S.; Wolf, A.T.; Giordano, M. Conflict and cooperation over international freshwater resources: Indicators of basins at risk. J. Am. Water Resour. Assoc. (JAWRA) 2003, 39, 1109–1126. [Google Scholar] [CrossRef]
  21. Weidmann, N.B.; Kuse, D.; Gleditsch, K.S. The geography of the international system: The CShapes dataset. Int. Interact. Empir. Theor. Res. Int. Relat. 2010, 36, 86–106. [Google Scholar]
  22. Weidmann, N.B.; KetilRød, J.; Cederman, L.-E. Representing ethnic groups in space: A new dataset. J. Peace Res. 2010, 47, 491–499. [Google Scholar] [CrossRef]
  23. Sun, M.; Dong, N.; Zheng, H.; Jiang, C.; Ren, X. A method of 3D-GIS application aided with stereo panorama technology. ISPRS Int. Arch. Photogram. Remote Sens. Spat. Inf. Sci. 2013, XL-4/W3, 123–130. [Google Scholar] [CrossRef]
  24. Zhou, X.G.; Jiang, Y.; Zhou, K.; Zeng, L. A dynamic integration method for borderland database using OSM data. ISPRS Int. Arch. Photogram. Remote Sens. Spat. Inf. Sci. 2013, XL-4/W3, 141–147. [Google Scholar] [CrossRef]
  25. Forghani, M.; Delavar, M.R. A quality study of the OpenStreetMap dataset for Tehran. ISPRS Int. J. Geo-Inf. 2014, 3, 750–763. [Google Scholar] [CrossRef]
  26. Feng, C.Q.; Jiang, N.; Zhang, X.N.; Ma, J. Automatic match between delimitation line and real terrain based on least-cost path analysis. ISPRS Int. Arch. Photogram. Remote Sens. Spat. Inf. Sci. 2013, XL-4/W3, 57–61. [Google Scholar] [CrossRef]
  27. Starr, H. Using geographic information systems to revisit enduring rivalries: The case of Israel. Geopolitics 2000, 5, 37–56. [Google Scholar] [CrossRef]
  28. Hisakawa, N.; Jankowski, P.; Paulus, G. Mapping the porosity of international border to pedestrian traffic: A comparative data classification approach to a study of the border region in Austria, Italy, and Slovenia. Cartogr. Geogr. Inf. Sci. 2013, 40, 18–27. [Google Scholar] [CrossRef]
  29. Bie, Q.; Zhou, S.; Li, C. The impact of Border policy effect on cross-border ethnic areas. ISPRS Int. Arch. Photogramm. Remote Sens. Spat. Inf. Sci. 2013, XL-4/W3, 35–40. [Google Scholar] [CrossRef]
  30. Mikhailova, E.V. Appearance and appliance of the twin-cities concept on the Russian-Chinese border. ISPRS Int. Arch. Photogram. Remote Sens. Spat. Inf. Sci. 2013, XL-4/W3, 105–110. [Google Scholar] [CrossRef]
  31. Zhou, Q.; Yang, S.; Luo, Y.; Cai, M.; Dong, G. Land use and cover in China and the neighboring countries from 2001 to 2009. World Reg. Stud. 2012, 21, 64–71. [Google Scholar]
  32. Norman, E.S.; Melious, J.O. Transboundary environmental management: A study of the Abbotsford-Sumas aquifer in British Columbia and western Washington. J. Borderl. Stud. 2004, 19, 101–119. [Google Scholar] [CrossRef]
  33. Bergs, R. Cross-border cooperation, regional disparities and integration of markets in the EU. J. Borderl. Stud. 2012, 27, 345–363. [Google Scholar] [CrossRef]
  34. Sousa, L.D. Understanding Euopean cross-border cooperation: A framework for analysis. J. Eur. Integr. 2013, 35, 669–687. [Google Scholar] [CrossRef] [Green Version]
  35. Zhou, Q.; Yang, S.; Cai, M.; Lou, H.; Luo, Y.; Zhang, J. Security analysis of international river based on event data of the Yarlung zangbo-Rahmaputra River. World Reg. Stud. 2013, 22, 127–133. [Google Scholar]
  36. Hu, H.; Ge, Y.; Hou, D. Using web crawler technology for geo-events analysis: A case study of the Huangyan Island incident. Sustainability 2014, 6, 1896–1912. [Google Scholar] [CrossRef]
  37. Liao, H.; Dong, W. Cartogram: A new perspective to understand the distribution of geo-political data. ISPRS Int. Arch. Photogram. Remote Sens. Spat. Inf. Sci. 2013, XL-4/W3, 95–98. [Google Scholar] [CrossRef]
  38. Sun, H.; Li, Z. Effectiveness of cartogram for the representation of spatial data. Cartogr. J. 2010, 47, 12–21. [Google Scholar] [CrossRef]
  39. Tobler, W. Thirty five years of computer cartograms. ANNALS Assoc. Am. Geogr. 2004, 94, 58–73. [Google Scholar] [CrossRef]
  40. Li, X.; Hua, Y.X.; Zhao, J.X.; Wang, L.-N.; Wang, P. A tag cloud-based visualization for geo-referenced text information. ISPRS Int. Arch. Photogramm. Remote Sens. Spat. Inf. Sci. 2013, 1, 89–93. [Google Scholar] [CrossRef]
  41. Konrad, V.; Nicol, H.N. Border culture, the boundary between Canada and the United States of America, and the advancement of borderlands theory. Geopolitics 2011, 16, 70–90. [Google Scholar] [CrossRef]
  42. Cao, L.; Stow, D.; Kaiser, J.; Coulter, L. Monitoring cross-border trailsusing airborne digital multispectral imagery and interactive image analysis techniques. Geocarto Int. 2007, 22, 107–125. [Google Scholar] [CrossRef]
  43. Donlon, C.; Berruti, B.; Buongiorno, A.; Ferreira, M.-H.; Féménias, P.; Frerick, J.; Goryl, P.; Klein, U.; Laur, H.; Mavrocordatos, C.; et al. The global monitoring for environment and security (GMES) sentinel-3 mission. Remote Sens. Environ. 2012, 120, 37–57. [Google Scholar] [CrossRef]
  44. Donaldson, J.W.; Pratt, M. Boundary and territorial trends in 2004. Geopolitics 2005, 10, 398–427. [Google Scholar] [CrossRef]
  45. Vukov, T.; Sheller, M. Border work: Surveillant assemblages, virtual fences, and tactical counter-media. Soc. Semiot. 2013, 23, 225–241. [Google Scholar] [CrossRef]
  46. Cao, Y.; Hua, Y.; Zhao, J.; Guo, S. Design and implementation of surrounding transaction plotting and management system based on google map API. ISPRS Int. Arch. Photogram. Remote Sens. Spat. Inf. Sci. 2013. [Google Scholar] [CrossRef]
  47. Jones, C.B.; Kidner, D.B.; Luo, L.Q.; Bundy, G.L.; Ware, J.M. Database design for a multi-scale spatial information system. Int. J. Geogr. Inf. Syst. 1996, 10, 901–920. [Google Scholar] [CrossRef]
  48. Gallego, F.J. A population density grid of the European Union. Popul. Environ. 2010, 31, 460–473. [Google Scholar] [CrossRef]
  49. Liu, J.Y.; Zhuang, D.F. Land cover classification of China: Integrated analysis of AVHRR imagery and geographical data. Int. J. Remote Sens. 2003, 24, 2485–2500. [Google Scholar] [CrossRef]
  50. Wang, K.-M. The relationship between carbon dioxide emissions and economic growth: Quantile panel-type analysis. Q. Quant. 2013, 47, 1337–1366. [Google Scholar] [CrossRef]
  51. Megoran, N. Neoclassical geopolitics. Polit. Geogr. 2010, 29, 187–189. [Google Scholar] [CrossRef]
  52. Hannis, S.; Bricker, S.; Goater, A.; Holloway, S.; Rushton, J.; Williams, G.; Williams, J. Cross-international boundary effects of CO2 injection. Energy Procedia 2013, 37, 4927–4936. [Google Scholar] [CrossRef] [Green Version]
  53. Lo, S. Globalization, state autonomy and the fight against cross-border crime: Greater China’s cooperation with the world. Asian J. Polit. Sci. 2009, 17, 299–322. [Google Scholar] [CrossRef]
  54. Xierali, I.M.; Liu, L. The effect of power and space on foreign diplomatic presence in the United States: A spatial modelling approach. Ann. GIS 2006, 12, 53–63. [Google Scholar] [CrossRef]
  55. Chen, J.-M.; Lu, X.-H.; Chen, J.; Chen, L.-J.; Chen, J. A spectral gradient difference based approach for land cover change detection. ISPRS J. Photogram. Remote Sens. 2013, 85, 1–12. [Google Scholar] [CrossRef]
  56. Lautze, J.; Wegerich, K.; Kazbekov, J.; Yakubov, M. International river basin organizations: Variation, options and insights. Water Int. 2013, 38, 30–42. [Google Scholar] [CrossRef]
  57. Brambilla, C. New approach in border studies: The need for re-thinking the European-African borderland through the case of the EUSADC relationship and the caprivi strip. J. Borderl. Stud. 2008, 23, 55–68. [Google Scholar] [CrossRef]
  58. Donaldson, J.W. Politics and scale in boundary-making: The work of boundary commissions. J. Hist. Geogr. 2008, 34, 393–396. [Google Scholar] [CrossRef]
  59. Malczewski, J. GIS-based multicriteria decision analysis-a survey of the literature. Int. J. Geogr. Inf. Sci. 2006, 20, 703–726. [Google Scholar] [CrossRef]
  60. Chen, J.; Li, C.-M.; Li, Z.-L.; Gold, C.M. A Voronoi-based 9-intersection model for spatial relations. Int. J. Geogr. Inf. Sci. 2001, 15, 201–220. [Google Scholar] [CrossRef]
  61. Chen, J.; Zhao, R.-L.; Li, Z.-L. Voronoi-based K-order neighbour relations for spatial analysis. ISPRS J. Photogram. Remote Sens. 2004, 59, 60–72. [Google Scholar] [CrossRef]
  62. Wang, S.; Ge, Y.; Cao, Y.; Hu, H. Modeling China’s geopolitical influence in surrounding areas: A case study of South Asia. Progress Geogr. 2014, 33, 738–747. [Google Scholar]
  63. Wang, S.; Cao, Y.; Ge, Y. Spatio-temporal changes and their reasons to the geopolitical influence of China and the US in South Asia. Sustainability 2015, 7, 1064–1080. [Google Scholar] [CrossRef]
  64. Hu, H.; Zhou, J.; Ge, Y. Industry selection and development orientation of Mudanjiang City with its geopolitical advantage. China Soft Sci. 2013, 5, 84–91. [Google Scholar]
  65. Perkmann, M. The construction of New Scales: A framework and case study of the EUREGIO cross-border region. Reg. Stud. 2007, 41, 253–266. [Google Scholar] [CrossRef]
  66. Center for Latin American Studies, San Diego State University. U.S-Mexico Border Dataset. Available online: http://latinamericanstudies.sdsu.edu/ (accessed on 2 April 2015).
  67. Shared River Basin Database—PRIO. Available online: http://www.prio.org/Projects/Project/?x=724 (accessed on 2 April 2015).
  68. Program in Water Conflict Management and Transformation. Available online: http://www.transboundarywaters.orst.edu (accessed on 2 April 2015).
  69. Gong, J.; Wu, H.; Gao, W.; Yue, P.; Zhu, X. Geospatial service web. In Geospatial Technology for Earth Observation Data; Li, D., Shan, J., Gong, J., Eds.; Springer: New York, NY, USA, 2009; pp. 355–379. [Google Scholar]
  70. Chen, J.; Wu, H.; Li, S.-N.; Chen, F.; Han, G. Service oriented dynamic computing for land cover big data. J. Geomat. Sci. Technol. 2013, 30, 369–374. [Google Scholar]
  71. Rungsawang, A.; Angkawattanawit, N. Learnable topic-specific web crawler. J. Netw. Comput. Appl. 2005, 28, 97–114. [Google Scholar] [CrossRef]
  72. Gong, J.; Wu, H. The geospatial service web: Ubiquitous connectivity with geospatial services. Trans. GIS 2012, 16, 741–743. [Google Scholar] [CrossRef]
  73. Chen, J.; Wu, H.; Li, S.-N.; Liao, A.-P.; He, C.-Y.; Cheng, D.-Y. Temporal logic and operation relations based knowledge representation for land cover change web service. ISPRS J. Photogram. Remote Sens. 2013, 83, 140–150. [Google Scholar] [CrossRef]
  74. Chen, J.; Ge, Y.-J.; Hua, Y.-X.; Wang, F.-L.; Yang, S.-T.; Qu, B.; Li, R. Digital borderlands: conceptual framework and research agenda. Bull. Surv. Mapp. 2013, 2, 1–4. [Google Scholar]
  75. Zell, E.A.; Carpenter, A.T.; Friedl, L.A. A user-driven approach to determining critical earth observation priorities for societal benefit. IEEE J. Sel. Top. Appl. Earth Obs. Remote Sens. 2012, 5, 1594–1602. [Google Scholar] [CrossRef]
  76. Khan, M.S.; Coulibaly, P.; Dibike, Y. Uncertainty analysis of statistical downscaling methods. J. Hydrol. 2006, 319, 357–382. [Google Scholar] [CrossRef]
  77. MacEachren, A.M.; Robinson, A.; Hopper, S.; Gardner, S.; Murray, R.; Gahegan, M.; Hetzler, E. Visualizing geospatial information uncertainty: What we know and what we need to know. Cartogr. Geogr. Inf. Sci. 2005, 32, 139–160. [Google Scholar] [CrossRef]
  78. Chen, J.; Chen, J.; Liao, A.; Cao, X.; Chen, L.; Chen, X.; He, C.; Han, G.; Peng, S.; Lu, M. Global land cover mapping at 30 m resolution: A POK-based operational approach. ISPRS J. Photogram. Remote Sens. 2014. [Google Scholar] [CrossRef]
  79. Chen, J.; Ban, Y.; Li, S. China: Open access to Earth land-cover map. Nature 2014. [Google Scholar] [CrossRef]
  80. Longueville, B.D. Community-based geoportals: The next generation? Concepts and methods for the geospatial Web 2.0. Comput. Environ. Urban Syst. 2010, 34, 299–308. [Google Scholar] [CrossRef]

