5.1. World Famous Semantic Landmarks
As a beginning, we have chosen from different countries around the world ten well-known landmarks (
cf. Table 2). The objective here is twofold: (1) first of all, we observe the presence or the absence of each landmark selected in order to evaluate the global reliability of Facebook and Foursquare databases. Then, (2) we verify if the “
Landmark” category (“
Monument/
Landmark” in the case of Foursquare) is relevant in the context of landmark detection.
As we can notice in the
Table 2, all listed landmarks are present in Facebook and Foursquare databases. More specifically, it appears that Facebook categories remain more homogeneous than those ones on Foursquare. Indeed, eight of the 10 chosen landmarks belong to the Facebook “
Landmark” category while only four venues on the list are considered as “
Monument/
Landmark”. This can be explained not because of the variety of landmarks (both Foursquare and Facebook propose an impressive amount of venue categories), but rather because of their distinct category hierarchies. Thus, Foursquare “
Monument/
Landmark” belongs to the “
Government Buildings” supra-category while Facebook’s “
Landmark” category constitutes a top-level category itself. We can suppose that Swarm users tended to look for the exact nature of the listed venues when they have added it (e.g., “Mountain”) while Facebook users were directly able to associate them as a landmark. As a short conclusion, we assume that global landmarks—
i.e., landmark used for global orientation [
30]—will mostly fall into Facebook’s “Landmark” category. In addition, we have inserted geosocial activity score (GSA) of each place as complementary information. Facebook and Swarm GSA cannot be compared since they are based on different indicators (
cf. Section 4.2.2). That being said, we can see that the Eiffel Tower remains indisputably the top-one world semantic landmark. It does make sense since France is the most visited country in the world. In the end, we can see that there is a link between users geosocial activity and venues’ popularity (e.g., nearly 4 million geolocated likes, talking about, and check-ins about the Eiffel Tower on Facebook).
Table 2.
Information of word popular landmarks according to Facebook and Swarm.
Table 2.
Information of word popular landmarks according to Facebook and Swarm.
| Landmark | Swarm Category | Swarm GSA | Facebook Category | Facebook GSA |
|---|
| Eiffel Tower (France) | Monument/Landmark | 111,217 | Monument | 3,896,373 |
| Golden Gate Bridge (USA) | Bridge | 69,960 | Monument | 698,102 |
| Coliseum (Italy) | Historic Site | 65,159 | Landmark | 28,201 |
| Statue of Liberty (USA) | Monument/Landmark | 49,225 | Landmark | 135,036 |
| Christ the Redeemer (Brazil) | Monument/Landmark | 25,487 | Landmark | 43,796 |
| Stonehenge (UK) | Historic Site | 15,669 | Landmark | 479,298 |
| Taj Mahal (India) | Historic Site | 7846 | Landmark | 139,097 |
| Great Pyramids of Giza (Egypt) | Historic Site | 3807 | Landmark | 26,813 |
| Mount Fuji (Japan) | Mountain | 3600 | Landmark | 14,929 |
| Uluru (Australia) | Monument/Landmark | 793 | Landmark | 8176 |
5.2. Global Semantic Landmarks across the City of Paris
Considering what we observed previously, we can assume that the more popular a venue is, the more geosocial activity will be generated from it. In order to verify this hypothesis, we selected five popular places located across the city of Paris. These venues are usually used by tourists for global orientation (
i.e., global landmarks) during their visits: (1) the
Eiffel Tower; (2) the
Arc de Triomphe; (3) the
Place de la Concorde; (4) the
Louvre museum; and finally (5), the
Bibliothèque François Mitterrand (
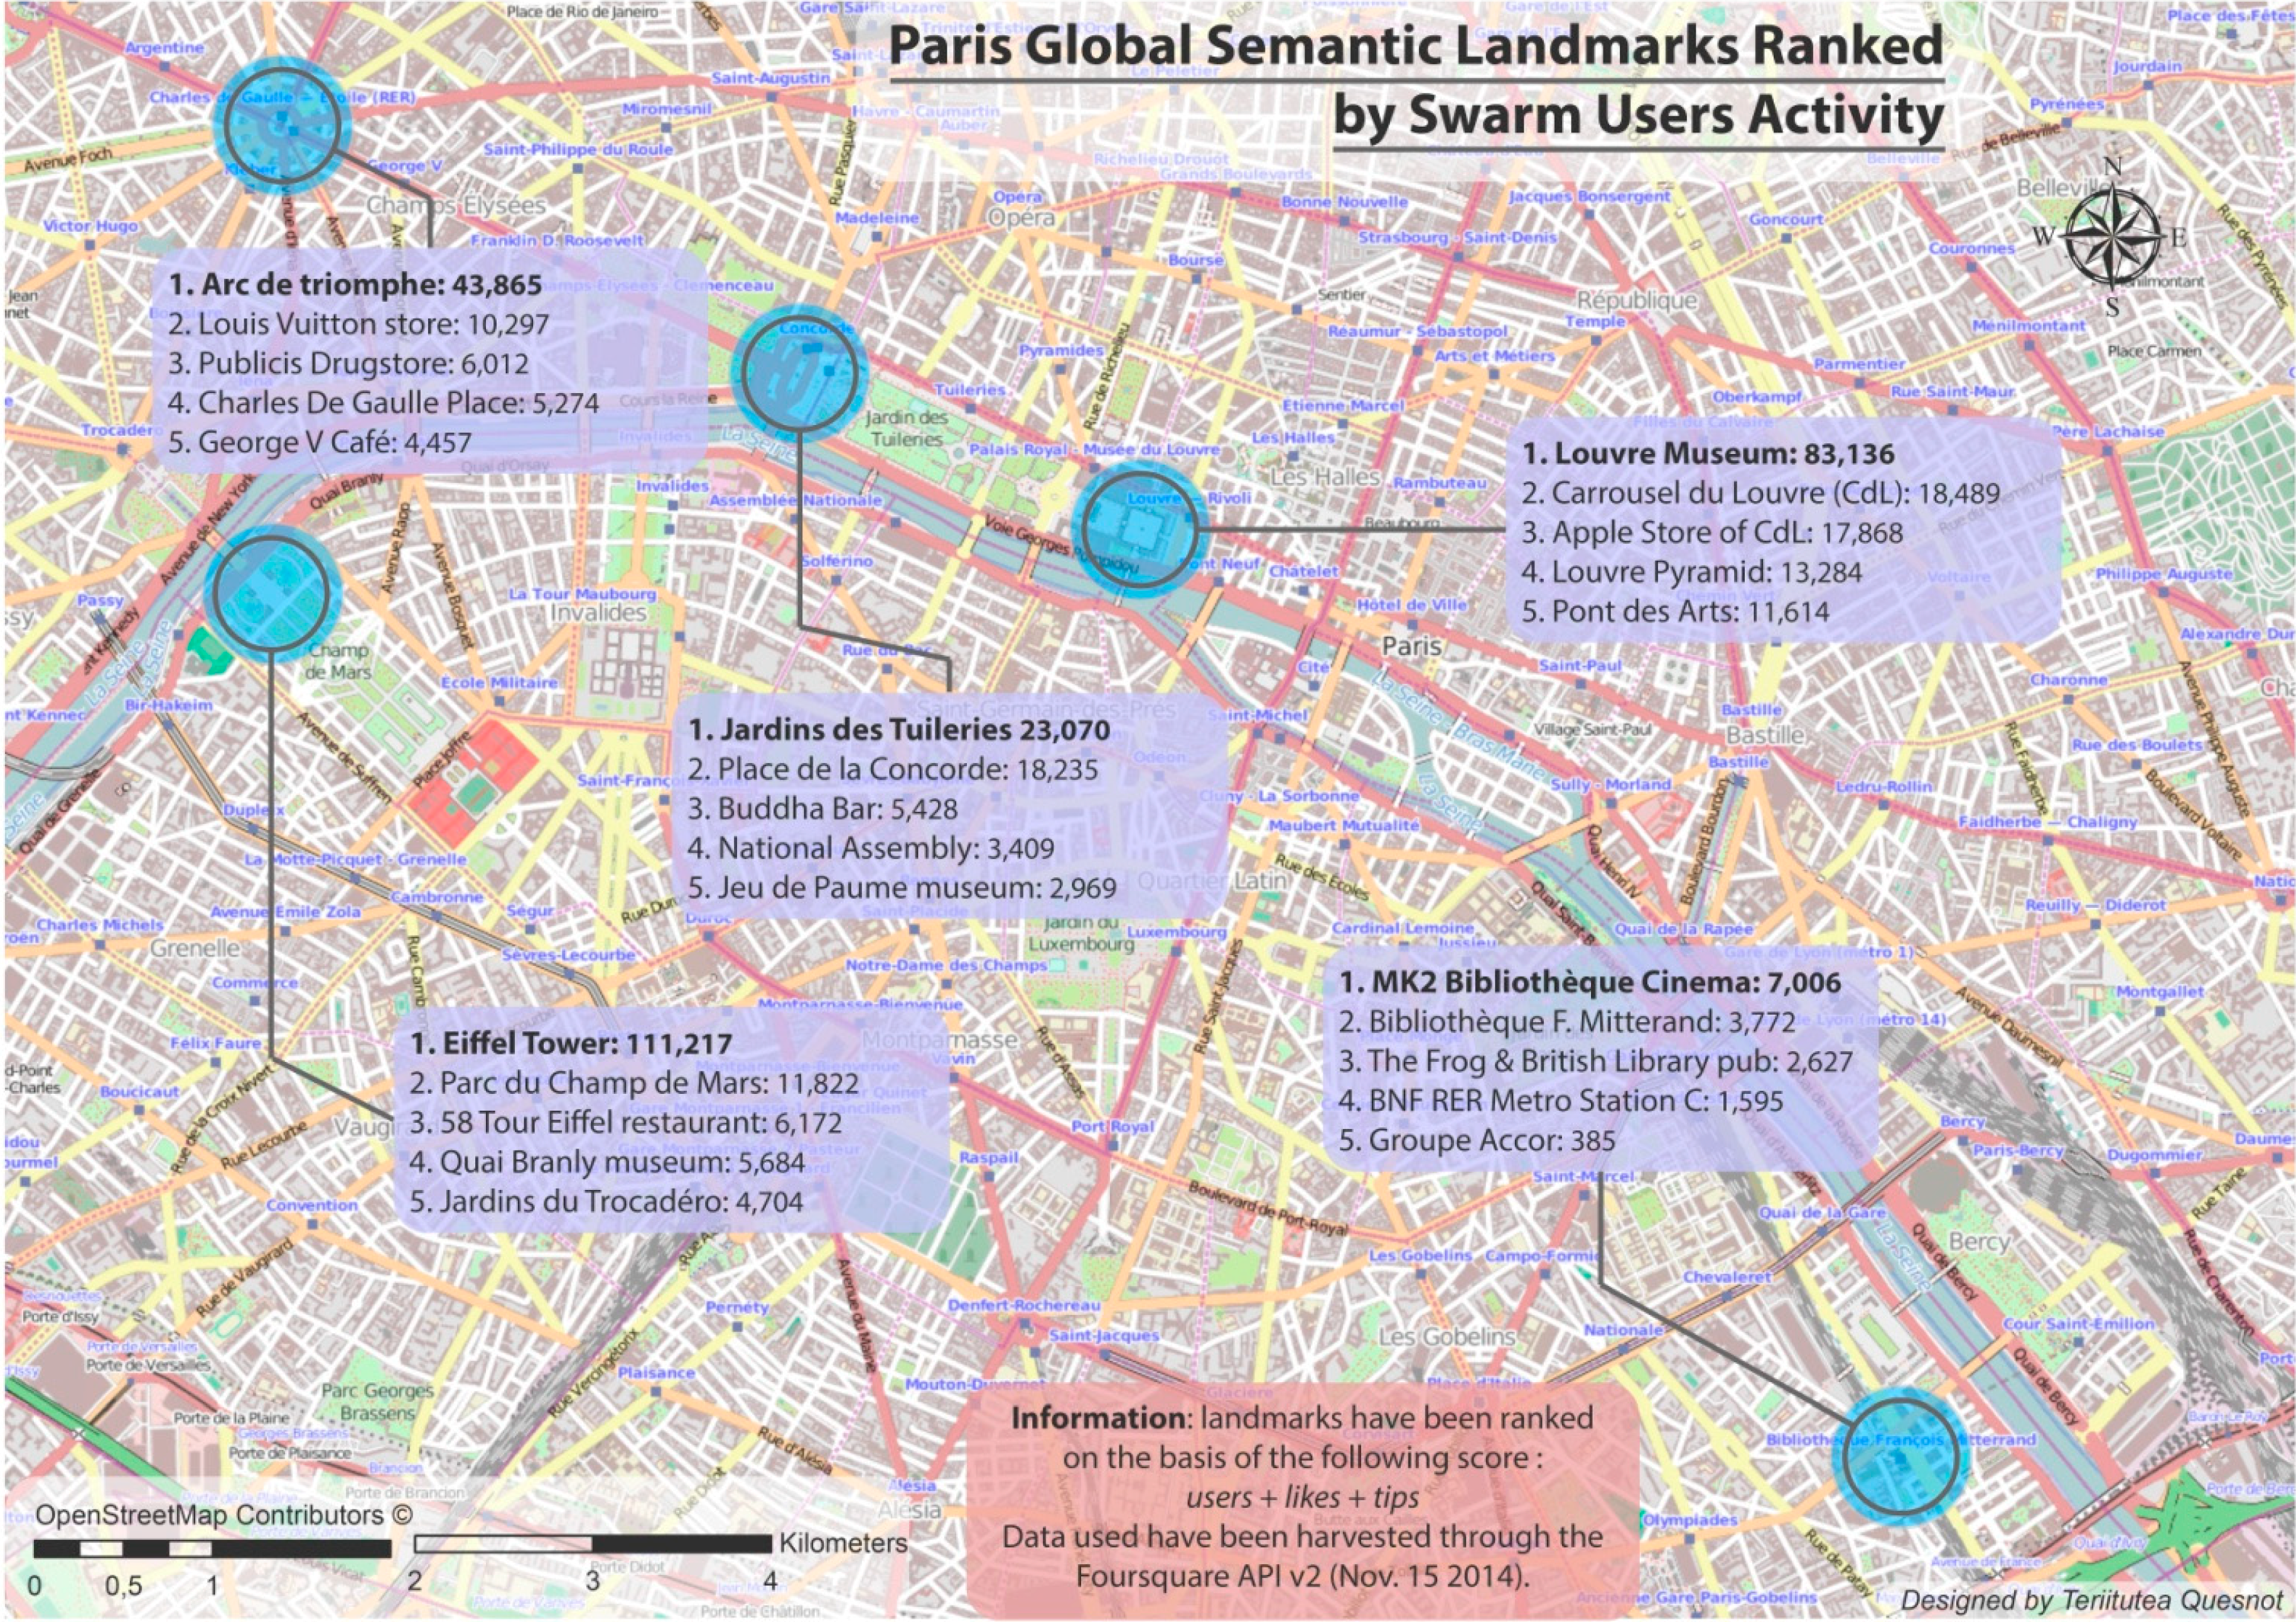
cf. Figure 4). For each place mentioned above, we extracted from Foursquare database the top 5 venues located within a 500 m. circle area in order to create a list of Parisian global semantic landmarks. Circle centers correspond to each popular landmark lat/long information.
Without any surprise, the Eiffel Tower is the most popular semantic landmark on the list with a GSA of 111,217. In its associated area, the
Parc du Champs de Mars and
Jardins du Trocadéro green spaces appear, respectively, at the second and fifth position. Actually, the
Parc du Champs de Mars is one of the largest parks in Paris with a surface area of 25 Ha. The
58 Tour Eiffel restaurant, which is listed just after this park, is located inside the Eiffel Tower. Providing wayfinding instructions based on this place does not make much sense since it is invisible from outside. This is an explicit illustration of the
sets of scales issue (
cf. Section 4.1.3). In the end, the
Quai Branly museum is ranked fourth with a GSA of 5684. This place is one of the best-known Parisian museums with the
Louvre.
The Louvre museum appears in second position with a GSA score of 83,136. As we can see, its popular pyramid is also on the list (ranked third). The Carrousel du Louvre, which comes directly after the Louvre (GSA: 18,489), is a dynamic place since it hosts restaurants, shops, and an art exhibition hall at the same time. By the way, the Apple Store located inside this venue is ranked fourth. Once again, we are facing an issue of sets of scales. Finally, the last position is held by the Pont des Arts, which is a bridge registered as “historic monument” since 1975.
The Arc de Triomphe score is behind the one of the Louvre museum with a GSA of 43,865. It is interesting to note that the second and the third venues listed here are stores. On the one hand, there is the Louis Vuitton store (luxury leather goods), and on the other hand, there is the Publicis Drugstore; a famous Parisian mall characterized by its original architecture. Just like the Charles De Gaulle Place (previously Place de l’étoile), the café George V generates a significant GSA score of 4457.
Figure 4.
Paris global semantic landmarks ranked by Swarm users activity.
Figure 4.
Paris global semantic landmarks ranked by Swarm users activity.
The pattern associated with the area of Place de la Concorde is quite interesting. Indeed, we can see that Place de la Concorde appears in second position behind the green space Les Jardins des Tuileries. These two venues clearly stand out from the three others in terms of geosocial activity (23,070 GSA for the Jardins des Tuileries and 18,235 GSA for Place de la Concorde). Indeed, the venue ranked third is a famous Parisian pub named Buddha Bar with a GSA of “only” 5428. The National Assembly and the museum of contemporary art Jeu de Paume appear, respectively, in fourth and fifth position.
Finally, the fifth example demonstrates that including a social component in the measure of landmark semantic salience using SLS datasets is relevant: instead of being at the supposed first place, the Bibliothèque François Mitterrand (BNF) stands at the second one, largely behind the cinema MK2 Bibliothèque (3772 GSA for the BNF versus almost the twice with 7006 GSA for the MK2). It demonstrates that a place culturally significant (i.e., the BNF) is not necessarily socially meaningful; i.e., daily practiced or recognized by citizens. By the way, we can see that the GSA score of The Frog & British Library pub is close to the BNF’s one (2627). Actually, the MK2 is the most relevant semantic landmark because it remains the unique movie theater located in the BNF region, which is an area characterized by a massive amount of offices. That is the reason why the Groupe Accor (a hostel operator) and the BNF RER Metro Station C also appear on the list.
5.3. Detecting Landmarks in the Streets of Vienna (Austria)
To conclude this final section, we propose five scenarios that take place in the city of Vienna. By this way, we want to demonstrate that the Landmark Semantic Salience score (LSS) proposed in the
Subsection 4.2.3 is reliable to extract global semantic landmarks for navigation. Each scenario deals with an intersection—
i.e., a choice point area [
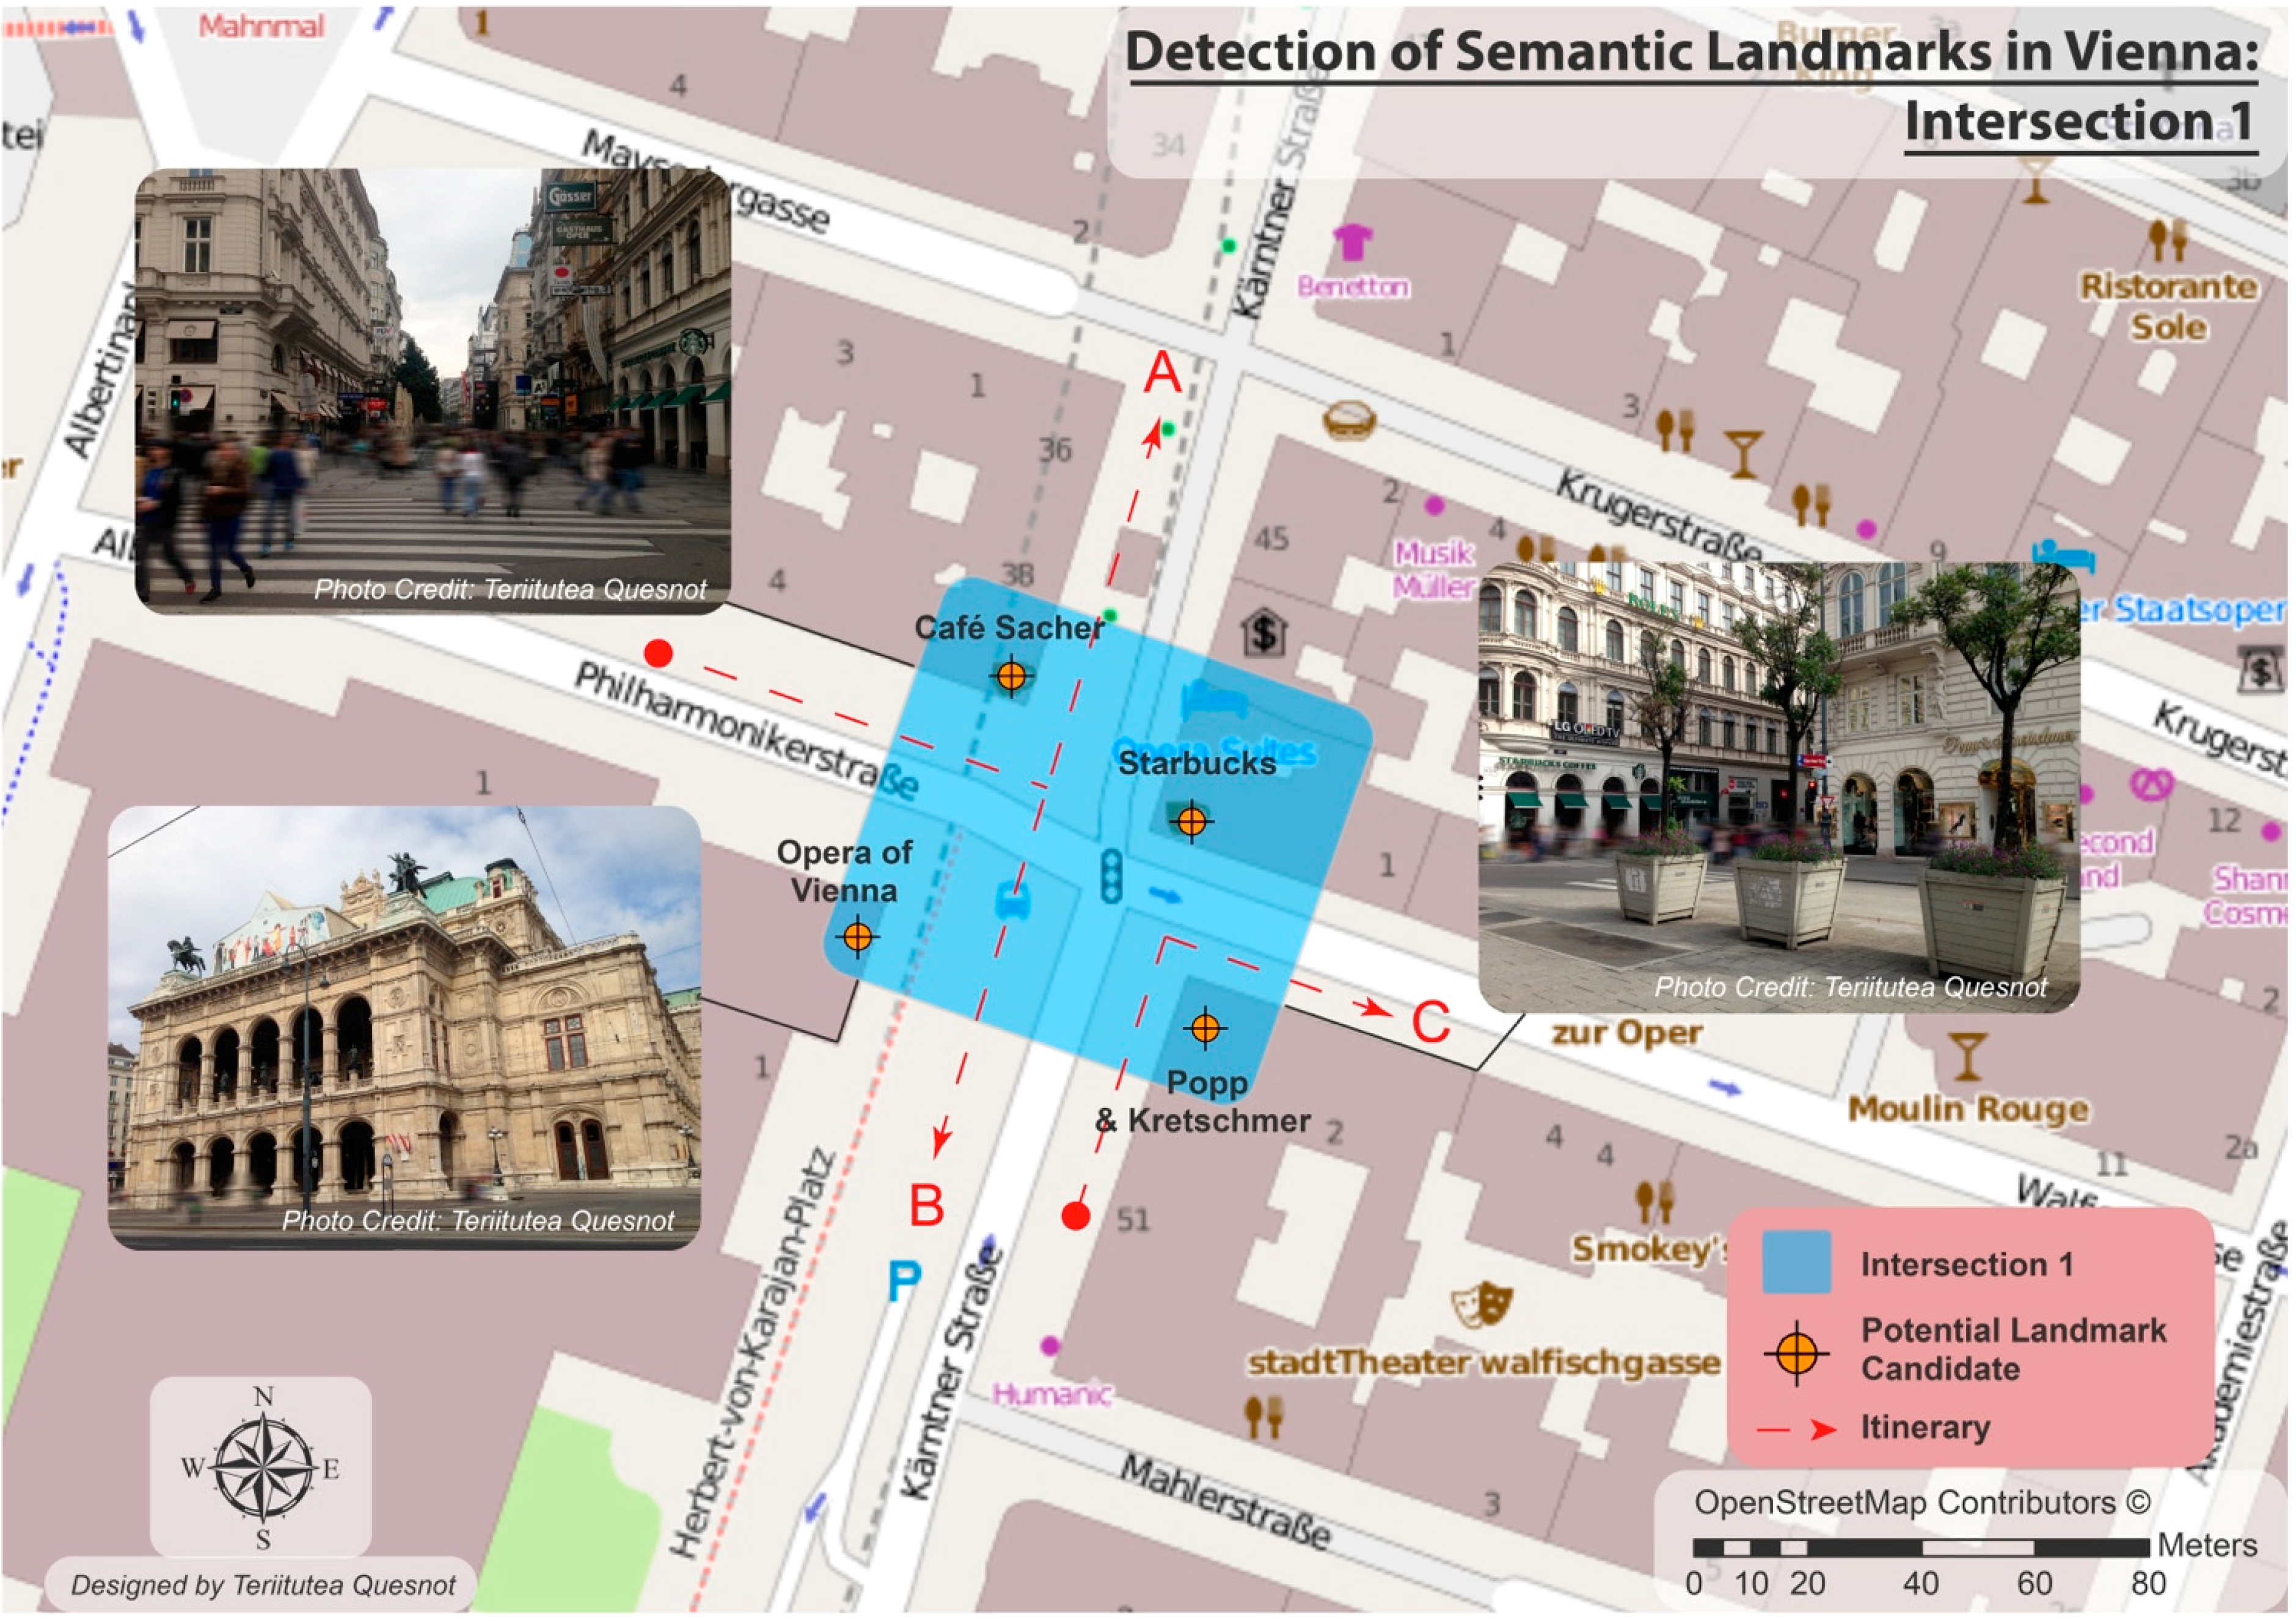
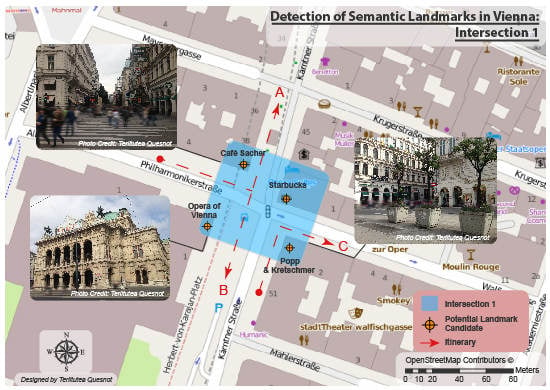
29]—where travelers can select different landmarks depending on the itinerary chosen. The first scenario takes place at the intersection of the streets
Philarmonikerstraße and
Kärntner Straße, near the Opera of Vienna. As shown in the
Figure 5, we can identify four potential landmark candidates given the three itineraries proposed (
i.e., A–C): (1) the
Opera of Vienna, (2) the
Starbucks Coffee and (3) the
Café Sacher, a well-known and prestigious Viennese café, and (4), a clothing store named
Popp & Kretschmer. Given their popularity, the Opera of Vienna and the two coffee shops should generate a lot of geosocial activity. The
Table 3 summarizes the GSA and uniqueness scores both normalized, as well as the LSS (
i.e., the arithmetic sum of GSA and uniqueness normalized scores) associated with places located at the first intersection.
Figure 5.
Detection of Semantic Landmarks in Vienna at the intersection 1.
Figure 5.
Detection of Semantic Landmarks in Vienna at the intersection 1.
Table 3.
Landmark semantic salience measured for places located at the intersection 1.
Table 3.
Landmark semantic salience measured for places located at the intersection 1.
| Landmark | Swarm GSA (n) | Facebook GSA (n) | Uniqueness (n) | LSS (Swarm) | LSS (Facebook) |
|---|
| Vienna Opera | 0.72 | 1 | 1 | 1.72 | 2 |
| Café Sacher | 1 | 0.29 | 0 | 1 | 0.29 |
| Starbucks | 0.50 | 0.02 | 0 | 0.50 | 0.02 |
| Popp & Kretschmer | 0 | ABS | 1 | 1 | NA |
As we can see, the Opera of Vienna does not necessarily generate the highest GSA in both platforms. Café Sacher appears to be more popular than the opera on Swarm. However, because of its uniqueness, the Opera of Vienna remains undoubtedly the top-one semantic landmark located at this intersection. Since Starbucks and Café Sacher are both cafés, their uniqueness score is reduced to 0. Popp & Kretschmer is the unique clothing store but it generates the lowest GSA. Plus, this venue is absent from the Facebook place database. That is the reason why it is ranked at the last position. Regarding the itinerary A, the Starbucks and the Café Sacher are potential landmark candidates unlike the Opera of Vienna and Popp & Kretschmer, which have in this context a weak structural salience (i.e., an unfavorable position). According to their respective LSS, the Café Sacher is considered as a landmark candidate. In the same vein, the Opera of Vienna and the Starbucks are, respectively, landmark candidates for itineraries B and C.
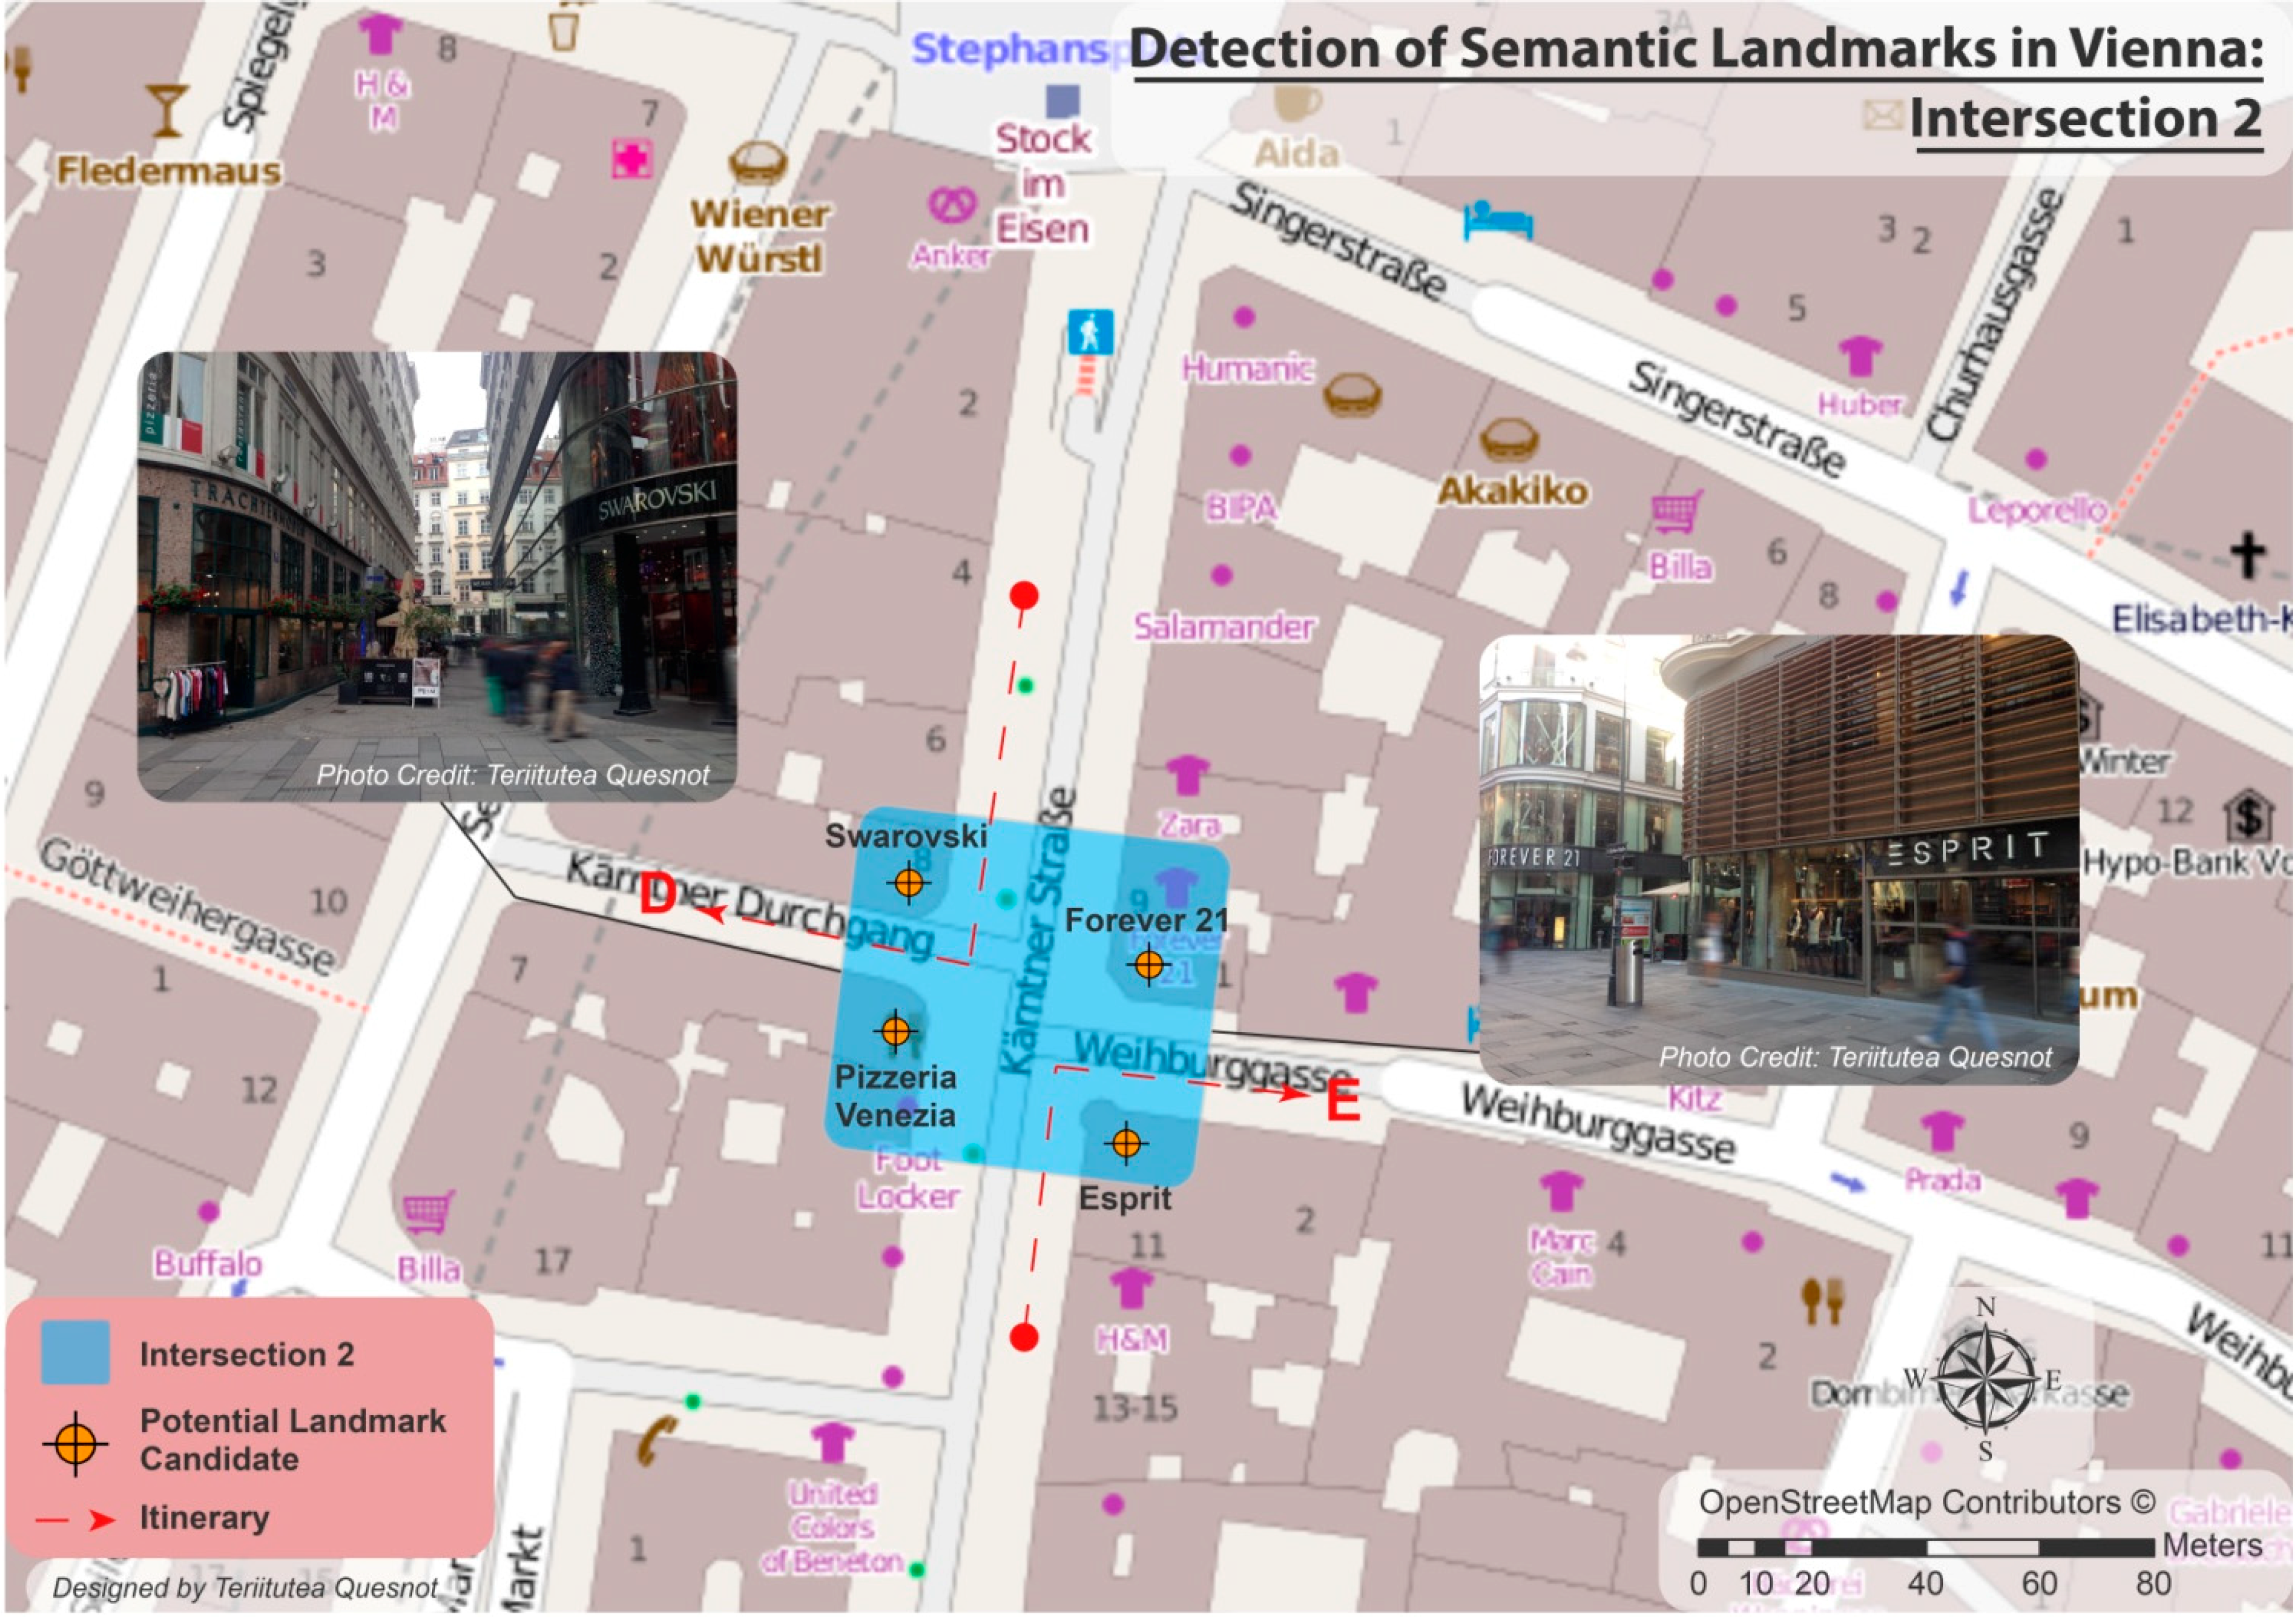
The intersection 2 is located along the street
Kärntner Straße, near the
Stephansplatz metro station. In this second scenario, four places could be used as a landmark: (1) the
Swarovski store; (2) the pizzeria
Venezia and (3,4), the clothing stores
Forever 21 and
Esprit (
cf. Figure 6). Unsurprisingly, the popular Swarovski store is the most reliable semantic landmark associated with this intersection according to our LSS calculation (
cf. Table 4). It is the unique jewelry store located there and it has the highest GSA in both platforms. Actually, this place could be used as a landmark candidate for both itineraries D and E. Venezia appears in second position: it does not generate a great GSA but it is the only pizzeria situated at the intersection. Thus, it has also a uniqueness score of 1. Forever 21 and Esprit are both clothing stores and consequently get their uniqueness score reduced to 0. Their LSS are very low since they generate weak GSA scores. That being said, in the case of the itinerary E, the Forever 21 store could be favored because of its advantageous position (structural salience).
Figure 6.
Detection of Semantic Landmarks in Vienna at the intersection 2.
Figure 6.
Detection of Semantic Landmarks in Vienna at the intersection 2.
Table 4.
Landmark semantic salience measured for places located at the intersection 2.
Table 4.
Landmark semantic salience measured for places located at the intersection 2.
| Landmark | Swarm GSA(n) | Facebook GSA(n) | Uniqueness (n) | LSS (Swarm) | LSS (Facebook) |
|---|
| Swarovski | 1 | 1 | 1 | 2 | 2 |
| Pizzeria Venezia | 0.25 | 0.02 | 1 | 1.25 | 1.02 |
| Forever 21 | 0.30 | 0.01 | 0 | 0.30 | 0.01 |
| Esprit | 0 | ABS | 0 | 0 | NA |
Table 5.
Landmark semantic salience measured for places located at the intersection 3.
Table 5.
Landmark semantic salience measured for places located at the intersection 3.
| Landmark | Swarm GSA(n) | Facebook GSA(n) | Uniqueness (n) | LSS (Swarm) | LSS (Facebook) |
|---|
| Aida Cafe | 1 | 1 | NA | 1 | 1 |
| Humanic (Clothing) | 0.11 | ABS | NA | 0.11 | NA |
| Jeweler Bucherer | 0 | ABS | NA | 0 | NA |
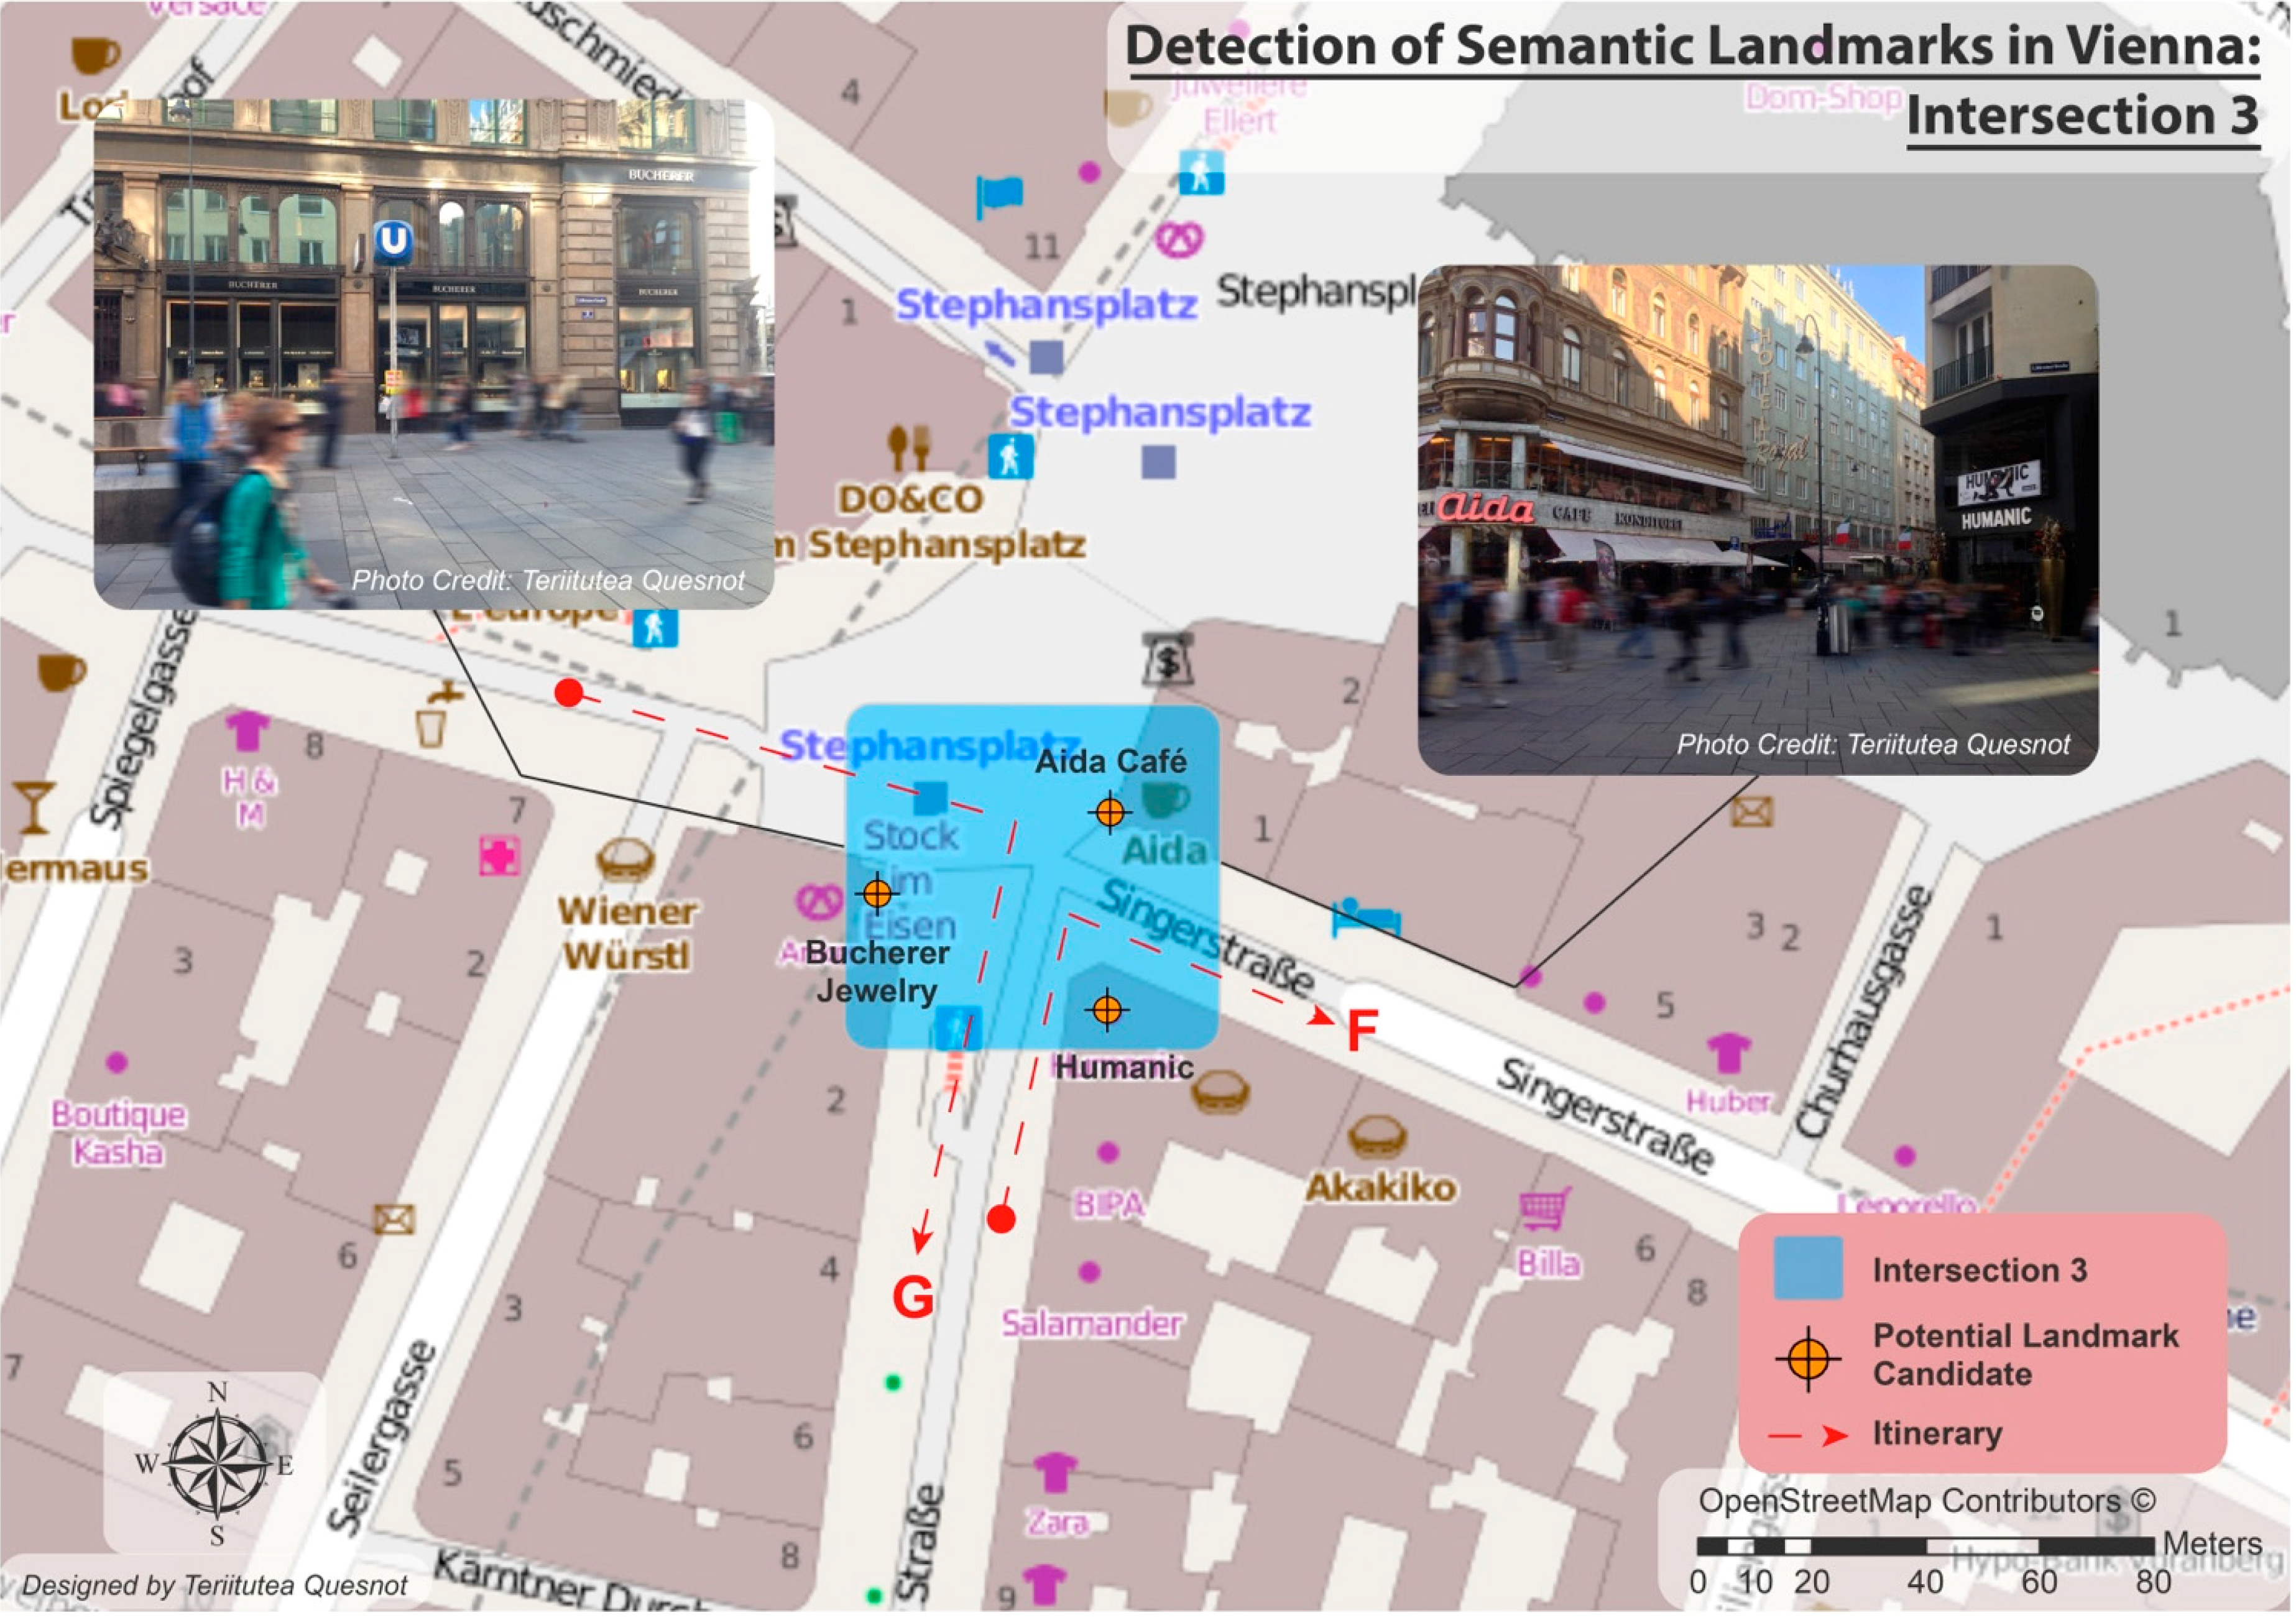
Figure 7.
Detection of Semantic Landmarks in Vienna at the intersection 3.
Figure 7.
Detection of Semantic Landmarks in Vienna at the intersection 3.
The third scenario takes place at the junction of the streets
Kärntner Straße and
Singerstraße. We distinguish here three potential landmark candidates: (1)
Aida Café; (2)
Humanic; and (3)
Bucherer. In this example, the calculation of the uniqueness score is not relevant since the three places mentioned above do not belong to the same category. Indeed, there is a coffee house (
Aida Café), a clothing store (
Humanic), and a jewelry store (
Bucherer). According to our LSS calculation, the Aida café, a famous Viennese coffee shop, is the most relevant semantic landmark located at this intersection. This café is full of consumers on a daily basis. Actually, we can consider it as a landmark candidate for both itineraries F and G because (1) Humanic and Bucherer produce a weak GSA and are absents from Facebook database (
cf. Table 5); and (2) this coffee shop is highly visible (
cf. Figure 7).
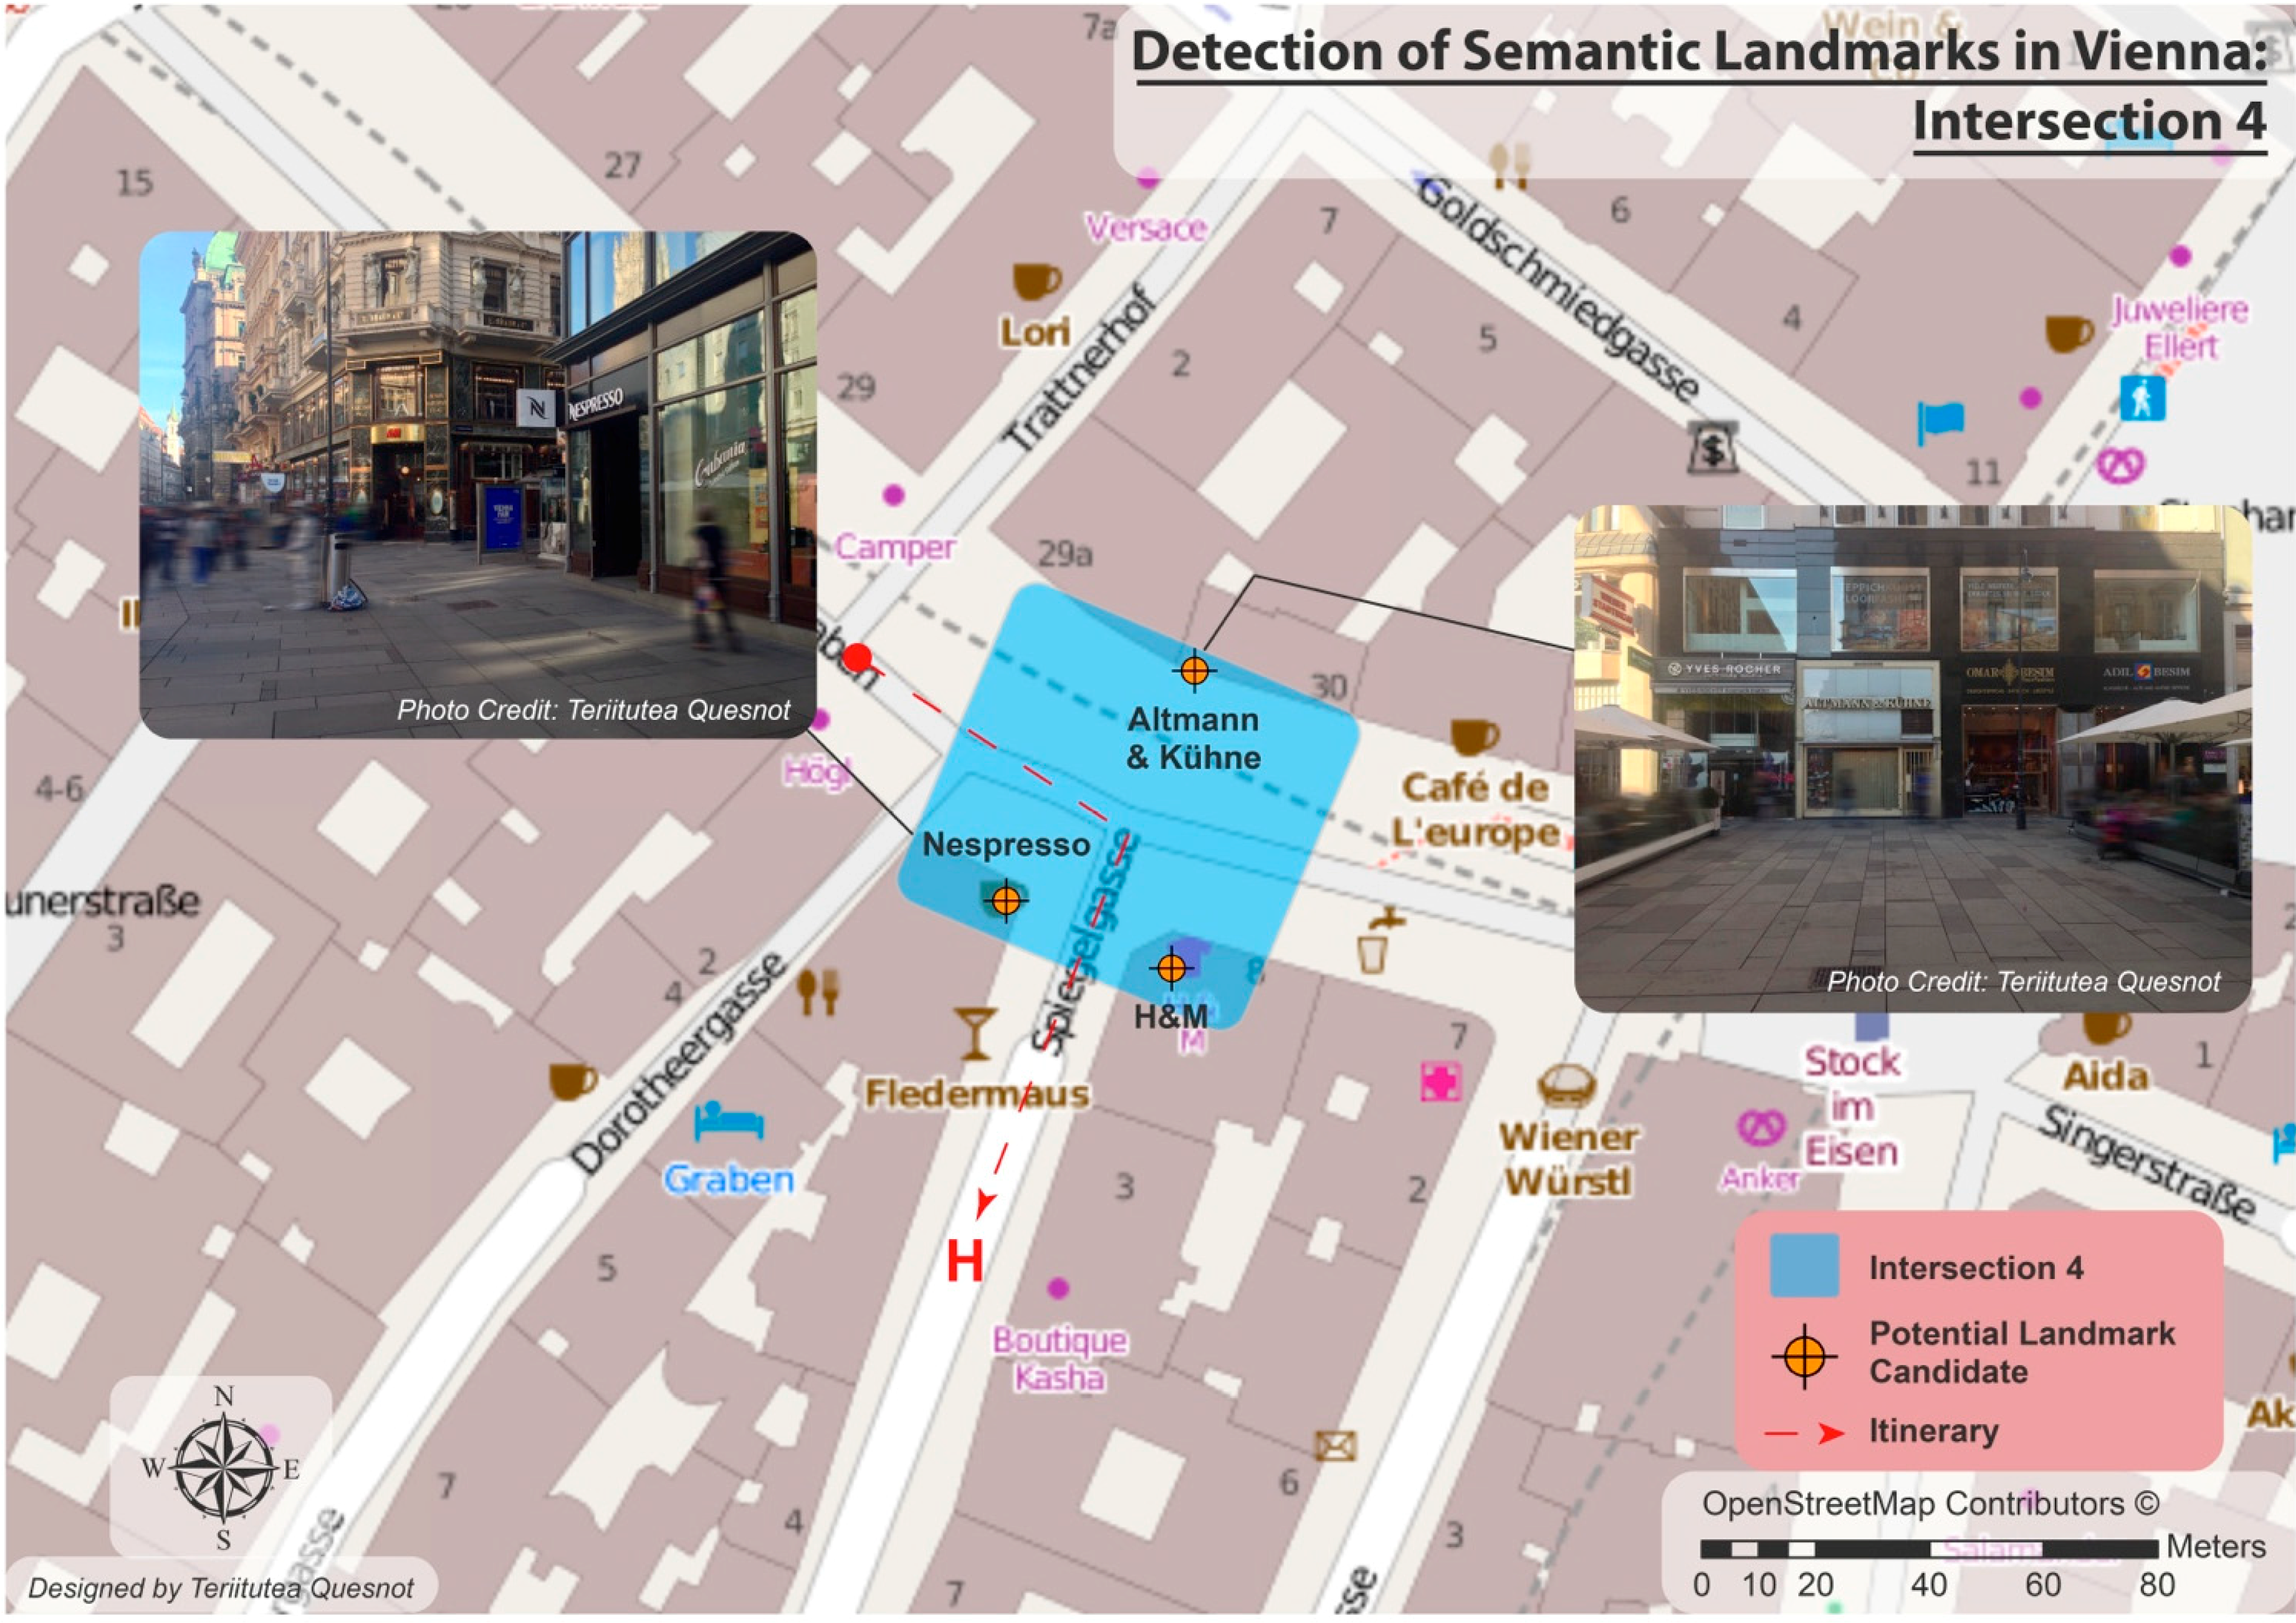
The next intersection is located at the junction of the streets
Graben and Spiegelgasse
. It concerns three potential landmarks: (1) the
Nespresso store; (2) the
H&M store; and (3) the
Altmann & Kühne candy shop (
cf. Figure 8). Once again, the calculation of the uniqueness score is not pertinent since we identified three different kinds of place categories.
Figure 8.
Detection of Semantic Landmarks in Vienna at the intersection 4.
Figure 8.
Detection of Semantic Landmarks in Vienna at the intersection 4.
As shown in the
Table 6, Nespresso and H&M can be used as landmark candidates. Indeed, Nespresso only gets the highest Swarm LSS while H&M holds the greatest value for Facebook LSS. In fact, the discrimination is neither semantic nor structural but visual. In our opinion, Nespresso should be the landmark candidate for the itinerary H because unlike the H&M store, its signboard is highly visible from a long distance (
cf. photo in
Figure 8).
Table 6.
Landmark semantic salience measured for places located at the intersection 4.
Table 6.
Landmark semantic salience measured for places located at the intersection 4.
| Landmark | Swarm GSA(n) | Facebook GSA(n) | Uniqueness (n) | LSS (Swarm) | LSS (Facebook) |
|---|
| Nespresso | 1 | 0.32 | NA | 1 | 0.32 |
| H&M | 0.28 | 1 | NA | 0.28 | 1 |
| Altmann & Kühne | 0 | ABS | NA | 0 | NA |
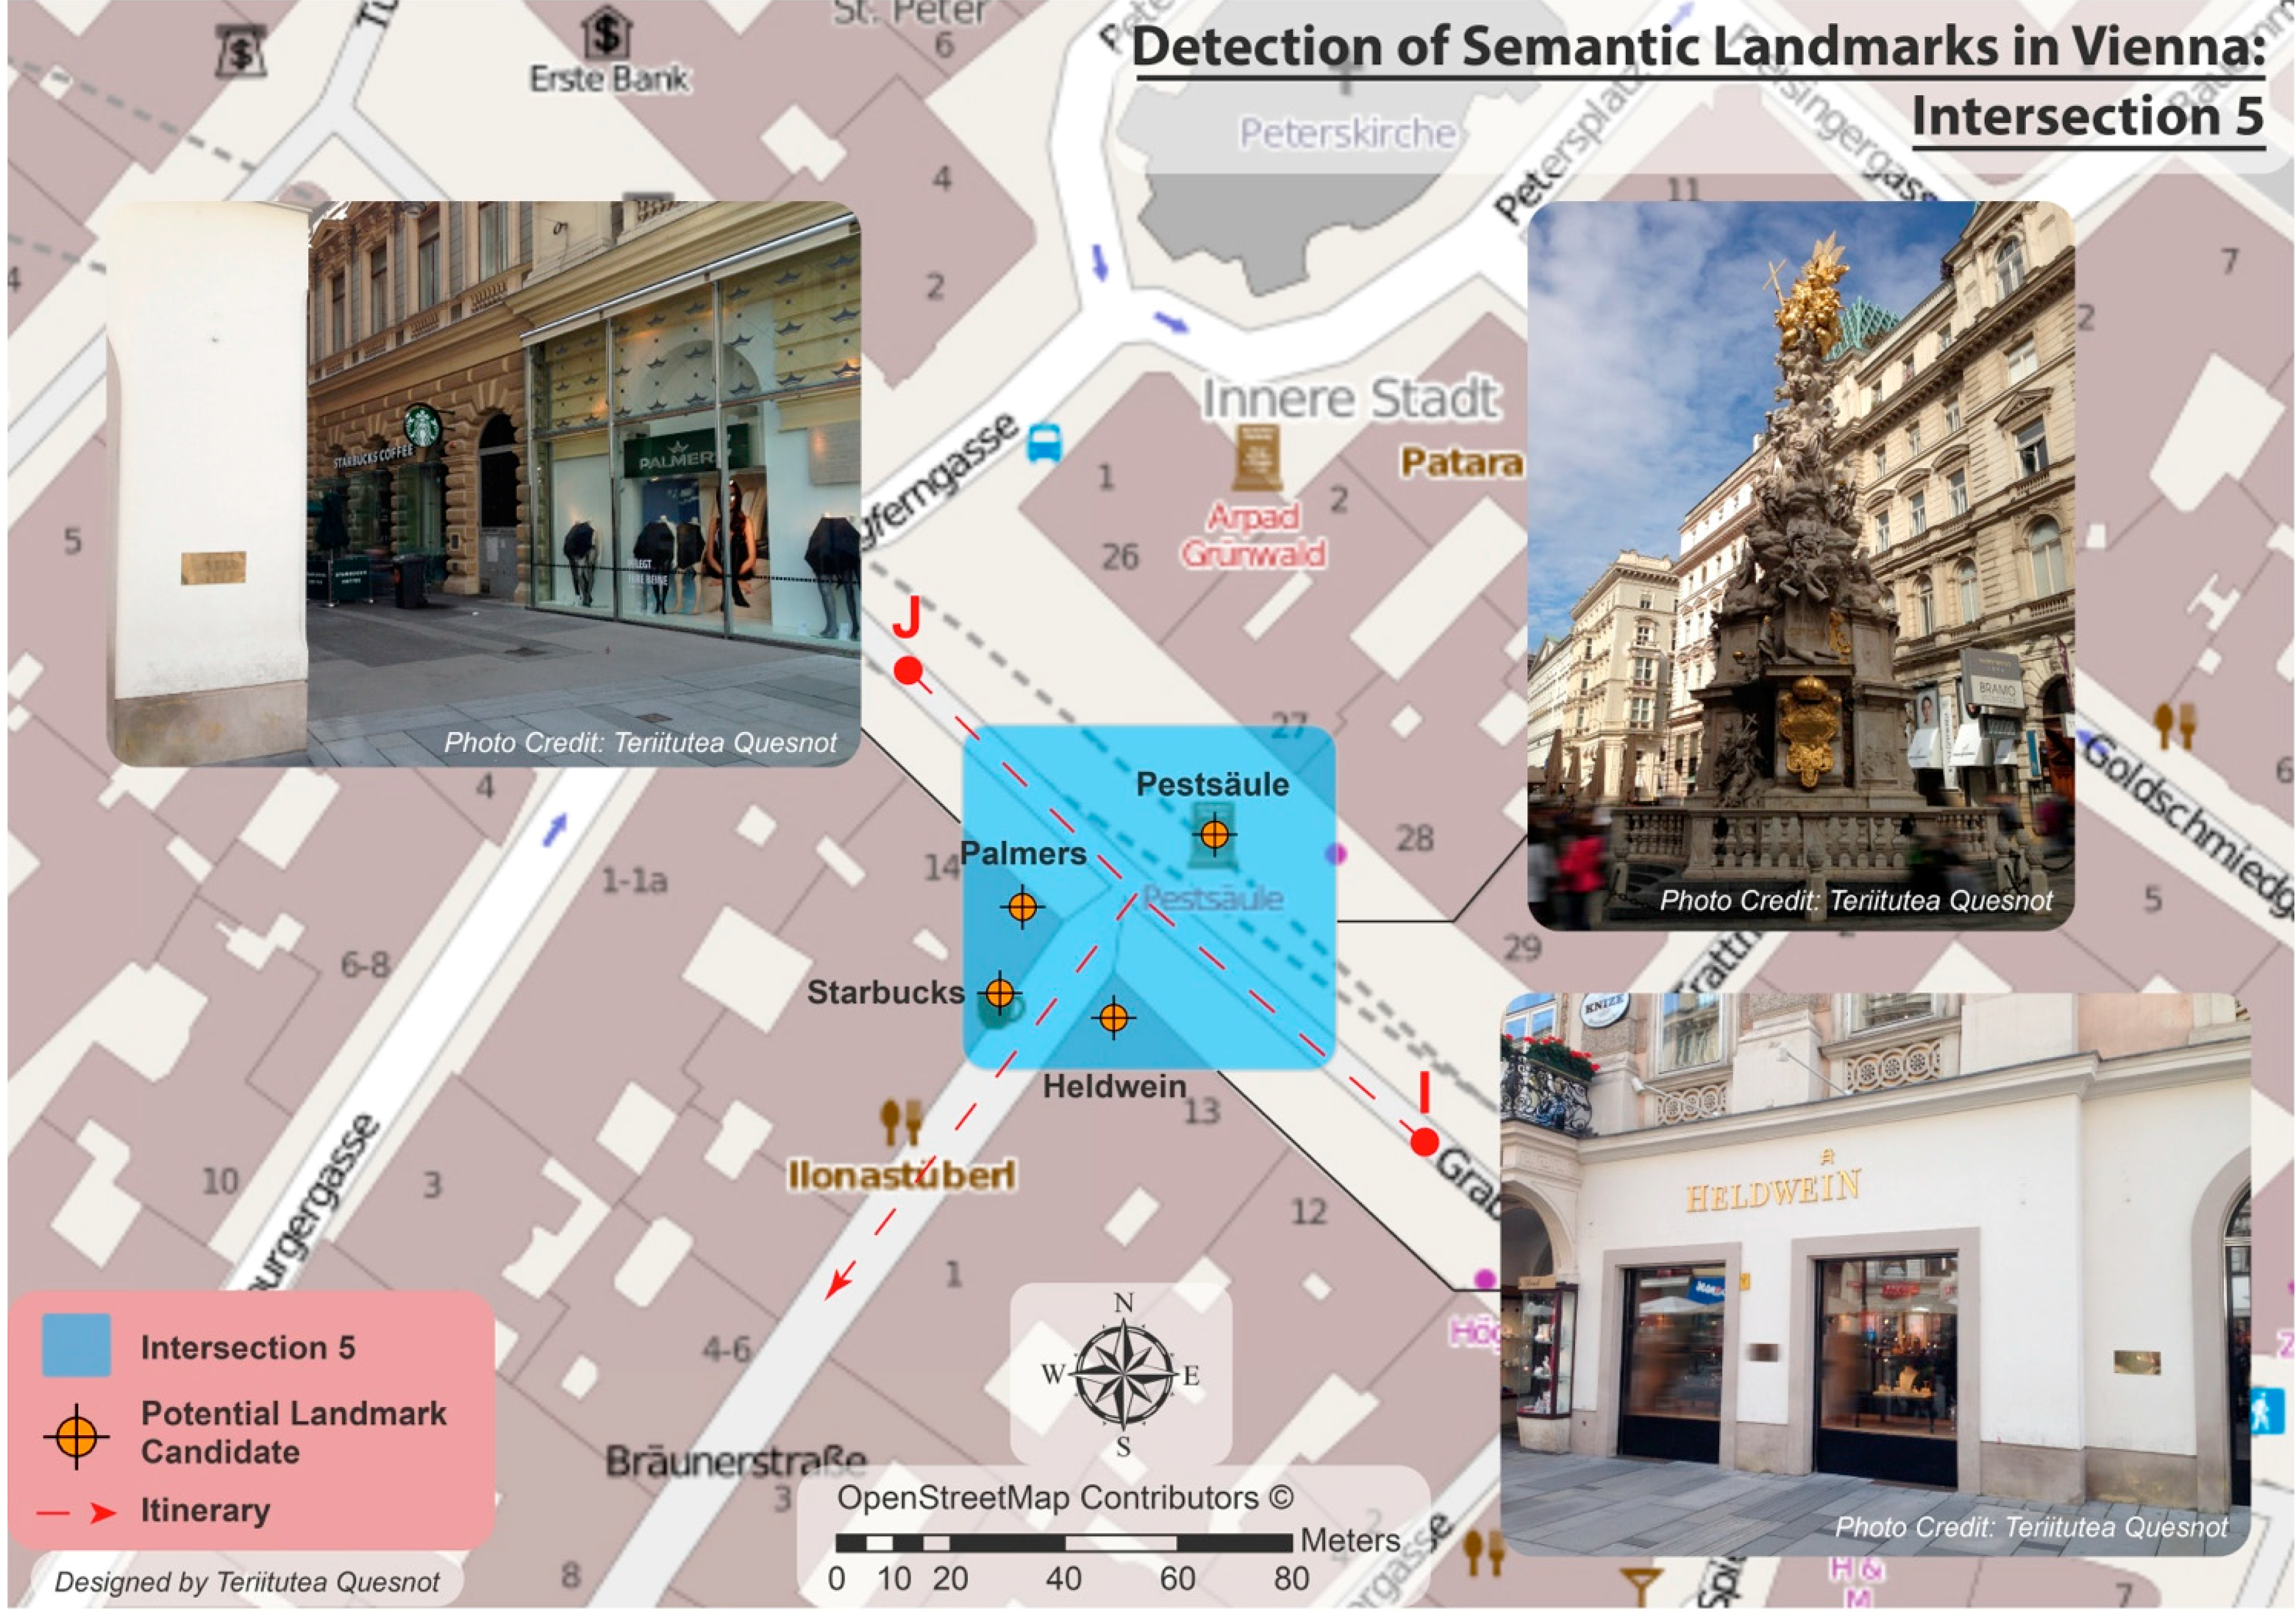
The last scenario, which takes place at the intersection of the streets
Graben and
Braunerstraße, reveals a quite interesting element. In this case, four places are potential semantic landmarks (
cf. Figure 9): (1) the clothing store
Palmers; (2) the
Pestsäule (Plague Column); (3) the
Heldwein jewelry store; and (4) a
Starbucks store. According to our LSS calculation (
cf. Table 7), Palmers and Heldwein are excluded because of their very low GSA scores. The Pestsäule appears in second position, far behind the Starbucks store (0.01
versus 1 regarding the Facebook LSS). The Pestsäule is a monument with a great historical and cultural significance. Yet, it is odds-on that tourists who follow the itinerary I would easily find their way with a semantic landmark, such as the Starbucks. Indeed, they do not necessarily know what the Plague Column is and what it does look like. Just like the BNF and MK2 example of the
Section 5.2, this scenario illustrates that people are not necessarily based on a place historically and culturally important. By extension, a place that benefits from a great historical or cultural significance does not systematically imply that it is a reliable semantic landmark. That being said, in the case of the itinerary J, selecting the Pestsäule as the landmark candidate would be more relevant since the Starbucks is completely invisible from this direction (weak visual salience).
Figure 9.
Detection of Semantic Landmarks in Vienna at the intersection 5.
Figure 9.
Detection of Semantic Landmarks in Vienna at the intersection 5.
Table 7.
Landmark semantic salience measured for places located at the intersection 5.
Table 7.
Landmark semantic salience measured for places located at the intersection 5.
| Landmark | Swarm GSA(n) | Facebook GSA(n) | Uniqueness (n) | LSS (Swarm) | LSS (Facebook) |
|---|
| Starbucks | 1 | 1 | NA | 1 | 1 |
| Pestsäule | 0.21 | 0.01 | NA | 0.21 | 0.01 |
| Heldwein | 0 | 0 | NA | 0 | 0 |
| Palmers | 0.004 | ABS | NA | 0.004 | NA |
5.4. Discussion and Outlook
Three elements need to be discussed in this last sub-section. The first one is tied down to the calculation of the uniqueness score (UNQ). Indeed, it was computed by taking into account the bottom-level venue categories of the potential landmark candidates. For example, in the case of the first scenario, the Swarm LSS of the clothing store Popp & Kretschmer is higher than the one from the Starbucks coffee, thanks to its uniqueness scores (
cf. Table 3). The two cafés and the clothing store were considered different in the computation of UNQ. This approach implies that these two venue categories are easily distinguishable in a navigation context; which is not necessarily the case. Actually, the Opera of Vienna is in our opinion the only feature that stands out by its function in the area of the intersection 1. The others potential landmark candidates are essentially stores. Consequently, as an improvement, we do believe that the uniqueness score proposed could be graded depending on the top-level venue categories. In this way, the degree of dissimilarity would be higher if the places compared together do not belong to the same top-level category (e.g., stores
versus a monument like the Opera of Vienna) and
vice versa. By extension, features that do not belong to the same infra-level venue category (e.g., a jewelry store
versus a clothing store) inside an identical supra-level venue category (e.g., stores) might be considered dissimilar, but not in an exclusive way. As an example, the pizzeria Venezia located at the intersection 2 would have the highest uniqueness score (
i.e., 1) since it remains the only restaurant in the area. On the other hand, we would assign a graded uniqueness score to the three other places (e.g., 0.5 for the Swarovski jewelry store, and 0.25 for both Forever 21 and Esprit clothing stores). This question, which is not solved in this paper, gives some central themes for further research in the area of automatic landmark detection.
Secondly, we have seen that places known as historically and culturally significant do not systematically generate the highest activity on online social networks. Indeed, as highlighted in the
Section 5.2, the GSA score of the MK2 movie theater is higher than the one of Paris BNF. We made a similar observation for the Buddha bar and the National Assembly (5428
versus 3409) as well as the Louis Vuitton store and the Place Charles de Gaulle (10,297
versus 5274). Therefore, in our opinion, computing a landmark semantic salience score exclusively based on the
historical and cultural significance attribute is not relevant. Including places’ social dimension through the exploitation of SLS datasets will undoubtedly enhance the measure of landmark semantic salience. Furthermore, we are asking the following question: considering the last scenario, is the
Plague Column a better semantic landmark than the
Starbucks coffee? Actually, we can assume that the
Starbucks brand is more popular than the
Plague Column but this question does not make much sense since the selection of landmarks is permanently route-dependent. As we explained, choosing the Starbucks as the landmark candidate is only appropriate for the itinerary I. Indeed, a pedestrian will not be able to see the coffee house if he follows the itinerary J (
cf. Figure 9).
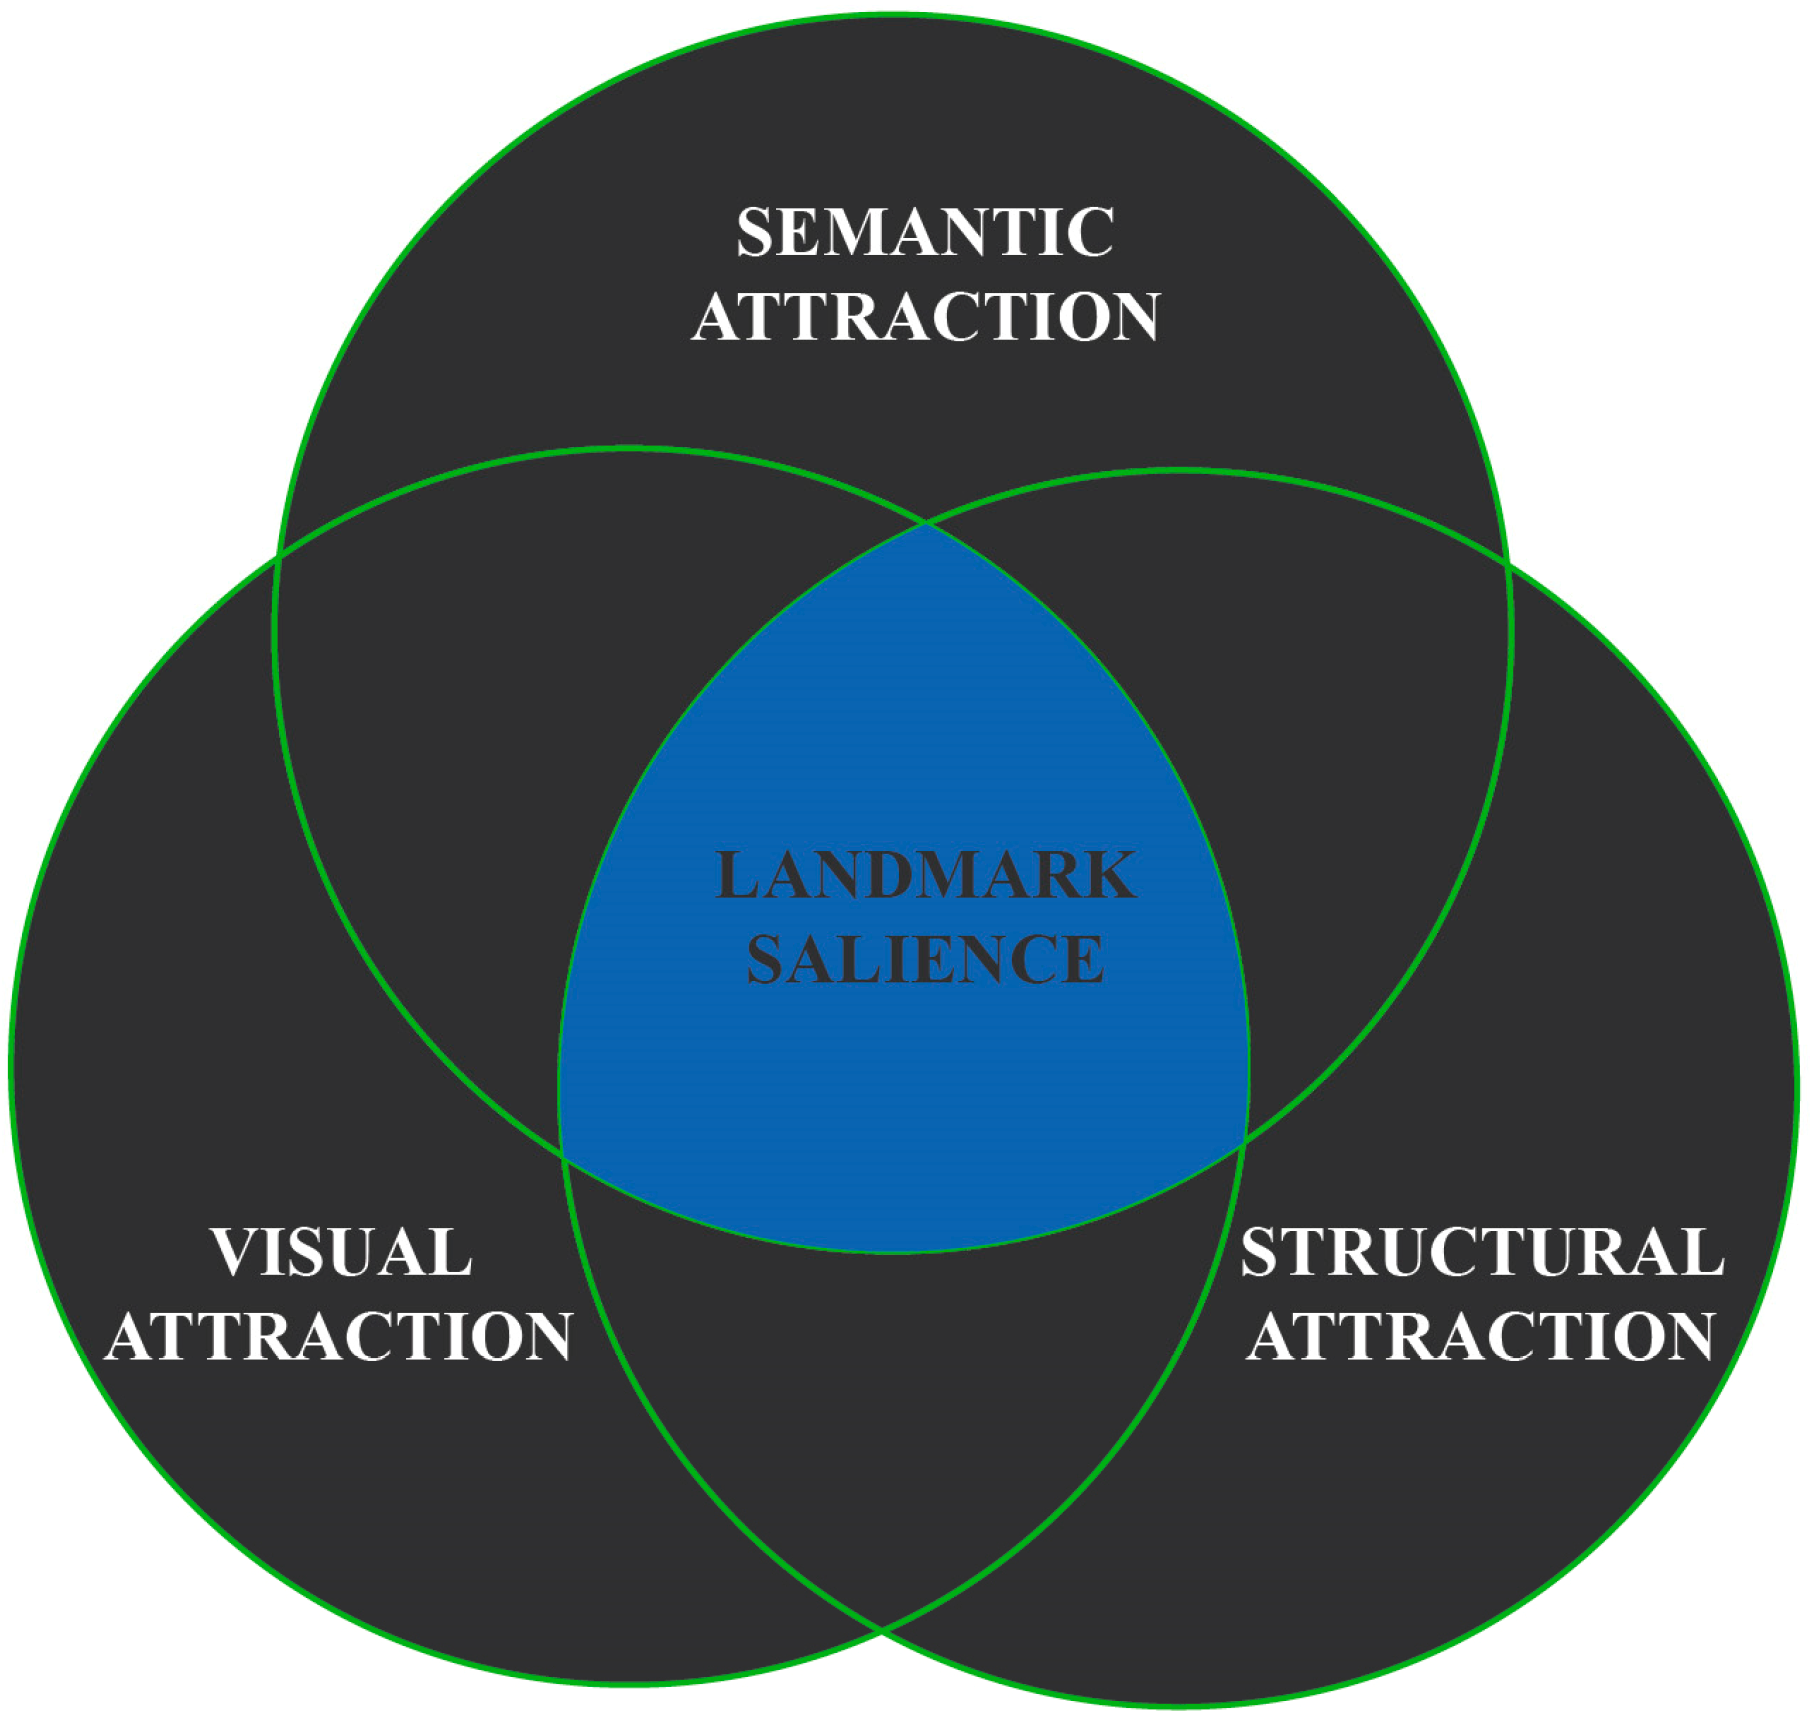
This statement leads us to the third element that we want to highlight here: the detection of landmarks cannot be exclusively done on the basis of their semantic salience. Obviously, the potential landmark candidates have to be enough visible in order to be useful in a navigation context (
cf. Winter’s work on advance visibility [
41]). Now, considering two places visually comparable (
i.e., with a visual salience score equivalent), the selection of the landmark candidate will depend on their respective structural salience; especially their position relative to the road. More specifically, places located where the next turn is supposed to be performed will tend to draw a greater attention to travelers [
52]. Consequently, how semantic salience is decisive for people’s landmarks selection? Actually, we argue that the significance of landmark semantic salience compared with visual and structural saliencies depends on two interrelated factors: (1) the traveler’s profile; and (2) the intensity of the landmark semantic salience itself. Indeed, on the one hand, we can assume that a tourist will tend to rely on highly visual and structural landmarks (e.g., a building with an outstanding architecture located at a major road intersection) unless he sees a place that sounds familiar to him;
i.e., a global semantic landmark, such as a Starbucks coffee. On the other hand, an individual who is travelling in a familiar environment will easily find his way through both global and local semantic landmarks (
i.e., places not necessarily famous). Thus, unless we have access to each traveler’s spatial knowledge, only
global semantic landmarks should be added in
standard route instructions. This assumption needs to be empirically tested out since the semantic salience of landmarks remains a theory-based suggestion.


