1. Introduction
The availability of well-prepared geospatial time-series information for environmental research is limited. Individual processing, depending on the data source, as well as changing data formats, all need to be done by the user, posing additional challenges. Working with time-series data is especially time-consuming, due to the large amount of data. For environmental studies, time-series data is an important information source to identify impacts and changes. Several initiatives, such as the Global Observation of Forest and Land Cover Dynamics (GOFC-GOLD) and the Northern Eurasia Earth Science Partnership Initiative (NEESPI), focus on monitoring the impact of global climate changes on the Earth’s surface [
1,
2]. This is important for land-cover and land-use change detection, as well as for disaster management, including fires, droughts and floods [
3,
4,
5,
6,
7,
8]. To do this, spatial time-series data from multiple data sources is needed. A lot of complimentary data is available for environmental research. Remote sensing satellites can provide this time-series data, as they are able to provide spatial and temporal views of environmental parameters, especially for large areas. However,
in situ data from meteorological stations are also useful, supporting the analysis of remote sensing data and giving an overview of the climate and the environment being studied.
As many data distributors provide data through web-based systems and programming interfaces, research needs to find ways to automate the steps of finding, downloading and processing data. One example is the Giovanni tool for interactive time-series data exploration and analysis [
9]. In addition to the processing needs of users, it is important to establish a system that provides access to multiple data sources. Both multi-source data access and additional processing steps can be integrated in an infrastructure based on data warehouse principles, introduced by Jones [
10]. A data warehouse is “a foundation for decision support systems and analytical processing” [
10] and provides a snapshot of multiple operational databases. Furthermore, spatio-temporal data warehouses exist, including data analysis, data processing and data storage [
11,
12]. Such a spatio-temporal data warehouse contains the basis structure for the developed multi-source data processing middleware. Therefore, spatial data is being extracted from the original source, transformed and loaded into the warehouse and, afterwards, provided as a middleware component. Similar concepts are described in several papers [
13,
14,
15,
16]. Another concept of structured data access to distributed systems is the approach for data brokering introduced for geospatial data by Nativi
et al. [
17,
18]. As both technologies differ, the aims are the same: reduce the entry barriers for multidisciplinary applications, as well as provide functionalities that give data added value via steps implementing advanced data discovery, data pre-processing and data transformation. Both the broker concept and the proposed infrastructure have, further, the same approach to “shift complexity from users and resource providers to the infrastructure/platform” [
17]; this quotation clearly states the aim of the system supporting users in data access, visualization and processing. An example of a processing middleware based on the warehouse concept in the field of Earth observation is the infrastructure that was developed for the European research project, ZAPÁS [
19]. In the provided web portal, remote sensing datasets from multiple sources and information products for Siberia can be visualized and downloaded for further analysis.
The Siberian Earth System Science Cluster (SIB-ESS-C,
http://www.sibessc.uni-jena.de) was developed with the aim of providing operational tools for multi-source data access, analysis and time-series monitoring for Siberia. The system comprises a metadata catalog allowing for data searching, as well as interoperable interfaces for data visualization, downloading and processing. Within the SIB-ESS-C, data from remote sensing satellites, climate data from meteorological stations and outcomes of research projects are stored. The aim is to provide a wide variety of operational information products free of charge. The advantage of representing different products within a single system is the integration of users’ needs into web-based processing services. Concerning climate change and land monitoring, the SIB-ESS-C focuses on land-based information products.
There are several other web-based systems that provide tools to search, order, download (NASA Reverb Client [
20], USGS Earth Explorer [
21], NCDC Climate WebGIS [
22]) and analyze data (NCDC Climate WebGIS [
22], NASA Giovanni [
9], Virtual laboratory of remote sensing time-series [
23]). However, if the data is not provided in a format that can be handled by the user, the data needs to be transformed into another format. In this case, there is a need for data processing steps that can be automated using programming languages. As a great amount of data is available online, clients can use web services to access this data. If further processing is needed (e.g., conversion of formats or units), the data can be transferred and processed in another system, and the processed data should also be made available for users. Providing this data in a standard-compliant format is important, so that other clients (WebGIS or Desktop GIS software) can access the processed data. These activities support the core principle of the Global Earth Observation System of Systems (GEOSS) to establish a “global and flexible network of content providers allowing decision makers to access an extraordinary range of information” [
24]. According to the GEOSS architecture principles [
25], component systems can be scaled from national to global networks and from
in situ to remote sensing data, which will also be implemented in the SIB-ESS-C. A further goal of GEOSS is to link existing and planned observation systems together; however, ultimately, the “success of GEOSS will depend on data and information providers accepting and implementing a set of interoperability arrangements, including technical specifications for collecting, processing, storing and disseminating shared data, metadata and products” [
26].
Further research is needed in the management, processing and standard-compliant distribution of spatial time-series information. The challenge of generating standardized and operational multi-source data handling structures has not yet been completely addressed in geo-information science. Therefore, the provision of standard-compliant data is a key component of data distribution; however, the combination of data distributed from different sources is also important. Another need is to overcome the lack of still not existing up-to-date time-series data, operationally acquired, preprocessed and provided in common data formats. The interoperability between data providers, data application engineers and policy makers has to be strengthened to make the large amount of valuable information accessible to experts in diverse fields. Data availability, in general, is not an issue, but which kind of data is available for specific dates and areas is a frequently asked question.
The objective of the middleware within the SIB-ESS-C is to build up an operational web-based system where data from different sources are provided and updated. The middleware automatically collects data from integrated resources to provide standard-compliant web services for data access and visualization. Datasets are then available for further analysis. This paper describes the development of a processing middleware to build up a multi-source database to support land-monitoring research by:
establishing a multi-source data processing middleware for land observations,
implementing additional and individual processing steps for integrated data,
providing standard-compliant visualization, access and download services for time-series data,
and fostering near real-time monitoring of land processes.
The description of the integrated data sources and their datasets is given in
Section 2.
Section 3 shows the framework that was developed for the middleware, including data integration and provision.
Section 4 explains the SIB-ESS-C web portal as a client and administration component for the middleware, and
Section 5 describes cases showing different applications of the middleware.
Section 6 offers a conclusion based on the developments and experiences discussed in the previous sections and gives recommendations and predictions regarding further work in this area.
3. Framework for the Multi-Source Data Processing Middleware
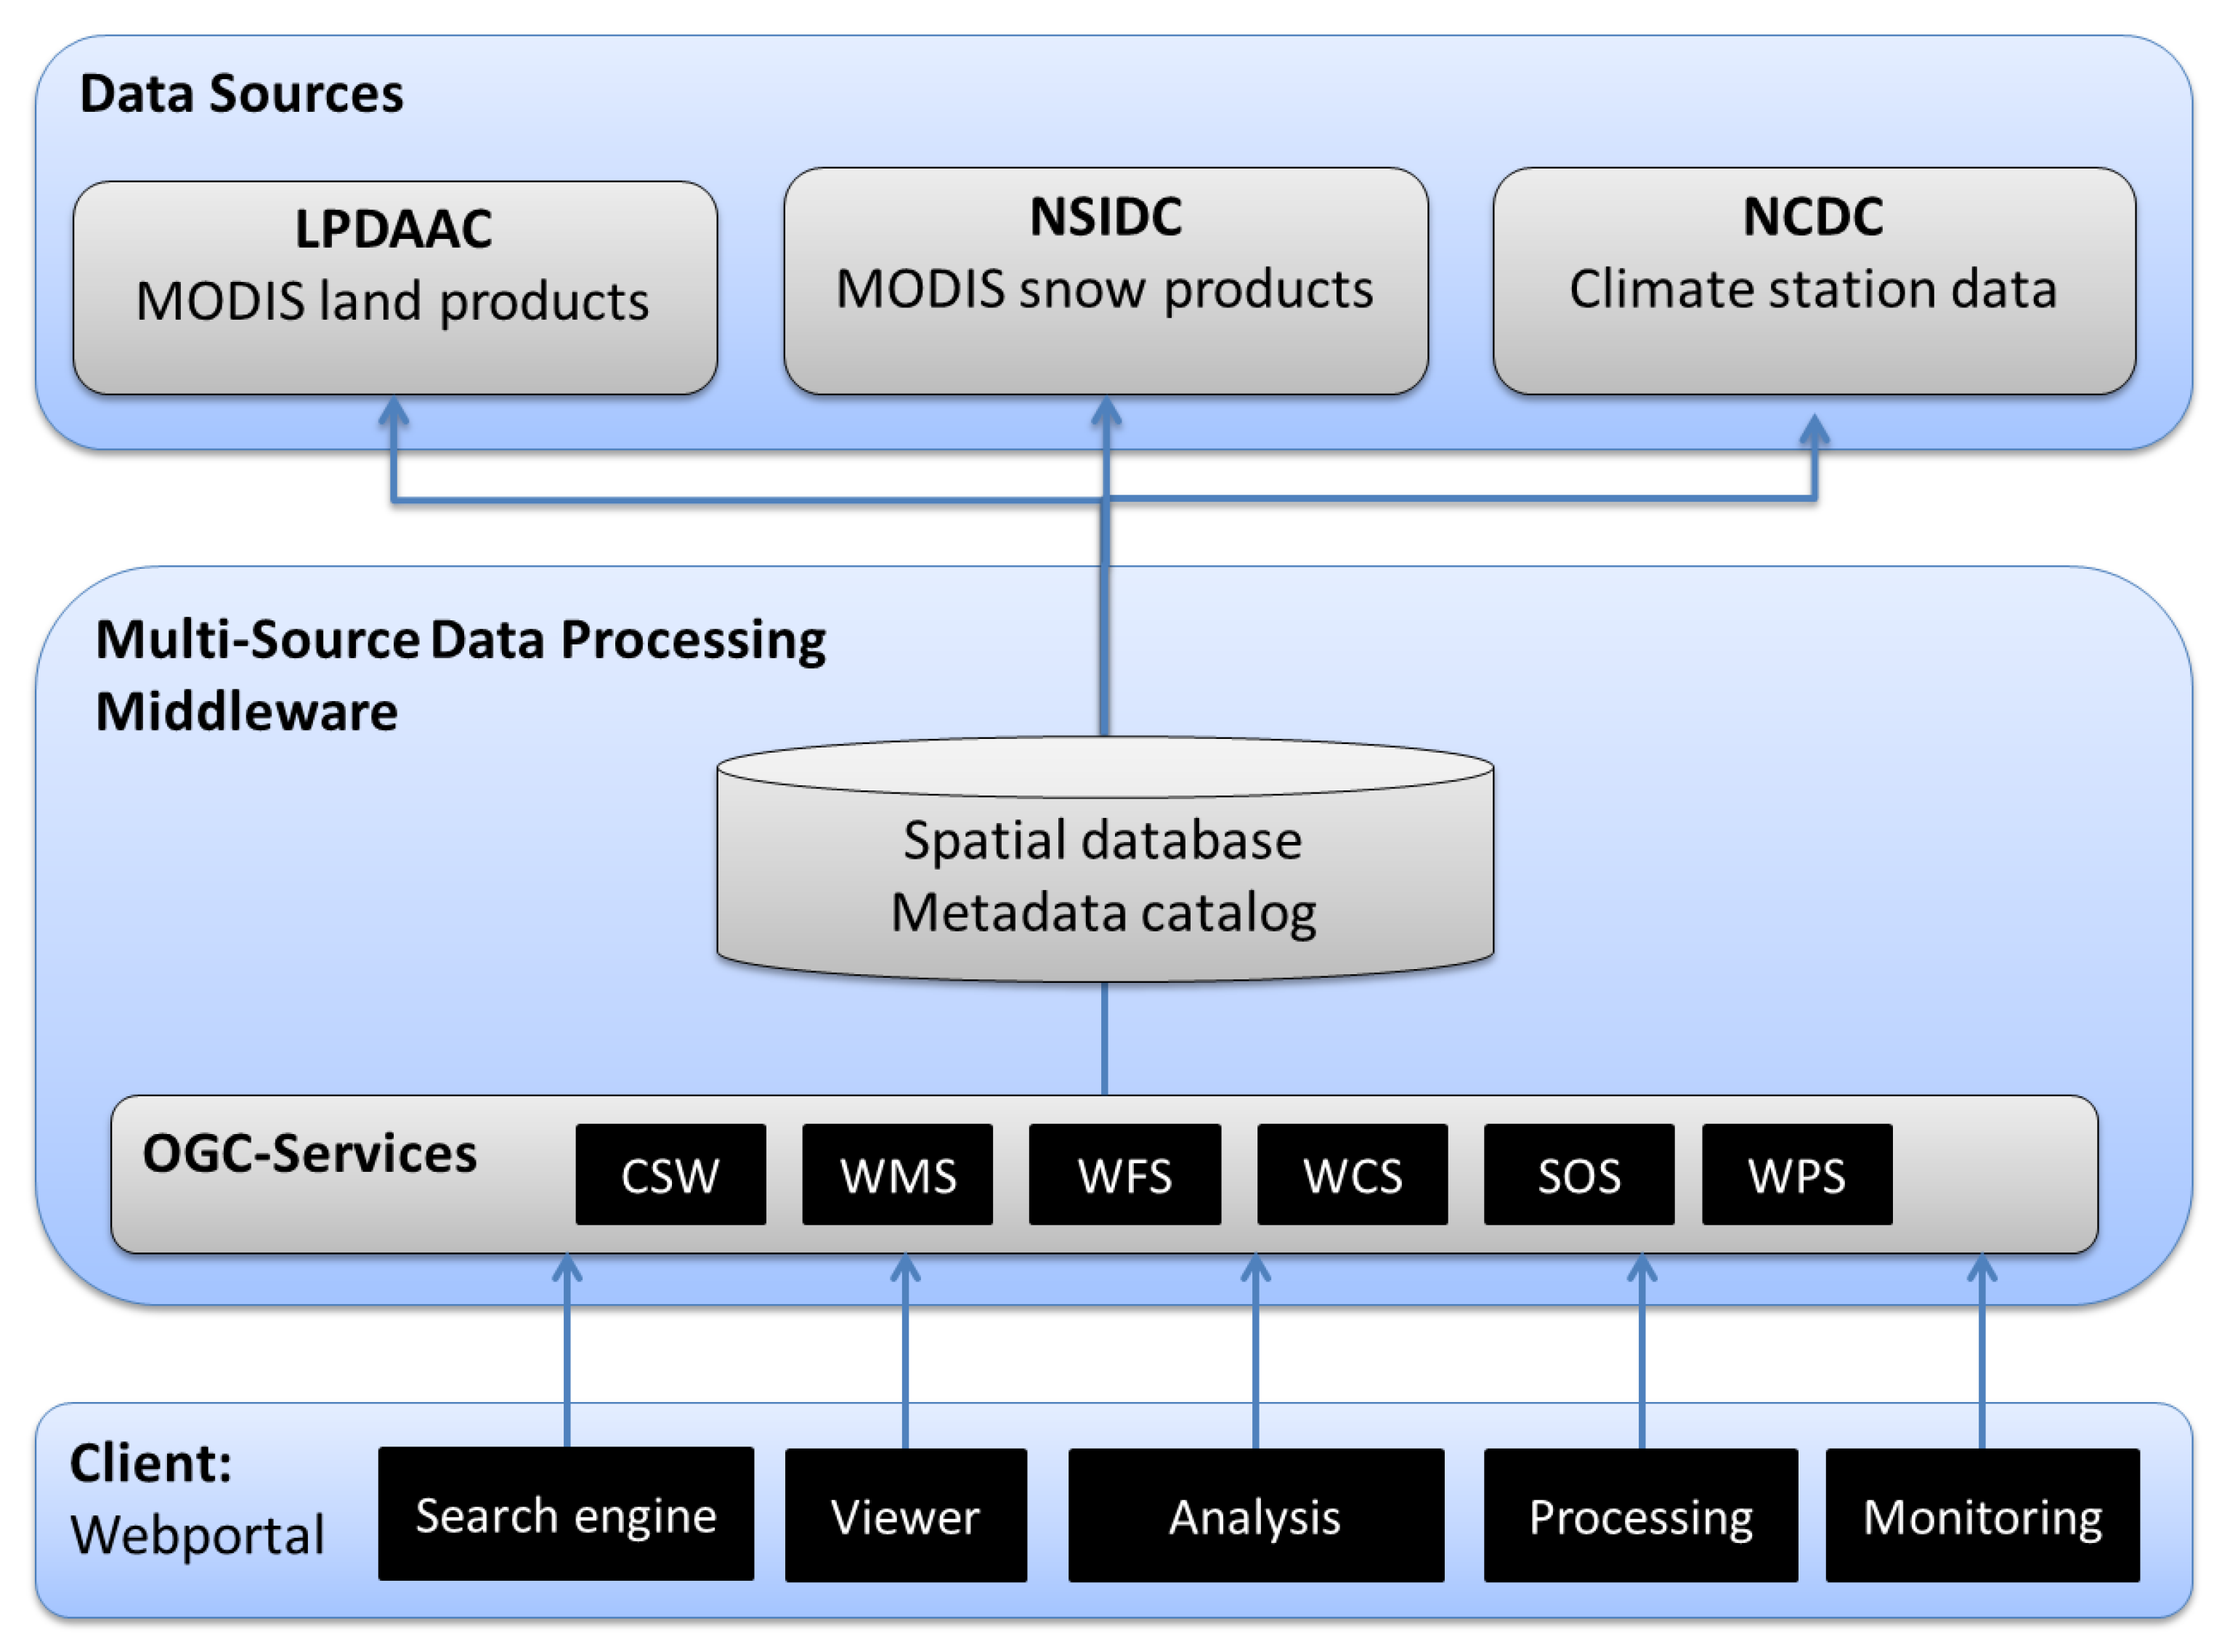
The middleware service developed within the SIB-ESS-C (
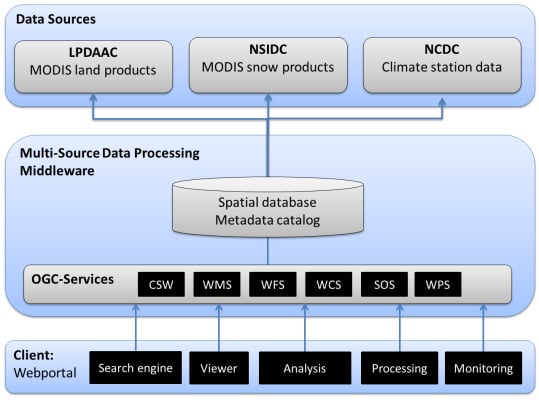
Figure 3 gives a system overview) integrates the time-series data from the Land Processes Distributed Active Archive Center (LPDAAC), the National Snow and Ice Data Center (NSIDC) and the National Climatic Data Center (NCDC) into a spatial database. Metadata information based on available datasets is stored in a second database. The integrated datasets are published via web services that are compliant with Open Geospatial Consortium (OGC) specifications. Data visualization and access is available through the Catalogue Service for Web (CSW; [
36]), Web Map Service (WMS; [
37]), Web Feature Service (WFS; [
38]), Web Coverage Service (WCS; [
39]) and Sensor Observation Service (SOS; [
40]). The time-series plotting service is available as Web Processing Service (WPS; [
41]). In addition to these web services, the SIB-ESS-C web portal acts as a client, accessing the data that are processed by the middleware service. The web portal contains a search engine, a dataset viewer, a time-series plotter and functions to initiate new, on-demand data integration requests for the middleware database.
Open source tools (
Table 4 for a complete list) were used to develop the middleware services; PostgreSQL with the PostGIS extension provides the database with the ability to store raster and vector data. Data integration is done with Python scripting (e.g., to execute command-line tools for data downloading and for raster time-series data processing), and R script is used to plot the integrated time-series data. On the service level, MapServer (data visualization and downloading), istSOS (climate data provision), pycsw (metadata provision) and PyWPS (time-series plotting) are used to publish OGC-compliant services.
Figure 3.
System overview for the framework developed within the Siberian Earth System Science Cluster (SIB-ESS-C). OGC, Open Geospatial Consortium; CSW, Catalogue Service for Web; WMS, Web Map Service; WFS, Web Feature Service; WCS, Web Coverage Service; SOS, Sensor Observation Service; WPS, Web Processing Service.
Table 4.
Open-source tools used for the developed framework.
3.1. Data Integration
The middleware service aims to enable the integration of datasets from external data sources. Therefore, downloading and processing steps have to be automatic. All necessary methods for the complete processing chain—download preparation, downloading, processing and publishing—were implemented with the programming language, Python. The following sections will describe the integration and processing of MODIS products from LPDAAC and NSIDC, as well as the climate data from GSOD and ISD datasets.
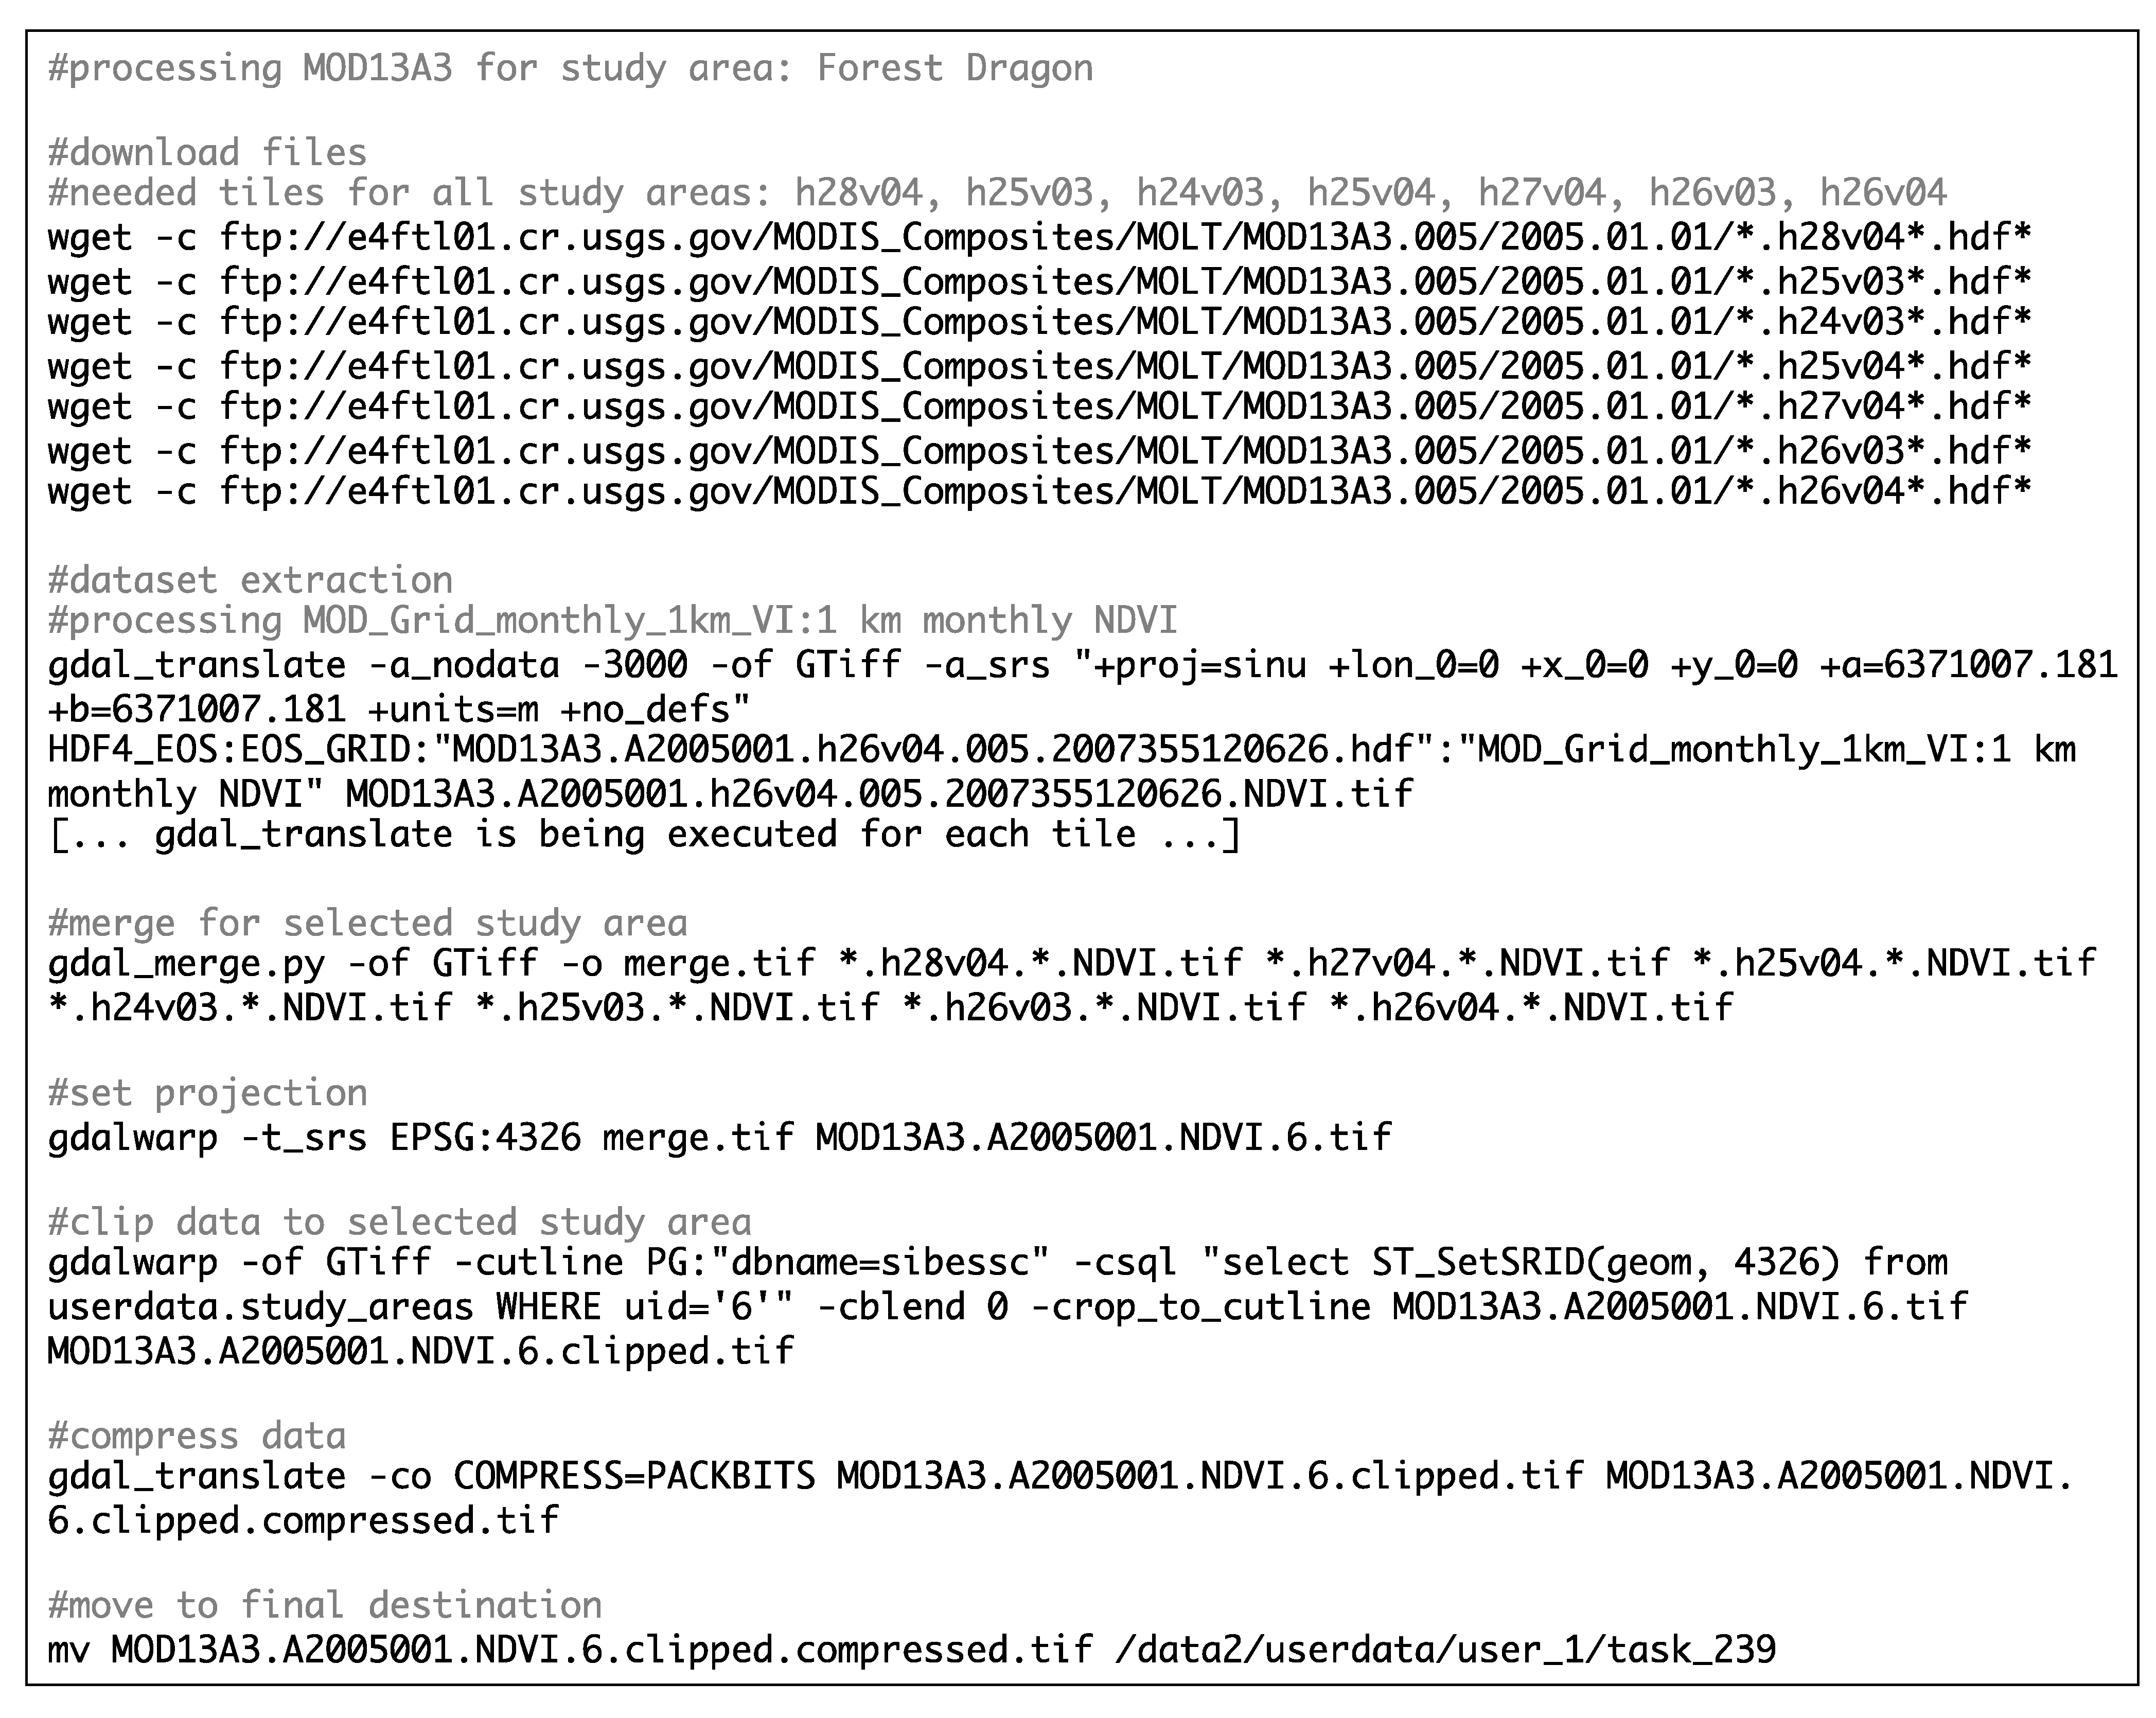
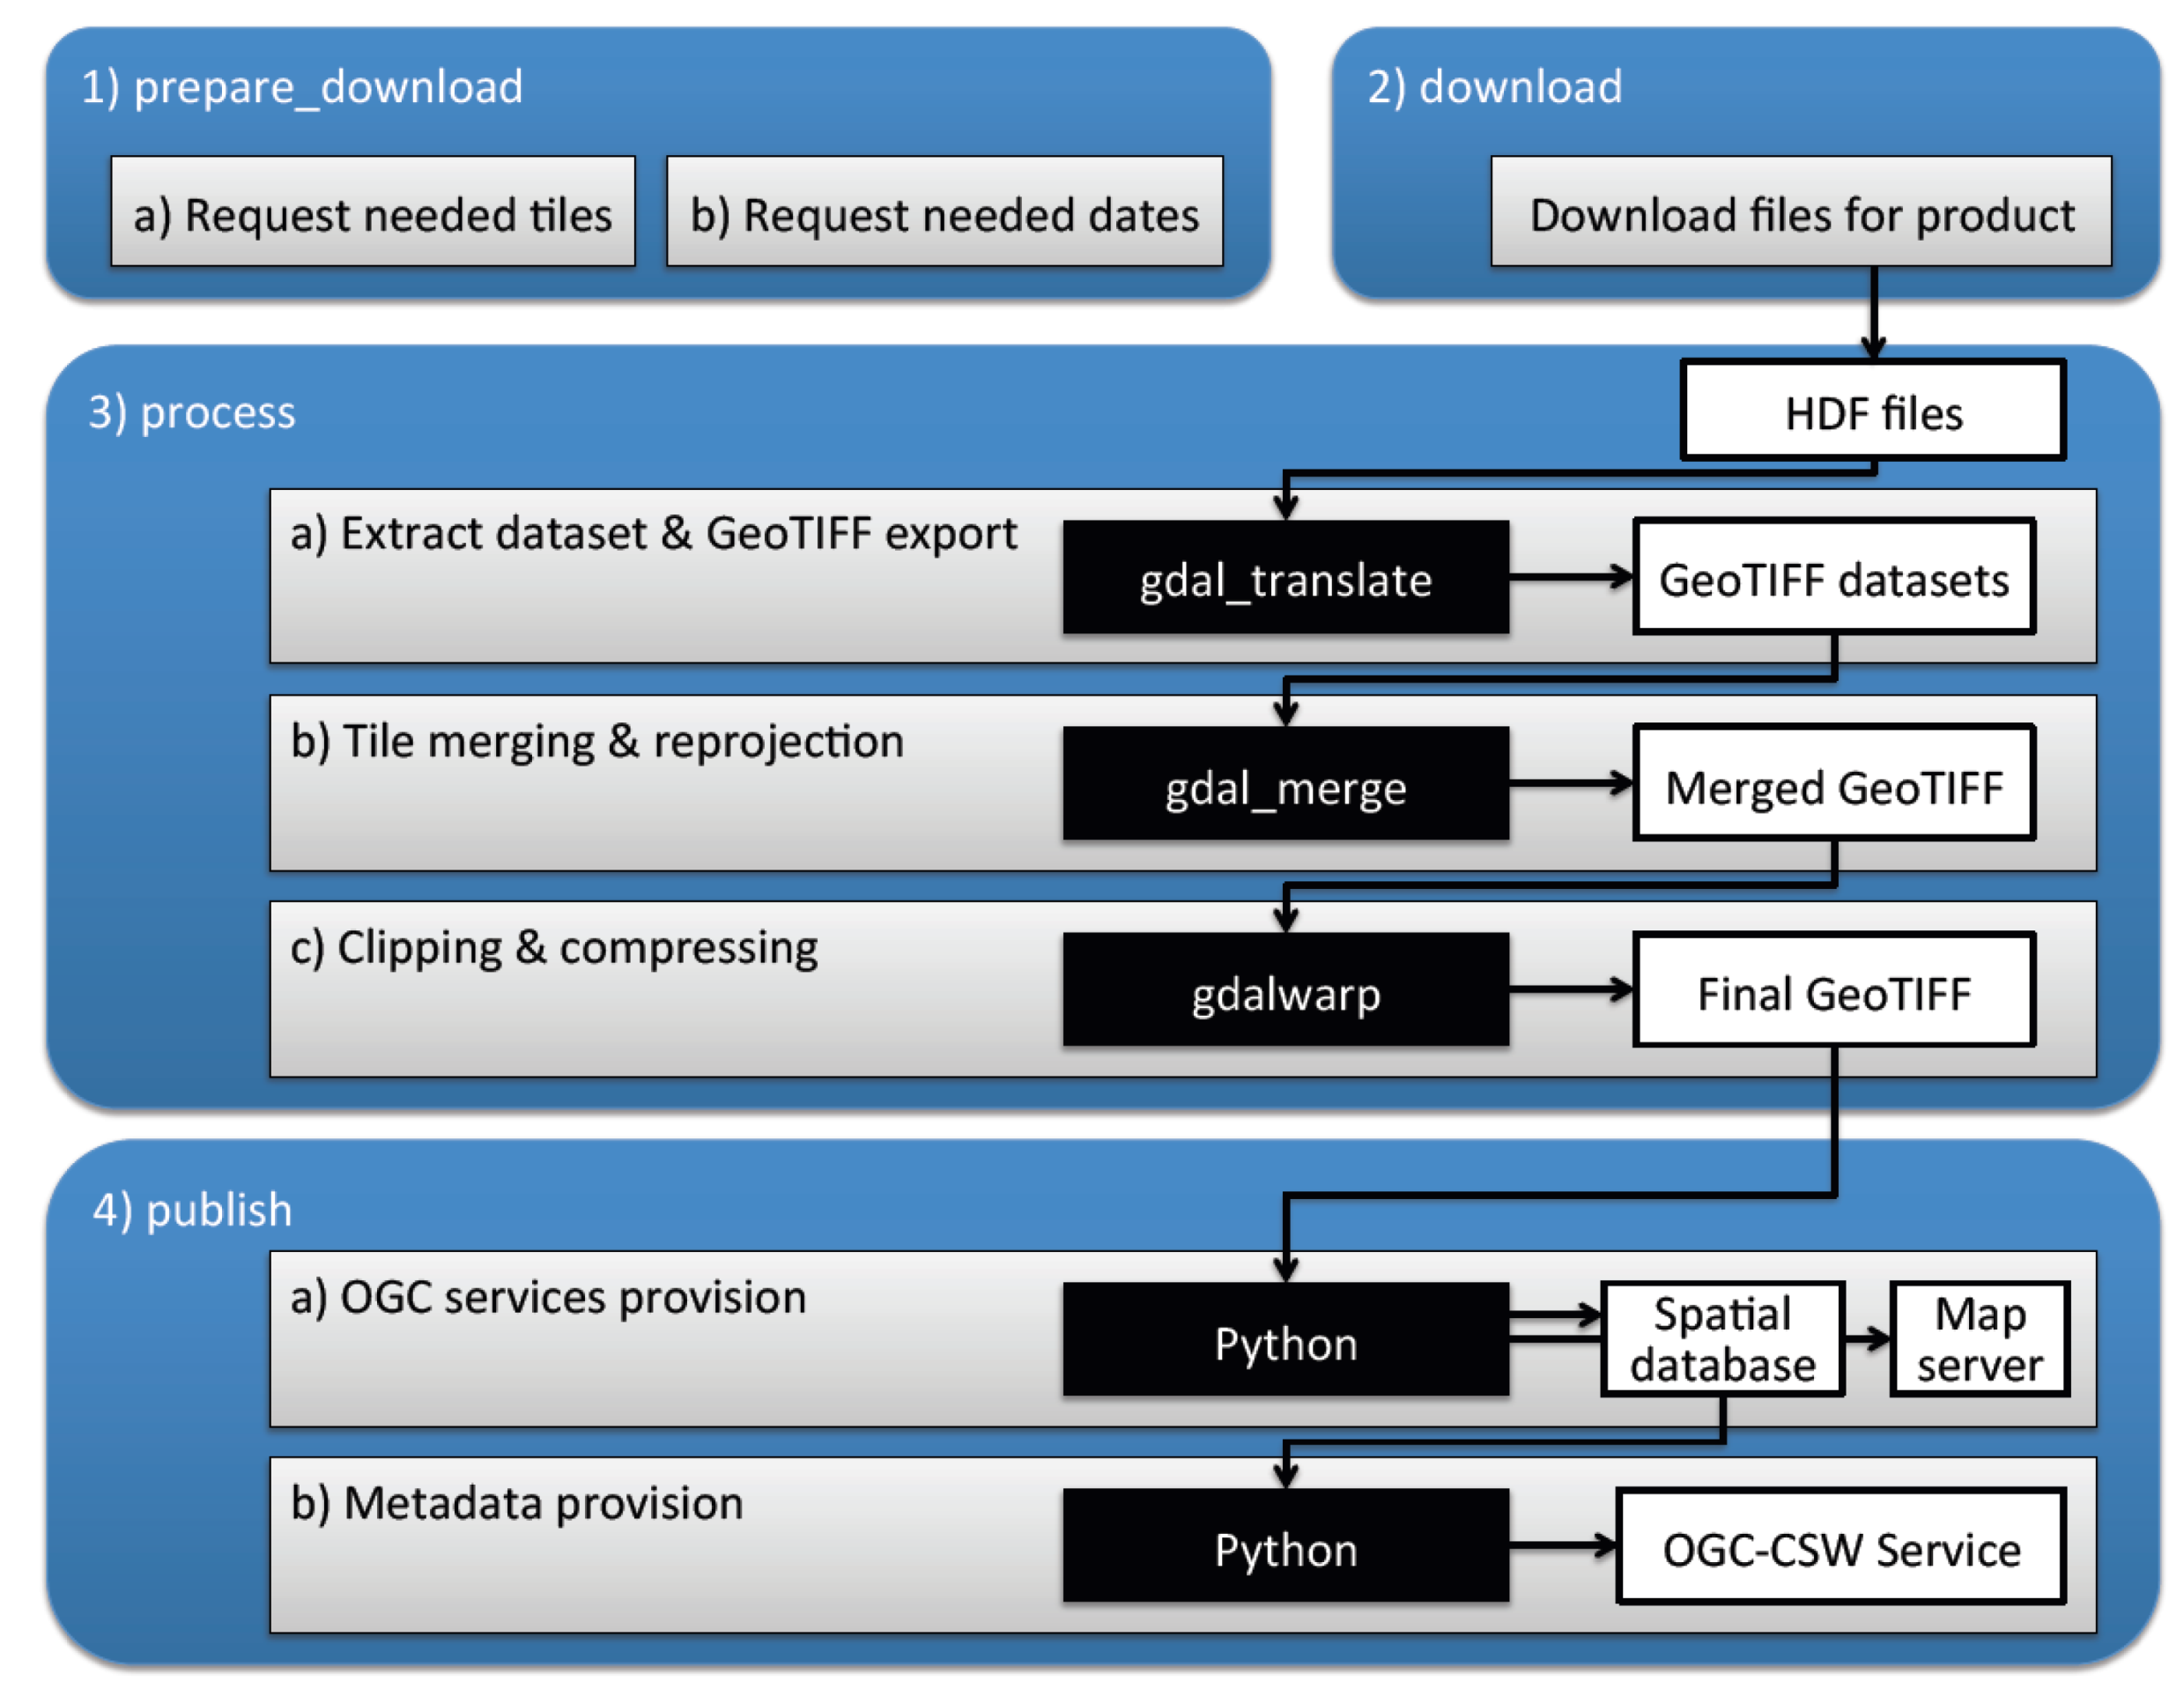
3.1.1. Integration and Processing of MODIS Products
Multiple steps are necessary to process MODIS products: downloading the file, dataset extraction, GeoTIFF export, tile merging and clipping to the specified region (
Figure 4). The workflow for dataset publishing is described in
Section 3.2. To integrate a specific MODIS product, further information is needed; this information is also stored within the middleware database for each product:
data server and directory where files are stored (e.g., FTP)
raster type of product (Swath, Tile, CMG)
whether 5 min swaths or tiles are needed (if raster type is equal to swath/tile)
dataset names to be extracted
no-data and scale information (if necessary for processing)
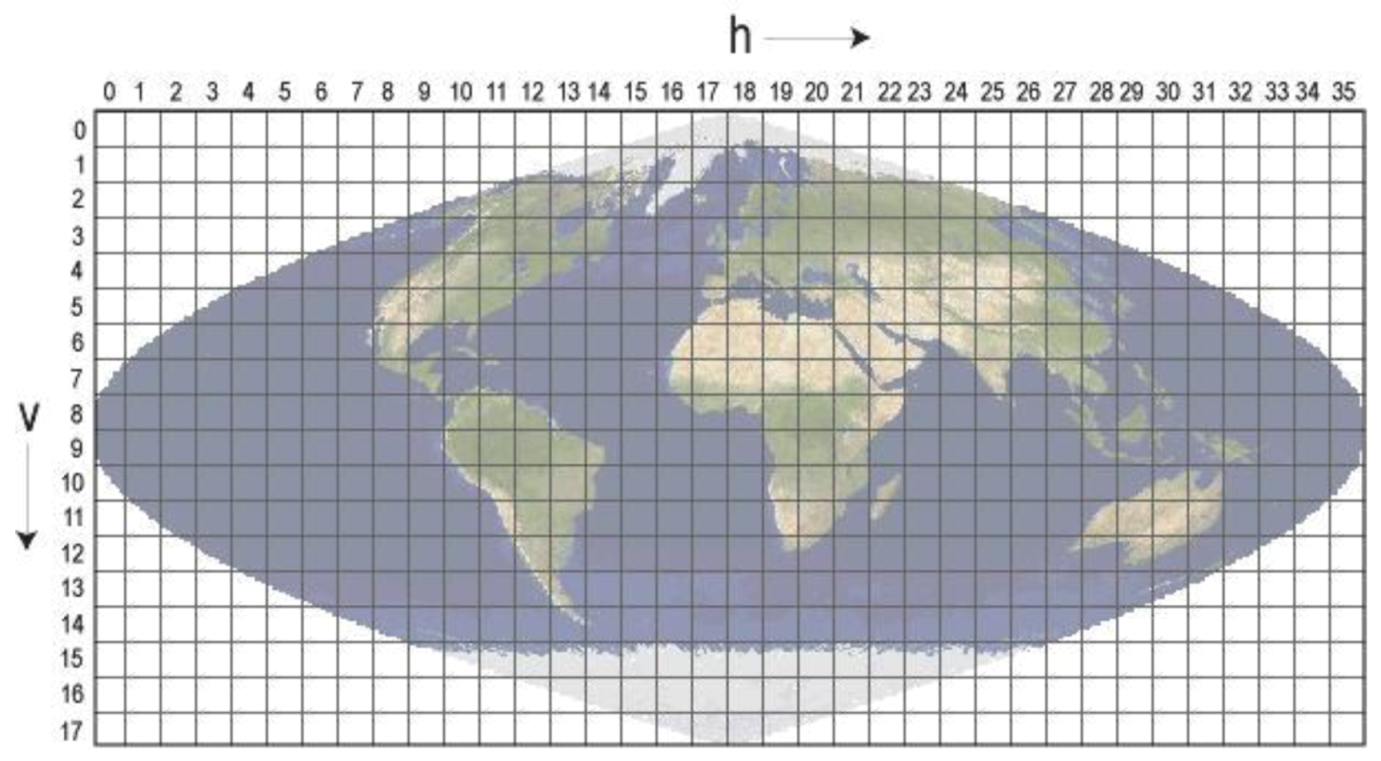
Prior to conducting the download process for tiled products, it is necessary to request the specific tiles needed for the specified region (
Figure 4(1a)). The bounding box of the gridded tiles is available as vector data [
42], which can be intersected with a polygon representing the region. A second step for preparing the download is to identify which dates from the dataset are available and will be processed (
Figure 4(1b)).
The next processing steps (
Figure 4(3)) must be done for each dataset and timestamp. First, the specified dataset is extracted from the original HDF-EOS file. This is done with commands from the Geospatial Data Abstraction Library (GDAL) [
43]. GDAL is a library for reading and writing various spatial raster data formats. It also provides command-line tools for data translation and processing. GDAL commands used in data integration are
gdal_translate (data translation),
gdal_merge.py (mosaic building) and
gdalwarp (transforming an image into a new coordinate system). For each tile or CMG-based file, the necessary dataset is extracted and stored as a GeoTIFF file (
Figure 4(3a)). After extraction, the GeoTIFF files from the tiles are merged and re-projected to EPSG:4326 projection (
Figure 4(3b)). Using the global CMG format—a single GeoTIFF file for the whole world—it is possible to extract, re-project and export to a GeoTIFF format in one step. At the final stage of processing, the output of the conversion is clipped to the specified region and compressed to save disk storage space (
Figure 4(3c)).
Figure 4.
Processing chain for the integration of MODIS products.
Figure 4.
Processing chain for the integration of MODIS products.
A database for the integrated products was established to provide easy access to the data (
Figure 4(4a)). Therefore, any time-series item from MODIS is inserted into the database (
Table 5) with the dataset name, the absolute path to the GeoTIFF file, a MultiPolygon as bounding box and the date of the time-series item. The structure of the tables is derived from the raster tile index structure of GDAL, which can be created for GeoTIFF files with the command-line tool,
gdaltindex. This also automatically creates a bounding box, necessary for OGC-compliant provision. The output is a shapefile containing features of each GeoTIFF file with the generated bounding box. Additional columns for dataset name and the date of the time-series item are added to this structure. In addition to a local link to the GeoTIFF file, it is possible to store the raster data directly in the database. To do this, a further column (raster) is needed, which is provided by the new raster column type of PostGIS 2 [
44].
Table 5.
Database table structure for MODIS time-series data.
Table 5.
Database table structure for MODIS time-series data.
| Column Name | dataset | date | location | geom | raster |
|---|
| Column Type | String | Date | String | MultiPolygon | Raster |
The subsequent steps in the integration chain are data (
Figure 4(4a)) and metadata (
Figure 4(4b)) provision with OGC-compliant services (as described in
Section 3.2.1,
Section 3.2.3). The MODIS processing chain can be extended with additional steps, such as the conversion of units (e.g., degrees Kelvin to degrees Celsius for temperature data), the removal of the scale factor from data values or the resampling to a coarser resolution.
3.1.2. Integration and Processing of the GSOD Dataset
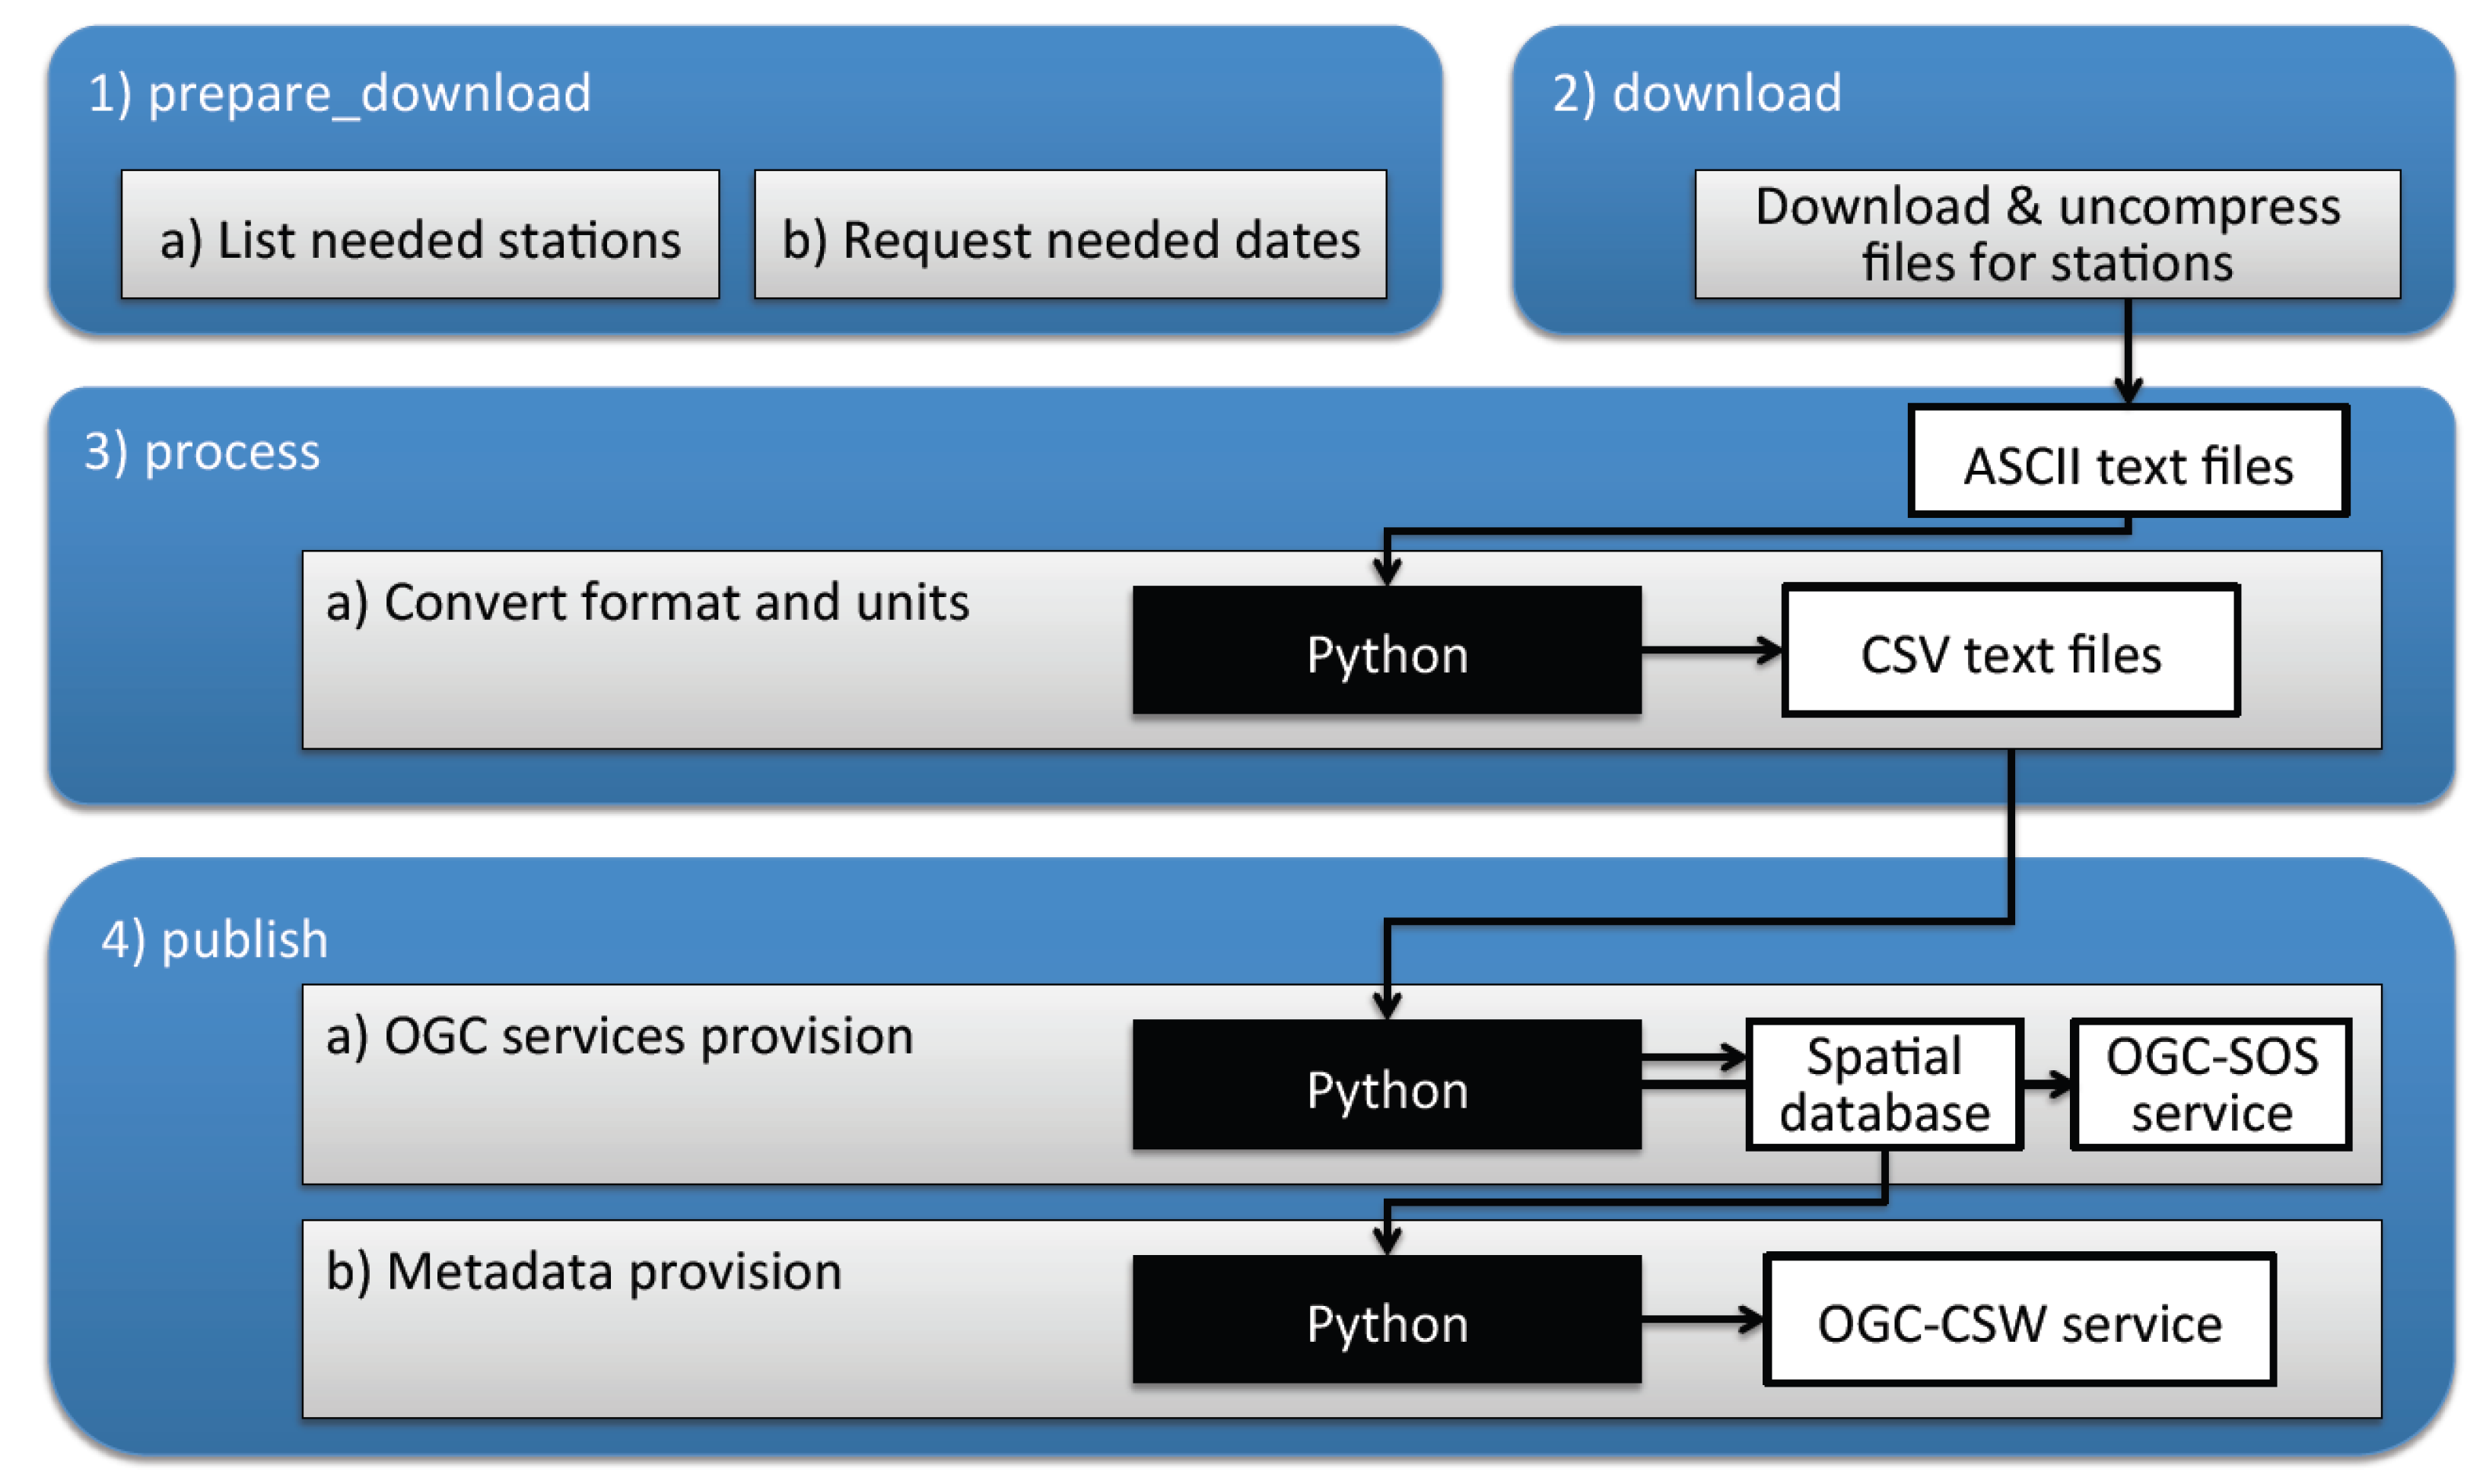
The automatic integration and processing of the GSOD dataset is based on a Python script.
Figure 5 shows the processing chain, with the individual steps divided into the methods used for integration into the middleware database.
Figure 5.
Processing chain for the integration of Global Surface Summary of the Day (GSOD) and Integrated Surface Database (ISD) data.
Figure 5.
Processing chain for the integration of Global Surface Summary of the Day (GSOD) and Integrated Surface Database (ISD) data.
All available stations are listed in a spatial overview table with information about the station ID (USAF, WBAN), station name, coordinates and country, as well as start and end dates for the data (
Table 6). The station ID is an important piece of information for automatic integration; it contains the USAF (Air Force Datsav3 station number), WBAN (historical Weather Bureau Air Force Navy number).
Table 6.
Fields of database table with overview of integrated meteorological stations.
Table 6.
Fields of database table with overview of integrated meteorological stations.
| Gid | USAF | WBAN | Call (ICAO) | Country | Fips | US state | Station name |
| Lat | Lon | Elevation | Date begin | Date end | Geometry | Location | File identifier |
To integrate the data into the middleware database, a list of station IDs and the start and end dates for each station are needed. This information is generated in the preparation step (
Figure 5(1a,1b)). After downloading, the data is unzipped. As mentioned in
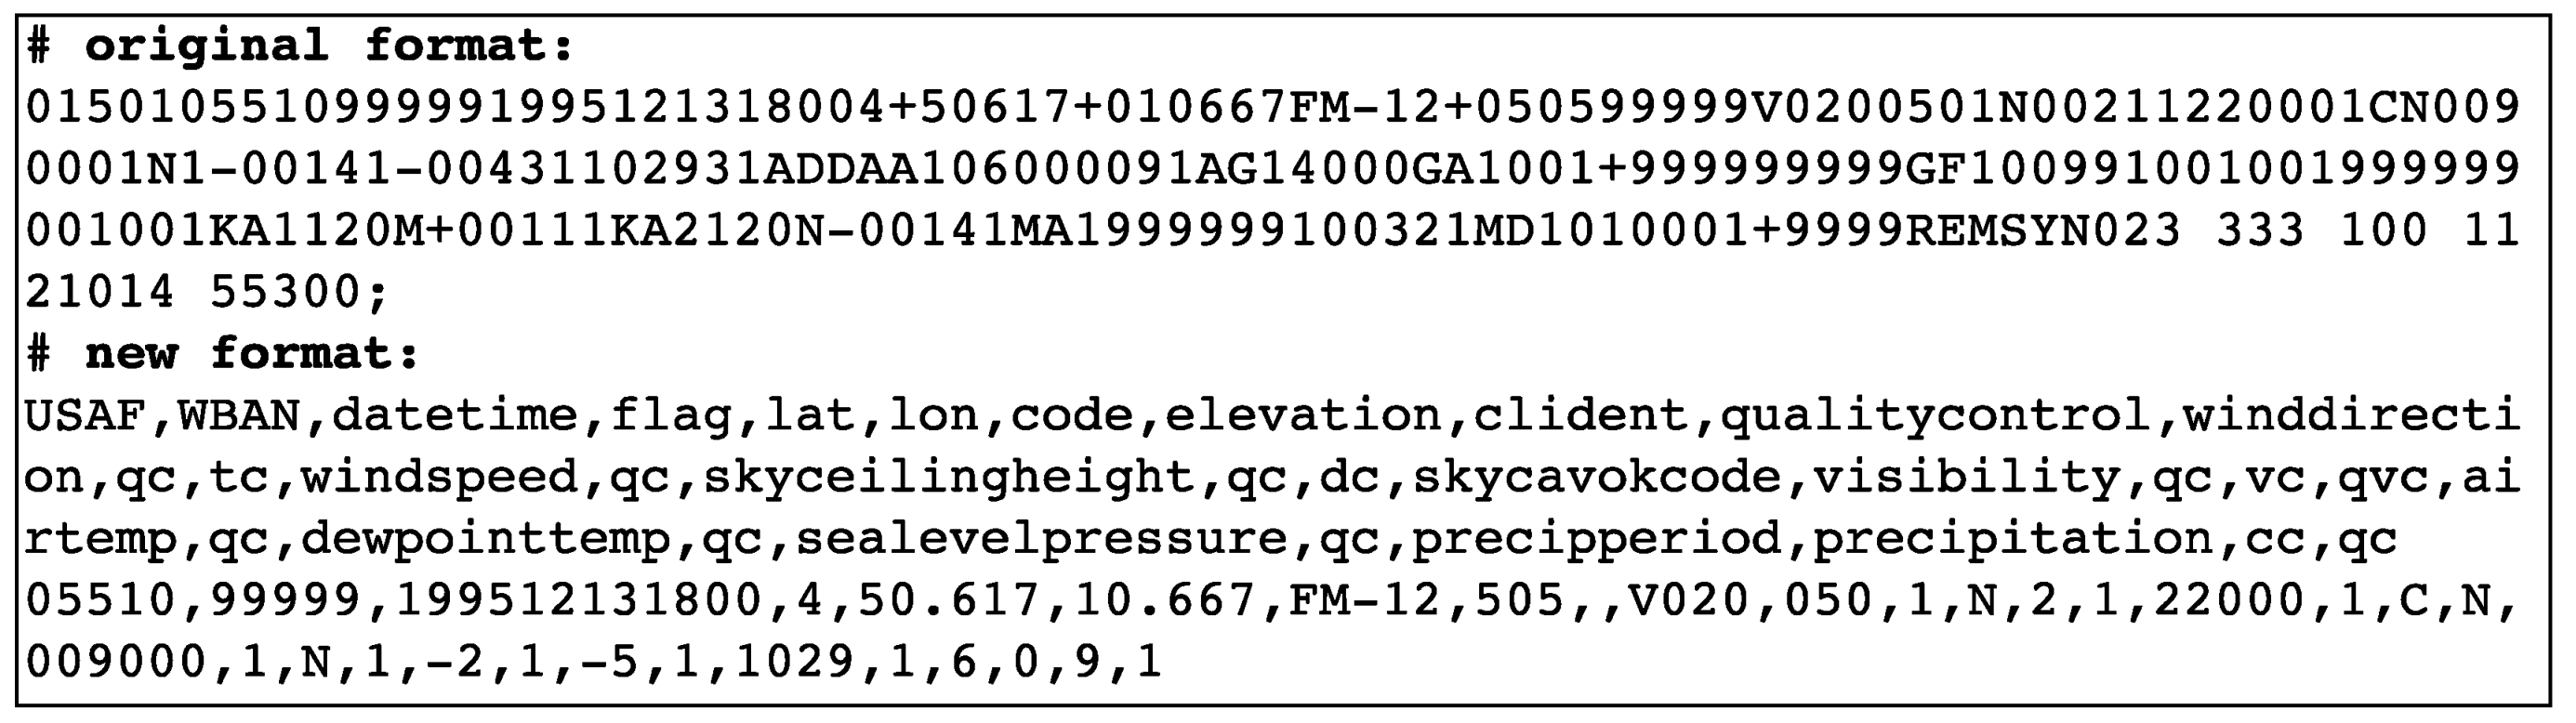
Section 2, the data is then converted from standard US measurement units (degrees Fahrenheit, inches,
etc.) to SI-based units; the format is also changed from a character-delimiting to a comma-delimiting format. This is done using a separate Python script (
Figure 5(3a)). Through this process, all available data are converted and no-data values are specified. As dates with no data are not available within the original file, the dates are added with no-data values to provide a consistent time-series. In addition to the CSV file, the processed data is stored in the PostgreSQL database; its structure is the same as that of the CSV file (
Figure 5(4a)).
3.1.3. Integration and Processing of the ISD Dataset
The integration and processing of the ISD dataset is done on demand based on user requests. The processing chain is the same as that used for the GSOD processing (
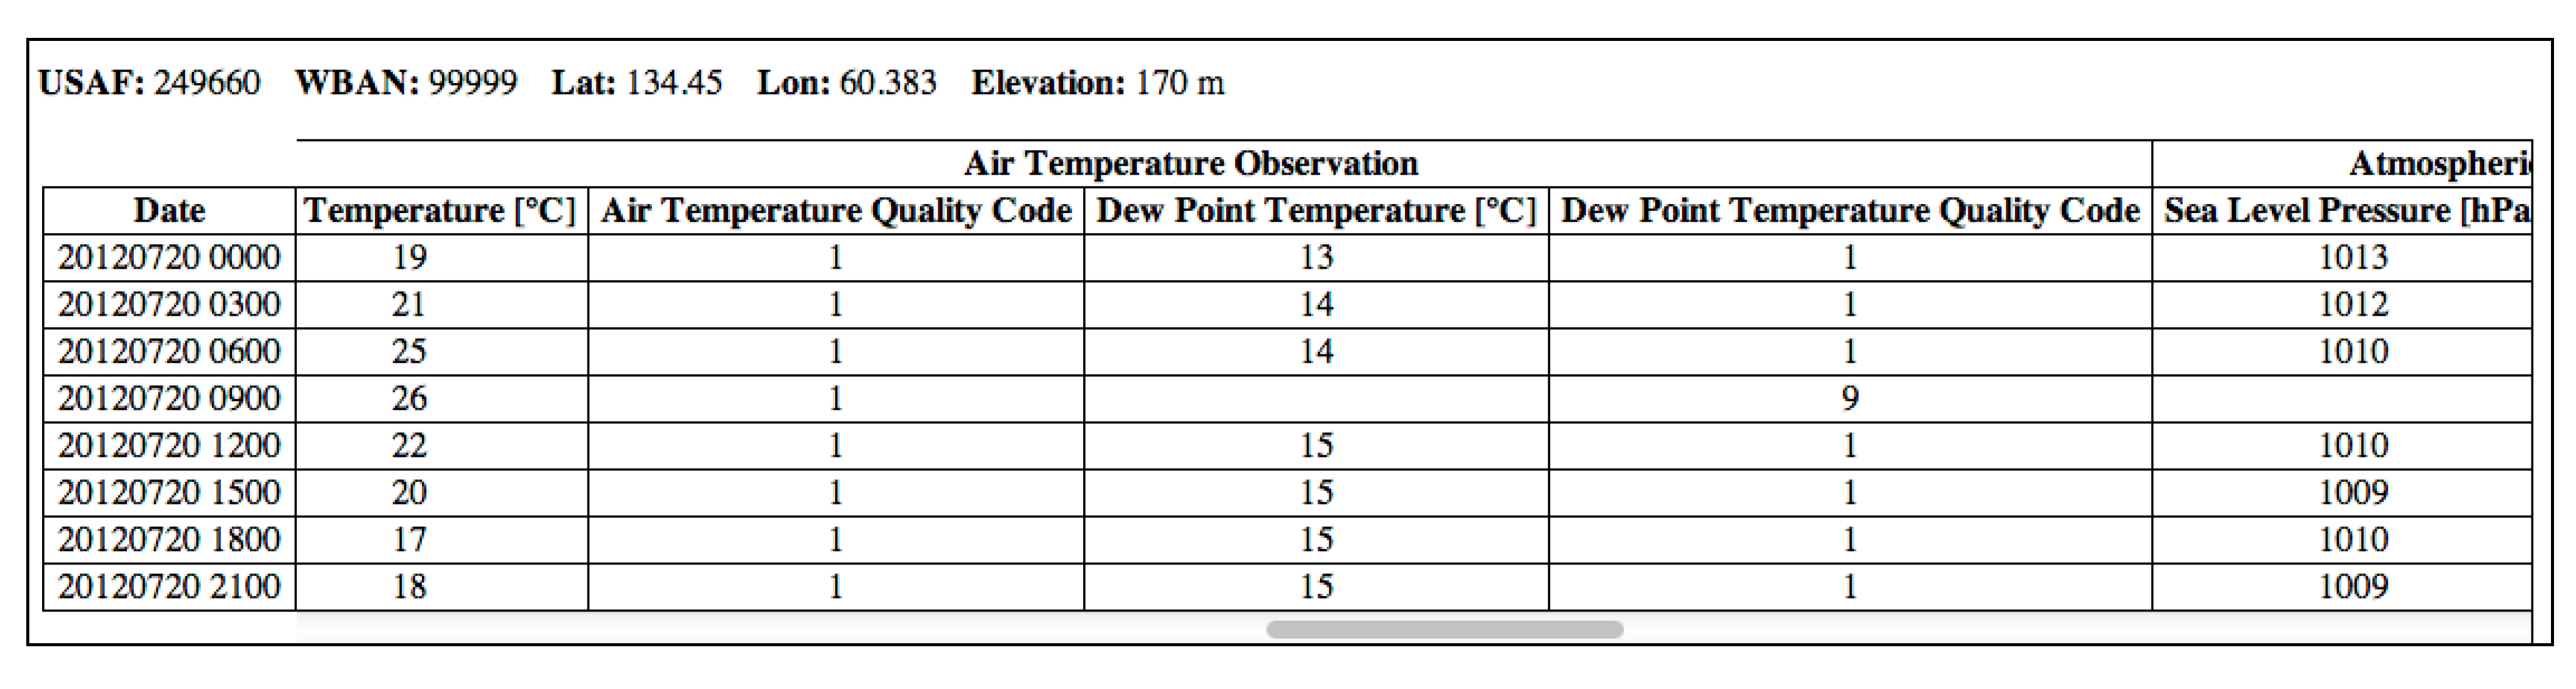
Figure 5). An additional Python script is only needed for data processing. The text files from requested stations are downloaded for the requested time range. After downloading, the files are merged and processed to convert the character-delimiting format to a comma-separated-values (CSV) format. This is done within a separately developed Python script, extracting the most important data. In addition to the data file, the script generates an HTML-based table of the data to provide a quick overview, which is displayed within the web portal. After processing, the files are returned to the web portal, where the user can access the data.
3.2. Data Provision
Services based on the standards and specifications of the Open Geospatial Consortium (OGC), such as Web Map Services (WMS; [
37]), Web Feature Service (WFS; [
38]), Web Coverage Services (WCS; [
39]), Sensor Observation Services (SOS; [
40]) and Catalogue Service for Web (CSW; [
36]), are used to provide access to the middleware database. In accordance with OGC specifications, these services for visualization and downloading can be implemented and then published.
3.2.1. MODIS Data Visualization and Download Services
OGC-based services for data visualization and raster data downloading can be accomplished using different software packages, such as the open-source software MapServer (
http://mapserver.org). MapServer provides OGC-compliant services for data visualization (WMS) and download (WFS, WCS). With time-series data, these services have to be published using the TIME parameter. Using this parameter, users can visualize and download data from a specific date within the time-series.
As all integrated time-series data are inserted into a database table (
Table 5), MapServer can use this table as a data source. However, further information is needed to provide a layer as WMS and WCS:
dataset (layer) name
time extend (start, end, interval)
default time
time positions
styling and legend information
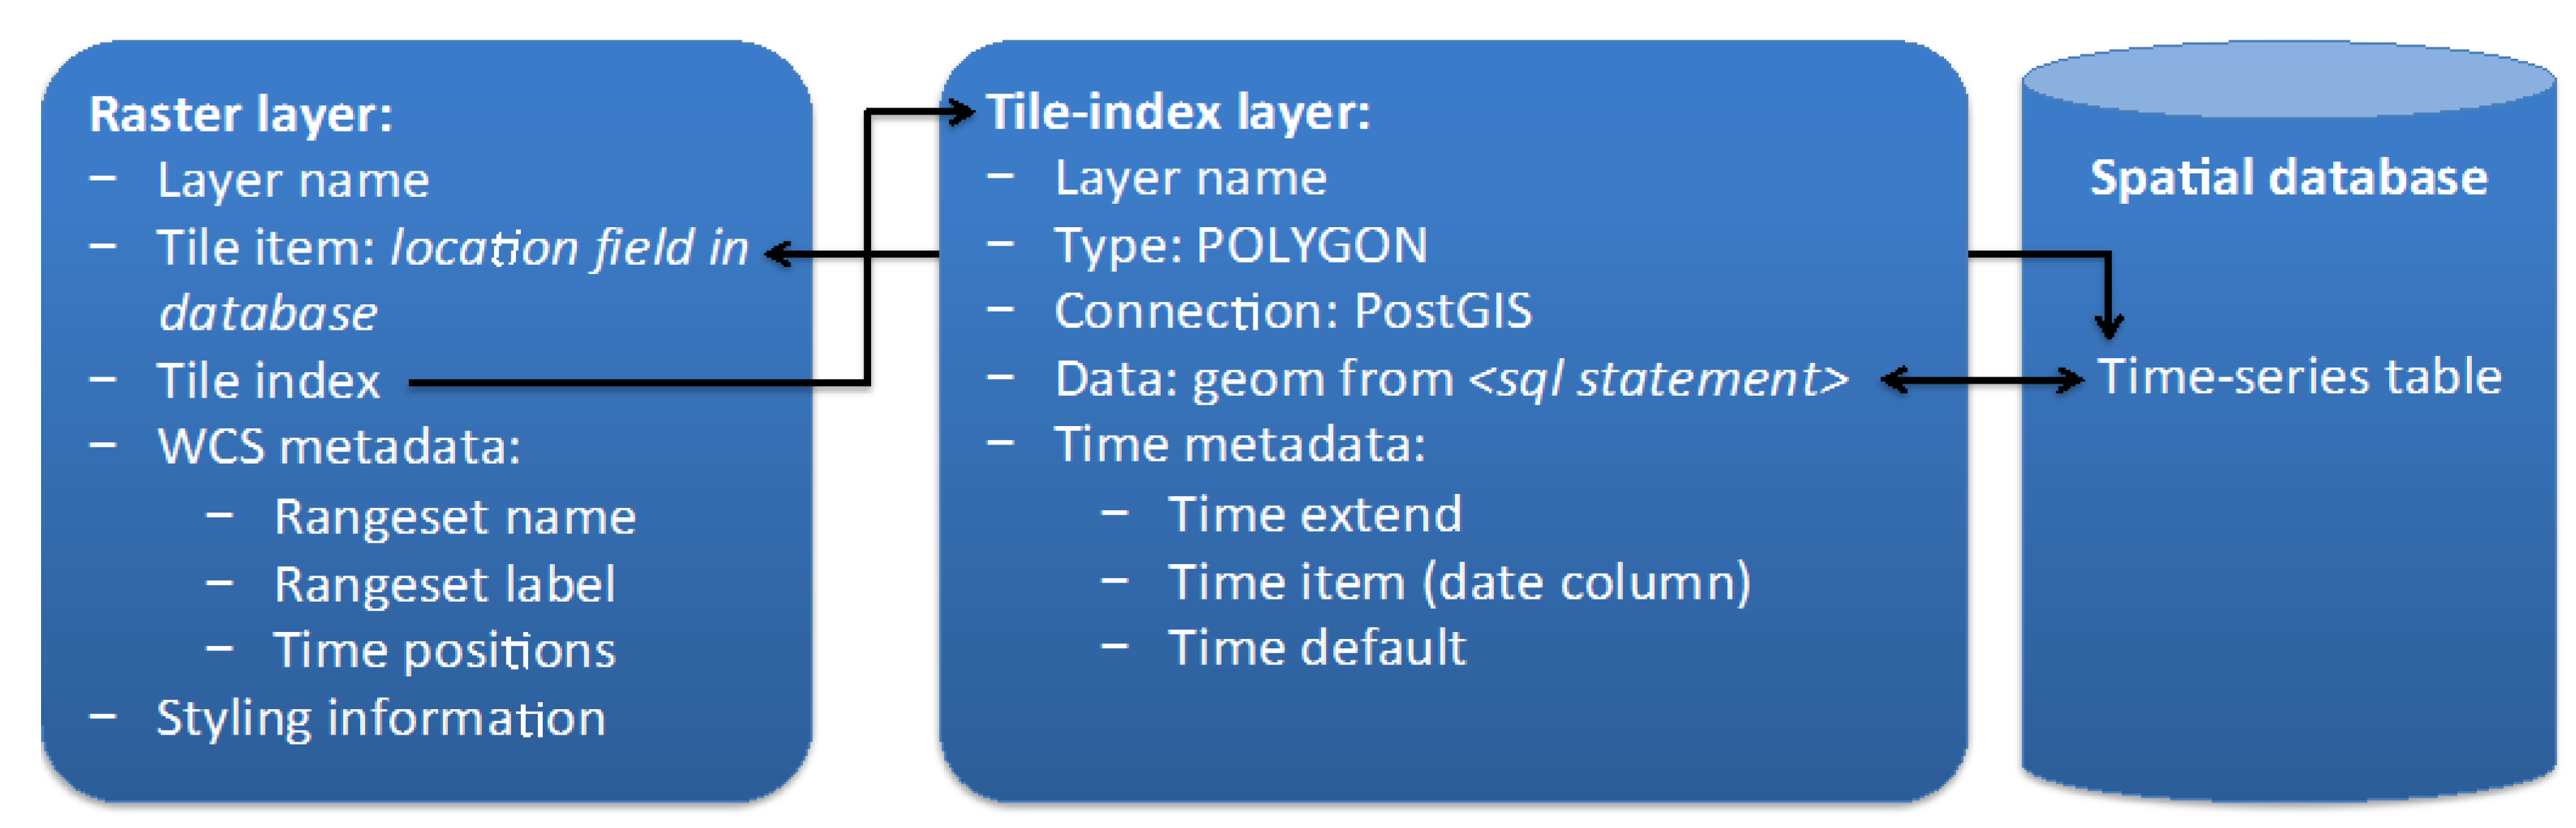
Two layers are needed for each dataset within the configuration file (map file) of MapServer: a tile-index layer, providing information about the connection to the database and the filtering (according to TIME parameter and dataset name), and the main layer, which contains the dataset that links to the tile-index layer (
Figure 6). Information for the database connection and the TIME parameter settings is needed for the tile-index layer. In addition to some general layer settings, the raster layer is configured with information about the database table column where the GeoTIFF file is linked (tile item), the referenced tile-index layer (tile index) and further styling and legend information. For a WCS, a TIME parameter needs to be specified (rangeset name/label) and every available time position for this layer is named in the configuration (time positions).
Figure 6.
MapServer configuration for tile-index and raster layer.
Figure 6.
MapServer configuration for tile-index and raster layer.
Figure 7.
MapCache configuration XML: source and tileset layer properties (e.g., for MOD13C1 normalized vegetation difference index (NDVI)).
Figure 7.
MapCache configuration XML: source and tileset layer properties (e.g., for MOD13C1 normalized vegetation difference index (NDVI)).
To increase the performance of the data visualization, the caching software MapCache (
http://mapserver.org/trunk/mapcache/) was installed and configured for the available layers. Some general properties have to be set, such as the caching storage type (disk or database), default format and error reporting. Service properties can also be set, stating forwarding rules for non-cacheable requests from the download services, WFS and WCS, as well as for specific WMS request types (GetFeatureInfo and GetLegendGraphic), which will be automatically forwarded to the original service endpoint. In addition to these general and service properties, each cached layer has to be configured with a
source and a
tileset object (
Figure 7). Within the
source object, the connection to the original service endpoint is set by URL and default parameters (e.g., format, map file, layer name and transparent flag). The
tileset object refers to the
source and the caching storage object and defines properties for the tiling mechanism: grid type, format, expiration time and dimensions. Within the
dimensions tag, every time position has to be listed.
After updating a time-series dataset, the configuration of MapServer and MapCache has to be updated, as the new time positions have to be added to the configuration. However, as the entire configuration is done using text-based files, it can be updated with any programming language on the server.
3.2.2. Climate Data Services
In addition to providing a CSV file for the climate data, the data can be served as a web service following OGC Sensor Observation Service (OGC-SOS) specifications. Such a web service was set up using the Python-based open-source software istSOS (
http://istgeo.ist.supsi.ch/software/istsos/) [
45,
46].
The administrative interface of istSOS provides functions to create SOS services with required components, such as observed properties, procedures and offerings. The istSOS tutorial [
47] proposes a structure whereby any meteorological station is defined as an SOS procedure linked with observed properties (sensor parameters). The procedures are grouped automatically with an SOS offering (“temporary”). Offerings provide the possibility for group procedures. Observations can be added either by using transactional SOS with XML code or an included Python script that parses text files with observations.
In addition to OGC-SOS specifications, istSOS provides a RESTful interface that allows users to communicate with and administer the service using the JSON data format. This interface also allows users to insert meteorological stations as procedures linked to observed parameters, which are geolocated with a point feature. The station IDs described earlier (USAF and WBAN) are also added as an interface value. The observation data is formatted in the proposed CSV format with column headers titled the same as the registered sensors. Using the included Python script cmdimportcsv.py and the system ID inserted in the prior procedure (meteorological station), the data can be inserted from the command-line.
3.2.3. Metadata Services
The available time-series data, meteorological stations and additional data layers are described using metadata records. These records list information about the data, visualization and download services, as well as the available time positions and time interval. Based on this, a client can build requests for accessing the data. The middleware service generates a metadata record for each time-series dataset following ISO 19115 [
48] specifications. The Python-based open-source software, pycsw (
http://pycsw.org) is used to provide metadata services. pycsw provides OGC-compliant Catalogue Service for Web (CSW), as well as transactional CSW for metadata insertion and updating. Within the configuration file, transactions can be activated only for specific IP addresses. The inserted metadata are stored for the SIB-ESS-C in a SQLite-based database. PostgreSQL and MySQL databases are also possible.
Table 7.
Excerpt of information stored in the metadata records (example of MODIS Terra land surface temperature time-series Data).
Table 7.
Excerpt of information stored in the metadata records (example of MODIS Terra land surface temperature time-series Data).
| General Metadata |
|---|
| File Identifier | MODIS_MOD11_C3_LST_Day_Series |
| Title | Monthly Daytime Land Surface Temperature from MODIS Terra |
| Abstract | Time-series of monthly Terra MODIS daytime land surface temperature in Kelvin at 0.05 degrees spatial resolution. To retrieve actual values in Kelvin, a scale factor of 0.02 has to be applied. The unscaled no-data value is encoded as 0. Original MODIS data retrieved from the Land Processes Distributed Active Archive Center (http://e4ftl01.cr.usgs.gov/MOLT/) |
| Keywords | MODIS, Terra, Siberia, Temperature, Global, Monthly, Series, Daytime |
| Lineage | MODIS HDF Level 2 product was converted to GeoTIFF with gdal_translate (Version 1.9) |
| Data Information |
| Description | Land Surface Temperature |
| Data Type | RASTER |
| Coverage Content Type | Physical Measurement |
| SRS | EPSG:4326 |
| BBOX | 57.1301270 81.2734985 179.8292847 42.2901001 |
| Columns | 2,454 |
| Rows | 780 |
| Resolution | 0.05 |
| Scale Factor | 0.02 |
| No Data Value | 0 |
| Time Begin | 2000-03-01 |
| Time End | 2012-09-01 |
| Time Interval | P1M |
| Dates | 2000-03-01, 2000-04-01, 2000-05-01,…, 2012-08-01, 2012-09-01 |
| Services |
| WMS URL | http://artemis.geogr.uni-jena.de/sibessc/modis |
| WMS Protocol | WebMapService:1.3.0:HTTP |
| WMS Description | MODIS Terra LST Day Monthly |
| WMS Name | mod11c3_lst_day |
| WCS URL | http://artemis.geogr.uni-jena.de/sibessc/modis |
| WCS Protocol | WebCoverageService:1.1.0:HTTP |
| WCS Description | MODIS Terra LST Day Monthly |
| WCS Name | mod11c3_lst_day |
The metadata records are the main entry point for accessing the multi-source data middleware database. In addition to general information, such as the title, abstract, keywords and lineage, a wide range of metadata information can be used to describe the time-series data (
Table 7). To link to OGC-compliant services for visualization and download,
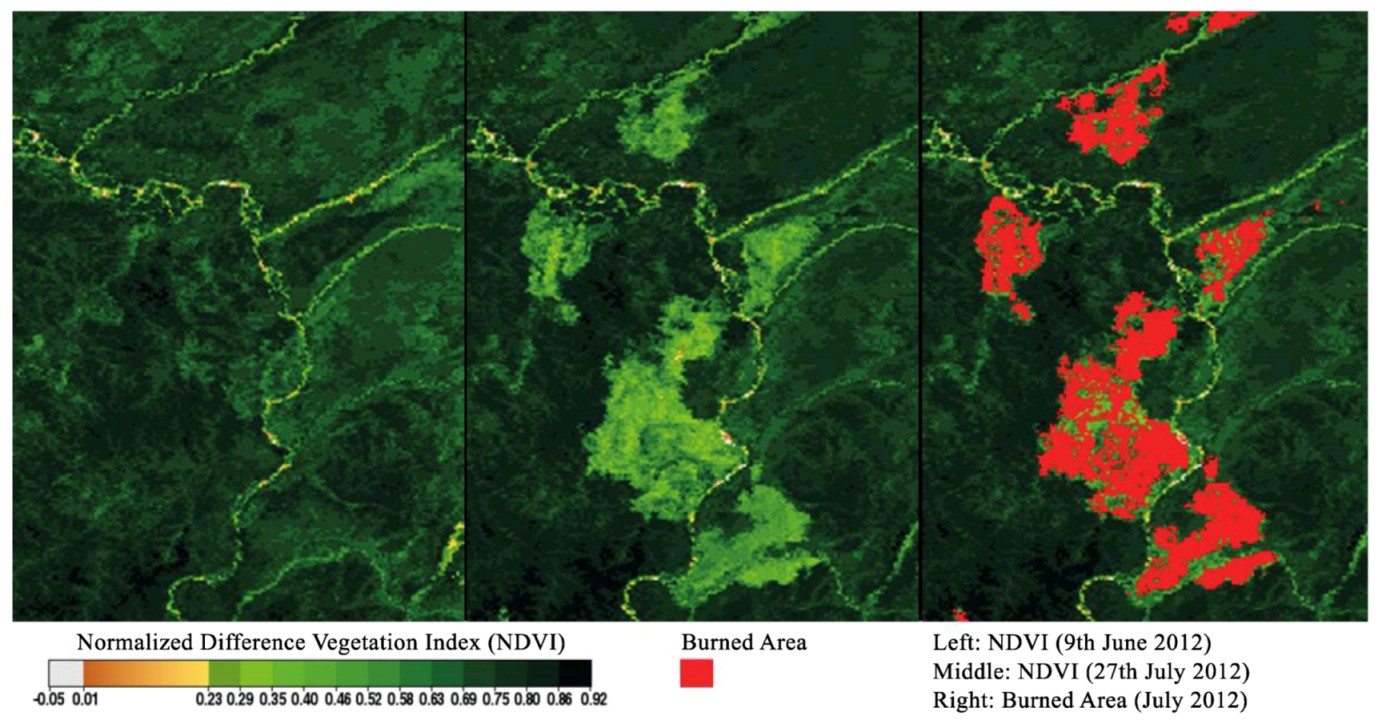
DigitalTransferOptions are provided within the metadata record. A client can retrieve metadata records based on a specific identifier or a search result, then can parse the information and visualize or download the data through the provided services. With the metadata information, the client knows which time positions are available and which services (e.g., Web Map Service, Web Coverage Service or any other http link) can be used, in accordance with user needs. Parsing the metadata record, the client can further distinguish between time-series raster data as physical measurements or as classifications. This distinction is important for aspects, such as providing the correct analysis processes, which differ for classification results (e.g., burned area), as opposed to continuous data, such as land surface temperature, vegetation indices and snow cover.
4. SIB-ESS-C Web Portal as Client for Middleware Services
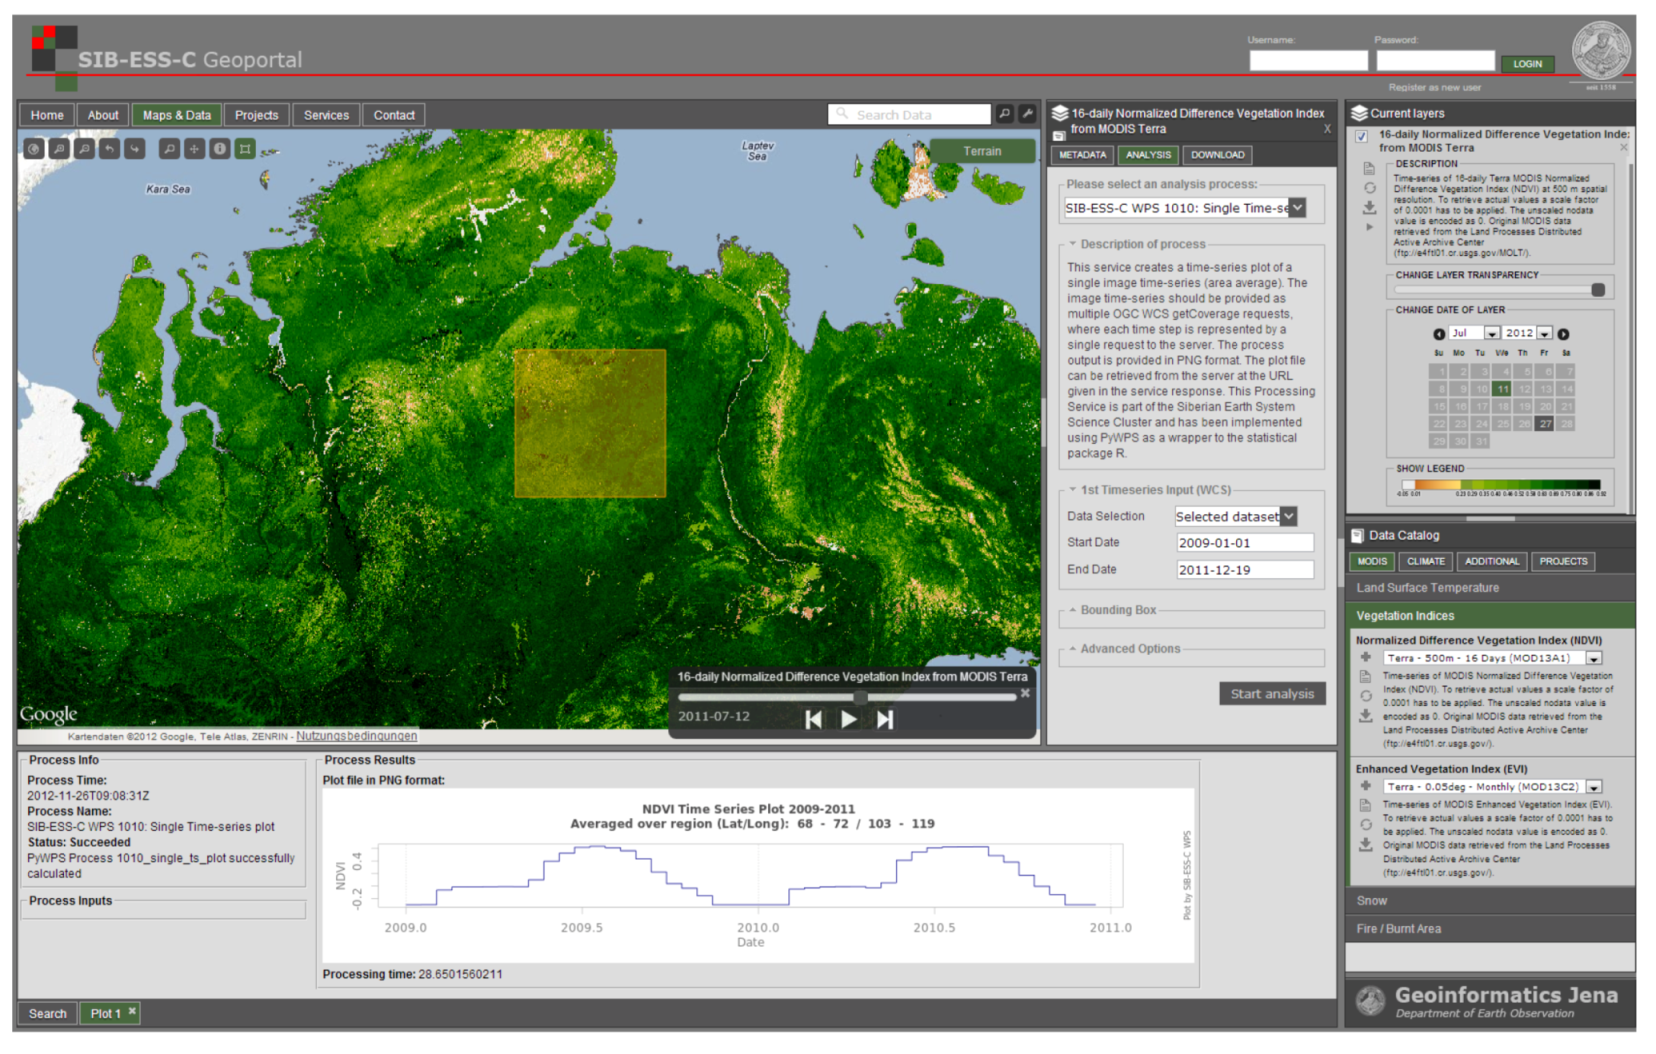
The middleware services are contained within the SIB-ESS-C web portal. This web portal (
Figure 8) includes functions allowing users to administer and manage the middleware services; it also allows easy access to the integrated datasets. Users are supposed to interact closely with the data to receive the best information. Visiting the web portal, the user can go through the data catalog that contains the available data of the middleware database. The metadata catalog can be searched, and the resulting records can be investigated. The data can then be visualized and downloaded.
In addition to providing visualization and download tools for the developed middleware services, the web portal also controls the data-integration process, with each step logged within the system. This feature was integrated for on-demand processing. Developments are currently leading in the direction that allow users to define their own study areas, select datasets and run integration themselves. With the implemented logging functions within the web portal, the user is informed when integration is completed.
Open-source software has been used to develop the web portal. In the backend, Drupal CMS (
http://drupal.org) provides a proxy to external web services, converts XML code to JSON code for better processing within the web-frontend programming language, JavaScript, and provides RESTful services for user registration and authentication. The frontend has been developed using the jQuery library (
http://jquery.org) and extensions of jQuery. The map viewer for visualizing the data has been created using the OpenLayers library (
http://openlayers.org).
6. Conclusion and Outlook
In accordance with the aims of the study, an operational multi-source data processing middleware for land monitoring was established with standard-compliant services for data visualization and distribution. Data from MODIS Land Team and from NSIDC, as well as two climate datasets from NCDC, were connected with the middleware. Additional processing steps were integrated to generate common data formats, such as GeoTIFF and standardized SI-based units for climate data. Since it provides standard-compliant services, the data can be used with other GIS clients or within the developed web portal. The present paper showed applications as to how the middleware services within the SIB-ESS-C can be used to foster the monitoring of land processes using remote sensing and in situ climate data. Without any processing by the user, datasets can be investigated according to land changes; additional information, such as climate data, can easily be added, making data middleware services powerful in combining datasets from multiple sources. Different datasets can then be compared visually within the SIB-ESS-C web portal. Further applications could be the provision of Earth observation data for users who are not familiar with using such kinds of data. They can just visit the web portal and explore the data visually. A main further aspect is the integration of web-based analysis of the time-series data with the possibility to identify changes of the environment in the past.
Standard-compliant data provision is no longer a critical topic, as software packages exist that can handle most common data formats. In combination with a spatial database, sub-selections of data based on parameters, such as time-series data with timestamps, is no longer prohibitively complex to implement. The open-source tools used facilitate the development of such spatial data infrastructures, especially for handling spatial data and making sure that it complies with standards. A more complex task is the provision of styling information for the visualization of data, as this information is not stored in the original data file and has to be generated manually for each dataset. Technical limitations did not occur during implementation, but further work would be helpful in investigating possible improvements in data storage: for example, raster databases [
49,
50] or no-SQL databases for storing and analyzing time-series data [
51]. Data access could also be improved in ways, such as the implementation of the OGC Web Coverage Processing Service specification [
52], which provides processing during data access [
53]. The automated data integration could be implemented, as long as all information required for data downloading and processing is stored in the database. This information is required for datasets that need to be integrated by the middleware service.
Advantages of the implemented methods in the system are the flexibility of how data is provided to the user by using OGC-based services and data in GIS-common formats and the possibility to integrate further time-series analysis tools. For the visualization of integrated data, it is necessary that data is stored in the system, as well. However, this leads to a main problem: data has to be downloaded from external systems and needs disk storage at the owner system. The speed of downloading depends also on the external server, and for big datasets, this needs the most time of data integration and processing. As an example, the data download for the ZAPÁS project took around two days; the processing, just around four hours. To overcome this main issue, the only solution could be that these processing steps (dataset extraction, format conversion, clipping, OGC-compliant data provision, etc.) are implemented on systems with direct access to the data. In an optimal case, the user or the data analysis system just has to download a time-series file and can, then, for example, provide further analysis tools. This is especially needed when such an infrastructure is adapted to higher resolution data, as data from the upcoming ESA Sentinel satellites. Otherwise, the time for data download would increase significantly.
State-of-the-art web technologies make it possible to develop web systems to support science, consulting and policy making, especially in the area of additional data processing. Such tools also support experts in diverse fields with easy data access and visualization tools. Easy-to-use web systems can provide data processing and visualization procedures; in this case, users do not need to download any datasets if they are only interested in getting an overview of land observations. This is made possible as data is provided through interfaces that allow for automated processing. With the automated data integration, time-series databases can be kept up to date. Data that is provided free of cost and is allowed to be distributed through other systems is a major driver of this movement. Further datasets, such as Landsat, NPP VIIRS, Spot Vegetation or the upcoming ESA Sentinel data, need service-based access to integrate them into the developed middleware database. This can be realized by web-based search, order and download services or just providing the data with FTP. Additional metadata and processing information—depending on the dataset—have to be added to the system to extract the requested datasets and to provide OGC-compliant services.
Future enhancements and improvements are planned for the multi-source data middleware and the SIB-ESS-C. For example, datasets from Landsat and Geoland 2 services [
54] might possibly be used for the on-demand integration. Further research on the implementation of processing and analysis tools, such as climate data interpolation, calculation of time-series statistics and the integration of a GIS software backend with Grass GIS or ESRI ArcGIS, have to be conducted. The developed web portal will be extended, e.g., offering tools for users to export time-series information in different formats. At the end of the SIB-ESS-C development, the ideal outcome is an operational monitoring service that observes time-series values, providing information and alerts as defined by the user. For example, users could request an alert in the event of fire or burned or flooded areas or receive an automatic notification regarding the monthly burned area within a user-defined region. The technical development of SIB-ESS-C generally allows the technical transfer and implementation of data middleware services for other areas, in addition to Siberia, as the integrated datasets are globally and freely available, and the above presented developments, databases and services are not specific to a particular area on Earth.

