Plasma Zonulin Levels as a Non-Invasive Biomarker of Intestinal Permeability in Women with Gestational Diabetes Mellitus

 ,
,
Abstract
:1. Introduction
2. Materials and Method
- (i)
- Fasting blood glucose: ≥92 mg/dL, or
- (ii)
- First hour plasma glucose: ≥180 mg/dL, or
- (iii)
- Second hour plasma glucose: ≥153 mg/dL.
Measurement of Plasma Zonulin Levels
3. Statistical Analysis
4. Results
5. Discussion
Author Contributions
Funding
Conflicts of Interest
References
- Kim, C. Maternal outcomes and follow-up after gestational diabetes mellitus. Diabet. Med. 2014, 31, 292–301. [Google Scholar] [CrossRef] [PubMed] [Green Version]
- Kho, Z.Y.; Lal, S.K. The Human Gut Microbiome—A Potential Controller of Wellness and Disease. Front. Microbiol. 2018, 9, 1835. [Google Scholar] [CrossRef] [PubMed]
- Fukui, H. Increased Intestinal Permeability and Decreased Barrier Function: Does It Really Influence the Risk of Inflammation? Inflamm. Intest. Dis. 2016, 1, 135–145. [Google Scholar] [CrossRef] [PubMed] [Green Version]
- Sturgeon, C.; Lan, J.; Fasano, A.; Ann, N.Y. Zonulin transgenic mice show altered gut permeability and increased morbidity/mortality in the DSS colitis model. Acad. Sci. 2017, 1397, 130–142. [Google Scholar] [CrossRef] [PubMed]
- Tripathi, A.; Lammers, K.M.; Goldblum, S.; Shea-Donohue, T.; Netzel-Arnett, S.; Buzza, M.S.; Antalis, T.M.; Vogel, S.N.; Zhao, A.; Yang, S.; et al. Identification of human zonulin, a physiological modulator of tight junctions, as prehaptoglobin-2. Proc. Natl. Acad. Sci. USA 2009, 106, 16799–16804. [Google Scholar] [CrossRef] [PubMed] [Green Version]
- Wang, W.; Uzzau, S.; Goldblum, S.E.; Fasano, A. Human zonulin, a potential modulator of intestinal tight junctions. J. Cell Sci. 2000, 113, 4435–4440. [Google Scholar] [PubMed]
- Vanuytsel, T.; Vermeire, S.; Cleynen, I. The role of haptoglobin and its related protein, zonulin, in inflammatory bowel disease. Tissue Barriers 2013, 1, e27321. [Google Scholar] [CrossRef] [PubMed]
- Sturgeon, C.; Fasano, A. Zonulin, a regulator of epithelial and endothelial barrier functions, and its involvement in chronic inflammatory diseases. Tissue Barriers 2016, 4, e1251384. [Google Scholar] [CrossRef] [PubMed] [Green Version]
- American Diabetes Association. 2. Classification and Diagnosis of Diabetes: Standards of Medical Care in Diabetes—2018. Diabetes Care 2018, 41, S13–S27. [Google Scholar] [CrossRef] [PubMed]
- Mokkala, K.; Tertti, K.; Rönnemaa, T.; Vahlberg, T.; Laitinen, K. Evaluation of serum zonulin for use as an early predictor for gestational diabetes. Nutr. Diabetes 2017, 7, e253. [Google Scholar] [CrossRef] [PubMed]
- Casas, R.; Sacanella, E.; Estruch, R. The immune protective effect of the Mediterranean diet against chronic low-grade inflammatory diseases. Endocr. Metab. Immune Disord. Drug Targets 2014, 14, 245–254. [Google Scholar] [CrossRef] [PubMed]
- Żak-Gołąb, A.; Kocełak, P.; Aptekorz, M.; Zientara, M.; Juszczyk, Ł.; Martirosian, G.; Chudek, J.; Olszanecka-Glinianowicz, M. Gut microbiota, microinflammation, metabolic profile, and zonulin concentration in obese and normal weight subjects. Int. J. Endocrinol. 2013, 2013, 674106. [Google Scholar] [CrossRef] [PubMed]
- Zhang, D.; Zhang, L.; Zheng, Y.; Yue, F.; Russell, R.D.; Zeng, Y. Circulating zonulin levels in newly diagnosed Chinese type 2 diabetes patients. Diabetes Res. Clin. Pract. 2014, 106, 312–318. [Google Scholar] [CrossRef] [PubMed]
- Sapone, A.; De Magistris, L.; Pietzak, M.; Clemente, M.G.; Tripathi, A.; Cucca, F.; Lampis, R.; Kryszak, D.; Cartenì, M.; Generoso, M. Zonulin upregulation is associated with increased gut permeability in subjects with type 1 diabetes and their relatives. Diabetes 2006, 55, 1443–1449. [Google Scholar] [CrossRef] [PubMed]
- Stevens, B.R.; Goel, R.; Seungbum, K.; Richards, E.M.; Holbert, R.C.; Pepine, C.J.; Raizada, M.K. Increased human intestinal barrier permeability plasma biomarkers zonulin and FABP2 correlated with plasma LPS and altered gut microbiome in anxiety or depression. Gut 2018, 67, 1555–1557. [Google Scholar] [CrossRef] [PubMed]
- Smecuol, E.; Sugai, E.; Niveloni, S.; Vázquez, H.; Pedreira, S.; Mazure, R.; Moreno, M.L.; Label, M.; Mauriño, E.; Fasano, A.; et al. Permeability, zonulin production, and enteropathy in dermatitis herpetiformis. Clin. Gastroenterol. Hepatol. 2005, 3, 335–341. [Google Scholar] [CrossRef]
- Ohlsson, B.; Roth, B.; Larsson, E.; Höglund, P. Calprotectin in serum and zonulin in serum and feces are elevated after introduction of a diet with lower carbohydrate content and higher fiber, fat and protein contents. Biomed. Rep. 2017, 6, 411–422. [Google Scholar] [CrossRef] [PubMed] [Green Version]
- Houttu, N.; Mokkala, K.; Laitinen, K. Overweight and obesity status in pregnant women are related to intestinal microbiota and serum metabolic and inflammatory profiles. Clin. Nutr. 2018, 37, 1955–1966. [Google Scholar] [CrossRef] [PubMed]
- Mokkala, K.; Pellonperä, O.; Röytiö, H.; Pussinen, P.; Rönnemaa, T.; Laitinen, K. Increased intestinal permeability, measured by serum zonulin, is associated with metabolic risk markers in overweight pregnant women. Metabolism 2017, 69, 43–50. [Google Scholar] [CrossRef] [PubMed]
- Mokkala, K.; Röytiö, H.; Munukka, E.; Pietilä, S.; Ekblad, U.; Rönnemaa, T.; Eerola, E.; Laiho, A.; Laitinen, K. Gut Microbiota Richness and Composition and Dietary Intake of Overweight Pregnant Women Are Related to Serum Zonulin Concentration, a Marker for Intestinal Permeability. J. Nutr. 2016, 146, 1694–1700. [Google Scholar] [CrossRef] [PubMed] [Green Version]


| Control Group | GDM Group | p | |||||
|---|---|---|---|---|---|---|---|
| Ort. ± s.d./n-% | Ort. ± s.d./n-% | ||||||
| Age, years | 30.2 | ± | 4.9 | 31.3 | ± | 6.4 | 0.169 |
| Height, cm | 160.8 | ± | 5.7 | 161.8 | ± | 5.5 | 0.206 |
| Weight, kg | 71.8 | ± | 12.1 | 76.9 | ± | 12.3 | 0.004 |
| BMI; kg/m2 | 27.7 | ± | 4.2 | 29.4 | ± | 4.7 | 0.027 |
| Pregnancy Number, n | 2.3 | ± | 1.3 | 2.7 | ± | 1.4 | 0.077 |
| History of GDM, n | 6 | 5.1% | 9 | 11.0% | 0.120 | ||
| HT, n | 2 | 1.7% | 2 | 2.4% | 1.000 | ||
| HL, n | 0 | 0.0% | 0 | 0.0% | 1.000 | ||
| Smoking, n | 17 | 14.4% | 13 | 15.9% | 0.778 | ||
| Family History, n | 52 | 44.1% | 29 | 35.4% | 0.218 | ||
| Control Group | GDM Group | p | ||||||
|---|---|---|---|---|---|---|---|---|
| Ort. ± s.d./n-% | Ort. ± s.d./n-% | |||||||
| Glucose, mg/dL | 72.5 | ± | 11.0 | 84.9 | ± | 14.6 | 84.0 | 0.000 |
| Urea, mg/dL | 14.3 | ± | 4.0 | 14.6 | ± | 4.0 | 14.0 | 0.356 |
| Creatinine, mg/dL | 0.4 | ± | 0.1 | 0.4 | ± | 0.1 | 0.4 | 0.148 |
| AST, U/L | 17.2 | ± | 5.1 | 18.0 | ± | 6.0 | 17.5 | 0.323 |
| ALT, U/L | 12.5 | ± | 5.9 | 14.5 | ± | 6.2 | 14.0 | 0.003 |
| LDL, mg/dL | 110.8 | ± | 36.1 | 114.8 | ± | 50.2 | 111.5 | 0.848 |
| HDL, mg/dL | 68.5 | ± | 15.6 | 66.4 | ± | 16.7 | 64.0 | 0.268 |
| TG, mg/dL | 195.5 | ± | 77.9 | 208.7 | ± | 69.8 | 200.5 | 0.083 |
| T.Cholesterol, mg/dL | 215.9 | ± | 47.8 | 222.8 | ± | 54.7 | 217.0 | 0.825 |
| Uric acid, mg/dL | 3.2 | ± | 0.6 | 3.3 | ± | 0.8 | 3.3 | 0.591 |
| GGT, U/L | 8.3 | ± | 4.8 | 9.1 | ± | 5.5 | 8.0 | 0.250 |
| Hb, g/dL | 11.2 | ± | 1.3 | 11.2 | ± | 1.0 | 11.2 | 0.868 |
| WBC, (x103) | 9.9 | ± | 2.3 | 10.2 | ± | 2.1 | 10.1 | 0.268 |
| Platelets (x109) | 241.2 | ± | 69.8 | 239.0 | ± | 61.1 | 233.5 | 0.805 |
| MPV, fL | 10.8 | ± | 1.2 | 10.9 | ± | 0.9 | 10.9 | 0.746 |
| Sodium, mmol/L | 137.4 | ± | 1.4 | 137.2 | ± | 1.7 | 138.0 | 0.716 |
| Potassium, mmol/L | 4.0 | ± | 0.3 | 4.1 | ± | 0.3 | 4.1 | 0.094 |
| HbA1c, g/dL | 4.8 | ± | 0.4 | 5.0 | ± | 0.4 | 5.0 | 0.004 |
| HOMA-IR | 2.2 | ± | 1.1 | 2.5 | ± | 1.0 | 2.4 | 0.004 |
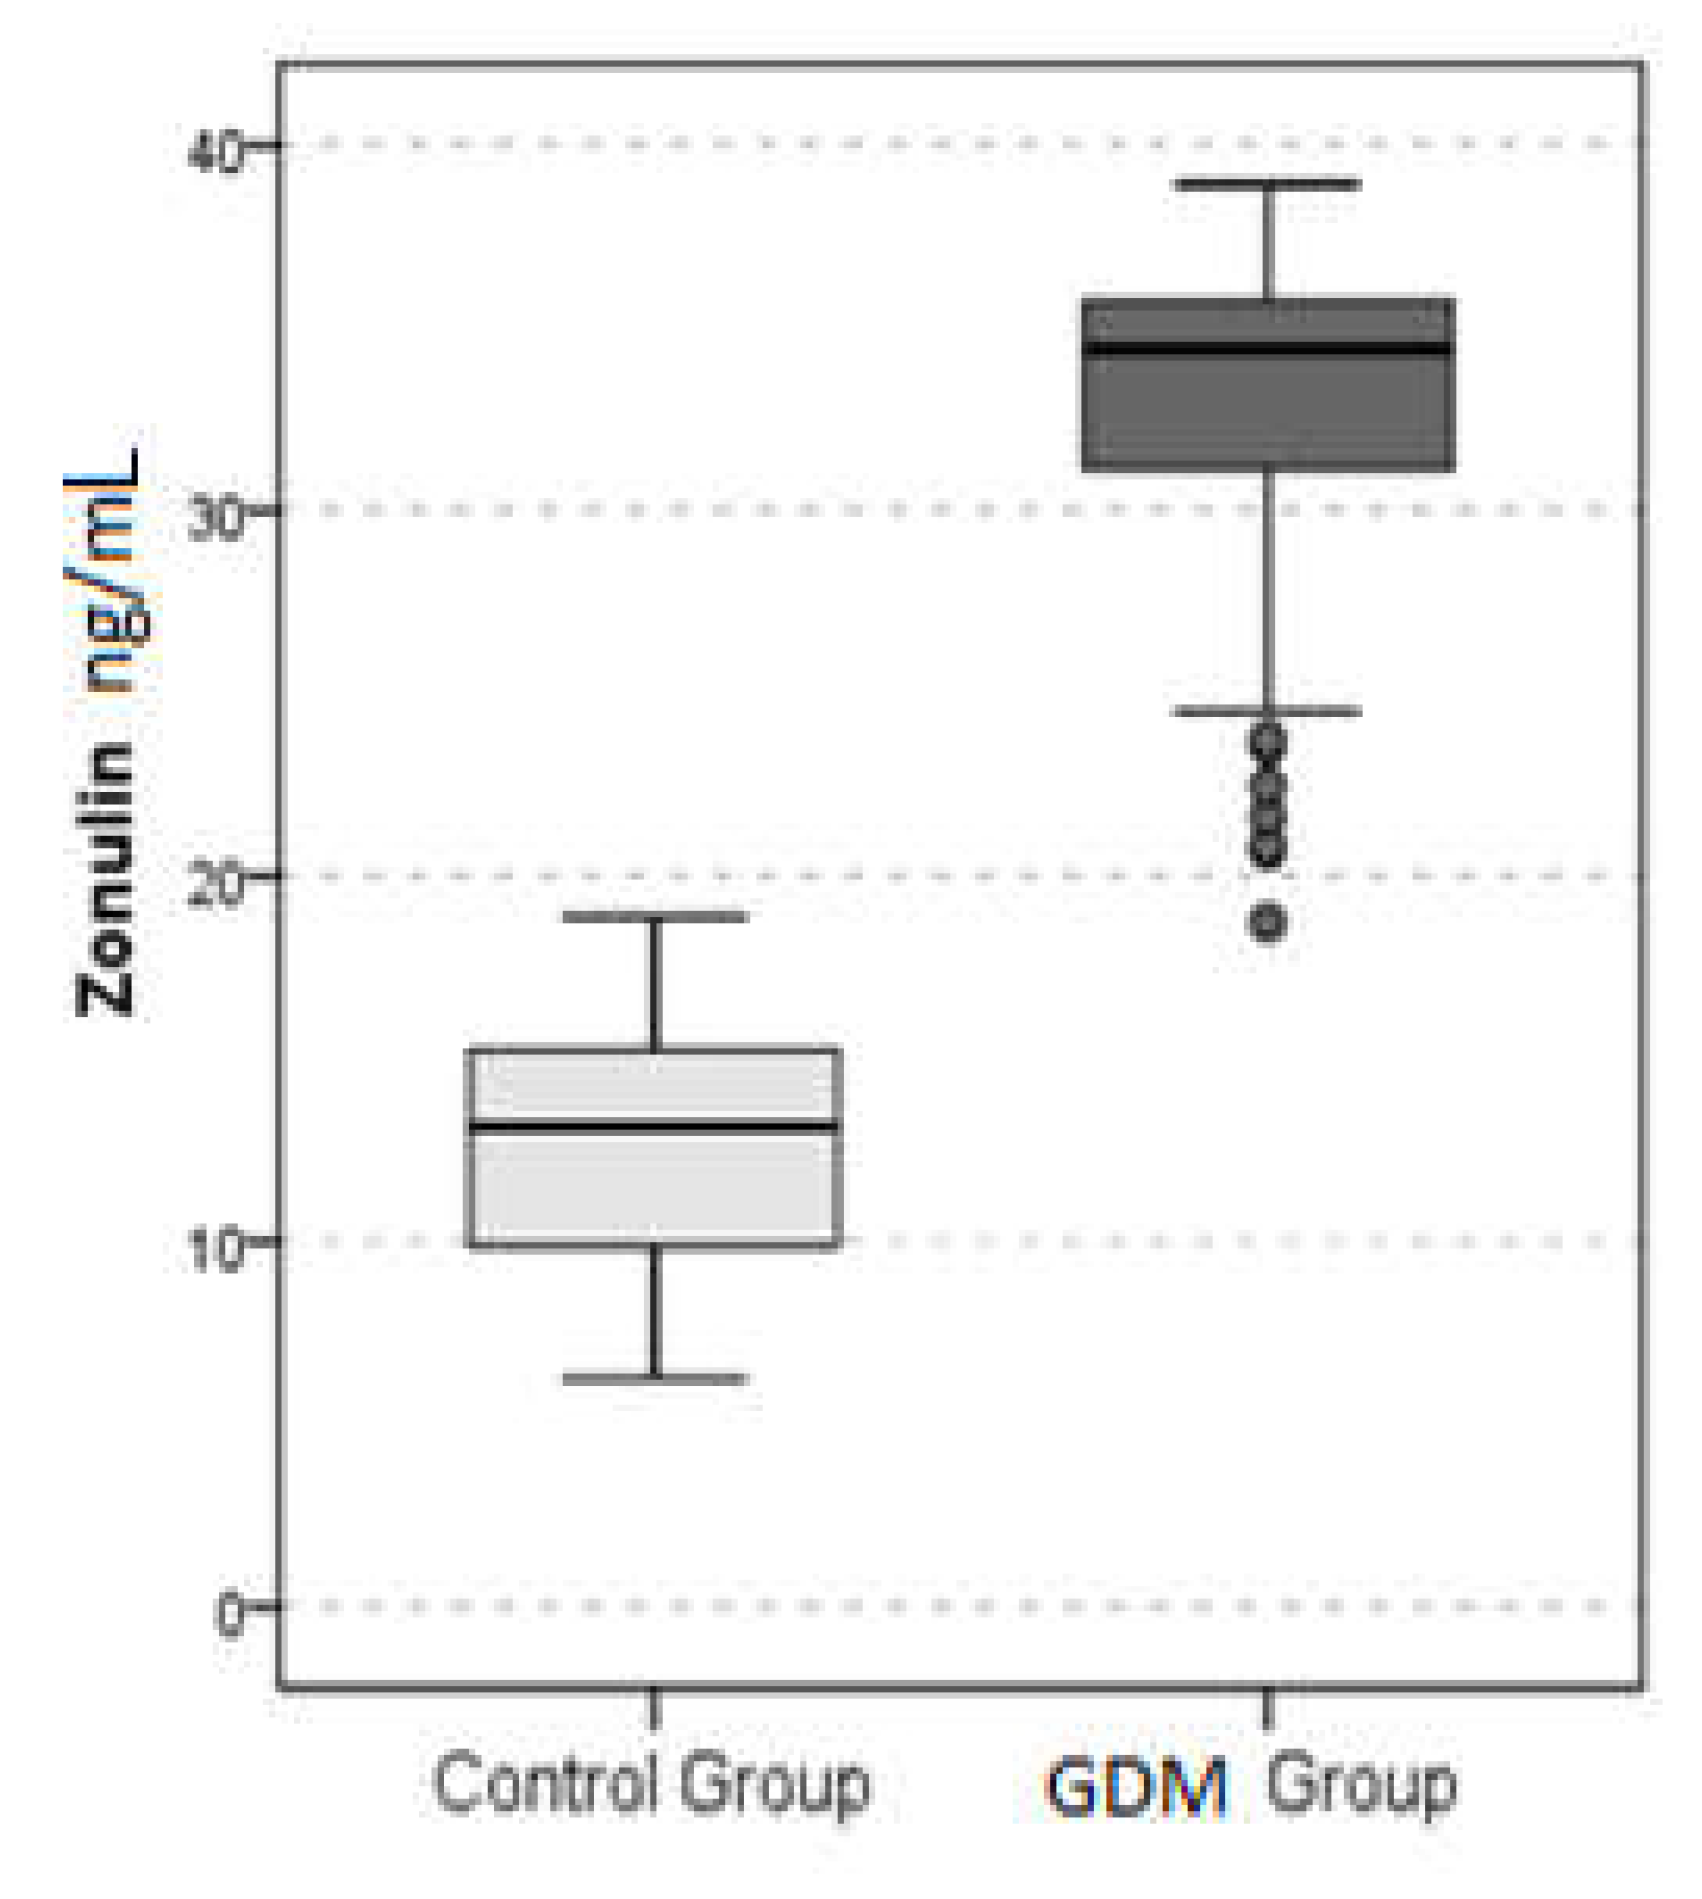
| Zonulin, ng/mL | 12.8 | ± | 3.3 | 32.6 | ± | 4.8 | 34.4 | 0.000 |
| OGTT 0, mg/dL | 81.2 | ± | 5.7 | 94.0 | ± | 11.5 | 92.0 | 0.000 |
| OGGT 1, mg/dL | 128.2 | ± | 24.3 | 173.5 | ± | 33.9 | 175.0 | 0.000 |
| OGGT 2, mg/dL | 107.3 | ± | 19.7 | 144.3 | ± | 31.0 | 144.0 | 0.000 |
| Age | BMI | Pregnancy Number | Glucose | Urea | ||
|---|---|---|---|---|---|---|
| Zonulin | r | 0.041 | 0.199 | 0.361 | −0.064 | |
| p | 0.633 | 0.019 | 0.463 | 0.000 | 0.455 | |
| Creatinin | AST | ALT | LDL | HDL | ||
| Zonulin | r | 0.247 | 0.020 | 0.197 | 0.039 | −0.173 |
| p | 0.003 | 0.815 | 0.020 | 0.646 | 0.041 | |
| TG | T.Cholesterol | Uric Acid | GGT | Hg | ||
| Zonulin | r | 0.140 | 0.028 | 0.150 | 0.096 | −0.031 |
| p | 0.100 | 0.746 | 0.078 | 0.259 | 0.719 | |
| WBC | Platelets | MPV | Sodium | Potassium | ||
| Zonulin | r | 0.102 | 0.018 | 0.040 | 0.014 | 0.126 |
| p | 0.233 | 0.830 | 0.639 | 0.871 | 0.138 | |
| HbA1c | HOMA-IR | OGTT 0 | OGGT 1 | OGGT 2 | ||
| Zonulin | r | 0.129 | 0.221 | 0.621 | 0.568 | 0.581 |
| p | 0.131 | 0.009 | 0.000 | 0.000 | 0.000 | |
© 2019 by the authors. Licensee MDPI, Basel, Switzerland. This article is an open access article distributed under the terms and conditions of the Creative Commons Attribution (CC BY) license (http://creativecommons.org/licenses/by/4.0/).
Share and Cite
Demir, E.; Ozkan, H.; Seckin, K.D.; Sahtiyancı, B.; Demir, B.; Tabak, O.; Kumbasar, A.; Uzun, H. Plasma Zonulin Levels as a Non-Invasive Biomarker of Intestinal Permeability in Women with Gestational Diabetes Mellitus. Biomolecules 2019, 9, 24. https://doi.org/10.3390/biom9010024
Demir E, Ozkan H, Seckin KD, Sahtiyancı B, Demir B, Tabak O, Kumbasar A, Uzun H. Plasma Zonulin Levels as a Non-Invasive Biomarker of Intestinal Permeability in Women with Gestational Diabetes Mellitus. Biomolecules. 2019; 9(1):24. https://doi.org/10.3390/biom9010024
Chicago/Turabian StyleDemir, Esra, Hanise Ozkan, Kerem Doga Seckin, Berrak Sahtiyancı, Bulent Demir, Omur Tabak, Abdülbaki Kumbasar, and Hafize Uzun. 2019. "Plasma Zonulin Levels as a Non-Invasive Biomarker of Intestinal Permeability in Women with Gestational Diabetes Mellitus" Biomolecules 9, no. 1: 24. https://doi.org/10.3390/biom9010024