Conformational Ensembles of an Intrinsically Disordered Protein pKID with and without a KIX Domain in Explicit Solvent Investigated by All-Atom Multicanonical Molecular Dynamics

Abstract
:1. Introduction
2. Experimental Section
2.1. Setting Simulation Systems (pKID and pKID–KIX Systems)
 and
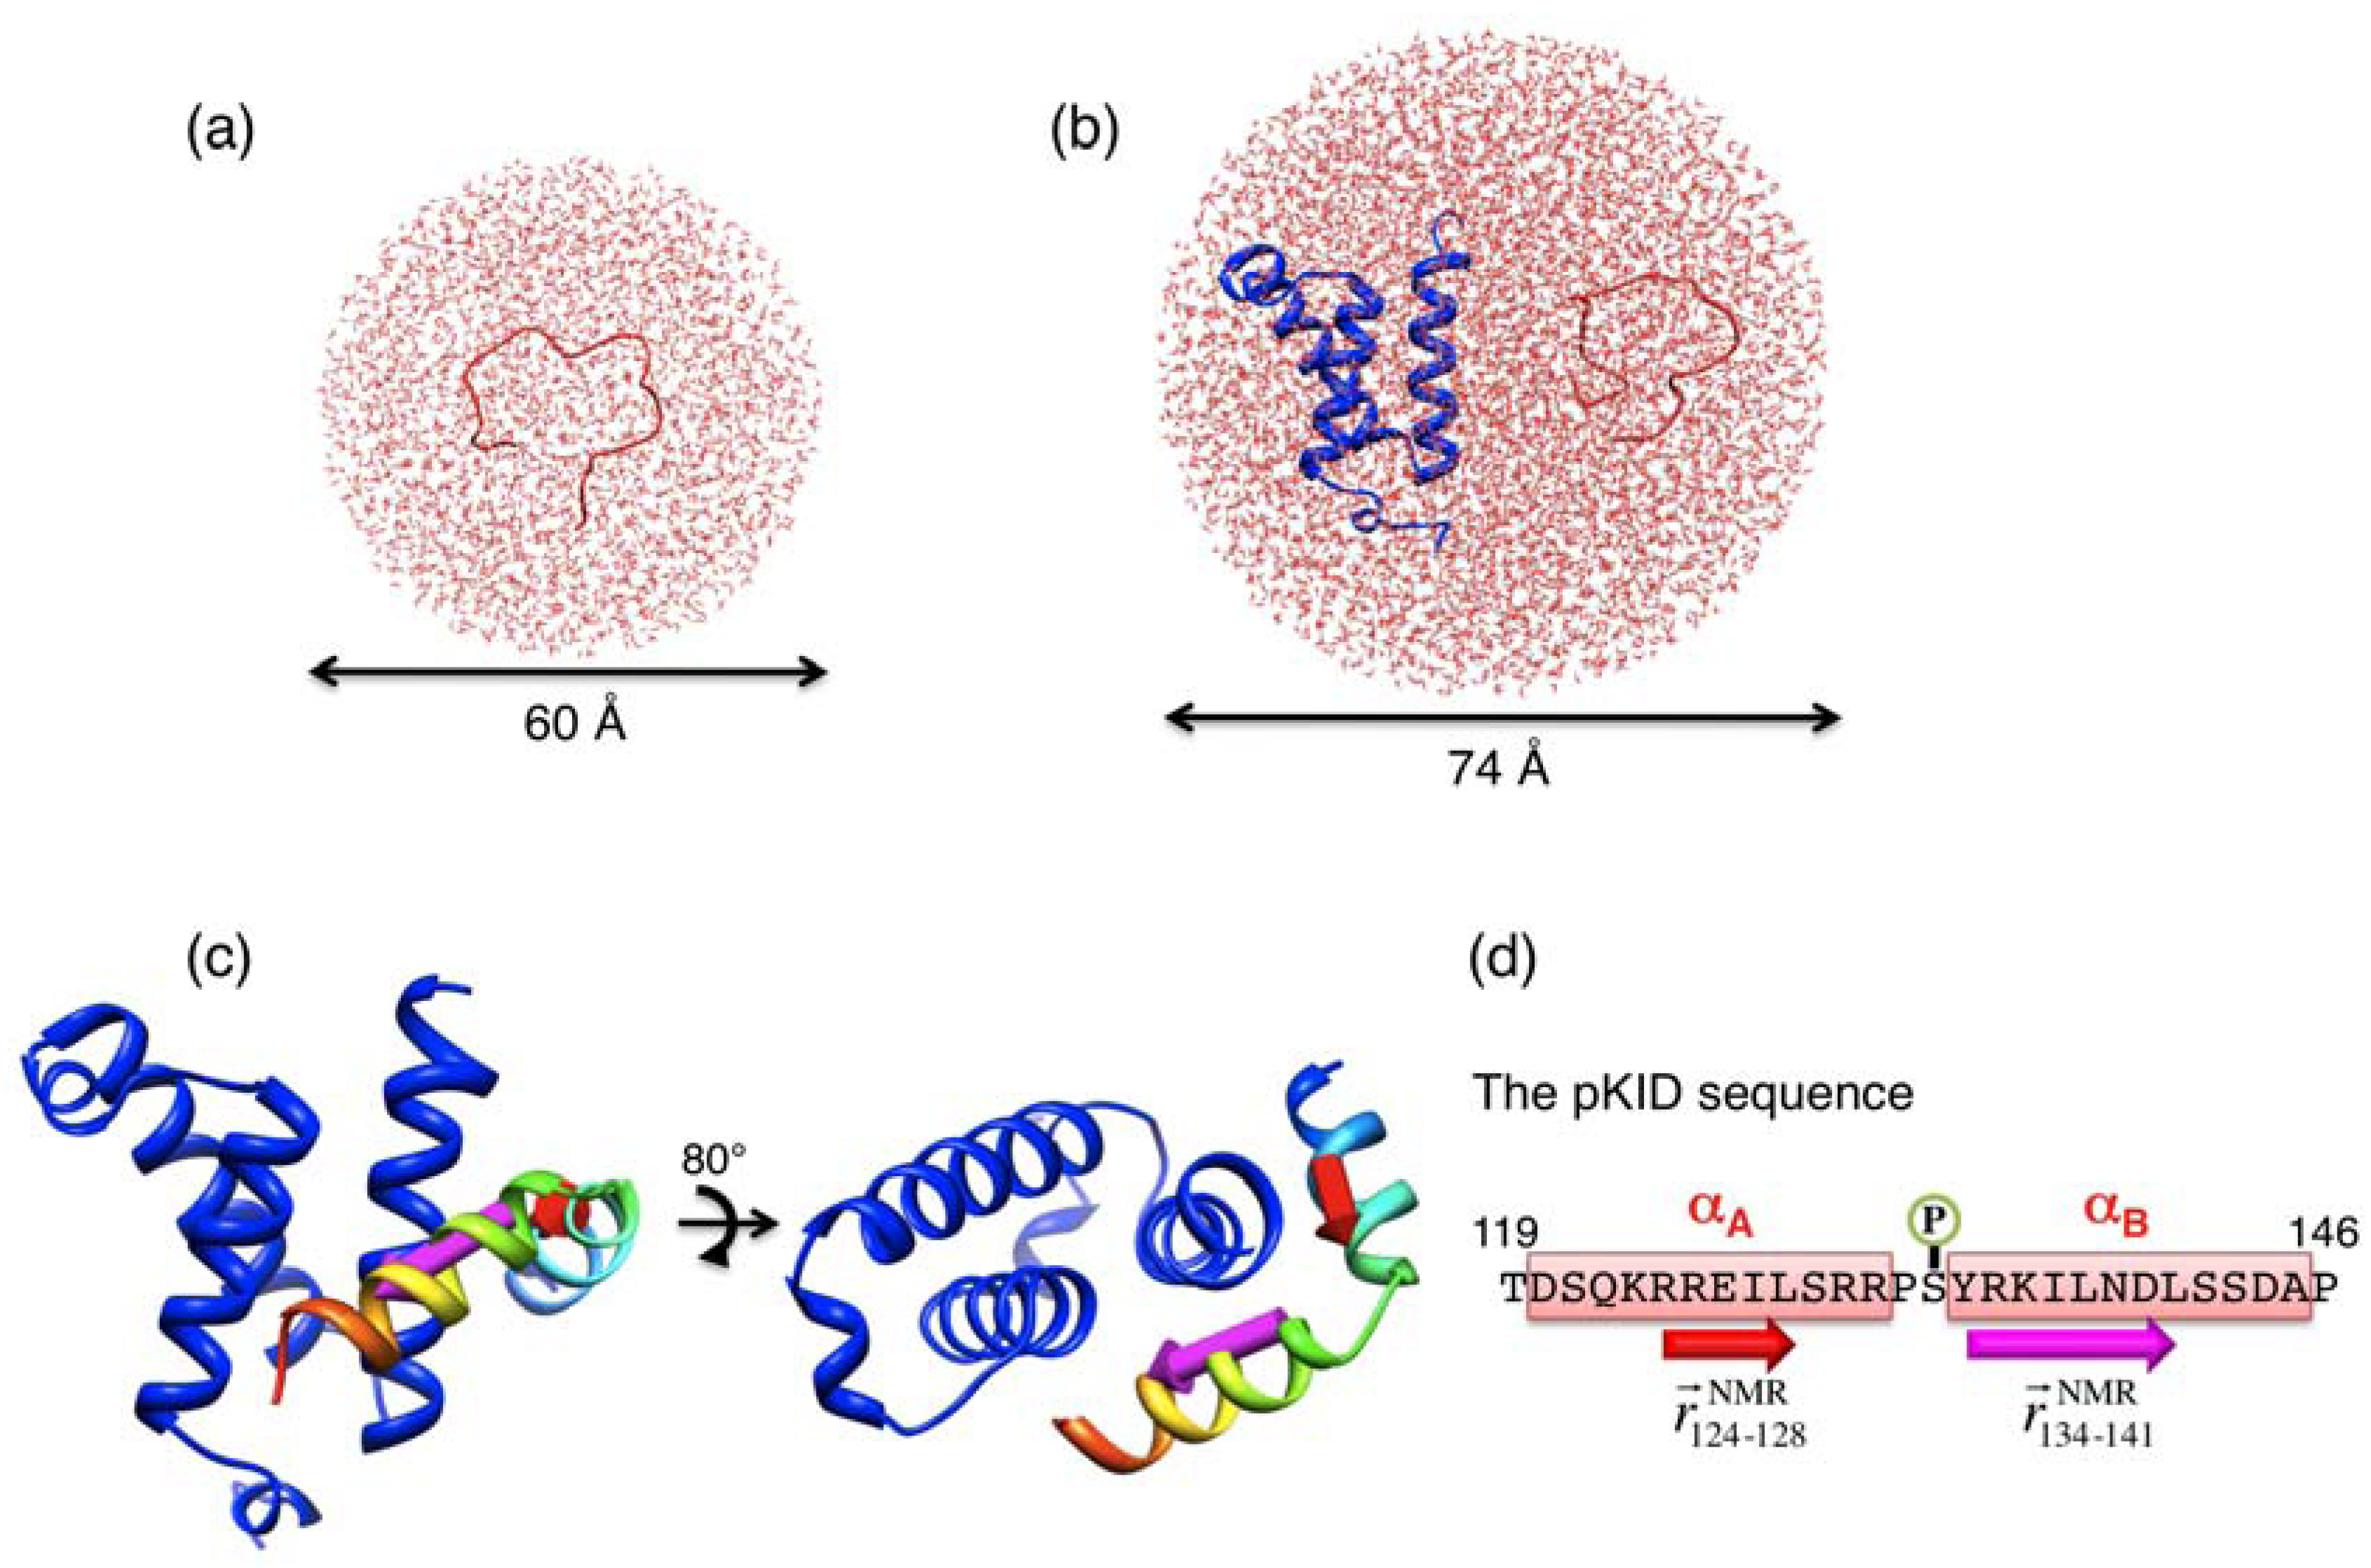
and  , respectively, which are defined in Section 3.2. (d) pKID sequence, where αA and αB residues are highlighted and character P in the circle represents the phosphate group. Arrows below the sequence indicate the starting and ending residues to define the vectors and . The structure images were created using Chimera viewer software [39].
and , respectively, which are defined in Section 3.2. (d) pKID sequence, where αA and αB residues are highlighted and character P in the circle represents the phosphate group. Arrows below the sequence indicate the starting and ending residues to define the vectors and . The structure images were created using Chimera viewer software [39].
, respectively, which are defined in Section 3.2. (d) pKID sequence, where αA and αB residues are highlighted and character P in the circle represents the phosphate group. Arrows below the sequence indicate the starting and ending residues to define the vectors and . The structure images were created using Chimera viewer software [39].
and , respectively, which are defined in Section 3.2. (d) pKID sequence, where αA and αB residues are highlighted and character P in the circle represents the phosphate group. Arrows below the sequence indicate the starting and ending residues to define the vectors and . The structure images were created using Chimera viewer software [39].
2.2. Trivial Trajectory Parallelization of Multicanonical Molecular Dynamics (TTP-McMD)


 .
.3. Results and Discussion
3.1. The Conformational Ensemble in the pKID System (Unbound State)


3.2. Free Energy Landscape and Orientation of αA in the pKID–KIX System
 and
and  , where
  and
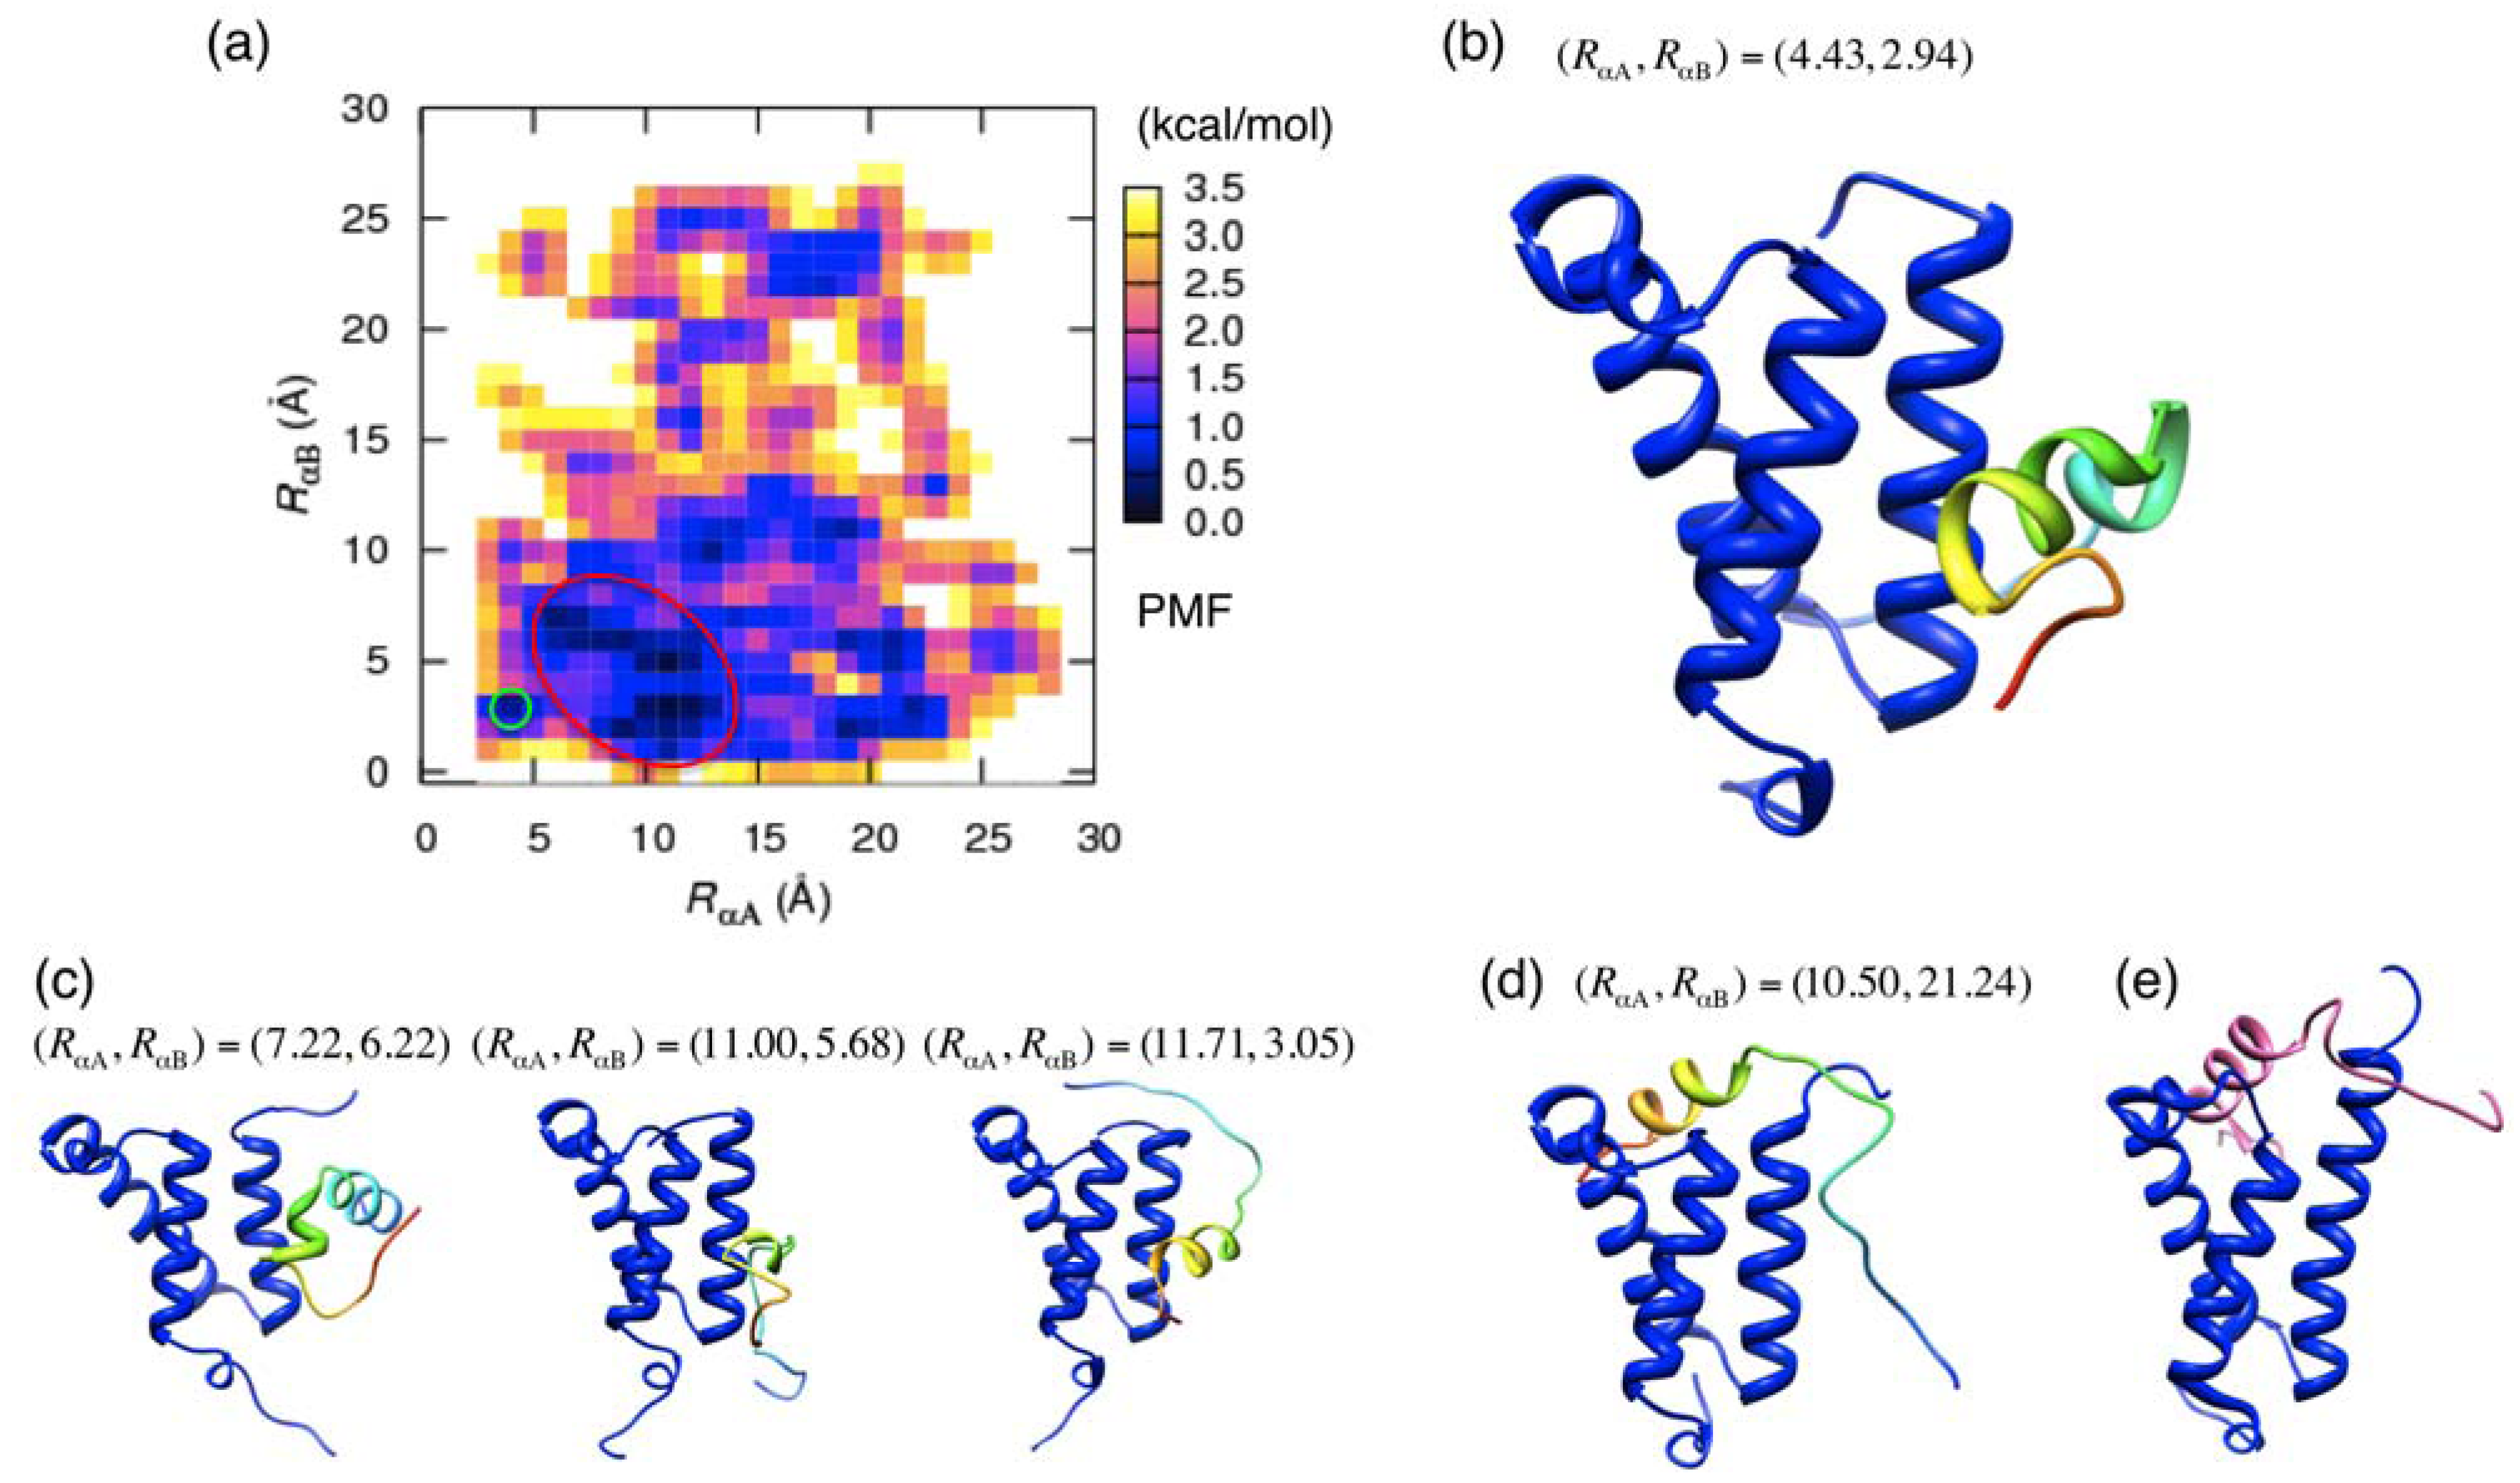
and  respectively represent the position vectors of the centroids of the αA and αB regions in a sampled conformation, and
  and
and  those in the reference structure (i.e., the NMR model), respectively. Using these distances as the reaction coordinates, we calculated the potential of mean force (PMF) as

 and
and  respectively represent the unit vectors of vectors
  and
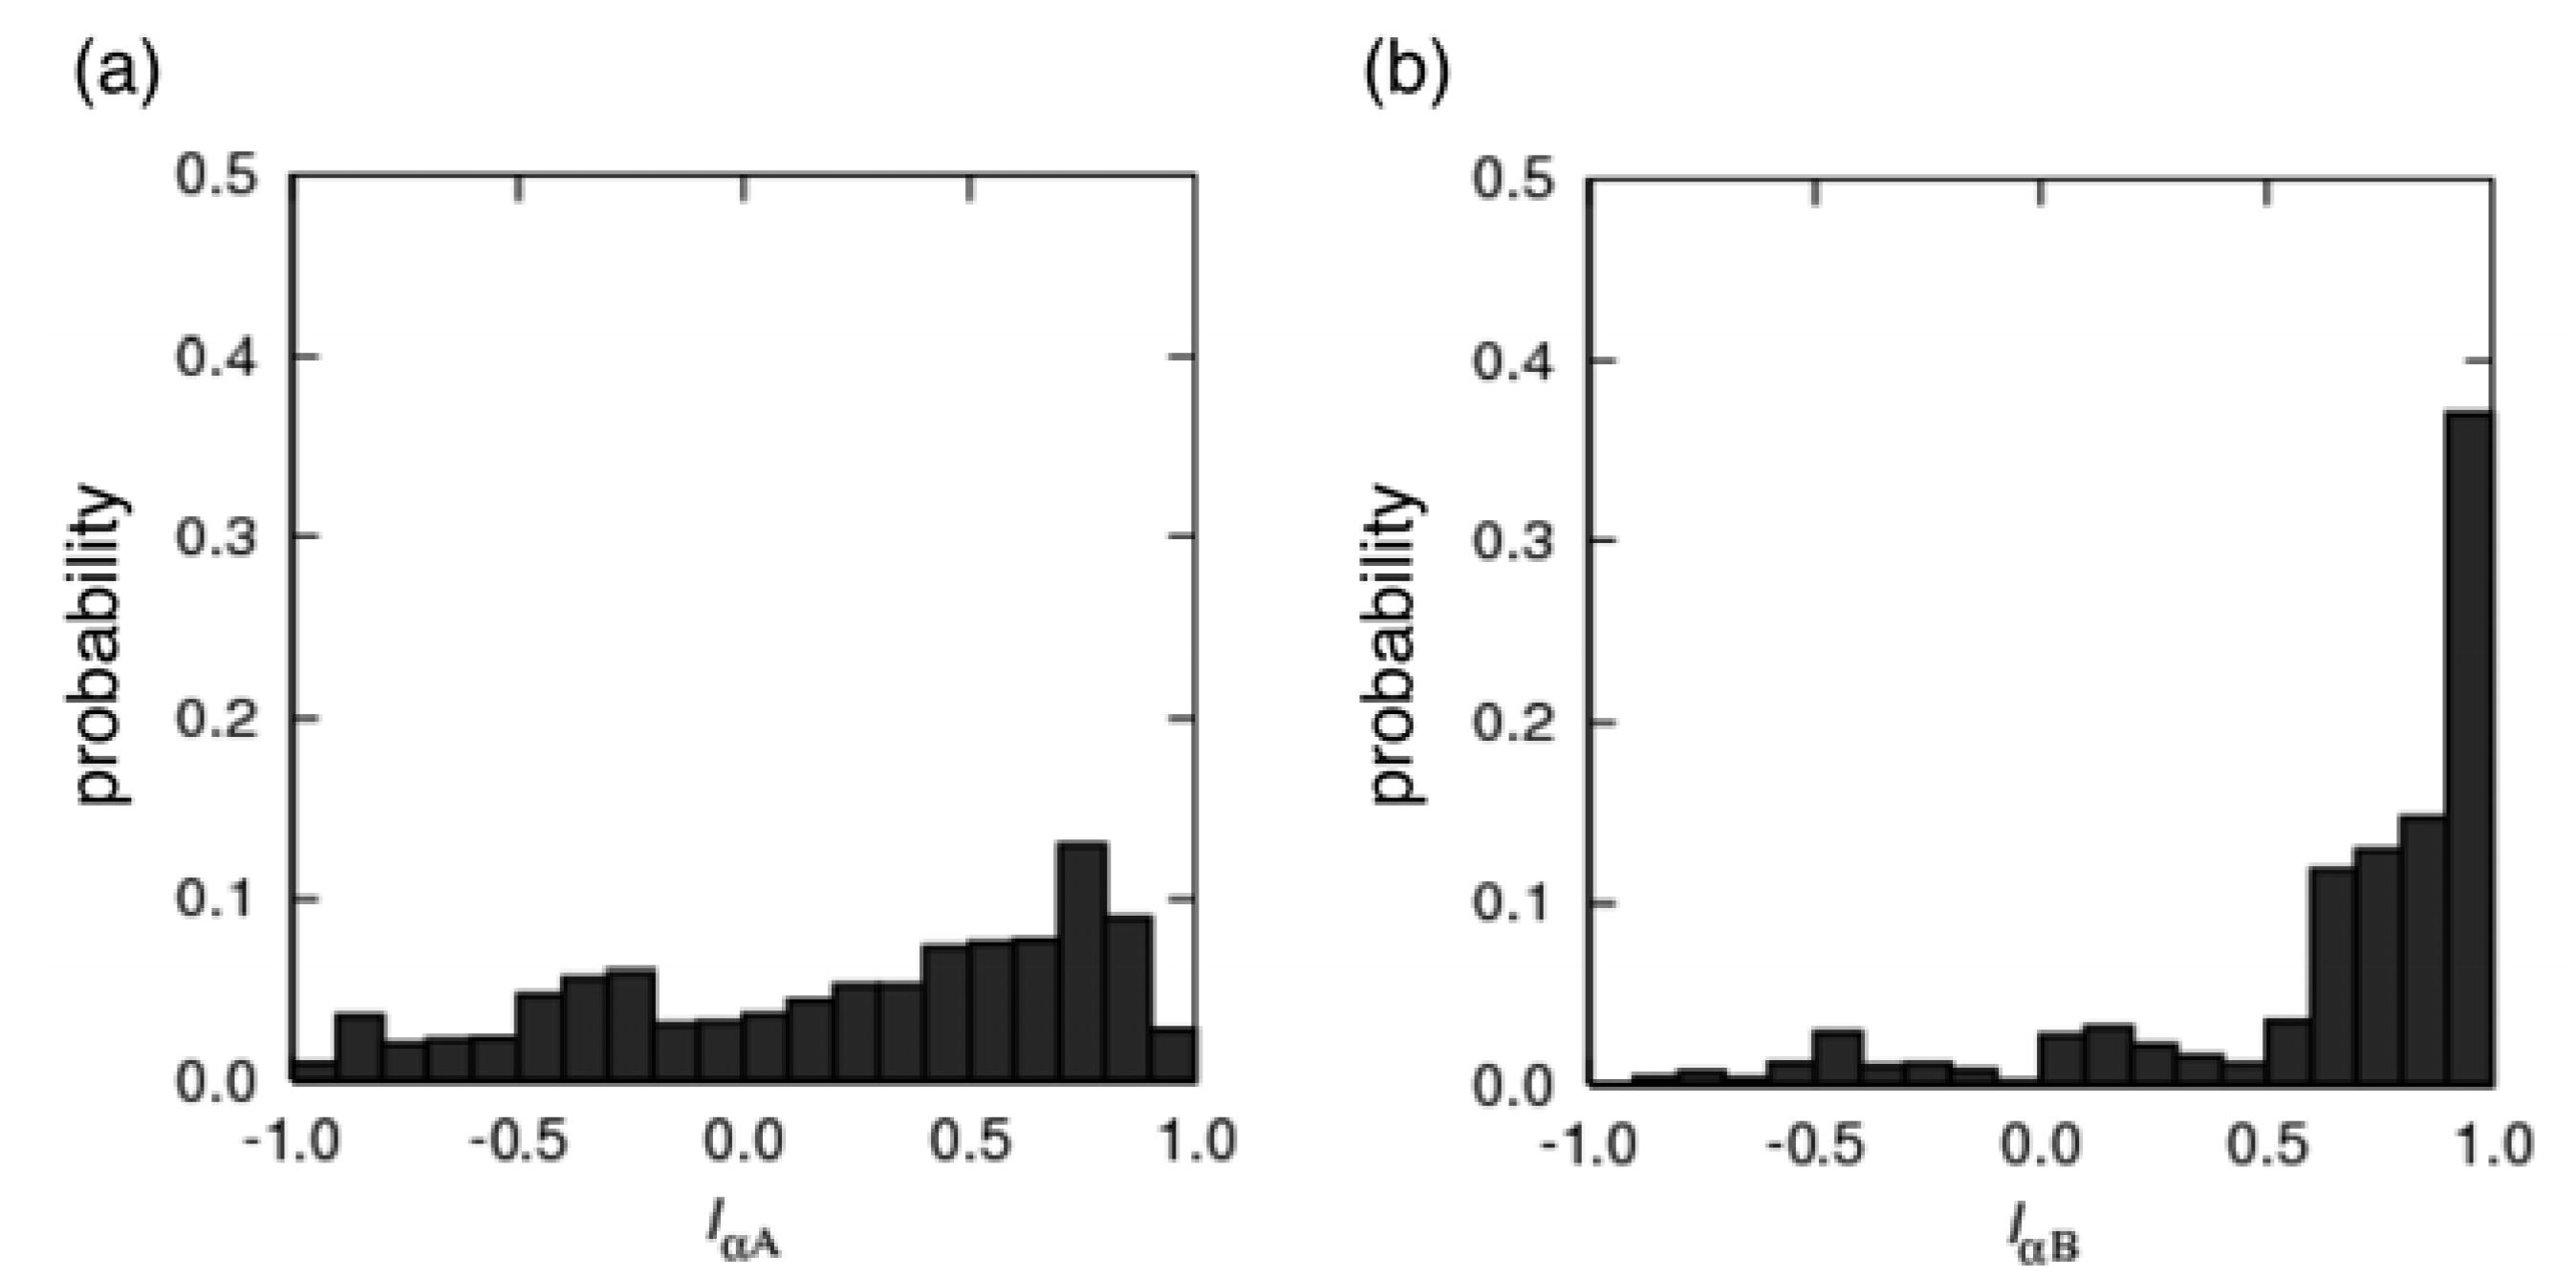
and  : see Figure 1(c). The vector is pointing from the Cα-atomic position of the 124th residue to that of the 128th residue in a sampled conformation. The vector is defined in the same way for the NMR structure. For the orientation of αB residues, IαB was defined as
 and
and  were calculated similarly as and by replacing the residue numbers 124–134 and 128–141. When the inner products IαA and IαB are 1, the orientations are aligned as in the native bound form.
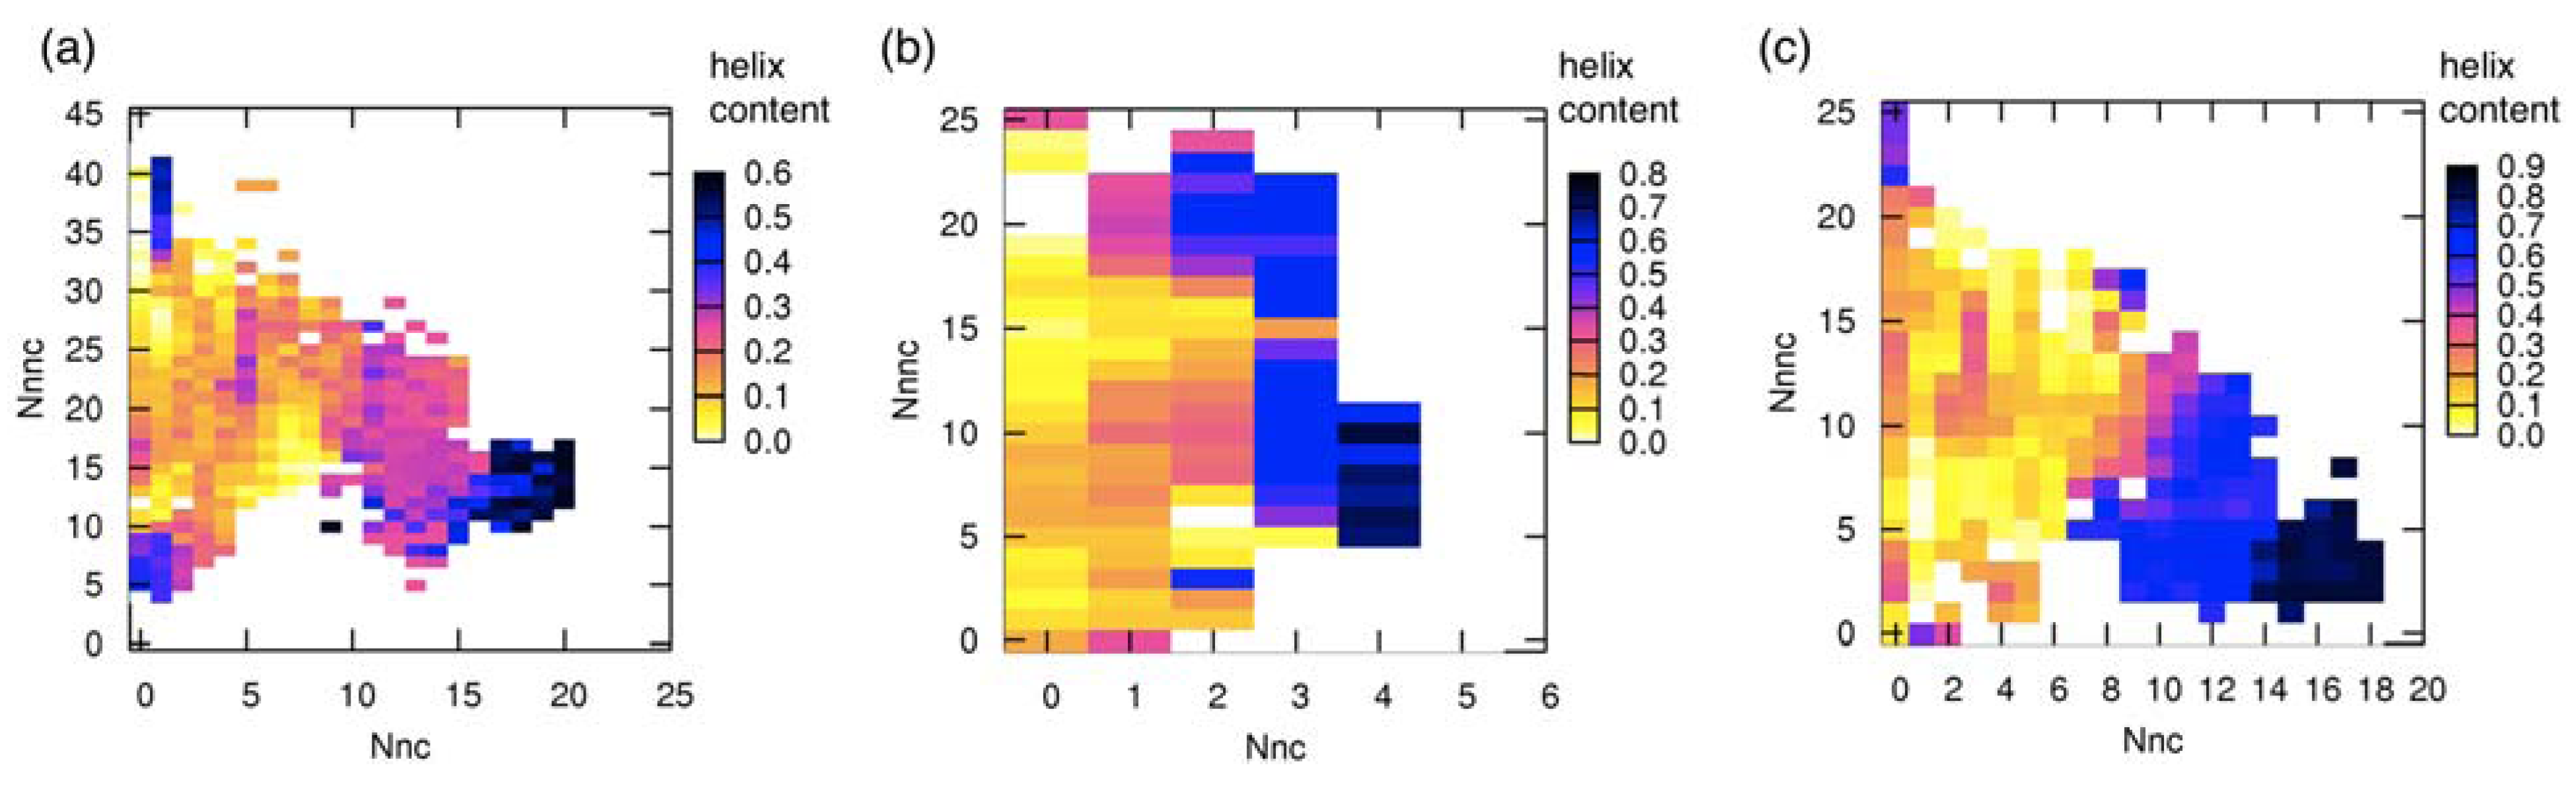
3.3. Correlation between Intermolecular Residue Contacts and Folding of pKID
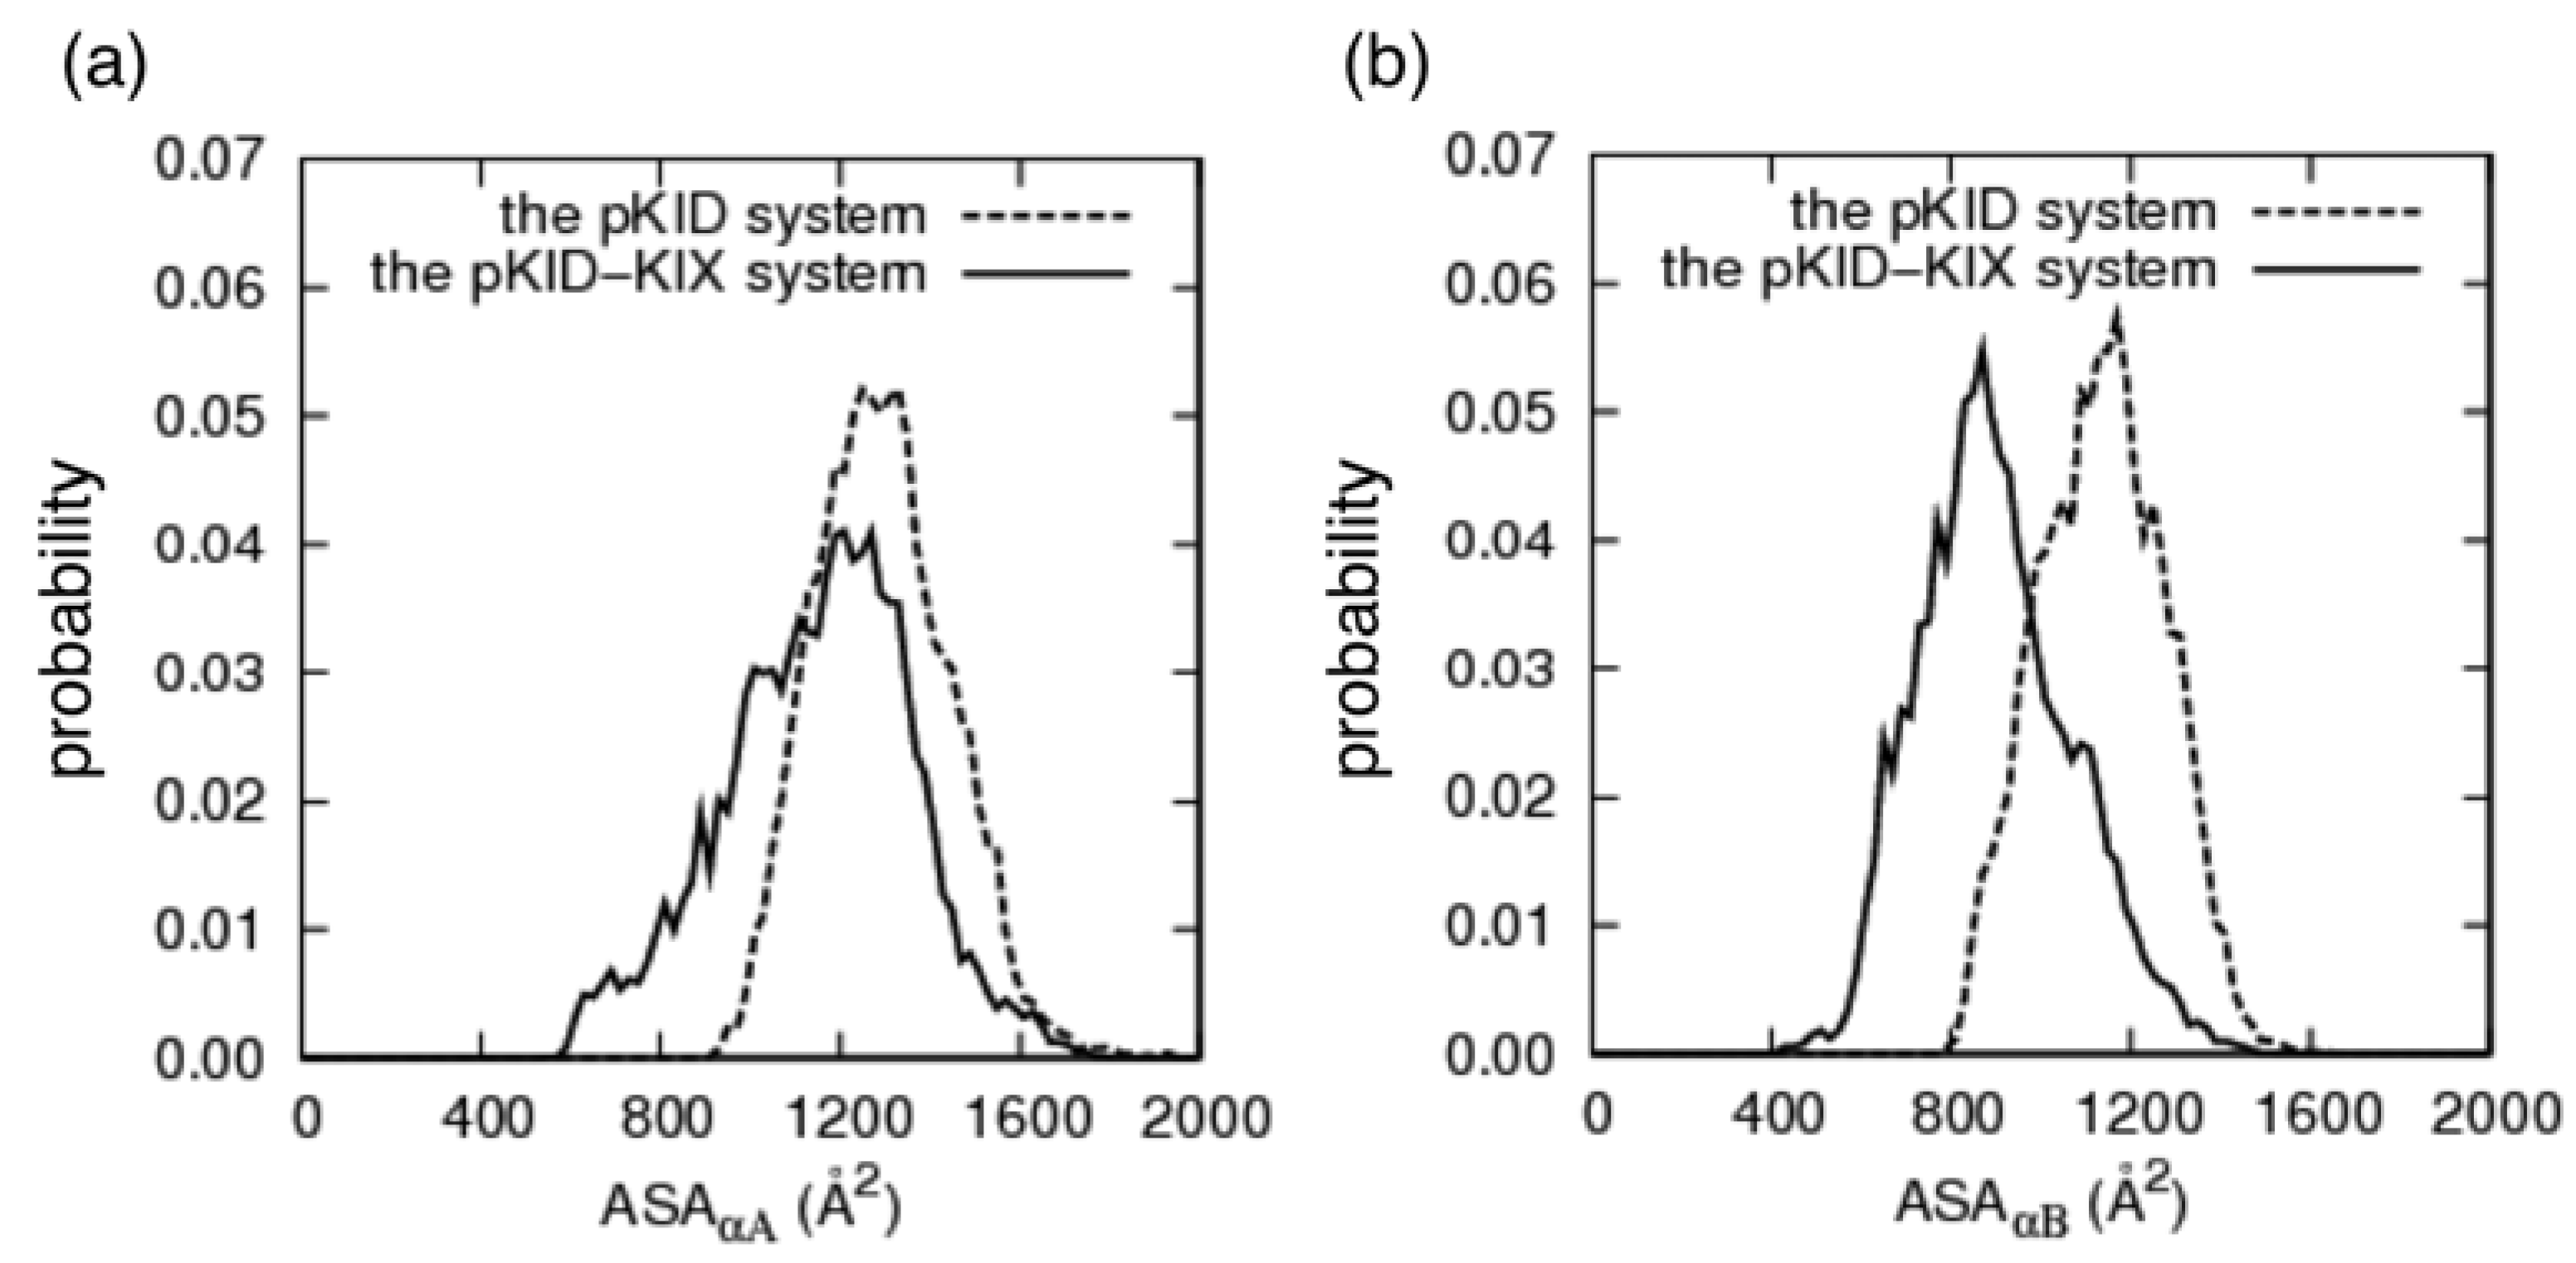
3.4. Change of Accessible Surface Area on Binding

 where
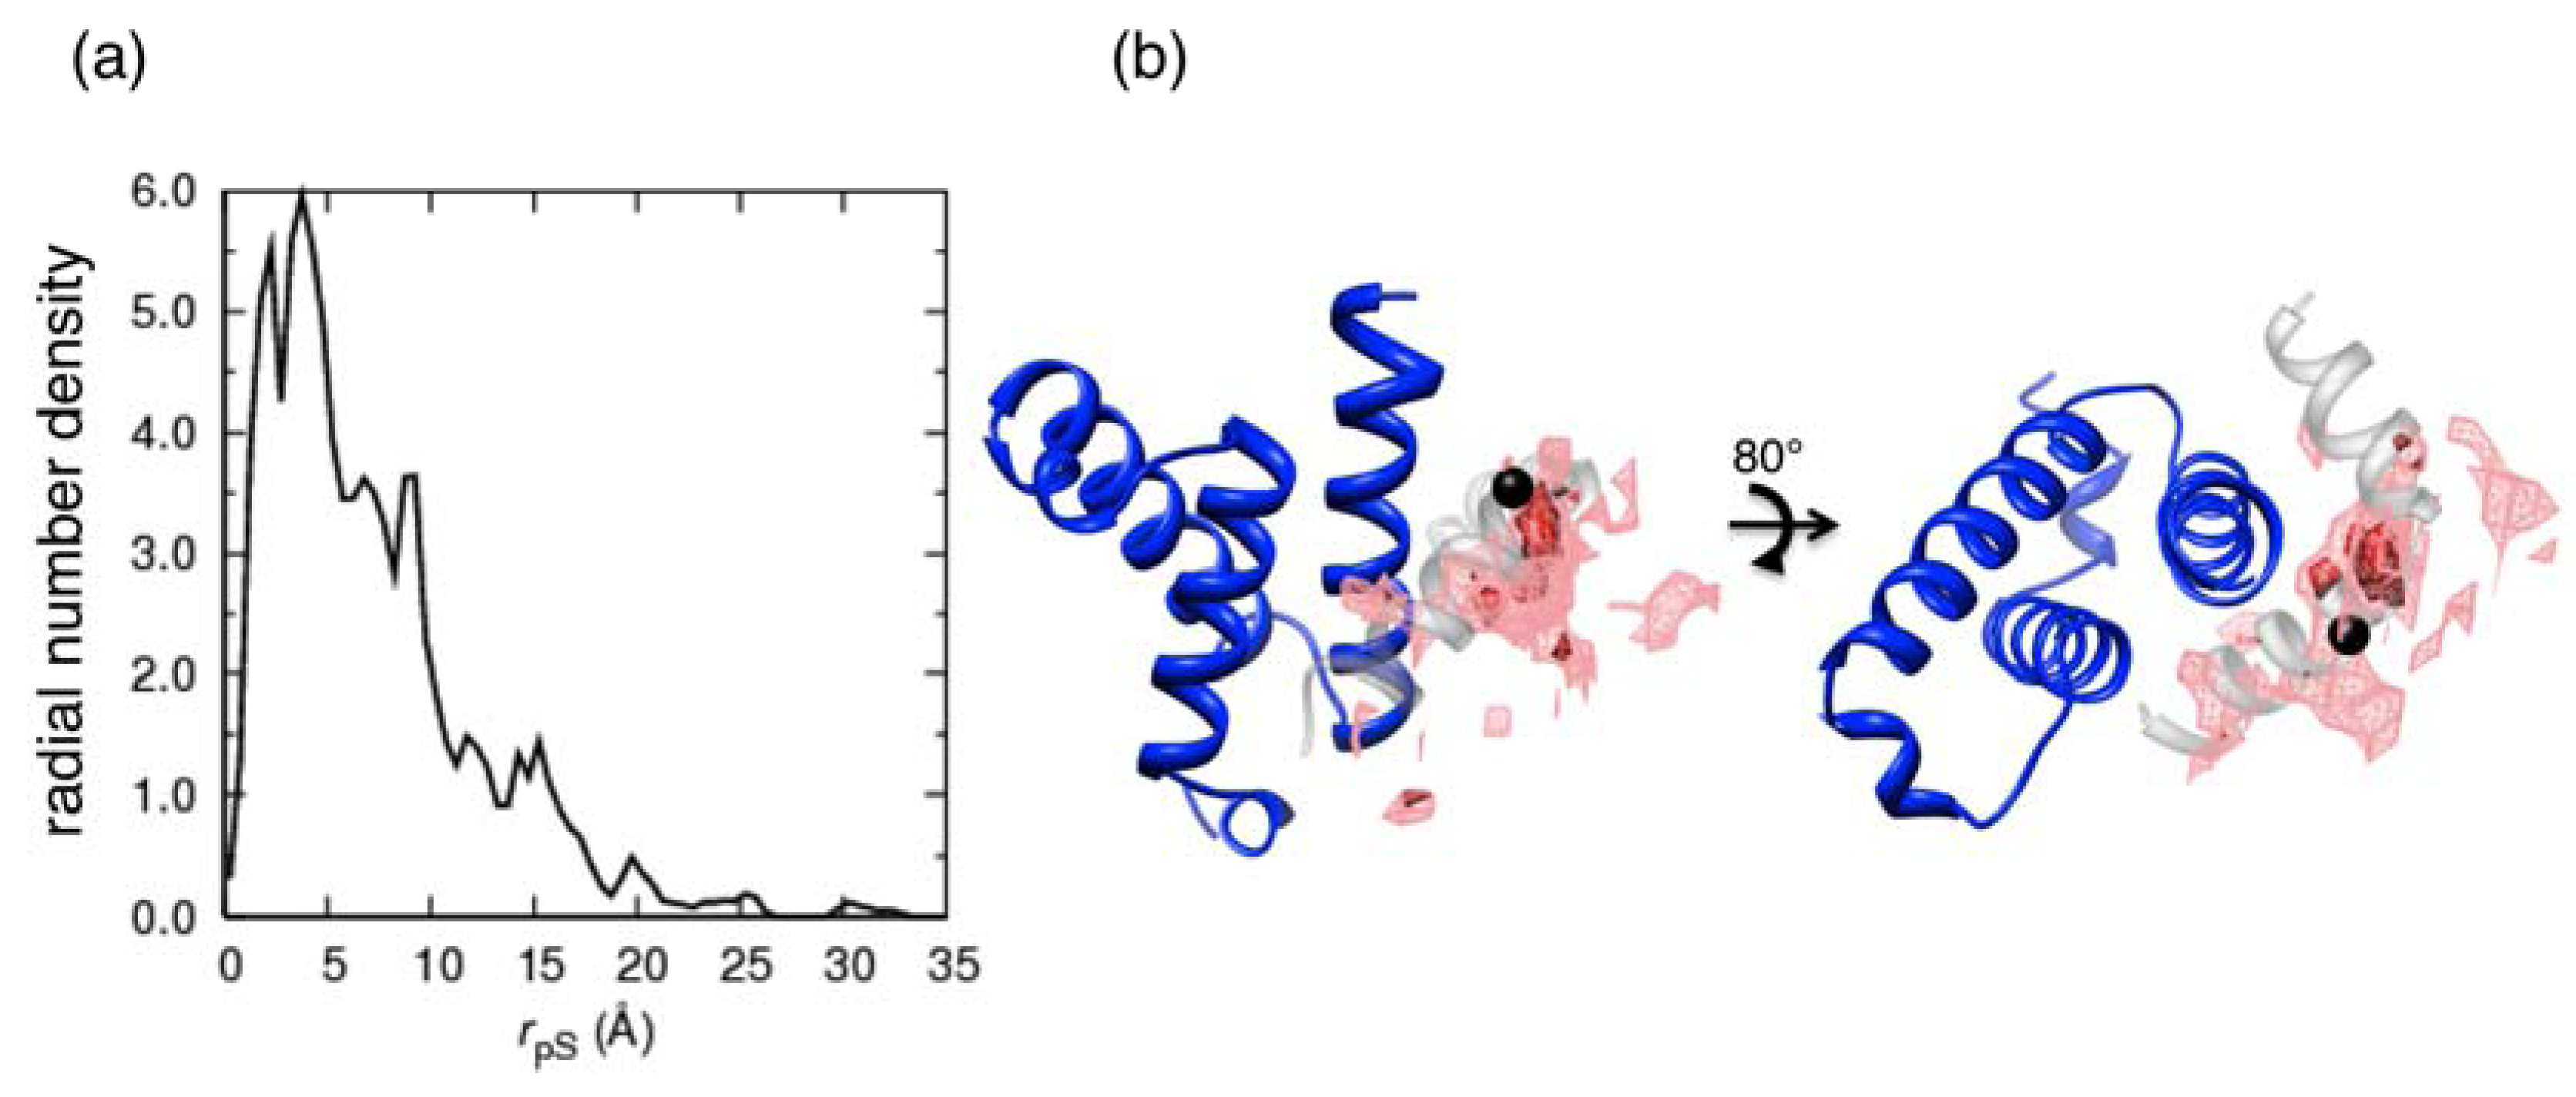
where  denotes the Cα-atom position of pS133 in the sampled snapshots and
  one in the reference structure (NMR model 1). (b) Spatial distribution of the Cα-atomic position of pS133, where red and magenta contours respectively represent the iso-density regions with density larger than 0.0032 Å–3 and 0.0001 Å–3. The black sphere is the position in the NMR Model 1.
where denotes the Cα-atom position of pS133 in the sampled snapshots and one in the reference structure (NMR model 1). (b) Spatial distribution of the Cα-atomic position of pS133, where red and magenta contours respectively represent the iso-density regions with density larger than 0.0032 Å–3 and 0.0001 Å–3. The black sphere is the position in the NMR Model 1.
one in the reference structure (NMR model 1). (b) Spatial distribution of the Cα-atomic position of pS133, where red and magenta contours respectively represent the iso-density regions with density larger than 0.0032 Å–3 and 0.0001 Å–3. The black sphere is the position in the NMR Model 1.
where denotes the Cα-atom position of pS133 in the sampled snapshots and one in the reference structure (NMR model 1). (b) Spatial distribution of the Cα-atomic position of pS133, where red and magenta contours respectively represent the iso-density regions with density larger than 0.0032 Å–3 and 0.0001 Å–3. The black sphere is the position in the NMR Model 1.
4. Conclusions
Acknowledgments
References
- Dyson, H.J.; Wright, P.E. Coupling of folding and binding for unstructured proteins. Curr. Opin. Struct. Biol. 2002, 12, 54–60. [Google Scholar] [CrossRef]
- Nishikawa, K. Natively unfolded proteins: An overview. Biophysics 2009, 5, 53–58. [Google Scholar] [CrossRef]
- Dunker, A.K.; Brown, C.J.; Lawson, J.D.; Iakoucheva, L.M.; Obradović, Z. Intrinsic disorder and protein function. Biochemistry 2002, 41, 6573–6582. [Google Scholar]
- Uversky, V.N.; Oldfield, C.J.; Dunker, A.K. Intrinsically disordered proteins in human diseases: Introducing the d2 concept. Annu. Rev. Biophys. 2008, 37, 215–246. [Google Scholar] [CrossRef]
- Dunker, A.K.; Uversky, V.N. Drugs for ‘protein clouds’: Targeting intrinsically disordered transcription factors. Curr. Opin. Pharmacol. 2010, 10, 782–788. [Google Scholar] [CrossRef]
- Metallo, S.J. Intrinsically disordered proteins are potential drug targets. Curr. Opin. Chem. Biol. 2010, 14, 481–488. [Google Scholar] [CrossRef]
- Uversky, V.N.; Oldfield, C.J.; Dunker, A.K. Showing your id: Intrinsic disorder as an id for recognition, regulation and cell signaling. J. Mol. Recognit. 2005, 18, 343–384. [Google Scholar] [CrossRef]
- Pontius, B.W. Close encounters: Why unstructured, polymeric domains can increase rates of specific macromolecular association. Trends Biochem. Sci. 1993, 18, 181–186. [Google Scholar]
- Shoemaker, B.A.; Portman, J.J.; Wolynes, P.G. Speeding molecular recognition by using the folding funnel: The fly-casting mechanism. Proc. Natl. Acad. Sci. USA 2000, 97, 8868–8873. [Google Scholar]
- Levy, Y.; Onuchic, J.N.; Wolynes, P.G. Fly-casting in protein-DNA binding: Frustration between protein folding and electrostatics facilitates target recognition. J. Am. Chem. Soc. 2007, 129, 738–739. [Google Scholar]
- Turjanski, A.G.; Gutkind, J.S.; Best, R.B.; Hummer, G. Binding-induced folding of a natively unstructured transcription factor. PLoSComput. Biol. 2008, 4. [Google Scholar]
- Huang, Y.; Liu, Z. Kinetic advantage of intrinsically disordered proteins in coupled folding-binding process: A critical assessment of the “Fly-casting” Mechanism. J. Mol. Biol. 2009, 393, 1143–1159. [Google Scholar] [CrossRef]
- Huang, Y.; Liu, Z. Nonnative interactions in coupled folding and binding processes of intrinsically disordered proteins. PLoSOne 2010, 5. [Google Scholar]
- Ganguly, D.; Chen, J. Topology-based modeling of intrinsically disordered proteins: Balancing intrinsic folding and intermolecular interactions. Proteins 2011, 79, 1251–1266. [Google Scholar] [CrossRef]
- Huang, Y.; Liu, Z. Smoothing molecular interactions: The “kinetic buffer” effect of intrinsically disordered proteins. Proteins 2010, 78, 3251–3259. [Google Scholar] [CrossRef]
- Oliveberg, M.; Wolynes, P.G. The experimental survey of protein-folding energy landscapes. Q. Rev. Biophys. 2005, 38, 245–288. [Google Scholar] [CrossRef]
- Nakajima, N.; Nakamura, H.; Kidera, A. Multicanonical ensemble generated by molecular dynamicssimulation for enhanced conformational sampling of peptides. J. Phys. Chem. B 1997, 101, 817–824. [Google Scholar] [CrossRef]
- Hansmann, U.H.E.; Okamoto, Y.; Eisenmenger, F. Molecular dynamics, Langevin and hybrid Monte Carlo simulations in a multicanonical ensemble. Chem. Phys. Lett. 1996, 259, 321–330. [Google Scholar] [CrossRef]
- Higo, J.; Kamiya, N.; Sugihara, T.; Yonezawa, Y.; Nakamura, H. Verifying trivial parallelization of multicanonical molecular dynamics for conformational sampling of a polypeptide in explicit water. Chem. Phys. Lett. 2009, 473, 326–329. [Google Scholar] [CrossRef]
- Ikebe, J.; Umezawa, K.; Kamiya, N.; Sugihara, T.; Yonezawa, Y.; Takano, Y.; Nakamura, H.; Higo, J. Theory for trivial trajectory parallelization of multicanonical molecular dynamics and application to a polypeptide in water. J. Comput. Chem. 2011, 32, 1286–1297. [Google Scholar] [CrossRef]
- Ikebe, J.; Standley, D.M.; Nakamura, H.; Higo, J. Ab initio simulation of a 57-residue protein in explicit solvent reproduces the native conformation in the lowest free-energy cluster. Protein Sci. 2011, 20, 187–196. [Google Scholar] [CrossRef]
- Higo, J.; Nishimura, Y.; Nakamura, H. A free-energy landscape for coupled folding and binding of an intrinsically disordered protein in explicit solvent from detailed all-atom computations. J. Am. Chem. Soc. 2011, 133, 10448–10458. [Google Scholar] [CrossRef]
- Mayr, B.; Montminy, M. Transcriptional regulation by the phosphorylation-dependent factor CREB. Nat. Rev. Mol. Cell Biol. 2001, 2, 599–609. [Google Scholar] [CrossRef]
- Karamouzis, M.V.; Konstantinopoulos, P.A.; Papavassiliou, A.G. Roles of CREB-binding protein (CBP)/p300 in respiratory epithelium tumorigenesis. Cell Res. 2007, 17, 324–332. [Google Scholar] [CrossRef]
- Zor, T.; Mayr, B.M.; Dyson, H.J.; Montminy, M.R.; Wright, P.E. Roles of phosphorylation and helix propensity in the binding of the kix domain of CREB-binding protein by constitutive (c-myb) and inducible (CREB) activators. J. Biol. Chem. 2002, 277, 42241–42248. [Google Scholar]
- Johannessen, M.; Delghandi, M.P.; Moens, U. What turns CREB on? Cell Signal. 2004, 16, 1211–1227. [Google Scholar] [CrossRef]
- Radhakrishnan, I.; PÈrez-Alvarado, G.C.; Parker, D.; Dyson, H.J.; Montminy, M.R.; Wright, P.E. Solution structure of the KIX domain of CBP bound to the transactivation domain of CREB: A model for activator: Coactivator interactions. Cell 1997, 91, 741–752. [Google Scholar]
- Wright, P.E.; Dyson, H.J. Linking folding and binding. Curr. Opin. Struct. Biol. 2009, 19, 31–38. [Google Scholar] [CrossRef]
- Sugase, K.; Dyson, H.J.; Wright, P.E. Mechanism of coupled folding and binding of an intrinsically disordered protein. Nature 2007, 447, 1021–1025. [Google Scholar] [CrossRef]
- Radhakrishnan, I.; PÈrez-Alvarado, G.C.; Dyson, H.J.; Wright, P.E. Conformational preferences in the ser133-phosphorylated and non-phosphorylated forms of the kinase inducible transactivation domain of CREB. FEBS Lett. 1998, 430, 317–322. [Google Scholar] [CrossRef]
- Cornell, W.D.; Cieplak, P.; Bayly, C.I.; Gould, I.R.; Merz, K.M.; Ferguson, D.M.; Spellmeyer, D.C.; Fox, T.; Caldwell, J.W.; Kollman, P.A. A second generation force field for the simulation of proteins, nucleic acids, and organic molecules. J. Am. Chem. Soc. 1995, 117, 5179–5197. [Google Scholar]
- Kollman, P.; Dixon, R.; Cornell, W.; Fox, T.; Chipot, C.; Pohorille, A. The Development/Application of a “Minimalist” For Organic/Biochemical Molecular Mechanic Force Field Using a Combination of ab Initio Calculations and Experimental Data; Springer: Dordrecht, The Netherlands, 1997; pp. 83–96. [Google Scholar]
- Kamiya, N.; Watanabe, Y.S.; Ono, S.; Higo, J. Amber-based hybrid force field for conformational sampling of polypeptides. Chem. Phys. Lett. 2005, 401, 312–317. [Google Scholar] [CrossRef]
- Ikebe, J.; Kamiya, N.; Ito, J.-I.; Shindo, H.; Higo, J. Simulation study on the disordered state of an Alzheimer’s βamyloid peptide aβ(12–36) in water consisting of random-structural, β-structural, and helical clusters. Protein Sci. 2007, 16, 1596–1608. [Google Scholar] [CrossRef]
- Jorgensen, W.L.; Chandrasekhar, J.; Madura, J.D.; Impey, R.W.; Klein, M.L. Comparison of simple potential functions for simulating liquid water. J. Chem. Phys. 1983, 79, 926–935. [Google Scholar] [CrossRef]
- Morikami, K.; Nakai, T.; Kidera, A.; Saito, M.; Nakamura, H. PRESTO (protein engineering simulator): A vectorized molecular mechanics program for biopolymers. Comput. Chem. 1992, 16, 243–248. [Google Scholar] [CrossRef]
- Ryckaert, J.-P.; Ciccotti, G.; Berendsen, H.J.C. Numerical integration of the Cartesian equations of motion of a system with constraints: Molecular dynamics of n-alkanes. J. Comput. Phys. 1977, 23, 327–341. [Google Scholar] [CrossRef]
- Ding, H.-Q.; Karasawa, N.; Goddard, W.A. Atomic level simulations on a million particles: The cell multipole method for Coulomb and London nonbond interactions. J. Chem. Phys. 1992, 97, 4309–4315. [Google Scholar] [CrossRef]
- Pettersen, E.F.; Goddard, T.D.; Huang, C.C.; Couch, G.S.; Greenblatt, D.M.; Meng, E.C.; Ferrin, T.E. UCSF chimera—A visualization system for exploratory research and analysis. J. Comput. Chem. 2004, 25, 1605–1612. [Google Scholar] [CrossRef]
- Evans, D.J.; Morriss, G.P. The isothermal/isobaric molecular dynamics ensemble. Phys. Lett. A 1983, 98, 433–436. [Google Scholar] [CrossRef]
- Kabsch, W.; Sander, C. Dictionary of protein secondary structure: Pattern recognition of hydrogen-bonded and geometrical features. Biopolymers 1983, 22, 2577–2637. [Google Scholar] [CrossRef]
- De Guzman, R.N.; Goto, N.K.; Dyson, H.J.; Wright, P.E. Structural basis for cooperative transcription factor binding to the CBP coactivator. J. Mol. Biol. 2006, 355, 1005–1013. [Google Scholar] [CrossRef]
- Lee, C.W.; Arai, M.; Martinez-Yamout, M.A.; Dyson, H.J.; Wright, P.E. Mapping the interactions of the p53 transactivation domain with the KIX domain of CBP. Biochemistry 2009, 48, 2115–2124. [Google Scholar]
- Goto, N.K.; Zor, T.; Martinez-Yamout, M.; Dyson, H.J.; Wright, P.E. Cooperativity in transcription factor binding to the coactivator CREB-binding protein (CBP). J. Biol. Chem. 2002, 277, 43168–43174. [Google Scholar]
© 2012 by the authors; licensee MDPI, Basel, Switzerland. This article is an open access article distributed under the terms and conditions of the Creative Commons Attribution license ( http://creativecommons.org/licenses/by/3.0/).
Share and Cite
Umezawa, K.; Ikebe, J.; Takano, M.; Nakamura, H.; Higo, J. Conformational Ensembles of an Intrinsically Disordered Protein pKID with and without a KIX Domain in Explicit Solvent Investigated by All-Atom Multicanonical Molecular Dynamics. Biomolecules 2012, 2, 104-121. https://doi.org/10.3390/biom2010104
Umezawa K, Ikebe J, Takano M, Nakamura H, Higo J. Conformational Ensembles of an Intrinsically Disordered Protein pKID with and without a KIX Domain in Explicit Solvent Investigated by All-Atom Multicanonical Molecular Dynamics. Biomolecules. 2012; 2(1):104-121. https://doi.org/10.3390/biom2010104
Chicago/Turabian StyleUmezawa, Koji, Jinzen Ikebe, Mitsunori Takano, Haruki Nakamura, and Junichi Higo. 2012. "Conformational Ensembles of an Intrinsically Disordered Protein pKID with and without a KIX Domain in Explicit Solvent Investigated by All-Atom Multicanonical Molecular Dynamics" Biomolecules 2, no. 1: 104-121. https://doi.org/10.3390/biom2010104