Exploring the Optimal Strategy to Predict Essential Genes in Microbes

Abstract
:
1.Introduction
2.Experimental
2.1. Data Sources
2.2. Genomic Features

| Feature | Description | Class * | Data type | Available ** | ||
|---|---|---|---|---|---|---|
| Aromo | Aromaticity score | A | Real | EC/AB/SC/NC | ||
| A3s | Base composition A | A | Real | EC/AB/SC/NC | ||
| C3s | Base composition C | A | Real | EC/AB/SC/NC | ||
| G3s | Base composition G | A | Real | EC/AB/SC/NC | ||
| T3s | Base composition T | A | Real | EC/AB/SC/NC | ||
| CAI | Codon adaptation index | A | Real | EC/AB/SC/NC | ||
| CBI | Codon bias index | A | Real | EC/AB/SC/NC | ||
| Fop | Frequency of optimal codons | A | Real | EC/AB/SC/NC | ||
| Nc | Effective number of codons | A | Real | EC/AB/SC/NC | ||
| L_sym | Frequency of synonymous codons | A | Integer | EC/AB/SC/NC | ||
| L_aa | Length amino acids | A | Integer | EC/AB/SC/NC | ||
| GC | GC content | A | Real | EC/AB/SC/NC | ||
| GC3s | GC content 3rd position of synonymous codons | A | Real | EC/AB/SC/NC | ||
| Gravy | Hydrophobicity score | A | Real | EC/AB/SC/NC | ||
| Cytoplasm | Subcellular localization: cytoplasm | B | Boolean | EC/AB/SC/NC | ||
| Extracellular | Subcellular localization: Extracellular | B | Boolean | EC/AB/SC/NC | ||
| Inner | Subcellular localization: Inner membrane | B | Boolean | EC/AB | ||
| Outer | Subcellular localization: Outer membrane | B | Boolean | EC/AB | ||
| Periplasm | Subcellular localization: Periplasm | B | Boolean | EC/AB | ||
| Golgi | Subcellular localization: Golgi | B | Boolean | SC/NC | ||
| Nucleus | Subcellular localization: Nucleus | B | Boolean | SC/NC | ||
| Mito | Subcellular localization: Mitochondrion | B | Boolean | SC/NC | ||
| Plasma | Subcellular localization: Plasma membrane | B | Boolean | SC/NC | ||
| Vacuole | Subcellular localization: Vacuole | B | Boolean | SC/NC | ||
| Peroxisome | Subcellular localization: Peroxisome | B | Boolean | SC/NC | ||
| ER | Subcellular localization: Endoplasmic reticulum | B | Boolean | SC/NC | ||
| ExpAA | Expect number of Amino acids in helices | B | Real | EC/AB/SC/NC | ||
| First60 | Expect number of AAs in helices in first 60 AAs | B | Real | EC/AB/SC/NC | ||
| PredHel | Number of predicted TM helices | B | Integer | EC/AB/SC/NC | ||
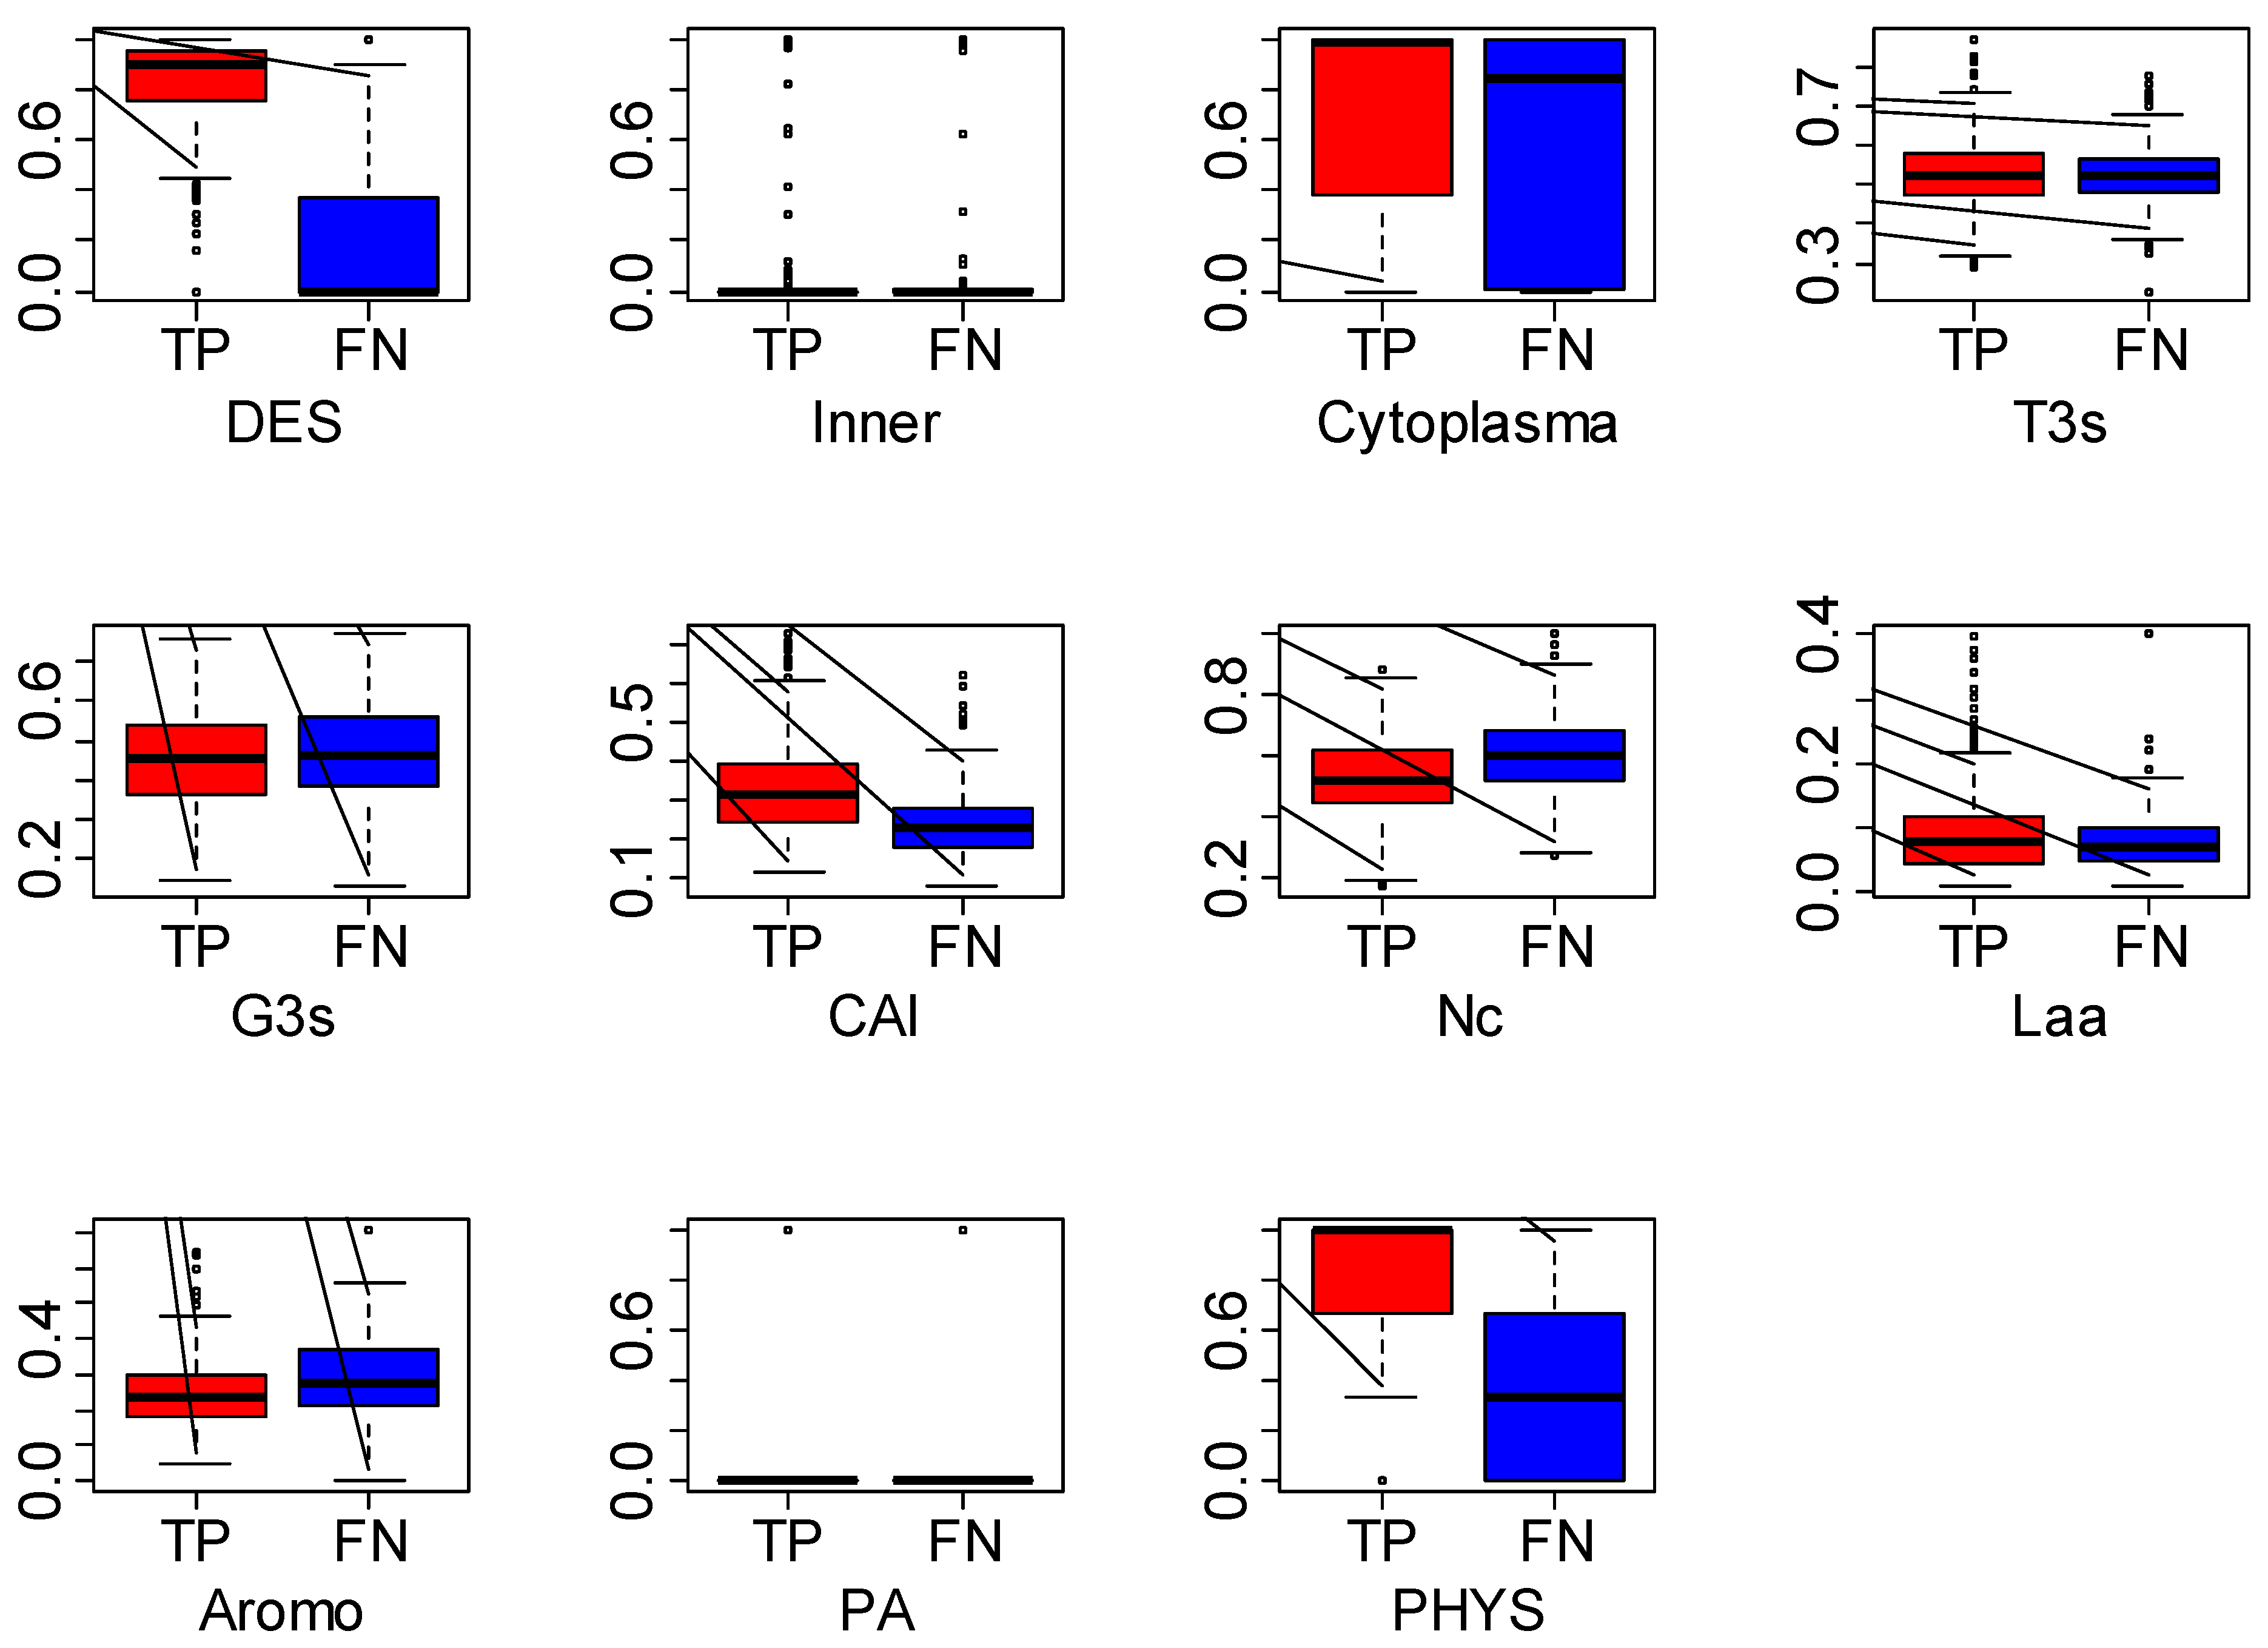
| PHYS | Phylogenetic score | B | Real | EC/AB/SC/NC | ||
| PA | Paralogy | B | Boolean | EC/AB/SC/NC | ||
| DES | Domain enrichment score | B | Real | EC/AB/SC/NC | ||
| FLU | Fluctuation | C | Real | EC/SC/NC | ||
| CEH | Coexpression network hubs | C | Boolean | EC/SC/NC | ||
| CEB | Coexpression network bottlenecks | C | Boolean | EC/SC/NC | ||
2.3. Training and Testing Sets Preparation
2.3.1. Same-Organism Approach
2.3.2. Cross-Organism Approach
2.3.3. The Combined Approach
2.4. Classifier Design
3.Results and Discussion
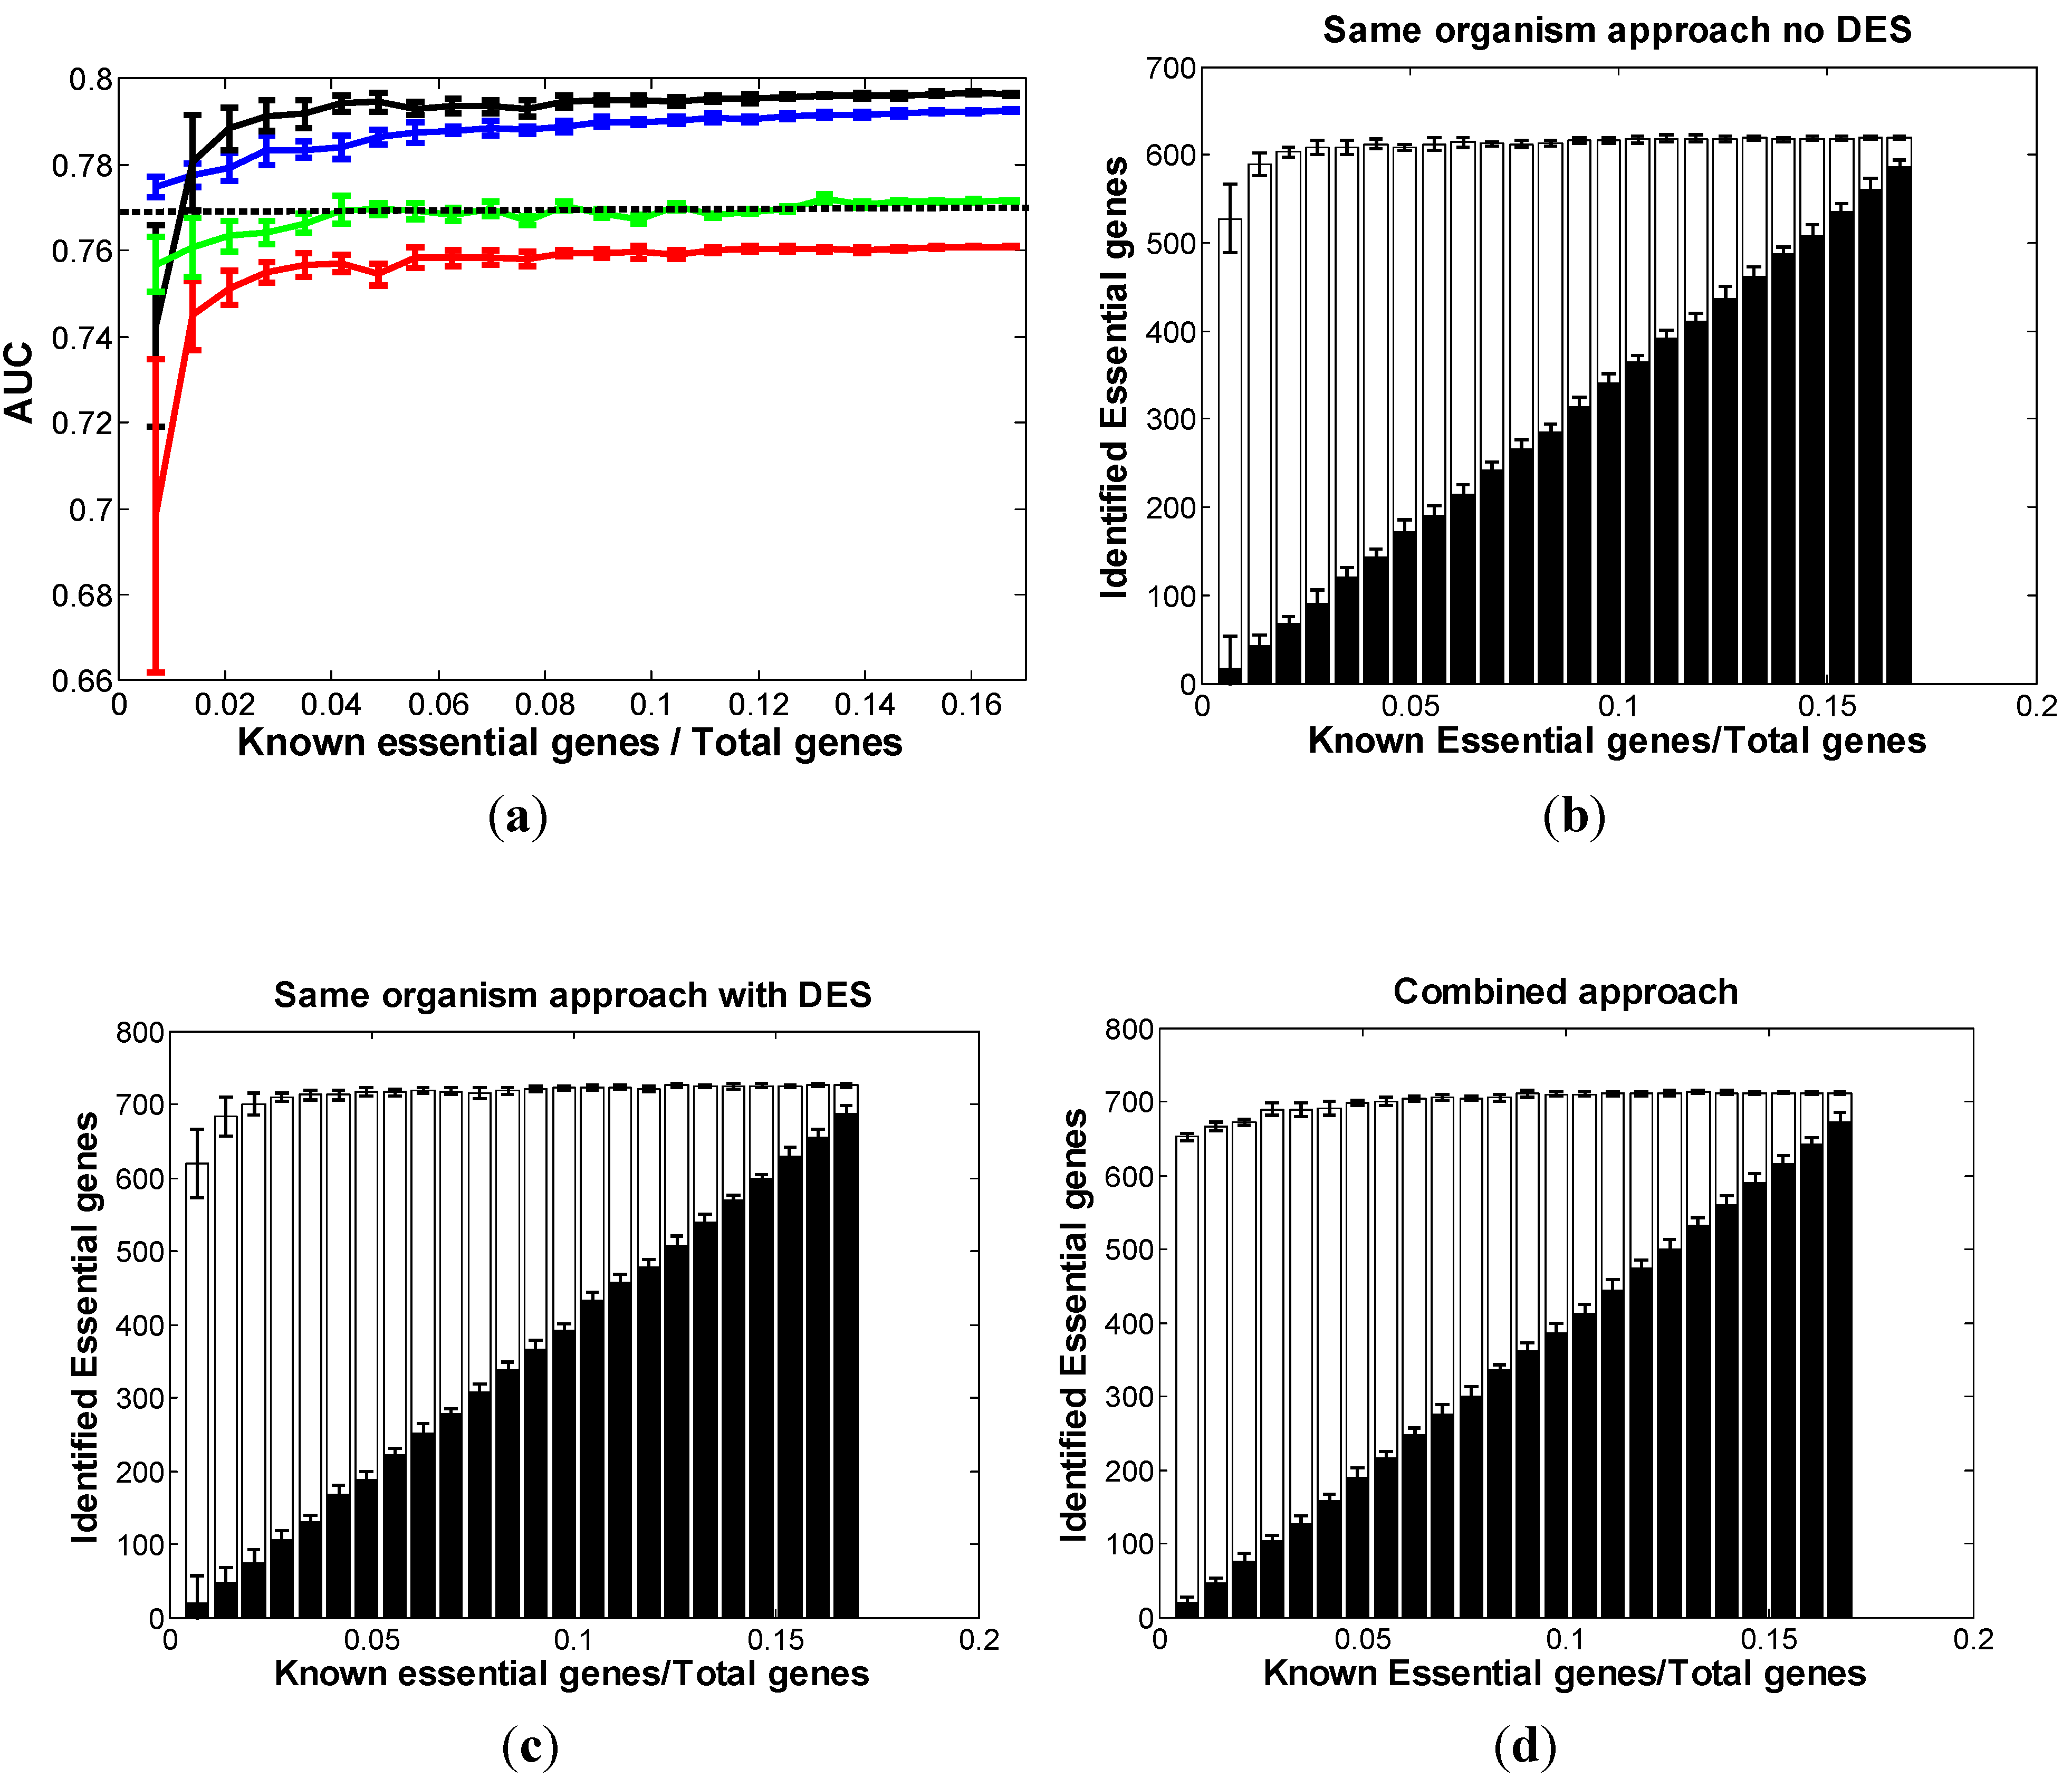
3.1. Optimal Strategy for Predicting Essential Genes in EC
| Approach | Description | “Gold Standard” Set | Prediction Set | |
|---|---|---|---|---|
| Training Set | Testing Set | |||
| Same-organism approach | Learning from the limited number of known essential genes in the target organism | 9/10 of the “gold standard” set of the target organism | 1/10 of the “gold standard” set of the target organism | The entire set of genes except the “gold standard” in the target organism |
| Cross-organism approach | Learning from essential genes from a closely-related model organism | 9/10 of the “gold standard” set in the related model organism | 1/10 of the “gold standard” set in the related model organism | The entire set of genes except the “gold standard” in the target organism |
| Combined approach | Learning from known essential genes in the target organism as well as a closely-related model organism with higher weights to the former | 9/10 of the “gold standard” combined set. The weights assigned to the genes in the target and model organism is w:1 | 1/10 of the “gold standard” combined set | The entire set of genes except the “gold standard” in the target organism |
3.1.1. Same-Organism Approach: Learning Traits from the Partially Known Essential Genes in EC

3.1.2. Cross-Organism Approach: Transferring Essential Gene Annotations from AB
3.1.3. Combined Approach: Combining Both AB and Partially Known Essential Information in EC
3.2. Optimal Strategy for Predicting Essential Genes in AB
3.3. Optimal Strategy for Predicting Essential Genes in SC

3.4. Optimal Strategy for Predicting Essential Genes in NC
3.5. Discussion
4.Conclusion
Acknowledgments
Supplementary Section
Intrinsic and Context-Dependent Genomic Features
 , here ness and nnon-ess represent a domain’s occurrence frequency in the essential and non-essential dataset, respectively. Ness and Nnon-ess is the size of the essential and non-essential dataset, respectively.
 and the edge set
  for
for  and | rij | ≥ 0.7. Each vertex represents a gene and each edge represents a gene pair whose gene expression profiles correlation coefficient | rij | is greater than 0.7. This cutoff value of | rij | is determined based on our previous work [13]. The hubs (nodes with high degrees) and bottlenecks (nodes with high betweenness or shortest paths occurrence) have been found to have correlations with gene essentiality [14]. The network statistics are calculated using tYNA (http://www.gersteinlab.org/tyna).
Supplementary References
- Kyte, J.; Doolittle, R.F. A simple method for displaying the hydropathic character of a protein. J. Mol. Biol. 1982, 157, 105–132. [Google Scholar] [CrossRef]
- Wright, F. The ‘effective number of codons’ used in a gene. Gene 1990, 87, 23–29. [Google Scholar] [CrossRef]
- Fuglsang, A. The ‘effective number of codons’ revisited. Biochem. Biophys. Res. Commun. 2004, 317, 957–964. [Google Scholar] [CrossRef]
- Sharp, P.M.; Li, W.H. The codon adaptation index—A measure of directional synonymous codon usage bias, and its potential applications. Nucleic Acids Res. 1987, 15, 1281–1295. [Google Scholar] [CrossRef]
- Lu, Z.; Szafron, D.; Greiner, R.; Lu, P.; Wishart, D.S.; Poulin, B.; Anvik, J.; Macdonell, C.; Eisner, R. Predicting subcellular localization of proteins using machine-learned classifiers. Bioinformatics 2004, 20, 547–556. [Google Scholar] [CrossRef]
- Sonnhammer, E.L.; von Heijne, G.; Krogh, A. A hidden markov model for predicting transmembrane helices in protein sequences. Proc. Int. Conf. Intell. Syst. Mol. Biol. 1998, 6, 175–182. [Google Scholar]
- Krogh, A.; Larsson, B.; von Heijne, G.; Sonnhammer, E.L. Predicting transmembrane protein topology with a hidden markov model: Application to complete genomes. J. Mol. Biol. 2001, 305, 567–580. [Google Scholar] [CrossRef]
- Chen, Y.; Xu, D. Understanding protein dispensability through machine-learning analysis of high-throughput data. Bioinformatics 2005, 21, 575–581. [Google Scholar] [CrossRef]
- Jeong, H.; Oltvai, Z.N.; Barabasi, A.L. Prediction of protein essentiality based on genomic data. ComPlexUs 2003, 1, 19–28. [Google Scholar] [CrossRef]
- Barrett, T.; Troup, D.B.; Wilhite, S.E.; Ledoux, P.; Rudnev, D.; Evangelista, C.; Kim, I.F.; Soboleva, A.; Tomashevsky, M.; Edgar, R. Ncbi geo: Mining tens of millions of expression profiles—Database and tools update. Nucleic Acids Res. 2007, 35, D760–D765. [Google Scholar]
- Parkinson, H.; Kapushesky, M.; Shojatalab, M.; Abeygunawardena, N.; Coulson, R.; Farne, A.; Holloway, E.; Kolesnykov, N.; Lilja, P.; Lukk, M.; Mani, R.; Rayner, T.; Sharma, A.; William, E.; Sarkans, U.; Brazma, A. Arrayexpress—A public database of microarray experiments and gene expression profiles. Nucleic Acids Res. 2007, 35, D747–D750. [Google Scholar]
- Gasch, A.P.; Spellman, P.T.; Kao, C.M.; Carmel-Harel, O.; Eisen, M.B.; Storz, G.; Botstein, D.; Brown, P.O. Genomic expression programs in the response of yeast cells to environmental changes. Mol. Biol. Cell 2000, 11, 4241–4257. [Google Scholar]
- Lu, L.J.; Xia, Y.; Paccanaro, A.; Yu, H.; Gerstein, M. Assessing the limits of genomic data integration for predicting protein networks. Genome Res. 2005, 15, 945–953. [Google Scholar] [CrossRef]
- Yu, H.; Greenbaum, D.; Xin Lu, H.; Zhu, X.; Gerstein, M. Genomic analysis of essentiality within protein networks. Trends Genet. 2004, 20, 227–231. [Google Scholar] [CrossRef]
References
- Haselbeck, R.; Wall, D.; Jiang, B.; Ketela, T.; Zyskind, J.; Bussey, H.; Foulkes, J.G.; Roemer, T. Comprehensive essential gene identification as a platform for novel anti-infective drug discovery. Curr. Pharm. Des. 2002, 8, 1155–1172. [Google Scholar] [CrossRef]
- Gibson, D.G.; Glass, J.I.; Lartigue, C.; Noskov, V.N.; Chuang, R.Y.; Algire, M.A.; Benders, G.A.; Montague, M.G.; Ma, L.; Moodie, M.M.; Merryman, C.; Vashee, S.; Krishnakumar, R.; Assad-Garcia, N.; Andrews-Pfannkoch, C.; Denisova, E.A.; Young, L.; Qi, Z.Q.; Segall-Shapiro, T.H.; Calvey, C.H.; Parmar, P.P.; Hutchison, C.A., III.; Smith, H.O.; Venter, J.C. Creation of a bacterial cell controlled by a chemically synthesized genome. Science 2010, 329, 52–56. [Google Scholar]
- Pennisi, E. Genomics. Synthetic genome brings new life to bacterium. Science 2010, 328, 958–959. [Google Scholar] [CrossRef]
- Dowell, R.D.; Ryan, O.; Jansen, A.; Cheung, D.; Agarwala, S.; Danford, T.; Bernstein, D.A.; Rolfe, P.A.; Heisler, L.E.; Chin, B.; Nislow, C.; Giaever, G.; Phillips, P.C.; Fink, G.R.; Gifford, D.K.; Boone, C. Genotype to phenotype: A complex problem. Science 2010, 328, 469. [Google Scholar] [CrossRef]
- Baba, T.; Ara, T.; Hasegawa, M.; Takai, Y.; Okumura, Y.; Baba, M.; Datsenko, K.A.; Tomita, M.; Wanner, B.L.; Mori, H. Construction of escherichia coli k-12 in-frame, single-gene knockout mutants: The keio collection. Mol. Syst. Biol. 2006, 2, 2006–0008. [Google Scholar]
- de Berardinis, V.; Vallenet, D.; Castelli, V.; Besnard, M.; Pinet, A.; Cruaud, C.; Samair, S.; Lechaplais, C.; Gyapay, G.; Richez, C.; Durot, M.; Kreimeyer, A.; le Fevre, F.; Schachter, V.; Pezo, V.; Doring, V.; Scarpelli, C.; Medigue, C.; Cohen, G.N.; Marliere, P.; Salanoubat, M.; Weissenbach, J. A complete collection of single-gene deletion mutants of acinetobacter baylyi adp1. Mol. Syst. Biol. 2008, 4. Article number: 174. [Google Scholar] [CrossRef]
- Kato, J.; Hashimoto, M. Construction of consecutive deletions of the escherichia coli chromosome. Mol. Syst. Biol. 2007, 3. Article number: 132. [Google Scholar] [CrossRef]
- Kobayashi, M.; Tsuda, Y.; Yoshida, T.; Takeuchi, D.; Utsunomiya, T.; Takahashi, H.; Suzuki, F. Bacterial sepsis and chemokines. Curr. Drug Targets 2006, 7, 119–134. [Google Scholar] [CrossRef]
- Akerley, B.J.; Rubin, E.J.; Novick, V.L.; Amaya, K.; Judson, N.; Mekalanos, J.J. A genome-scale analysis for identification of genes required for growth or survival of haemophilus influenzae. Proc. Natl. Acad. Sci. USA 2002, 99, 966–971. [Google Scholar]
- Gallagher, L.A.; Ramage, E.; Jacobs, M.A.; Kaul, R.; Brittnacher, M.; Manoil, C. A comprehensive transposon mutant library of francisella novicida, a bioweapon surrogate. Proc. Natl. Acad. Sci. USA 2007, 104, 1009–1014. [Google Scholar]
- Gerdes, S.Y.; Scholle, M.D.; Campbell, J.W.; Balazsi, G.; Ravasz, E.; Daugherty, M.D.; Somera, A.L.; Kyrpides, N.C.; Anderson, I.; Gelfand, M.S.; Bhattacharya, A.; Kapatral, V.; D’Souza, M.; Baev, M.V.; Grechkin, Y.; Mseeh, F.; Fonstein, M.Y.; Overbeek, R.; Barabasi, A.L.; Oltvai, Z.N.; Osterman, A.L. Experimental determination and system level analysis of essential genes in escherichia coli mg1655. J. Bacteriol. 2003, 185, 5673–5684. [Google Scholar]
- Glass, J.I.; Assad-Garcia, N.; Alperovich, N.; Yooseph, S.; Lewis, M.R.; Maruf, M.; Hutchison, C.A., III.; Smith, H.O.; Venter, J.C. Essential genes of a minimal bacterium. Proc. Natl. Acad. Sci. USA 2006, 103, 425–430. [Google Scholar]
- Hutchison, C.A.; Peterson, S.N.; Gill, S.R.; Cline, R.T.; White, O.; Fraser, C.M.; Smith, H.O.; Venter, J.C. Global transposon mutagenesis and a minimal mycoplasma genome. Science 1999, 286, 2165–2169. [Google Scholar]
- Jacobs, M.A.; Alwood, A.; Thaipisuttikul, I.; Spencer, D.; Haugen, E.; Ernst, S.; Will, O.; Kaul, R.; Raymond, C.; Levy, R.; Chun-Rong, L.; Guenthner, D.; Bovee, D.; Olson, M.V.; Manoil, C. Comprehensive transposon mutant library of pseudomonas aeruginosa. Proc. Natl. Acad. Sci. USA 2003, 100, 14339–14344. [Google Scholar]
- Liberati, N.T.; Urbach, J.M.; Miyata, S.; Lee, D.G.; Drenkard, E.; Wu, G.; Villanueva, J.; Wei, T.; Ausubel, F.M. An ordered, nonredundant library of pseudomonas aeruginosa strain pa14 transposon insertion mutants. Proc. Natl. Acad. Sci. USA 2006, 103, 2833–2838. [Google Scholar]
- Forsyth, R.A.; Haselbeck, R.J.; Ohlsen, K.L.; Yamamoto, R.T.; Xu, H.; Trawick, J.D.; Wall, D.; Wang, L.; Brown-Driver, V.; Froelich, J.M.; C, K.G.; King, P.; McCarthy, M.; Malone, C.; Misiner, B.; Robbins, D.; Tan, Z.; Zhu Zy, Z.Y.; Carr, G.; Mosca, D.A.; Zamudio, C.; Foulkes, J.G.; Zyskind, J.W. A genome-wide strategy for the identification of essential genes in staphylococcus aureus. Mol. Microbiol. 2002, 43, 1387–1400. [Google Scholar]
- Ji, Y.; Zhang, B.; Van, S.F.; Horn; Warren, P.; Woodnutt, G.; Burnham, M.K.; Rosenberg, M. Identification of critical staphylococcal genes using conditional phenotypes generated by antisense rna. Science 2001, 293, 2266–2269. [Google Scholar]
- Bijlsma, J.J.; Burghout, P.; Kloosterman, T.G.; Bootsma, H.J.; de Jong, A.; Hermans, P.W.; Kuipers, O.P. Development of genomic array footprinting for identification of conditionally essential genes in streptococcus pneumoniae. Appl. Environ. Microbiol. 2007, 73, 1514–1524. [Google Scholar]
- Daniels, C.; Godoy, P.; Duque, E.; Molina-Henares, M.A.; de la Torre, J.; del Arco, J.M.; Herrera, C.; Segura, A.; Guazzaroni, M.E.; Ferrer, M.; Ramos, J.L. Global regulation of food supply by pseudomonas putida dot-t1e. J. Bacteriol. 2010, 192, 2169–2181. [Google Scholar]
- Joyce, A.R.; Reed, J.L.; White, A.; Edwards, R.; Osterman, A.; Baba, T.; Mori, H.; Lesely, S.A.; Palsson, B.O.; Agarwalla, S. Experimental and computational assessment of conditionally essential genes in escherichia coli. J. Bacteriol. 2006, 188, 8259–8271. [Google Scholar]
- Molina-Henares, M.A.; de la Torre, J.; Garcia-Salamanca, A.; Molina-Henares, A.J.; Herrera, M.C.; Ramos, J.L.; Duque, E. Identification of conditionally essential genes for growth of pseudomonas putida kt2440 on minimal medium through the screening of a genome-wide mutant library. Environ. Microbiol. 2010, 12, 1468–1485. [Google Scholar]
- Tong, X.; Campbell, J.W.; Balazsi, G.; Kay, K.A.; Wanner, B.L.; Gerdes, S.Y.; Oltvai, Z.N. Genome-scale identification of conditionally essential genes in e. Coli by DNA microarrays. Biochem. Biophys. Res. Commun. 2004, 322, 347–354. [Google Scholar] [CrossRef]
- Hillenmeyer, M.E.; Fung, E.; Wildenhain, J.; Pierce, S.E.; Hoon, S.; Lee, W.; Proctor, M.; St Onge, R.P.; Tyers, M.; Koller, D.; Altman, R.B.; Davis, R.W.; Nislow, C.; Giaever, G. The chemical genomic portrait of yeast: Uncovering a phenotype for all genes. Science 2008, 320, 362–365. [Google Scholar]
- Deng, J.; Deng, L.; Su, S.; Zhang, M.; Lin, X.; Wei, L.; Minai, A.A.; Hassett, D.J.; Lu, L.J. Investigating the predictability of essential genes across distantly related organisms using an integrative approach. Nucleic Acids Res. 2010, 39, 795–807. [Google Scholar]
- Hashimoto, M.; Ichimura, T.; Mizoguchi, H.; Tanaka, K.; Fujimitsu, K.; Keyamura, K.; Ote, T.; Yamakawa, T.; Yamazaki, Y.; Mori, H.; Katayama, T.; Kato, J. Cell size and nucleoid organization of engineered escherichia coli cells with a reduced genome. Mol. Microbiol. 2005, 55, 137–149. [Google Scholar]
- Giaever, G.; Chu, A.M.; Ni, L.; Connelly, C.; Riles, L.; Veronneau, S.; Dow, S.; Lucau-Danila, A.; Anderson, K.; Andre, B.; Arkin, A.P.; Astromoff, A.; El-Bakkoury, M.; Bangham, R.; Benito, R.; Brachat, S.; Campanaro, S.; Curtiss, M.; Davis, K.; Deutschbauer, A.; Entian, K.D.; Flaherty, P.; Foury, F.; Garfinkel, D.J.; Gerstein, M.; Gotte, D.; Guldener, U.; Hegemann, J.H.; Hempel, S.; Herman, Z.; Jaramillo, D.F.; Kelly, D.E.; Kelly, S.L.; Kotter, P.; LaBonte, D.; Lamb, D.C.; Lan, N.; Liang, H.; Liao, H.; Liu, L.; Luo, C.; Lussier, M.; Mao, R.; Menard, P.; Ooi, S.L.; Revuelta, J.L.; Roberts, C.J.; Rose, M.; Ross-Macdonald, P.; Scherens, B.; Schimmack, G.; Shafer, B.; Shoemaker, D.D.; Sookhai-Mahadeo, S.; Storms, R.K.; Strathern, J.N.; Valle, G.; Voet, M.; Volckaert, G.; Wang, C.Y.; Ward, T.R.; Wilhelmy, J.; Winzeler, E.A.; Yang, Y.; Yen, G.; Youngman, E.; Yu, K.; Bussey, H.; Boeke, J.D.; Snyder, M.; Philippsen, P.; Davis, R.W.; Johnston, M. Functional profiling of the saccharomyces cerevisiae genome. Nature 2002, 418, 387–391. [Google Scholar]
- Barrett, T.; Troup, D.B.; Wilhite, S.E.; Ledoux, P.; Rudnev, D.; Evangelista, C.; Kim, I.F.; Soboleva, A.; Tomashevsky, M.; Edgar, R. Ncbi geo: Mining tens of millions of expression profiles—Database and tools update. Nucleic Acids Res. 2007, 35, D760–D765. [Google Scholar]
- Parkinson, H.; Kapushesky, M.; Shojatalab, M.; Abeygunawardena, N.; Coulson, R.; Farne, A.; Holloway, E.; Kolesnykov, N.; Lilja, P.; Lukk, M.; Mani, R.; Rayner, T.; Sharma, A.; William, E.; Sarkans, U.; Brazma, A. Arrayexpress—A public database of microarray experiments and gene expression profiles. Nucleic Acids Res. 2007, 35, D747–D750. [Google Scholar]
- Gasch, A.P.; Spellman, P.T.; Kao, C.M.; Carmel-Harel, O.; Eisen, M.B.; Storz, G.; Botstein, D.; Brown, P.O. Genomic expression programs in the response of yeast cells to environmental changes. Mol. Biol. Cell 2000, 11, 4241–4257. [Google Scholar]
- Scott, M.S.; Barton, G.J. Probabilistic prediction and ranking of human protein-protein interactions. BMC Bioinformat. 2007, 8. Article number: 239. [Google Scholar] [CrossRef]
- Chawla, N.V.J., N.; Kolcz, A. Editorial: Special issue on learning from imbalanced data sets. SIGKDD Explor. 2004, 6, 1–6. [Google Scholar]
- Zhang, C.T.; Zhang, R. Gene essentiality analysis based on deg, a database of essential genes. Methods Mol. Biol. 2008, 416, 391–400. [Google Scholar] [CrossRef]
© 2012 by the authors; licensee MDPI, Basel, Switzerland. This article is an open access article distributed under the terms and conditions of the Creative Commons Attribution license ( http://creativecommons.org/licenses/by/3.0/).
Share and Cite
Deng, J.; Tan, L.; Lin, X.; Lu, Y.; Lu, L.J. Exploring the Optimal Strategy to Predict Essential Genes in Microbes. Biomolecules 2012, 2, 1-22. https://doi.org/10.3390/biom2010001
Deng J, Tan L, Lin X, Lu Y, Lu LJ. Exploring the Optimal Strategy to Predict Essential Genes in Microbes. Biomolecules. 2012; 2(1):1-22. https://doi.org/10.3390/biom2010001
Chicago/Turabian StyleDeng, Jingyuan, Lirong Tan, Xiaodong Lin, Yao Lu, and Long J. Lu. 2012. "Exploring the Optimal Strategy to Predict Essential Genes in Microbes" Biomolecules 2, no. 1: 1-22. https://doi.org/10.3390/biom2010001