1. Introduction
The penetration of neutral atoms into plasmas from the wall of thermonuclear devices is important for interpretation of the luminosity of the edge plasmas. This is essential for calculation of both the plasma radiation losses and the diagnostics of basic plasma components (i.e., hydrogen isotopes) and impurity ions. The luminosity of the Balmer spectral lines of hydrogen isotopes is the major experimental method to measure the isotopic composition of plasmas, which is an important parameter for the International Test Experimental Reactor (ITER). One of the main problems here is the relationship between the luminosity of Balmer spectral lines and the neutral flux from the wall. Besides the neutral atom spatial distribution, another important parameter of plasma is the velocity distribution function (VDF) of neutral atoms. The latter determines the spectral line shapes of hydrogen isotopes, including the deuterium and tritium. The observed spectral line shapes of hydrogen isotopes are the integral characteristics which are determined by the integrals of the line shapes along the observation line, weighted with their local luminosities. Thus, we will consider calculations of the 2D distributions of neutral atoms in space coordinates and velocities as well as their intensities at certain observation lines in the edge plasma.
We performed the numerical calculation for certain observation chords as well as certain scenarios of discharge in ITER. We used the data from the Monte-Carlo simulation with the EIRENE code [
1] stand-alone simulations of neutral deuterium VDF, applied on the SOL&divertor plasma background calculated by the SOLPS4.3 (B2-EIRENE) code [
1,
2,
3,
4]. These calculations, however, are time consuming. At the same time we need such calculations to be performed on a massive scale for various observation chords and scenarios in ITER. Therefore, the development of a simple and reliable computational model is of practical interest. Here we develop a kinetic model for calculation of neutral atom penetration into plasmas. This model is both accurate enough and fast for computation of characteristics of neutral atom flux from the wall. Unlike the complicated computational models, it enables one to retrace explicitly the impact of various physics processes upon formation of the spectral line shapes.
2. Description of Ballistic Model for Penetration of Neutral Atoms into Fusion Plasmas
The main sources of neutral atoms which come from the wall are the molecular dissociation and the recombination of ions on the wall. The slow atoms are formed by the dissociation of both the neutral molecules and the ionized molecular ions. The steadу state neutral flux is the bases for consideration below which is available for steady operation in ITER. The effect of ITER strong magnetic field is ignored for neutral particle motion whereas for charged particles it results in limitation of charge particle motion across the magnetic field. The atoms which are formed in such a way produce the first-generation flux. These atoms become a source of atoms of the next generation due to their charge exchange on the plasma ions.
The present calculations are based on a ballistic model (BM) of penetration of neutrals into plasmas [
5,
6]. Since the neutral atoms are localized mainly in a thin layer in the edge plasma with the typical width ~10 cm, which is small as compared to the minor radius of plasma in modern tokamaks, as well as in ITER, we can use a 1D-model of neutral’s motion (in the direction along the LoS perpendicular to the wall). In the frame of such an approximation the ballistic model for deuterium plasmas reduces to the following model:
The initial object of the theory is the ballistic flux of D
2 molecules which start from the wall and penetrate into the plasma with velocities determined by the wall temperature.
- -
Their collisions with electron result in the molecular dissociation and ionization. It is necessary to take into account the heating of molecular ions D2+ due to their elastic Coulomb collisions with plasma ions (the heating of neutral molecules is essentially smaller and is not taken into account); atoms created in dissociation processes move in two directions—into plasma and out the wall where they elastically reflected back;
- -
The other part of neutral atoms created due to ions recombination at the wall is also taken into account; so the total initial flux is formed by the dissociated and recombined atoms;
- -
The initial flux decreases due to ionization and charge exchange on plasma ions; the last process results in generation of secondary atomic flux with a temperature corresponding to the local one at the charge exchange point;
- -
The resulting atoms of the second generation are moving along ballistic trajectories together with those of the first generation. They undergo the ionization and the charge exchange that results in an attenuation of the flux and production of the next-generation atoms.
So the total neutral density is the sum of the all neutral atom generations. Calculations demonstrate a fast convergence due to a decrease of neutral fluxes at every step of fluxes generation.
The typical equations for connection of the next generation of neutrals (N
2) with the previous one (N
1) takes the form:
Here
x is the coordinate along line of sight,
vD2 is a velocity of deuterium neutral atoms arising from atoms with velocity
vD1,
P(
vD2,
vD1,
y) is velocity distribution function in a specific space point y with account for charge exchange,
dN1(
vD1,
y) is a source of neutral atom first generation, connected with the second one by the charge exchange processes with cross section
σcx and ion thermal velocity
vi on ions with density equal to electron density
Ne,
φ(
x,
y) is the propagation function describing the propagation of neutrals along ballistic trajectories from the point y to the point
x with account of their charge exchange and electron ionization (with the rate
![Atoms 02 00195 i002]()
) processes.
The distribution function P(vD2, vD1, y) is obtained from a solution of kinetic equation averaged over components of velocities perpendicular to the line of sight (LoS). The problem is that charge exchange rate depends on all three components of colliding particles velocities whereas the ballistic model is based on one dimensional motion along LoS. Such averaging shows that the distribution function can be expressed in terms of velocity projections with small corrections of the distribution function as compared with a Maxwellian one.
We perform the successive calculation of neutral atom density along the ballistic trajectories of the atoms. Note that the atoms of the former generation are considered to be the sources for atoms of the next generation. Such a procedure leads to a successive reduction of neutral atom density on every step, so that only a few iterations are sufficient to obtain a good result. The results obtained with the ballistic model are compared with those simulated by the EIRENE code [
1] stand-alone simulations of neutral deuterium VDF, applied on the SOL&divertor plasma background calculated by the SOLPS4.3 (B2-EIRENE) code [
1,
2,
3,
4] for certain observation chords. This enables us to draw a conclusion on the accuracy of the ballistic model.
To meet the requirements for the accuracy of the Balmer spectral lines diagnostic of the edge plasma parameters, it is important to take into account the population of the excited atomic states.
The electron excitation of atoms in the atomic ground state obviously does not change the ballistic velocity distribution function of neutrals. In contrast, the charge exchange from the excited atoms on the plasma ions results in the production of the excited neutrals with the local Maxwellian velocity distribution function.
Indeed, the cross section of the charge exchange of an atom in the excited atomic state n is proportional to n4, so it increases sharply with increasing n. Therefore, the radiation emission of the Balmer lines goes via two major channels: the first one is due to population of the emitting atomic level by the charge exchange in the ground state of neutrals and the second one is due to the resonance charge-exchange in the excited states. The difference between these two channels, and the corresponding luminosities of Balmer spectral lines, is due to the difference between the velocity distribution function of the Maxwellian generation of the neutrals and that of the ballistic one. The distribution function of the initial ballistic generation is essentially nonlocal and determined mainly by the ballistic transport of neutrals from one point to another. The distribution function of the Maxwellian generation is a local one and determined by the Maxwellian distribution in a given spatial point that is caused by the high rate of the charge exchange in the excited atomic states (an instant transfer of excitation).
3. The Typical Spatial Distribution of Plasma Parameters along Observation Chords in ITER
General view of some diagnostic chord in ITER is shown in
Figure 1 (
cf. [
4,
7]). The coordinate
x on the
Figure 2 and below are marked off the wall (the point
x = 0 is the position of the wall).
Figure 1.
General view of some diagnostic chords of observation of the scrape of layer (SOL) in International Test Experimental Reactor (ITER) with designations of high field side (HFS) and low field side (LFS) domains [
4,
7].
Figure 1.
General view of some diagnostic chords of observation of the scrape of layer (SOL) in International Test Experimental Reactor (ITER) with designations of high field side (HFS) and low field side (LFS) domains [
4,
7].
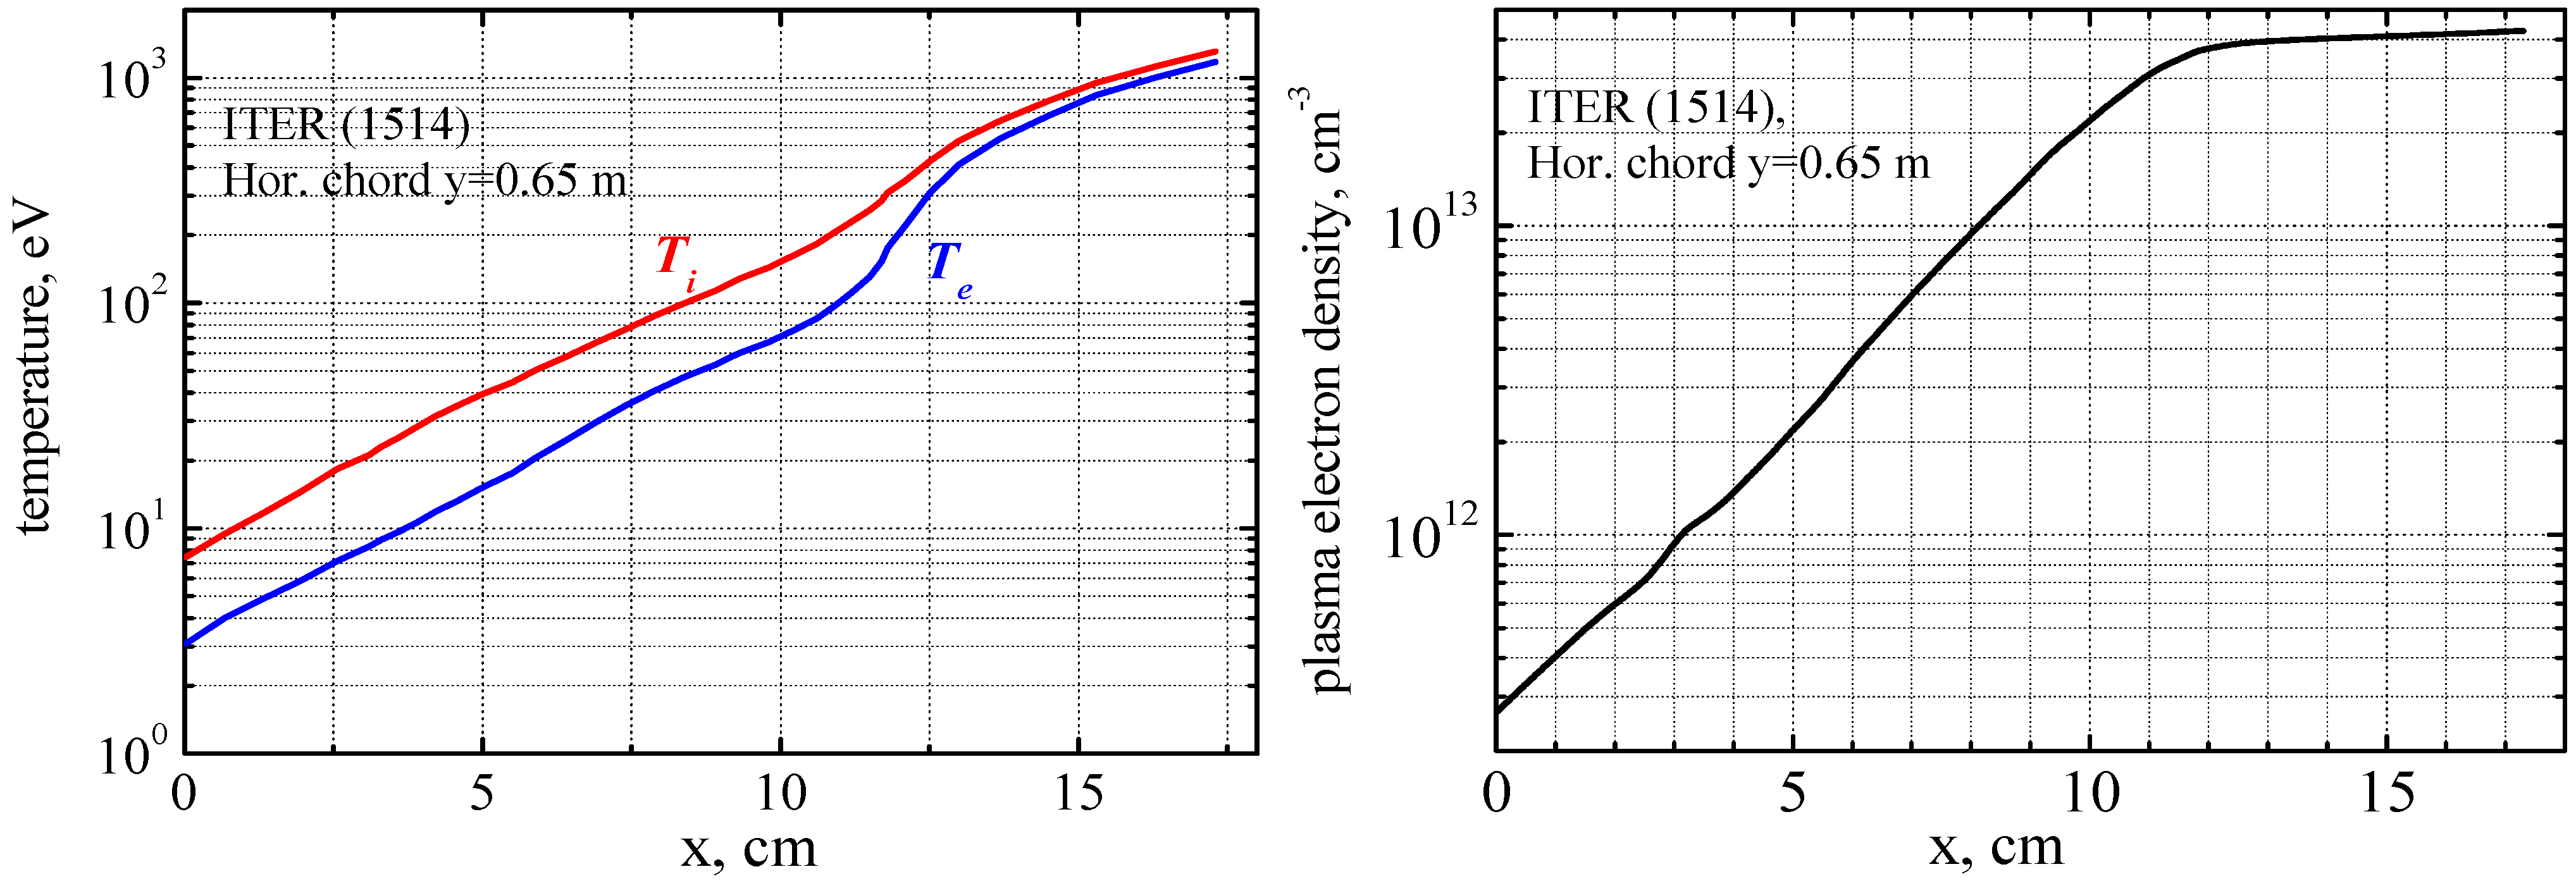
The distributions of temperature and density along the horizontal chord is given in
Figure 2 on the basis of simulations with the codes [
4,
7].
4. The Numerical Modeling Results
We tested the ballistic model for the following plasma parameters: For systematical test of ballistic model there were taken the plasma parameters along the outer part of horizontal chord for the ITER SOL&divertor case #1514 (
cf. [
3]) with density and temperature profiles presented above in
Figure 2.
We performed the following calculations in the frame of developed ballistic model:
- (1)
radial space distribution of molecules and molecular ions;
- (2)
radial space distributions of initial and secondary neutral atomic densities;
- (3)
radial space distribution of atomic velocity distribution function.
Figure 2.
Electron and ion temperature (
left) and electron (and ion) density (
right) along the horizontal observation chord according to the data from simulations with the codes [
4].
Figure 2.
Electron and ion temperature (
left) and electron (and ion) density (
right) along the horizontal observation chord according to the data from simulations with the codes [
4].
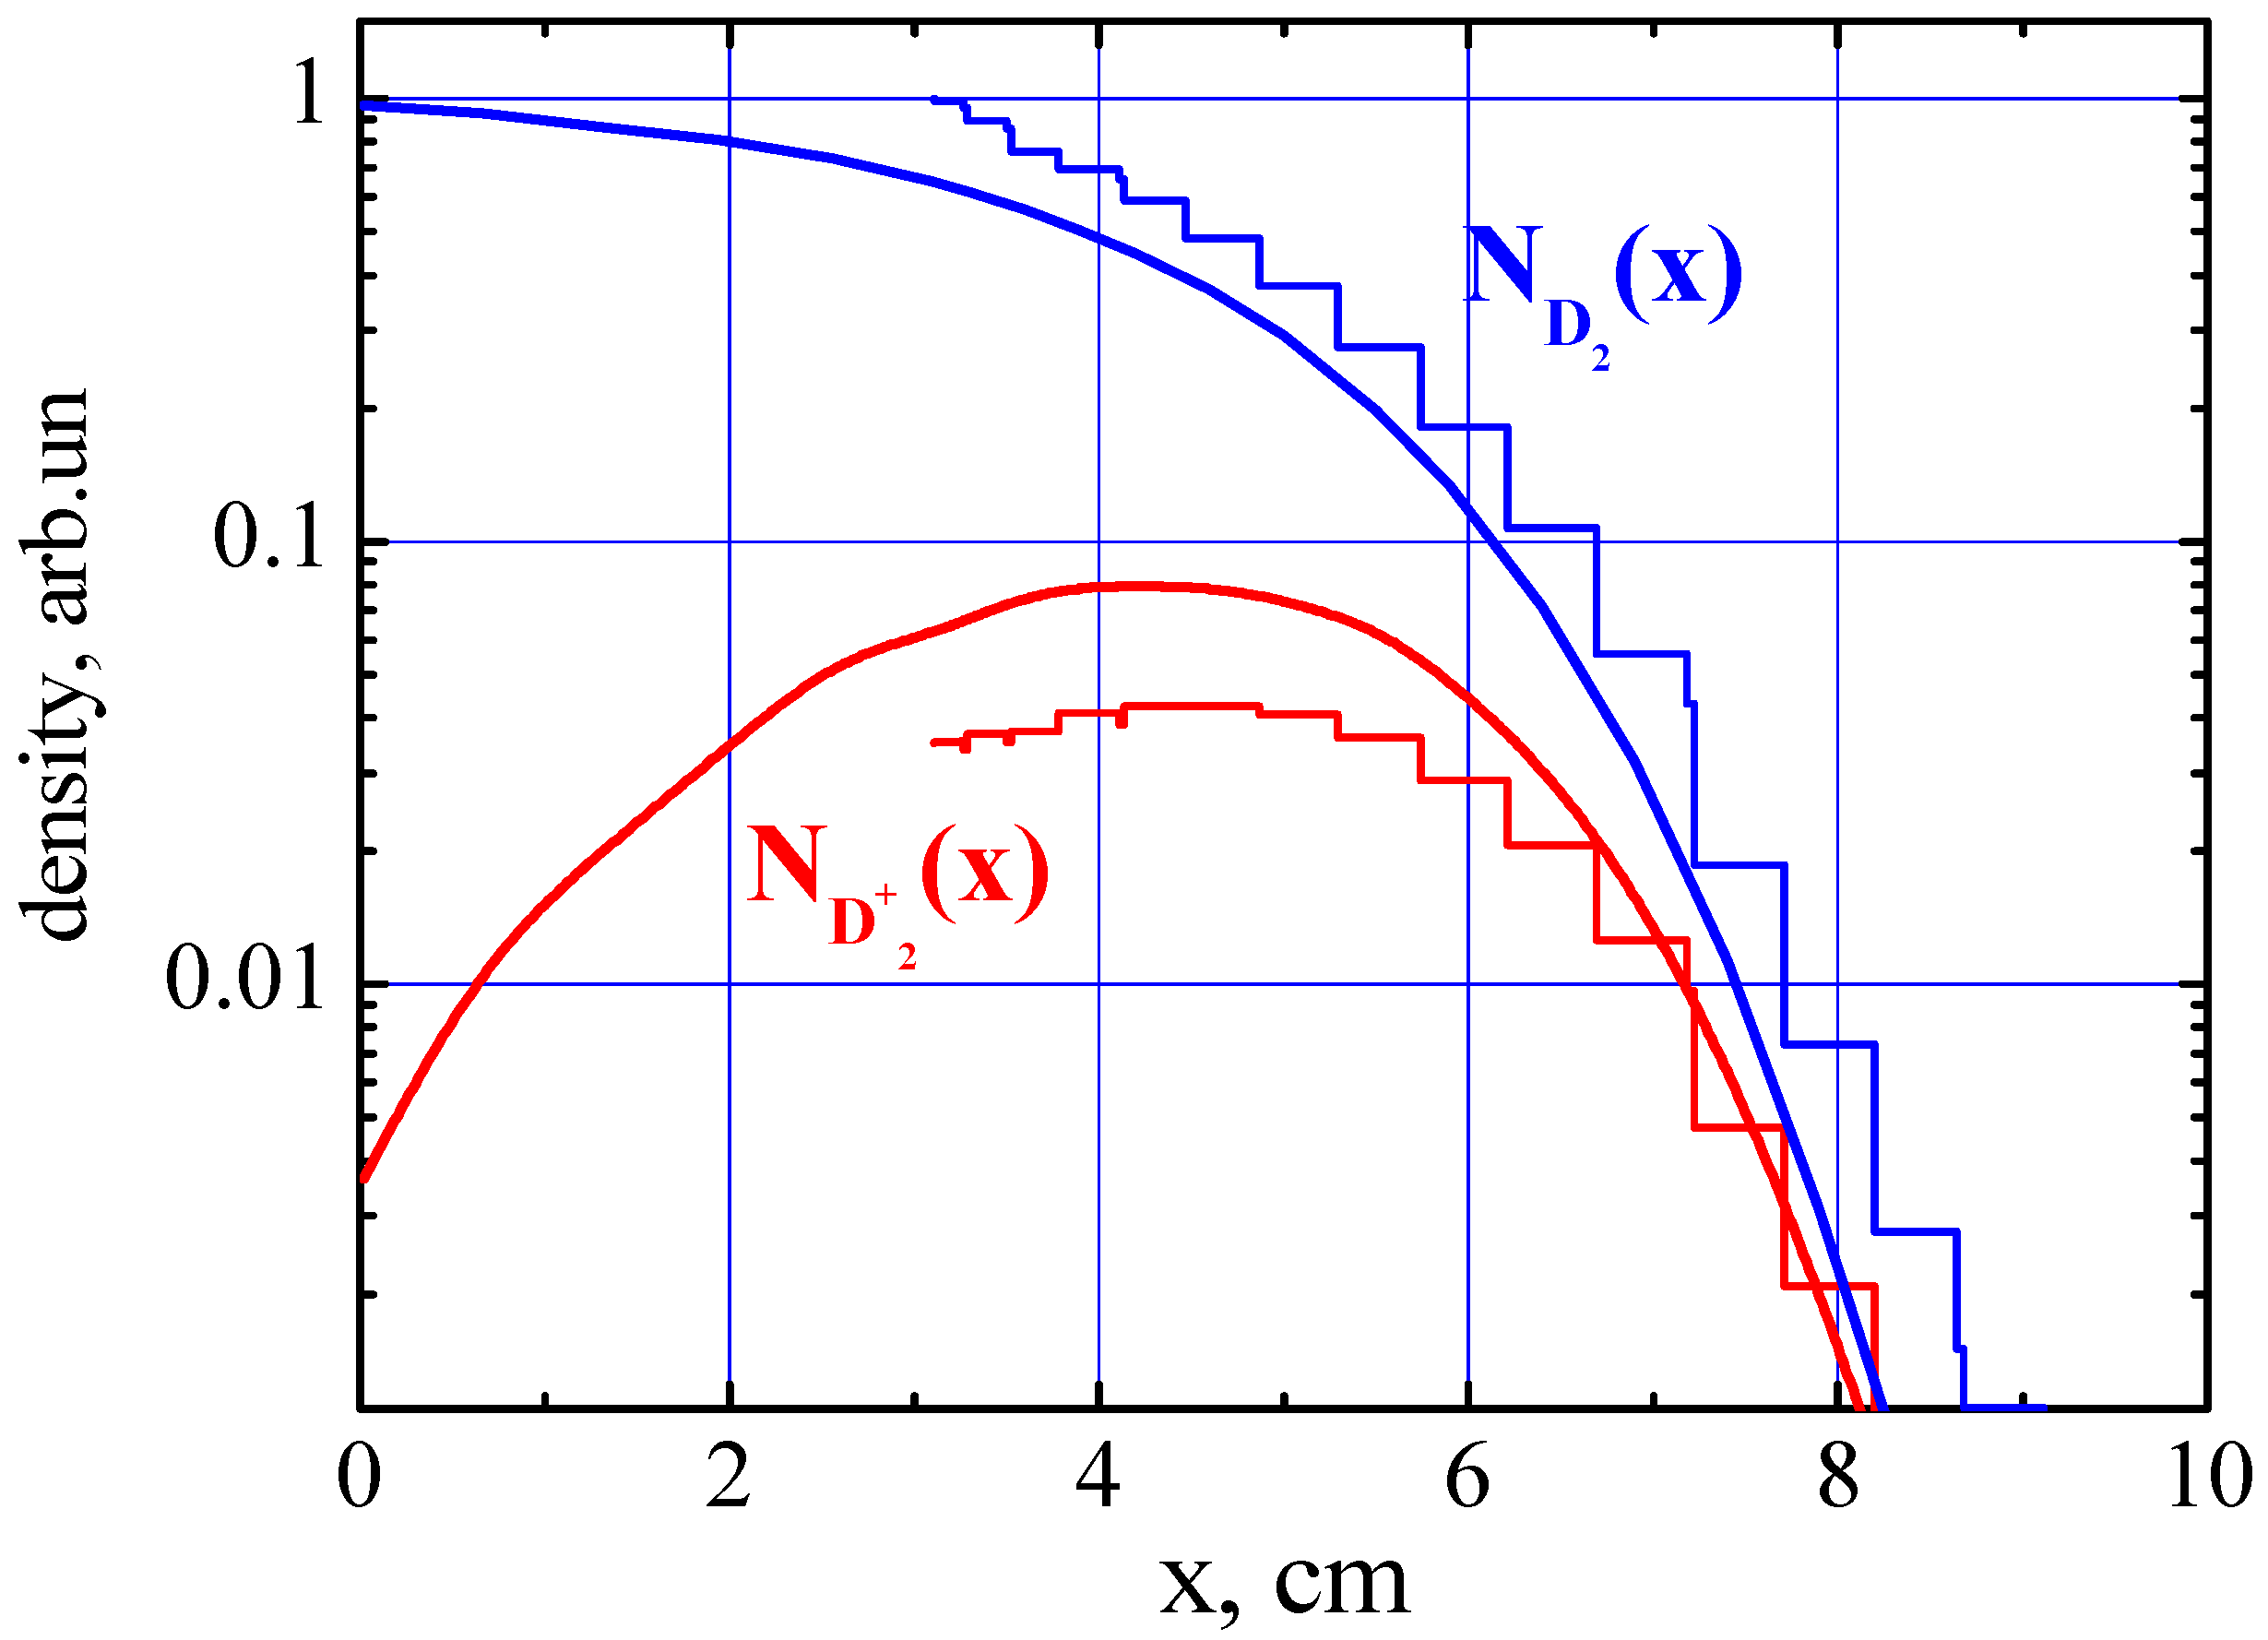
The initial source of fluxes in the ballistic model are molecules and molecular ions of deuterium. A comparison of these calculations with those performed with Monte-Carlo EIRENE code is shown in
Figure 3. One can see a good agreement between the functions of molecular sources computed with foregoing two methods. This encourages us towards making further comparisons of the data computed with developed ballistic model and the EIRENE code numerical simulations.
Figure 3.
Comparison of space profiles of molecules and molecular ions of deuterium for the outer part of horizontal chord. Solid line—ballistic model, histogram (stepped line)—EIRENE code simulations.
Figure 3.
Comparison of space profiles of molecules and molecular ions of deuterium for the outer part of horizontal chord. Solid line—ballistic model, histogram (stepped line)—EIRENE code simulations.
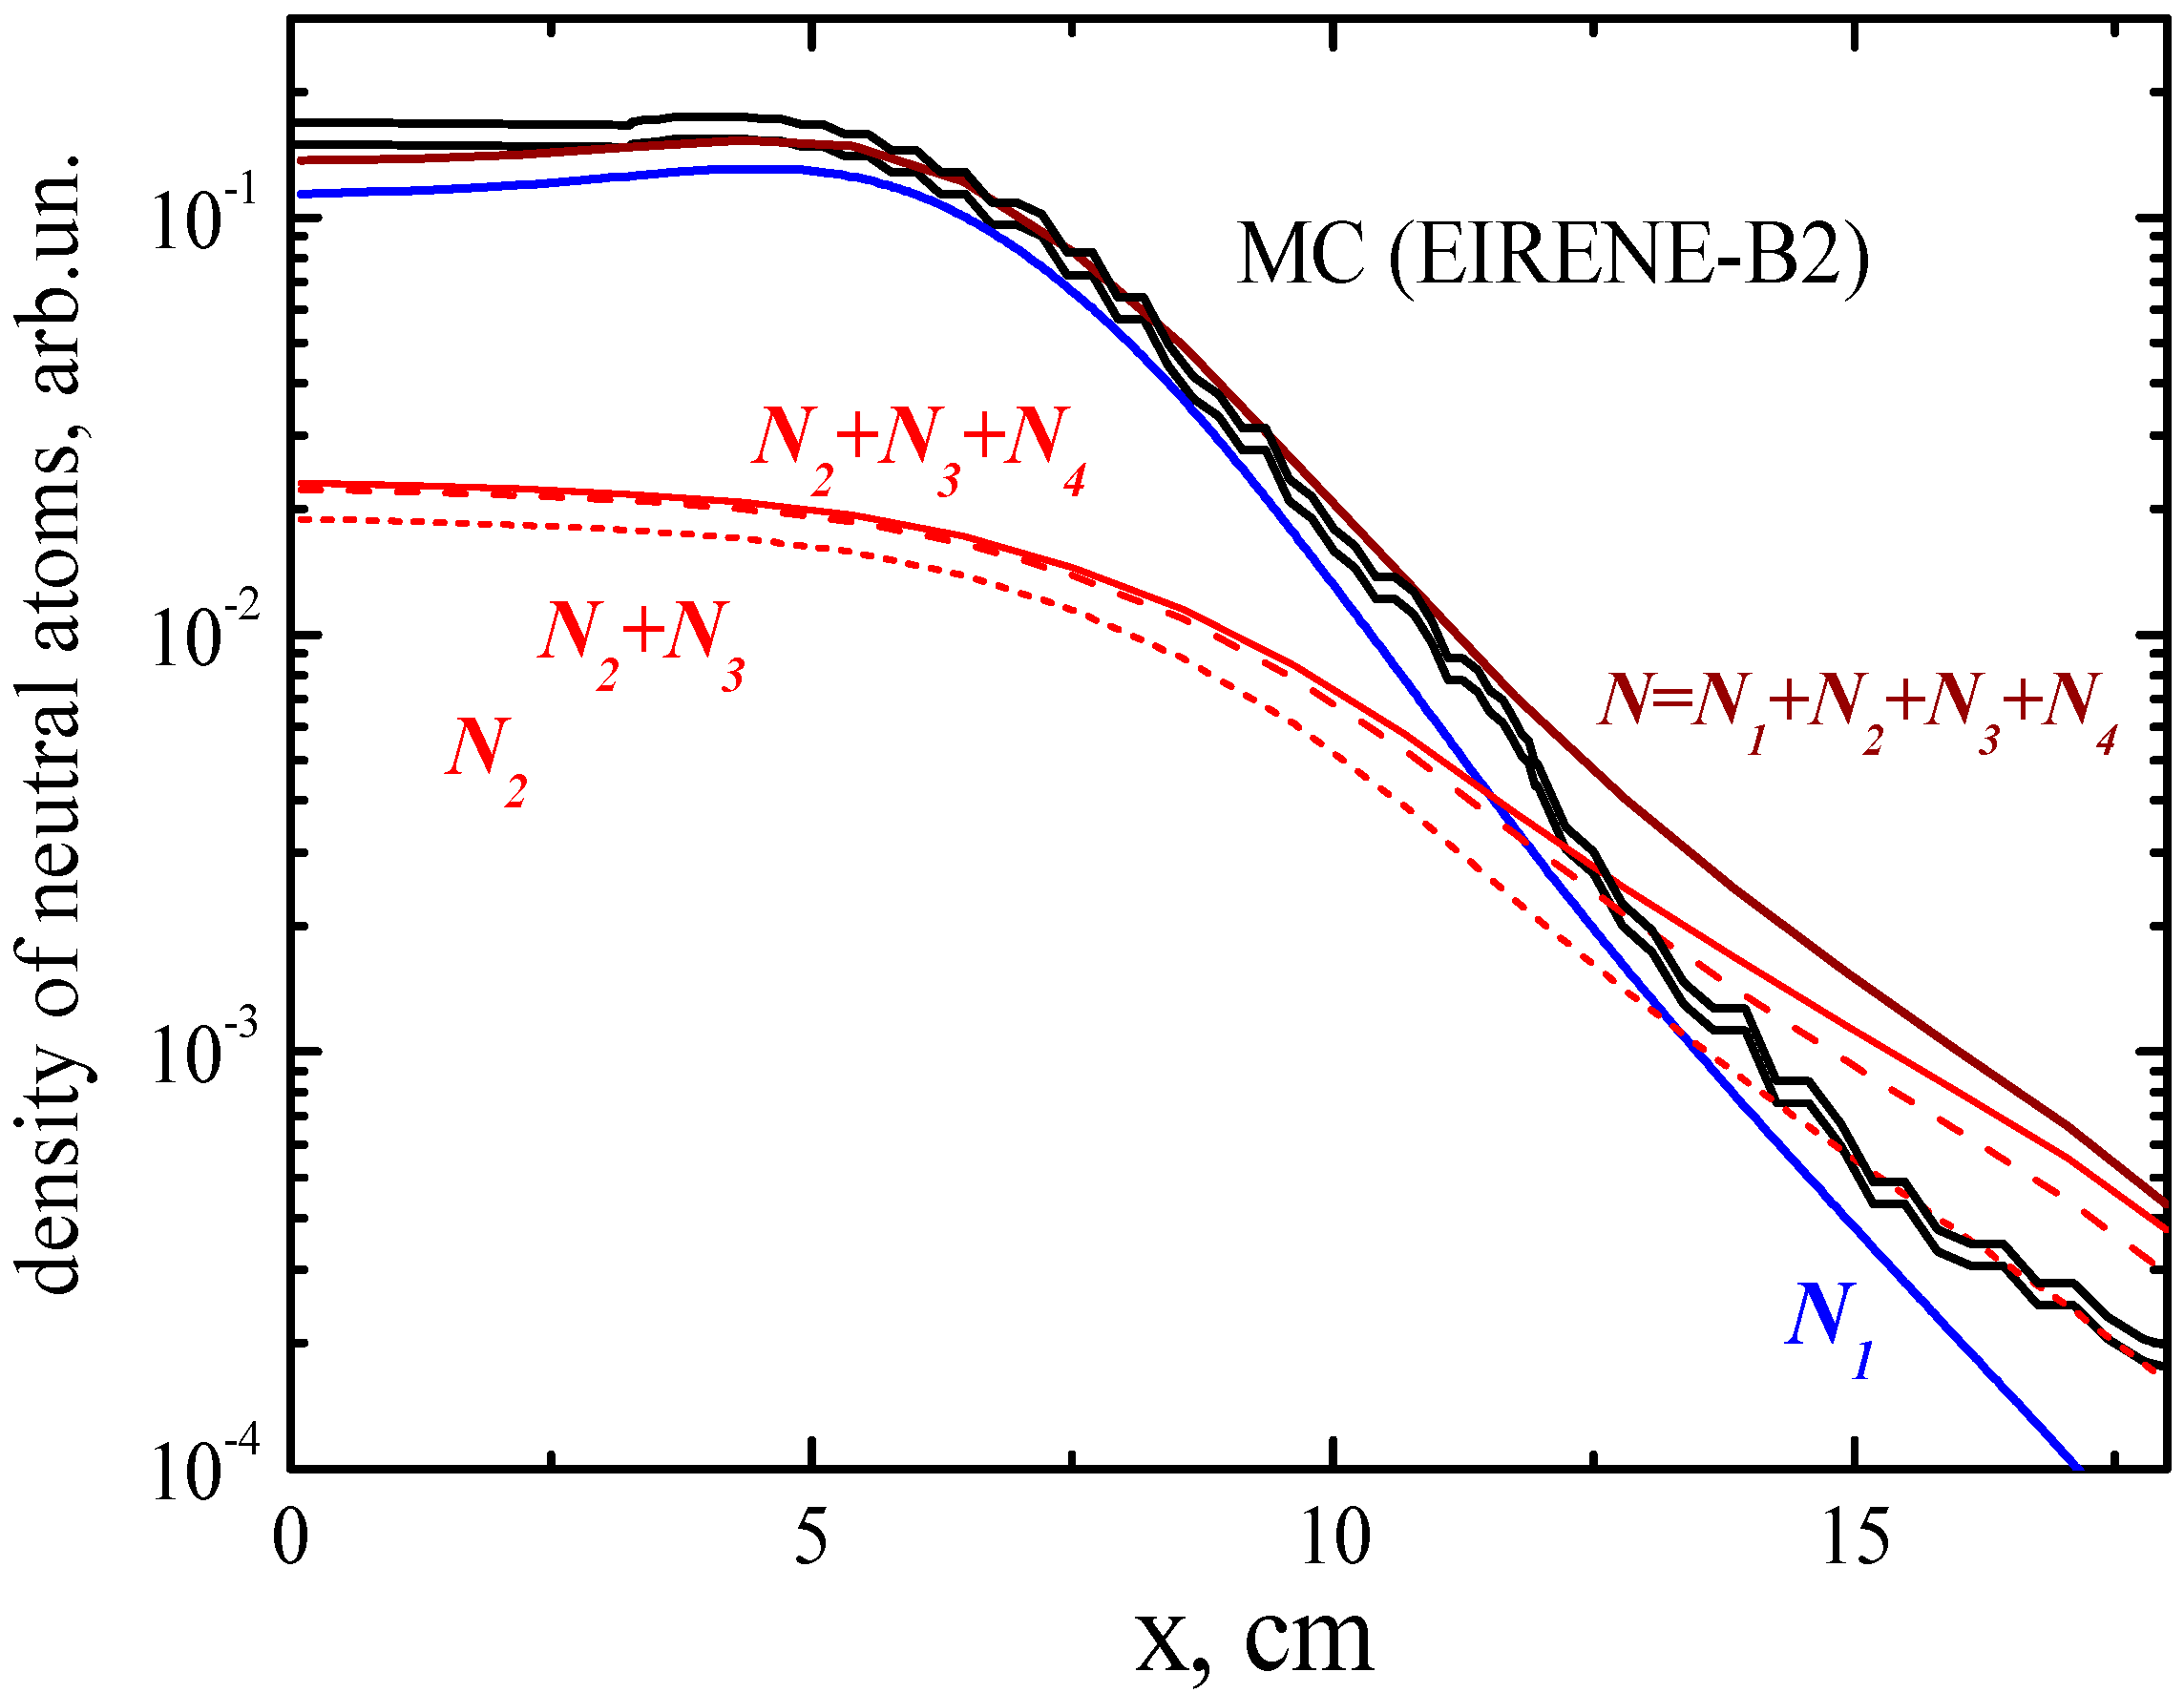
Figure 4 shows the impact of the initial neutral flux from the wall
N1 and the impacts of fluxes of various generations of neutrals in the ground state
N2,
N3,
N4. One can see a good agreement between the Monte-Carlo EIRENE code simulations data and those from the ballistic model.
Figure 4.
Comparison of space profiles of molecules and molecular ions of deuterium for the outer part of horizontal chord. Solid line—ballistic model, histogram (stepped line)—EIRENE code simulations.
Figure 4.
Comparison of space profiles of molecules and molecular ions of deuterium for the outer part of horizontal chord. Solid line—ballistic model, histogram (stepped line)—EIRENE code simulations.
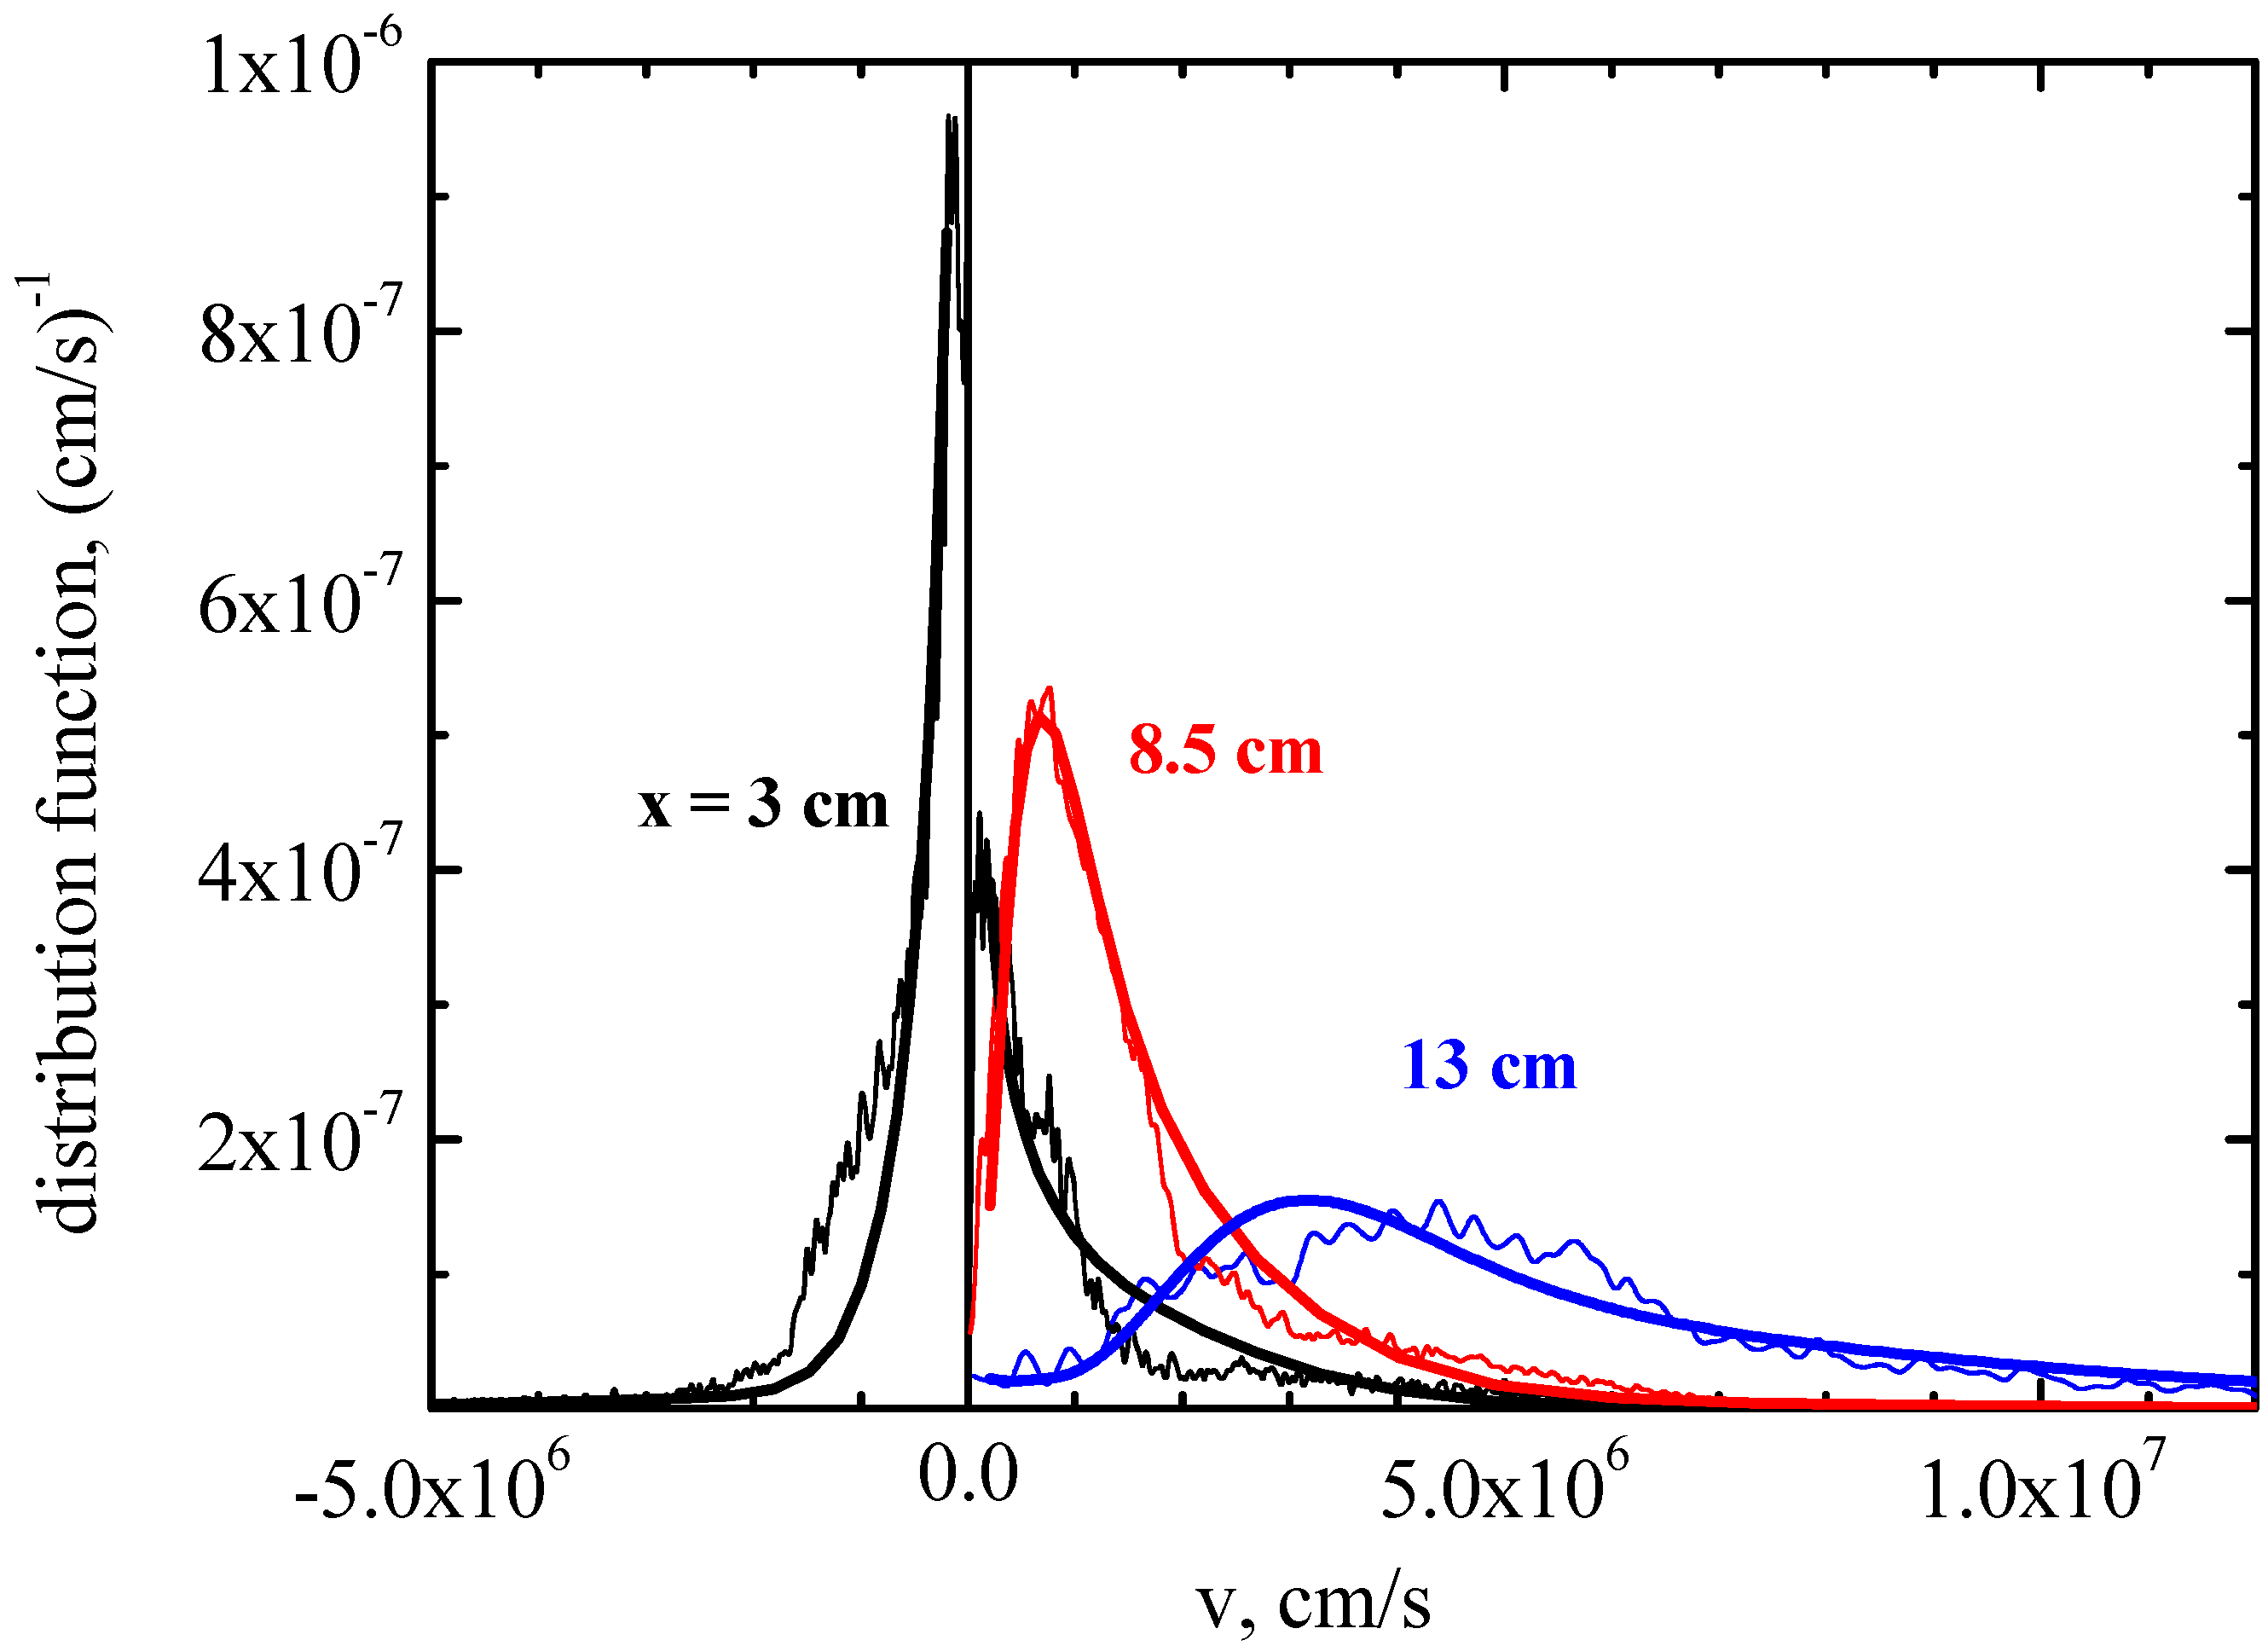
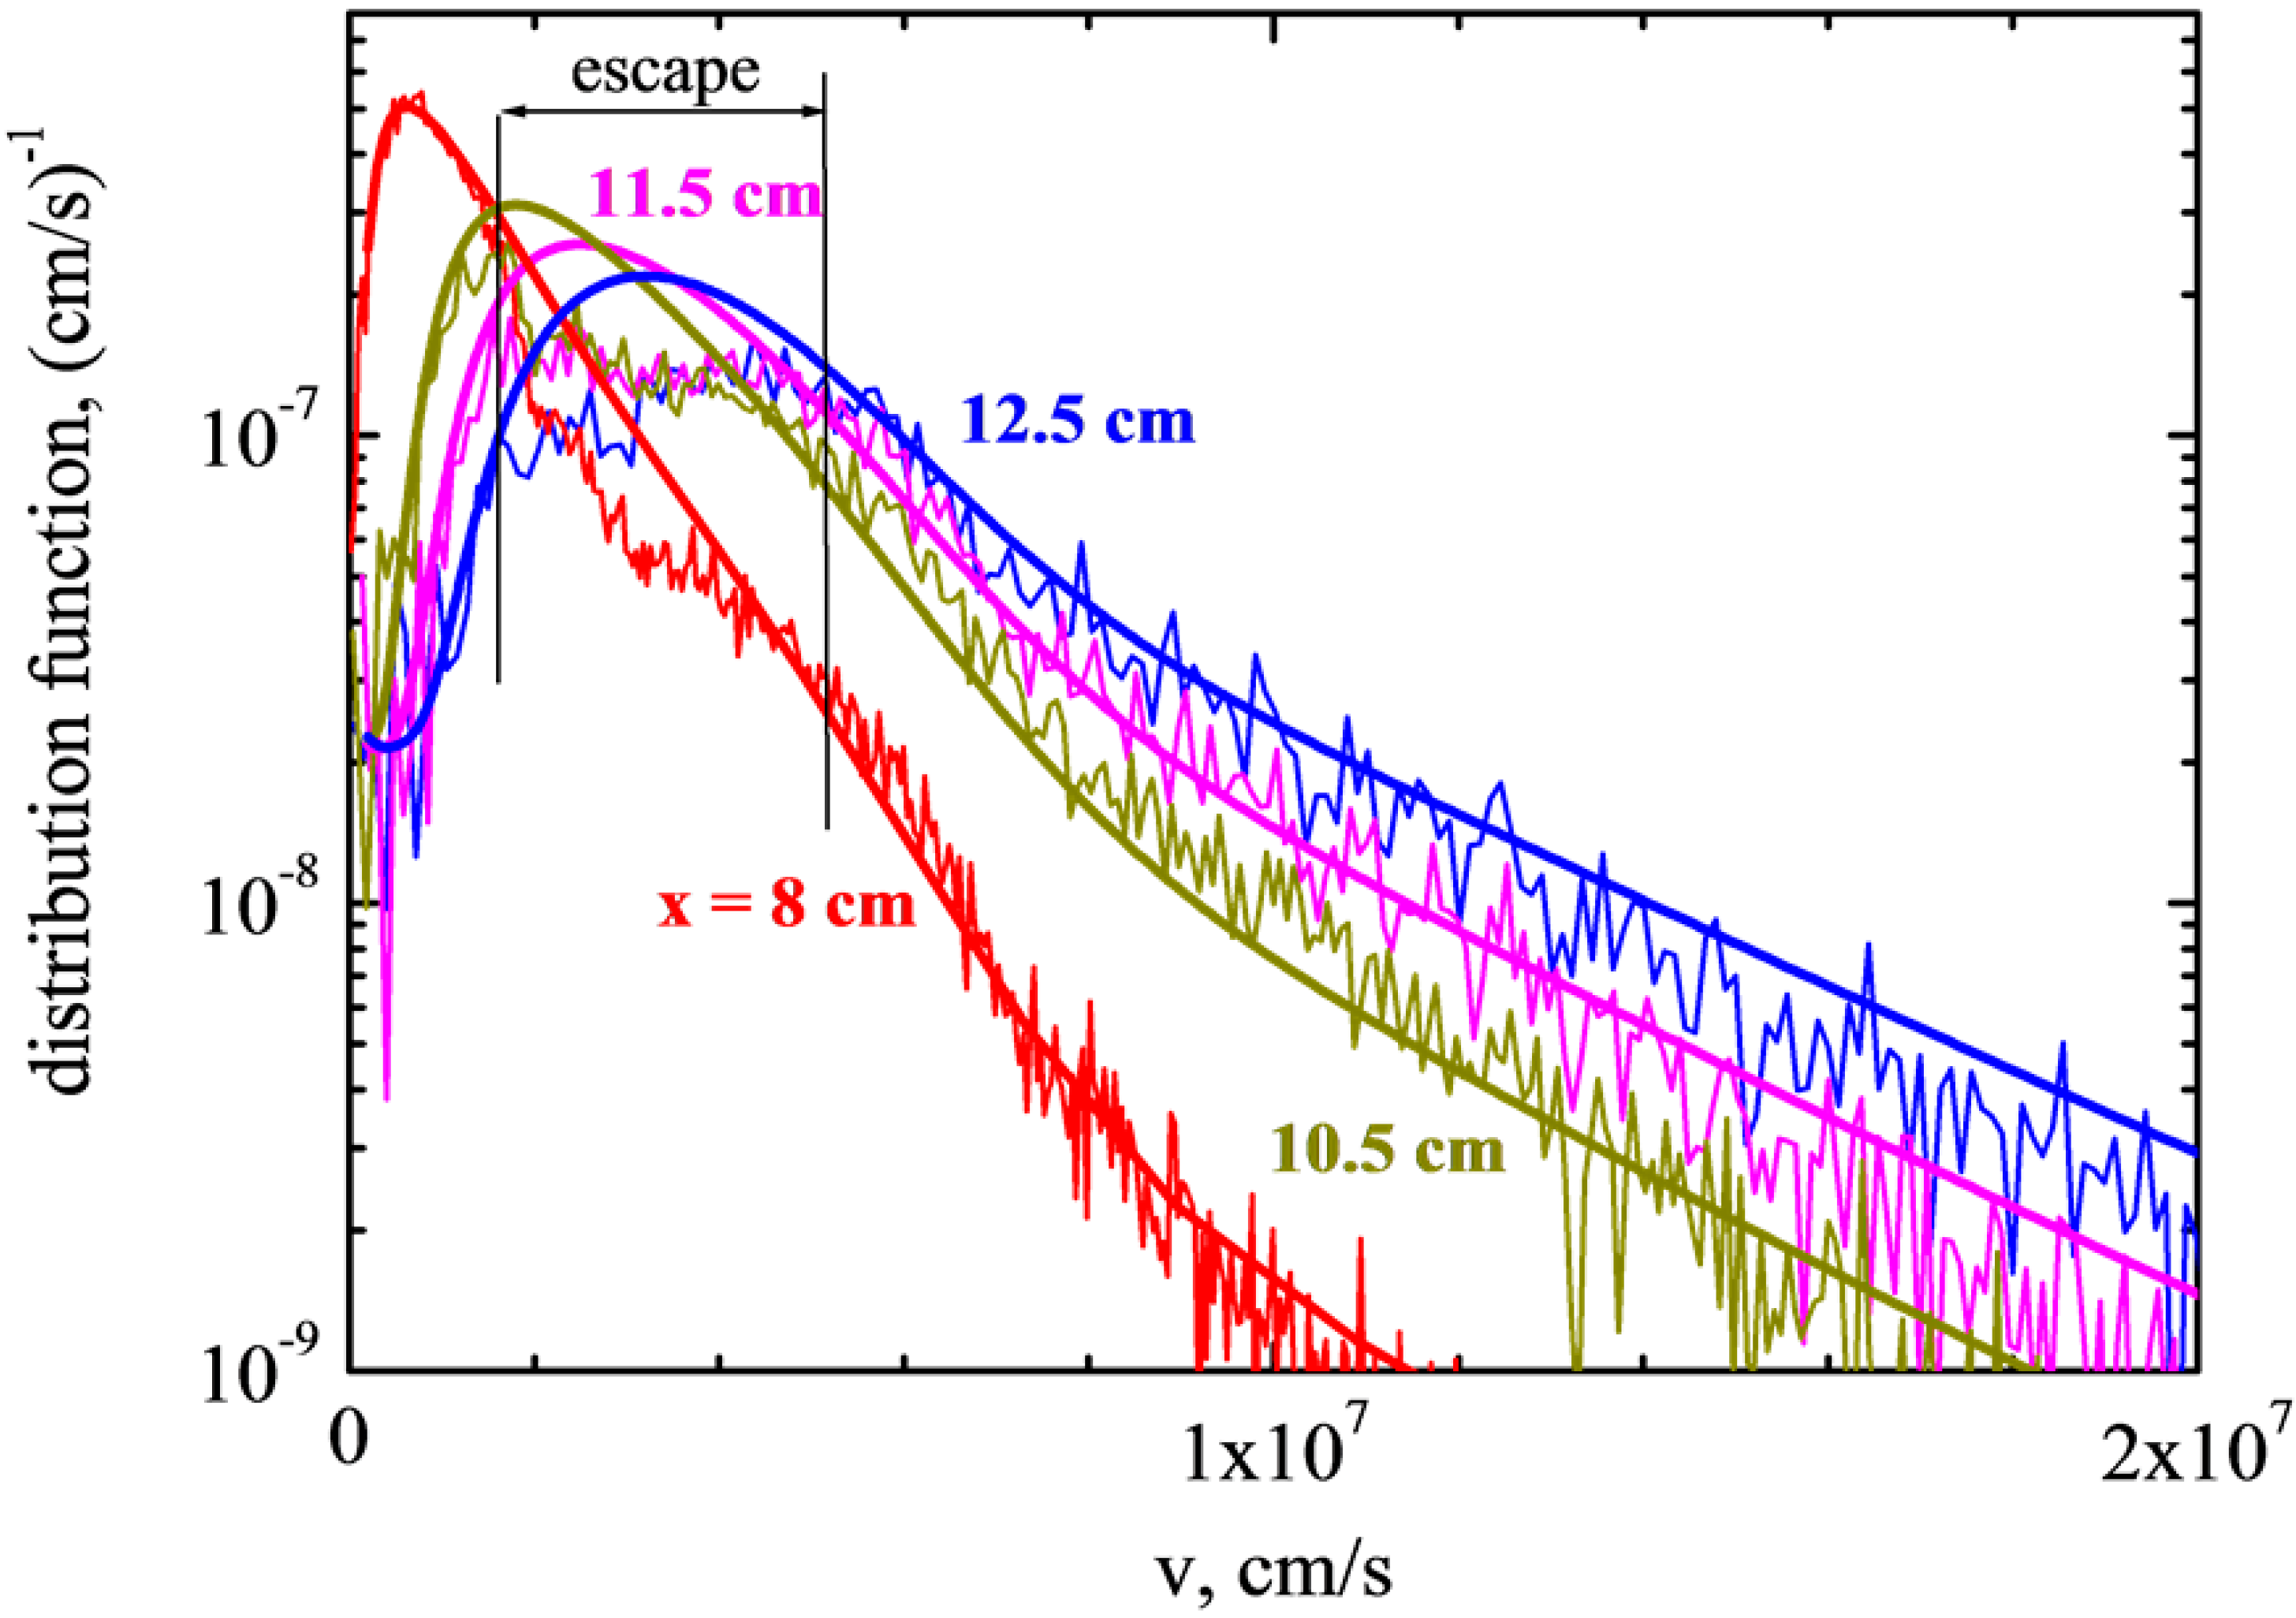
Figure 5 and
Figure 6 show the velocity distribution function of neutral deuterium atoms along the distance from the wall computed with ballistic model as compared with the EIRENE code simulations data. One can see a good agreement between two models both at relatively small and large distances.
Figure 5.
Atomic velocity distribution function at different distances from the wall at the outer horizontal chord: thick solid lines—ballistic model, thin lines—Monte-Carlo simulations with the EIRENE code.
Figure 5.
Atomic velocity distribution function at different distances from the wall at the outer horizontal chord: thick solid lines—ballistic model, thin lines—Monte-Carlo simulations with the EIRENE code.
The velocity distribution function of neutrals in the edge plasma calculated in the frame of ballistic model is of importance for fast line shape calculations along lines of sights needed for spectral line diagnostics of neutrals in ITER.
Figure 6.
Atomic velocity distribution function at large distances from the wall at the outer horizontal chord: thick solid lines-ballistic model, thin lines-MC modeling with the EIRENE code.
Figure 6.
Atomic velocity distribution function at large distances from the wall at the outer horizontal chord: thick solid lines-ballistic model, thin lines-MC modeling with the EIRENE code.
5. The Charge Exchange from the Excited Atomic States
The calculation scheme of the charge-exchange impact may be reduced as follows. The initial source of atoms population is the excitation of ballistic neutrals of the first generation by an electron impact. In order to take into account the population of atomic levels of these neutrals by the charge exchange we add the charge exchange contribution to the ionization rates that allows for electron transfer from a given excited atomic level to the atomic levels of a plasma ion. We can neglect the inverse process since the neutral density is sufficiently smaller than that of the ambient plasma ions. Then the population of the atomic levels of the first-generation atoms with account of the charge exchange is decreased as compared with those without the charge exchange.
where
K takes into account a decrease of the population of atomic levels of ballistic (non-Maxwellian) atoms due to the charge exchange.
The local populations of atoms, which arise from the charge exchange of the ballistic atoms on ions are calculated in the frame of the radiative-collisional model. The source of atomic levels population is the charge exchange from the levels of ballistic atoms. Thus, the local population takes the form:
The sum of Populations (2) and (3) remains constant and equals to the population without charge exchange in the excited states because it is determined only by the processes of collision with electrons and radiative decay. The charge exchange process results only in a redistribution of populations between the ballistic (non-Maxwellian) atoms and the “local” (Maxwellian) ones.
In the calculations of radiation spectra it should be remembered that the ballistic emitting atoms and the plasma ones have different velocity distribution functions. The velocity distribution function of the ballistic atoms is determined by their motion from the wall, while that of the “local” atoms is determined by ion temperature in a given point.
The population redistribution coefficient
K(
n,
Te,
Ne) depends on the principal quantum number of the atomic level as well as the temperature and density of the ambient plasma. The values of
K for the atomic levels with principal quantum numbers
n = 3 and
n = 4 for typical plasma conditions in the SOL in ITER are presented in
Table 1 and
Table 2.
Table 1.
The population redistribution coefficient K(n, Te, Ne) for the hydrogen atomic level n = 3 for various plasma temperatures and densities.
Table 1.
The population redistribution coefficient K(n, Te, Ne) for the hydrogen atomic level n = 3 for various plasma temperatures and densities.
| Te, eV\Ne, m−3 | 1018 | 3 × 10¹⁸ | 1019 | 1020 | 1021 |
|---|
| 20 | 0.04163 | 0.08648 | 0.1675 | 0.319 | 0.4185 |
| 50 | 0.0442 | 0.09318 | 0.1862 | 0.3746 | 0.491 |
| 100 | 0.04588 | 0.09774 | 0.1991 | 0.4185 | 0.5477 |
| 200 | 0.0473 | 0.1018 | 0.2106 | 0.4622 | 0.6036 |
Table 2.
The population redistribution coefficient K(n, Te, Ne) for the hydrogen atomic level n = 4 for various plasma temperatures and densities.
Table 2.
The population redistribution coefficient K(n, Te, Ne) for the hydrogen atomic level n = 4 for various plasma temperatures and densities.
| Te, eV\Ne, m−3 | 1018 | 3 × 10¹⁸ | 1019 | 1020 | 1021 |
|---|
| 20 | 0.1861 | 0.2824 | 0.3735 | 0.4972 | 0.5723 |
| 50 | 0.2046 | 0.3219 | 0.4322 | 0.5798 | 0.6602 |
| 100 | 0.2169 | 0.3503 | 0.476 | 0.6398 | 0.7221 |
| 200 | 0.2274 | 0.3764 | 0.518 | 0.6953 | 0.7771 |
One can see that the magnitude of redistribution coefficients is essential especially for the level n = 4 (Balmer-beta line).
6. Radiation Spectra Calculations
Radiation spectra calculations were performed on the basis of population kinetic models described above. The main mechanisms of the spectral line broadening is the Doppler effect. The presence of a strong magnetic field with the field strength of 5T, typical for ITER plasma, is taken into account. In the frame of above approximations the radiation atomic spectra are described by the formula:
where the line shape
JnBAL(∆
ω,
B,
Ti) is calculated with the help of the ballistic atoms velocity distribution function obtained with the ballistic model and appeared to be close to the data of the Monte-Carlo simulations, and the line shape
JnLOC(∆
ω,
B,
Ti) is calculated for a Maxwellian velocity distribution function with the ionic temperature in a given spatial point.
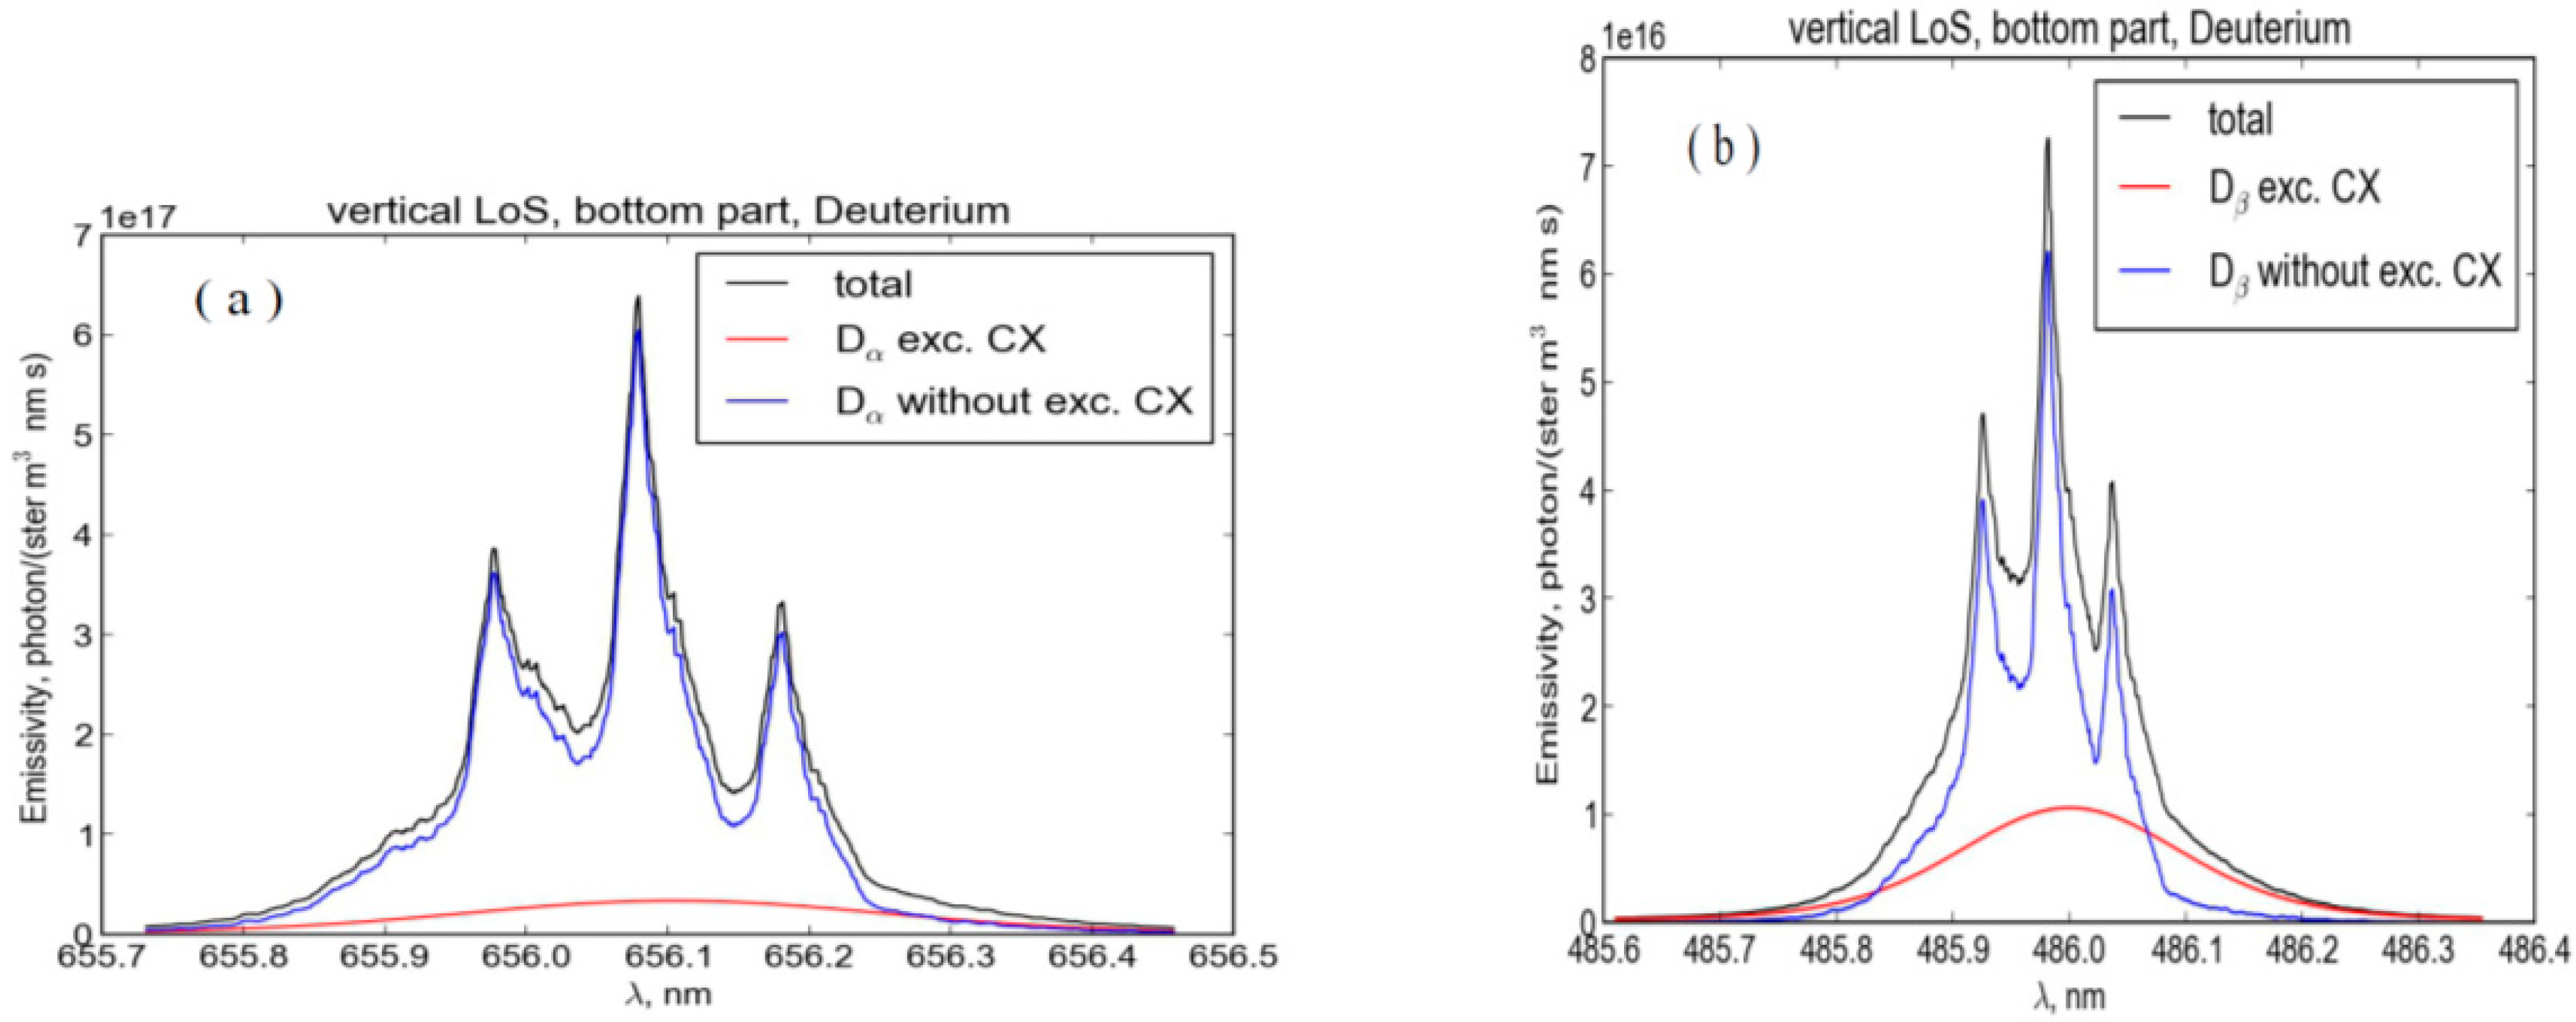
The results for the Balmer-alpha and Balmer-beta line shapes are presented in
Figure 7 and
Figure 8.
Figure 7.
Spectral intensity of Balmer-alpha (a) and Balmer-beta (b) deuterium lines in SOL for the bottom part of vertical observation chord (R = 65.5 cm) for the ITER SOL&divertor case #1514. The red line shows contribution to the radiation from neutrals obtained from charge exchange of neutrals in the exited state n = 3 (for the Balmer-alpha line) and n = 4 (for the Balmer-beta line) on fast ions. Blue lines—from ballistic atoms. Black line is the total spectrum.
Figure 8.
The same as in
Figure 7 but for the top part of vertical observation chord.
Figure 8.
The same as in
Figure 7 but for the top part of vertical observation chord.
7. Conclusions
A new simplified method and numerical code for calculations of neutral atoms penetration into plasma is suggested. The method is based on the ballistic motion of neutrals along the line of sight. As a result, two dimensional distribution functions, dependent on the LoS coordinate and the velocity projection on the LoS, and responsible for the Doppler broadening of the line shape, are calculated.
The interrelation between MC simulation and fast ballistic code is as following: the MC code provides the distributions of main plasma components (electron and ions temperatures and densities, see
Figure 2) whereas the ballistic code provides the fast calculations of much less neutral atomic density distribution together with atomic kinetics and line shapes along LoS.
The distributions on
Figure 3,
Figure 4,
Figure 5 and
Figure 6 are quit satisfactory but still not refine. The reason for discrepancies between Monte-Carlo (MC) and ballistic model (BM) seems to be related to 3D simulation in MC and 1D simulation in BM. Such discrepancies exist in the radiation transport theory between 3D calculations and “forward-back” photons propagation approximation [
8]. Nevertheless the 1D simulation is quit reasonable for determination of photon space distribution [
8] as well as neutral component distribution. So the application of 1D BM seems to be successful on average taking into account the great advantage in calculation time. Some differences of the velocity distribution function is connected with charge exchange collision integral. Really there is a difference between particles moving forward (from the wall) and back (to the wall) after charge exchange in some space point; the first ones meet more hot plasma particles whereas the second ones—more cold. So the charge exchange rates are slightly different for these particles that can be a reason for discrepancy between both types of data on
Figure 5 (for the curve
x = 3 cm) near velocity points ± (1–2) × 10
6 cm/c. The difference between data on
Figure 6 is less important for line shape calculations because of strong decrease in atomic densities with increasing of distance from the wall.
The test calculations of the Balmer spectral line shapes are performed for plasma parameters distributions typical for ITER diagnostic tasks. A comparison of the method with the respective (Monte Carlo) EIRENE code [
1] stand-alone simulations of neutral deuterium velocity distribution function, applied on the SOL&divertor plasma background calculated by the SOLPS4.3 (B2-EIRENE) code [
1,
2,
3,
4], is made to evaluate the accuracy of the ballistic model. The results of the model reproduce numerical data obtained by the EIRENE code with an average accuracy of 10%–20%. The calculation time is smaller by the orders of magnitude as compared with the Monte Carlo simulation one. This makes it possible to apply the code for calculations of background plasma radiation properties of SOL plasma in various regimes of ITER operation.
Acknowledgments
This work was partially supported by the grant No. 3328.2014.2 of President of Russian Federation for Leading Scientific Schools. The authors thank K.Yu. Vukolov and A.G. Alekseev for stimulating discussions and support, A.S. Kukushkin, for providing the ITER SOL&divertor background plasma data, and A.B. Kukushkin, for helpful discussions.
Author Contributions
Valery S. Lisitsa—development of models, analytical calculations of ballistic model, writing of manuscript.
Mikhail B. Kadomtsev—development of models, analytical calculations of charge exchange kinetics, writing of manuscript.
Vladislav Kotov—Monte Carlo calculations of neutral space and velocity distribution functions.
Vladislav S. Neverov—numerical calculations of hydrogen line shapes along SoL in ITER.
Vladimir A. Shurygin—numerical calculations of neutral space and velocity distribution functions in ballistic model.
Conflicts of Interest
The authors declare no conflict of interest.
References
- Reiter, D.; Baelmans, M.; Boerner, P. The EIRENE and B2-EIRENE Codes. Fusion Sci. Tech. 2005, 47, 172–186. [Google Scholar]
- Braams, B.J. Computational studies in tokamak equilibrium and transport. Ph.D. Thesis, Utrecht University, Netherlands, 1986. [Google Scholar]
- Kukushkin, A.S.; Pacher, H.D.; Loarte, A.; Komarov, V.; Merola, M.; Pache, G.W.; Reiter, D. Analysis of performance of the optimized divertor in ITER. Nucl. Fusion 2009, 49, 075008. [Google Scholar] [CrossRef]
- Kotov, V.; Reiter, D.; Kukushkin, A.S. Numerical Study of the ITER Divertor Plasma with B2-EIRENE Code Package. Available online: http://www.eirene.de/kotov_solps42_report.pdf (accessed on 13 May 2014).
- Kadomtsev, M.B.; Kotov, V.; Lisitsa, V.S.; Shurygin, V.A. Ballistic model for neutral hydrogen distribution in ITER edge plasma. In Proceedings of the 39th EPS Conference on Plasma Physics & 16th International Congress on Plasma Physics, Stockholm, Sweden, 2–6 July 2012; p. 4.093.
- Kadomtsev, M.B.; Kotov, V.; Lisitsa, V.S.; Shurygin, V.A. Shurygin. Kinetics of hydrogen atom radiation emission of the SOL plasma in ITER. In Proceedings of the 40th EPS Conference on Plasma Physics, Espoo, Finland, 1–5 July 2013; p. 1.135.
- Kukushkin, A.B.; Lisitsa, V.S.; Kadomtsev, M.B.; Levashova, M.G.; Neverov, V.S.; Shurygin, V.A.; Kotov, V.; Kukushkin, A.S.; Lisgo, S.; Alekseev, A.G.; et al. Theoretical issues of high resolution H-α spectroscopy measurements in ITER. In Proceedings of the 24th IAEA Fusion Energy Conference, San Diego, CA, USA, 8–13 October 2012.
- Biberman, L.M.; Vorob’ev, V.S.; Yakubov, I.T. Kinetics of Nonequilibrium Low Temperature Plasmas; Consultants Bureau: New York, NY, USA, 1987. [Google Scholar]
© 2014 by the authors; licensee MDPI, Basel, Switzerland. This article is an open access article distributed under the terms and conditions of the Creative Commons Attribution license (http://creativecommons.org/licenses/by/3.0/).


 ) processes.


