Untargeted Metabolomics Analysis of Eggplant (Solanum melongena L.) Fruit and Its Correlation to Fruit Morphologies


1
Department of Agronomy and Horticulture, Bogor Agricultural University, Jl. Meranti, IPB Dramaga Campus Bogor, West Java 16680, Indonesia
2
Center for Tropical Horticulture Studies, Bogor Agricultural University, Bogor 16680, Indonesia
3
Department of Biotechnology, Graduate School of Engineering, Osaka University, 2-1 Yamadaoka, Suita, Osaka 565-0871, Japan
4
Microbiology Division, Institute of Biological Sciences, University of the Philippines Los Baños, Los Baños, Laguna 4031, Philippines
*
Author to whom correspondence should be addressed.
Metabolites 2018, 8(3), 49; https://doi.org/10.3390/metabo8030049
Submission received: 11 July 2018
/
Revised: 27 August 2018
/
Accepted: 29 August 2018
/
Published: 1 September 2018
(This article belongs to the Special Issue Mass Spectrometry-Based Metabolomics and Its Applications)
Abstract
:Eggplant is one of the most widely cultivated vegetables in the world and has high biodiversity in terms of fruit shape, size, and color. Therefore, fruit morphology and nutrient content become important considerations for both consumers and breeders who develop new eggplant-based products. To gain insight on the diversity of eggplant metabolites, twenty-one eggplant accessions were analyzed by untargeted metabolomics using GC-MS and LC-MS. The dataset of eggplant fruit morphologies, and metabolites specific to different eggplant fruit accessions were used for correlation analysis. Untargeted metabolomics analysis using LC-MS and GC-MS was able to detect 136 and 207 peaks, respectively. Fifty-one (51) metabolites from the LC-MS analysis and 207 metabolites from the GC-MS analysis were putatively identified, which included alkaloids, terpenes, terpenoids, fatty acids, and flavonoids. Spearman correlation analysis revealed that 14 fruit morphologies were correlated with several metabolites. This information will be very useful for the development of strategies for eggplant breeding.
1. Introduction
Eggplant (Solanum melongena L.) is one of the most widely grown vegetables in the world [1,2], ranking sixth in global vegetable production. Eggplants are mainly grown for their fruits, with only a few cases reporting the use of eggplant leaves as herb or for medicinal uses [1]. China has the highest eggplant production in the world with 22 million tons, ca. 62% of the total world production [3]. Eggplant is one of the most common ingredients in Indonesian cuisine and Indonesian people consume local eggplants of different shapes, colors, and patterns. Thus, in this region, different fruit morphology characteristics are considered major factors when assessing the quality of eggplants. These include several morphological characteristics such as color, shape, size, uniformity, shelf-life, and nutrient content.
Nutrient content is an important consideration when choosing the type of eggplant fruit to cultivate. In addition, eggplants are found to contain high levels of antioxidant compounds, as well as phenolic and flavonoid compounds [4]. To explore the diversity of eggplant fruit metabolites, metabolomics—the comprehensive analysis of metabolites in a biological sample at a given time or condition—can be used [5]. Such metabolite profiling can be done using gas chromatography or liquid chromatography coupled with mass spectrometry (GC-MS or LC-MS). One approach, called untargeted metabolomics analysis, aims to collect as much information as possible from the metabolites contained in biological samples [6]. This approach has been successfully used to determine the metabolite profile of various plants such as tomato, arabidopsis, date, potato, and black cumin [7,8,9,10]. Information on the diverse metabolites of plants is very useful for better understanding of the genotypic or phenotypic differences of plants. In coffee, untargeted metabolomics analysis was used as a preliminary approach to determine the origin of coffee, after which targeted analysis was done to determine the difference in flavor and taste [11]. Furthermore, the usefulness of metabolomics in determining markers for discriminating original “kopi luwak” from adulterated coffee has also been reported [12]. In this research, we analyzed the diversity of metabolites found in different eggplant fruit accessions and their relationship with fruit morphology. This information will be beneficial for the development of strategies for improvement of the eggplant crop in the future.
2. Results
2.1. Untargeted Metabolomics Analysis
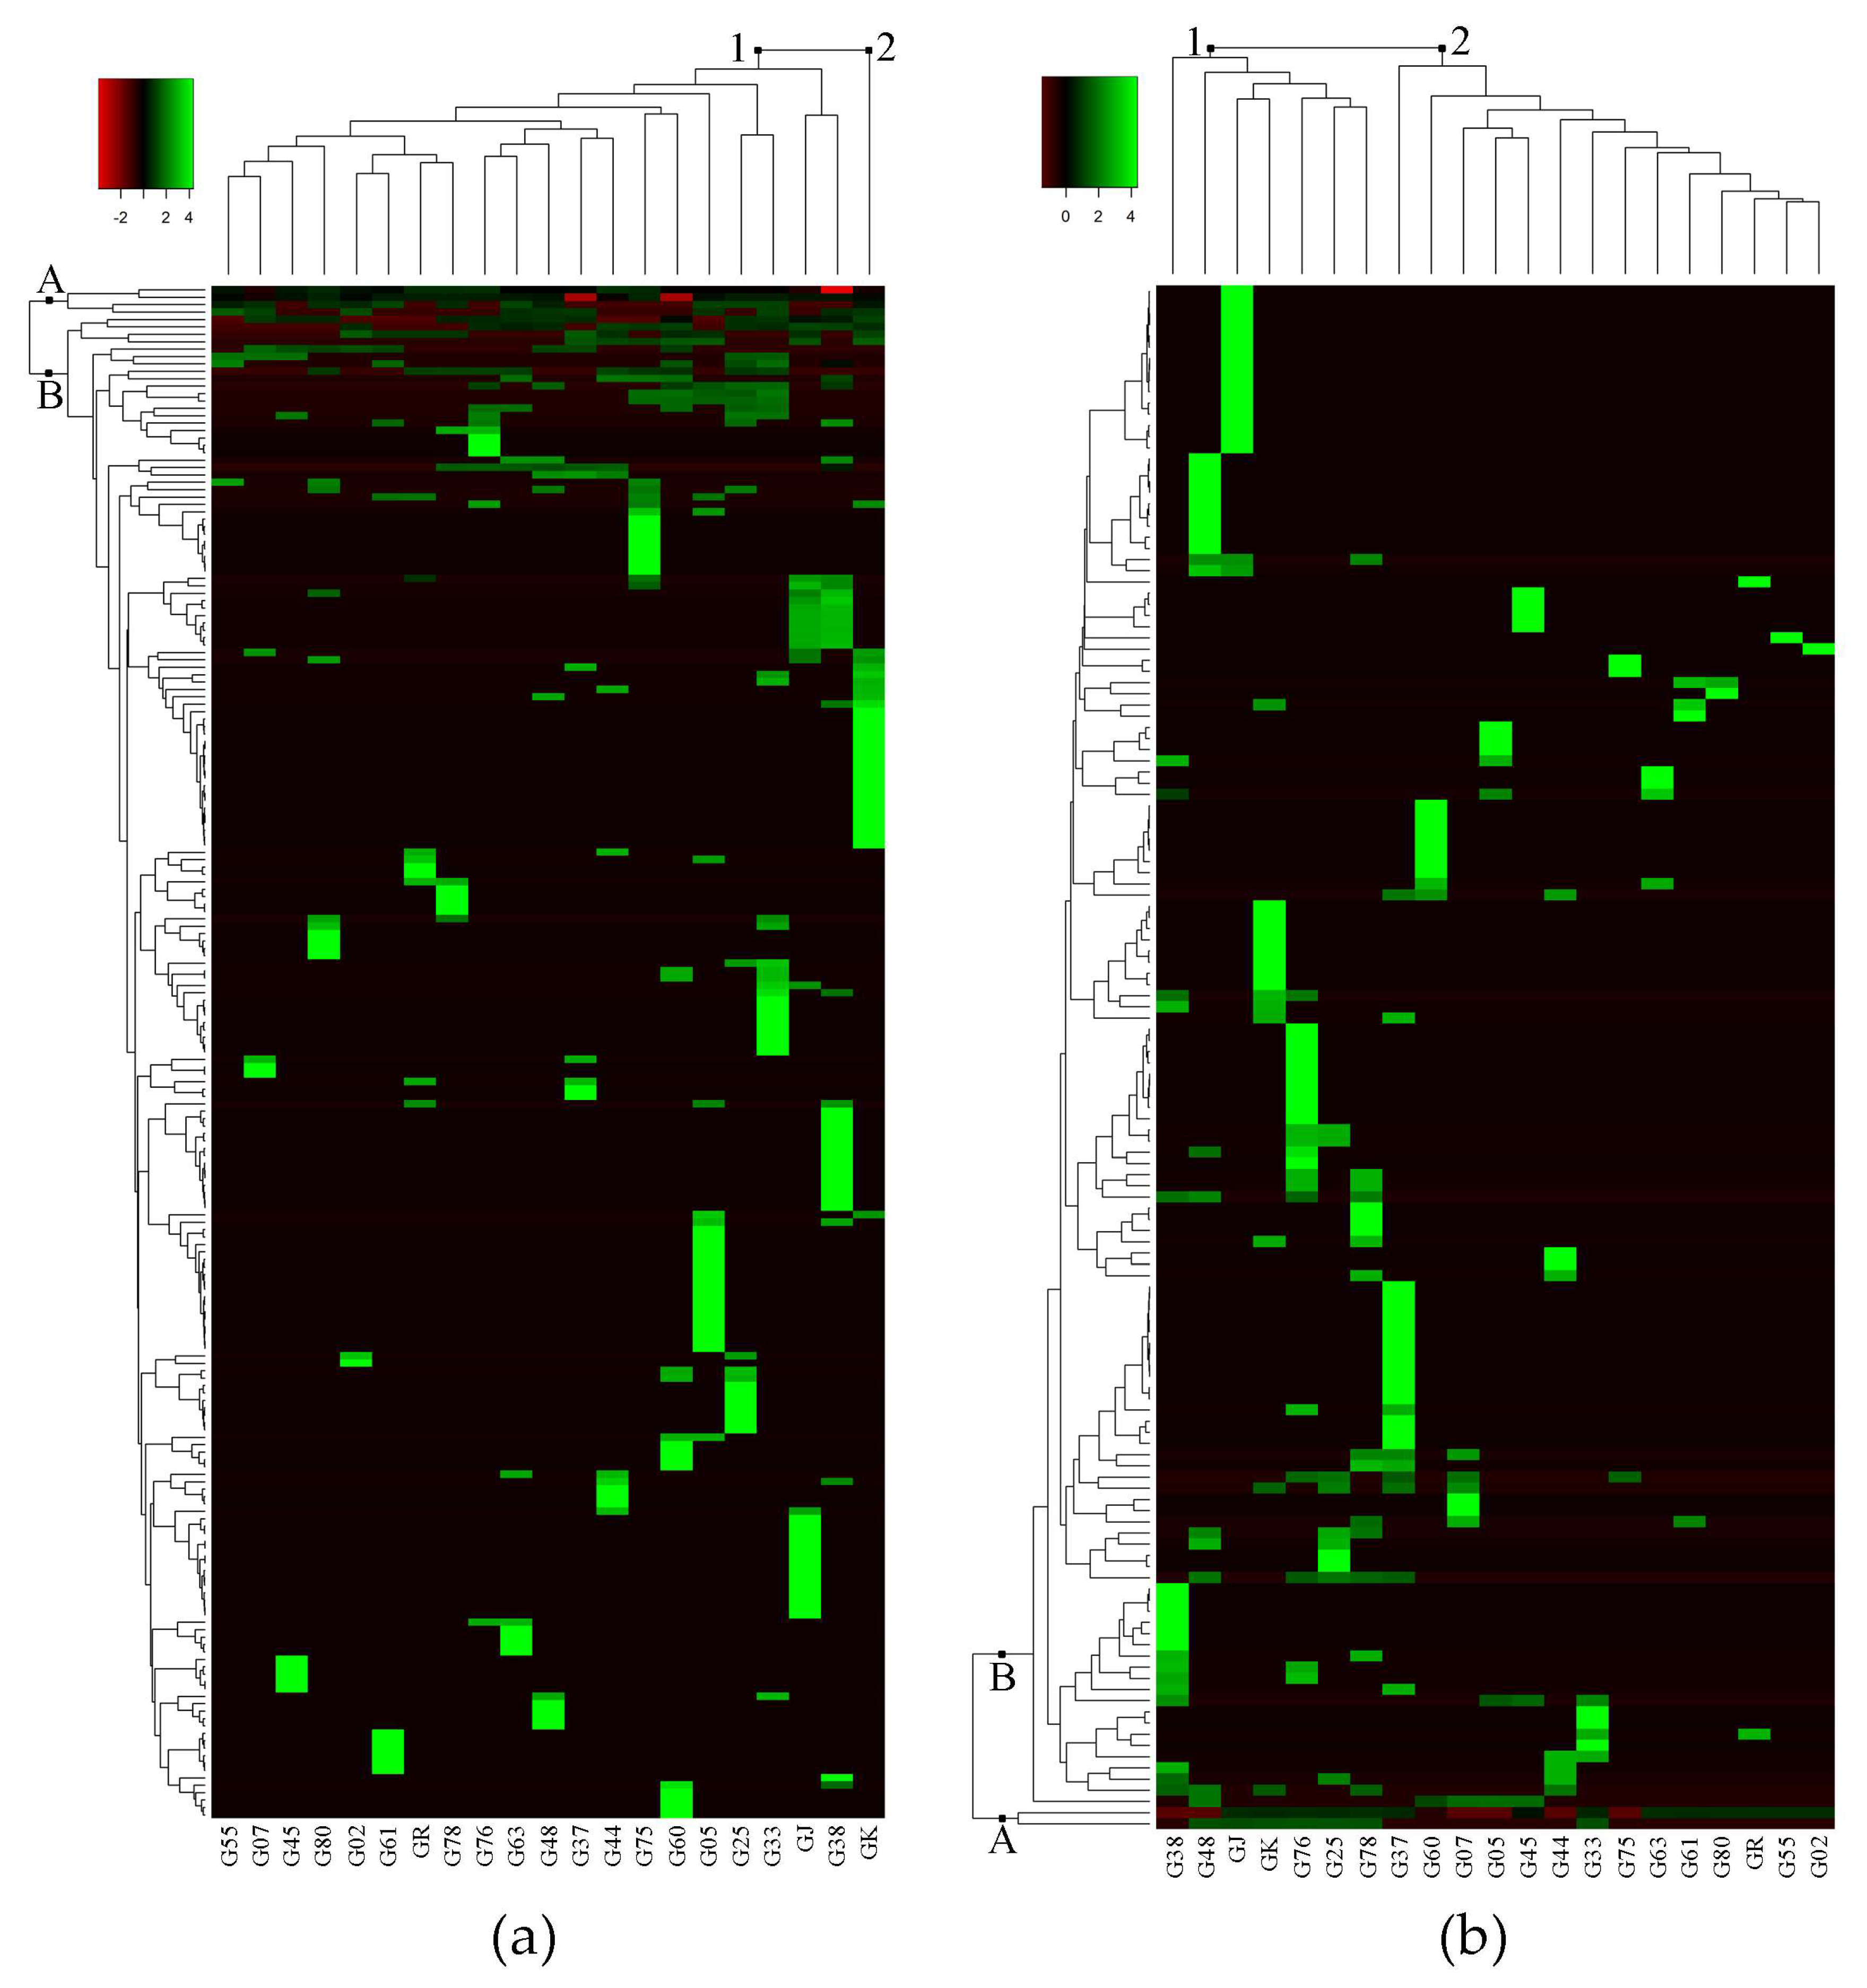
Untargeted metabolomics analysis of eggplant fruit successfully detected 207 metabolite peaks using GC-MS, and 136 metabolite peaks using LC-MS. The log-transformed dataset of peak area percentage (area pct.) was used to construct the heat map and dendrogram (Figure 1). The heat map shows the metabolites that were detected in 21 eggplant accessions. Hierarchical cluster analyses (HCA), using Euclidean distance and complete linkage agglomerative methods, were carried out to measure the similarity of multivariate samples [13] and cluster the metabolomics data, respectively [14]. In the heat map, rows represent each detected metabolite, and columns represent the different eggplant accessions. Large peak areas were colored green, while smaller peak areas were black, and went red as peaks became smaller. Among the detected metabolite peaks from GC-MS and LC-MS analyses, 207 and 51 metabolites were putatively identified using the online metabolite databases MassBank (http://www.massbank.jp/?lang=en) and Plant Metabolic Pathway Databases (https://www.plantcyc.org/) [15,16] (Table 1 and Table 2), respectively. The important metabolites identified in the GC-MS analysis are shown in Table 1, and the complete list is shown in Table S1.
Figure 1a shows the heat map generated from GC-MS analysis. The detected metabolite peaks (in rows) produced two clusters: group A and group B, while eggplant accessions (in columns) also clustered into two groups: group 1 and group 2. Group A in the GC-MS heat map (Figure 1a) consisted of metabolites that were present in most of the eggplant accessions such as linoleic acid, palmitic acid, and neophytadiene (Table 1). Based on GC-MS analysis, the clustering of eggplant accessions showed interesting results in which only GK separated from the rest of the accessions. Group 1 consisted of 20 eggplant accessions while Group 2 consisted of only GK (Figure 1a). Accession-specific metabolites (indicated in green) for GK include linoleic acid, palmitic acid, and neophytadiene. Moreover, GK had the most accession-specific metabolites among all the samples (Table S1). On the other hand, accessions G37, G78 and GR each had a solitary accession-specific metabolite, namely solanesol, cyclododecanone, and (9E,12E)-9,12-octadecadienoyl chloride, respectively (Table 1).
Group A in the LC-MS heat map consisted of two unidentified metabolites, (LmUi 1) and (LmUi 2), which were present in 15 and 7 accessions, respectively. The other group of metabolites, group B, consisted of metabolites that were present in fewer eggplant accessions than group A. For instance, farnesyl acetone and citronellyl formate were found only in G02 and G25, respectively (Table 1). Likewise, L-dopachromate can be found in G37 and G38, cyclopentolate in G76 and G78, and carprofen in G37 (Table 2).
The number of accession-specific metabolites was also the main factor for the clustering of groups in the LC-MS heat map (Figure 1b). As seen on the heat map, group 1, which includes G38, G48, GJ, GK, G76, G25, and G78, had more accession-specific metabolites (indicated in green) than group 2. The specific metabolites for each eggplant accession that have been annotated are shown in Table 2. Fifteen out of 21 accessions have annotated accession-specific metabolites, while six (G02, G25, G33, G44, G75, and G80) have unknowns. Table 2 shows 12 classes of identified metabolites, in which the alkaloid group was the most common metabolite class with 16 metabolites. There are four identified metabolites that can be found in more than two eggplant accessions, namely 2,5-bis(N-hexylmethylsilyl)thiophene, penicillin K, 2-(methylthiomethyl)-3-phenyl-2-propenal, and dimethisterone (Table 2).
2.2. Correlation Analysis of Fruit Metabolites with Fruit Morphology
To gain insight on the relationship between fruit metabolites and morphology, data on the fruit morphology of 21 eggplant accessions were used in the correlation analysis. All eggplant accessions possess metabolites and fruit morphology characteristics that are unique to each accession (Table 3). Specifically, different eggplant accessions have different fruit size, shape, and color, with some also showing unique morphology such as fruit with patches and stripes on the skin (G02, G05, G48), fruit with ribs (G02, G05, G25 and G63), very dark purple fruit (GJ), and yellow fruit (GK).
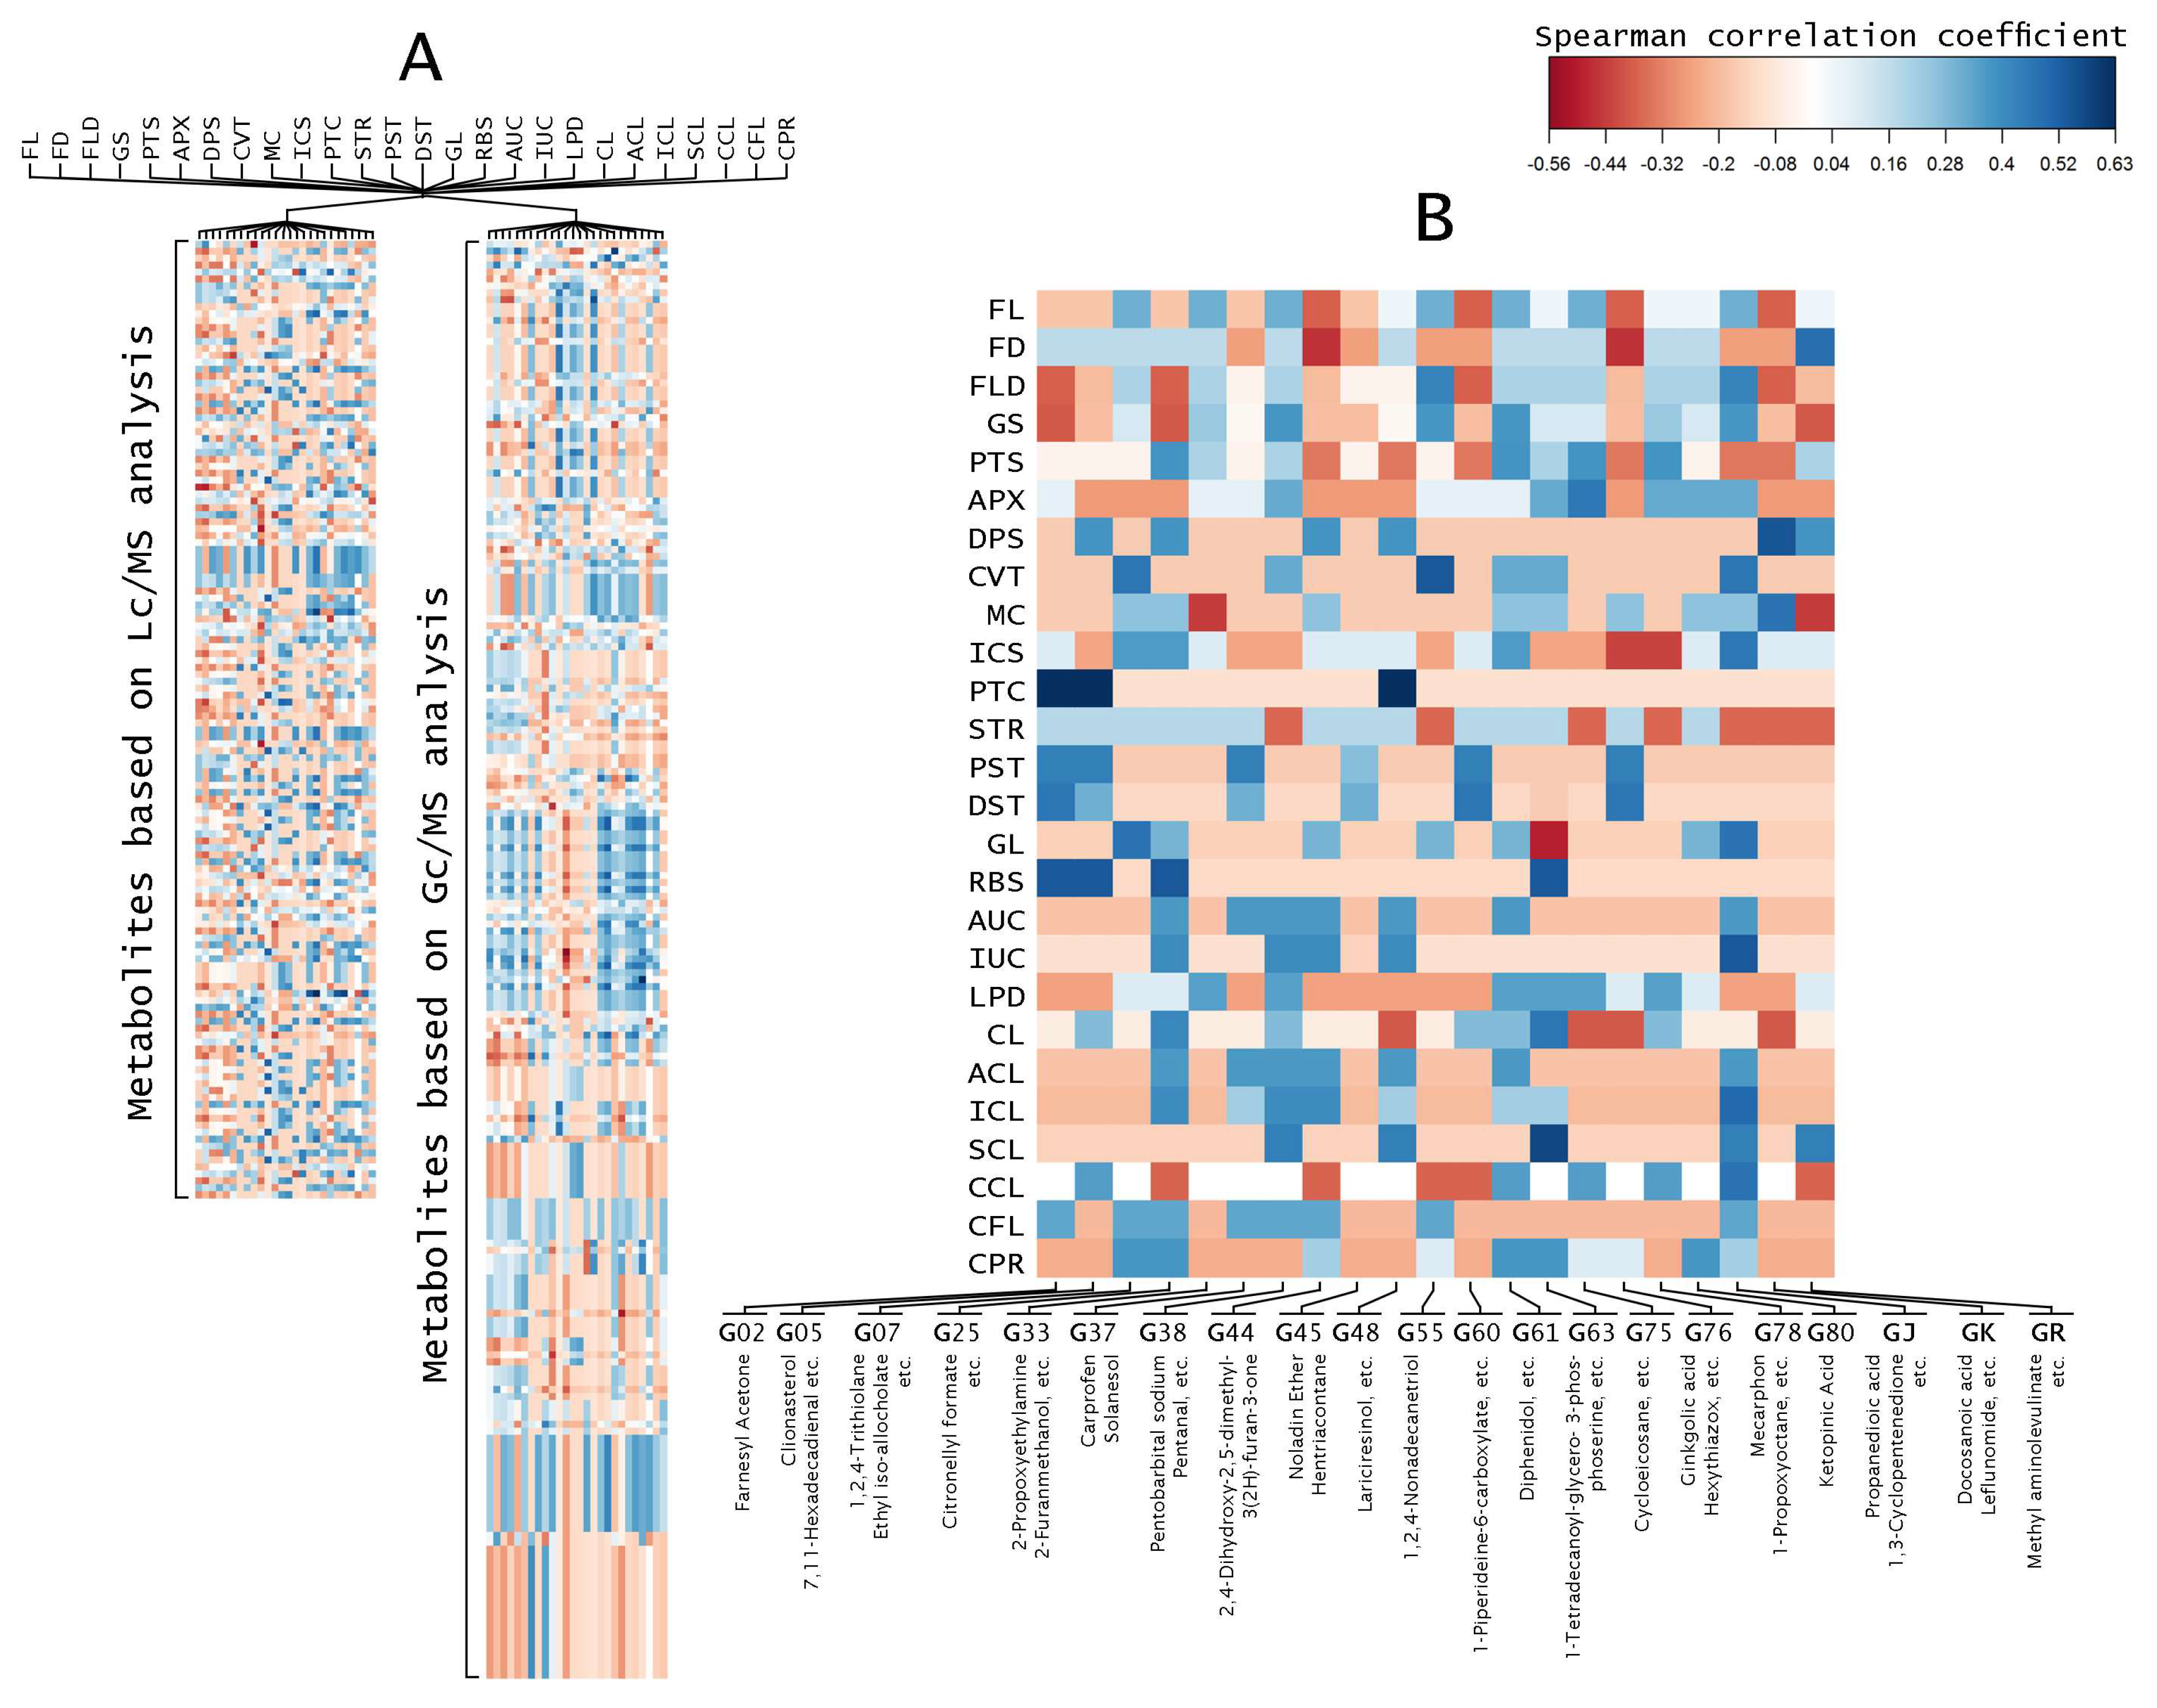
Correlation coefficient analysis indicated that fruit morphologies are related to metabolites (Figure 2). The correlation analysis was done between 26 fruit morphologies and all the identified peaks from the LC-MS and GC-MS analyses separately (Figure 2A). Furthermore, the correlation coefficient of accession-specific metabolites from each eggplant accession were collected and used to build a new heat map (Figure 2B and Table S2). Accession-specific metabolites from the same eggplant accessions showed similar coefficient correlation (Figure 2B). Out of 26 fruit morphology categories, seven eggplant fruit morphologies, namely DPS, CVT, PTC, DST, RBS, IUC, and SCL, showed correlations with specific metabolites. Accessions with patched fruit, G02, G05, and G48, correlated with farnesyl acetone, clionasterol, and lariciresinol, respectively. G25 along with G05 and G02, which have medium ribs, also showed a correlation between its fruit morphology and its accession-specific metabolites. Strong curvature fruit (CVT), which is unique to G55 fruit, was correlated with 1,2,4-nonadecanetriol. Similarly, very strong spininess of calyx (SCL) that is only found in G63, correlated with ethyl 9-heptadecenoate and 1-tetradecanoyl-glycero-3-phosphoserine metabolite, with the highest correlation coefficient. GJ with its very strong intensity of anthocyanin coloration underneath the calyx (IUC), and GK with its medium depth of indentation of pistil scar (DPS), also showed correlations with their metabolites. On the other hand, the rest of the accessions did not show any correlations.
3. Discussion
3.1. Untargeted Metabolomics Analysis Revealed Unique Metabolites Present in Different Accessions
Untargeted metabolomics analysis was successfully carried out using LC-MS and GC-MS on eggplant fruits. In this study, we used both GC-MS and LC-MS to increase the number of metabolites that could be detected due to the difference in the type of metabolites that can be analyzed by each analytical platform. GC-MS is more widely used in metabolomics analysis than LC-MS because there are more metabolite databases available for GC-MS [17]. However, using both LC-MS and GC-MS analysis is preferred in metabolomics. Choi et al. [11] used LC-MS and GC-MS in untargeted metabolomics analysis to determine the origin of coffee, followed by targeted analysis to determine the difference in flavor and taste. To assess the variety of our detected metabolites, data analysis was conducted using R software (Version 3.2.2) with the Metabolomics package. The heat map was able to show the differences in metabolites that were present in 21 eggplant accessions.
The metabolites identified in the different eggplant accessions were diverse, with some that are reported to have economic or health benefits. Using GC-MS analysis, we found 20 classes of metabolites, with terpenoids being the most abundant (Table 1). Farnesyl acetone, citronellyl formate, and 2-furanmethanol, in G02, G25, and G33 respectively, are terpenoids known as food additives [18,19,20]. We observed that most of the eggplant accessions have linoleic acid, palmitic acid, α-tocopherol (Vitamin E), and neophytadiene. Palmitic acid is a saturated fatty acid that is commonly found in plants and animals [21], while linoleic acid is one of the saturated fatty acids that is beneficial for acne-prone patients as a comedolytic agent [22] and for human bone health [23]. Moreover, these fatty acids are also important for the plant, as plant membranes contain a mixture of saturated and unsaturated fatty acids that are believed to be essential for the plant to adapt to environmental changes [24]. On the other hand, Vitamin E is commonly found in fruits and vegetables and is reported to have antioxidant activity [25]. Neophytadiene is a natural volatile compound found in tobacco, that contributes to its flavor in small effect and has antimicrobial activity [26].
Plants synthesize a wide variety of organic compounds. We also found a wide range of alkaloids, steroid, terpenes, fatty acids, and flavonoids in eggplants from the LC-MS analysis. These diverse organic compounds are believed to be part of an evolutionary process of plant defense against pests, diseases, droughts and other environmental challenges [27]. Other metabolites that were found in more than four accessions were 2,5-Bis(N-hexylmethylsilyl)thiophene and 2-(methylthiomethyl)-3-phenyl-2-propenal (Table 1). 2,5-Bis(N-hexylmethylsilyl)thiophene, which was identified using the metabolite database of Massbank of Japan Science and Technology Agency, has unknown function while 2-(methylthiomethyl)-3-phenyl-2-propenal is known as a food additive agent according to the JECFA (Joint FAO/WHO Expert Committee on Food Additives) database [28]. Some metabolites from the LC-MS analysis are still unidentified.
Analytical instruments used in this analysis were coupled with a low-resolution mass spectrometer. Low-resolution instruments are more cost effective and easier to access in newly industrialized countries such as Indonesia; thus, these instruments are suitable for use in the initial screening of local eggplant fruit metabolites. The drawbacks of using low-resolution LC/MS include poor mass accuracy and low specificity, thus it tends to yield several candidate metabolites for a particular peak. Therefore, metabolite annotation was performed by spectral library matching as a first step. Several candidate metabolites were then shortlisted and metabolites that showed identical names from both the MassBank and PlantCyc online databases were selected. Afterward, we double- checked in the public repository websites such as PubChem (https://pubchem.ncbi.nlm.nih.gov/) and ChemSpider (http://www.chemspider.com/) [29,30] to determine whether these metabolites are commonly found in plants.
3.2. Several Metabolites Are Accession-Specific
We described accession-specific metabolites as those that were present in only one accession (Table 1 and Table 2). For instance, mecarphon, (Table 2) which was present only in G78, is a natural pesticide that is used in seed treatment of Delia spp. [31]. Solanesol, which was present only in G37, is a metabolite that is mainly found in solanaceous crops, including tobacco, tomato, potato, eggplant, and pepper. Solanesol is used as a critical intermediate for the synthesis of ubiquinone drugs in the pharmaceutical industry [32]. Information on solanesol found in G37 might be used for the pharmaceutical industry as a useful backup source of solanesol, other than tobacco leaves.
The detection of specific metabolites in different eggplant accessions is likely dependent on the genetic makeup of the plant. Untargeted metabolomics and quantitative trait locus (QTL) analysis of Arabidopsis thaliana showed that metabolite variation is genetically controlled [33]. The long process of gene expression involves many metabolic pathways until it can finally manifest as a phenotype. Cellular regulatory processes produce metabolites as their end products to respond to biological signals and environmental changes that will affect the phenotype [34]. Similar to eggplant, metabolomics analysis of tomatoes and potatoes also showed differences in metabolites based on accessions [35,36]. Since analysis on the metabolomics level is closer to the expression of the plant phenotype than to the genomic level, it can better explain the phenotype. Therefore, metabolomics analysis is an appropriate approach to distinguish phenotypes [37]. This information on accession-specific metabolites can be used by plant breeders to choose and develop better eggplant varieties, as well as being a new selling point to consumers.
3.3. Correlation Analysis Shows Relationship between Fruit Morphologies and Metabolites
Creating variation in eggplant fruit size and shape is one of the objectives of breeding. Size and shape, along with taste, are the three principal qualities considered in the process of domestication of eggplant in China [38]. Selection and breeding over hundreds of years have resulted in a large number of eggplant varieties [39]. Genetic studies on fruit size and shape development in eggplant showed that these characteristics are controlled by some of the loci mapped to the common region of the genome [40]. Our eggplant accessions showed the variety in fruit color, including green, white, and purple, with only one accession with yellow fruit. Yellow eggplant is commonly used as an ornamental plant and not for food [41]. Purple, green, striped and patched eggplants are preferred in Southeast Asia over yellow eggplants [42]. This is probably the reason yellow eggplants are less common than others.
This research was able to obtain information about the distinct metabolites in different eggplant accessions and their correlations with fruit characteristics. Metabolites in the G33, G37, G38, G61, G78, and G80 accessions did not correlate with any fruit characteristics. We suspect that metabolites in these accessions are not included in the regulatory processes that lead to the phenotype of fruits. Recent studies about plant tissue-specific metabolism showed that some tissues with specific metabolite groups have interdependencies among them in terms of metabolite content [43]. Since metabolites are the result of interactions between the genome system and the environment that is not only the end result of gene expression but part of the regulation of the biological system [44], this might explain why some metabolites are not related to some characteristics.
Plant metabolomics is a continuously expanding field and, so far, recent studies are more focused on the application of metabolomics with other “omics” such as genomics, transcriptomics, and proteomics [43]. However, the vast number of metabolites in plants and their biological systems are still a challenge for metabolomics research. Metabolic alterations in lettuce (Lactuca sativa L.) caused by different CECs (contaminants of emerging concern) from exposure to irrigation water were linked to the changes in morphological characteristics such as leaf height and stem width [45]. This indicates that plant metabolites are correlated with plant morphological characteristics. However, the change in plant metabolites due to a sudden change of environment usually affects quantitative traits. On the other hand, our findings showed correlations between plant metabolites and morphological characteristics of eggplant for both quantitative (fruit length, fruit diameter) and qualitative traits (fruit main color, fruit patches). This study will be useful to further studies for developing preferred fruit morphology based on the metabolites contained therein.
Metabolomics analysis is an appropriate approach to distinguish phenotypes [37]. Information on metabolites that are correlated with morphological characteristics would be very useful for plant breeding strategies in eggplant. Moreover, plant breeders and consumers can use this information to make a quick assessment of eggplant fruits and their content.
4. Materials and Methods
4.1. Plant Materials
A total of 21 eggplant fruit accessions with different fruit morphologies from the Center for Tropical Horticulture Studies, Bogor Agricultural University, Indonesia were used in this study (Table 4). The plants were maintained in Bogor, West Java province, Indonesia (altitude 265 m above sea level, maximum temperature 29 °C, minimum temperature 20 °C). Eggplant seeds were sowed and watered regularly for a five-week period in a greenhouse. The seedlings were transplanted manually into the experimental plot. Ten plants per accession were planted with three replications. Plants were spaced 30 cm between rows and 40 cm between columns. A combination of compound fertilizer and manure was used to ensure that plants grew normally. All plants were kept free from pest and disease using a combination of manual and chemical controls.
4.2. Extraction and Sample Preparation
Eggplant fruits were harvested 12–15 days after anthesis [4]. Three eggplant fruits were sampled from each accession. The freshly-picked fruits were immediately cut into smaller sizes and dried using an oven at 40 °C for three days [46]. The small pieces from three eggplant fruits of each accession were pooled to make a representative fruit sample. Later, the dried fruit samples were placed in 99.9% pure ethanol and macerated for three days. Thirty microliters (30 µL) of the macerated samples were injected into the LC-MS instrument for analysis. For GC-MS analysis, 10 mL of the macerated samples were transferred to a new tube and evaporated for 1 h at 40 °C. The evaporated sample was added to 200 µL extract of the macerated samples to increase the concentration. Five microliters of sample was used for injection to get a wide range spectrum.
4.3. LC-MS Analysis
Waters Alliance 2695 HPLC system was used in the LC-MS analysis using an XTerra MS C18 column (2.1 × 100 mm, 3.5 µm particle size; Waters, MA, USA). The injection volume was 30 µL. The mobile phase A was methanol, while the mobile phase B was water with the following linear gradient programme: the concentration of mobile phase A was 10% at 0 min, 25% at 5 min, increased to 75% with gradient 5%/min and held for 5 min, then decreased to 10% and held for 15 min, while the mobile phase B was 90% at 0 min, 75% at 5 min, decreased to 25% and held for 5 min with gradient 5%/min, then increased until 90% and held for 15 min. The flow rate was 0.2 mL/min and the column temperature was 40 °C. The spectra were monitored using Waters Quattro Micro™ in full scan mode (m/z 50–1200) and electrospray ionization (ESI) interface in positive mode, with the source temperature maintained at 120 °C, desolvation temperature at 450 °C, and gas flow of 500 L/h. This procedure was controlled by Masslynx software (Version 4.0).
4.4. GC-MS Analysis
An Agilent Technologies 7890 A Gas Chromatograph coupled with 5975 C Mass Spectrometer system was used for analysis, with HP Ultra 2 capillary column (30 m, 0.25 mm i.d., 0.25 mm film thickness; Agilent, Santa Clara, CA, USA). The injection volume was 5 µL with 8:1 split ratio and 250 °C injection port temperature. The initial oven temperature was at 70 °C held for 0 min, increased at 3 °C/min to 150 °C, held for 1 min, and finally raised 20 °C/min to 250 °C and held for 26 min. Helium was used as carrier gas with a constant flow rate of 1.2 mL/min. MS acquisition parameters were done at 70 eV electron impact ionization, EM voltage of 2318 V, source 230 °C, quadrupole 150 °C, solvent delay: 2.5 min, and full scan (40–650 a.m.u) at a scan rate of 2.42 scan s−1.
4.5. Putative Identification of Metabolites
Putative identification of the resulting data of LC-MS analysis was carried out using MZmine2 (Version 2.24) software [47]. The following parameters were used: (1) filter: Savitzky-Golay, number of datapoints: 5; (2) mass detector: centroid, MS level: 1, noise level: 1000; (3) chromatogram builder, min time span: 0.08 min, min height: 0.0E0, m/z tolerance: 0.001 m/z or 5 ppm; (4) peak detection using online database search option, Massbank of Japan Science and Technology Agency [15], Plant Metabolic Network: Plant Metabolic Pathway Databases [16]. For one detected peak we got a variety of metabolite candidates from a 1–10 name. We picked metabolites that showed the same name from both MassBank and PlantCyc online databases and commonly found in plants.
The data acquisition of GC-MS analysis was done using MS-Chemstation G1701-DA with WILEY and NIST spectral libraries. Volatiles that showed mass spectra with match factors quality of ≥90% were considered as putatively identified substances. The putatively identified peak list from both LC-MS and GC-MS, which showed the data set of retention time, peak height, and area pct. (% of the total measured area in the total ion chromatogram) was exported and processed in Microsoft Excel.
4.6. Fruit Morphology Evaluation
Eggplant fruits from 21 eggplant accessions were evaluated using characteristics in the Guidelines for the Conduct of Tests for Distinctness, Uniformity, and Stability (GCT-DUS) for Eggplant species [48]. These guidelines include 12 vegetative characteristics, 3 inflorescence characteristics, 26 fruit characteristics and 2 characteristics on the time of flowering and ripeness. For this research, we observed 26 fruit characteristics (Table 3). Three biological replicates from 10 fruits of each accession were used in evaluation of fruit morphology. The data were used for correlation analysis.
4.7. Data Analysis
The dataset of area pct. of metabolites was log-transformed and then analyzed using R software [49]. The Metabolomics package [50] for R software was used to perform HCA (hierarchical cluster analysis) and construct heat maps with dendrograms. HCA was performed using the Euclidean distance method and the complete linkage agglomerative method.
The observed data from fruit morphology observation and the dataset of metabolites of eggplant accessions were used for correlation analysis. The Spearman correlation coefficients was calculated between these data. Calculations were done one by one between fruit morphology and its metabolites. Correlation analysis was conducted to determine the relation between eggplant fruit morphology and its metabolites. All calculations were done using the R software with the Corrplot package [51].
5. Conclusions
Untargeted metabolomics analysis was able to determine the metabolites contained in the eggplant fruit. We were able to detect 136 and 207 metabolite peaks from LC-MS and GC-MS analyses, respectively. Some of the metabolites were annotated as alkaloids, terpenes, terpenoids, fatty acids, and flavonoids. This study also found specific metabolites that are unique to a specific eggplant accession. Furthermore, Spearman correlation analysis showed the relationship between specific metabolites and fruit morphologies. Our results indicated that some specific metabolites in particular eggplant accessions correlated with its fruit morphologies. We believe that this information would be valuable for variety improvement program of eggplant.
Supplementary Materials
The following are available online at https://www.mdpi.com/2218-1989/8/3/49/s1, Table S1: Complete list of metabolites compounds from untargeted metabolomics analysis in eggplant fruit using GC-MS. Table S2: Spearman’s correlation coefficient value between eggplant fruit metabolites and fruit morphologies.
Author Contributions
A.H., S. and A.M. conceived and designed the experiments; A.H. performed the experiments, analyzed the data, and wrote the paper; S., A.M., S.P.P. and W.A.L. revised the manuscript.
Funding
This research was partly funded by the Indonesia Endowment Fund for Education (LPDP), Ministry of Finance, the Republic of Indonesia.
Acknowledgments
A.H. would like to thank the Indonesia Endowment Fund for Education (LPDP), Ministry of Finance, the Republic of Indonesia for the scholarship.. We would like to thank the Center for Tropical Horticulture Studies, Bogor Agricultural University, Indonesia for providing experiment material and facilities.
Conflicts of Interest
The authors declare no conflicts of interest.
References
- Weese, T.L.; Bohs, L. Eggplant origins: Out of Africa, into the Orient. Taxon 2010, 59, 49–56. [Google Scholar] [CrossRef]
- Knapp, S.; Vorontsova, M.S.; Prohens, J. Wild Relatives of the Eggplant (Solanum melongena L.: Solanaceae): New Understanding of Species Names in a Complex Group. PLoS ONE 2013, 8, e57039. [Google Scholar] [CrossRef] [PubMed]
- FAOSTAT. Available online: http://www.fao.org/faostat/en/#data/QC (accessed on 8 January 2018).
- Zhang, Y.; Hu, Z.; Chu, G.; Huang, C.; Tian, S.; Zhao, Z.; Chen, G. Anthocyanin Accumulation and Molecular Analysis of Anthocyanin Biosynthesis-Associated Genes in Eggplant (Solanum melongena L.). J. Agric. Food Chem. 2014, 62, 2906–2912. [Google Scholar] [CrossRef] [PubMed]
- Hall, R.D. Plant metabolomics: From holistic hope, to hype, to hot topic. New Phytol. 2006, 169, 453–468. [Google Scholar] [CrossRef] [PubMed]
- De Vos, R.C.; Moco, S.; Lommen, A.; Keurentjes, J.J.; Bino, R.J.; Hall, R.D. Untargeted large-scale plant metabolomics using liquid chromatography coupled to mass spectrometry. Nat. Protoc. 2007, 2, 778–791. [Google Scholar] [CrossRef] [PubMed]
- Arbona, V.; Iglesias, D.J.; Talón, M.; Gómez-Cadenas, A. Plant Phenotype Demarcation Using Nontargeted LC-MS and GC-MS Metabolite Profiling. J. Agric. Food Chem. 2009, 57, 7338–7347. [Google Scholar] [CrossRef] [PubMed] [Green Version]
- Tikunov, Y. A Novel Approach for Nontargeted Data Analysis for Metabolomics. Large-Scale Profiling of Tomato Fruit Volatiles. Plant Physiol. 2005, 139, 1125–1137. [Google Scholar] [CrossRef] [PubMed] [Green Version]
- Farag, M.A.; Mohsen, M.; Heinke, R.; Wessjohann, L.A. Metabolomic fingerprints of 21 date palm fruit varieties from Egypt using UPLC/PDA/ESI–qTOF-MS and GC–MS analyzed by chemometrics. Food Res. Int. 2014, 64, 218–226. [Google Scholar] [CrossRef] [PubMed]
- Farag, M.A.; Gad, H.A.; Heiss, A.G.; Wessjohann, L.A. Metabolomics driven analysis of six Nigella species seeds via UPLC-qTOF-MS and GC–MS coupled to chemometrics. Food Chem. 2014, 151, 333–342. [Google Scholar] [CrossRef] [PubMed]
- Choi, M.-Y.; Choi, W.; Park, J.H.; Lim, J.; Kwon, S.W. Determination of coffee origins by integrated metabolomic approach of combining multiple analytical data. Food Chem. 2010, 121, 1260–1268. [Google Scholar] [CrossRef]
- Jumhawan, U.; Putri, S.P.; Yusianto; Marwani, E.; Bamba, T.; Fukusaki, E. Selection of Discriminant Markers for Authentication of Asian Palm Civet Coffee (Kopi Luwak): A Metabolomics Approach. J. Agric. Food Chem. 2013, 61, 7994–8001. [Google Scholar] [CrossRef] [PubMed]
- Foxman, B.; Srinivasan, U.; Wen, A.; Zhang, L.; Marrs, C.F.; Goldberg, D.; Weyant, R.; McNeil, D.; Crout, R.; Marazita, M. Exploring the effect of dentition, dental decay and familiality on oral health using metabolomics. Infect. Genet. Evol. 2014, 22, 201–207. [Google Scholar] [CrossRef] [PubMed] [Green Version]
- De Souza, D.P.; Saunders, E.C.; McConville, M.J.; Likic, V.A. Progressive peak clustering in GC-MS Metabolomic experiments applied to Leishmania parasites. Bioinformatics 2006, 22, 1391–1396. [Google Scholar] [CrossRef] [PubMed] [Green Version]
- MassBank|High Quality Mass Spectral Database. Available online: http://www.massbank.jp/?lang=en (accessed on 9 January 2018).
- Plant Metabolic Pathway Databases|Plant Metabolic Network. Available online: https://www.plantcyc.org/ (accessed on 9 January 2018).
- Verhoeven, H.A.; de Vos, C.H.R.; Bino, R.J.; Hall, R.D. Plant Metabolomics Strategies Based upon Quadrupole Time of Flight Mass Spectrometry (QTOF-MS). In Plant Metabolomics; Biotechnology in Agriculture and Forestry; Springer: Berlin/Heidelberg, Germany, 2006; pp. 33–48. ISBN 978-3-540-29781-9. [Google Scholar]
- 2,6,10-TRIMETHYL-2,6,10-PENTADECATRIEN-14-ONE. WHO|JECFA. Available online: http://apps.who.int/food-additives-contaminants-jecfa-database/chemical.aspx?chemID=4689 (accessed on 8 January 2018).
- CITRONELLYL FORMATE. WHO|JECFA. Available online: http://apps.who.int/food-additives-contaminants-jecfa-database/chemical.aspx?chemID=4012 (accessed on 8 January 2018).
- FURFURYL ALCOHOL. WHO|JECFA. Available online: http://apps.who.int/food-additives-contaminants-jecfa-database/chemical.aspx?chemID=1781 (accessed on 8 January 2018).
- Gunstone, F.D.; Harwood, J.L.; Dijkstra, A.J. The Lipid Handbook with CD-ROM, 3rd ed.; Taylor & Francis: Oxford, UK, 2007; ISBN 978-0-8493-9688-5. [Google Scholar]
- Letawe, C.; Boone, M.; Piérard, G.E. Digital image analysis of the effect of topically applied linoleic acid on acne microcomedones. Clin. Exp. Dermatol. 1998, 23, 56–58. [Google Scholar] [CrossRef] [PubMed]
- Macdonald, H.M.; New, S.A.; Golden, M.H.; Campbell, M.K.; Reid, D.M. Nutritional associations with bone loss during the menopausal transition: Evidence of a beneficial effect of calcium, alcohol, and fruit and vegetable nutrients and of a detrimental effect of fatty acids. Am. J. Clin. Nutr. 2004, 79, 155–165. [Google Scholar] [CrossRef] [PubMed]
- Bonaventure, G. Disruption of the FATB Gene in Arabidopsis Demonstrates an Essential Role of Saturated Fatty Acids in Plant Growth. Plant Cell Online 2003, 15, 1020–1033. [Google Scholar] [CrossRef] [Green Version]
- Cao, G.; Sofic, E.; Prior, R.L. Antioxidant Capacity of Tea and Common Vegetables. J. Agric. Food Chem. 1996, 44, 3426–3431. [Google Scholar] [CrossRef]
- Stojanovic, G.; Palic, R.; Alagic, S.; Zeković, Z. Chemical composition and antimicrobial activity of the essential oil and CO2 extracts of semi-oriental tobacco, Otlja. Flavour Fragr. J. 2000, 15, 335–338. [Google Scholar] [CrossRef]
- Dixon, R.A. Natural products and plant disease resistance. Nature 2001, 411, 843. [Google Scholar] [CrossRef] [PubMed]
- 2-(METHYLTHIOMETHYL)-3-PHENYLPROPENAL. WHO|JECFA. Available online: http://apps.who.int/food-additives-contaminants-jecfa-database/chemical.aspx?chemID=1145 (accessed on 8 January 2018).
- Kim, S.; Thiessen, P.A.; Bolton, E.E.; Chen, J.; Fu, G.; Gindulyte, A.; Han, L.; He, J.; He, S.; Shoemaker, B.A.; et al. PubChem Substance and Compound databases. Nucleic Acids Res. 2016, 44, D1202–D1213. [Google Scholar] [CrossRef] [PubMed]
- ChemSpider|Search and Share Chemistry. Available online: http://www.chemspider.com/ (accessed on 27 August 2018).
- Gould, H.J.; Mayor, J.G. Alternative Seed Treatments to Dieldrin for the Control of Bean Seed Fly (Delia spp.). Plant Pathol. 1975, 24, 245–246. [Google Scholar] [CrossRef]
- Yan, N.; Liu, Y.; Gong, D.; Du, Y.; Zhang, H.; Zhang, Z. Solanesol: A review of its resources, derivatives, bioactivities, medicinal applications, and biosynthesis. Phytochem. Rev. 2015, 14, 403–417. [Google Scholar] [CrossRef]
- Keurentjes, J.J.B.; Fu, J.; de Vos, C.H.R.; Lommen, A.; Hall, R.D.; Bino, R.J.; van der Plas, L.H.W.; Jansen, R.C.; Vreugdenhil, D.; Koornneef, M. The genetics of plant metabolism. Nat. Genet. 2006, 38, 842–849. [Google Scholar] [CrossRef] [PubMed]
- Fiehn, O. Metabolomics—The link between genotypes and phenotypes. Plant Mol. Biol. 2002, 48, 155–171. [Google Scholar] [CrossRef] [PubMed]
- Wahyuni, Y.; Ballester, A.-R.; Sudarmonowati, E.; Bino, R.J.; Bovy, A.G. Metabolite biodiversity in pepper (Capsicum) fruits of thirty-two diverse accessions: Variation in health-related compounds and implications for breeding. Phytochemistry 2011, 72, 1358–1370. [Google Scholar] [CrossRef] [PubMed]
- Uri, C.; Juhász, Z.; Polgár, Z.; Bánfalvi, Z. A GC–MS-based metabolomics study on the tubers of commercial potato cultivars upon storage. Food Chem. 2014, 159, 287–292. [Google Scholar] [CrossRef] [PubMed]
- Tian, J.; Shi, C.; Gao, P.; Yuan, K.; Yang, D.; Lu, X.; Xu, G. Phenotype differentiation of three E. coli strains by GC-FID and GC–MS based metabolomics. J. Chromatogr. B 2008, 871, 220–226. [Google Scholar] [CrossRef] [PubMed]
- Wang, J.-X.; Gao, T.-G.; Knapp, S. Ancient Chinese Literature Reveals Pathways of Eggplant Domestication. Ann. Bot. 2008, 102, 891–897. [Google Scholar] [CrossRef] [PubMed] [Green Version]
- Cericola, F.; Portis, E.; Toppino, L.; Barchi, L.; Acciarri, N.; Ciriaci, T.; Sala, T.; Rotino, G.L.; Lanteri, S. The Population Structure and Diversity of Eggplant from Asia and the Mediterranean Basin. PLoS ONE 2013, 8, e73702. [Google Scholar] [CrossRef] [PubMed]
- Doganlar, S.; Frary, A.; Daunay, M.-C.; Lester, R.N.; Tanksley, S.D. Conservation of gene function in the solanaceae as revealed by comparative mapping of domestication traits in eggplant. Genetics 2002, 161, 1713–1726. [Google Scholar] [PubMed]
- Shen, G.; Kiem, P.V.; Cai, X.-F.; Li, G.; Dat, N.T.; Choi, Y.A.; Lee, Y.M.; Park, Y.K.; Kim, Y.H. Solanoflavone, a new biflavonol glycoside from Solanum melongena: Seeking for anti-inflammatory components. Arch. Pharm. Res. 2005, 28, 657–659. [Google Scholar] [CrossRef] [PubMed]
- Akanitapichat, P.; Phraibung, K.; Nuchklang, K.; Prompitakkul, S. Antioxidant and hepatoprotective activities of five eggplant varieties. Food Chem. Toxicol. 2010, 48, 3017–3021. [Google Scholar] [CrossRef] [PubMed]
- Li, D.; Heiling, S.; Baldwin, I.T.; Gaquerel, E. Illuminating a plant’s tissue-specific metabolic diversity using computational metabolomics and information theory. Proc. Natl. Acad. Sci. USA 2016, 113, E7610–E7618. [Google Scholar] [CrossRef] [PubMed] [Green Version]
- Putri, S.P.; Fukusaki, E. Mass Spectrometry-Based Metabolomics: A Practical Guide; CRC Press: Boca Raton, FL, USA, 2016; ISBN 978-1-4822-2377-4. [Google Scholar]
- Hurtado, C.; Parastar, H.; Matamoros, V.; Piña, B.; Tauler, R.; Bayona, J.M. Linking the morphological and metabolomic response of Lactuca sativa L exposed to emerging contaminants using GC × GC-MS and chemometric tools. Sci. Rep. 2017, 7, 6546. [Google Scholar] [CrossRef] [PubMed]
- Yi, W.; Wetzstein, H.Y. Effects of Drying and Extraction Conditions on the Biochemical Activity of Selected Herbs. HortScience 2011, 46, 70–73. [Google Scholar]
- MZmine 2. Available online: http://mzmine.github.io/ (accessed on 9 January 2018).
- The International Union for the Protection of New Varieties of Plants (UPOV). Guidelines for the Conduct of Tests for Distinctness, Uniformity and Stability; UPOV Press: Geneva, Switzerland, 2002. [Google Scholar]
- R: The R Project for Statistical Computing. Available online: https://www.r-project.org/ (accessed on 9 January 2018).
- Alysha, M.D.L.; Jairus, B.B. Metabolomics: Analysis of Metabolomics Data. R Package Version 0.1.4. 2014. Available online: http://cran.r-project.org/package=metabolomics/index.html (accessed on 9 January 2018).
- Wei, T.; Simko, V.; Levy, M.; Xie, Y.; Jin, Y.; Zemla, J. Corrplot: Visualization of a Correlation Matrix. R Package Version 0.84. 2017. Available online: https://cran.r-project.org/web/packages/corrplot/index.html (accessed on 9 January 2018).
Figure 1.
Heat map result of hierarchical group analysis based on metabolite peaks identified from LC-MS and GC-MS analyses. (a) heat map of 207 metabolite peaks from GC-MS analysis; (b) heat map of 136 metabolite peaks from LC-MS analysis. A = metabolites found in many eggplant accessions; B = metabolites found in a few, or only one, eggplant accession. The green, black, and red bars represent the value of area pct. that has been transformed by log2. The bright green color shows higher peak areas of metabolite, while black and red colors show lower peak areas of metabolites. This coloring is metabolite-wise.

Figure 2.
Heat map of correlations between eggplant fruit metabolites and fruit morphologies. Each square represents the Spearman’s correlation coefficient (p < 0.05). (A) Heat map of correlations between eggplant fruit metabolites based on 136 detected peaks of LC-MS analysis and 207 detected peaks of GC-MS analysis with 26 fruit morphologies; (B) Heat map of correlations between specific eggplant fruit metabolites of each accession with 26 fruit morphologies.


Table 1.
Metabolite compounds from untargeted metabolomics analysis in eggplant fruit using GC-MS.
| Name | Formula | Class | Accessions |
|---|---|---|---|
| Linoleic acid | C18H32O2 | Saturated Fatty Acid | G02, G05, G07, G25, G33, G37, G44, G45, G48, G55, G60, G61, G63, G75, G76, G78, G80, GJ, GK, GR |
| Palmitic acid | C16H32O2 | Saturated Fatty Acid | G02, G05, G07, G25, G33, G38, G44, G45, G48, G55, G61, G63, G75, G76, G78, G80, GJ, GK, GR |
| α-Tocopherol (Vitamin E) | C29H50O2 | Vitamin | G07, G25, G33, G37, G38, G45, G48, G60, G63, G76, G78, G80, GJ, GK |
| Neophytadiene | C20H38 | Diterpenoid | G02, G05, G07, G33, G37, G38, G48, G55, G63, GK |
| Farnesyl acetone | C18H30O | Terpenoid | G02 |
| N,N-Dimethylethylamine | C14H11N | Amines | G05 |
| Hexanal | C6H12O | Alkaloid | G05 |
| 2-Hydroxyethylphosphine | C2H7OP | Flavonoid | G05 |
| (Dimethylamino)acetone | C5H11NO | Alkaloid | G05 |
| 4-Oxononanedioic acid | C9H14O5 | Terpen | G05 |
| Clionasterol | C29H50O | Triterpenoid | G05 |
| 7,11-Hexadecadienal | C16H28O | Pheromon | G05 |
| Ethyl iso-allocholate | C26H44O5 | Steroid | G07 |
| 1,1-Dibutylhydrazine | C8H20N2 | Skeletal formula | G25 |
| Citronellyl formate | C11H20O | Terpenoid | G25 |
| 13-Tetradecenal | C14H26O | Terpenoid | G25 |
| Ammonium oxalate, monohydrate | C2H8N2O4 | Terpenoid | G33 |
| 2-Propoxyethylamine | C5H13NO | Terpenoid | G33 |
| 2-Furanmethanol | C5H6O2 | Terpenoid | G33 |
| 4-Methyl-1,3-dioxane | C5H10O2 | Benzene and Subtituent Derivatives | G33 |
| Ethyl tetradecanoate | C16H32O2 | Unsaturated Fatty Acid | G33 |
| Methyl (9E,12Z)-9,12-octadecadienoate | C19H34O2 | Diterpenoid | G37 |
| Solanesol | C45H74O | Polyterpen | G37 |
| Butanoic acid, 3-hydroxy- | C4H8O3 | Hydroxy Acid and Derivatives | G38 |
| Methoxyethylamine | C3H9NO | Alkaloid | G38 |
| 1,4-Cyclohexanediol, trans- | C6H12O2 | Flavonoid | G38 |
| 3-Butenoic acid | C4H6O2 | Fatty Acids and Conjugate | G38 |
| Pentanal | C5H10O | Saturated Fatty Acid | G38 |
| E-9-Tetradecenal | C14H26O | Unsaturated Fatty Acid | G38 |
| Methyl palmitoleate | C17H32O2 | Fatty Acid Methyl Ester | G38 |
| Octadecyltrichlorosilane | C18H37Cl3Si | Organochlorosilane | G38 |
| 2,4-Dihydroxy-2,5-dimethyl-3(2H)-furan-3-one | C6H8O4 | Flavonoid (Ketone bodies) | G44 |
| Hentriacontane | C31H64 | Alkanes | G45 |
| Diisooctyl phthalate | C24H38O4 | Diterpenoid | G48 |
| 9,10-Dibromopentacosane | C25H50Br2 | Recolcinolic lipid | G48 |
| Hydroperoxide, 1-methylhexyl | C7H16O2 | Terpenoid | G60 |
| Eicosanoic acid | C20H40O2 | Saturated Fatty Acid | G60 |
| Octadecanoic acid | C18H36O2 | Saturated Fatty Acid | G60 |
| Ethyl 9-hexadecenoate | C18H34O2 | Unsaturated Fatty Acid | G60 |
| 2,2-Dideuteropropane | C3H8 | Hydrocarbon | G61 |
| Tetradecanal | C14H28O | Saturated Fatty Acid | G61 |
| Ethyl 9-heptadecenoate | C19H38O2 | Saturated Fatty Acid | G63 |
| Propanamide, N,N-dimethyl- | C5H9NO2 | Steroid | G75 |
| Cycloeicosane | C20H40 | Terpen | G75 |
| trans-Chrysanthemal | C10H16O | Natural pesticide | G75 |
| Z,E-3,13-Octadecadien-1-ol | C18H34O | Unsaturated Fatty Acid | G76 |
| 1-Propoxyoctane | C11H24O | Steroid | G78 |
| Cyclododecanone | C12H22O | Flavonoid (Ketone bodies) | G78 |
| Ketopinic Acid | C10H14O3 | Flavonoid | G80 |
| Propanedioic acid | C3H4O4 | Terpenoid | GJ |
| 3-Amino-2-oxazolidinone | C3H6N2O2 | Alkaloid | GJ |
| 1,3-Cyclopentenedione | C5H6O2 | Alkaloid | GJ |
| Trichloroacetic acid, undec-10-enyl ester | C13H21Cl3O2 | Trichloroacetic Acid | GJ |
| Cyclohexadecanone | C16H30O | Organohalogen compound | GJ |
| Oleyl alcohol, heptafluorobutyrate | C22H35F7O2 | Alkanes | GJ |
| Ethyl octadecanoate | C20H40O2 | Unsaturated Fatty Acid | GK |
| 10-HeptyL-10-Octylicosane | C35H72 | Terpen | GK |
| Pentacosane | C25H52 | Alkanes | GK |
| 1-Chloroheptacosane | C27H55Cl | Alkanes | GK |
| Triacontane | C30H62 | Alkanes | GK |
| 9-Hexacosene | C26H52 | Terpen | GK |
| Nonadecane | C19H40 | Terpen | GK |
| (9E,12E)-9,12-Octadecadienoyl chloride | C18H31ClO | Skeletal formula | GR |
Table 2.
Metabolites from untargeted metabolomics analysis in eggplant fruit using LC-MS.
| Name | Formula | Class | Accessions |
|---|---|---|---|
| 2,5-Bis(N-hexylmethylsilyl)thiophene | C18H36SSi2 | Terpen | G07, G25, G37, G76, G78 |
| 2-(Methylthiomethyl)-3-phenyl-2-propenal | C11H12OS | Terpenoid | G05, G33, G38, G45 |
| Boscalid | C18H12Cl2N2O | Alkaloids | G07, G25, G37, GK |
| Dimethisterone | C23H32O2 | Steroid | G25, G48, G78 |
| Glucolepidiin | C17H14Cl2N2O2 | Alkaloids | G48, G78, GJ |
| Methyl-2-alpha-l-fucopyranosyl-beta-d-galactoside | C13H24O10 | Glycoside | G25, G48 |
| L-dopachromate | C9H6NO4 | Terpenoid | G37, G38 |
| L-saccharopine | C11H19N2O6 | Alpha amino acids | G37, GK |
| Coumachlor | C19H15ClO4 | Steroid | G37, G78 |
| 5-Methoxytryptamine | C11H14N2O | Alkaloids | G38, G78 |
| Clopidol | C7H7Cl2NO | Alkaloids | G44, G60 |
| 4,4′-Ditolylthiourea | C15H16N2S | Steroid | G48, GJ |
| Octylbenzene | C14H22 | Terpenoid | G76, G78 |
| Cyclopentolate | C17H25NO3 | Steroid | G76, G78 |
| Trioxilin A3 | C20H33O5 | Steroid | G78, GK |
| Pyrazinemethanethiol | C5H6N2S | Monoterpene | G05 |
| 1-Diethoxyphosphoryl-4-hydroxy-nonan-2-one | C13H27O5P | Terpenoid | G05 |
| 1,2,4-Trithiolane | C2H4S3 | Steroid | G07 |
| 2-Chloro-1,4-naphthoquinone | C10H5ClO2 | Monoterpene | G37 |
| Methyl 6-O-galloyl-beta-d-glucopyranoside | C14H18O10 | Flavonoid | G37 |
| Propericiazine | C21H23N3OS | Alkaloids | G37 |
| N-Phenylacetylglutamic acid | C13H17NO5 | Steroid | G37 |
| Carprofen | C15H12ClNO2 | Steroid | G37 |
| 8-O-Methyloblongine | C20H26NO3 | Steroid | G37 |
| 5,5′-Methylenedi(2-para-tolylperhydropyrrolo(3,4-c)pyrrole-1,3-dione) | C27H28N4O4 | Alkaloids | G38 |
| 1-Deoxy-d-xylulose | C5H10O4 | Flavonoid | G38 |
| Cis-Zeatin | C10H13N5O | Alkaloids | G38 |
| 1-Hydroperoxy-8-carboxyoctyl-3,4-epoxynon-(2E)-enyl-ether | C12H18BNO2 | Alkaloids | G38 |
| Pentobarbital sodium | C11H17N2O3 | Alkaloids | G38 |
| Noladin Ether | C23H40O3 | Steroid | G45 |
| Lariciresinol | C20H24O6 | Monoterpene | G48 |
| 1,2-Bis(4-nitrophenyl)ethane | C14H12N2O4 | Stilbenoid | G48 |
| 1,2,4-Nonadecanetriol | C19H40O3 | Terpen | G55 |
| 1-Piperideine-6-carboxylate | C6H8NO2 | Alkaloids | G60 |
| 9-Chloro-10-hydroxy-octadecanoic acid | C18H35ClO3 | Alkaloids | G60 |
| Diphenidol | C21H27NO | Monoterpene | G61 |
| 1-Tetradecanoyl-glycero-3-phosphoserine | C20H40NO9P | Fatty acid | G63 |
| Ginkgolic acid | C22H34O3 | Terpenoid | G76 |
| Hexythiazox | C17H21ClN2O2S | Alkaloids | G76 |
| Atovaquone | C22H19ClO3 | Steroid | G76 |
| 5-Formiminotetrahydrofolate | C20H24N8O6 | Monoterpene | G76 |
| Butocarboxim | C7H14N2O2S | Alkaloids | G76 |
| Elaeocarpidine | C17H21N3 | Alkaloids | G76 |
| Mecarphon | C7H14NO4PS2 | Organophosphorus | G78 |
| Ethyl 18-bromooctadec-17-en-5,7,15-triynoate | C20H25BrO2 | Monoterpene | GJ |
| 2-Acetoxy-7-bromo-4-isopropyltropone | C12H13BrO3 | Terpen | GJ |
| N-(1-Deoxy-1-fructosyl)histidine | C12H19N3O7 | Steroid | GJ |
| Docosanoic acid | C22H44O2 | Terpen | GK |
| Leflunomide | C12H9F3N2O2 | Steroid | GK |
| Yohimbinic acid | C20H24N2O3 | Alkaloids | GK |
| Methyl aminolevulinate | C6H11NO3 | Alkaloids | GR |
Table 3.
Description of fruit morphologies for 21 eggplant accessions based on UPOV.
| Code | Morphological Characteristics | ||||||||||||||||||||
|---|---|---|---|---|---|---|---|---|---|---|---|---|---|---|---|---|---|---|---|---|---|
| FL | Fruit: length (1) very short (<1 cm), (3) short (~ 2cm), (5) medium (~5 cm), (7) long (~10 cm), (9) very long (>20 cm) | ||||||||||||||||||||
| FD | Fruit: maximum diameter (1) very small (<1 cm), (3) small (~2 cm), (5) medium (~3 cm), (7) large (~5 cm), (9) very large (>10 cm) | ||||||||||||||||||||
| FLD | Fruit: ratio length/maximum diameter (1) very small, (3) small, (5) medium, (7) large, (9) very large | ||||||||||||||||||||
| GS | Fruit: general shape (1) globular, (2) ovoid, (3) obovate, (4) pear shaped, (5) club shaped, (6) ellipsoid, (7) cylindrical | ||||||||||||||||||||
| PTS | Fruit: size of pistil scar (1) very small, (3) small, (5) medium, (7) large, (9) very large | ||||||||||||||||||||
| APX | Fruit: apex (1) indented, (2) flattened, (3) rounded, (4) pointed | ||||||||||||||||||||
| DPS | Fruit: depth of indentation of pistil scar (1) absent or very shallow, (3) shallow, (5) medium, (7) deep, (9) very deep | ||||||||||||||||||||
| CVT | Only for cylindrical types: Fruit: curvature (1) absent or very weak, (3) weak, (5) medium, (7) strong, (9) very strong | ||||||||||||||||||||
| MC | Fruit: main color of skin at harvest maturity (1) white, (2) green, (3) violet, (4) yellow | ||||||||||||||||||||
| ICS | Fruit: intensity of main color of skin (1) very light, (3) light, (5) medium, (7) dark, (9) very dark | ||||||||||||||||||||
| PTC | Fruit: patches (1) absent, (9) present | ||||||||||||||||||||
| STR | Fruit: stripes (1) absent, (9) present | ||||||||||||||||||||
| PST | Fruit: prominence of stripes (3) weak, (5) medium, (7) strong | ||||||||||||||||||||
| DST | Fruit: density of stripes (3) sparse, (5) medium, (7) dense | ||||||||||||||||||||
| GL | Fruit: glossiness at harvest maturity (3) weak, (5) medium, (7) strong | ||||||||||||||||||||
| RBS | Fruit: ribs (1) absent or very weak, (3) weak, (5) medium, (7) strong, (9) very strong | ||||||||||||||||||||
| AUC | Fruit: anthocyanin coloration underneath calyx (1) absent, (9) present | ||||||||||||||||||||
| IUC | Fruit: intensity of anthocyanin coloration underneath calyx (3) weak, (5) medium, (7) strong | ||||||||||||||||||||
| LPD | Fruit: length of peduncle (1) very short, (3) short, (5) medium, (7) long, (9) very long | ||||||||||||||||||||
| CL | Fruit: size of calyx (1) very small, (3) small, (5) medium, (7) large, (9) very large | ||||||||||||||||||||
| ACL | Fruit: anthocyanin coloration of calyx (1) absent, (9) present | ||||||||||||||||||||
| ICL | Fruit: intensity of anthocyanin coloration of calyx - (1) very weak, (3) weak, (5) medium, (7) strong, (9) very strong | ||||||||||||||||||||
| SCL | Fruit: spininess of calyx (1) absent or very weak, (3) weak, (5) medium, (7) strong, (9) very strong | ||||||||||||||||||||
| CCL | Fruit: creasing of calyx (1) very weak, (3) weak, (5) medium, (7) strong, (9) very strong | ||||||||||||||||||||
| CFL | Fruit: color of flesh (1) whitish, (2) greenish | ||||||||||||||||||||
| CPR | Fruit: color of skin at physiological ripeness (1) yellow, (2) orange, (3) ochre, (4) brown | ||||||||||||||||||||
| Code | G02 | G05 | G07 | G25 | G33 | G37 | G38 | G44 | G45 | G48 | G55 | G60 | G61 | G63 | G75 | G76 | G78 | G80 | GJ | GK | GR |
| FL | 5 | 5 | 9 | 5 | 9 | 5 | 9 | 3 | 5 | 7 | 9 | 3 | 9 | 7 | 9 | 3 | 7 | 7 | 9 | 3 | 7 |
| FD | 7 | 7 | 7 | 7 | 7 | 5 | 7 | 3 | 5 | 7 | 5 | 5 | 7 | 7 | 7 | 3 | 7 | 7 | 5 | 5 | 9 |
| FLD | 1 | 3 | 7 | 1 | 7 | 5 | 7 | 3 | 5 | 5 | 9 | 1 | 7 | 7 | 7 | 3 | 7 | 7 | 9 | 1 | 3 |
| GS | 1 | 2 | 5 | 1 | 6 | 3 | 7 | 2 | 2 | 3 | 7 | 2 | 7 | 5 | 5 | 2 | 6 | 5 | 7 | 2 | 1 |
| PTS | 5 | 5 | 5 | 9 | 7 | 5 | 7 | 3 | 5 | 3 | 5 | 3 | 9 | 7 | 9 | 3 | 9 | 5 | 3 | 3 | 7 |
| APX | 3 | 1 | 1 | 1 | 3 | 3 | 4 | 1 | 1 | 1 | 3 | 3 | 3 | 4 | 7 | 1 | 4 | 4 | 4 | 1 | 1 |
| DPS | 1 | 3 | 1 | 3 | 1 | 1 | 1 | 3 | 1 | 3 | 1 | 1 | 1 | 1 | 1 | 1 | 1 | 1 | 1 | 5 | 3 |
| CVT | 1 | 1 | 5 | 1 | 1 | 1 | 3 | 1 | 1 | 1 | 7 | 1 | 3 | 3 | 1 | 1 | 1 | 1 | 5 | 1 | 1 |
| MC | 2 | 2 | 3 | 3 | 1 | 2 | 2 | 3 | 2 | 2 | 2 | 2 | 3 | 3 | 2 | 3 | 2 | 3 | 3 | 5 | 1 |
| ICS | 5 | 3 | 7 | 7 | 5 | 3 | 3 | 5 | 5 | 5 | 3 | 5 | 7 | 3 | 3 | 1 | 1 | 5 | 9 | 5 | 5 |
| PTC | 9 | 9 | 1 | 1 | 1 | 1 | 1 | 1 | 1 | 9 | 1 | 1 | 1 | 1 | 1 | 1 | 1 | 1 | 1 | 1 | 1 |
| STR | 9 | 9 | 9 | 9 | 9 | 9 | 1 | 9 | 9 | 9 | 1 | 9 | 9 | 9 | 1 | 9 | 1 | 9 | 1 | 1 | 1 |
| PST | 7 | 7 | 3 | 3 | 3 | 7 | 3 | 3 | 5 | 3 | 3 | 7 | 3 | 3 | 3 | 7 | 3 | 3 | 3 | 3 | 3 |
| DST | 7 | 5 | 3 | 3 | 3 | 5 | 3 | 3 | 5 | 3 | 3 | 7 | 3 | 3 | 3 | 7 | 3 | 3 | 3 | 3 | 3 |
| GL | 3 | 3 | 7 | 5 | 3 | 3 | 3 | 5 | 3 | 3 | 5 | 3 | 5 | 1 | 3 | 3 | 3 | 5 | 7 | 3 | 3 |
| RBS | 5 | 5 | 1 | 5 | 1 | 1 | 1 | 1 | 1 | 1 | 1 | 1 | 1 | 5 | 1 | 1 | 1 | 1 | 1 | 1 | 1 |
| AUC | 1 | 1 | 1 | 9 | 1 | 9 | 9 | 9 | 1 | 9 | 1 | 1 | 9 | 1 | 1 | 1 | 1 | 1 | 9 | 1 | 1 |
| IUC | 3 | 3 | 3 | 5 | 3 | 3 | 5 | 5 | 3 | 5 | 3 | 3 | 3 | 3 | 3 | 3 | 3 | 3 | 7 | 3 | 3 |
| LPD | 5 | 5 | 7 | 7 | 9 | 5 | 9 | 5 | 5 | 5 | 5 | 5 | 9 | 9 | 9 | 7 | 9 | 7 | 5 | 5 | 7 |
| CL | 3 | 5 | 3 | 7 | 3 | 3 | 5 | 3 | 3 | 1 | 3 | 5 | 5 | 9 | 1 | 1 | 5 | 3 | 3 | 1 | 3 |
| ACL | 1 | 1 | 1 | 9 | 1 | 9 | 9 | 9 | 1 | 9 | 1 | 1 | 9 | 1 | 1 | 1 | 1 | 1 | 9 | 1 | 1 |
| ICL | 1 | 1 | 1 | 5 | 1 | 3 | 5 | 5 | 1 | 3 | 1 | 1 | 3 | 3 | 1 | 1 | 1 | 1 | 9 | 1 | 1 |
| SCL | 1 | 1 | 1 | 1 | 1 | 1 | 3 | 1 | 1 | 3 | 1 | 1 | 1 | 9 | 1 | 1 | 1 | 1 | 3 | 1 | 3 |
| CCL | 3 | 5 | 3 | 1 | 3 | 3 | 3 | 1 | 3 | 3 | 1 | 1 | 5 | 3 | 5 | 3 | 5 | 3 | 7 | 3 | 1 |
| CFL | 2 | 1 | 2 | 2 | 1 | 2 | 2 | 2 | 1 | 1 | 2 | 1 | 1 | 1 | 1 | 1 | 1 | 1 | 2 | 1 | 1 |
| CPR | 1 | 1 | 4 | 4 | 1 | 1 | 1 | 3 | 1 | 1 | 2 | 1 | 4 | 4 | 2 | 2 | 1 | 4 | 3 | 1 | 1 |
Table 4.
Description of 21 eggplant accessions from the Center for Tropical Horticulture Studies.
| Accessions Code | Fruit Morphology | |
|---|---|---|
| Color | Shape | |
| G02 | Green with stripes and patches | Globular |
| G05 | Light green with stripes and patches | Ovoid |
| G07 | Dark purple with stripes | Club shaped |
| G25 | Dark purple with stripes | Globular |
| G33 | White with stripes | Ellipsoid |
| G37 | Light green with stripes | Obovate |
| G38 | Light green | Cylindrical |
| G44 | Purple | Ovoid |
| G45 | Green with stripes | Ovoid |
| G48 | Green with stripes and patches | Obovate |
| G55 | Light green | Cylindrical |
| G60 | Green with stripes | Ovoid |
| G61 | Dark purple | Cylindrical |
| G63 | Light purple with stripes | Club shaped |
| G75 | Light green | Club shaped |
| G76 | Very light purple with green stripes | Ovoid |
| G78 | Very light green | Ellipsoid |
| G80 | Purple with stripes | Club shaped |
| GJ | Very dark purple | Cylindrical |
| GK | Yellow | Ovoid |
| GR | White | Globular |
© 2018 by the authors. Licensee MDPI, Basel, Switzerland. This article is an open access article distributed under the terms and conditions of the Creative Commons Attribution (CC BY) license (http://creativecommons.org/licenses/by/4.0/).
Share and Cite
MDPI and ACS Style
Hanifah, A.; Maharijaya, A.; Putri, S.P.; Laviña, W.A.; Sobir. Untargeted Metabolomics Analysis of Eggplant (Solanum melongena L.) Fruit and Its Correlation to Fruit Morphologies. Metabolites 2018, 8, 49. https://doi.org/10.3390/metabo8030049
AMA Style
Hanifah A, Maharijaya A, Putri SP, Laviña WA, Sobir. Untargeted Metabolomics Analysis of Eggplant (Solanum melongena L.) Fruit and Its Correlation to Fruit Morphologies. Metabolites. 2018; 8(3):49. https://doi.org/10.3390/metabo8030049
Chicago/Turabian StyleHanifah, Abu, Awang Maharijaya, Sastia P. Putri, Walter A. Laviña, and Sobir. 2018. "Untargeted Metabolomics Analysis of Eggplant (Solanum melongena L.) Fruit and Its Correlation to Fruit Morphologies" Metabolites 8, no. 3: 49. https://doi.org/10.3390/metabo8030049
Note that from the first issue of 2016, this journal uses article numbers instead of page numbers. See further details here.