
Decoding Biosynthetic Pathways in Plants by Pulse-Chase Strategies Using 13CO2 as a Universal Tracer †

Abstract
:
1. Introduction
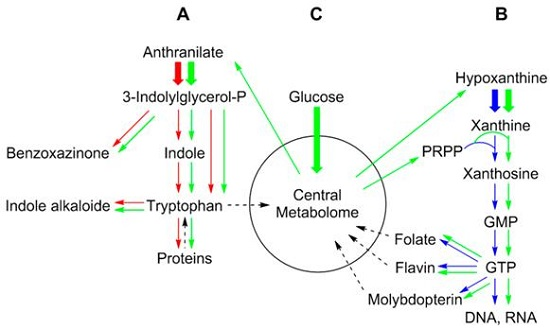
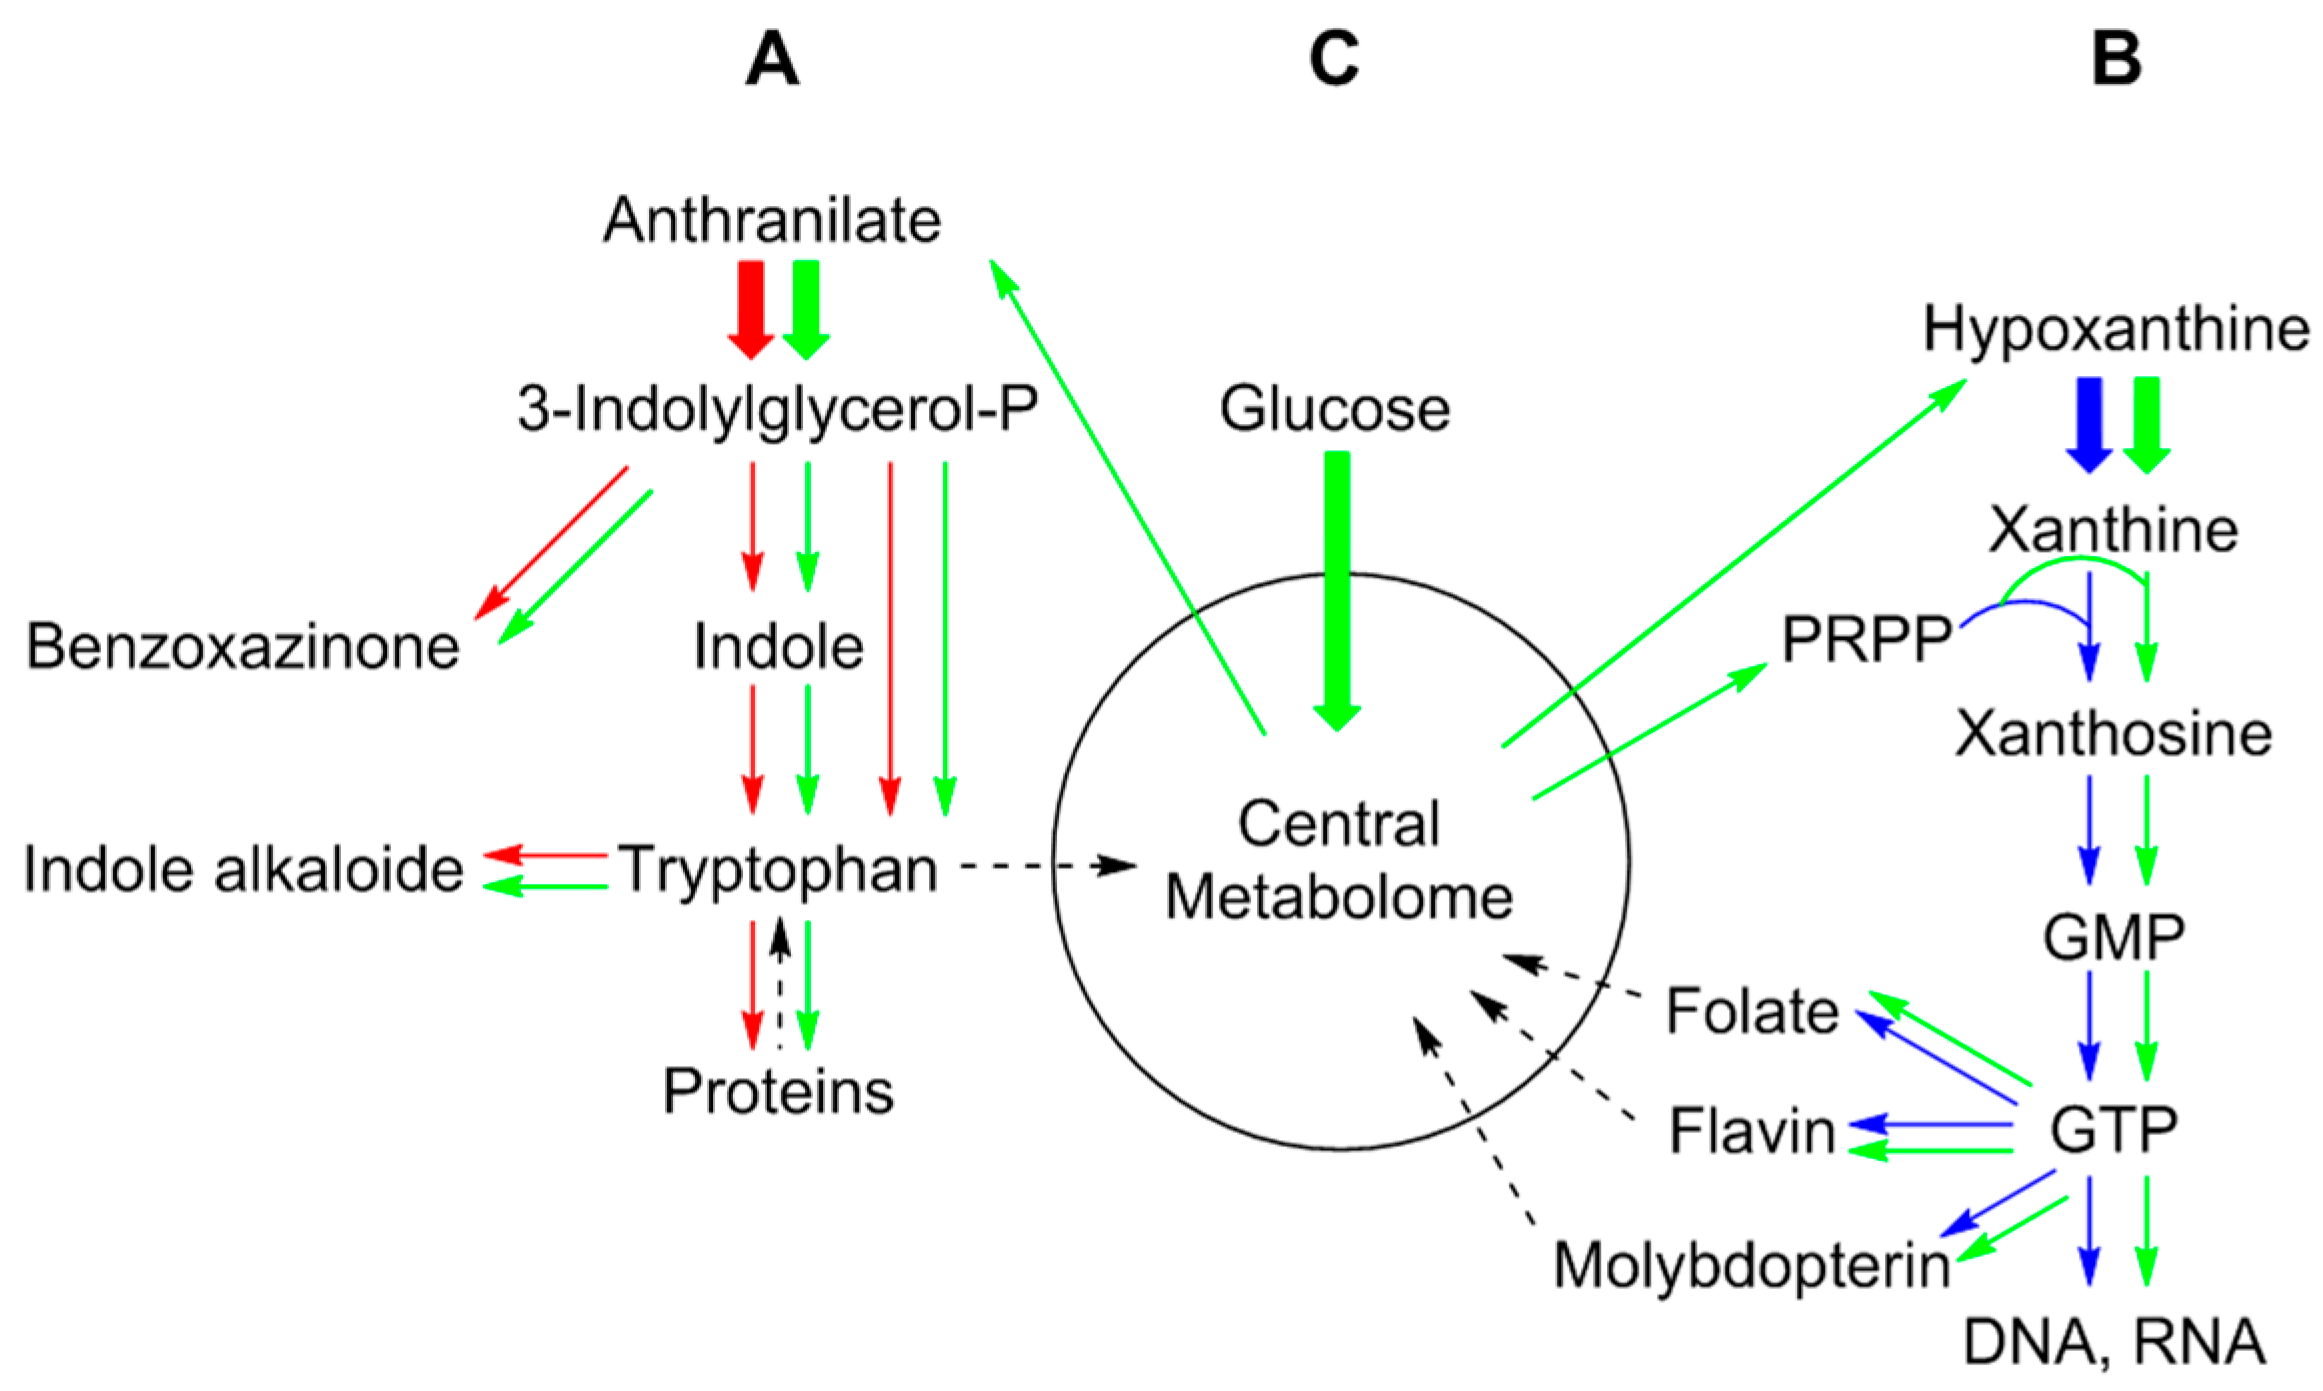
2. Metabolic Networks
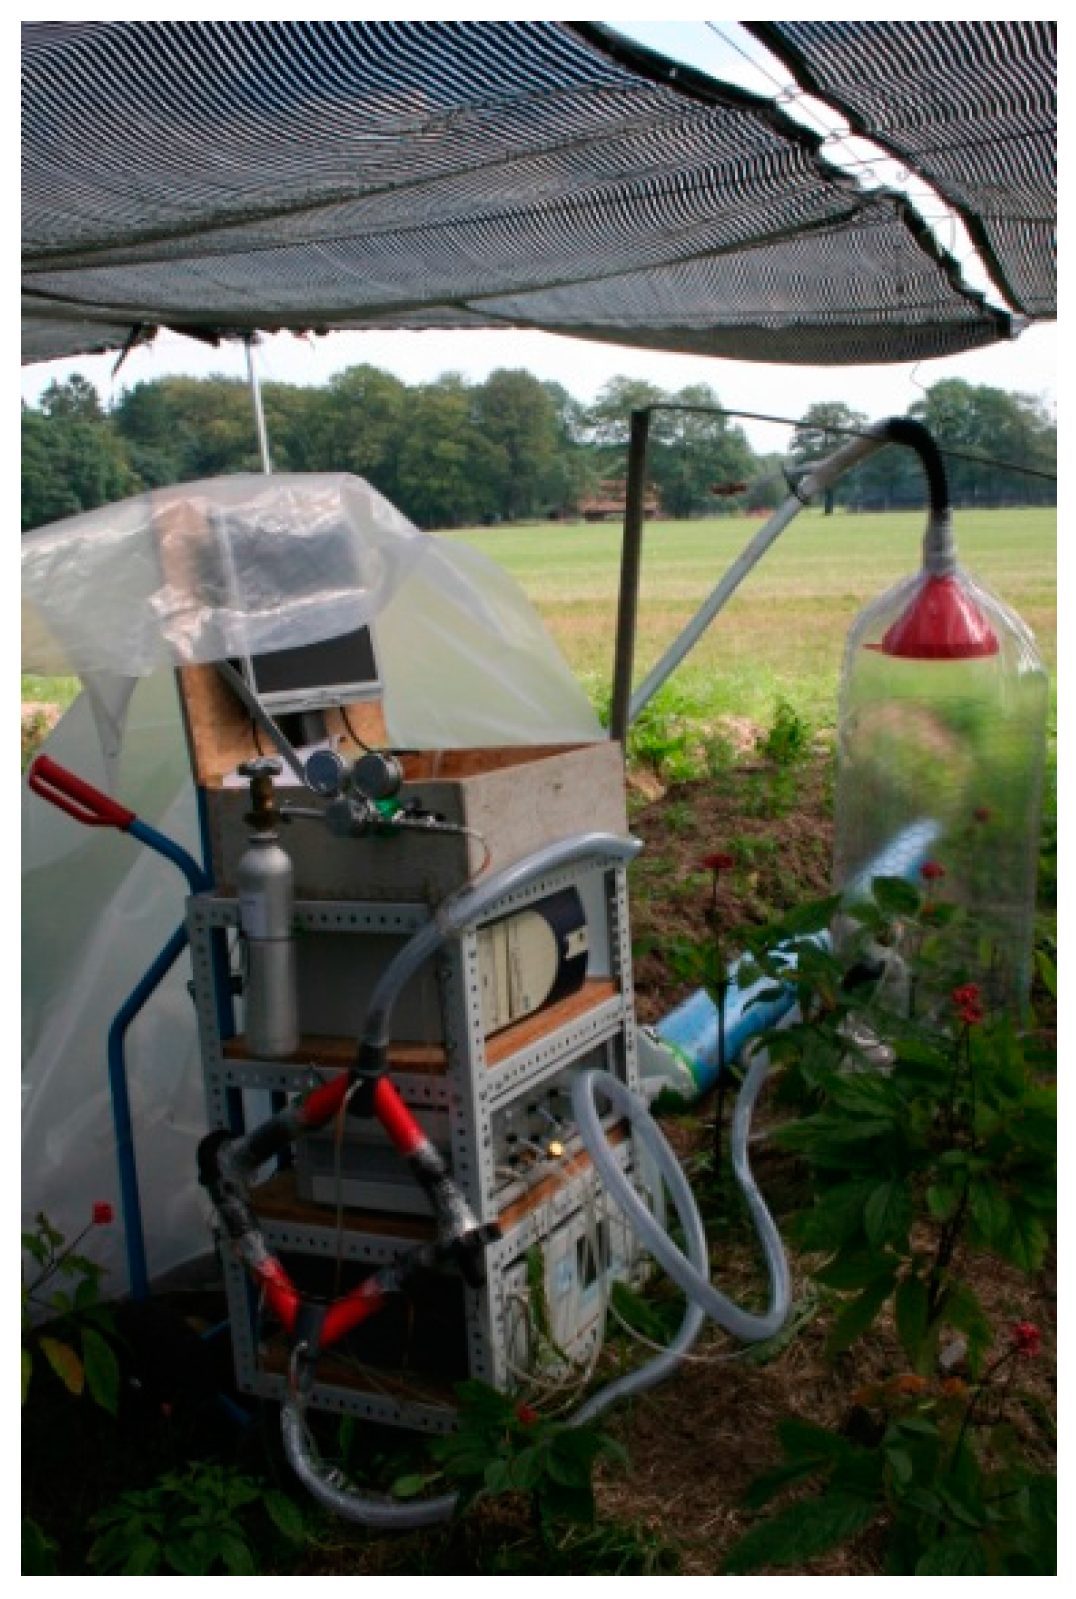
3. Technical Hurdles for Tracer Studies in Plants
4. Biochemistry of 13CO2 Pulse-Chase Experiments
5. Terminology of 13C Isotopologue Mixtures
6. A Short Primer to 13C-NMR Spectra of Complex Isotopologues and Isotopologue Mixtures
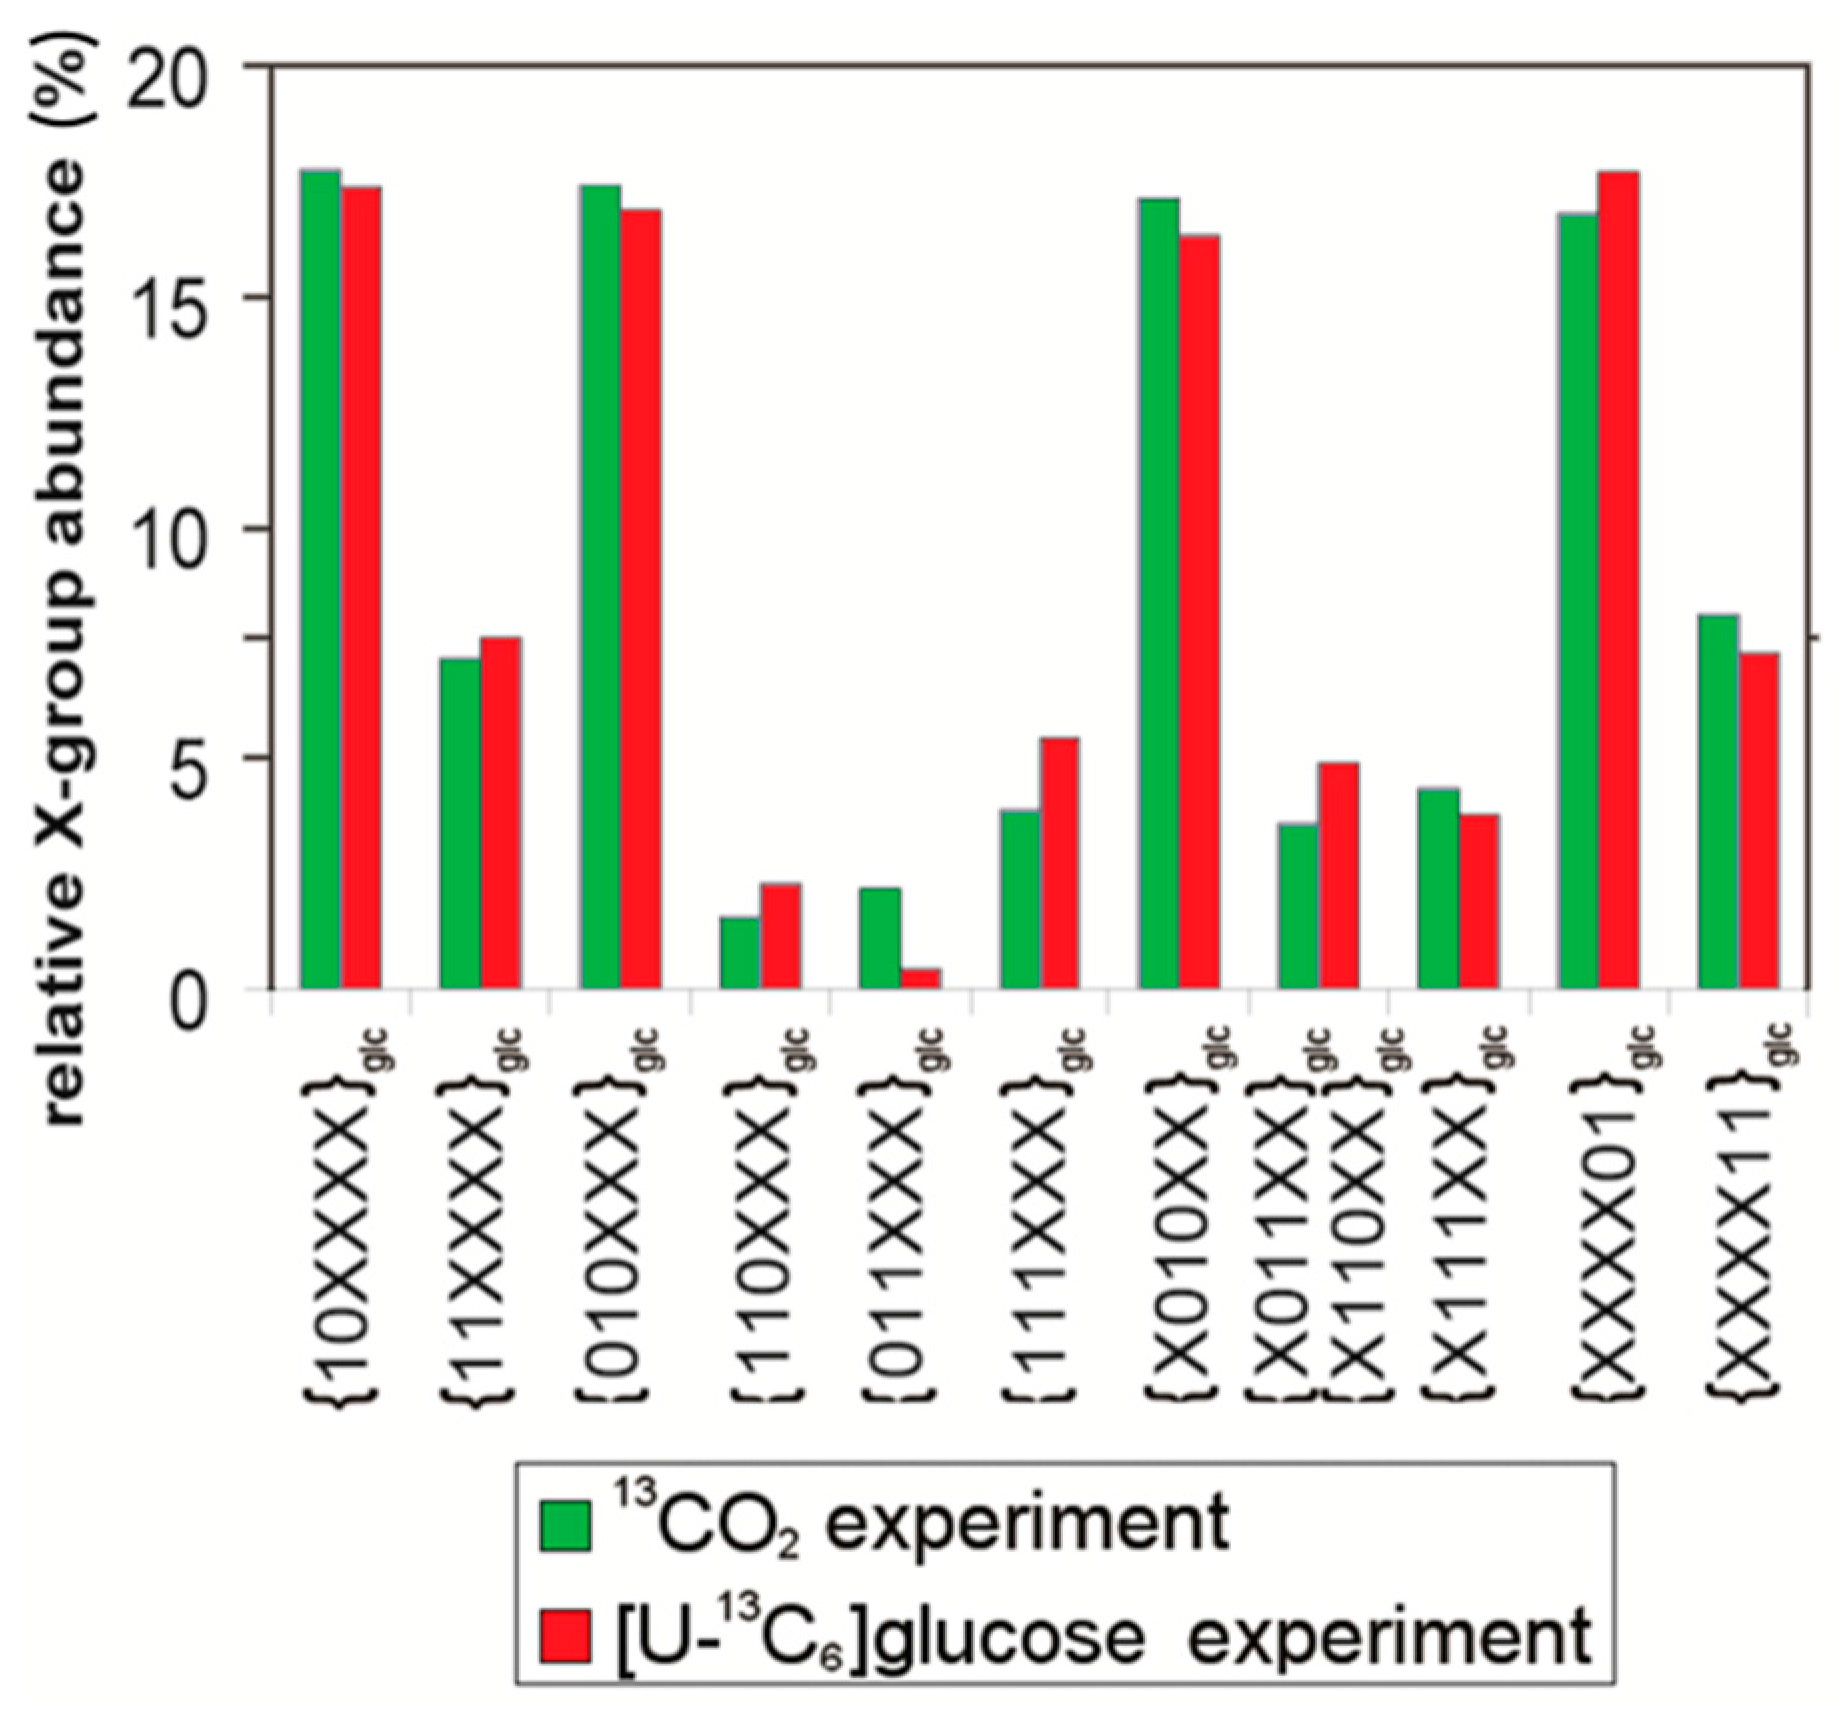
7. Similar Labeling Patterns of Metabolic Glucose in Tobacco Plants Exposed to [U-13C6]glucose or 13CO2
8. Comparison of Labeling Patterns of Plant Secondary Products as Observed in Experiments with [U-13C6]glucose or 13CO2
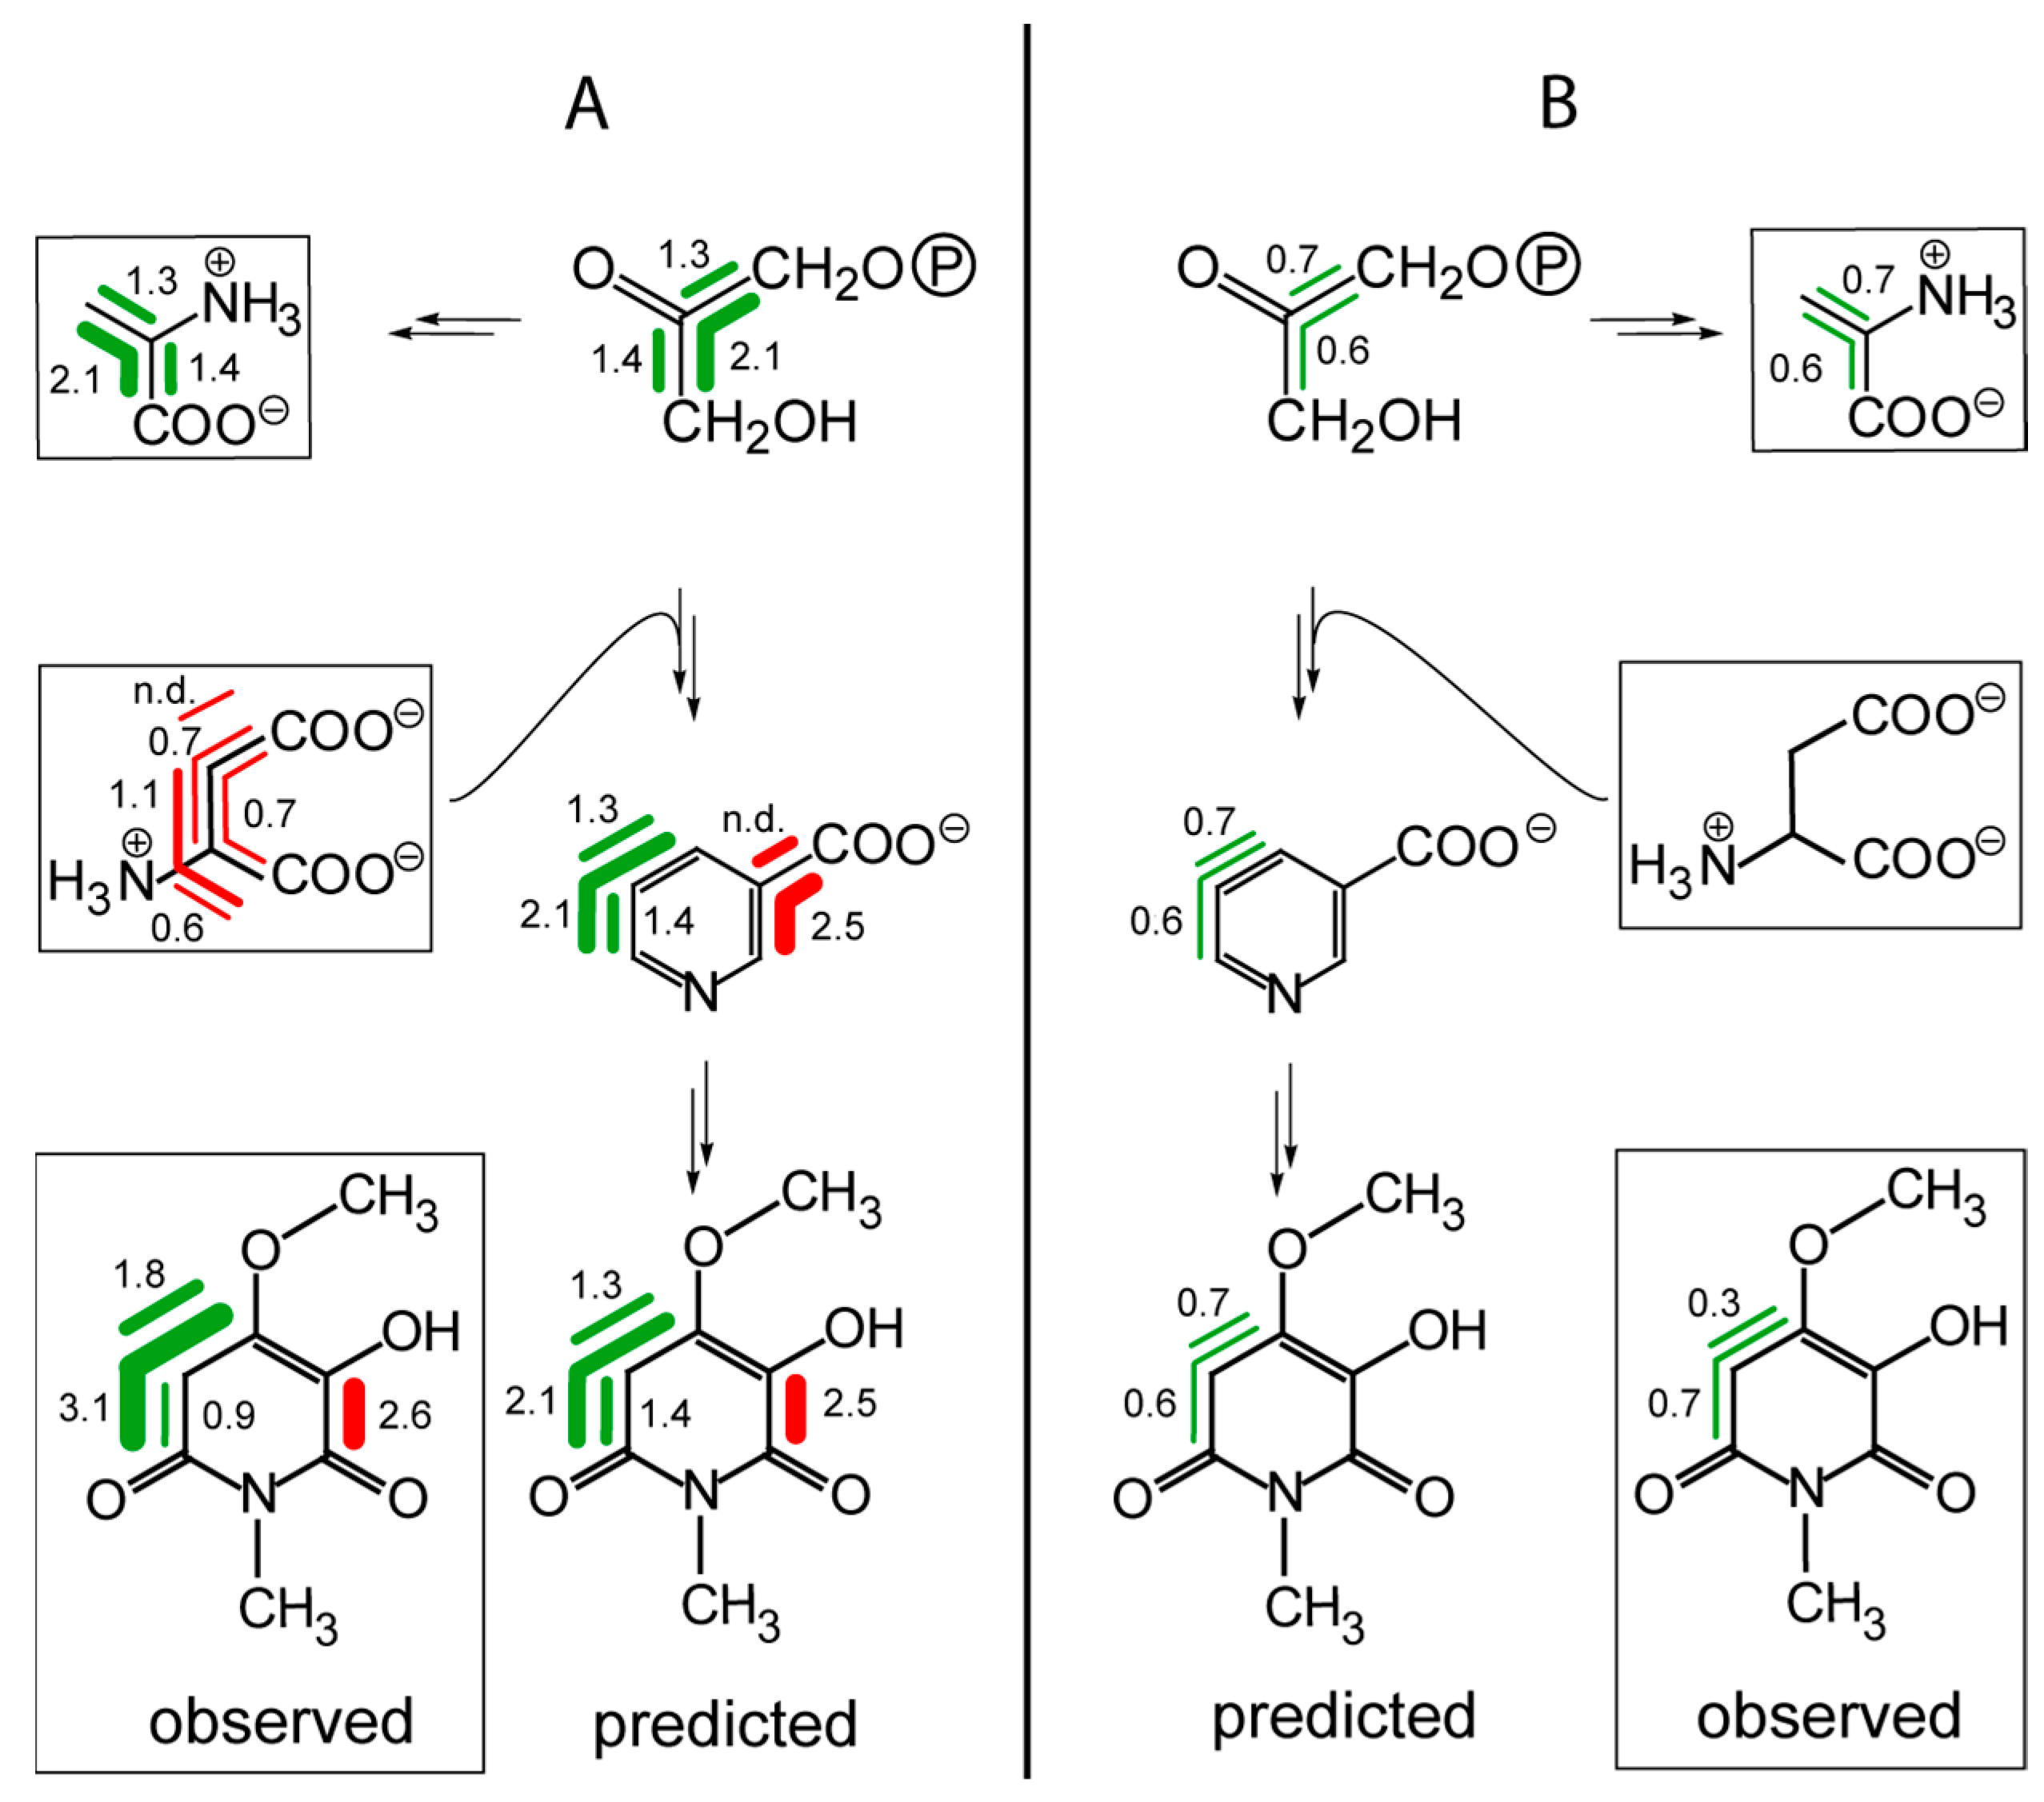
8.1. Nicotine
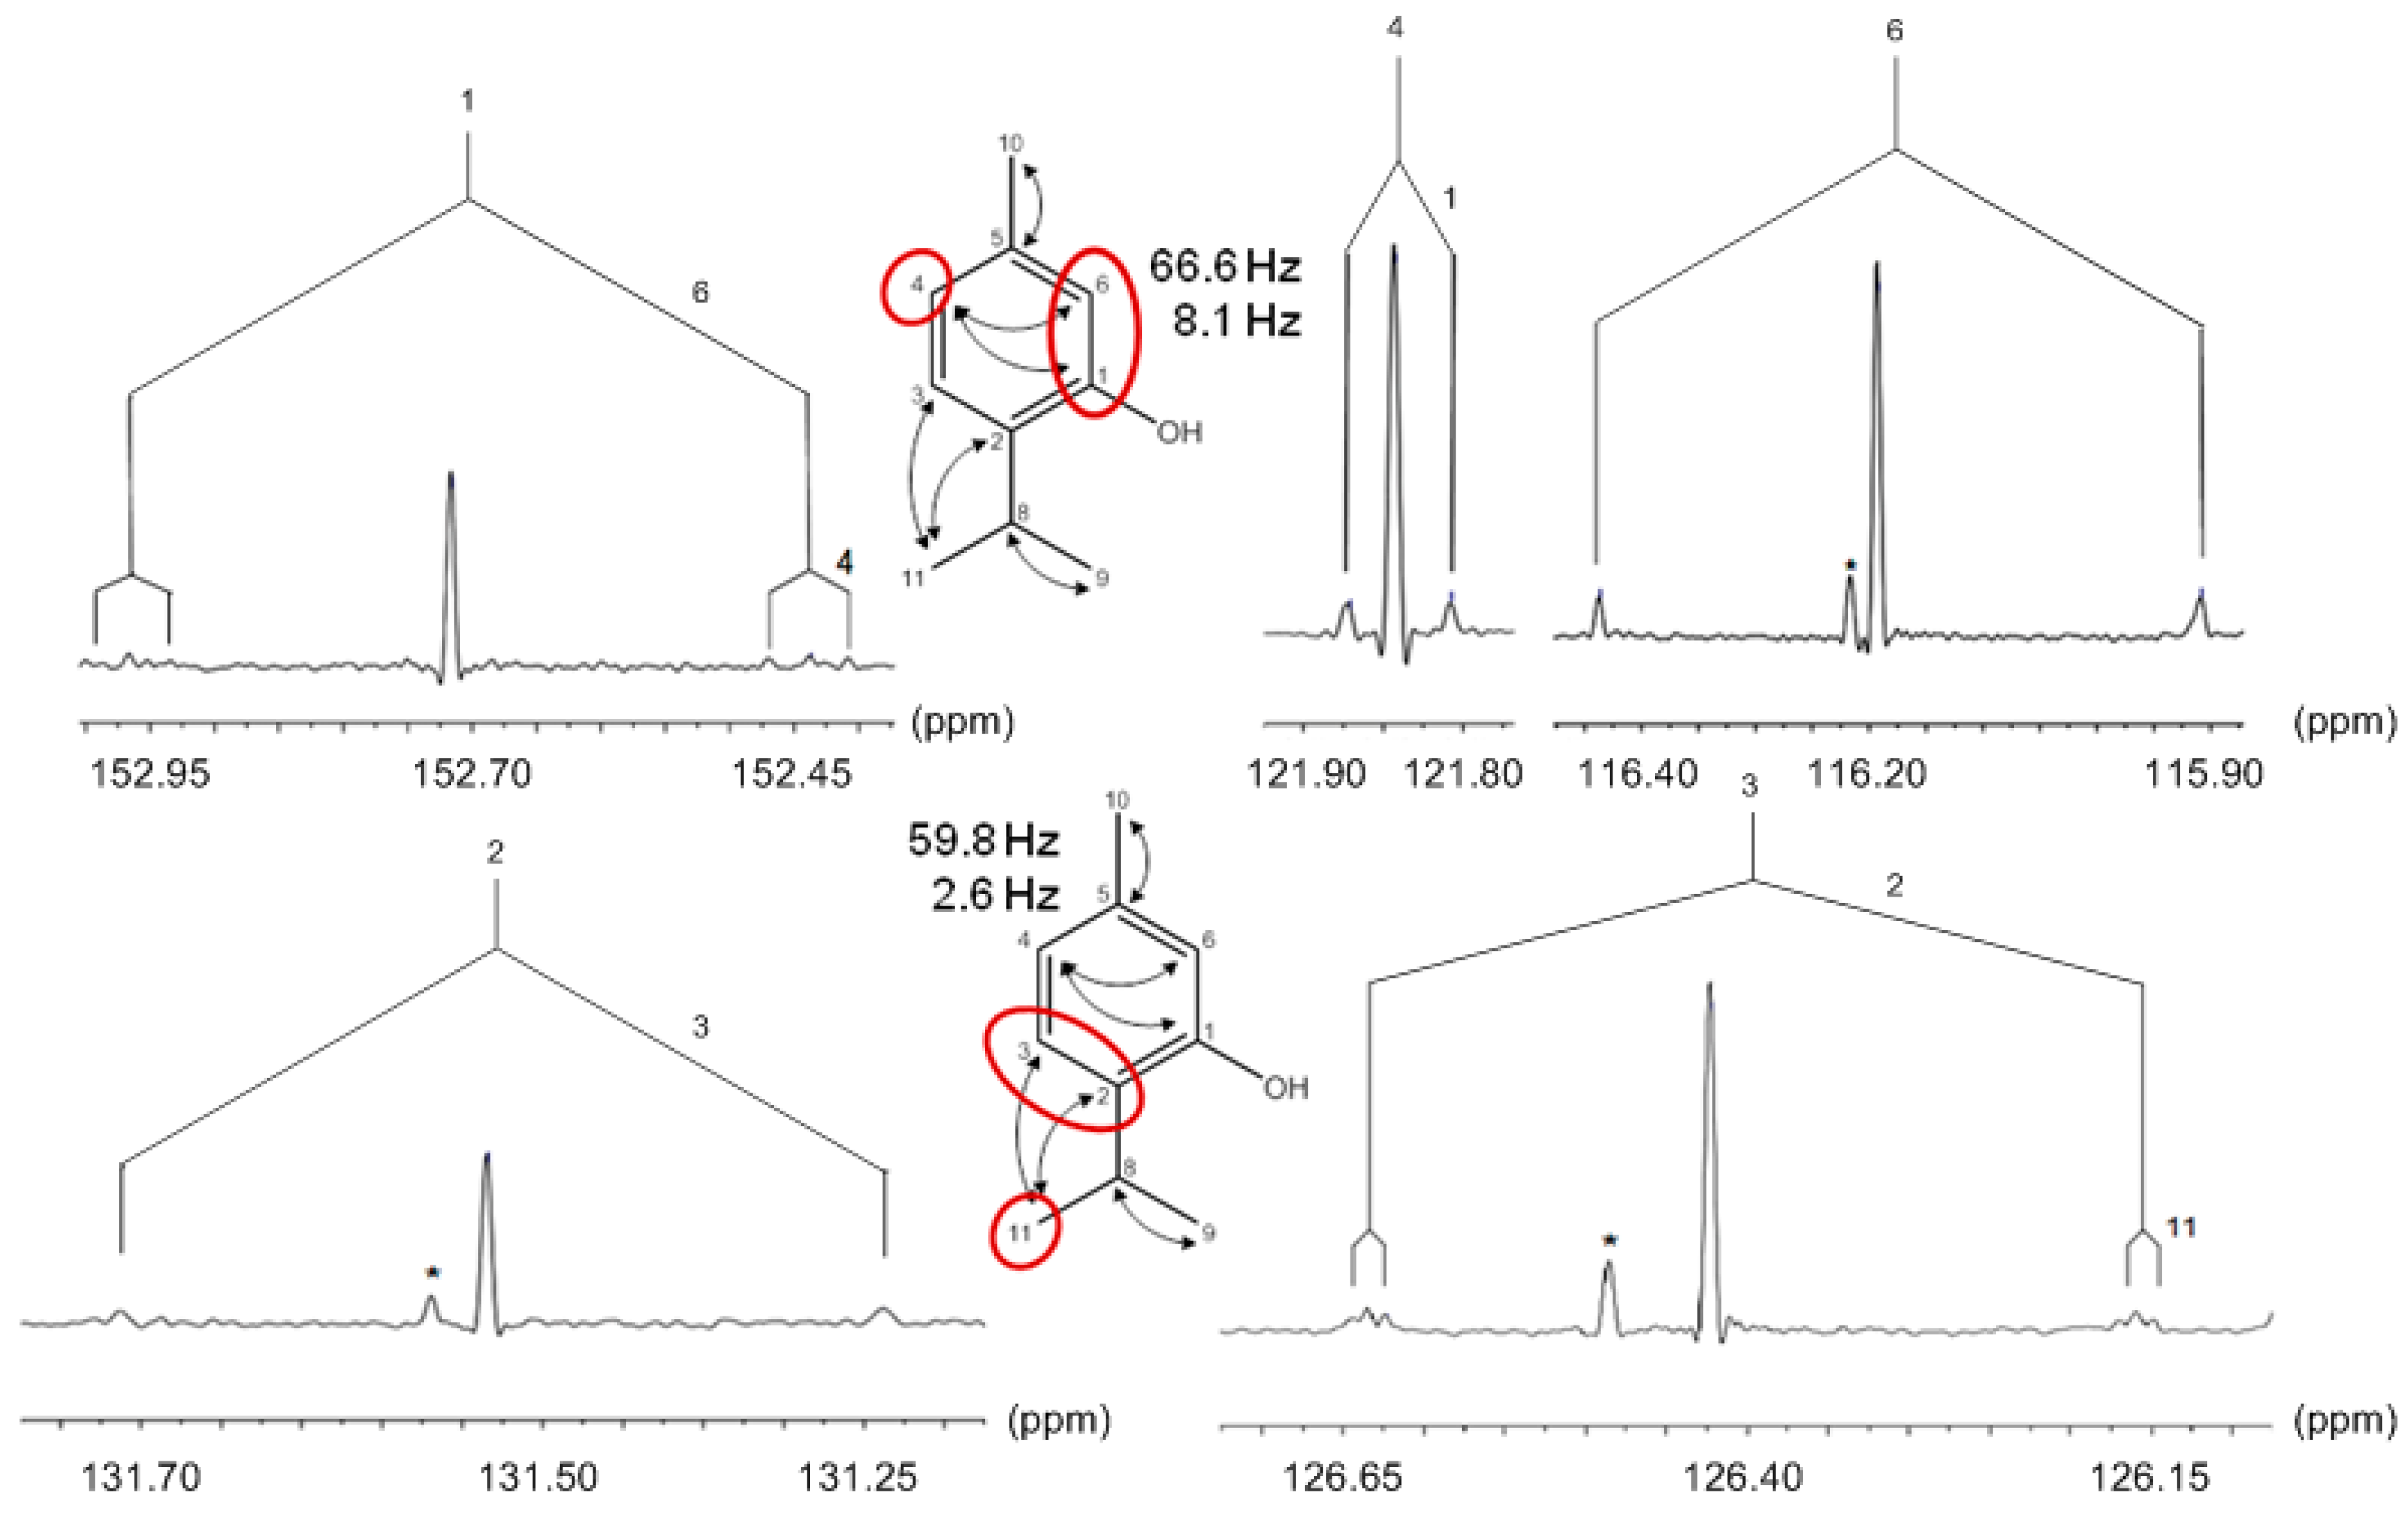
8.2. Hermidin
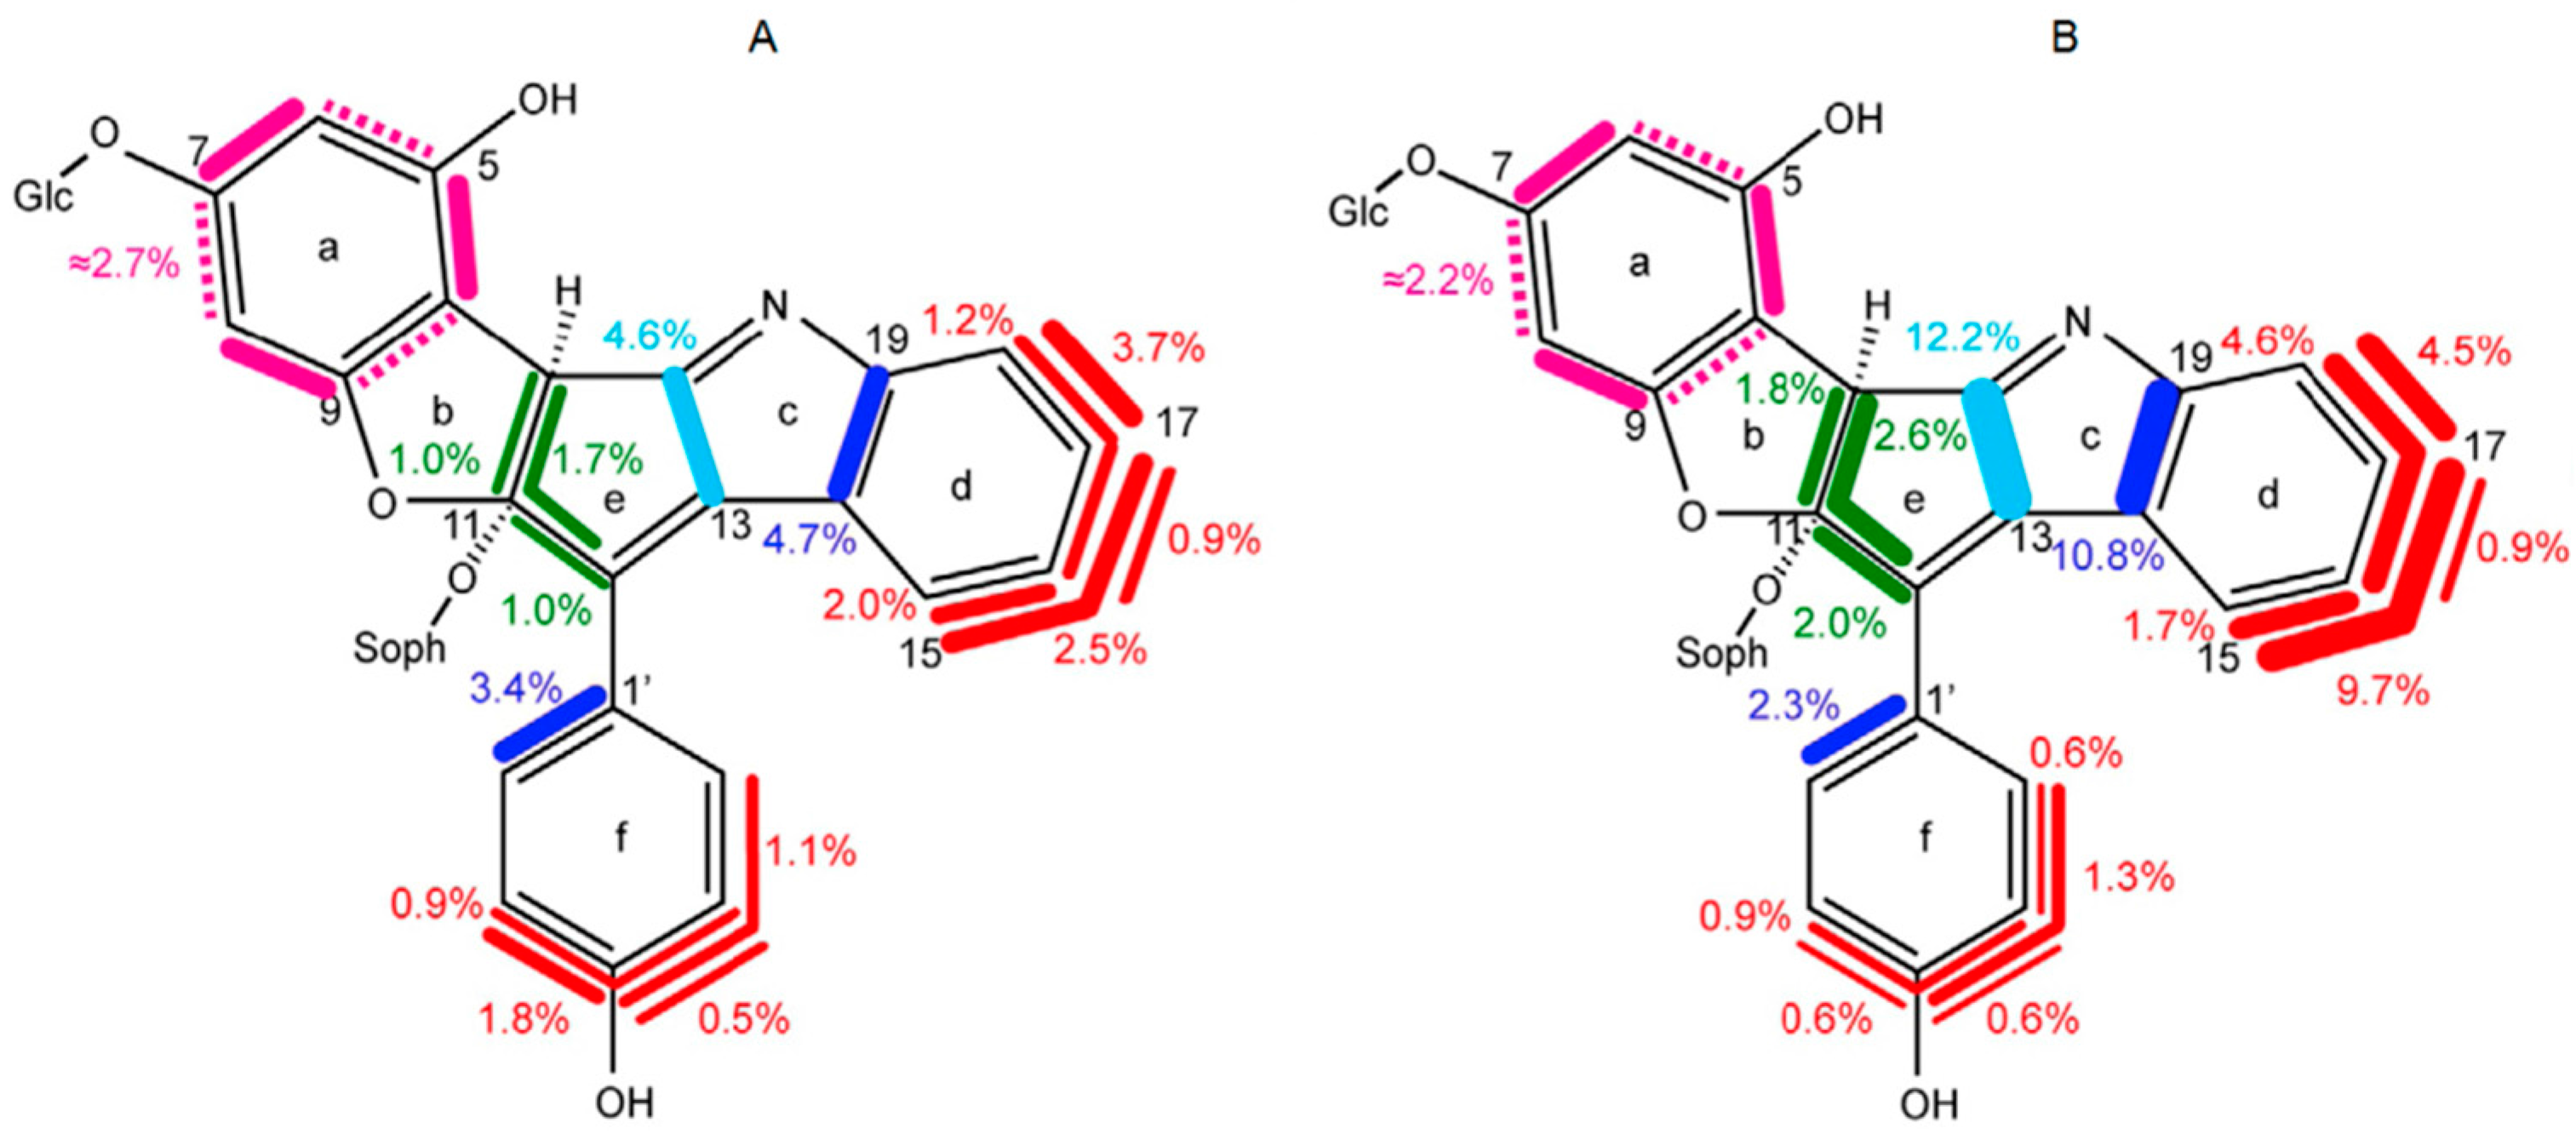
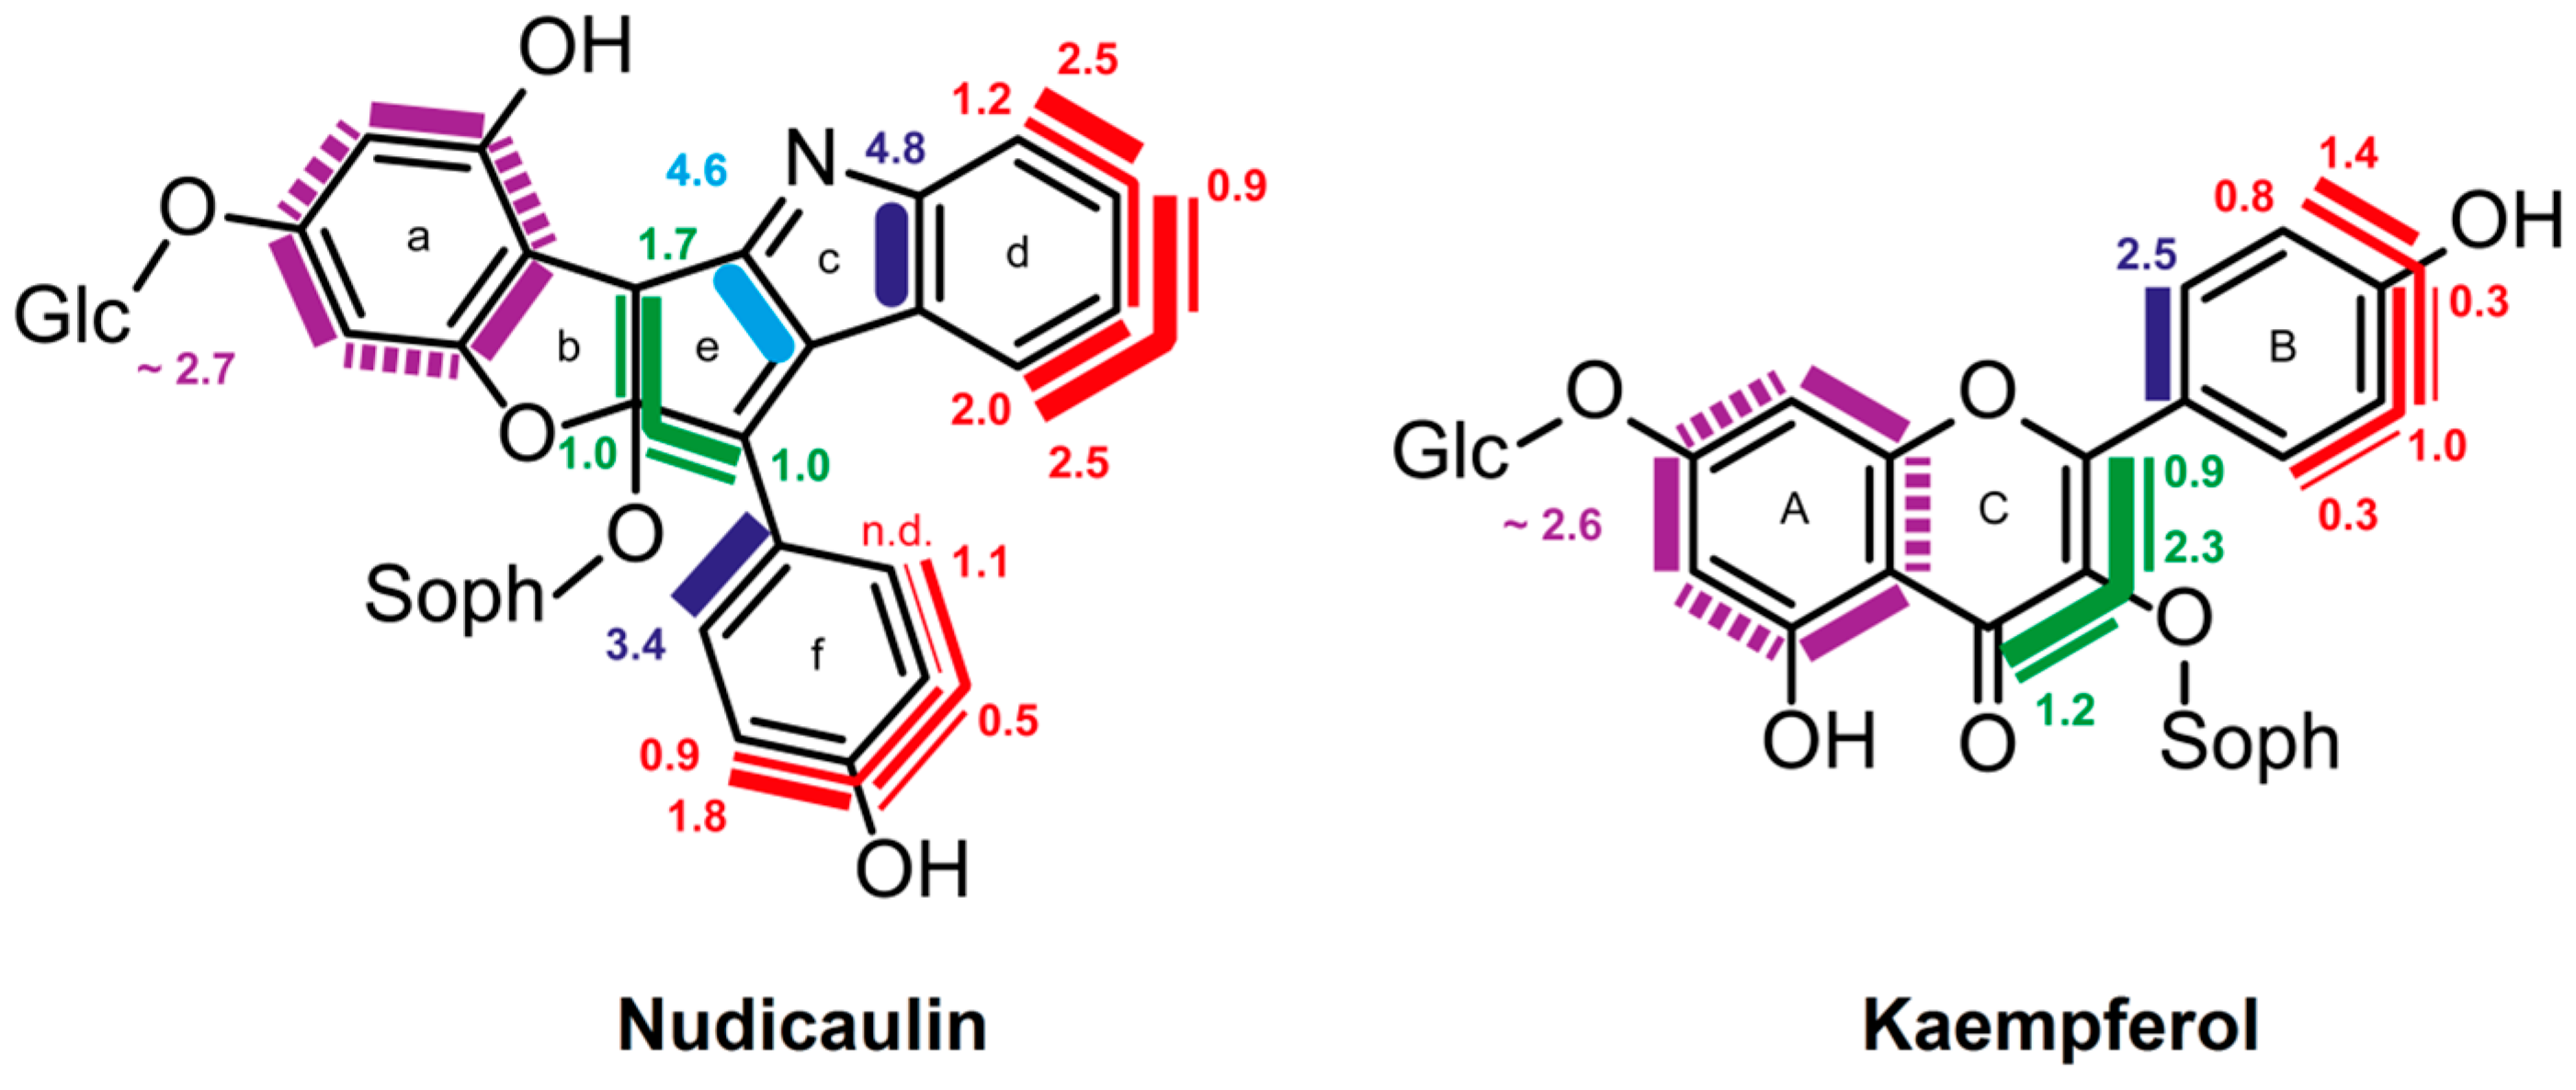
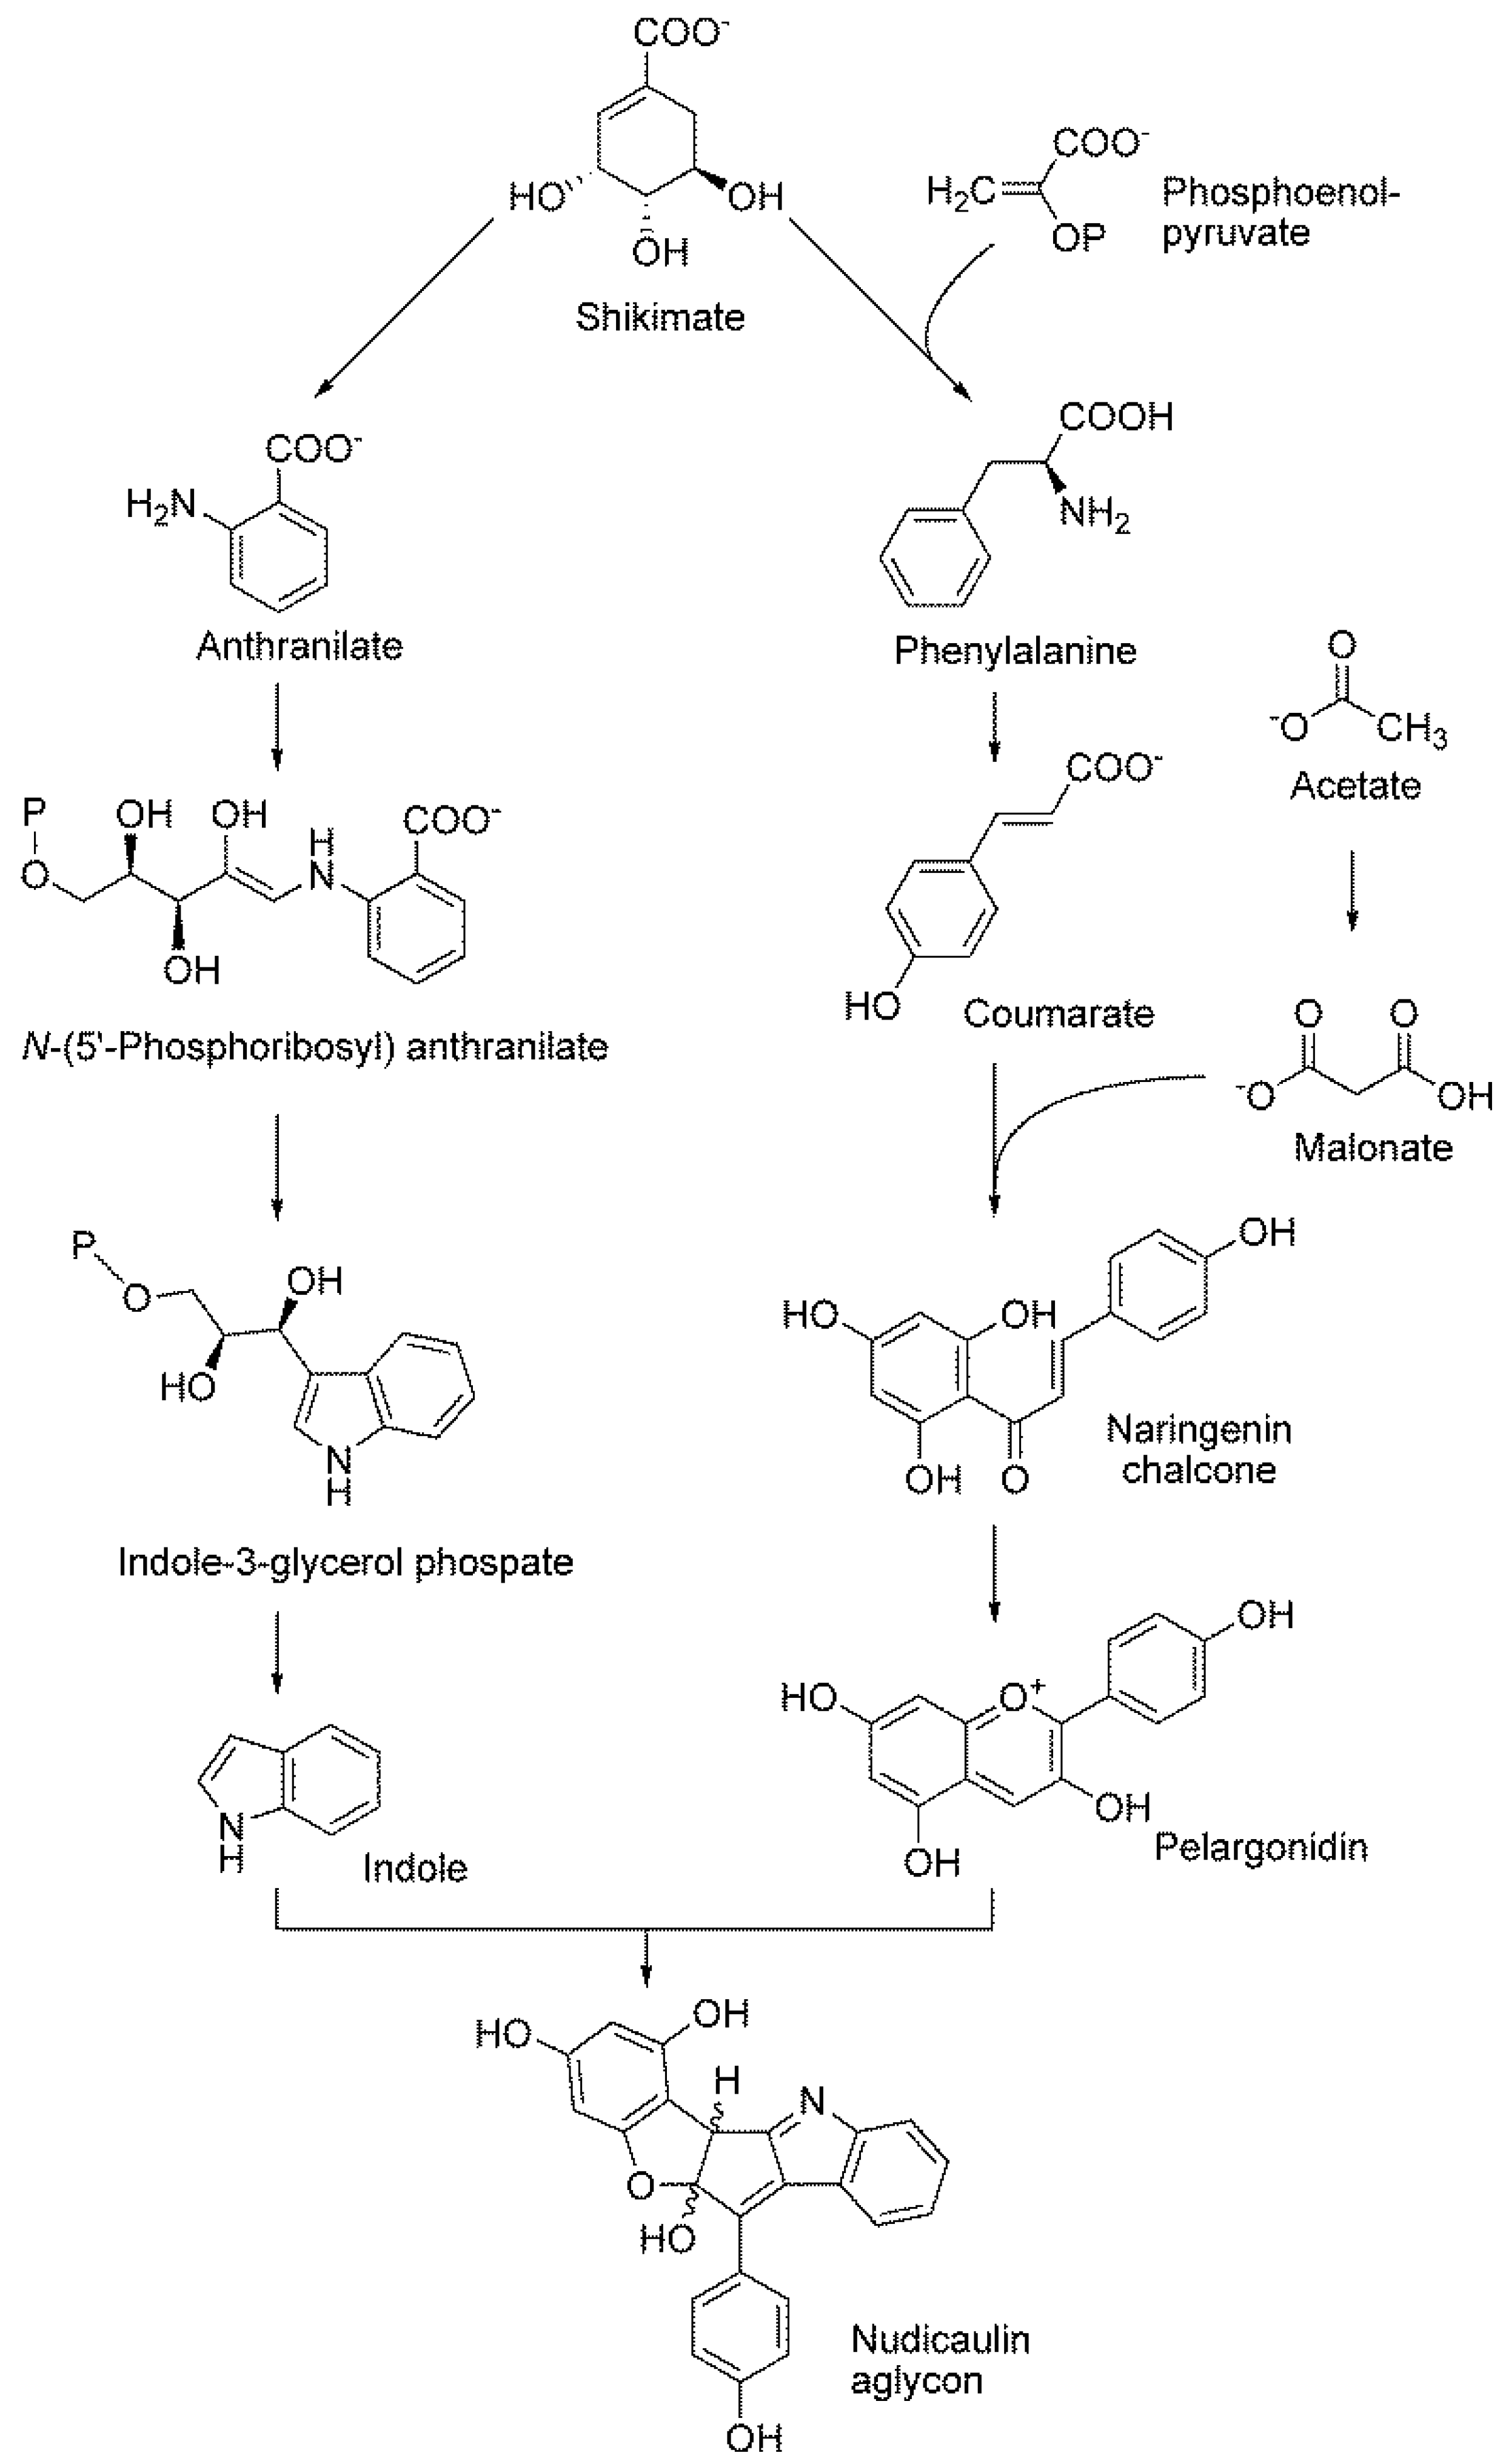
8.3. Nudicaulin
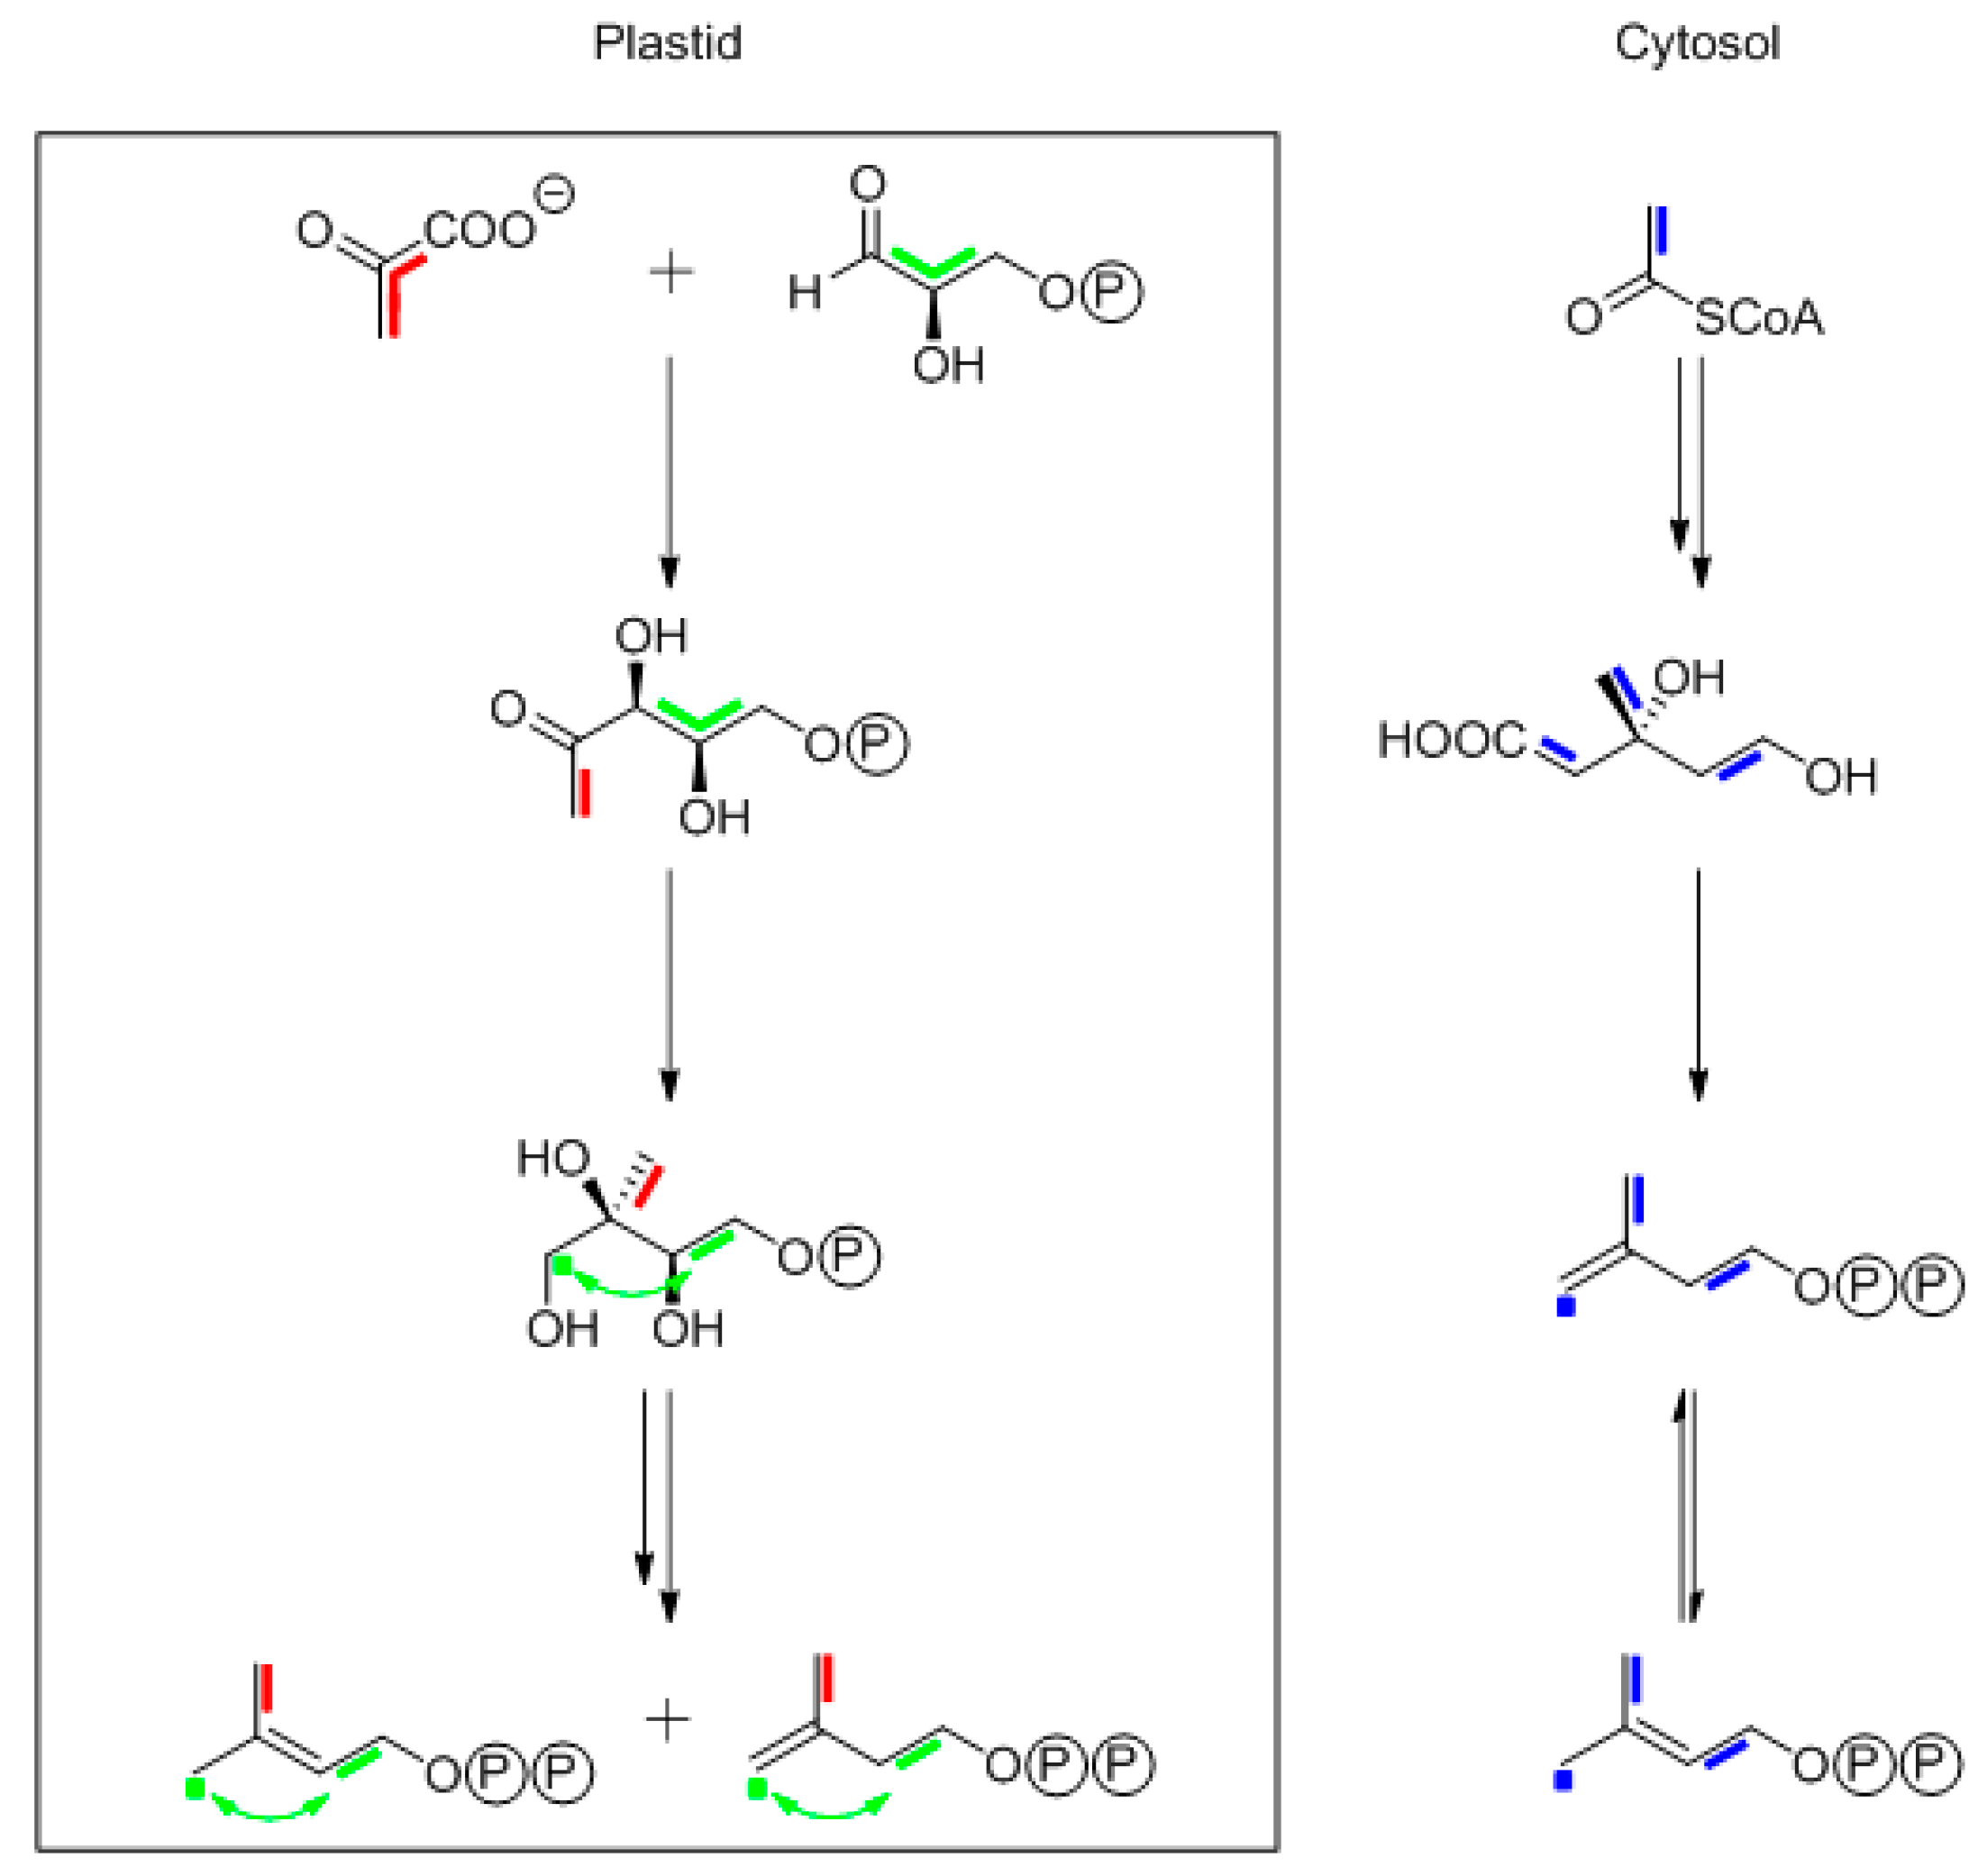
9. Biosynthesis of Terpenes Studied by 13CO2 Experiments
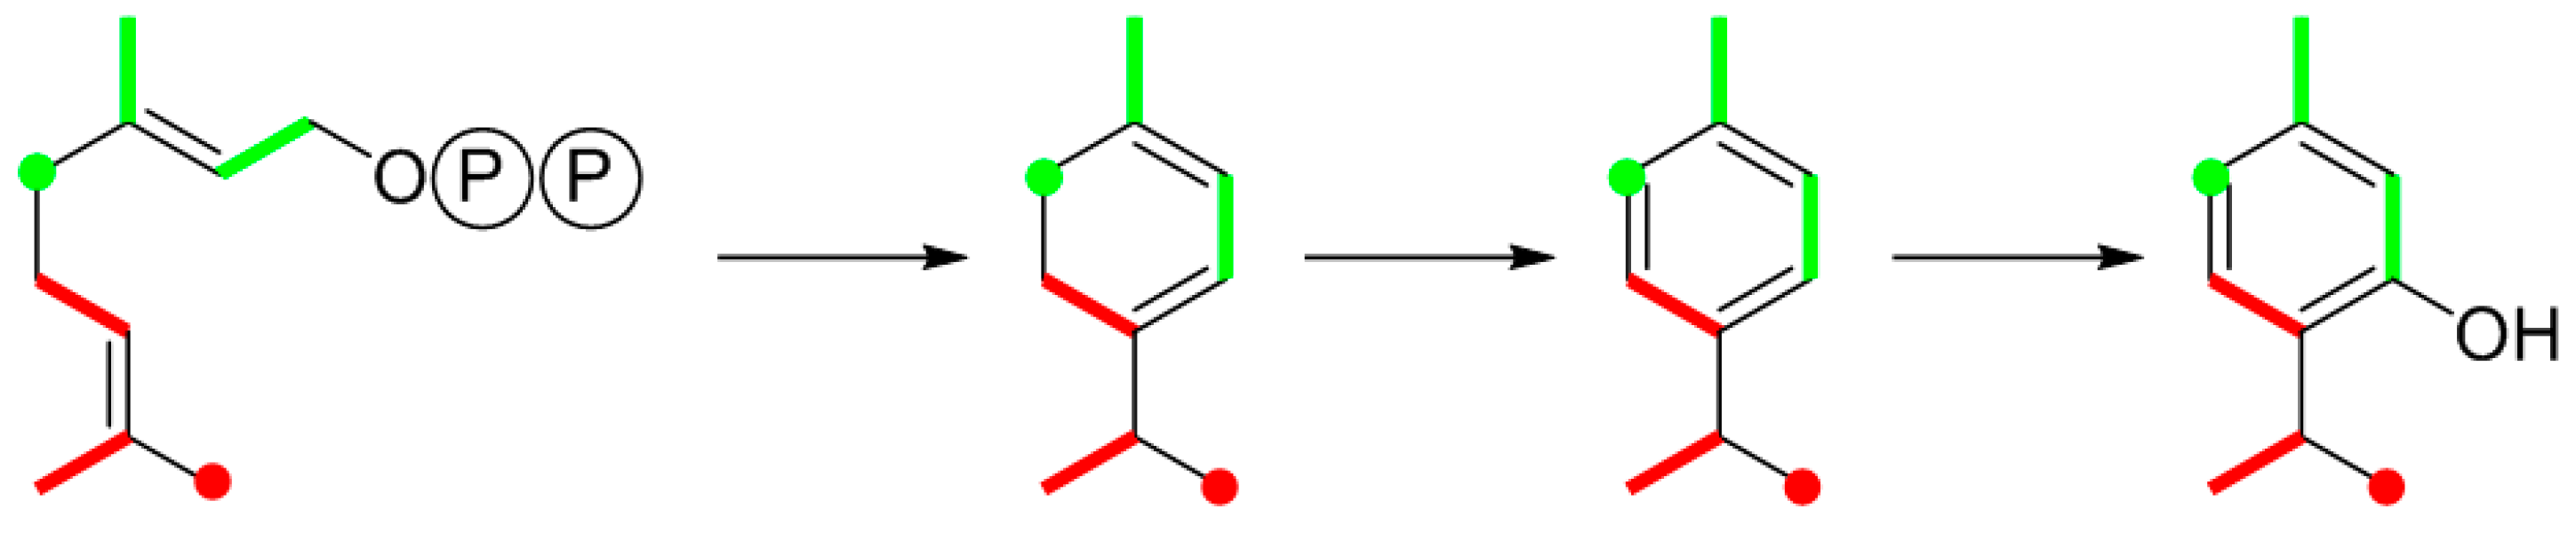
9.1. Thymol
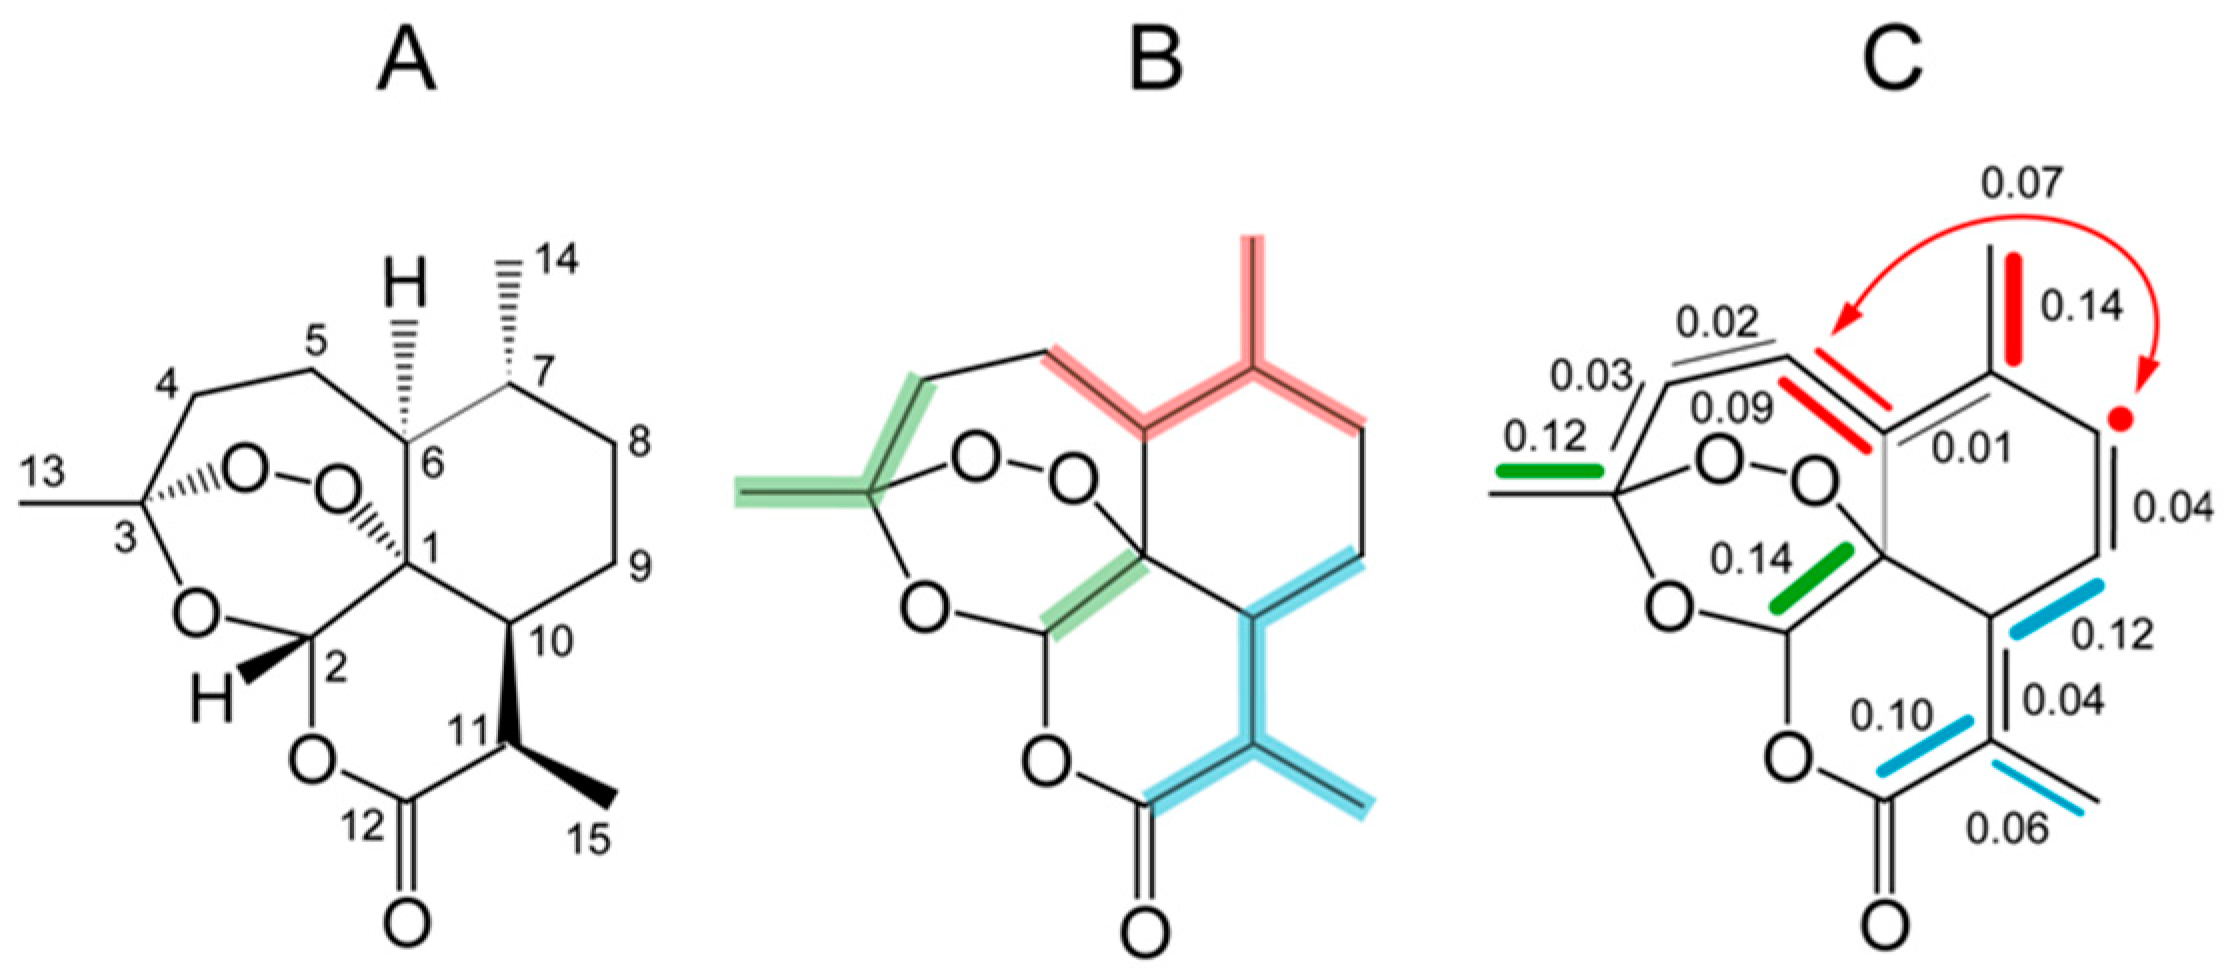
9.2. Artemisinin
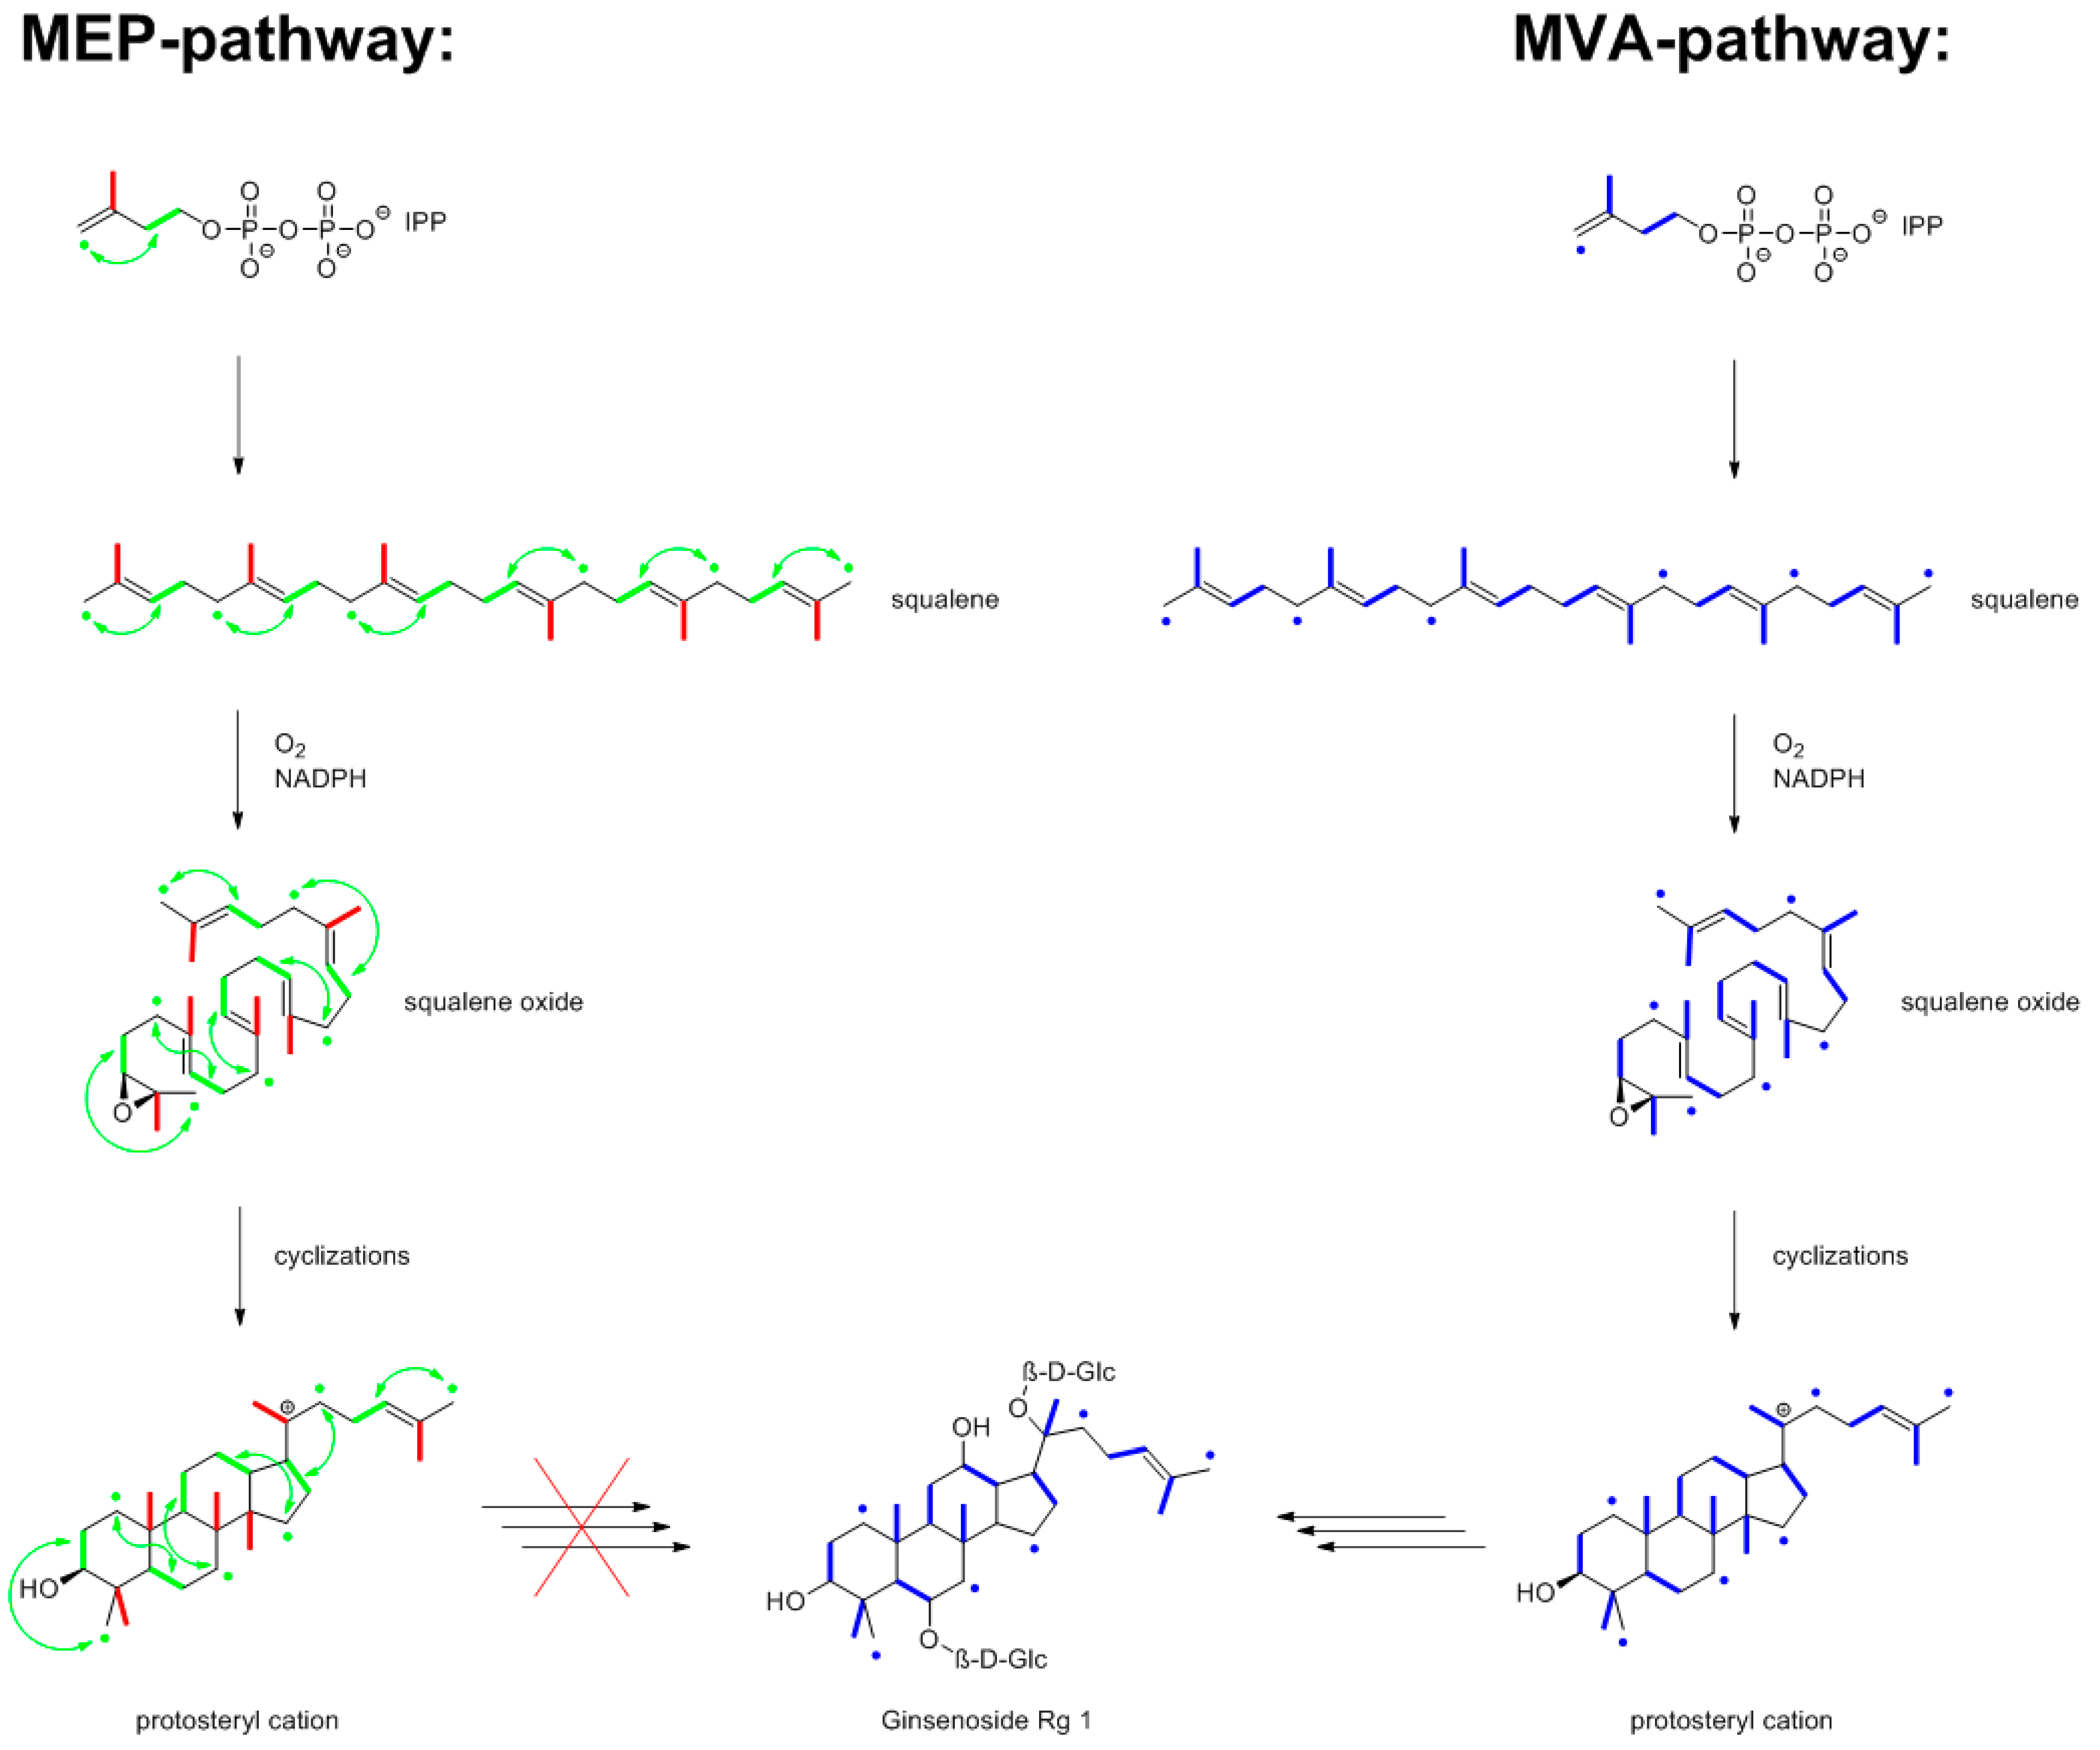
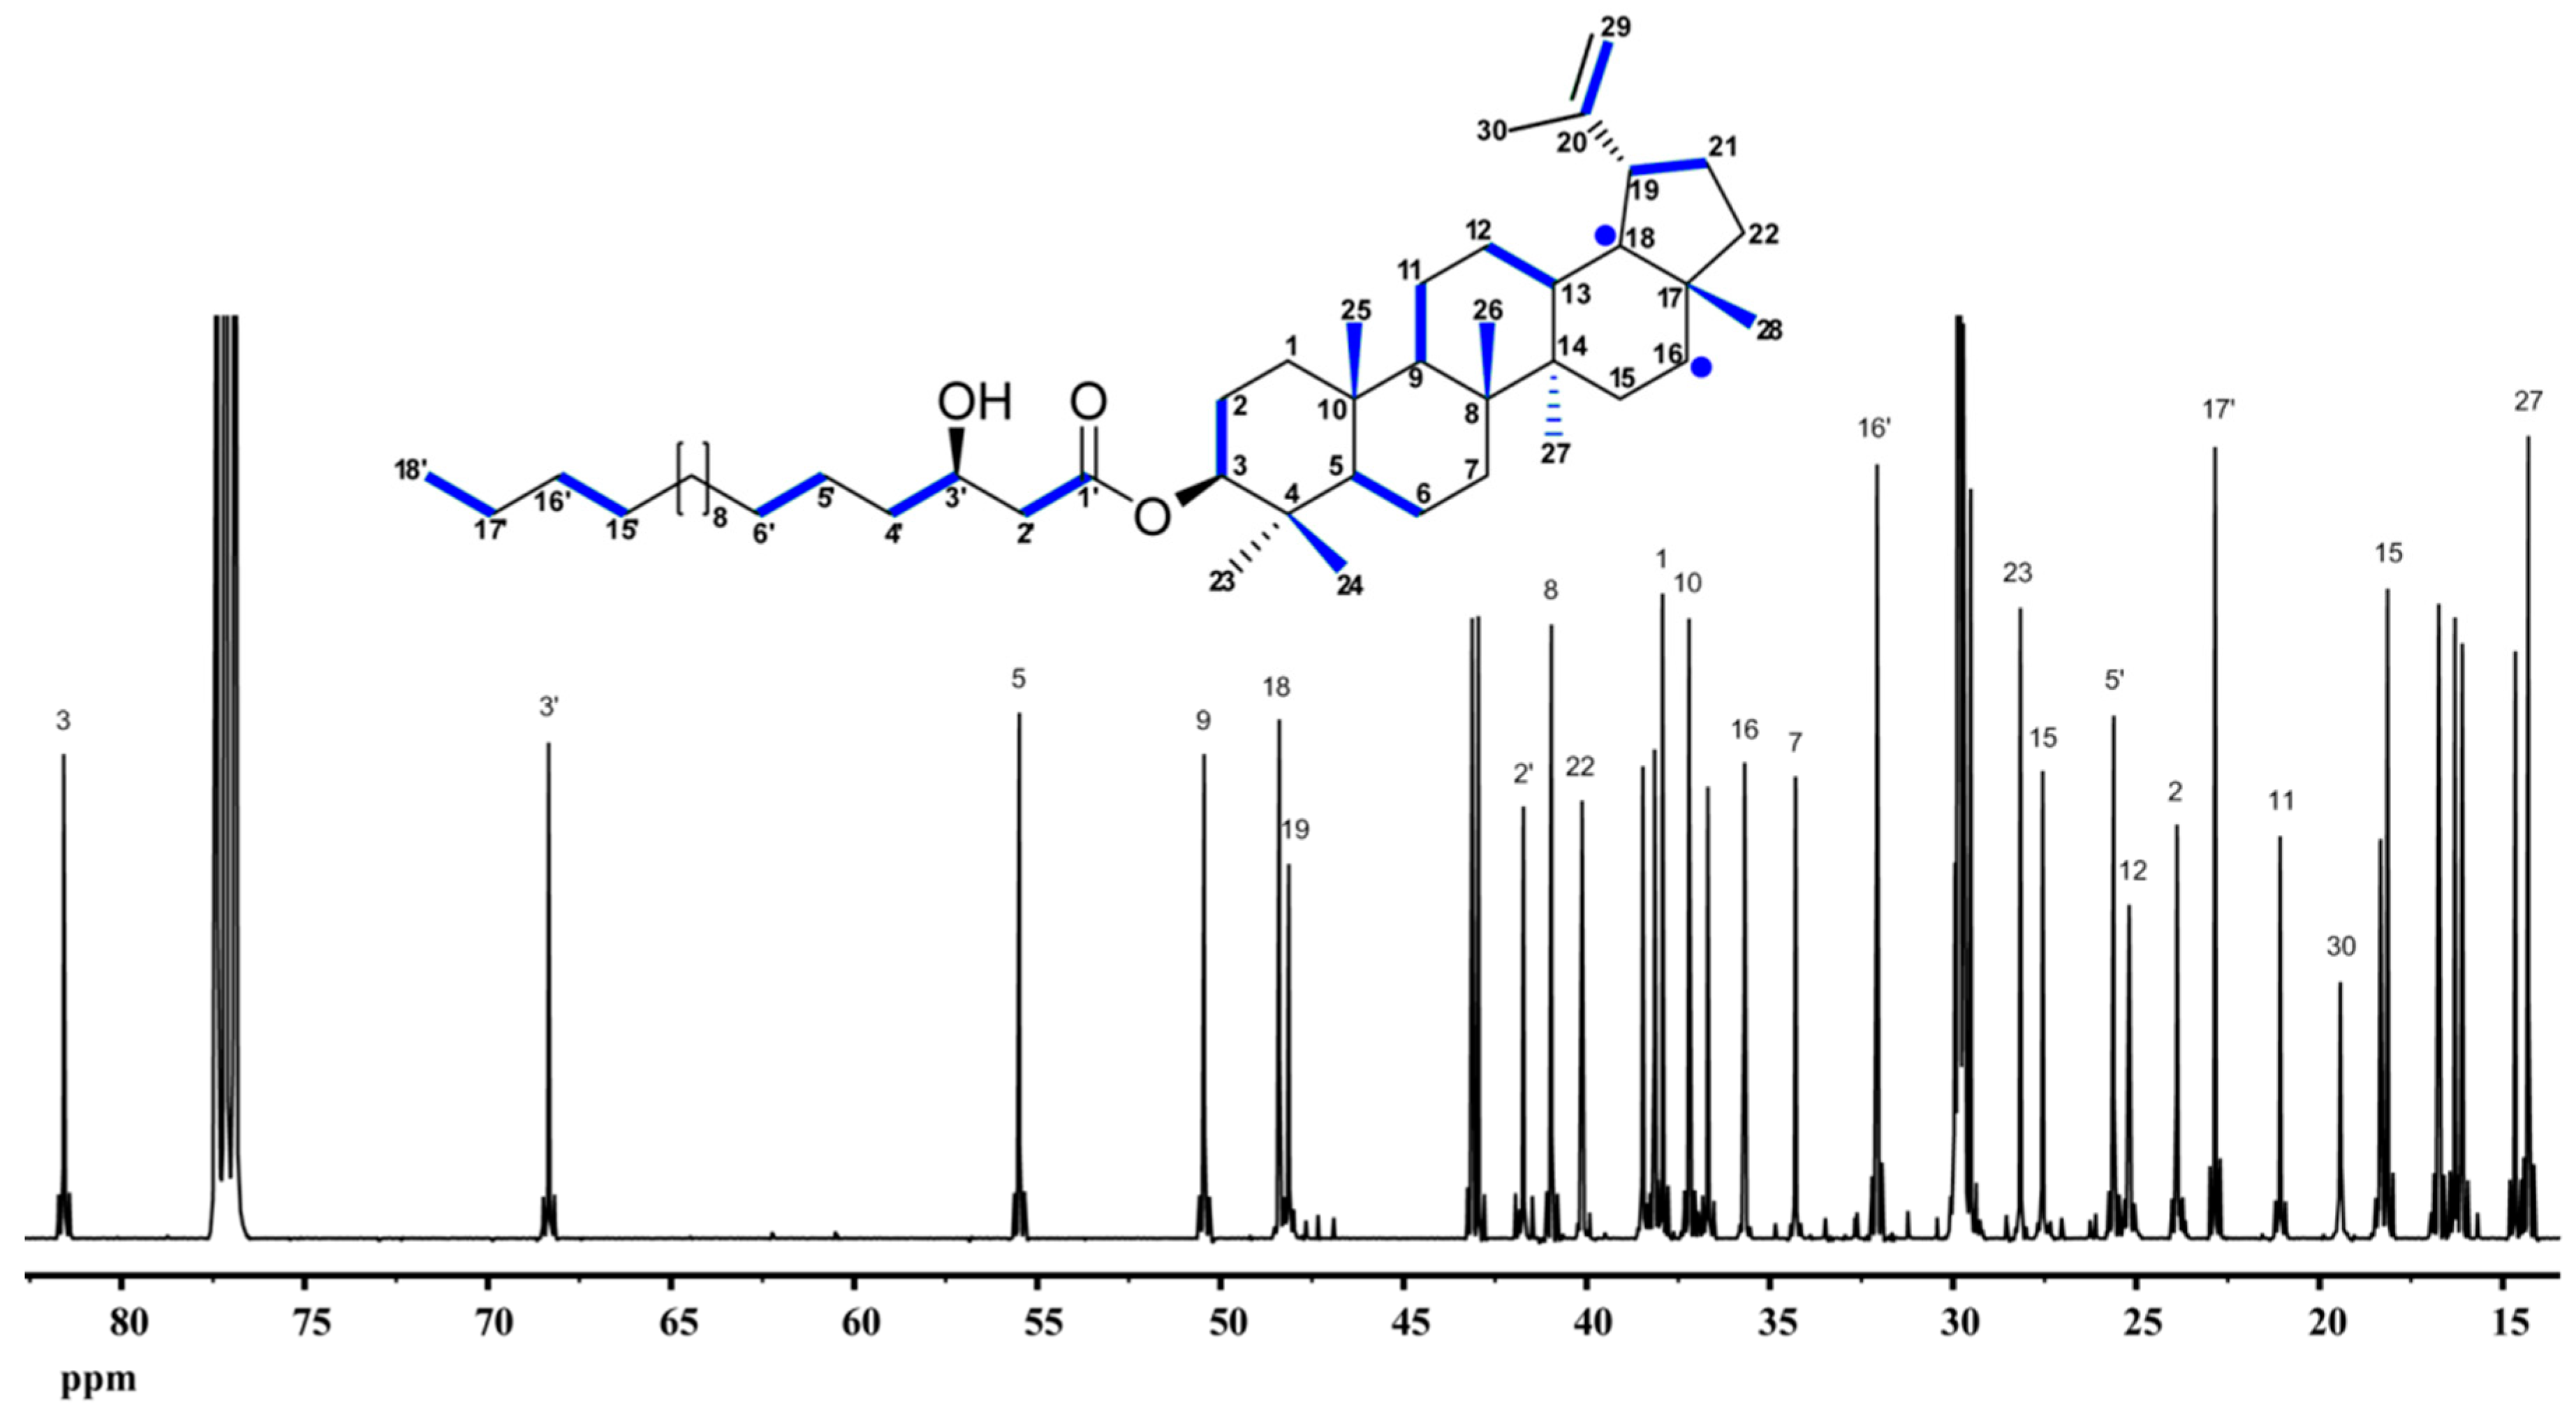
9.3. Ginsenosides
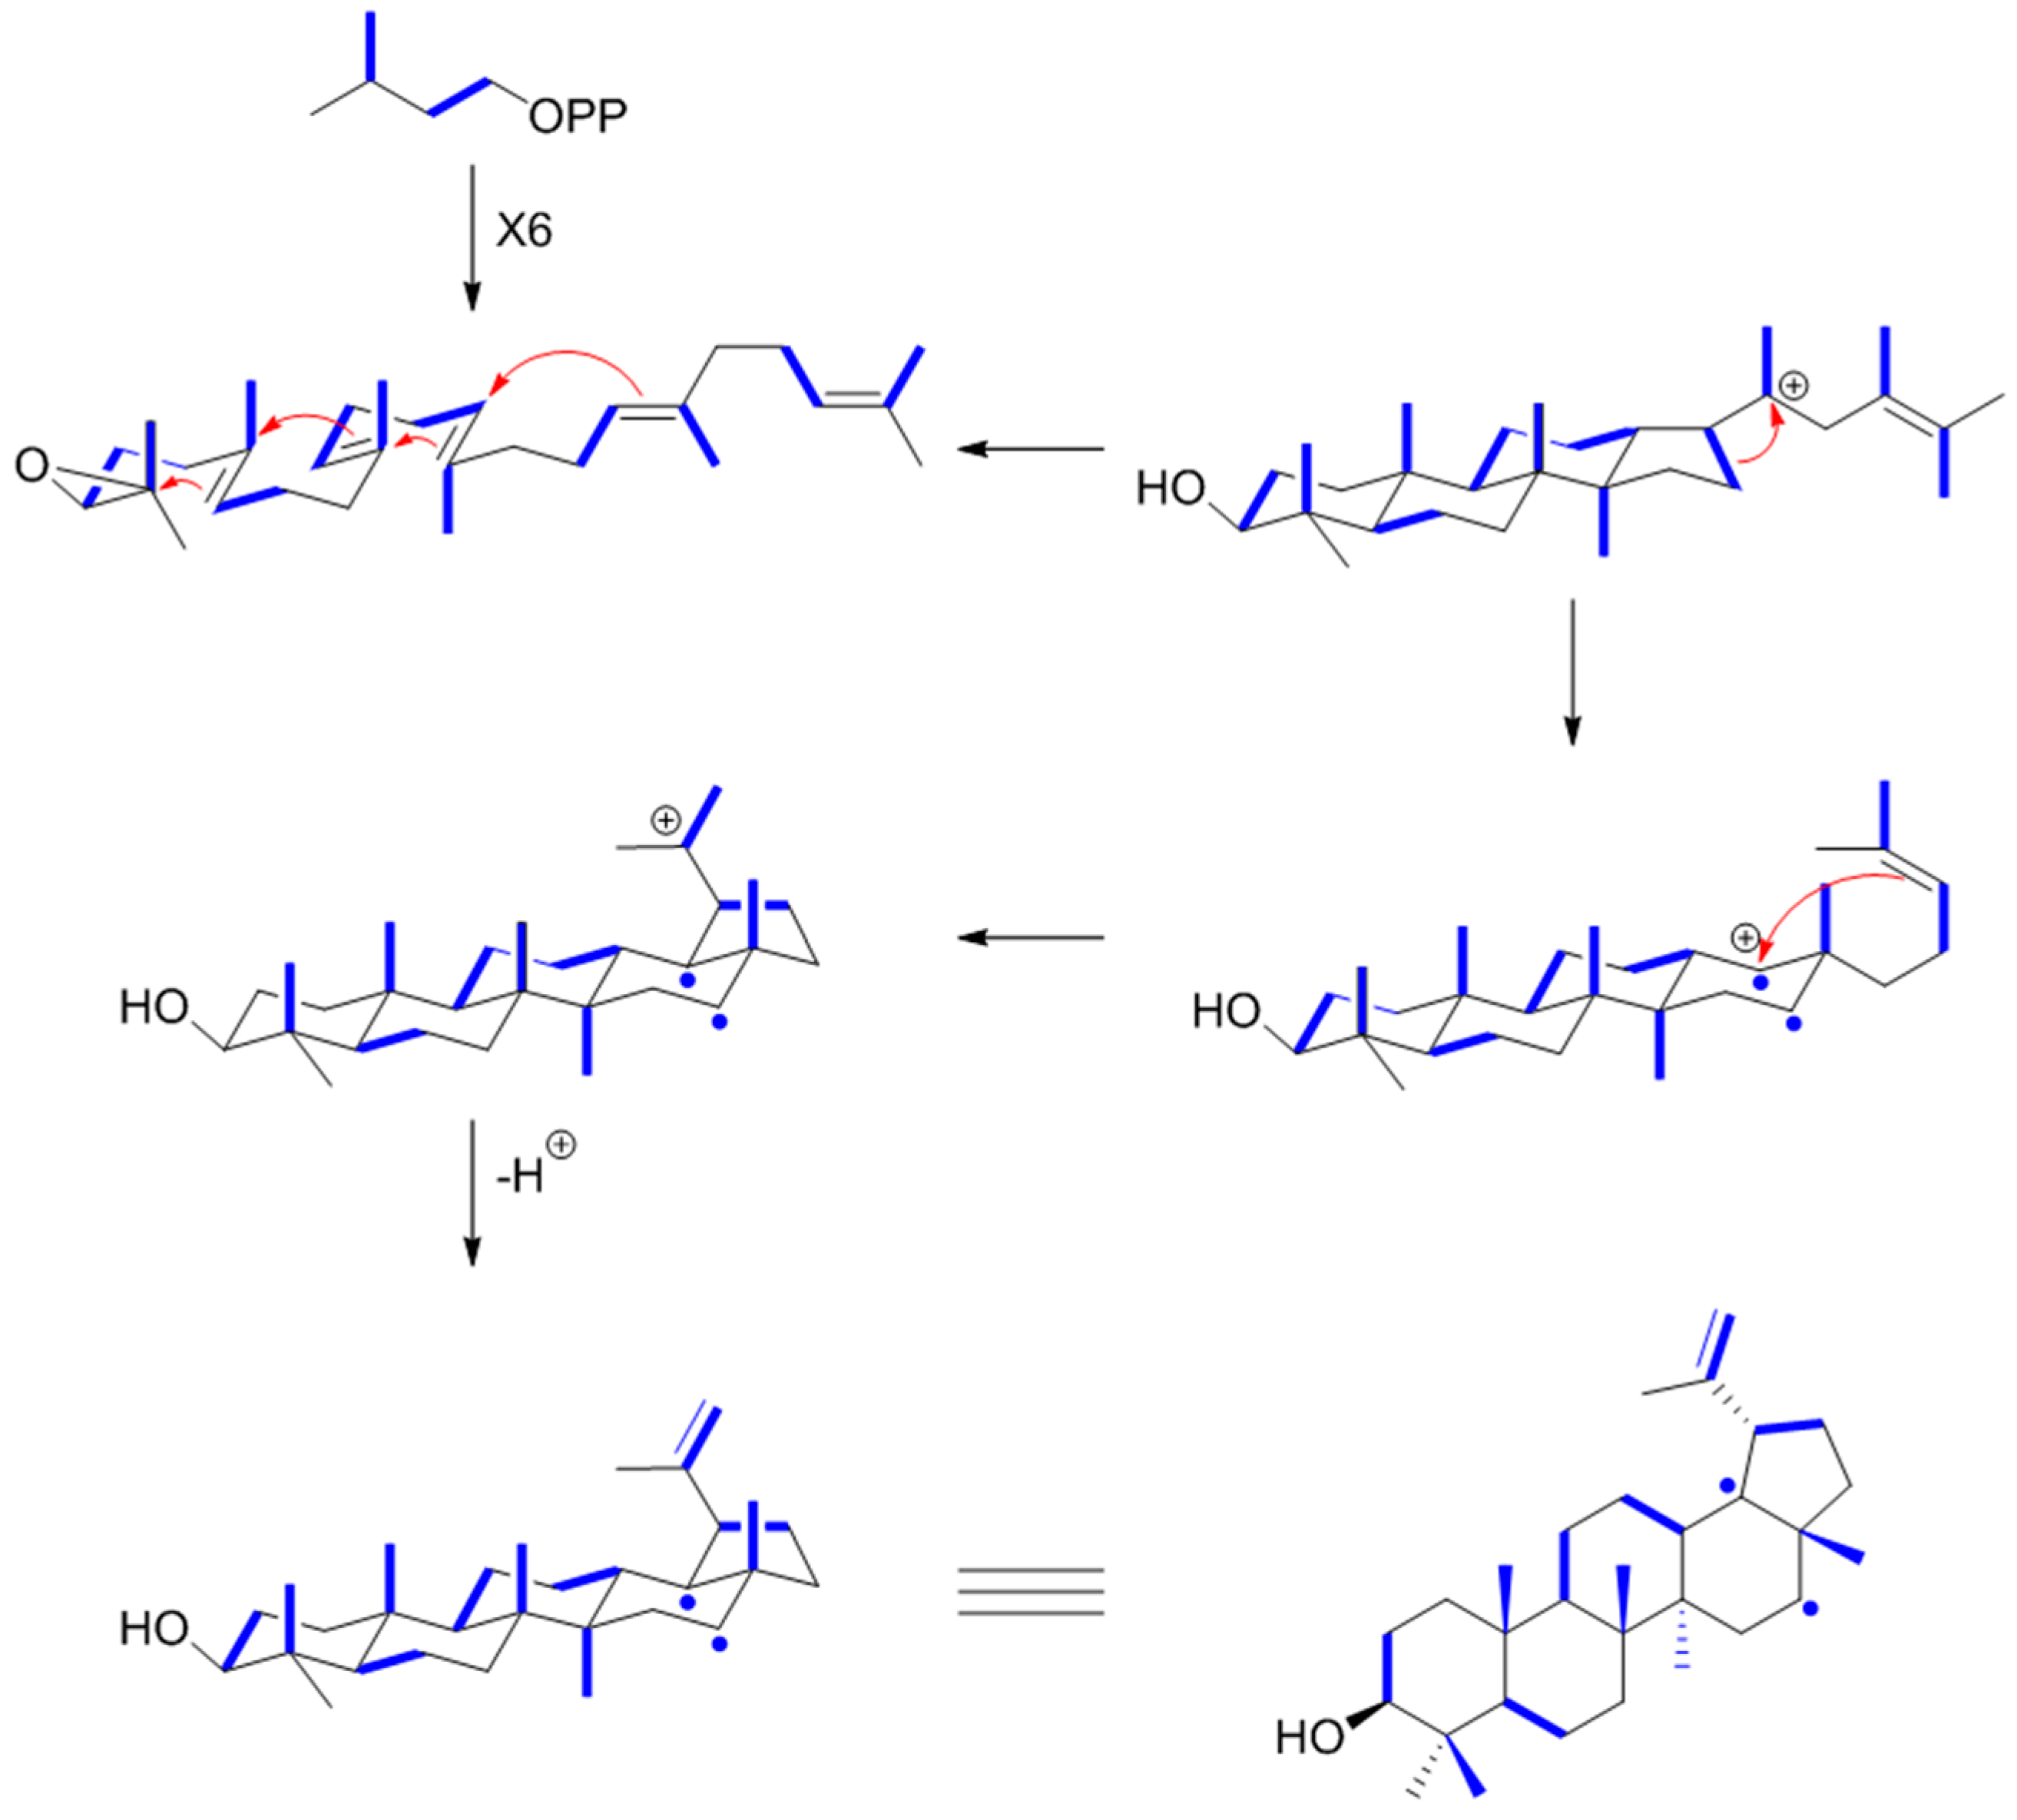
9.4. Lupeol
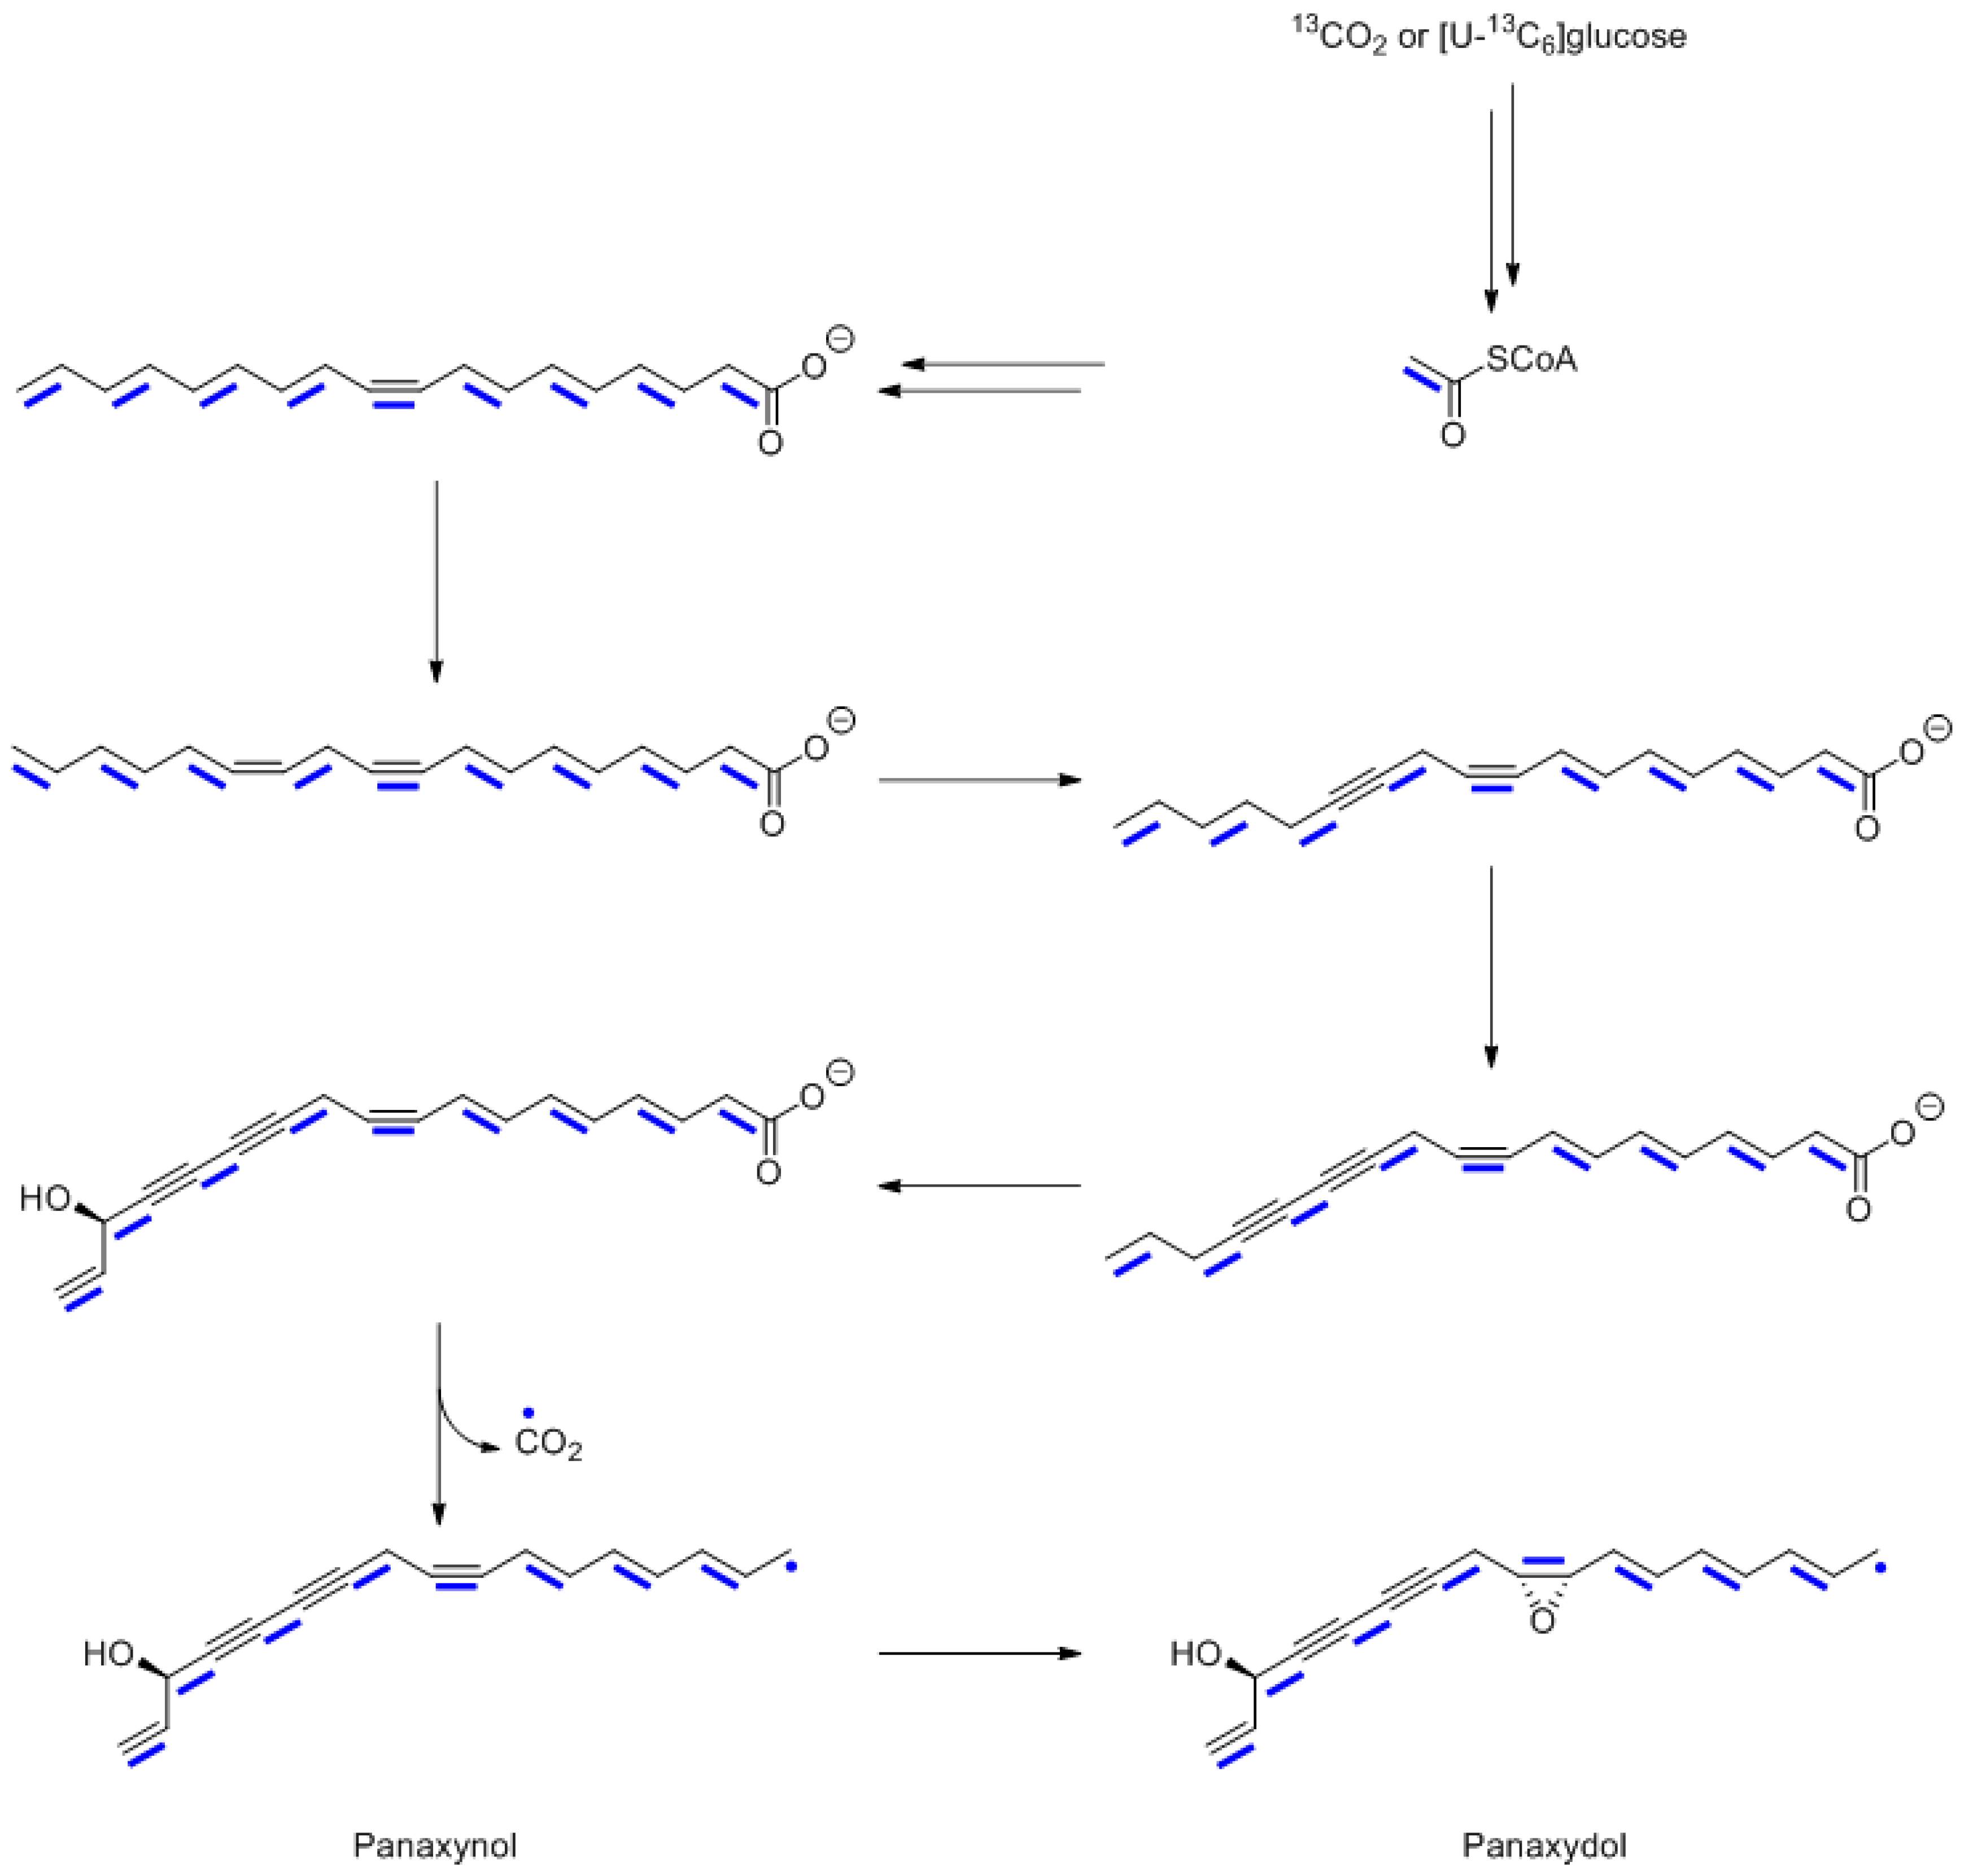
10. Polyacetylenes from Panax ginseng
11. Tracking Shikimate Derivatives as Building Blocks for Secondary Metabolites
12. The Role of the Time Coordinate in Work with 13CO2
Acknowledgments
Author Contributions
Conflicts of Interest
References
- Schönheimer, R.; Rittenberg, D. Deuterium as an indicator in the study of intermediary metabolism. Science 1935, 82, 156–157. [Google Scholar] [CrossRef] [PubMed]
- Kamen, M.D. Use of isotopes in biochemical research; fundamental aspects. Annu. Rev. Biochem. 1947, 16, 631–654. [Google Scholar] [CrossRef] [PubMed]
- Calvin, M.; Benson, A.A. The path of carbon in photosynthesis IV: The identity and sequence of the intermediates in sucrose synthesis. Science 1949, 109, 140–142. [Google Scholar] [CrossRef] [PubMed]
- Bothwell, J.H.; Griffin, J.L. An introduction to biological nuclear magnetic resonance spectroscopy. Biol. Rev. Camb. Philos. Soc. 2011, 86, 493–510. [Google Scholar] [CrossRef] [PubMed]
- Boughton, B.A.; Thinagaran, D.; Sarabia, D.; Bacic, A.; Roessner, U. Mass spectrometry imaging for plant biology: A review. Phytochem. Rev. 2016, 15, 445–488. [Google Scholar] [CrossRef] [PubMed]
- Schmidt, H.L.; Robins, R.J.; Werner, R.A. Multi-factorial in vivo stable isotope fractionation: Causes, correlations, consequences and applications. Isotopes Environ. Health Stud. 2015, 51, 155–199. [Google Scholar] [CrossRef] [PubMed]
- Kanehisa, M.; Sato, Y.; Kawashima, M.; Furumichi, M.; Tanabe, M. KEGG as a reference resource for gene and protein annotation. Nucleic Acids Res. 2016, 44, D457–D462. [Google Scholar] [CrossRef] [PubMed]
- Strogatz, S.H. Exploring complex networks. Nature 2001, 410, 268–276. [Google Scholar] [CrossRef] [PubMed]
- Schmidt, S.; Sunyaev, S.; Bork, P.; Dandekar, T. Metabolites: A helping hand for pathway evolution? Trends Biochem. Sci. 2003, 28, 336–341. [Google Scholar] [CrossRef]
- Grubmüller, S.; Schauer, K.; Goebel, W.; Fuchs, T.M.; Eisenreich, W. Analysis of carbon substrates used by Listeria monocytogenes during growth in J774A.1 macrophages suggests a bipartite intracellular metabolism. Front. Cell. Infect. Microbiol. 2014, 4, 156. [Google Scholar] [PubMed]
- Häuslein, I.; Manske, C.; Goebel, W.; Eisenreich, W.; Hilbi, H. Pathway analysis using 13C-glycerol and other carbon tracers reveals a bipartite metabolism of Legionella pneumophila. Mol. Microbiol. 2016, 100, 229–246. [Google Scholar] [CrossRef] [PubMed]
- Maeda, H.; Dudareva, N. The shikimate pathway and aromatic amino acid biosynthesis in plants. Annu. Rev. Plant Biol. 2012, 63, 73–105. [Google Scholar] [CrossRef] [PubMed]
- Zrenner, R.; Stitt, M.; Sonnewald, U.; Boldt, R. Pyrimidine and purine biosynthesis and degradation in plants. Annu. Rev. Plant Biol. 2006, 57, 805–836. [Google Scholar] [CrossRef] [PubMed]
- Haase, I.; Gräwert, T.; Illarionov, B.; Bacher, A.; Fischer, M. Recent advances in riboflavin biosynthesis. Methods Mol. Biol. 2014, 1146, 15–40. [Google Scholar] [PubMed]
- Hanson, A.D.; Gregory, J.F., 3rd. Folate biosynthesis, turnover, and transport in plants. Annu. Rev. Plant Biol. 2011, 62, 105–125. [Google Scholar] [CrossRef] [PubMed]
- Mendel, R.R.; Leimkühler, S. The biosynthesis of the molybdenum cofactors. J. Biol. Inorg. Chem. 2015, 20, 337–347. [Google Scholar] [CrossRef] [PubMed]
- Ettenhuber, C.; Radykewicz, T.; Kofer, W.; Koop, H.U.; Bacher, A.; Eisenreich, W. Metabolic flux analysis in complex isotopolog space. Recycling of glucose in tobacco plants. Phytochemistry 2005, 66, 323–335. [Google Scholar] [CrossRef] [PubMed]
- Nargund, S.; Misra, A.; Zhang, X.; Coleman, G.D.; Sriram, G. Flux and reflux: Metabolite reflux in plant suspension cells and its implications for isotope-assisted metabolic flux analysis. Mol. Biosyst. 2014, 10, 1496–1508. [Google Scholar] [CrossRef] [PubMed]
- Schwender, J.; Hebbelmann, I.; Heinzel, N.; Hildebrandt, T.; Rogers, A.; Naik, D.; Klapperstuck, M.; Braun, H.P.; Schreiber, F.; Denolf, P.; et al. Quantitative multilevel analysis of central metabolism in developing oilseeds of oilseed rape during in vitro culture. Plant Physiol. 2015, 168, 828–848. [Google Scholar] [CrossRef] [PubMed]
- Kruger, N.J.; Ratcliffe, R.G. Fluxes through plant metabolic networks: Measurements, predictions, insights and challenges. Biochem. J. 2015, 465, 27–38. [Google Scholar] [CrossRef] [PubMed]
- Ishihara, H.; Obata, T.; Sulpice, R.; Fernie, A.R.; Stitt, M. Quantifying protein synthesis and degradation in Arabidopsis by dynamic 13CO2 labeling and analysis of enrichment in individual amino acids in their free pools and in protein. Plant Physiol. 2015, 168, 74–93. [Google Scholar] [CrossRef] [PubMed]
- Gao, J.Q.; Gao, J.J.; Zhang, X.W.; Xu, X.L.; Deng, Z.H.; Yu, F.H. Effects of waterlogging on carbon assimilate partitioning in the Zoige alpine wetlands revealed by 13CO2 pulse labeling. Sci. Rep. 2015, 5, 9411. [Google Scholar] [CrossRef] [PubMed]
- Epron, D.; Cabral, O.M.; Laclau, J.P.; Dannoura, M.; Packer, A.P.; Plain, C.; Battie-Laclau, P.; Moreira, M.Z.; Trivelin, P.C.; Bouillet, J.P.; et al. In situ 13CO2 pulse labelling of field-grown eucalypt trees revealed the effects of potassium nutrition and throughfall exclusion on phloem transport of photosynthetic carbon. Tree Physiol. 2016, 36, 6–21. [Google Scholar] [CrossRef] [PubMed]
- Dersch, L.M.; Beckers, V.; Rasch, D.; Melzer, G.; Bolten, C.J.; Kiep, K.; Becker, H.; Blasing, O.E.; Fuchs, R.; Ehrhardt, T.; et al. High-throughput plant metabolic profiling by stable isotope labelling and combustion isotope ratio mass spectrometry: In vivo assimilation and molecular re-allocation of carbon and nitrogen in rice. Plant Physiol. 2016, 171, 25–41. [Google Scholar] [CrossRef] [PubMed]
- Hasunuma, T.; Harada, K.; Miyazawa, S.; Kondo, A.; Fukusaki, E.; Miyake, C. Metabolic turnover analysis by a combination of in vivo 13C-labelling from 13CO2 and metabolic profiling with CE-MS/MS reveals rate-limiting steps of the C3 photosynthetic pathway in Nicotiana tabacum leaves. J. Exp. Bot. 2010, 61, 1041–1051. [Google Scholar] [CrossRef] [PubMed]
- Huege, J.; Sulpice, R.; Gibon, Y.; Lisec, J.; Koehl, K.; Kopka, J. GC-EI-TOF-MS analysis of in vivo carbon-partitioning into soluble metabolite pools of higher plants by monitoring isotope dilution after 13CO2 labelling. Phytochemistry 2007, 68, 2258–2272. [Google Scholar] [CrossRef] [PubMed]
- Ma, F.; Jazmin, L.J.; Young, J.D.; Allen, D.K. Isotopically nonstationary 13C flux analysis of changes in Arabidopsis thaliana leaf metabolism due to high light acclimation. Proc. Natl. Acad. Sci. USA 2014, 111, 16967–16972. [Google Scholar] [CrossRef] [PubMed]
- Hutchinson, C.R.; Stephen, M.T.; Hsia, S.; Carver, R.A. Biosynthetic studies with 13CO2 of secondary plant metabolites. Nicotiana alkaloids. 1. Initial experiments. J. Am. Chem. Soc. 1976, 98, 6006–6011. [Google Scholar] [PubMed]
- Cegelski, L.; Schaefer, J. NMR determination of photorespiration in intact leaves using in vivo 13CO2 labeling. J. Magn. Reson. 2006, 178, 1–10. [Google Scholar] [CrossRef] [PubMed]
- Dirks, R.C.; Singh, M.; Potter, G.S.; Sobotka, L.G.; Schaefer, J. Carbon partitioning in soybean (Glycine max) leaves by combined 11C and 13C labeling. New Phytol. 2012, 196, 1109–1121. [Google Scholar] [CrossRef] [PubMed]
- Yu, T.Y.; Singh, M.; Matsuoka, S.; Patti, G.J.; Potter, G.S.; Schaefer, J. Variability in C3-plant cell-wall biosynthesis in a high-CO2 atmosphere by solid-state NMR spectroscopy. J. Am. Chem. Soc. 2010, 132, 6335–6341. [Google Scholar] [CrossRef] [PubMed]
- Stidham, M.A.; Moreland, D.E.; Siedow, J.N. C Nuclear magnetic resonance studies of Crassulacean acid metabolism in intact leaves of Kalanchoe tubiflora. Plant Physiol. 1983, 73, 517–520. [Google Scholar] [CrossRef] [PubMed]
- Bassham, J.A.; Benson, A.A.; Calvin, M. The path of carbon in photosynthesis. J. Biol. Chem. 1950, 185, 781–787. [Google Scholar] [PubMed]
- Römisch-Margl, W.; Schramek, N.; Radykewicz, T.; Ettenhuber, C.; Eylert, E.; Huber, C.; Römisch-Margl, L.; Schwarz, C.; Dobner, M.; Demmel, N.; et al. 13CO2 as a universal metabolic tracer in isotopologue perturbation experiments. Phytochemistry 2007, 68, 2273–2289. [Google Scholar] [CrossRef] [PubMed]
- Eisenreich, W.; Ettenhuber, C.; Laupitz, R.; Theus, C.; Bacher, A. Isotopolog perturbation techniques for metabolic networks: Metabolic recycling of nutritional glucose in Drosophila melanogaster. Proc. Natl. Acad. Sci. USA 2004, 101, 6764–6769. [Google Scholar] [CrossRef] [PubMed]
- Ettenhuber, C.; Spielbauer, G.; Margl, L.; Hannah, L.C.; Gierl, A.; Bacher, A.; Genschel, U.; Eisenreich, W. Changes in flux pattern of the central carbohydrate metabolism during kernel development in maize. Phytochemistry 2005, 66, 2632–2642. [Google Scholar] [CrossRef] [PubMed]
- Eisenreich, W.; Bacher, A. Advances of high-resolution NMR techniques in the structural and metabolic analysis of plant biochemistry. Phytochemistry 2007, 68, 2799–2815. [Google Scholar] [CrossRef] [PubMed]
- Ostrozhenkova, E.; Eylert, E.; Schramek, N.; Golan-Goldhirsh, A.; Bacher, A.; Eisenreich, W. Biosynthesis of the chromogen hermidin from Mercurialis annua L. Phytochemistry 2007, 68, 2816–2824. [Google Scholar] [CrossRef] [PubMed]
- Tatsis, E.C.; Eylert, E.; Maddula, R.K.; Ostrozhenkova, E.; Svatos, A.; Eisenreich, W.; Schneider, B. Biosynthesis of nudicaulins: A 13CO2-pulse/chase labeling study with Papaver nudicaule. Chembiochem 2014, 15, 1645–1650. [Google Scholar] [CrossRef] [PubMed]
- Warskulat, A.C.; Tatsis, E.C.; Dudek, B.; Kai, M.; Lorenz, S.; Schneider, B. Unprecedented utilization of pelargonidin and indole for the biosynthesis of plant indole alkaloids. Chembiochem 2016, 17, 318–327. [Google Scholar] [CrossRef] [PubMed]
- Tholl, D. Biosynthesis and biological functions of terpenoids in plants. Adv. Biochem. Eng. Biotechnol. 2015, 148, 63–106. [Google Scholar] [PubMed]
- Eisenreich, W.; Bacher, A.; Arigoni, D.; Rohdich, F. Biosynthesis of isoprenoids via the non-mevalonate pathway. Cell. Mol. Life Sci. 2004, 61, 1401–1426. [Google Scholar] [CrossRef] [PubMed]
- Ruzicka, L. The isoprene rule and the biogenesis of terpenic compounds. Experientia 1953, 9, 357–367. [Google Scholar] [CrossRef] [PubMed]
- Kennedy, E.P.; Westheimer, F.H. Nobel Laureates: Bloch and Lynen win prize in medicine and physiology. Science 1964, 146, 504–506. [Google Scholar] [CrossRef] [PubMed]
- Arigoni, D.; Sagner, S.; Latzel, C.; Eisenreich, W.; Bacher, A.; Zenk, M.H. Terpenoid biosynthesis from 1-deoxy-D-xylulose in higher plants by intramolecular skeletal rearrangement. Proc. Natl. Acad. Sci. USA 1997, 94, 10600–10605. [Google Scholar] [CrossRef] [PubMed]
- Rohmer, M.; Knani, M.; Simonin, P.; Sutter, B.; Sahm, H. Isoprenoid biosynthesis in bacteria: A novel pathway for the early steps leading to isopentenyl diphosphate. Biochem. J. 1993, 295 Pt 2, 517–524. [Google Scholar] [CrossRef] [PubMed]
- Hemmerlin, A.; Harwood, J.L.; Bach, T.J. A raison d’etre for two distinct pathways in the early steps of plant isoprenoid biosynthesis? Prog. Lipid Res. 2012, 51, 95–148. [Google Scholar] [CrossRef] [PubMed]
- Wright, L.P.; Rohwer, J.M.; Ghirardo, A.; Hammerbacher, A.; Ortiz-Alcaide, M.; Raguschke, B.; Schnitzler, J.P.; Gershenzon, J.; Phillips, M.A. Deoxyxylulose 5-phosphate synthase controls flux through the methylerythritol 4-phosphate pathway in Arabidopsis. Plant Physiol. 2014, 165, 1488–1504. [Google Scholar] [CrossRef] [PubMed]
- Kutzner, E.; Manukyan, A.; Eisenreich, W. Profiling of terpene metabolism in 13CO2-labelled Thymus transcaucasicus. Metabolomics 2014, 4, 129. [Google Scholar]
- Kong, L.Y.; Tan, R.X. Artemisinin, a miracle of traditional Chinese medicine. Nat. Prod. Rep. 2015, 32, 1617–1621. [Google Scholar] [CrossRef] [PubMed]
- Schramek, N.; Wang, H.; Römisch-Margl, W.; Keil, B.; Radykewicz, T.; Winzenhörlein, B.; Beerhues, L.; Bacher, A.; Rohdich, F.; Gershenzon, J.; et al. Artemisinin biosynthesis in growing plants of Artemisia annua. A 13CO2 study. Phytochemistry 2010, 71, 179–187. [Google Scholar] [CrossRef] [PubMed]
- Baeg, I.H.; So, S.H. The world ginseng market and the ginseng (Korea). J. Ginseng Res. 2013, 37, 1–7. [Google Scholar] [CrossRef] [PubMed]
- Schramek, N.; Huber, C.; Schmidt, S.; Dvorski, S.E.; Knispel, N.; Ostrozhenkova, E.; Pena-Rodriguez, L.M.; Cusido, R.M.; Wischmann, G.; Eisenreich, W. Biosynthesis of ginsenosides in field-grown Panax ginseng. JSM Biotechnol. Bioeng. 2014, 2, 1033. [Google Scholar]
- Pena-Rodriguez, L.M.; Yam-Puc, A.; Knispel, N.; Schramek, N.; Huber, C.; Grassberger, C.; Ramirez-Torres, F.G.; Escalante-Erosa, F.; Garcia-Sosa, K.; Hiebert-Giesbrecht, M.R.; et al. Isotopologue profiling of triterpene formation under physiological conditions. Biosynthesis of lupeol-3-(3′-R-hydroxy)-stearate in Pentalinon andrieuxii. J. Org. Chem. 2014, 79, 2864–2873. [Google Scholar] [CrossRef] [PubMed]
- Knispel, N.; Ostrozhenkova, E.; Schramek, N.; Huber, C.; Pena-Rodriguez, L.M.; Bonfill, M.; Palazon, J.; Wischmann, G.; Cusido, R.M.; Eisenreich, W. Biosynthesis of panaxynol and panaxydol in Panax ginseng. Molecules 2013, 18, 7686–7698. [Google Scholar] [CrossRef] [PubMed] [Green Version]


| Amino Acid | Precursora | Related Upstream Intermediate | Pathway |
|---|---|---|---|
| Ala | Pyruvate | Glyceraldehyde 3-Phosphate, Malate | Glycolysis, C4-dicarboxylic acid cycle, Non-mevalonate pathway |
| Arg | Glu | α-Ketoglutarate | Citrate cycle |
| Arg | CO2 | C1-metabolism | |
| Asp | Oxaloacetate | Phosphoenolpyruvate, CO2 | Citrate cycle, C1-metabolism |
| Glu | α-Ketoglutarate | Oxaloacetate, Acetyl-CoA | Citrate cycle, Mevalonate pathway |
| His | 5-Phosphoribosyl diphosphate | Ribulose 5-Phosphate | Pentose phosphate pathway, Calvin cycle, C1-metabolism |
| His | ATP | CO2 | Purine metabolism, C1-metabolism |
| Ile | Thr | Asp | Citrate cycle |
| Ile | Pyruvate | Glyceraldehyde 3-Phosphate, Malate | Glycolysis, C4-dicarboxylic acid cycle, Non-mevalonate pathway |
| Leu | Pyruvate | Glyceraldehyde 3-Phosphate, Malate | Glycolysis, C4-dicarboxylic acid cycle, Non-mevalonate pathway |
| Leu | Acetyl-CoA | Pyruvate, Fatty acids | Mevalonate pathway, Polyketide metabolism, Fatty acid metabolism |
| Lys | Asp | Oxaloacetate | Citrate cycle |
| Phe | Erythrose 4-phosphate | Fructose 6-Phosphate, Ribulose 5-Phosphate | Chorismate pathway, Pentose phosphate pathway, Calvin cycle |
| Phe | Phosphoenol-pyruvate | 3-Phosphoglycerate, Oxaloacetate | Chorismate pathway, Glycolysis, Calvin cycle |
| Pro | Glu | α-Ketoglutarate | Citrate cycle |
| Thr | Asp | Oxaloacetate | Citrate cycle |
| Trp | Erythrose 4-phosphate | Fructose 6-Phosphate, Ribulose 5-Phosphate | Chorismate pathway, Pentose phosphate pathway, Calvin cycle |
| Trp | Phosphoenol pyruvate | 3-Phosphoglycerate, Oxaloacetate | Chorismate pathway, Glycolysis, Calvin cycle |
| Trp | Ser | 3-Phosphoglycerate, Gly | Chorismate pathway, Glycolysis, Calvin cycle, C1-metabolism |
| Trp | 5-Phosphoribosyl diphosphate | Ribulose 5-Phosphate | Pentose phosphate pathway, Calvin cycle |
| Tyr | Erythrose 4-phosphate | Fructose 6-Phosphate, Ribulose 5-Phosphate | Chorismate pathway, Pentose phosphate pathway, Calvin cycle |
| Tyr | Phosphoenol pyruvate | 3-Phosphoglycerate, Oxaloacetate | Chorismate pathway, Glycolysis, Calvin cycle |
| Val | Pyruvate | Glyceraldehyde 3-Phosphate, Malate | Glycolysis, C4-dicarboxylic acid cycle, Non-mevalonate pathway |
© 2016 by the authors; licensee MDPI, Basel, Switzerland. This article is an open access article distributed under the terms and conditions of the Creative Commons Attribution (CC-BY) license (http://creativecommons.org/licenses/by/4.0/).
Share and Cite
Bacher, A.; Chen, F.; Eisenreich, W. Decoding Biosynthetic Pathways in Plants by Pulse-Chase Strategies Using 13CO2 as a Universal Tracer. Metabolites 2016, 6, 21. https://doi.org/10.3390/metabo6030021
Bacher A, Chen F, Eisenreich W. Decoding Biosynthetic Pathways in Plants by Pulse-Chase Strategies Using 13CO2 as a Universal Tracer. Metabolites. 2016; 6(3):21. https://doi.org/10.3390/metabo6030021
Chicago/Turabian StyleBacher, Adelbert, Fan Chen, and Wolfgang Eisenreich. 2016. "Decoding Biosynthetic Pathways in Plants by Pulse-Chase Strategies Using 13CO2 as a Universal Tracer" Metabolites 6, no. 3: 21. https://doi.org/10.3390/metabo6030021