1. Introduction
In the past decades, the development of optical fiber communication technology has promoted the development of the telecom industry and information industry. In recent years, optical fibers, serving as sensors, have become a hot research topic in the field of monitoring. Different from conventional point sensors, the phase sensitive optical time domain reflectometry (Φ-OTDR) is a practical and effective technology for vibration detection applications, which can monitor vibration events occurring along the fiber [
1,
2,
3]. Based on its high sensitivity, fast response and the ability to reconstruct the full vector field of acoustic events, i.e. amplitude, frequency and phase, Φ-OTDR has been extensively employed in various fields such as fiber optic safety monitoring, seismic monitoring, as well as structural health monitoring and intrusion monitoring, etc. [
4].
Although Distributed Acoustic Sensor (DAS) has great potential, there are still many problems which limit its application and popularization in engineering. The amplitude fluctuation of the Rayleigh backscattered trace (RBS) causes the scattered light intensity to be lower than the noise-intensity in some areas, resulting in dead detection zones and a propensity to false negatives. Healey et al. discussed that the speckle phenomenon cannot occur at rest. The effects of fading components can be limited by averaging various Rayleigh traces through direct or specific randomization processes [
5,
6], however, the unintentional distribution of strain and temperature along the fiber is spatially random, which remains relatively stable over time. Therefore, fading cannot be eliminated by simply averaging multiple scans through a single fixed probe frequency. One of the first methods to overcome fading was the frequency hopping technique using a laser source, which changed the laser frequency gradually by changing the temperature and the backscattered signal integration. Although this technique could successfully reduce the amplitude fluctuation, it requires thousands or even tens of thousands of averages, making it unsuitable for real-time applications [
7,
8]. Multi-frequency nonlinear frequency modulation (NLFM) light pulse provides another way to suppress fading. This method produces continuous wave laser (CW) light with a non-linear tuning frequency and compresses RBS by signal processing, aiming to obtain higher detection pulse energy without sacrificing spatial resolution (SR). The overall signal to noise ratio (SNR) will increase, reducing the possibility of fading. However, for long-distance measurements, fading is still a problem when the RBS intensity decays at the far end of the sensing fiber [
9]. Hartog et al. used multiple detection frequencies to enhance the amplitude and SNR of the seismic sensing system. Nevertheless, in the case of seismic waves, it does not require long sensing times, and the monitored disturbances last only a few seconds. They pay more attention to the suppression of the fading effect of the amplitude, and have not discussed the phase signal behavior in the fading region [
5].
On the other hand, when the length of the observed area remains unknown, it will become a challenge to achieve optimal SNR by adjusting SR. The SNR can be enhanced by introducing more components or modules to the sensing system, such as distributed amplification [
10,
11] and ultra-weak fiber Bragg grating [
12]. However, such modifications apparently increase the overall complexity of the system. A matched filtering algorithm with frequency division multiplexing (FDM) for extending the FRR of Φ-OTDR has been proposed in [
13]. To enhance the SNR and extract weak vibration signal, an adaptive two-dimensional bilateral filtering algorithm is used in the Φ-OTDR sensing system [
14]. A denoising method bases on empirical mode decomposition to improve the SNR in Φ-OTDR in [
15]. Despite this, none of the above researches quantify the relationship between SNR, SR and the length of the vibration region. Moreover, when the length of the vibration event applied to the sensing fiber cannot be known in advance, it will be more difficult to achieve optimal measurement by adjusting SR, directly affecting the effective feature collection of the vibration event in the actual monitoring environment.
In addition, limited frequency response range (FRR) is another problem DAS systems often suffer from. The frequency of the interference event can reach several hundred kHz as usual [
4]. The range of frequency is limited by the length of the fiber, which makes it difficult to reconstruct the high frequency vibration signal accurately. In 2013, the Φ-OTDR with interferometer configuration extended the FRR to ~3 MHz [
16]. However, this system requires an fiber under test (FUT) of a loop structure, which causes inconveniences in application. Wang demonstrated an FDM Φ-OTDR to increase the sampling rate of the system [
17]. Subsequently, Gaussian detection pulses and time-gated digital optical frequencies are applied in the FDM Φ-OTDR to improve performance [
13,
18]. Although the proposed system can extend the FRR, the RBS intensity of these systems may drop to very small values at fading locations [
19]. Although the FDM system can extend FRR, it is still affected by fading. When fading occurs, the RBS intensity of these positions will be too small for phase demodulation [
13]. Therefore, if we want to extend the range of response frequency, we also need to balance the fading suppression.
Since the location of fading areas are different for different probe frequencies, we could possibly avoid fading phenomenon by using different frequencies in the probe light. For the optimization of SNR without vibration length information, it is still difficult to achieve performance optimization through a fixed SR. The sensing system requires the capability of multi-spatial resolution (MSR) analysis and multi-SRs provided by FDM to enhance its performance. Although, multiple detection pulses have been used to extend the FRR, the systems as mentioned above can either reduce the influence of fading or enlarge FRR, and there is no proper way to reduce the fading position and meanwhile expand FRR. In a word, in the current research, methods that can simultaneously solve the above three types of problems has not been discussed. In order to solve the three problems, this paper will propose a series of specific and novel methods based on FDM to enhance the performance of the system. Based on the principle and development of Φ-OTDR system, the methods in this paper implement continuous suppression of fading, optimize measurement by adjusted SR and extension of response.
3. Continuous Fading Effect Suppression Method for Φ-OTDR Systems Based on Optimum Tracking and FDM
If we consider the noise of active devices as broadband white noise and we pass them through, the output photocurrent can be expressed as:
is the amplitude of the backscattered signal,
is the random noise amplitude,
is the phase of the RBS, and
is the phase of the noise signal. Without regard to the white noise after the photodetector, we assumed the noise amplitude
N follows the Gaussian distribution, while the noise phase
follows a uniform one. We exploited an I/Q demodulation system [
29]. After low-pass filtering, we have two terms:
and the phase of the backscattered signal is follows:
Equation (8) shows to what extent the output is dependent on noise. Any change in system noise directly affects the accuracy of the arctangent change and the extracted phase signal. If
and
are the actual phase values (including noise) and the expected phase values, respectively, we can write:
and
are the additional values of the phase noise:
Similarly, is the phase difference we are looking for, and is the output we can actually get. If the received signal from A or B does not have a good SNR, the term will not carry valid information about the applied disturbance.
According to the literature and our experimental results [
5,
20,
30], the frequencies of different detection pulses cause different phase changes in each region. Assuming that A or B has fading at the frequency, A or B’s RBS may actually be very strong at different frequencies. However, when choosing different detection frequencies, the smallest possible phase correlation should be taken into consideration. Correlation can be mitigated by using a large number of backscattered signals corresponding to various frequencies [
30]. In order to eliminate the phase correlation between every two frequencies and keep probe light independent, different frequencies must satisfy the following equation:
and are the frequencies of the incident light, is the group velocity in the fiber, and is the physical distance between A and B. This means that a large frequency shift is required to keep the two nearby detection frequencies independent.
The scatterers are distributed unevenly along the fiber, and the horizontal distribution of RBS follows the Rayleigh statistic [
6]. If we are able to obtain a large number of independent traces, the average amplitude obtained from the coherent OTDR system will exhibit a Gaussian shape [
19].
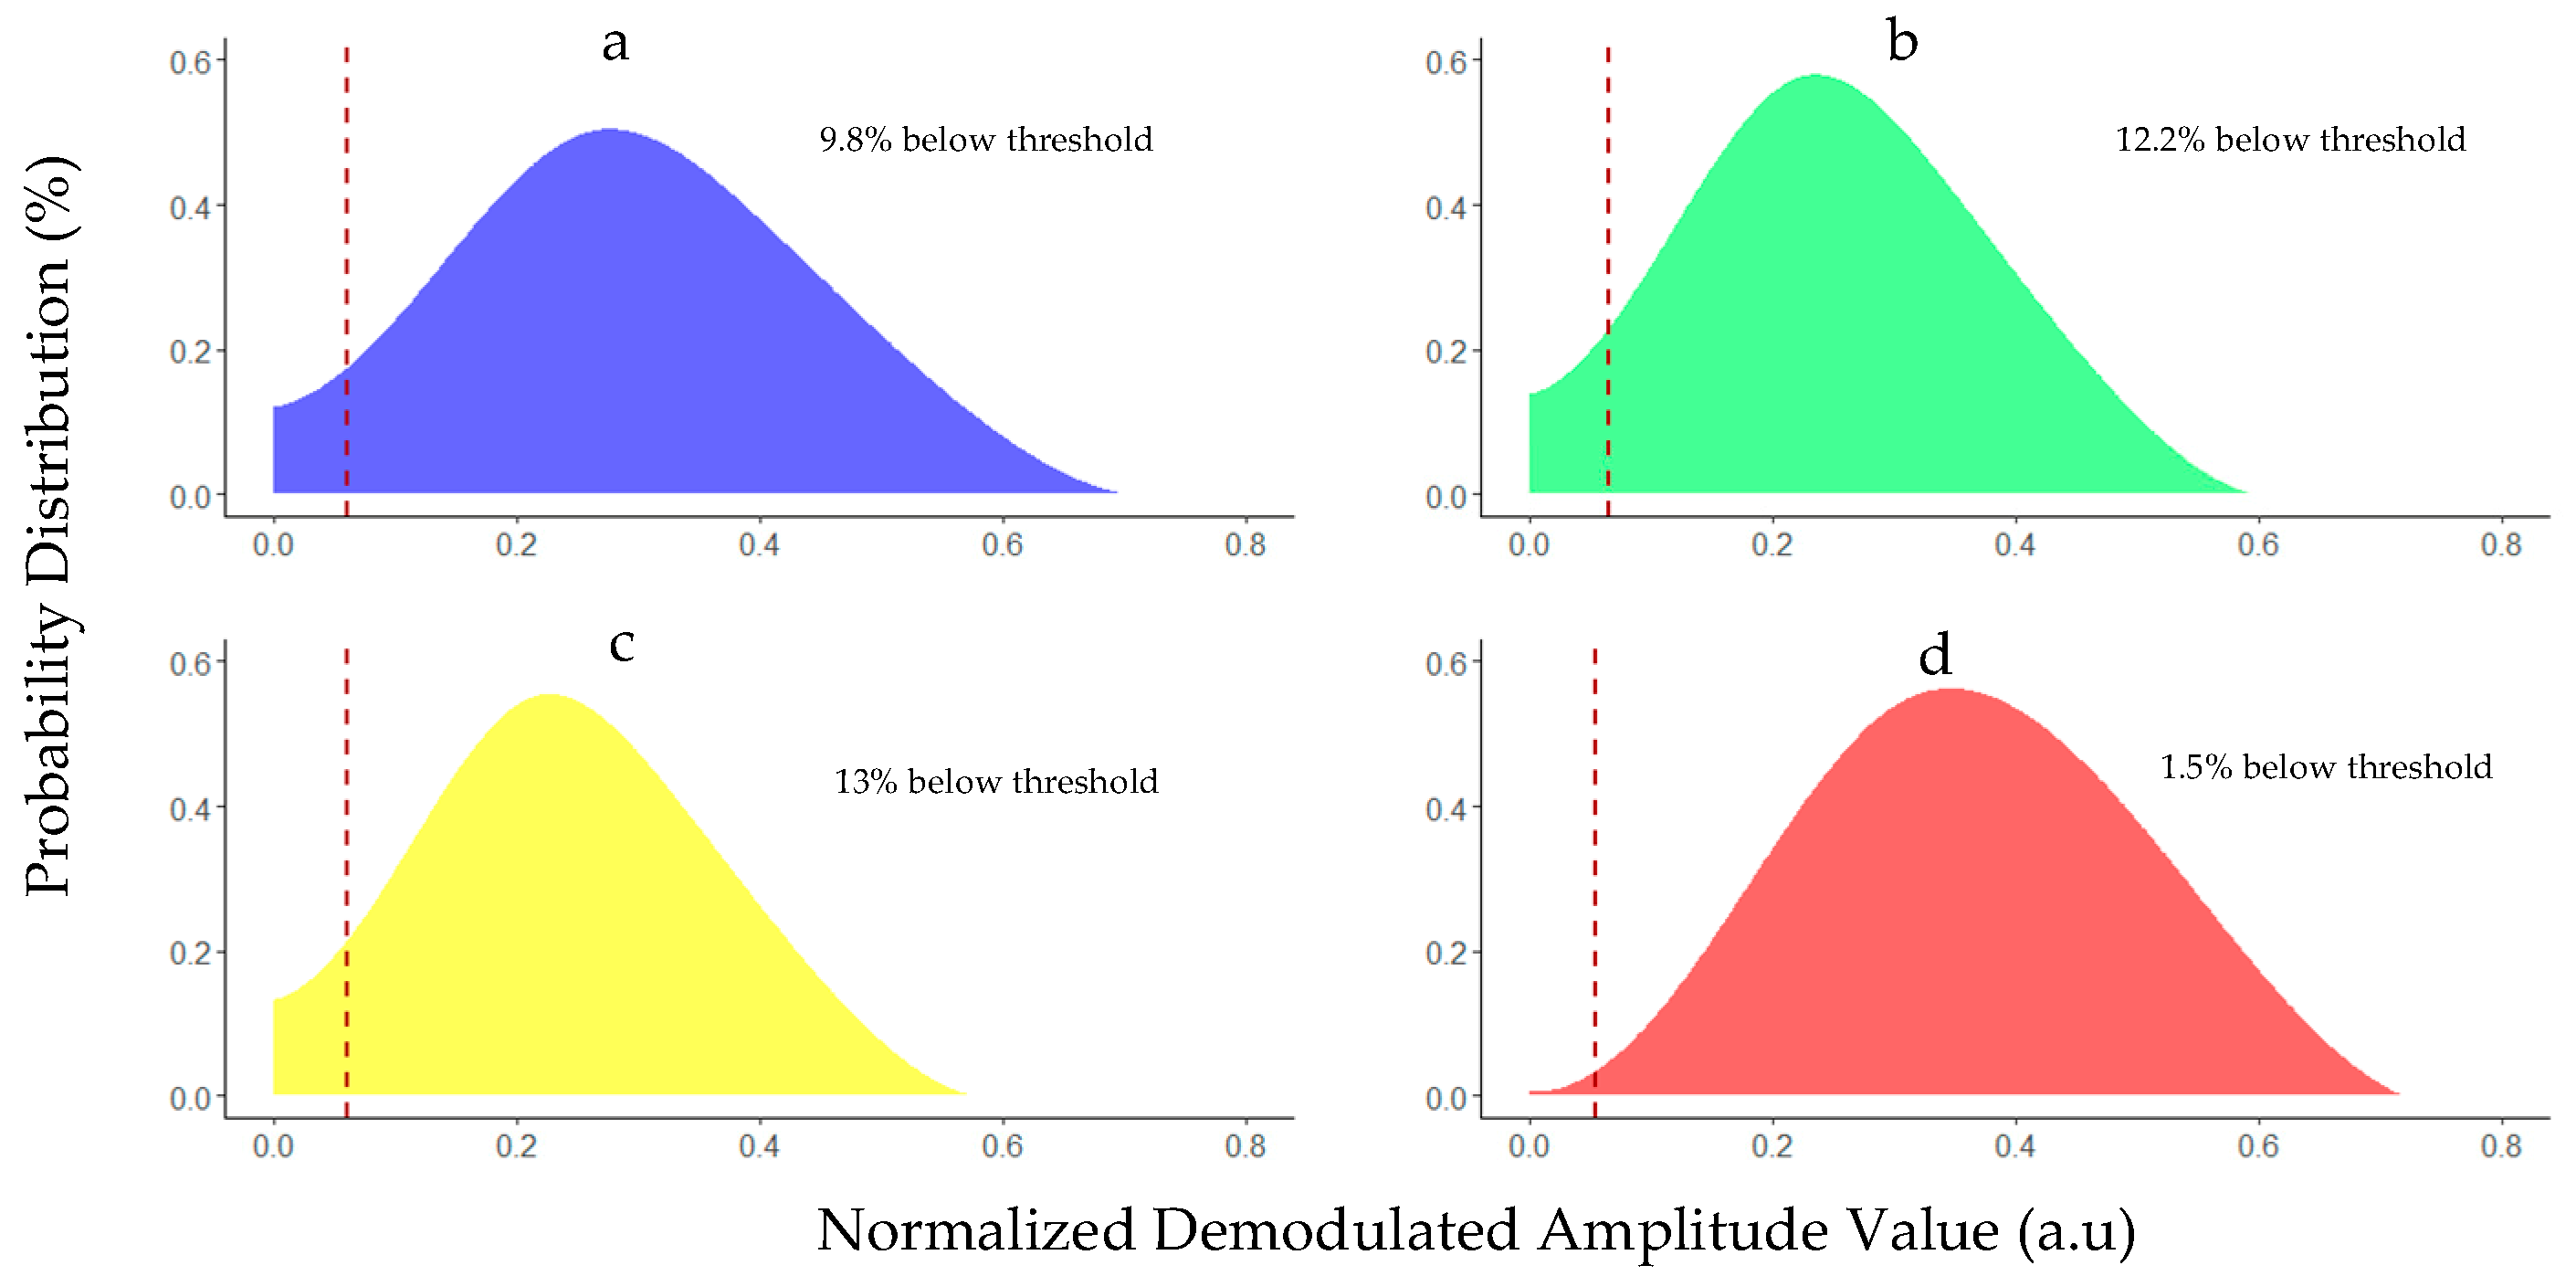
Since the positions of the low-amplitude points of different frequencies are different, we statistically scan the amplitude values in the demodulated traces and plot the probability distribution in
Figure 3. In a, b, and c, the shape of these distributions tend to be left-skewed. Considering the 10 dB threshold, the larger area on the left side of the threshold line in the bell shape, means more areas below the threshold and at risk of fading.
Figure 3 compares the probability distribution of all frequencies and the maximum value after processing. The probability of points at 40, 80 and 150 MHz below the threshold are 9.8%, 12.2% and 13%. For the last graph with the maximum of each section, the bell curve can be moved to the right and the smaller portion is below the threshold, which drops significantly to 1.5%. This amount is related to the points where all three frequencies fall into the fading region simultaneously. Even at the same position, the distortion shape of the phase signal will change with time. Referring to Equation (10), this is because that the SNR of the phase signal is too low. We observe that there are some small fluctuations in the amplitude of the demodulated signal at each frequency, and the average value can be used to mitigate the effects of fluctuations. Considering the phase demodulation of the two points A and B, these two positions are averaged in time with a specific time window (the number of specific traces). If we consider the input data as a matrix, each row is an independent trace of the FUT, and each column is a different time corresponding to that point. The time difference between every two consecutive lines is equal to the repetition period of the incoming light pulse. The averages of columns A and B at each frequency will be used as the primary parameters in our prediction method. A and B can move along the FUT to find the vibration zone, but the distance between them must meet the requirements of Equation (11).
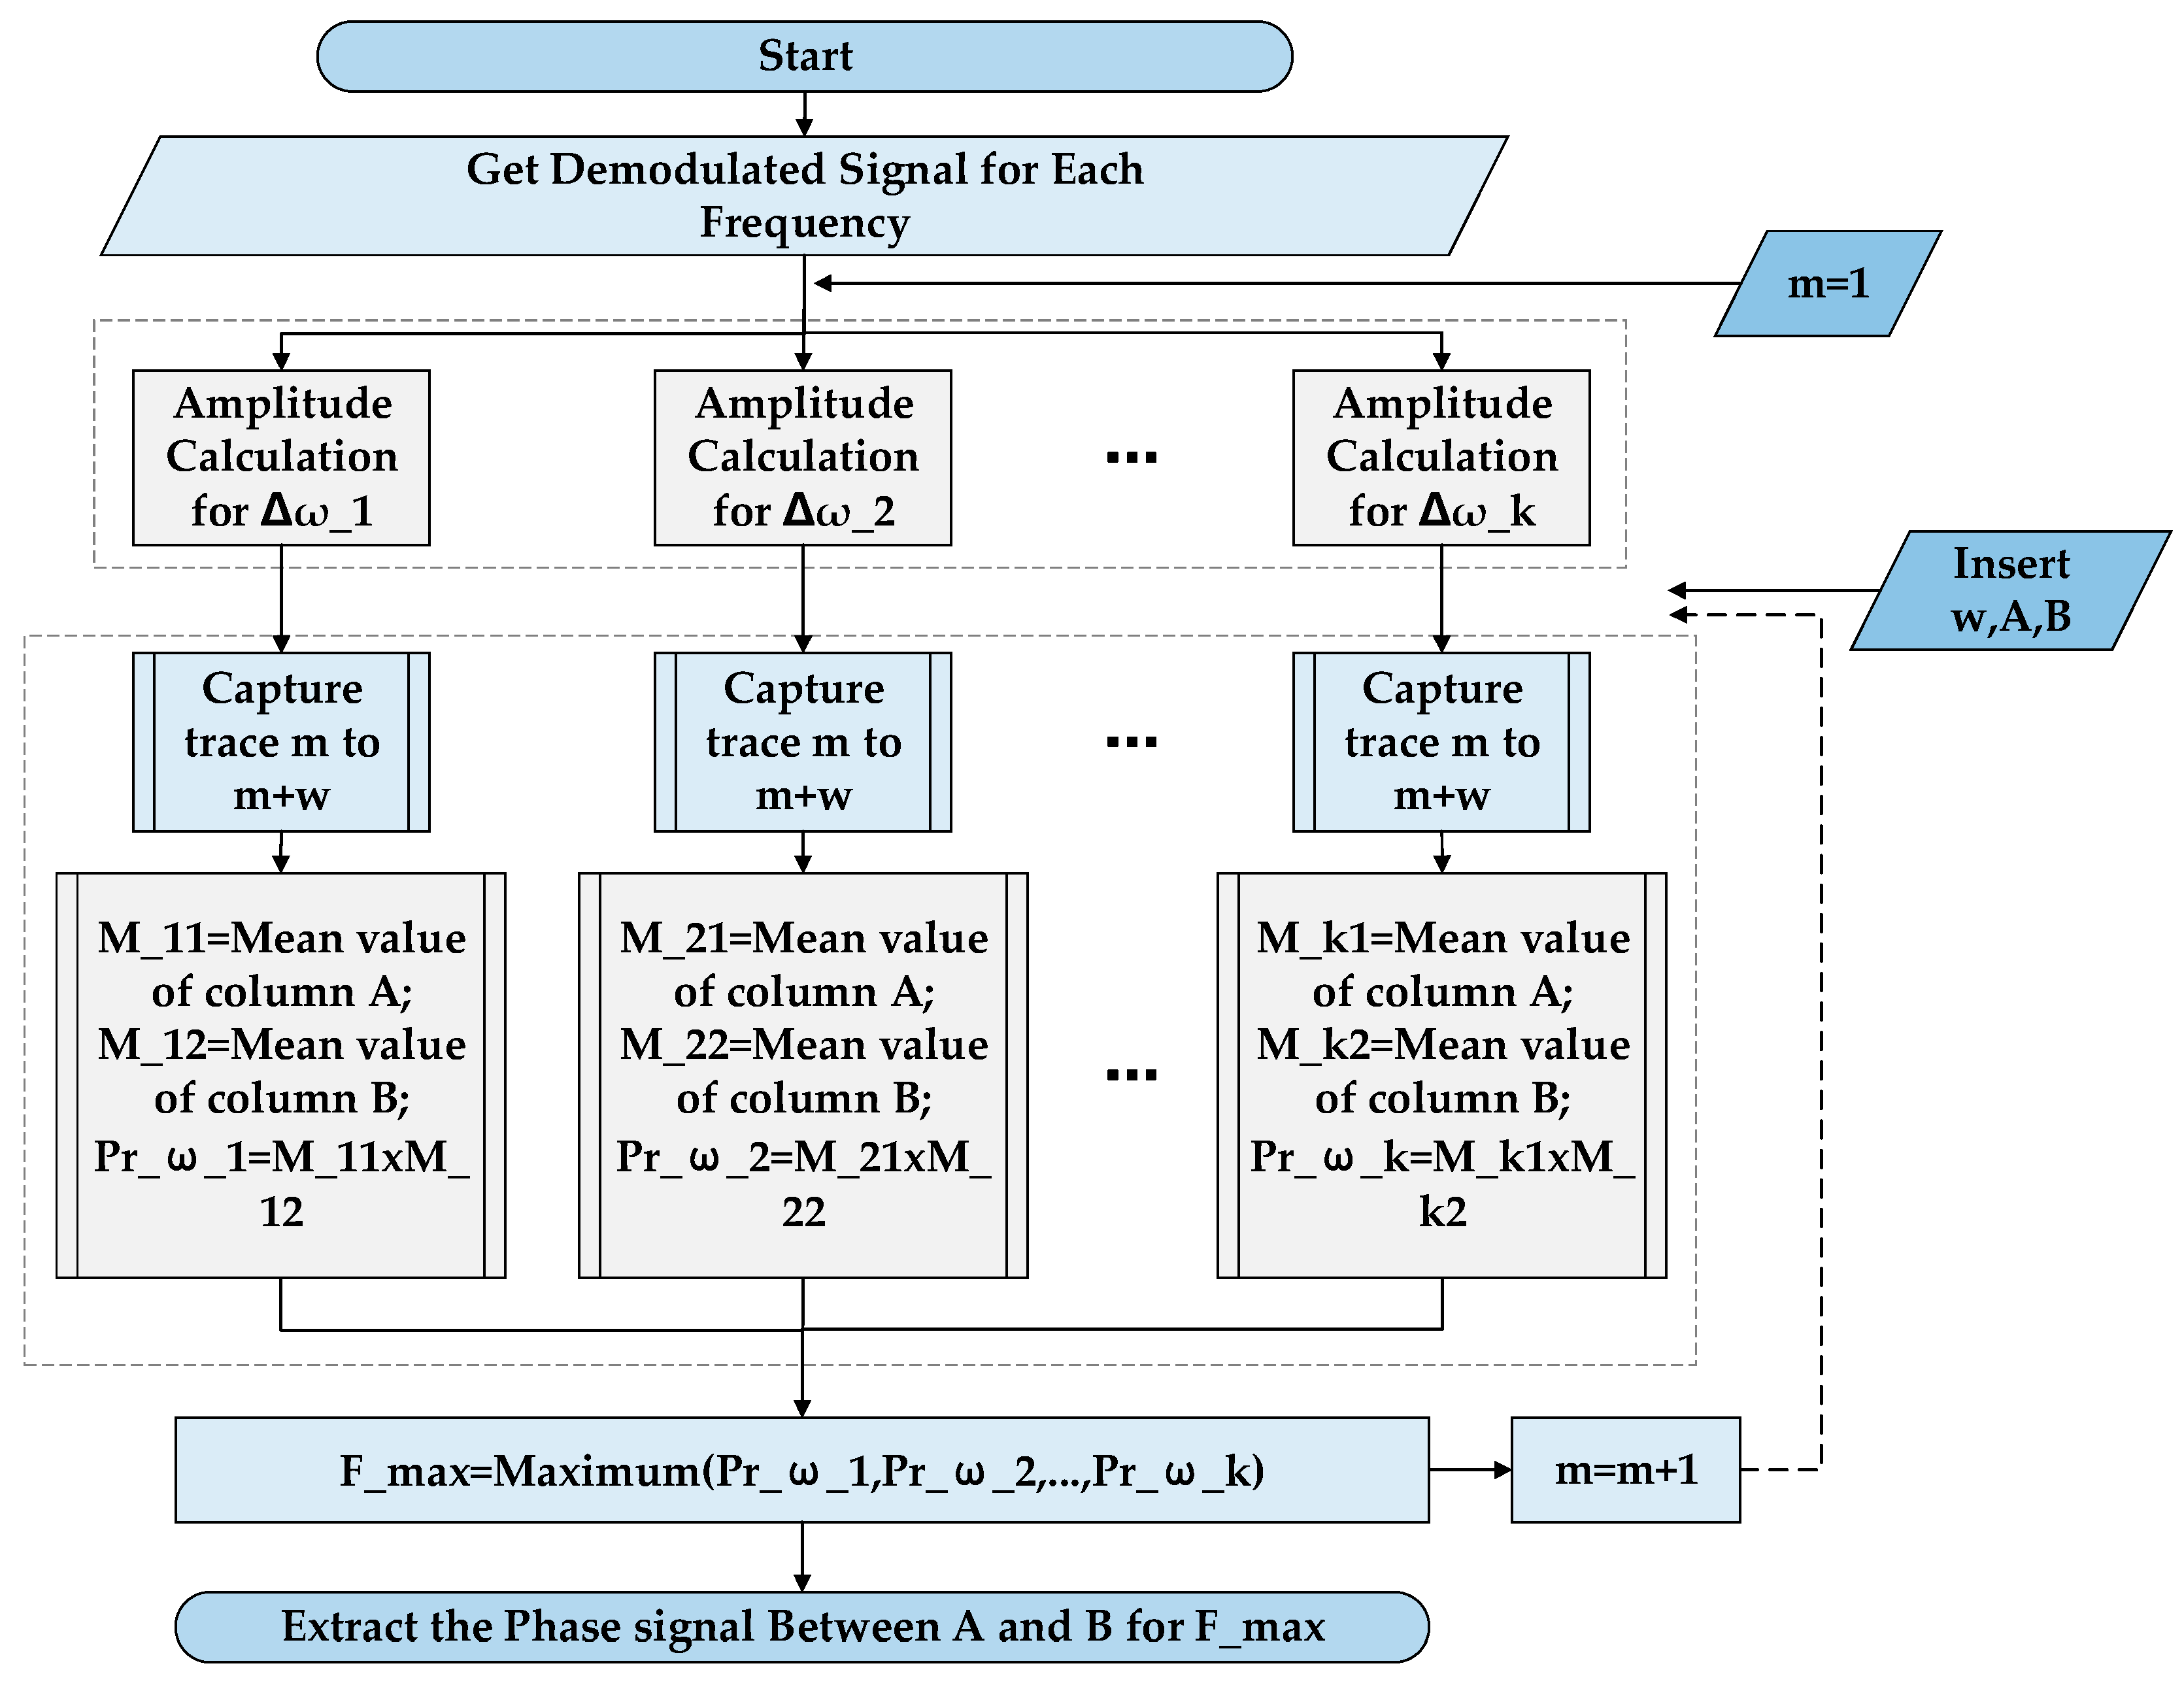
Figure 4 shows the flow chart of the proposed optimal tracking algorithm.
Initially, we provide the demodulation results to the flowchart, as well as the definition of A and B and the size of the average window. After averaging the A and B columns for each frequency, we will have two values (
and
). Considering the digital logic operation, only when all input values are “1”, the result of “AND” operation can be “1”. Therefore, in the next step, we multiply these two values ("AND" function) to obtain a single quantity for each given frequency (
). We compare these multiplication results (
) and choose the maximum value (
). This maximum value indicates which probe frequency has the best phase signal in the upcoming trace. After each round of processing, the average window slides down a trace and continues the process. We can move A and B in each loop to scan the FUT. After selecting the best signal for phase extraction, the rest of the work will be similar to the normal Φ-OTDR system. We must subtract the phase of column A from column B and then extract the phase with this result [
26,
31]. After extracting the phase signal, we apply a high-pass filter to eliminate possible offsets in the phase signal and to place different phase signals at the same level from different frequencies.
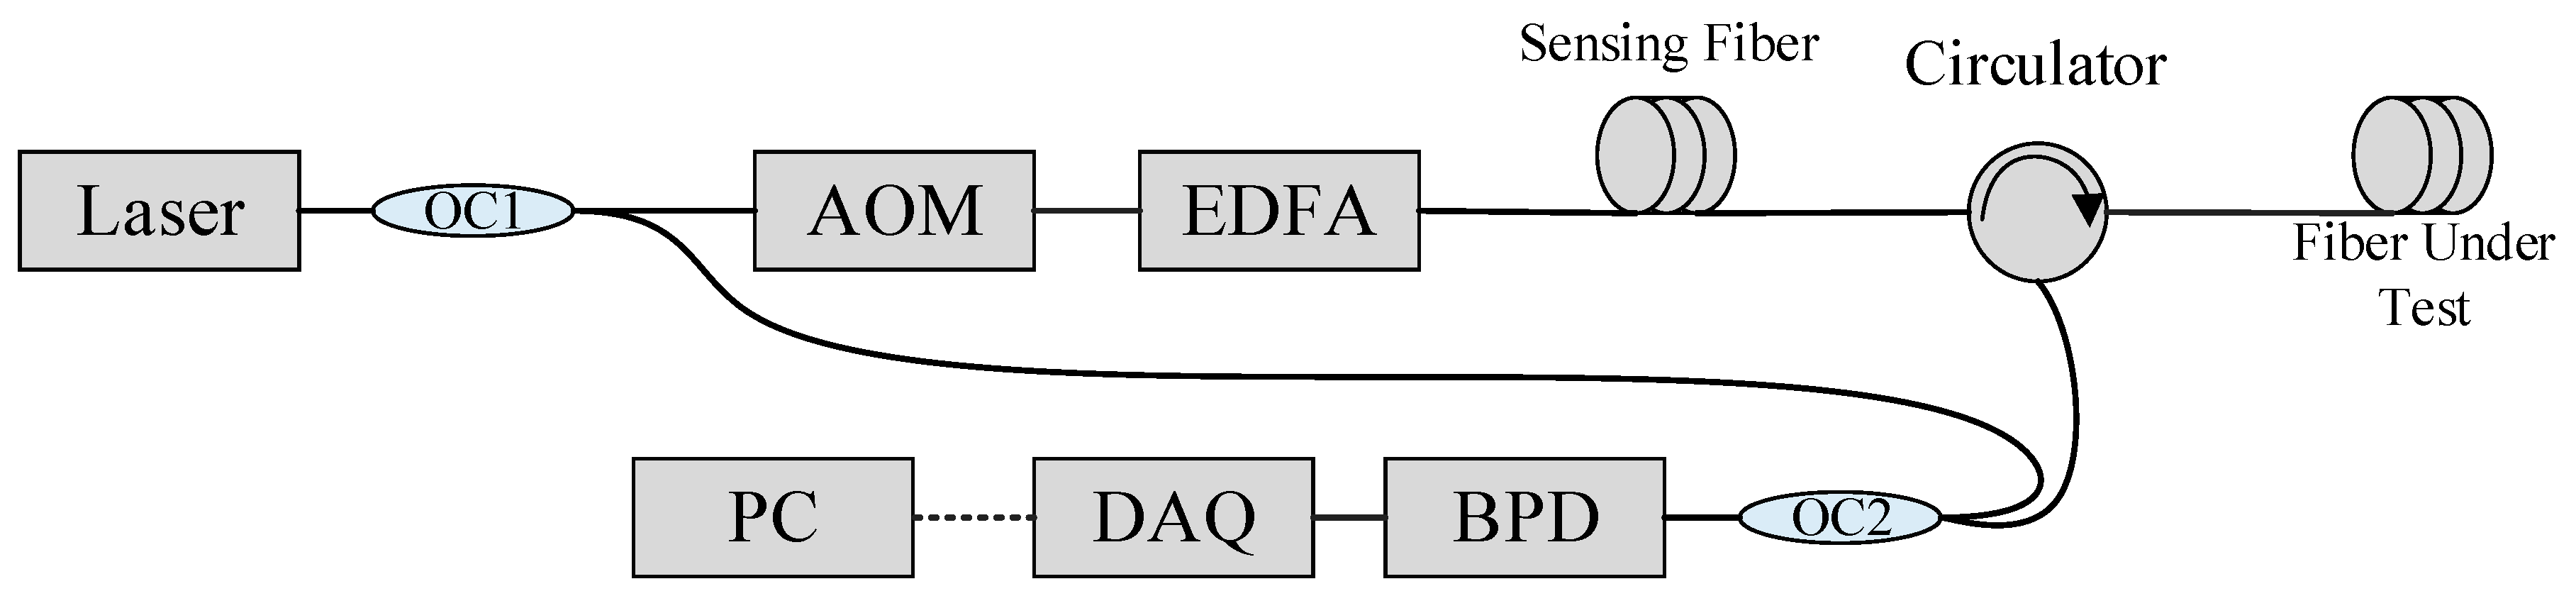
The structure of the Φ-OTDR vibration sensor system with multiple probe frequencies is shown in
Figure 5. The output path of a CW laser with frequency
(1550 nm, RIO Orion laser module) is divided into a local oscillator (OLO) and a sensor. Regarding Equation (11), when the difference between frequencies is greater than 1.66 MHz with
L = 30 m, they are independent of each other [
32]. Since the pulse width here was 100 ns, the measured distance must exceed 17.8 m to ignore the effect of the pulse width on the phase signal calculation.
L = 30 m meet this criterion. Three acoustic-optical modulators generate probe pulses and shift their frequencies by 40, 80 and 150 MHz (Δ
w_1, Δ
w_2, Δ
w_3). Three AOMs and the data acquisition system were synchronized by a pulse generator. All pulses had a 100 ns width and a 1 kHz repetition rate. After amplification in an EDFA, the probe pulse was transmitted through the circulator to the FUT. The first part of the fiber was 450 m, followed by a 30 m cylindrical piezo-electric transducer (PZT) actuator excited with a 25 Hz sine wave. Then, the far end of the FUT was located at the 1079 m. RBS from the FUT at frequency
mixed with the OLO at the receiver, produced three intermediate frequencies. A balanced photodetector with a 200 MHz bandwidth converts the optical signal into an electrical signal. An 8-bit data acquisition system was used to capture the output data at a 1 GHz sampling rate.
In order to evaluate our proposed algorithm, 375 s of data was continuously collected. Experiments have shown that the intensity of the backscattered light at each point does not change very quickly, so it took several seconds to enter or fall out of it for each point. Therefore, this long record data ensured that all scatterers have enough time to experience various possible states.
Figure 6 shows an output of approximately 13 s.
In this example, the amplitude of the demodulated signal with the average window of 100 had been observed. When the frequencies were 40, 80 and 150 MHz, the phase display was distorted in some time ranges. In order to achieve the best trajectory, the distortion signal was jumped to a well-shaped signal at an appropriate time before the distortion actually occurs. The six framed areas were controversial because the system needs to switch from the current output that was about to be distorted to another beat frequency opportunely, which provided the best phase signal for the upcoming trace. Each phase signal extracted had a different phase offset, and we had added a high-pass filter like a differentiator to eliminate these offsets. Therefore, we achieved a change in instead of itself. The change in the phase signal extracted from the most recent output was directly appended to the previous one. The final output was very smooth, well-formed and without distortion. The three figures of indicate that every two highest amplitude curved collide, one of them exceeded the other, and our prediction signal changed and switches to another beat frequency.
We calculated the failure rate of each frequency during the test time. The average failure rates were 11.2%, 14.7%, 15.3% for 40, 80 and 150 MHz. When the window size was 50, the failure rate of the algorithm can be reduced to 1.26%.
4. Optimization of SR and SNR Performance in the Φ-OTDR System Based on FDM
In the current study on Φ-OTDR, vibration is generally considered to be applied to a small area of the SR unit. RBS from upstream and downstream of the vibration location are unaffected. [
31]. However, in practice, vibration can be applied to the sensing fiber containing many SR units. These regions may be modulated by vibration and other background noise, resulting in noise phase signal interference, which in turn deteriorates the SNR of the Φ-OTDR system. However, the SNR of Φ-OTDR is actually related to the SR and the length of the vibration region. The RBS trajectory of Φ-OTDR can be described by the classical one-dimensional impulse response model [
6]. The optical power
of the RBS light is as follows:
is the amplitude of the
scattered light,
is the total number of scattered points within a probe pulse,
is the fiber attenuation constant,
is the speed of light in vacuum,
is the refractive index of the fiber, and
corresponds to the time delay of the detection pulse travelling distance
, from the input to the
scattering.
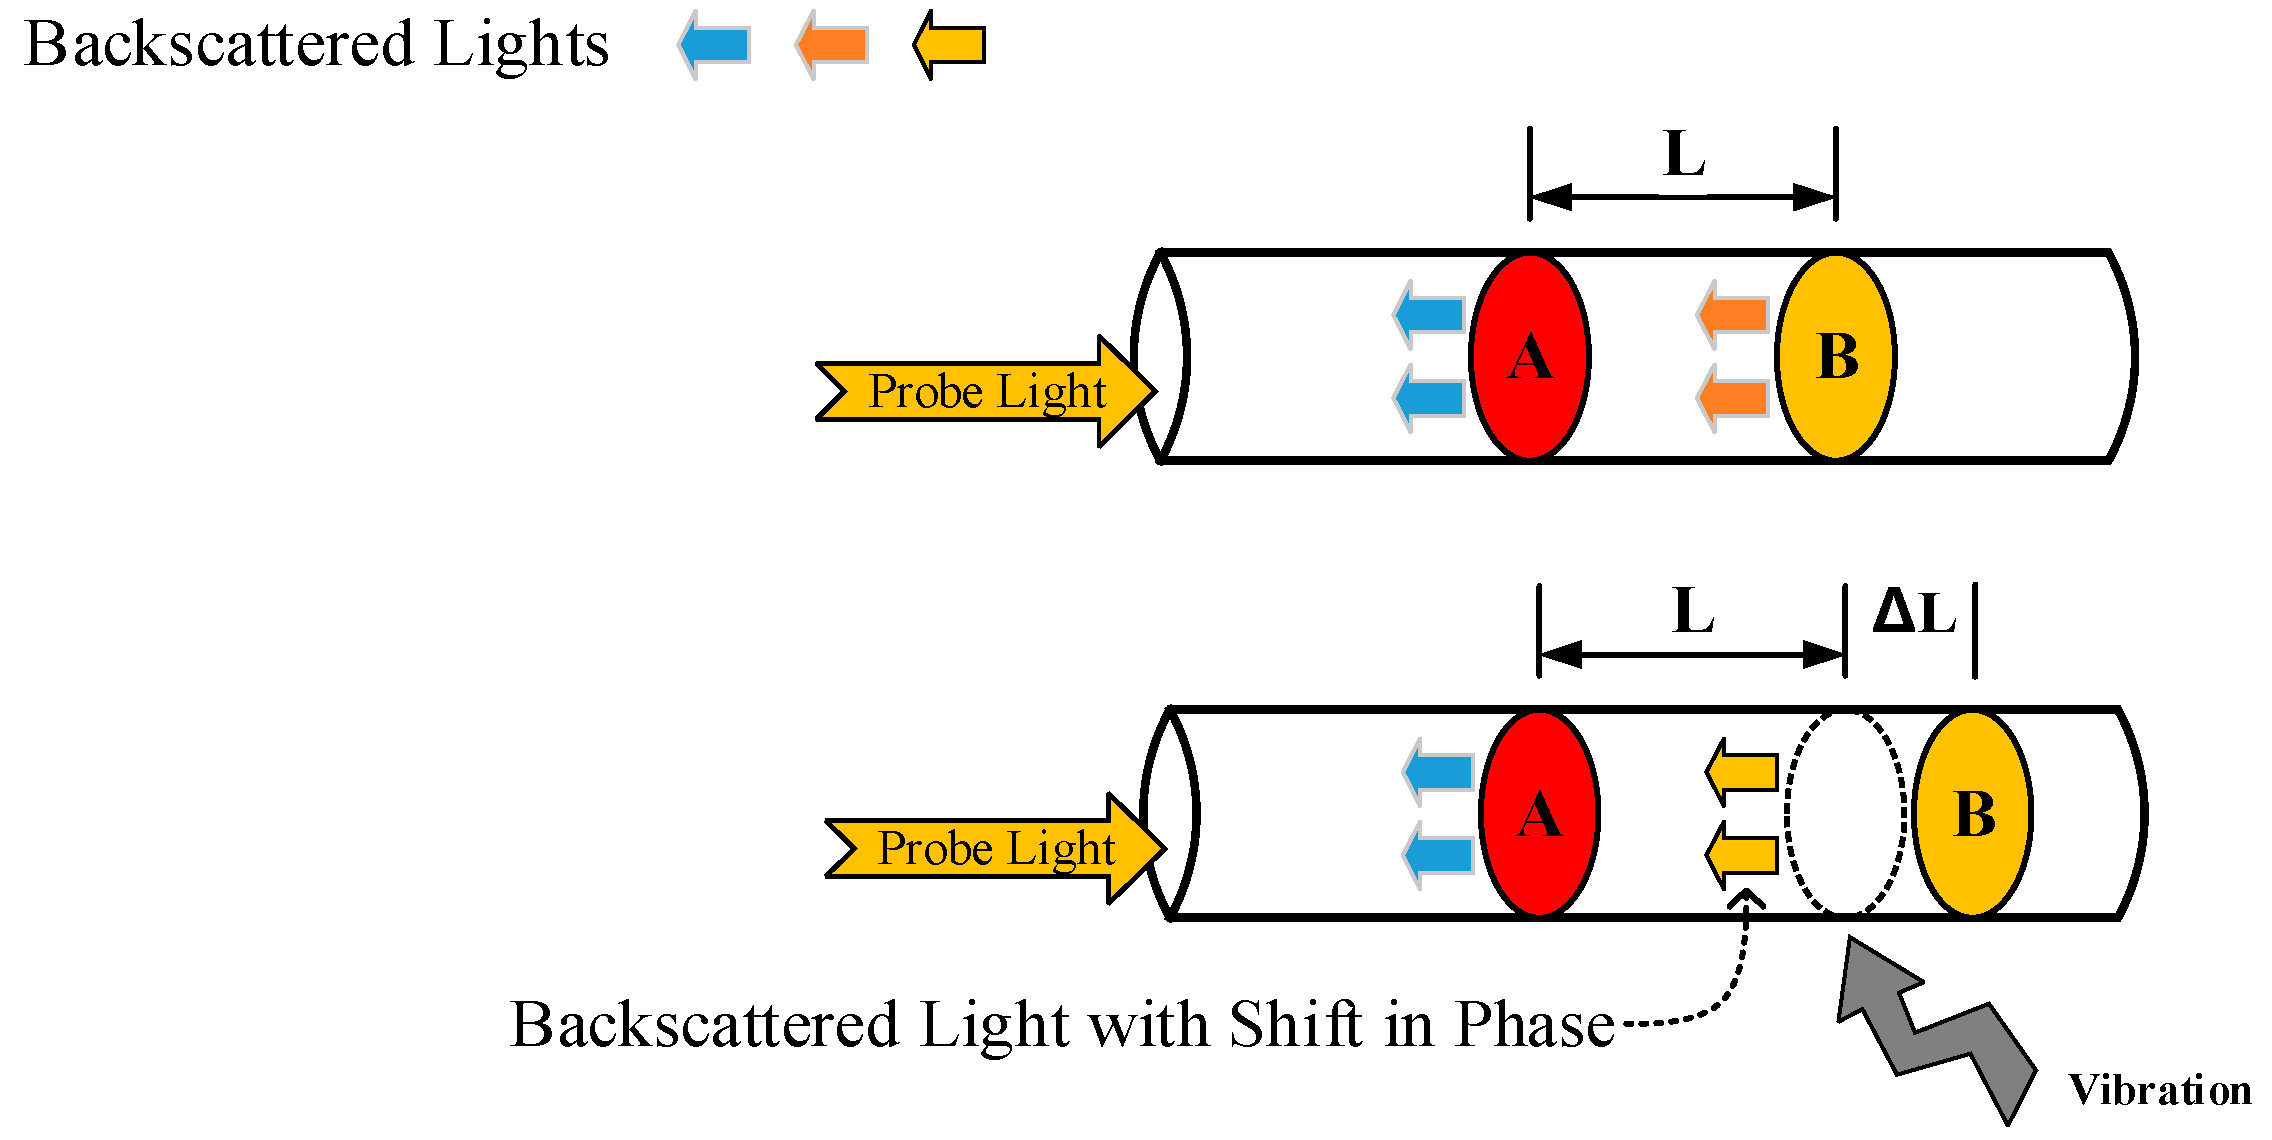
is the pulse width in the sensing fiber. There is a linear relationship between the phase difference change
and Δ
L [
33], like Equation (4).
For conveniences, it is reasonable to assume that the change in fiber length is caused only by external vibration events and background noise within the SR unit. In addition, the level of background noise in field applications is typically much higher than system noise. Therefore, the influence of system noise on SNR can be neglected, and the length change between adjacent scattering points on the fiber caused by vibration can be considered as Δ
ls. Considering that the noise is random, the equivalent fiber length variation Δ
ln between adjacent scattering points caused by background noise can be expressed as:
is the change in fiber length of the
scatter point caused by background noise.
N is the total number of scatter points within a probe pulse. Therefore, the SNR of the Φ-OTDR can be given as follows:
and
are the fiber variations length caused by vibration and background noise, respectively. Assuming that the scattering point density per unit fiber length is
, the length of the vibration area is
. When
,
and
can be defined as:
Substituting (15) and (16) into (14), we get SNR as:
Obviously, when
, the SNR increases monotonically with SR. When
, we can get the best SNR. When
,
and
can be defined as:
Substituting Equations (18) and (19) into (14), when
, we get the SNR,
Equation (21) means that when
, the SNR decreases monotonically with SR. In summary, the SNR of the phase discrimination Φ-OTDR sensing system can be written as:
Therefore, when SR is equal to the length of the vibration region L, the optimum SNR of the sensing system can be achieved.
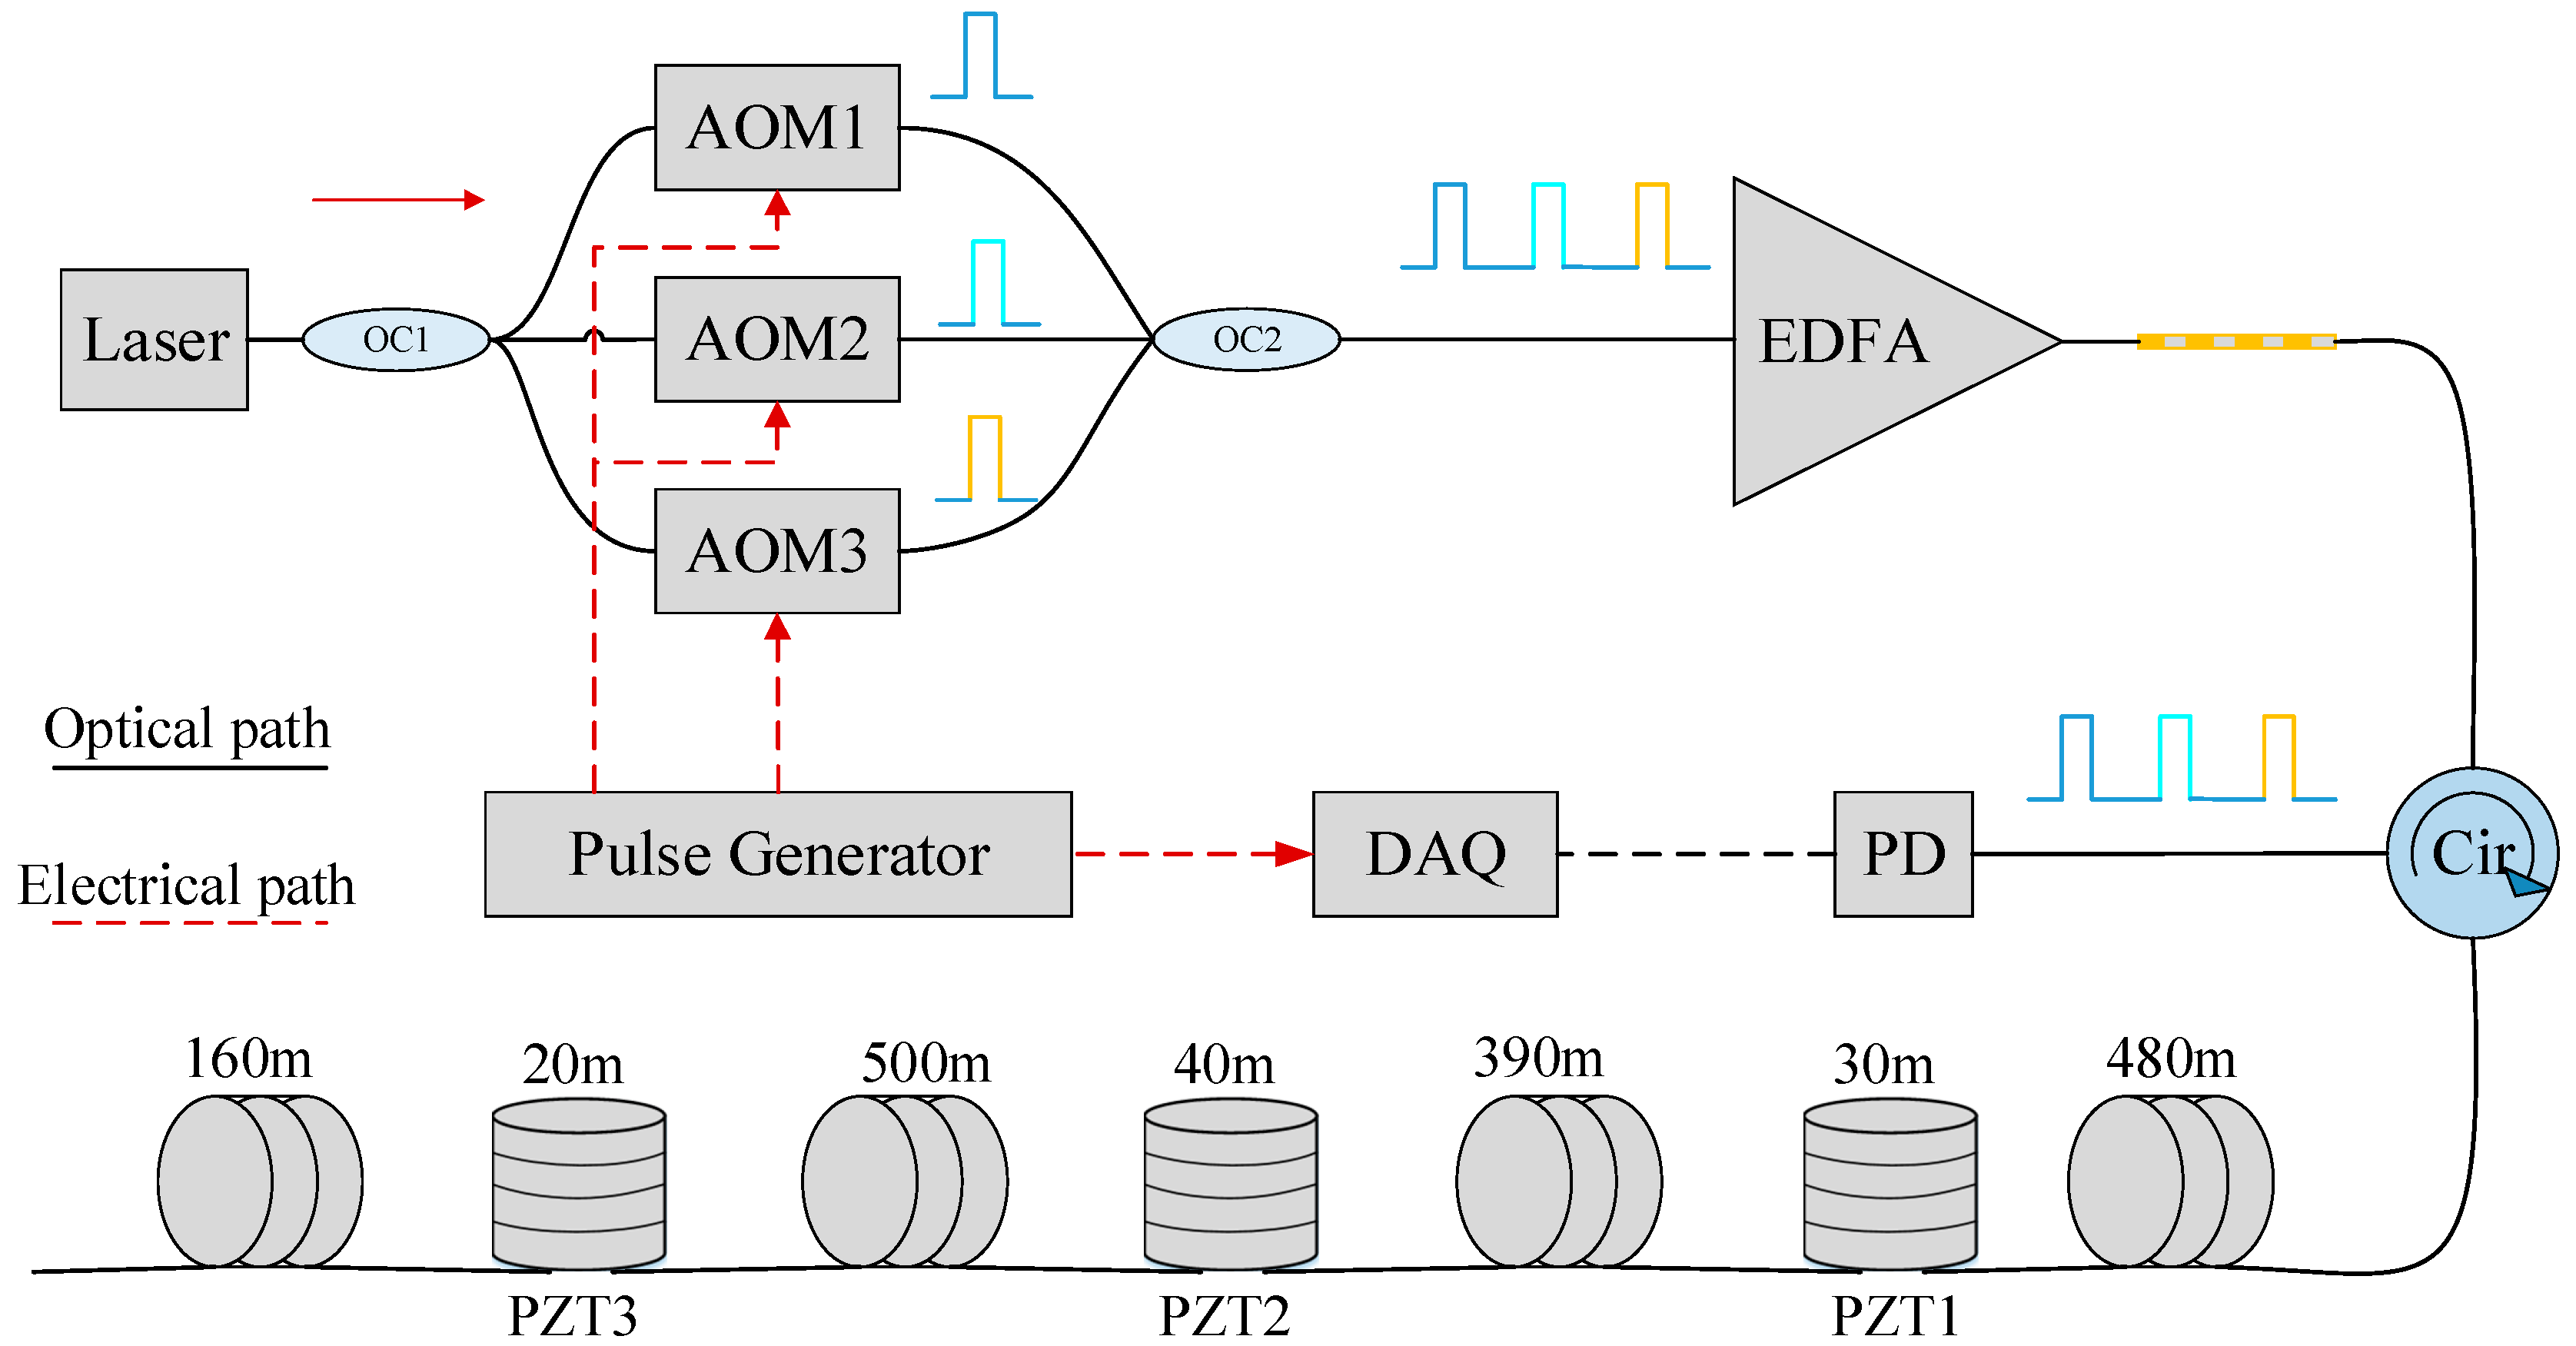
Based on the above analysis, the basic qualitative relationship between SR, SNR and the length of the vibration region is revealed. However, since the length of the vibration event region cannot be known in advance, and a plurality of vibration events of different vibration regions may occur along the sensing fiber, which makes it difficult to achieve best performance with the fixed SR. The sensing system must have MSR analysis capabilities to achieve performance optimization of the Φ-OTDR sensing system. Therefore, we propose a new MSR Φ-OTDR scheme based on FDM, shown in
Figure 7.
A narrow linewidth laser was used as the light source, and its line width and center wavelength were 3.7 kHz and 1550.12 nm, respectively. The output of the laser was split into three paths through a 3 × 3 opt coupler (OC1). Three acoustic optical modulators (AOM1, 2, 3) were used to generate optical pulses having a frequency shift of 40, 80 and 150 MHz with respect to the laser. The AOM was modulated by a pulse generator. The pulse width and repetition rate of the three probe pulses were 100 ns and 25 kHz, respectively. These probes were then pulsed together by OC2 and amplified by an EDFA. An optical filter with a 0.8 nm bandwidth was inserted to minimize the broadband amplifier’s spontaneous emission (ASE) noise. The peak power of the probe pulse was amplified to 20 dBm and then transmitted through a circulator to the 1.62 km sensing fiber. Three PZTs were mounted on the sensing fiber, and the length of the vibration zone was 30 m, 40 m and 20 m, respectively. A 1 kHz pure sine wave drive signal was applied across all three PZTs. The RBS was received by a 200 MHz photodetector (PD). The DAQ records 500 consecutive Φ-OTDR traces for signal processing with a sample rate of 1 GSa/s.
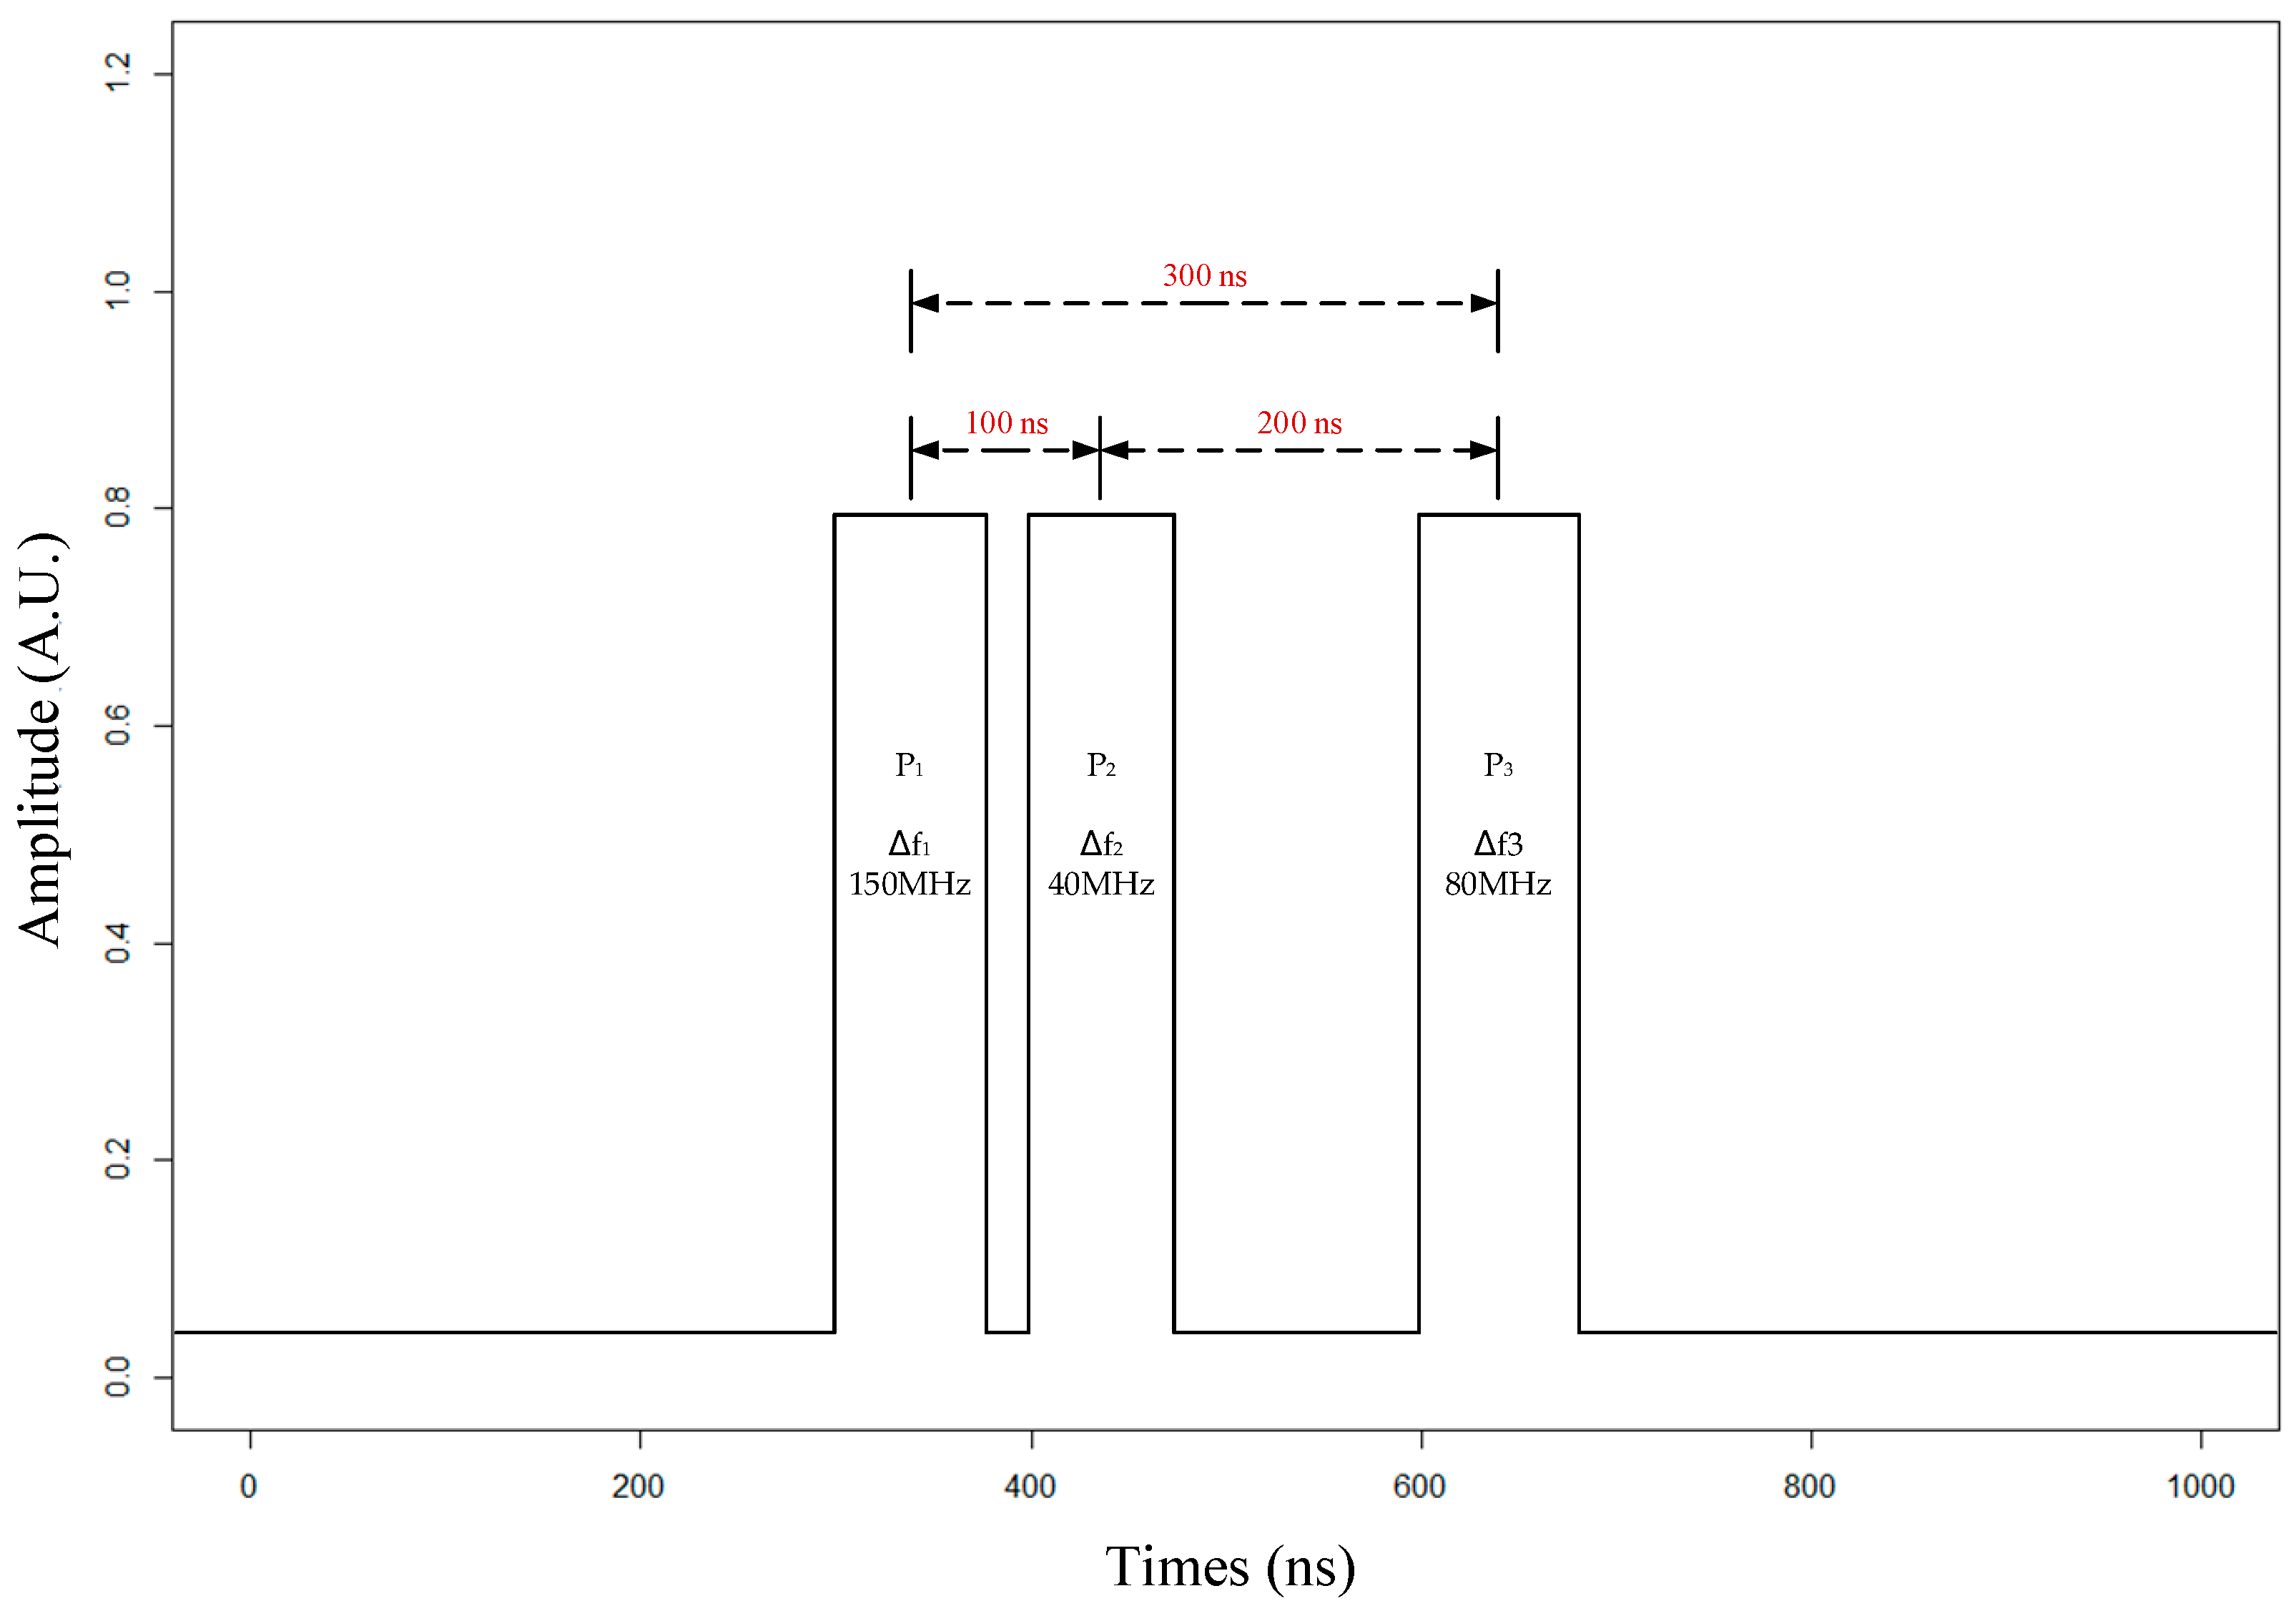
Figure 8 shows the schematic diagram of time domain waveform of a three pulse. By adjusting the trigger time of the pulse, the time delay between
and
is 100 ns and 200 ns. Therefore, the time delay between
and
can be considered to be 300 ns. The corresponding interval for each of the two pulses is 20 m, 40 m and 60 m. The on-time of the pulse itself is always set to 100 ns, corresponding to a 20 m pulse width in the sensing fiber.
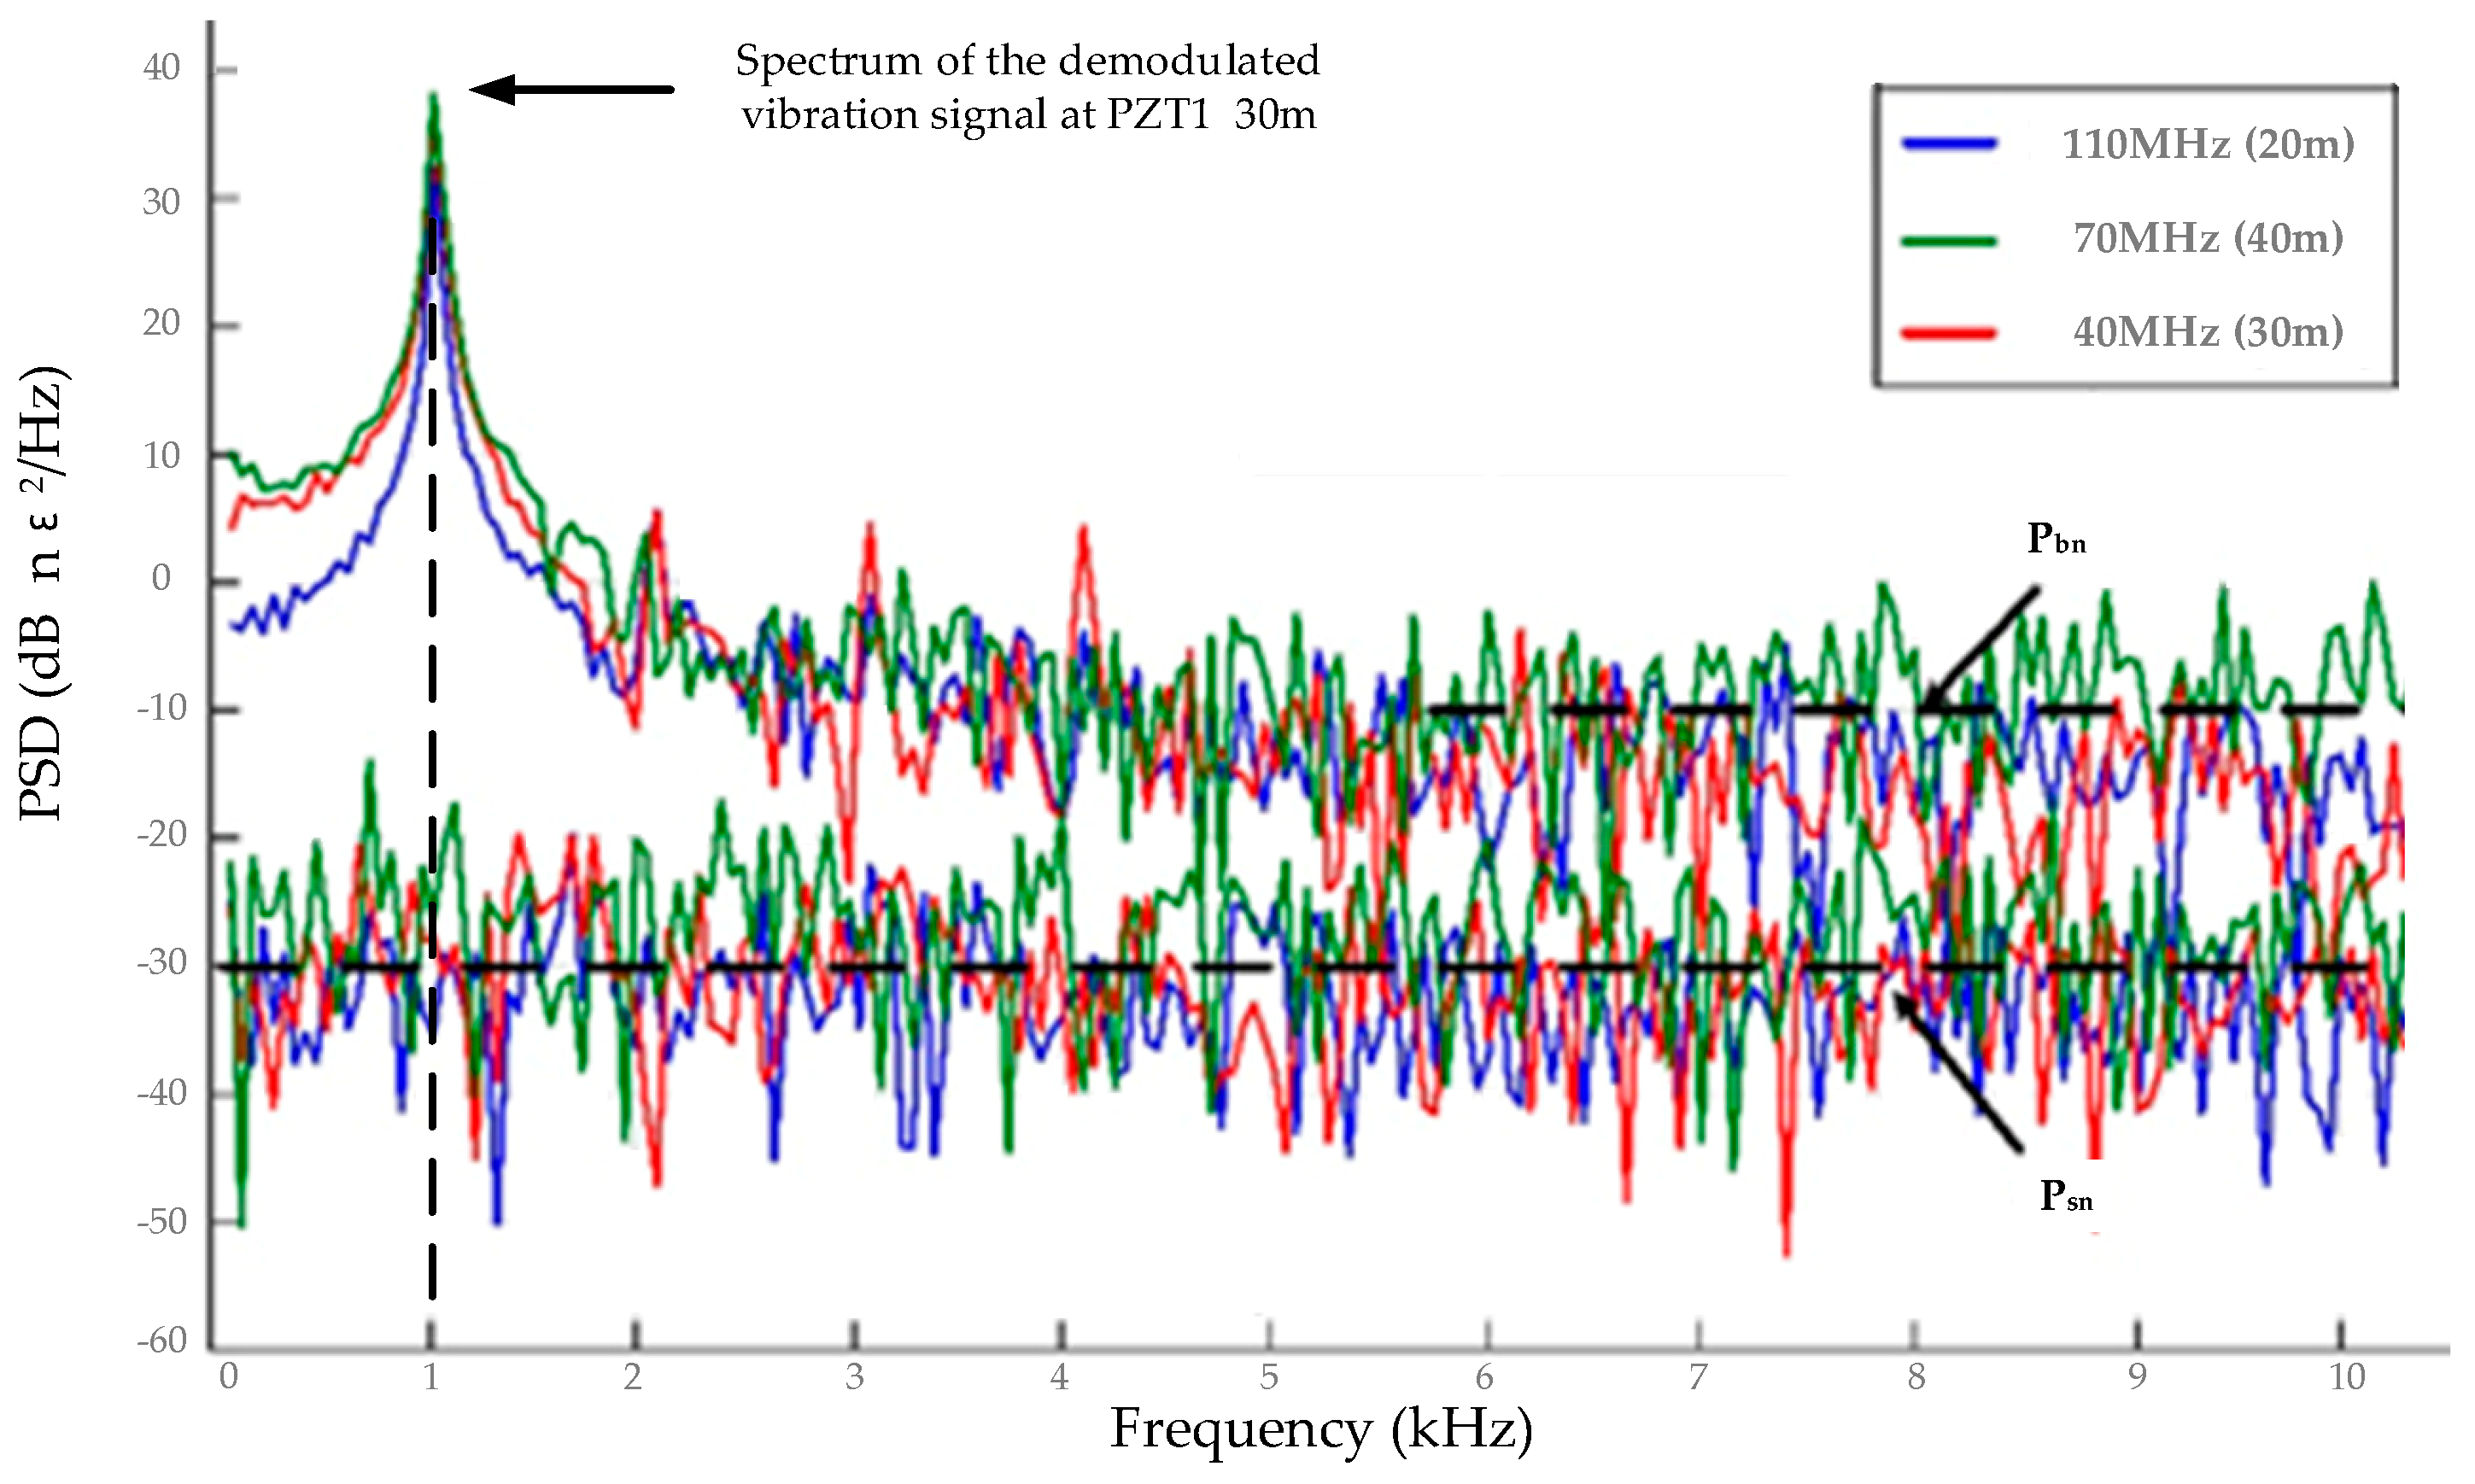
The output of the PD will contain three product terms of the direct-current term and the electric field of the RBS generated by the three pulses. Three digital band-pass filters with center frequencies of 40 MHz, 70 MHz and 110 MHz were designed to extract the three beat signals. The passband of these three filters is 20 MHz. According to Equation (15), different time delays can result in different SRs, so each beat signal corresponds to one SR. This means that SR is 30 m for a 40 MHz beat signal, 40 m for a 70 MHz beat signal, and 20 m for a 110 MHz beat signal.
The envelope and phase angle of the three beat signals can be extracted by the Hilbert transform [
34]. The designed band-pass filter differs in the delay between sequence and pulse, so there was a delay in each beat signal. The power spectrum of the demodulated vibration signal at PZT1 and system noise are shown in
Figure 7. The first peak has a frequency of 1 kHz, which was consistent with the frequency of the waveform applied on PZT1. By processing three jitter signals, the SNR of PZT1 under different SR was 47.73, 48.49 and 53.28 dB, respectively. Obviously, the red spectrum obtained by processing the 40 MHz beat signal had the optimum value of SNR. The length of the fiber wrapped on PZT1 was just about 30 m, so when SR (30 m) was equal to the length of the vibration zone (PZT1), the SNR can reach the optimum value.
In this experiment, we first placed the sensing fiber on a platform without vibration isolation. Because the laboratory was located on the top floor of the six-story building, the building’s free vibration and several continuous working machines inside, such as ventilation system, central air conditioning, etc., together generate background noise to the sensing fiber and PZT, resulting in a relatively strong background noise. Then, in order to evaluate the system noise level, the sensing fiber was placed on a rubber isolation pad and a floating optical platform to be isolated from the environment and free from background noise. For PZT1, the power density of the background noise
and system noise
are as shown in
Table 1 and
Figure 9. Obviously, the background noise level was much higher than the system noise level, and the difference of the noise level was about 20 dB.
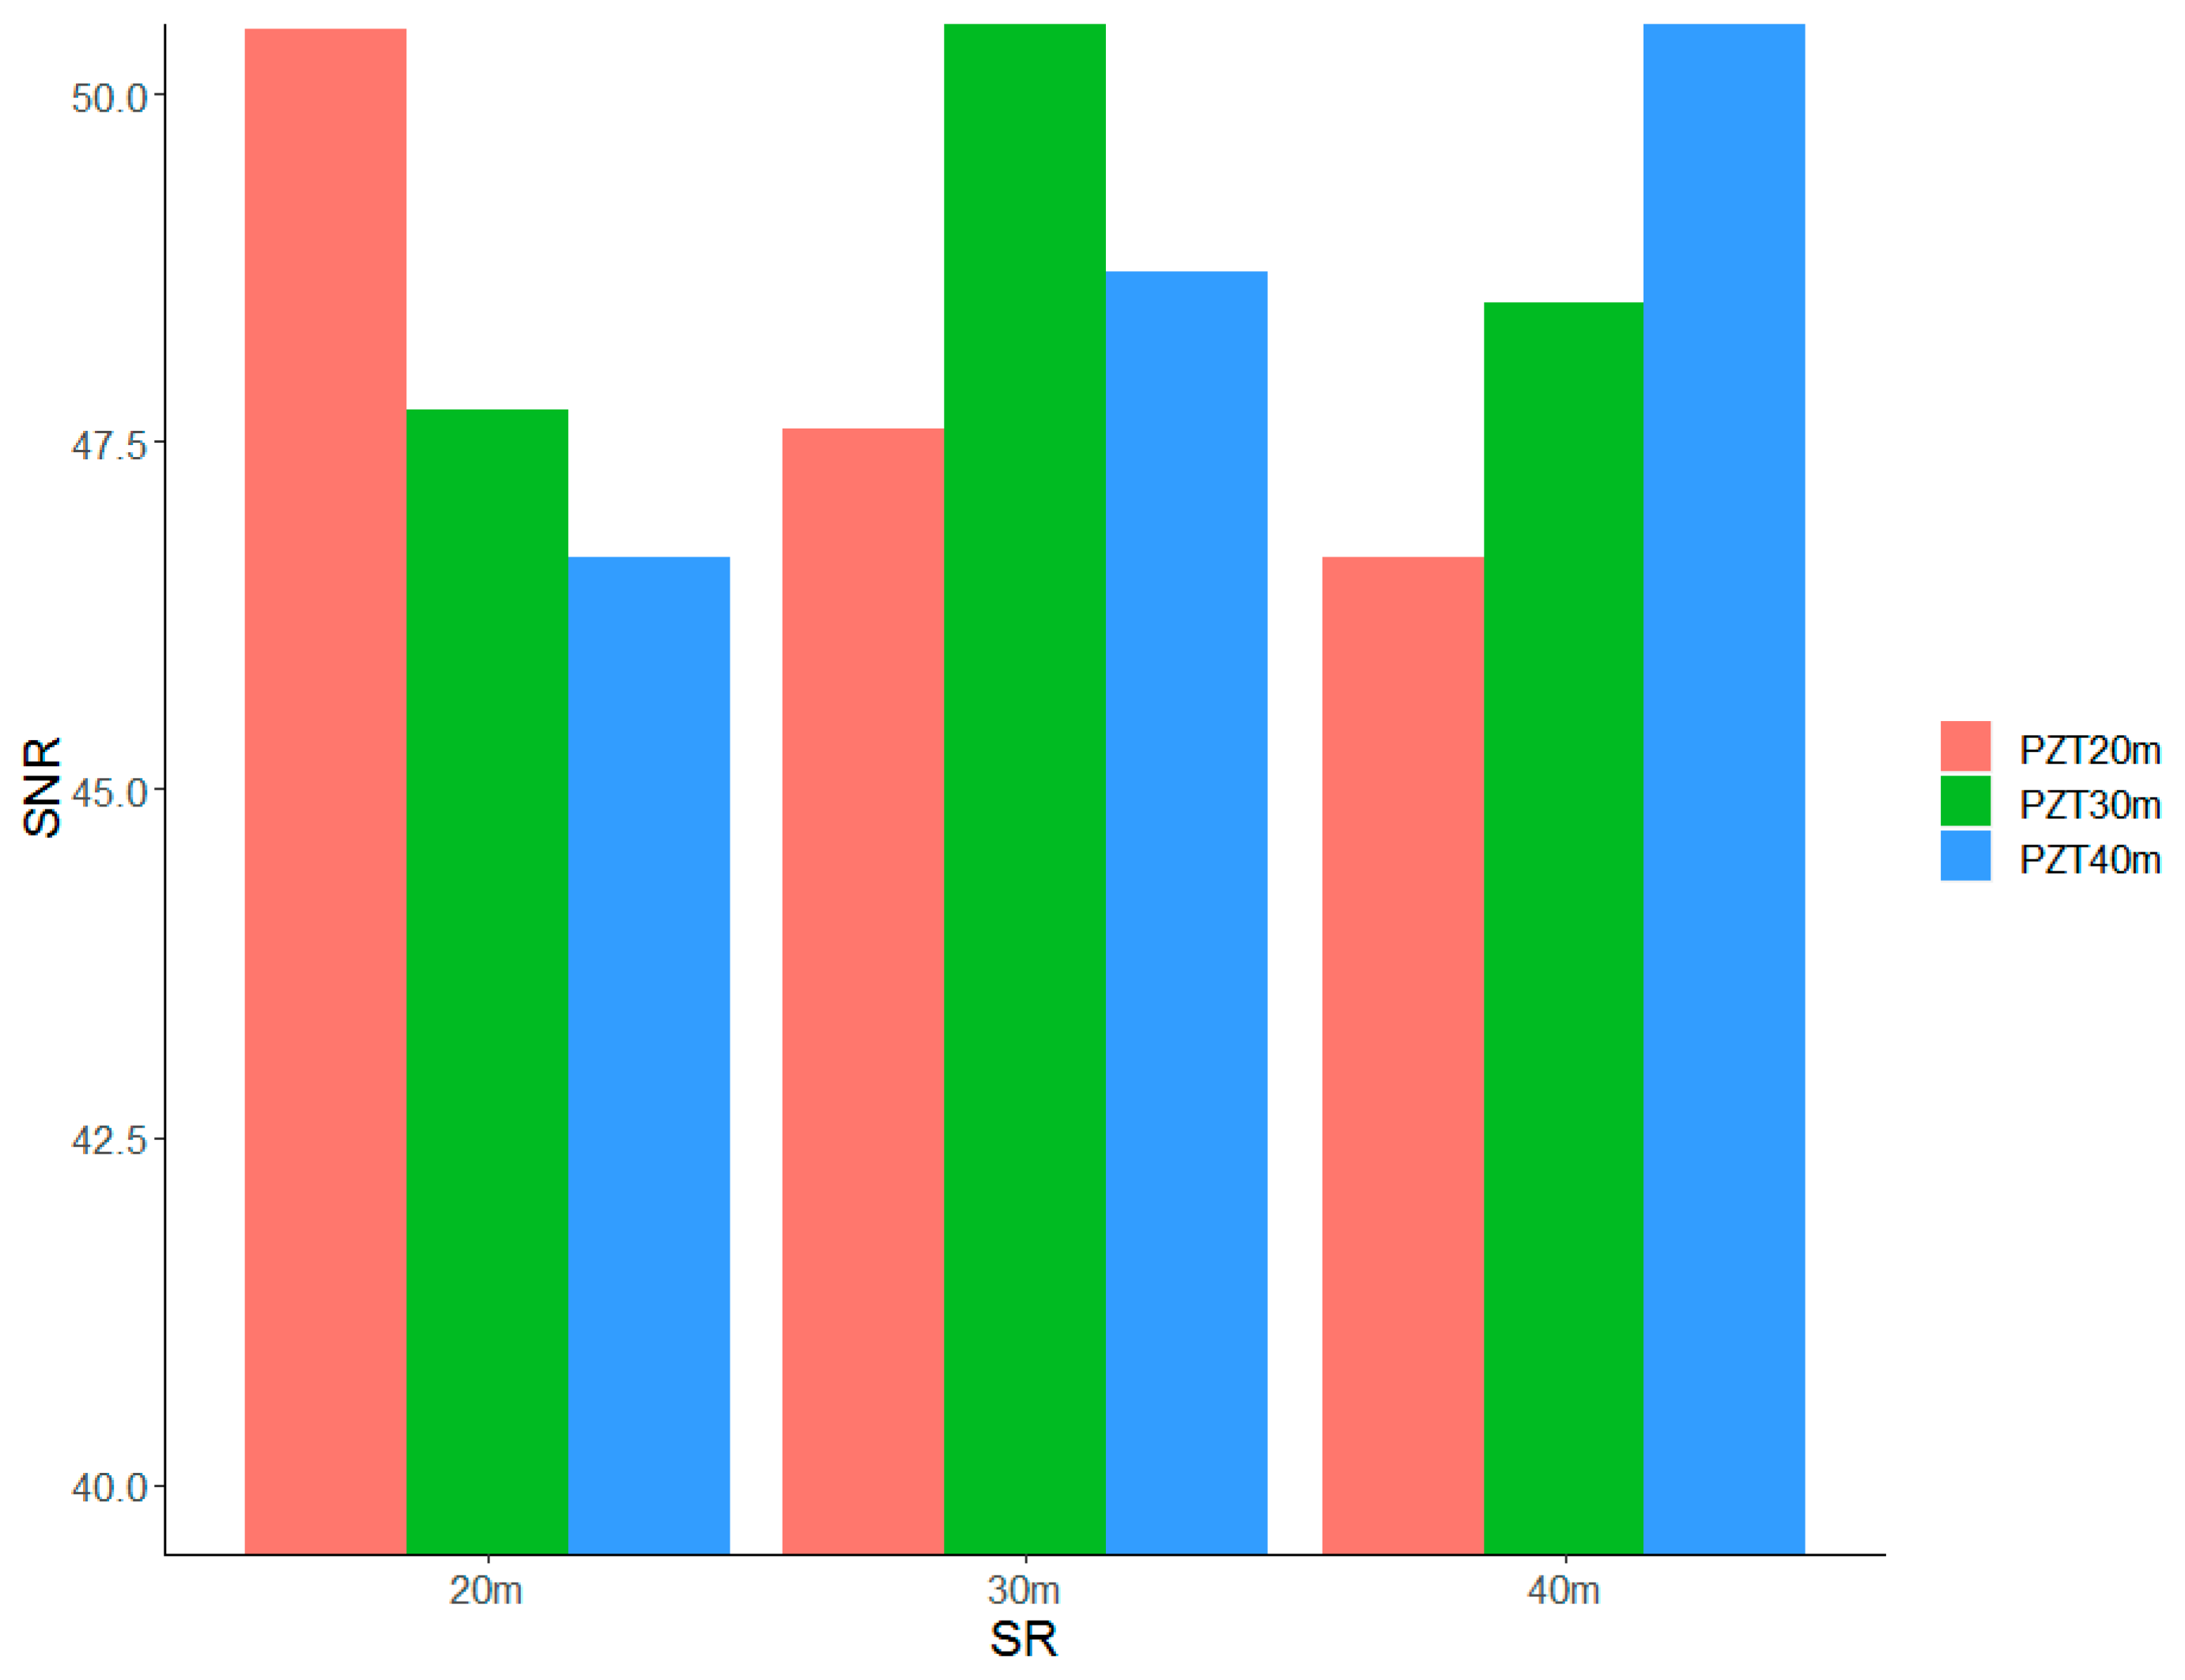
Then, the same signal processing was applied to the other two vibration regions.
Figure 10 shows the overall measured SNR for the three PZTs. Therefore, through MSR analysis, the optimal SNR can be selected and the performance of the Φ-OTDR system can be effectively optimized.
The performance of Φ-OTDR is optimal when its SR matches the length of the vibration region. However, as described in Equation (4), in order to obtain a phase difference change, the upstream and downstream positions of the vibration are selected as the reference regions. These two reference regions should remain unaffected by the vibration. With a finer SR to measure the signal, the reference area will still be in the vibration zone and be affected by the vibration. When the background noise is very strong, the finer combination of SR will not further improve the SNR, and may even worsen the SNR of the demodulated phase signal [
4]. In any case, the digital combination of signals simplifies the system structure, so it is also a powerful MSR solution that improves the SNR of the system.
5. A Fading-free Broadband Φ-OTDR System Based on Artificial Microstructure Array and FDM
According to the Nyquist sampling theorem, the FRR of a conventional Φ-OTDR is half the repetition frequency of a probe pulse with a single frequency. If an interference event is detected at an under-sampling rate, the Φ-OTDR system will obtain the aliasing frequency in the FRR. There is a mathematical relationship between the aliasing frequency and the interference frequency, as described in [
35]:
where,
is the aliasing frequency with the under-sampling rate detected by the traditional Φ-OTDR system,
is the actual frequency of the interference event,
is the frequency of the single detection pulse,
is the pulse repetition period, and
is a coefficient that can make frequency beyond the FRR move to the FRR from
to
. The schematic is shown in
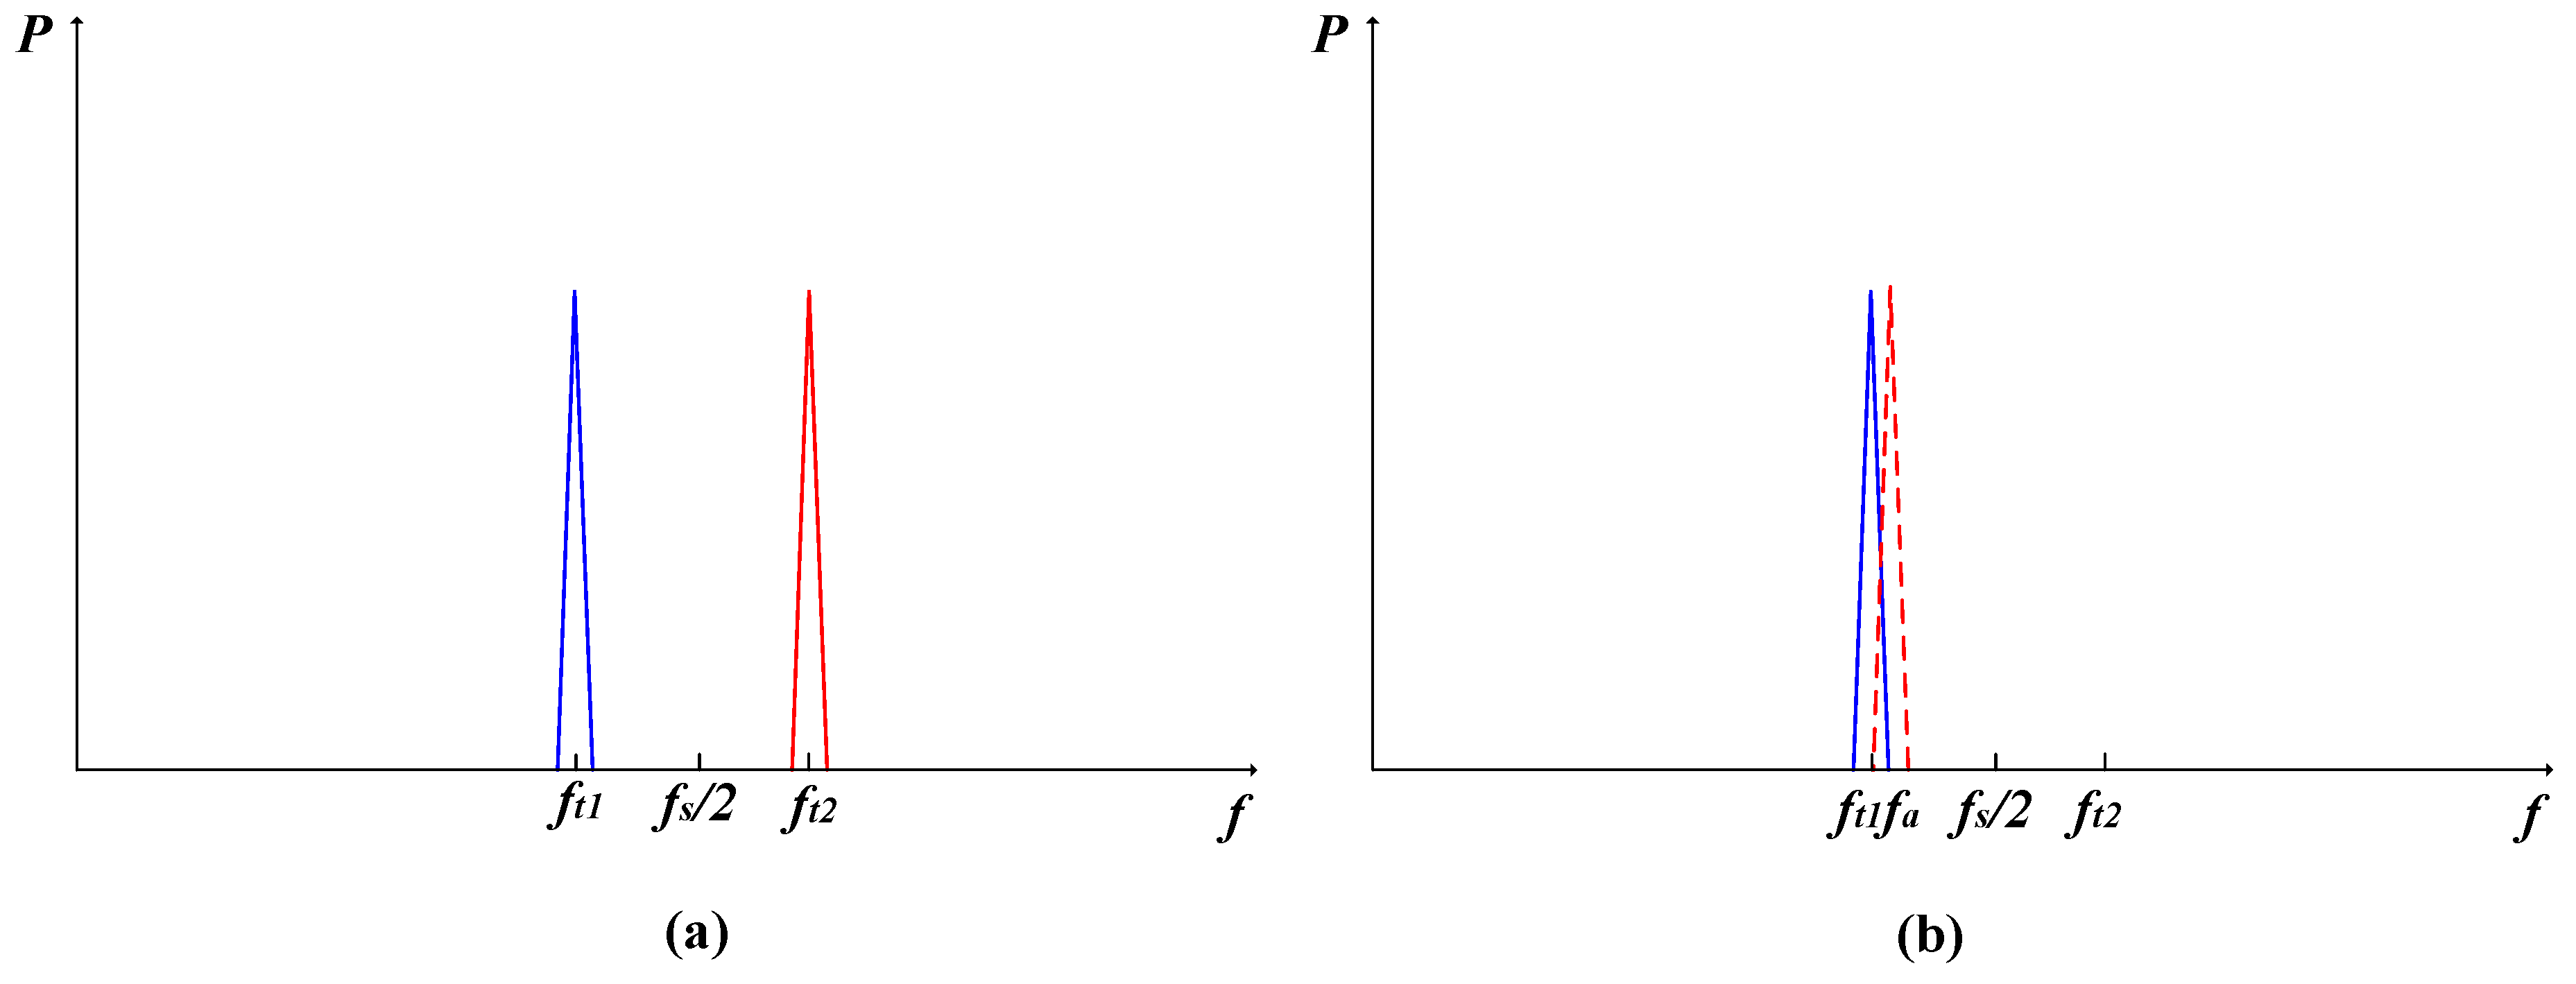
Figure 11.
Figure 11a shows that
is the frequency of the interference event in the FRR, and
is the frequency of the interference event beyond the FRR. According to Equation (24),
will be folded into the FRR. As shown in
Figure 11b, the aliasing frequency of
,
overlaps with
, which means that the frequencies in the FRR can be regarded as different frequencies. This situation can lead to wrong judgments. Therefore, it is necessary to extend the FRR of the system.
As mentioned earlier, trace intensity may have very low values at certain locations, which are referred to as fade locations. According to Equation (25), the trajectory intensity of the coherent signal is proportional to the scattering coefficient. The improved composite scattering coefficient can be described as follows [
19]:
where the
rave is the average backscattering coefficient of the FUT and
ri is the scattering coefficient of the
i-th scattering in the fiber, which is a random variable.
f(
t) is the waveform of the probe pulse.
β is the integral of the phase factor. Compared to fibers with backscattering coefficients and random positions, sensing fibers embedded in artificial microstructures have no melting loss and produce controllable and stable reflections. Therefore, the use of artificial microstructures instead of optical fibers makes the intensity traces more stable and the fading locations decreases.
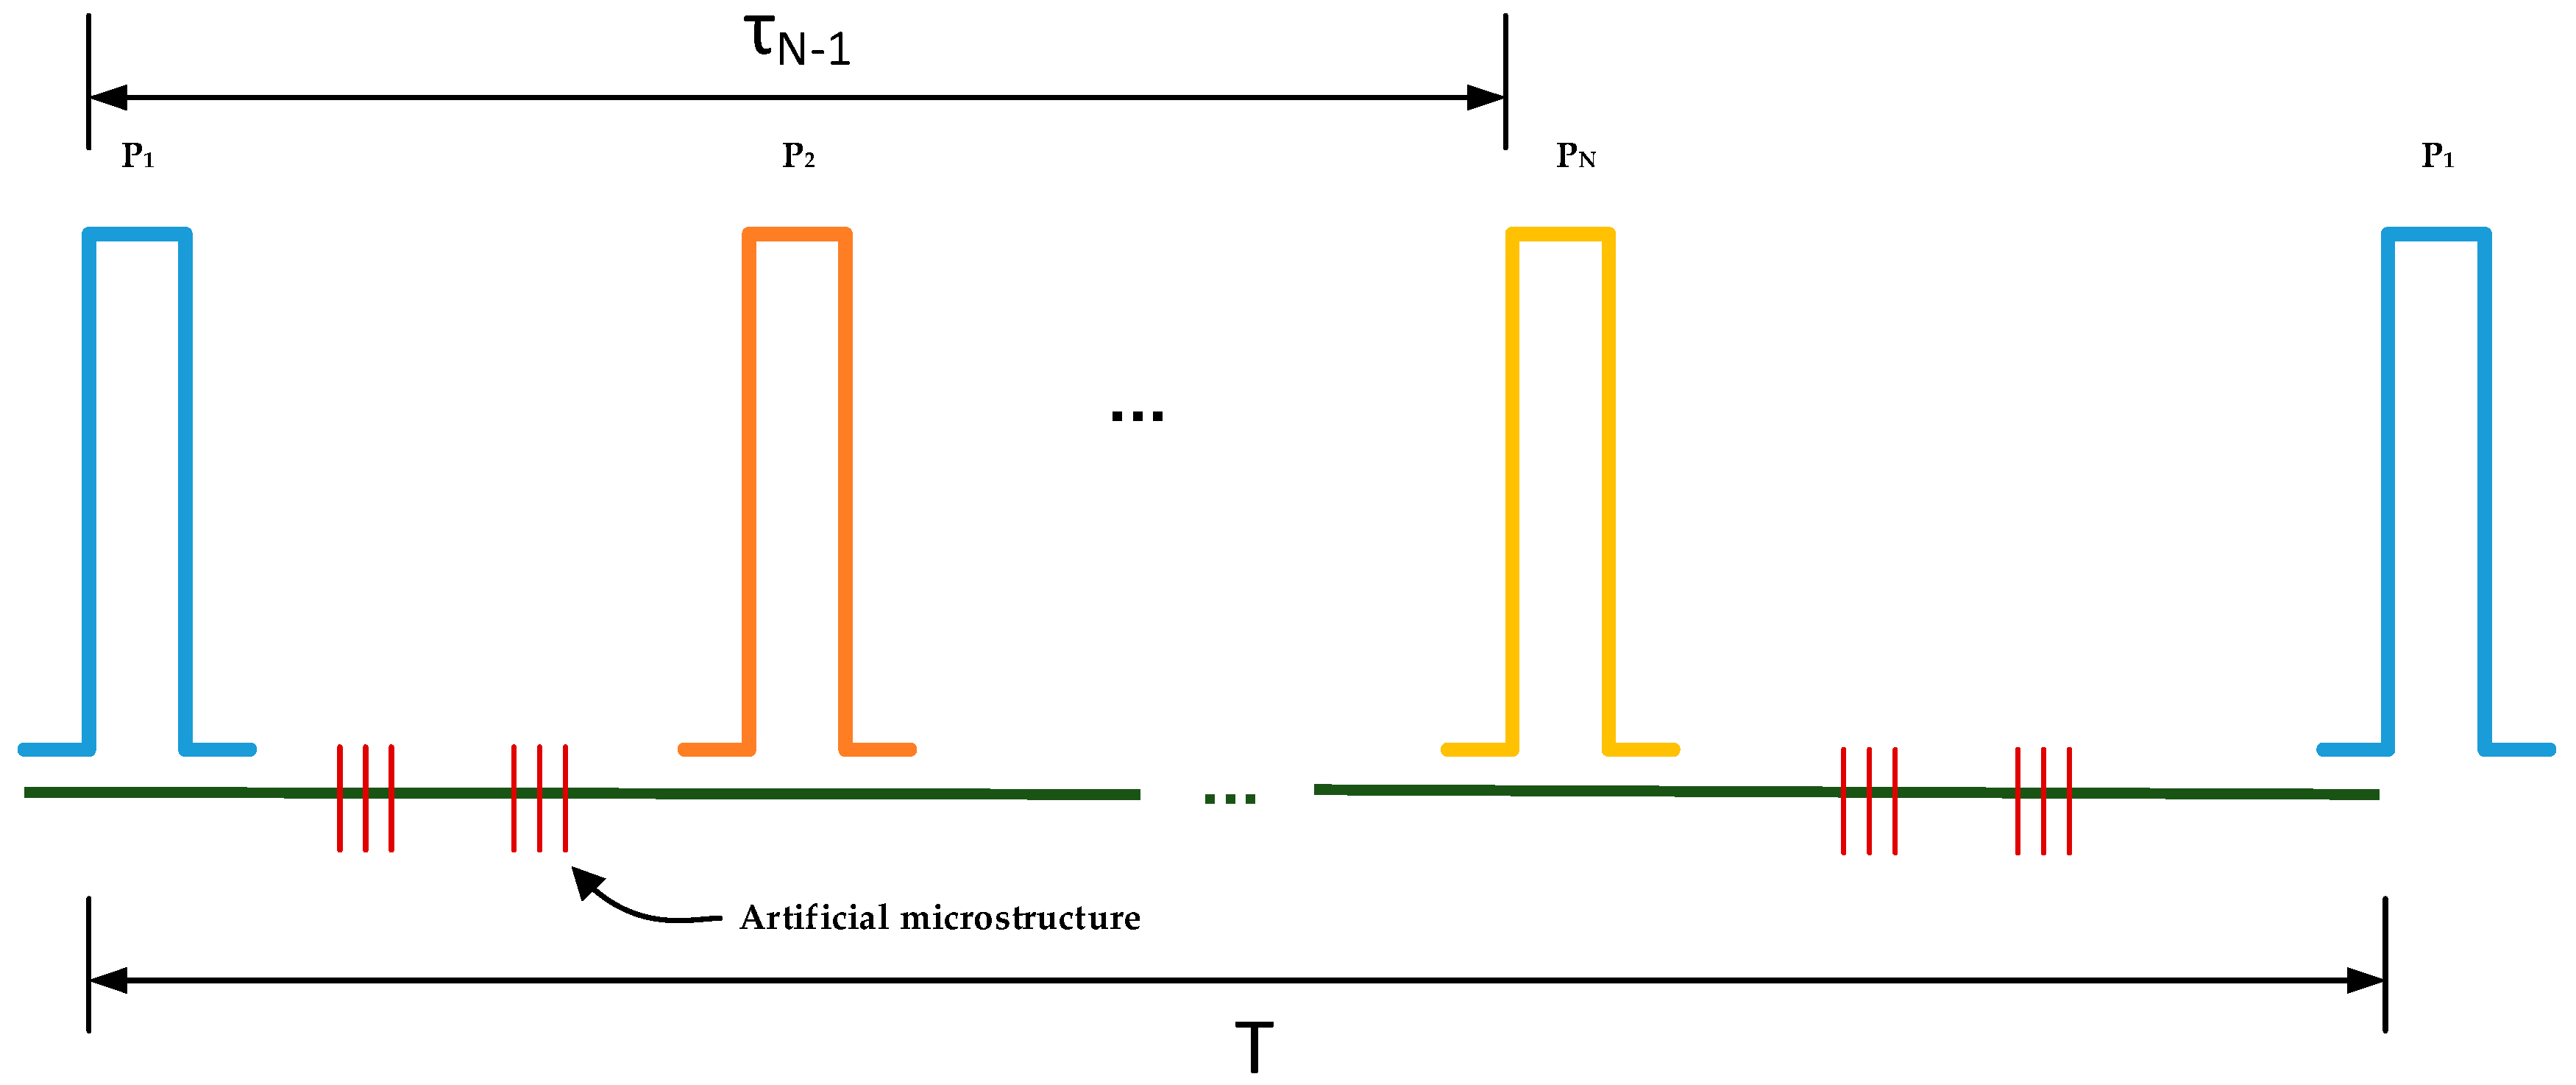
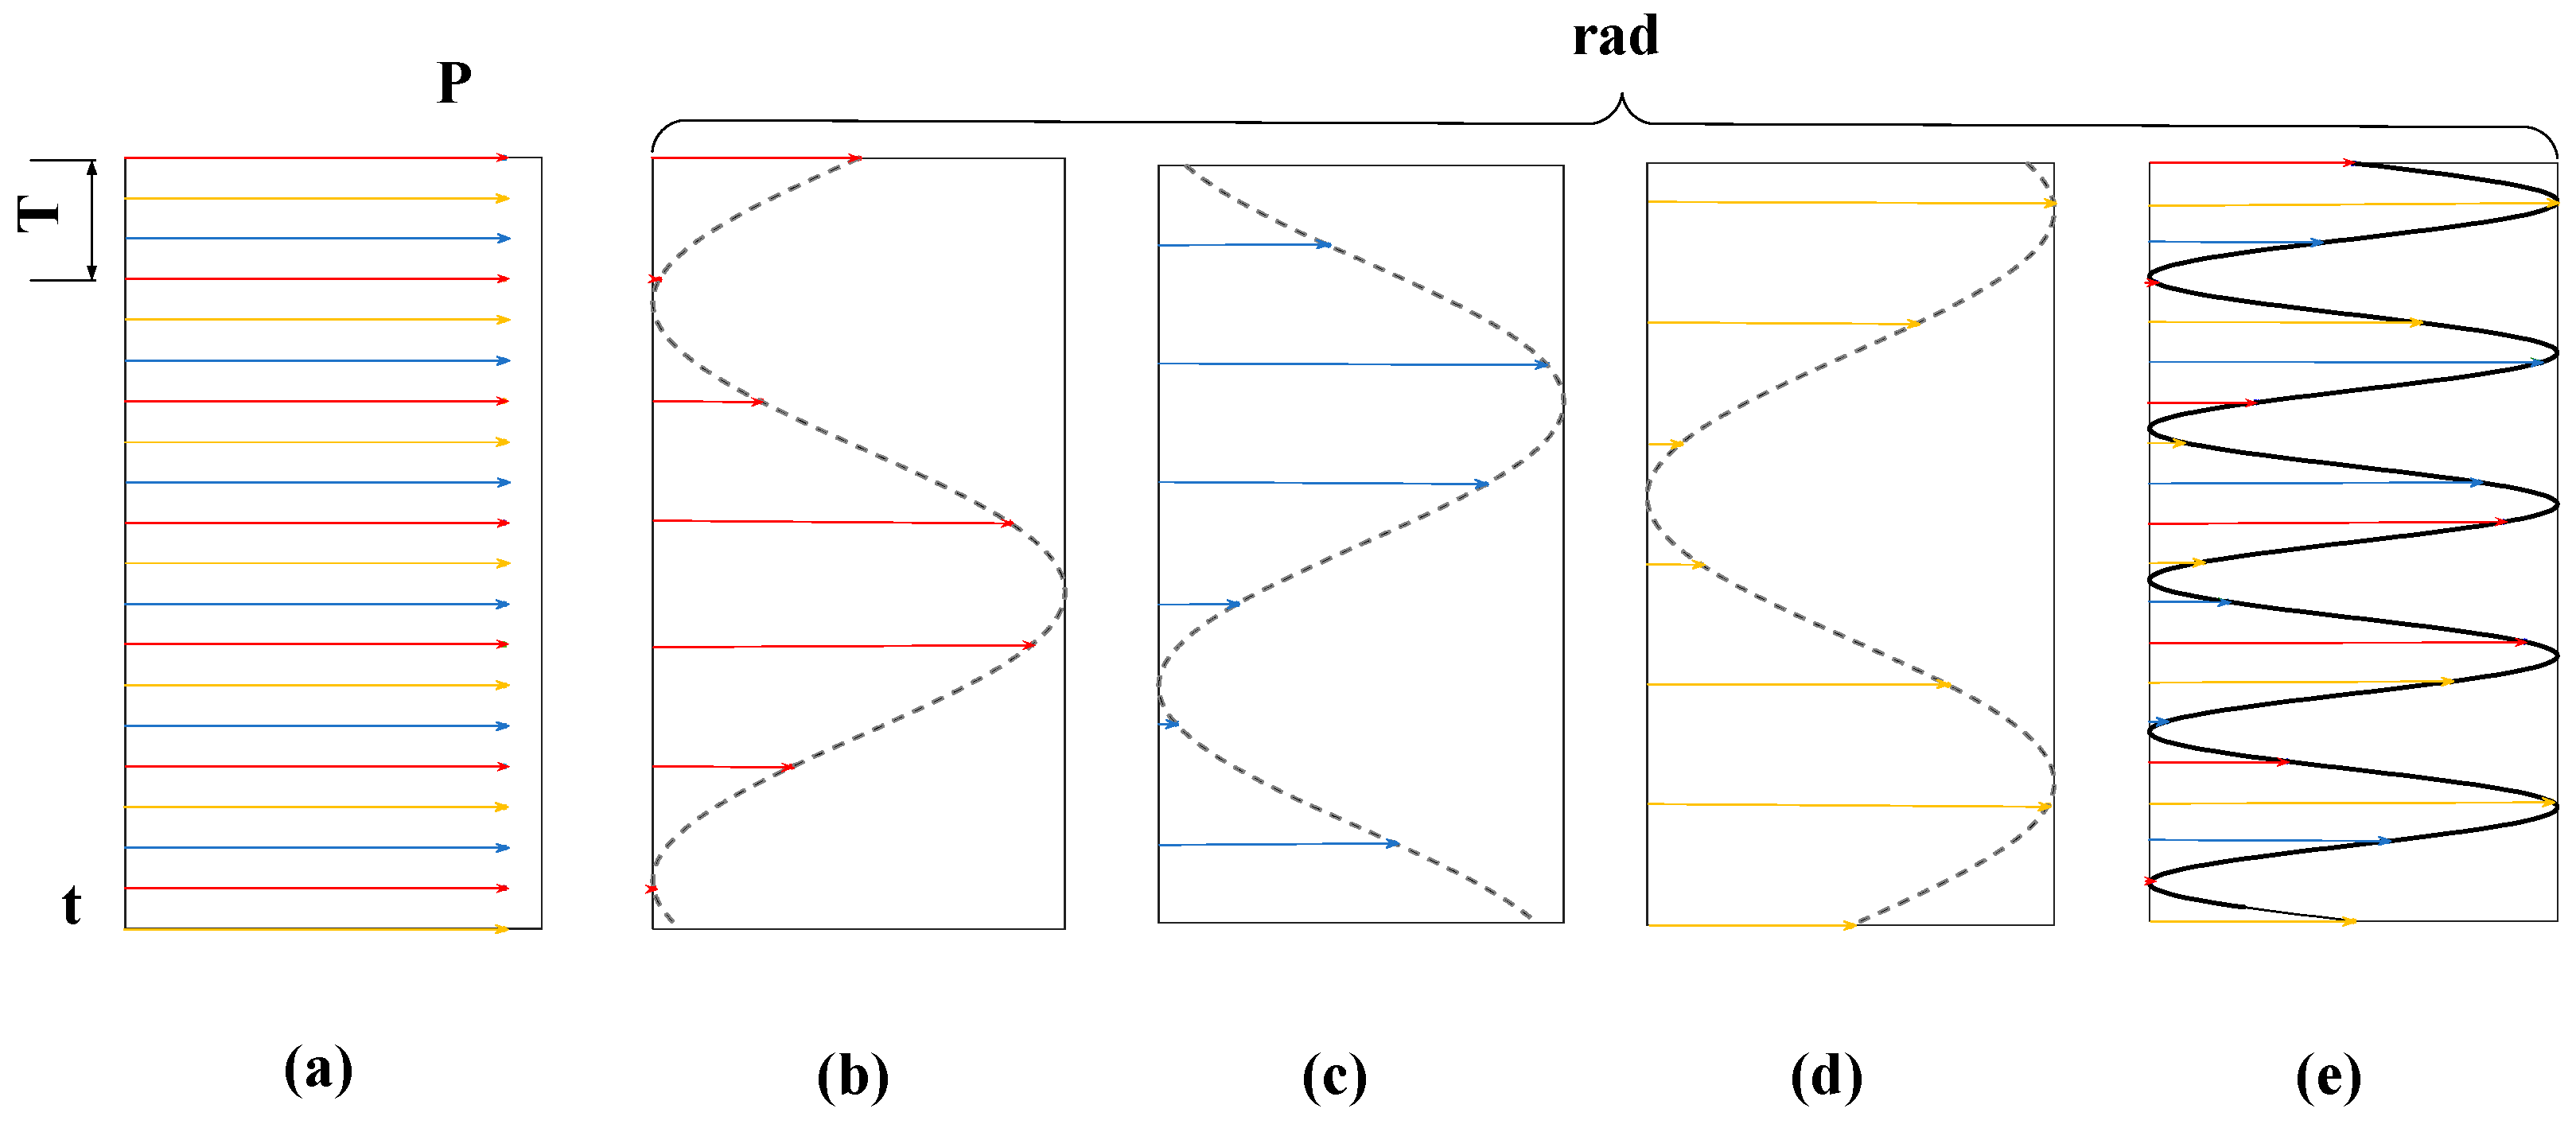
The detection pulse of the FDM Φ-OTDR system with artificial microstructure is shown in
Figure 12, in which pulses of different frequencies have different colors, and
represents the number of detection pulses having different frequencies. Assuming that the number of probe pulses at different frequencies is 3, the phase change of the reflected signal is as follows:
,
,
are phase differences caused by probe pulses of different frequencies,
,
,
are the frequency shifts of the three pulse modulators,
is the refractive index of the fiber, and
is the speed of light in the vacuum.
is the change in length of the FUT caused by vibration. Due to the frequency shift, the center frequency of the probe pulse also changes. The center wavelength of the laser source in the experiment was 1550 nm, which means that the center frequency of the laser source was 6.45 × 10⁴ GHz. Typically, the frequency shift in the experiment is approximately one hundred MHz, which means that the difference between the center frequency and the frequency shift of the laser source is approximately 10
−5. The variation caused by the frequency shift can be ignored compared to the center frequency of the laser source. Therefore, it is considered as follows:
According to Equation (28), when the same vibration is detected, the phase difference caused by the probe pulses of different frequencies is the same, which means that the phase change can be directly regarded as part of the vibration without additional mathematical process.
Due to the time delay between the probe pulses, the relationship between the change in phase difference of the reflected signal and the vibration is described as follows:
where
,
,
are phase difference variation waveforms obtained by detection pulses of different frequencies,
is the waveform of the disturbance event, and
is the time delay pulse
between the probes and
,
is the time delay between the detection pulses
and
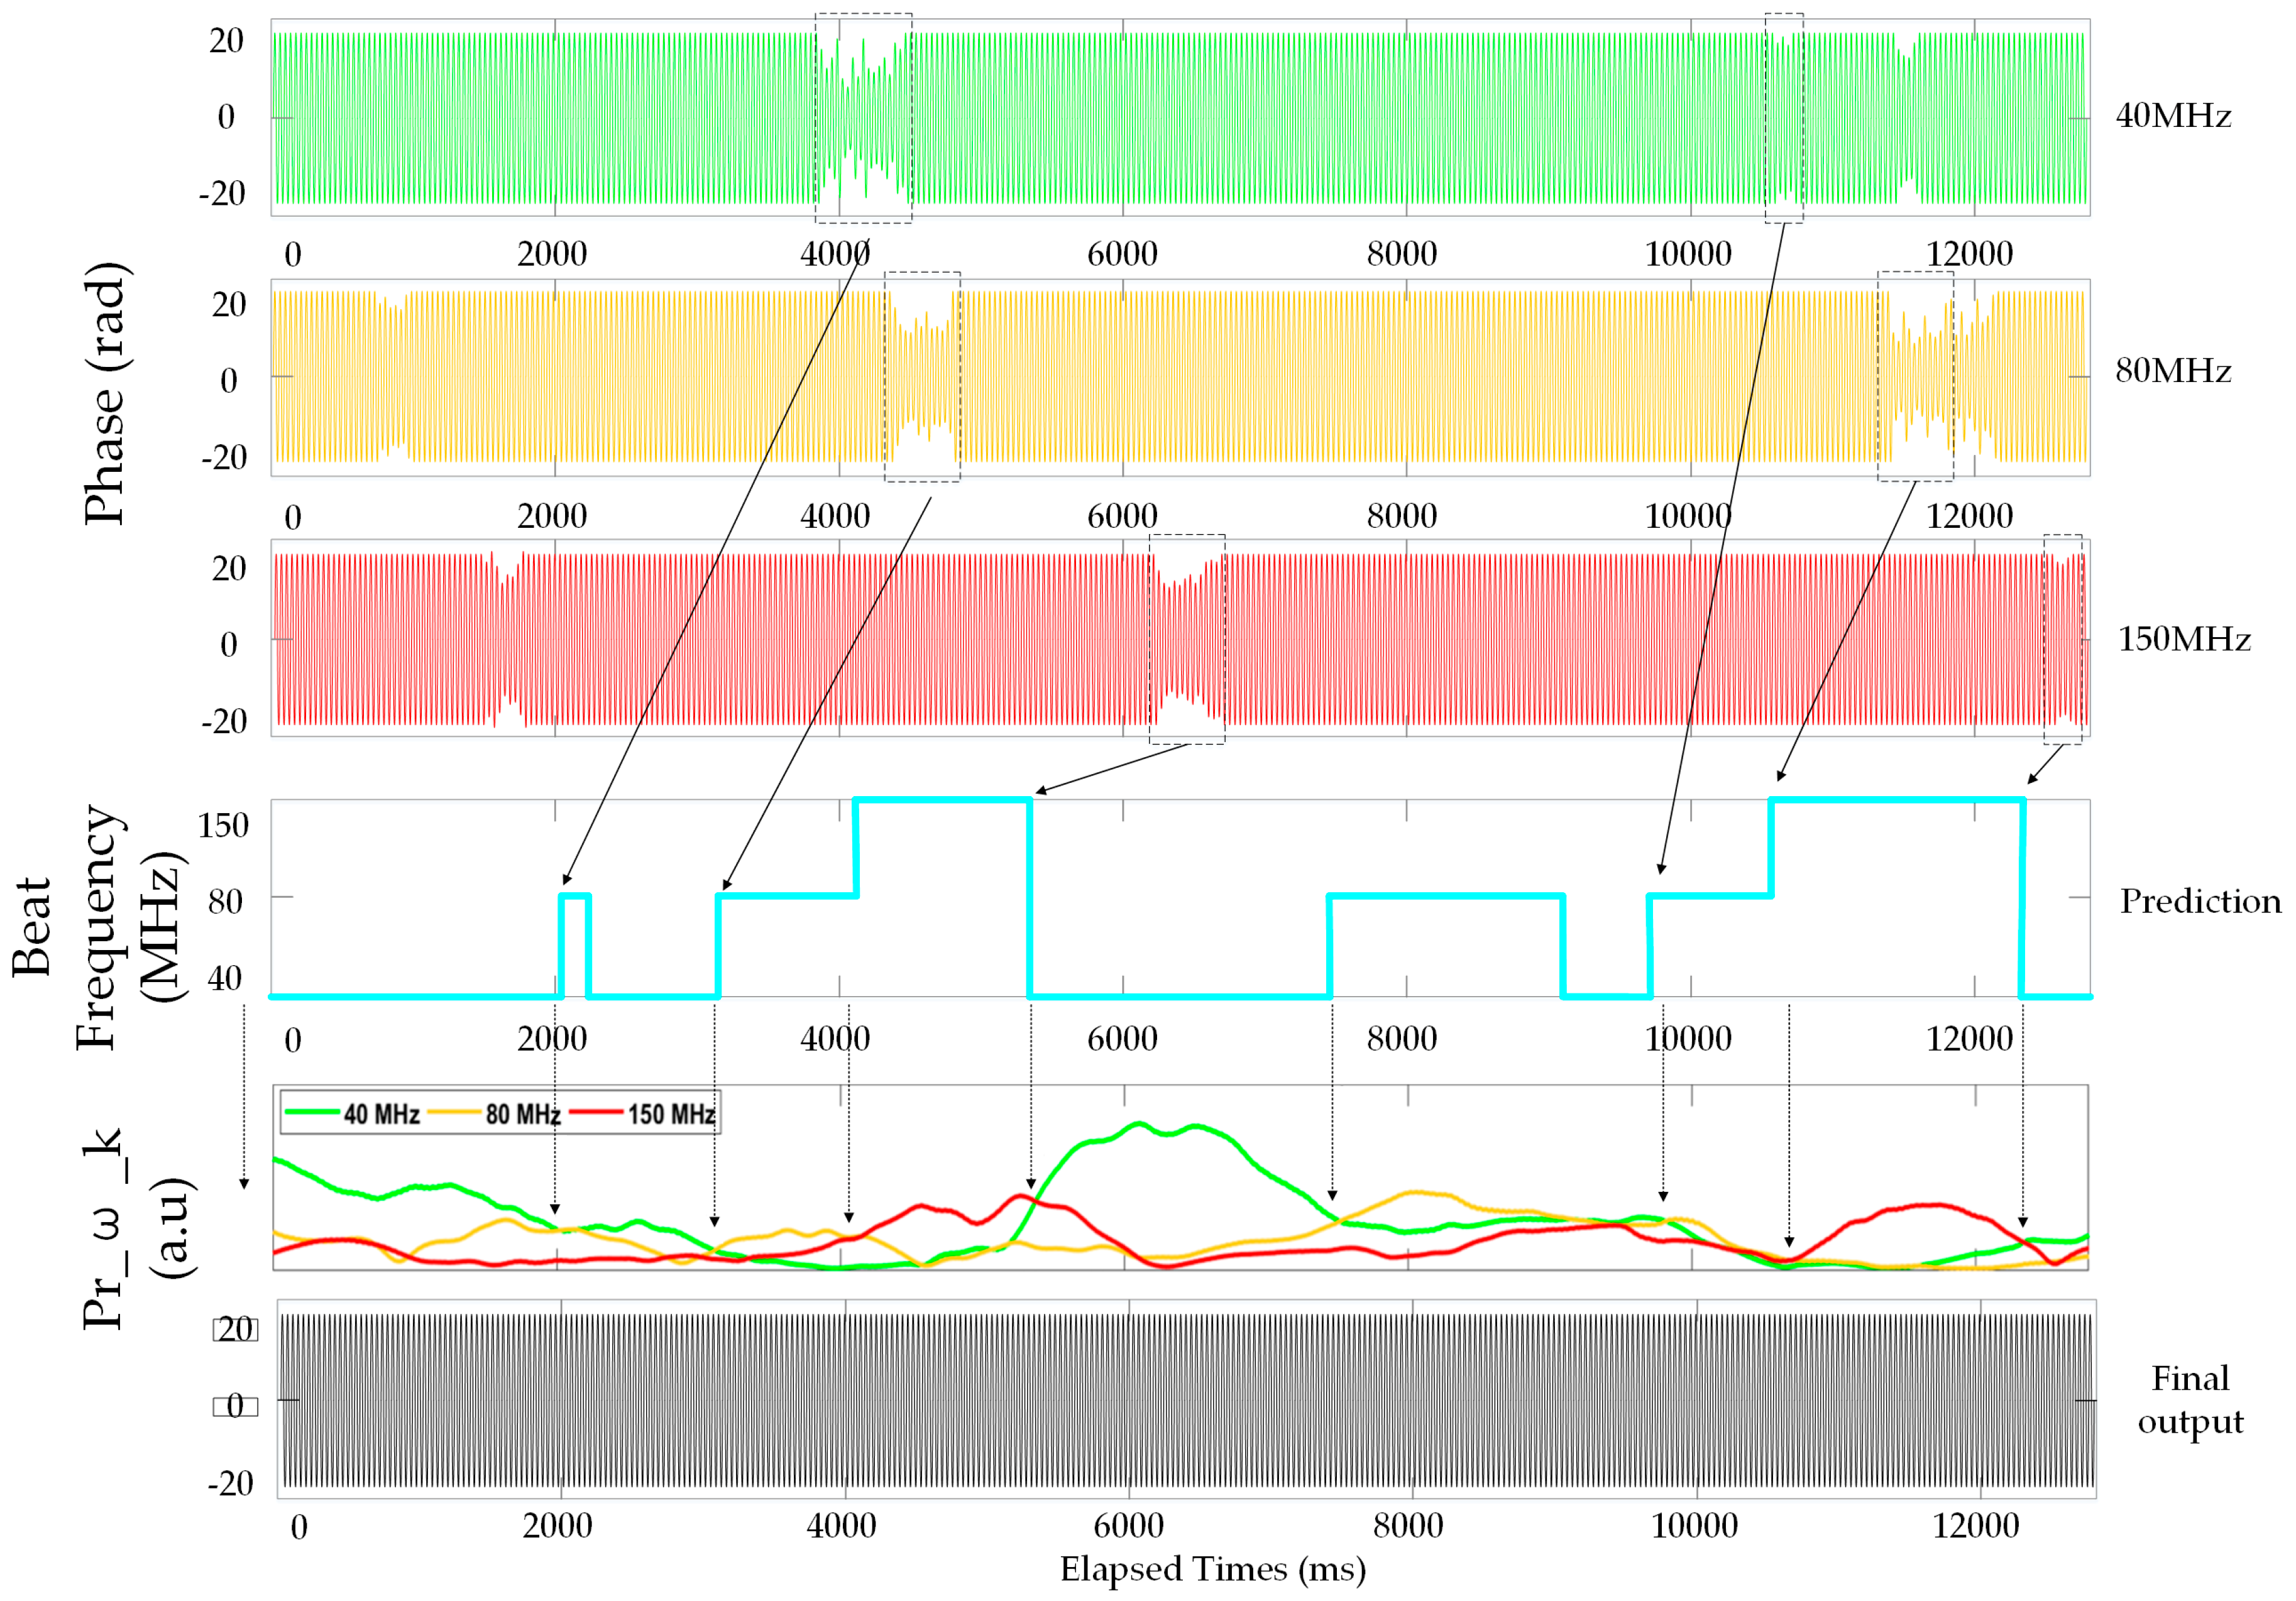
. The probe pulse is shown in
Figure 13. The phase difference will be considered as part of the vibration signal as shown in
Figure 13b–d. Each probe pulse provides an effective sample of the vibration signal, and the waveform shows the vibration at the wrong frequency. The vibration signals demodulated from the reflected light are staggered in time series. As shown in
Figure 13e, it can recover the vibration of the real frequency. After the interleaving algorithm process, the FRR can be extended. The FRR of the conventional system is half of the detection pulse frequency, that is 1/2
T. If
N is the number of probe pulses of different frequencies, the FRR of the FDM system is
N/2
T, which is
N times higher than that of the conventional system [
18].
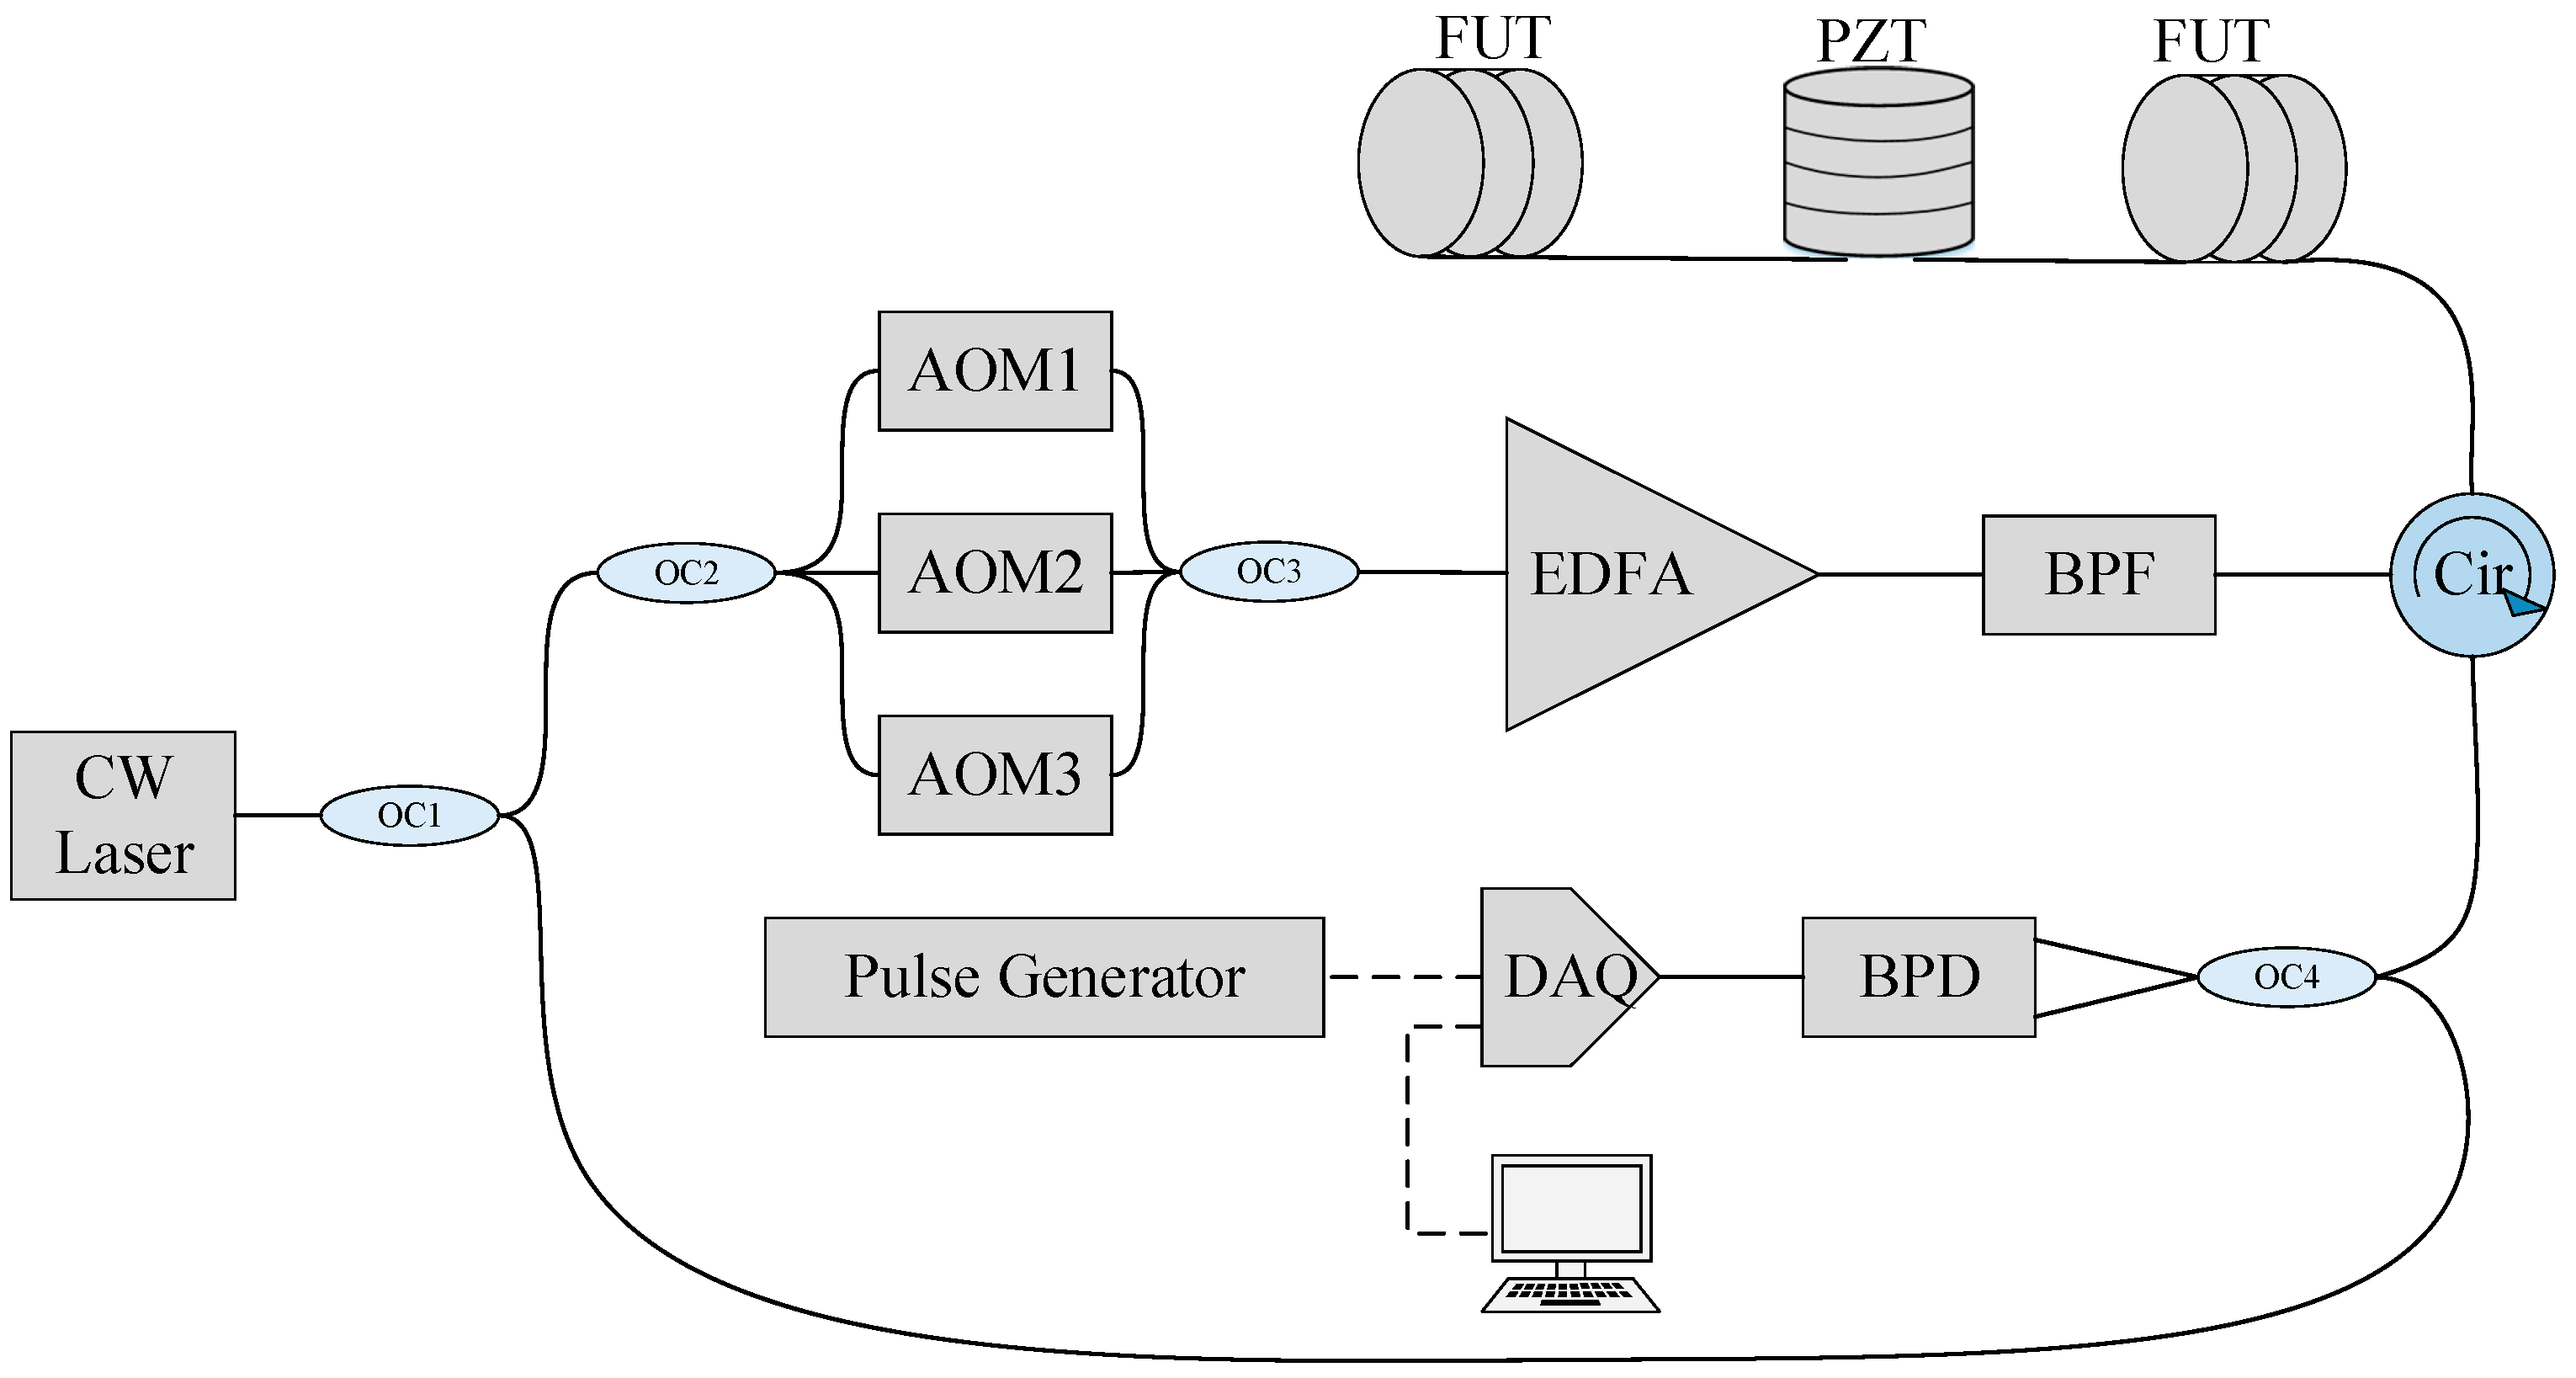
The proposed system setup is shown in
Figure 14. A narrow linewidth fiber laser (RIO Orion laser module, Redfern Integrated Optics Inc., headquarter in Santa Clara California, USA) was used as a coherent source. The CW was separated into an OLO path and a probe generation path using a 90:10 OC1. The polarization of the OLO was controlled by a polarization controller (PC) to reduce the polarization effect. The probe generation path was then split into three paths by a three-port OC2. Three AOMs simultaneously modulated the probe pulses with different frequency shifts. The frequency shift
of the probe pulse
was 150 MHz, the frequency shift
of the probe pulse
was 80 MHz, and the frequency shift
of the probe pulse was 40 MHz, respectively. The repetition period T and the width of the probe pulse w were 3.3 μs and 100 ns.
The time delay between the probe pulses and was 1.1 μs, and the time delay between the probe pulses and was 2.2 μs. AOM2 and AOM3 can be turned off to simulate a traditional Φ-OTDR system. The three modulated pulses were then combined by a three port OC3. A pulsed EDFA and an optical filter were used to amplify the probe pulses and minimize the broadband ASE noise, respectively. The probe pulse passes through the circulator was transmitted to the FUT. A 33-artificial microstructure of an ultra-weak fiber Bragg grating with a reflectivity of 0.01% (−40 dB) was implanted into a 330 m sensing fiber with a spacing of 10 m. The center wavelength of each artificial microstructure is 1550.12 nm and the bandwidth i was 5 nm. A PZT was placed between the last two artificial microstructures to simulate vibration. The reflected light from the FUT passes through Cir and then mixed with the OLO at OC4 (a 50:50). Finally, a BPD with a 350 MHz bandwidth received coherent light. Data were collected from the BPD using a DAQ with a sampling rate of 1.25 GSa/s and then analyzed.
The output signal of the BPD contained three product terms of the electric field of the signal produced by three detection pulses having different frequencies. Digital band-pass filtered with center frequencies of 40, 80 and 150 MHz, respectively, were designed to extract these signals. The pass band of these filters was 20 MHz. For comparison, AOM2 and AOM3 were turned off to make the settings work like a traditional Φ-OTDR system. According to the Nyquist sampling theorem, since the repetition period of a single-frequency pulse is 3.3 μs, the FRR of the system was 0 to 150 kHz.
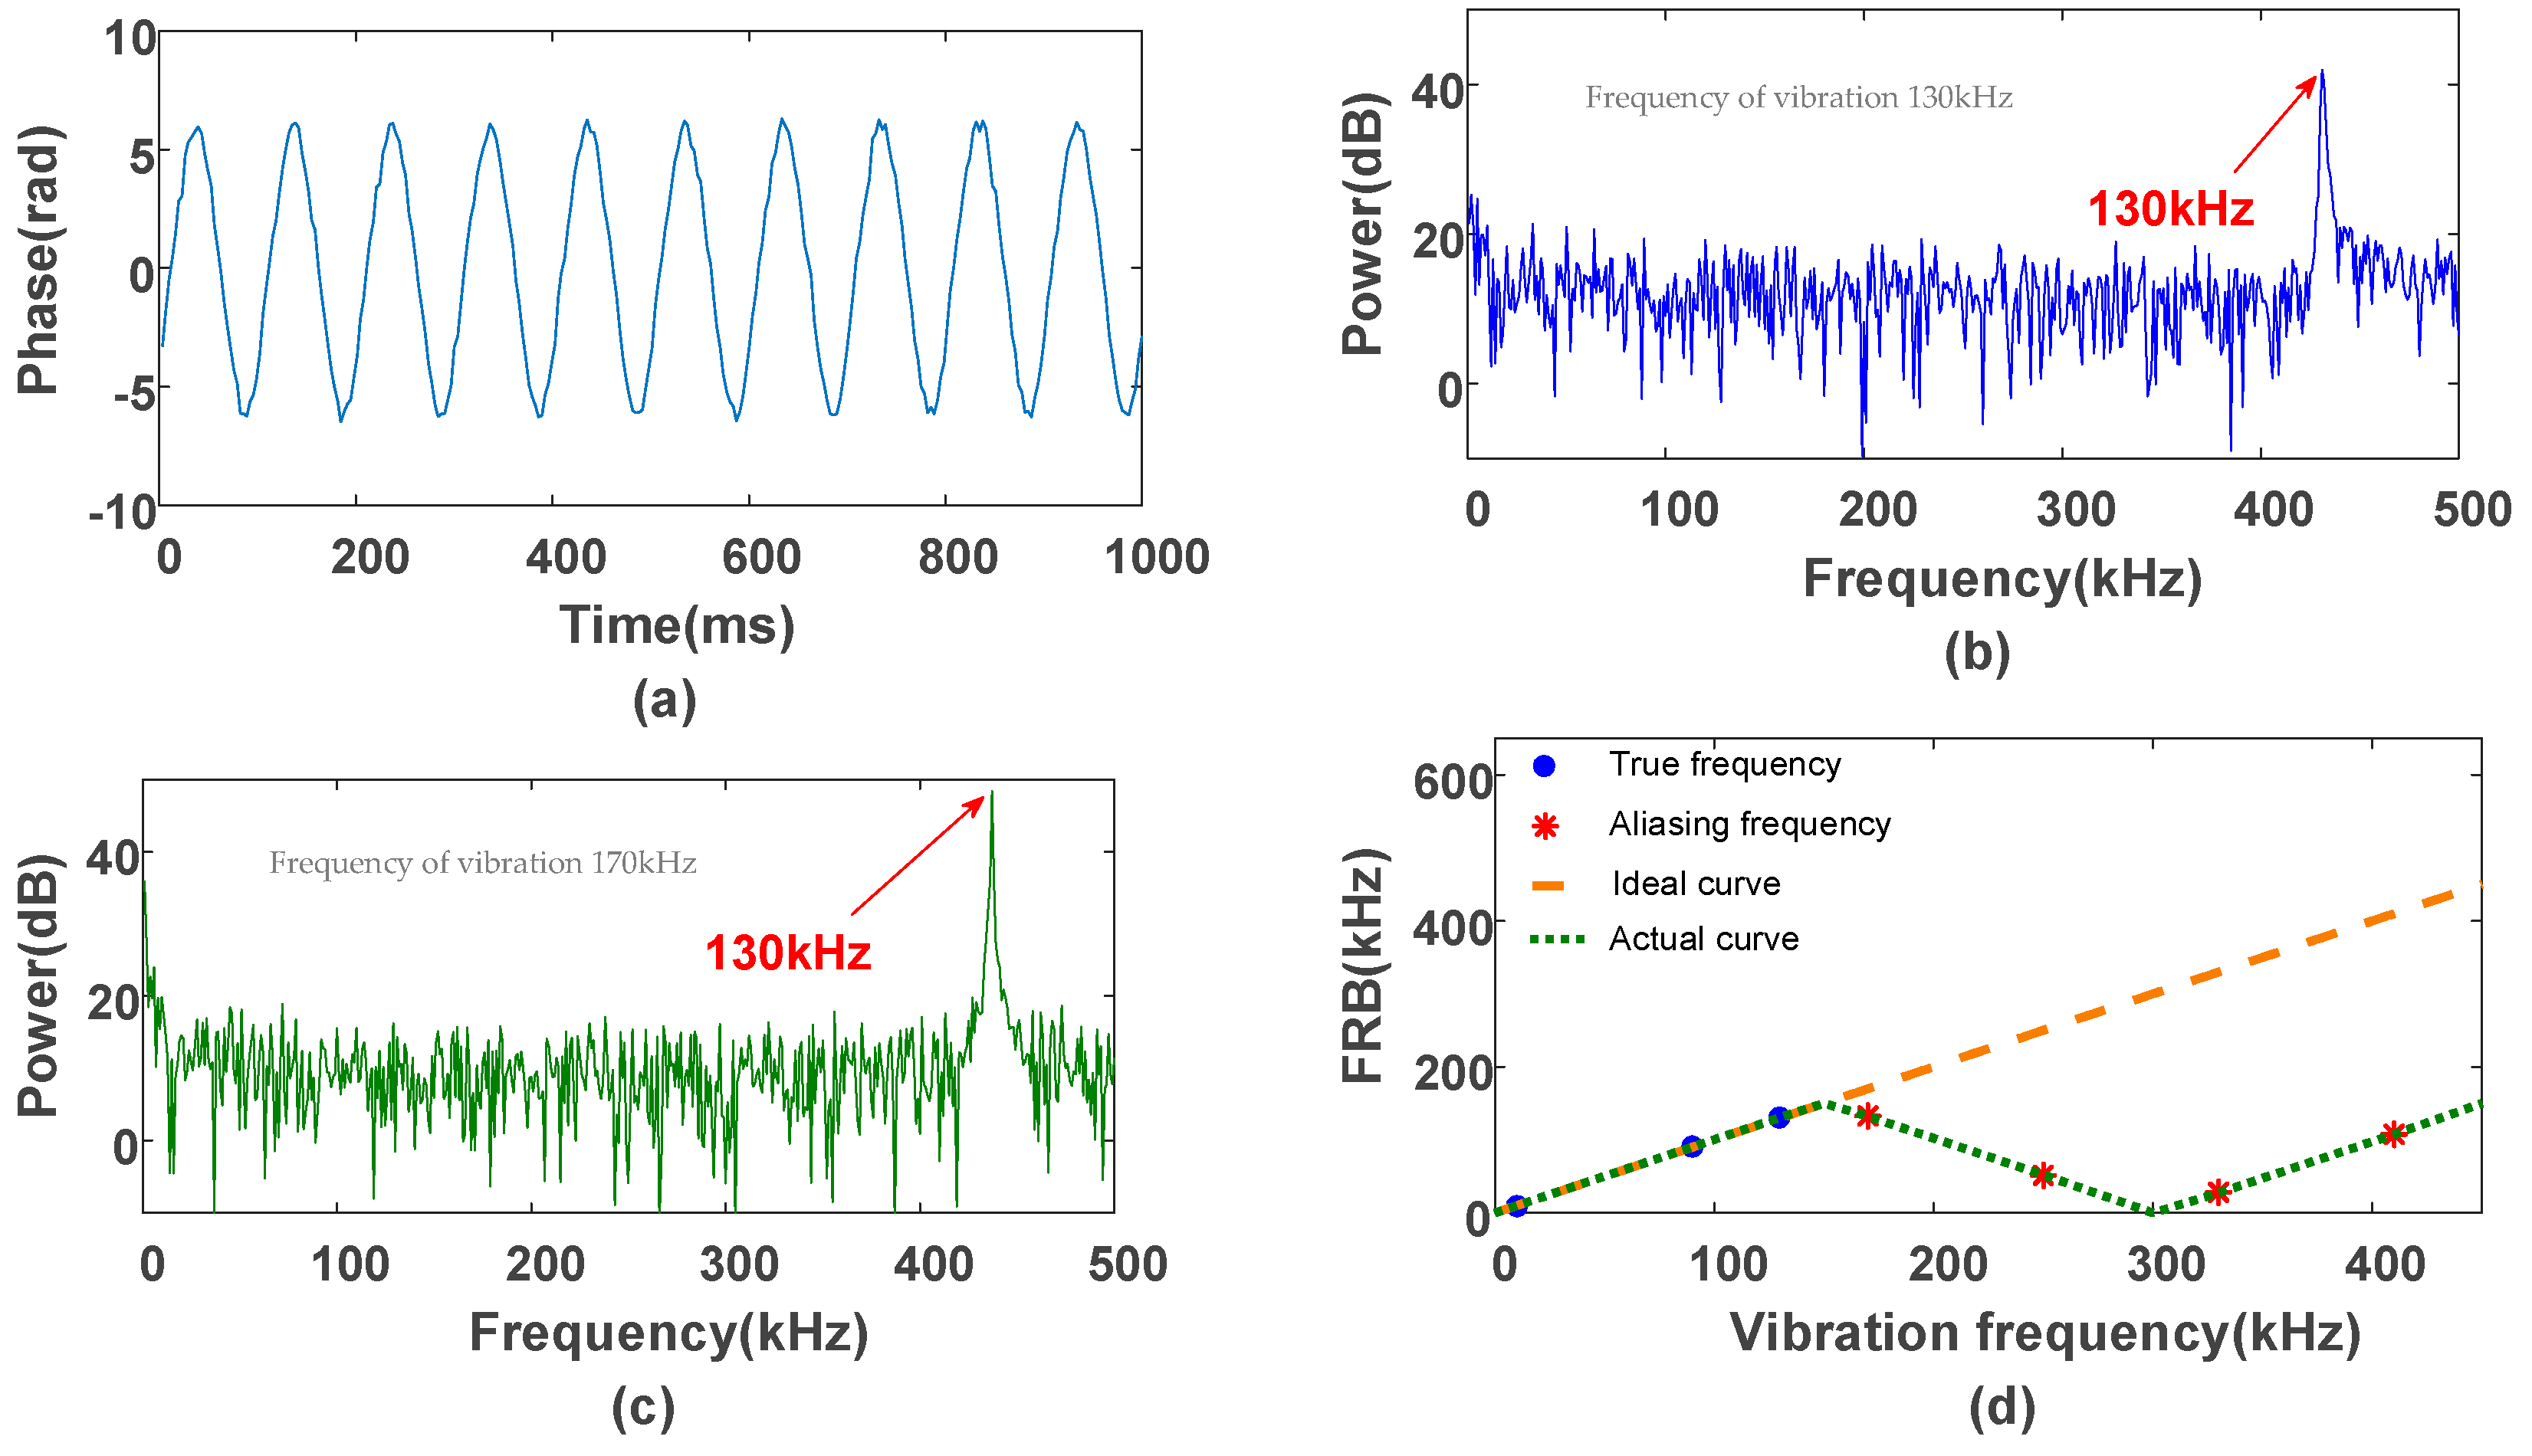
In the experiment, a vibration with a frequency of 130 kHz was applied to the PZT. After the phase difference and phase unwrapping, we can get the demodulated phase signal of the vibration.
Figure 15a indicates the waveform of vibration after phase differential and unwrapping. The waveform was indicated in
Figure 15a. After FFT, we obtained the frequency spectrum of vibration. SNR of the this FDM system was 54.25 dB. To conform FRR of the traditional system, the vibration of 130 kHz and 170 kHz were applied to PZT, respectively. When a vibration with high frequency was applied, the response of PZT became worse, which resulted in deform waveform and lower SNR. The frequency spectrum of the 130 kHz vibration was shown in
Figure 15b. The peak appeared at the frequency spectrum of 130 kHz, which was exactly coincident with the frequency of applied vibration. As presented in
Figure 15c, the harmonics peak of 170 kHz was moved to 130 kHz. Although the actual frequencies of each event were different, the detected results were highly similar and it became difficult to distinguish different events. Subsequently, the vibrations from 10 kHz to 410 kHz with the interval of 80 kHz were applied to PZT. As shown in
Figure 15d, the actual curve was a green dashed line and ideal curve was an orange one.
When the vibration frequency exceeds the FRR, the detection frequency was folded into the FRR, which was consistent with Equation (27). The frequency folding conformed to the periodic law, and the shape of the fitting measurement frequency curve was similar to the periodic triangular wave. Then we opened AOM2 and AOM3 to set up the FDM structure to extend the FRR. Since there were three pulses of different frequencies, the FRR would expand to approximately 450 kHz. The 10 kHz vibration in the conventional system FRR was applied to the PZT.
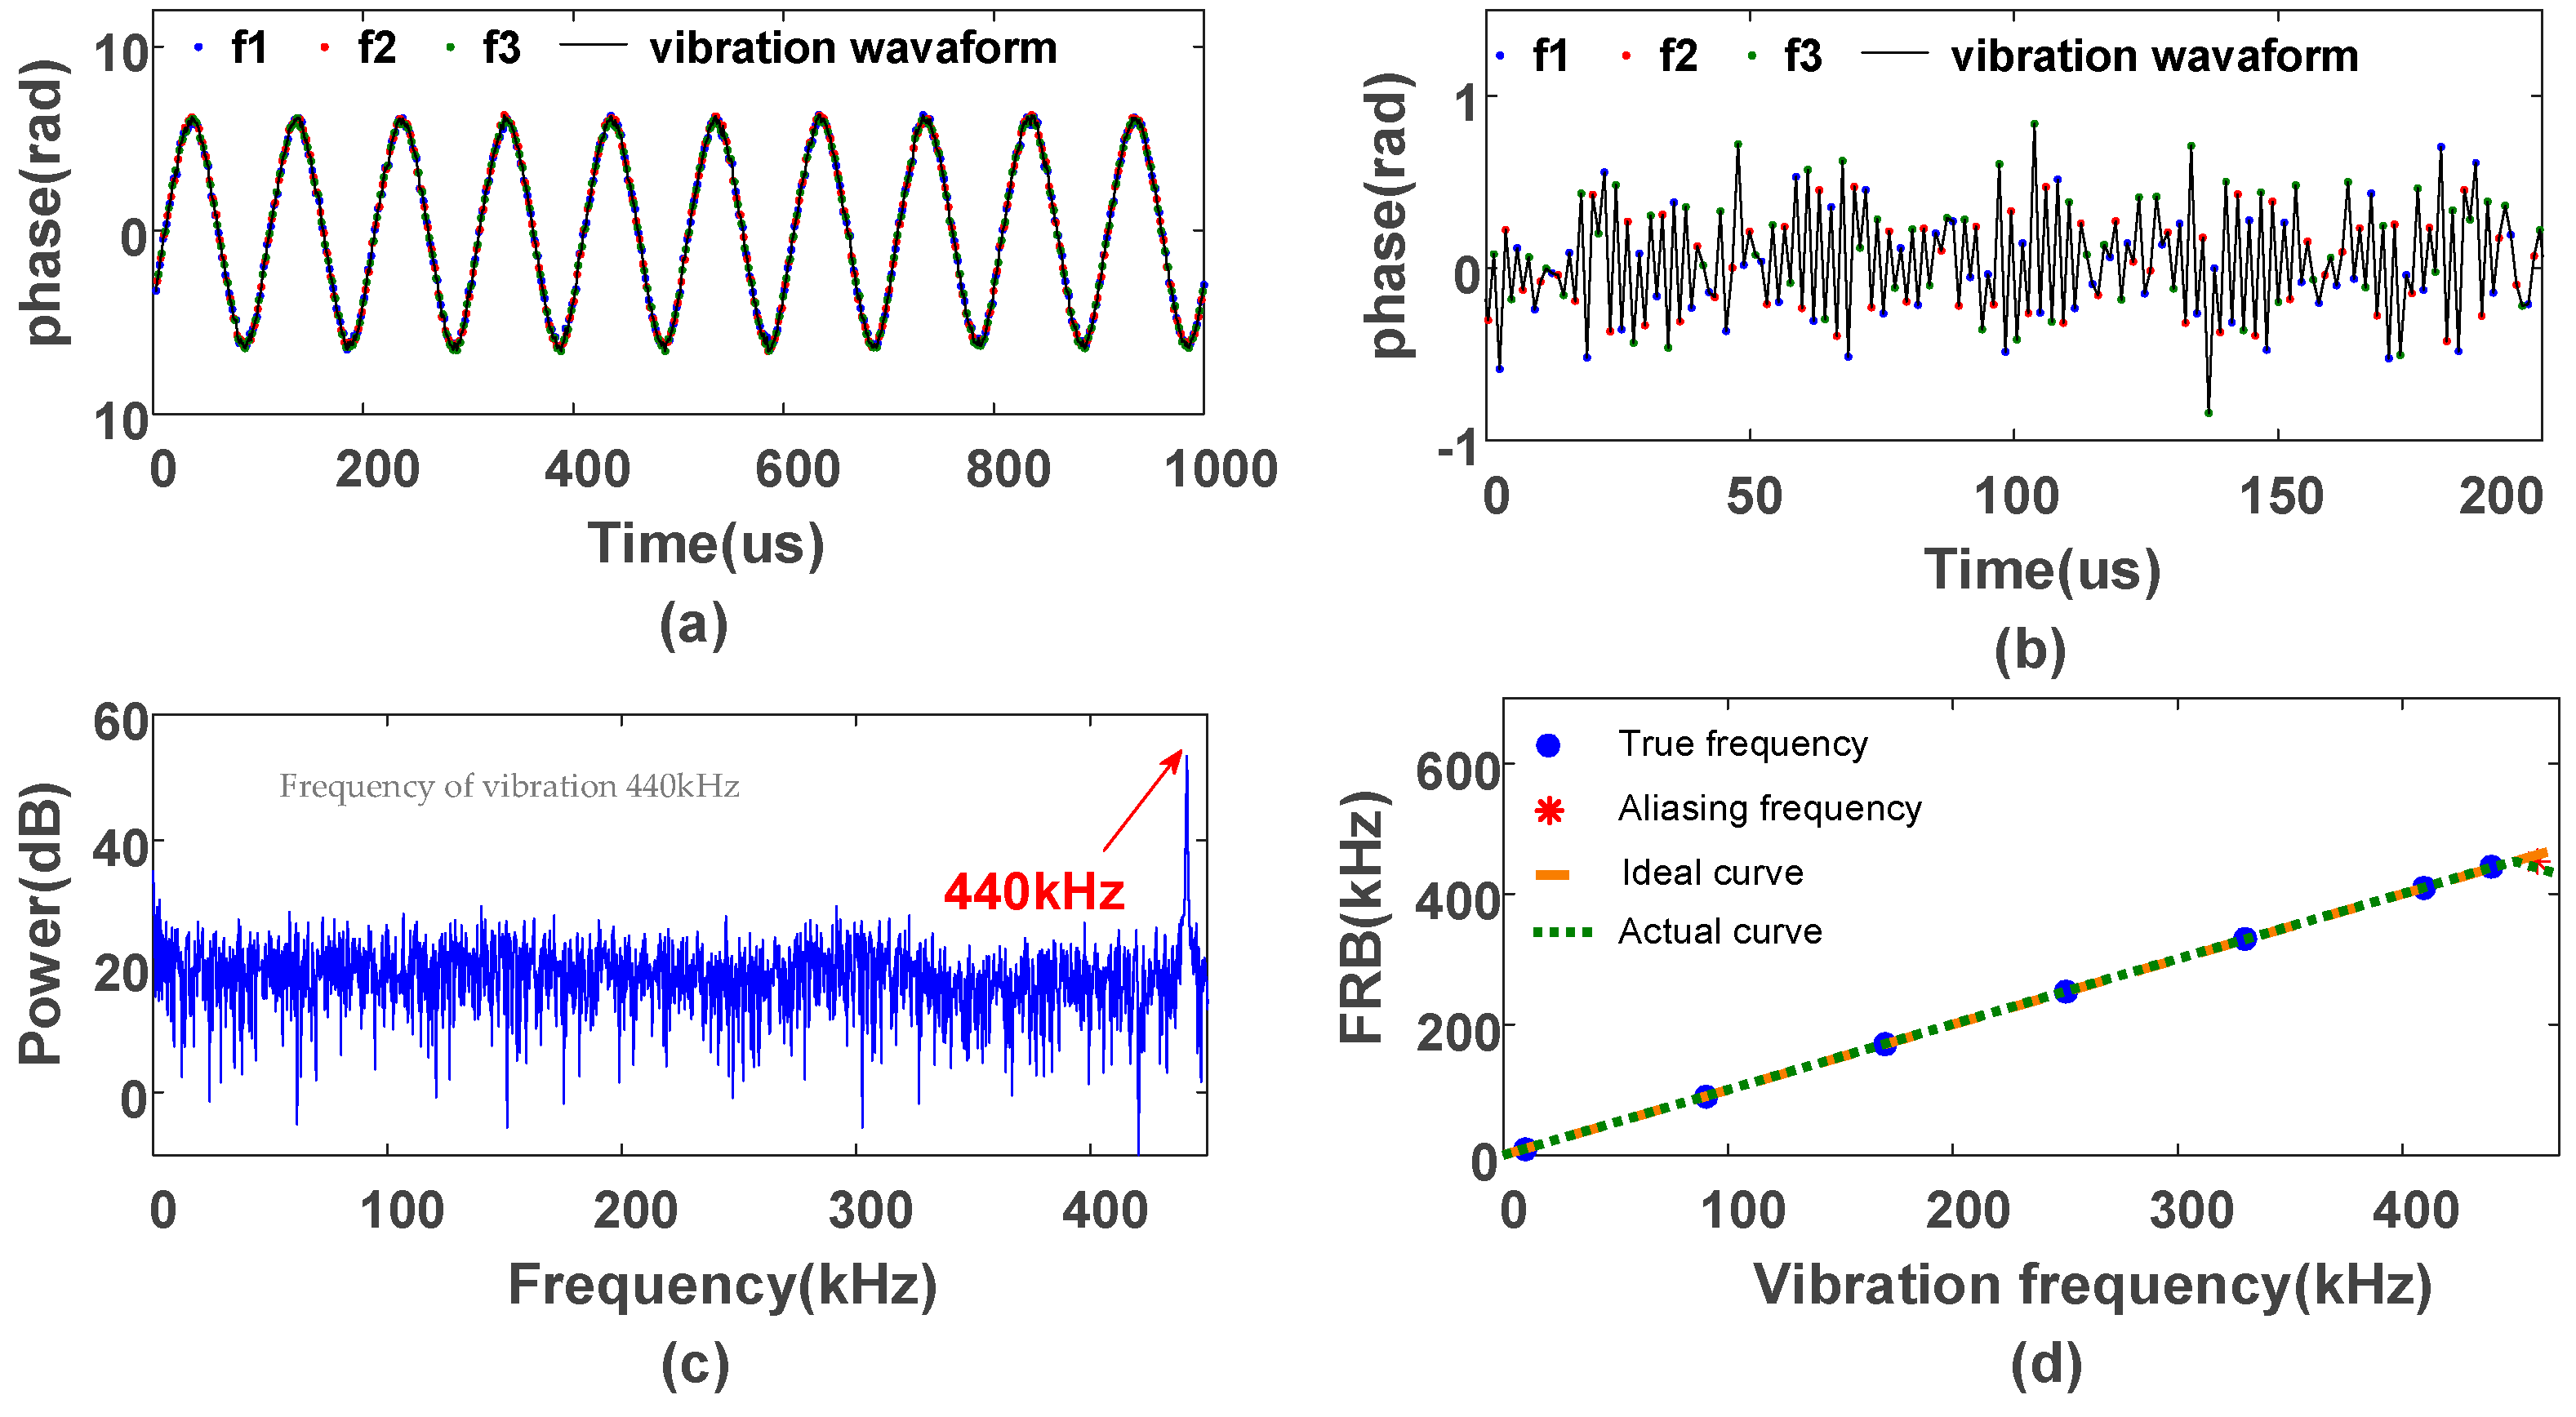
In the experiment, PZT produced a 440 kHz vibration, which exceeded the FRR of the traditional system. The phase waveform demodulated from the intensity traces of three pulses having different frequencies was as shown in
Figure 16a, the phase waveform of reconstruction vibration was described. SNR of the FDM system was 59.9 dB. Compared with the traditional system, SNR of the FDM system was 5.65 dB higher. As the FDM structure could help increase the sampling rate of the FDM system, broadband noise components aliasing below
could be reduced, and the in-band SNR would increase. PZT generated the vibration of 440 kHz, which was beyond FRR of the traditional system.
The final phase waveform after interleaving was presented in
Figure 16b. The frequency spectrum of vibration was illustrated in
Figure 16c; whose peak was exactly 440 kHz. Then, the vibrations from 10 kHz to 410 kHz with the interval of 80 kHz were applied to PZT. Additionally, 440 kHz and 460 kHz vibrations were applied to PZT to get more accurate FRR. As shown in
Figure 16d, it can be observed that the frequency of 440 kHz vibration was detected as 440 kHz and that of 460 kHz vibration was detected as the wrong frequency.
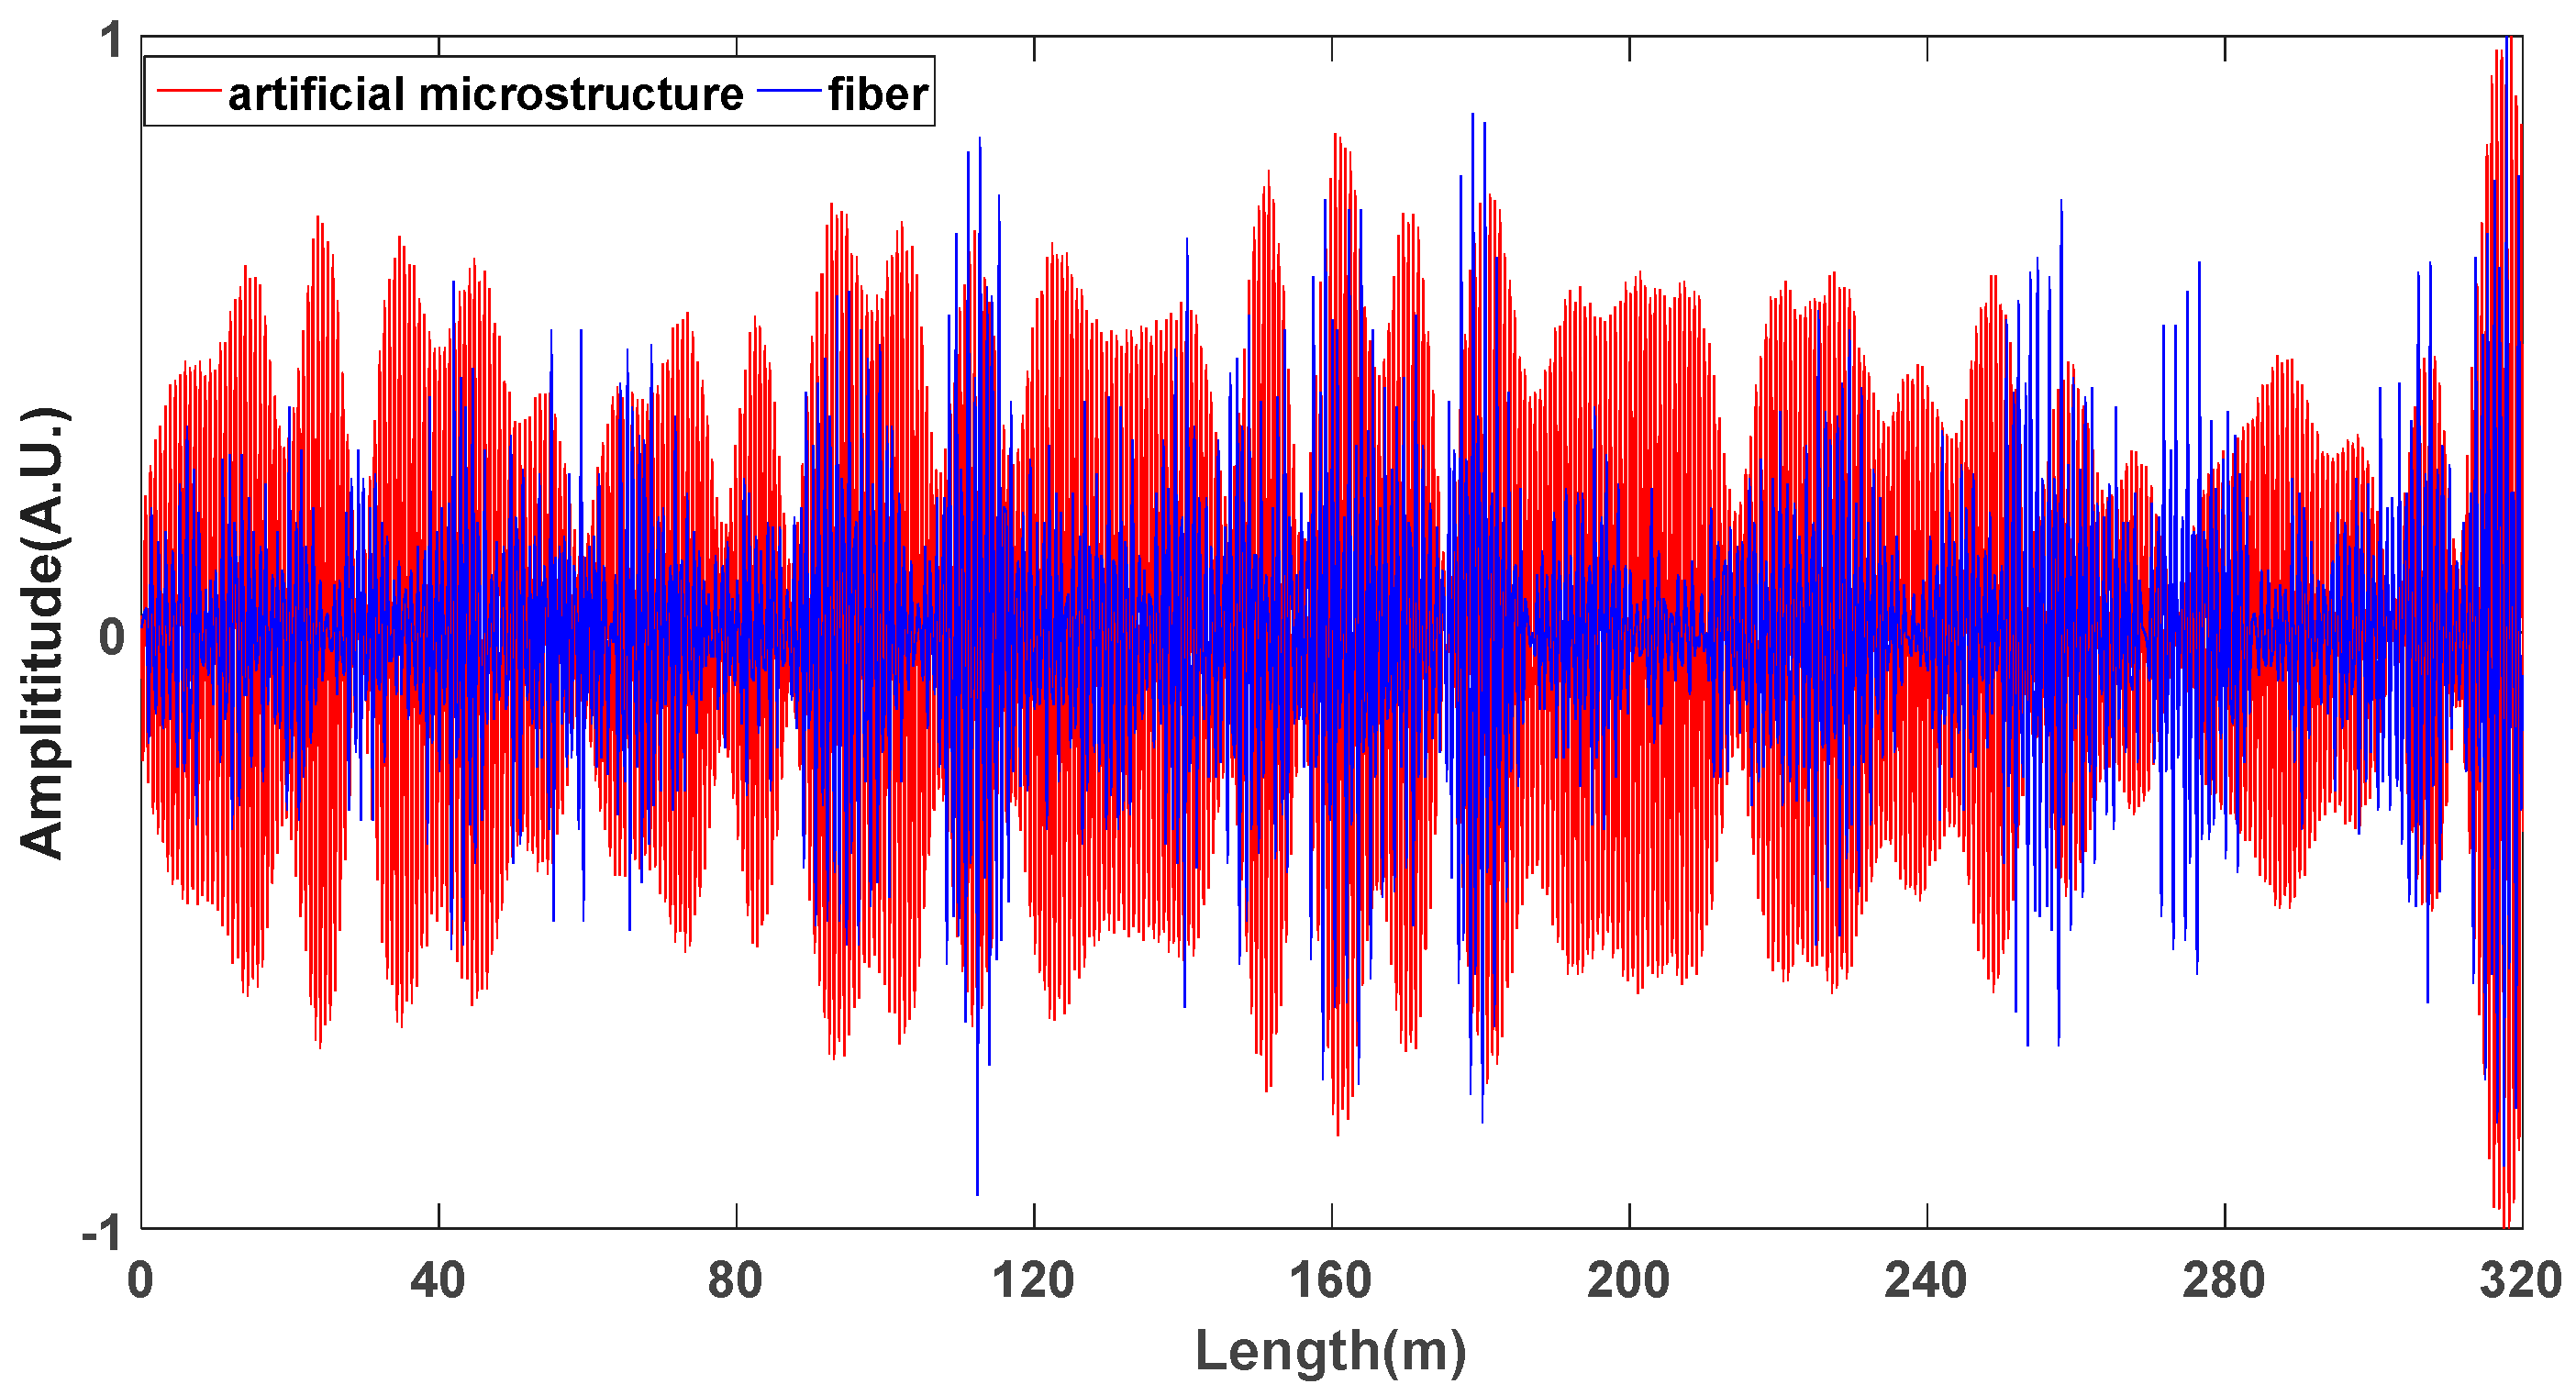
For comparison, the artificial microstructure was replaced with the ordinary single-mode fibers in the experimental setup.
Figure 17 shows a normalized beat signal based on Φ-OTDR for fiber and artificial microstructures. The magnitude of the traditional Φ-OTDR was lower than that of the system with the artificial microstructures. In order to obtain accurate results, the beat signal is statistically analyzed.
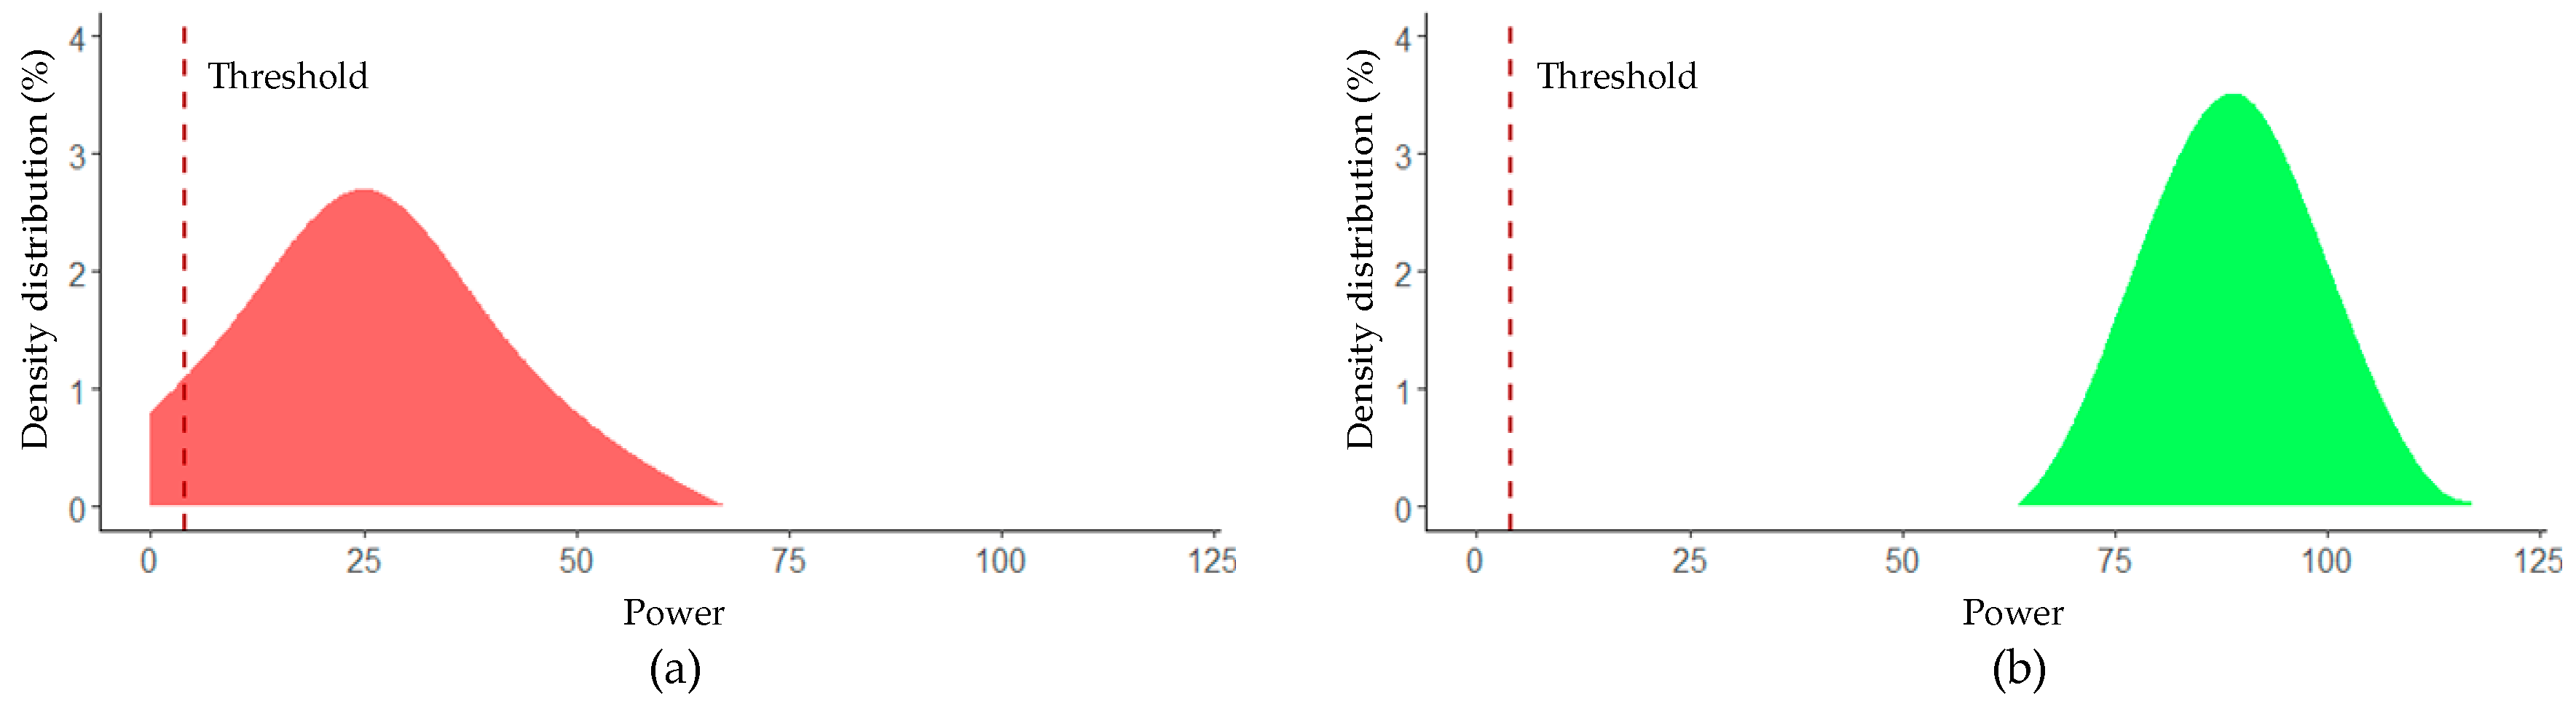
The fitting distribution of the peak amplitude statistics along the 330 m FUT is shown in
Figure 18a,b for 5 min. System peak amplitude statistics based on fiber and artificial microstructures have been normalized using a Gaussian distribution. The average and variance of fiber-based systems are 25.42 and 16.50, respectively, while the average and variance of artificial microstructure-based systems are 88.73 and 10.17, respectively. Fiber-based system peak amplitude statistics are significantly smaller than artificial microstructure-based system peak amplitude statistics, which means that fiber-based systems are more prone to fading locations. According to previous research, the noise floor in the DAS system is caused by the thermal noise of the active device and the quantization noise of the analog-to-digital conversion (ADC) [
29]. Assuming a threshold of 1/32, the system’s SNR is about 10 dB, enough to reconstruct the vibration. Based on the threshold, we calculated the probability of the two sets of data falling into the fading position. After the statistics, the probability of occurrence of fading position in the fiber-based system is 3.92%, and the probability of occurrence of fading position in the system based on artificial microstructure is 10
−10%, which can be considered as zero. This means that systems with artificial microstructures are likely to suffer from faded locations.
We propose an FDM system based on artificial microstructure and coherent detection. With the FDM technology, the detection frequency range can be effectively expanded. Instead of RBS in a conventional Φ-OTDR system, it is observed that the reflected light from the artificial microstructure is stable and controllable, which makes it possible to sense a vibration signal with a high SNR and avoid a fading position. The artificial microstructure-based FDM system provides a reliable broadband distributed vibration sensing enhancement system.
6. Discussion and Conclusions
In this paper, the principle of the DAS system is described in detail, that is, the amplitude and phase changes of the vibration event modulation are obtained by heterodyne coherence measurements, and the detailed information of the vibration event is further analyzed. Because of their high sensitivity, DAS systems are widely used in various monitoring scenarios. However, the random nature of RBS and strong background noise exist in engineering measurements. The frequency response range and the length of the vibration event could not be known in advance as well. These problems result in the performance of traditional DAS systems being restricted by various problems, such as the fading problem, the limitation of uncertain SR on optimal measurement, and the restricted frequency response range in a single measurement pulse. Different kind of multi-pluses frequency division multiplexing Φ-OTDR system has been proposed to solve the above three problems, improving the performance of DAS system with fewer changes in system structure.
In order to solve the problem of fading in continuous monitoring environments, this paper proposes a method based on FDM and optimum tracking. The proposed method can successfully forecast the occurrence of distortion and avoid it by jumping to a better phase signal. We attained a distortion-free output over 98.84%. To solving the limitation of uncertain SR on optimal measurement, we proposed a tri-pulses frequency division multiplexing Φ-OTDR system with multi-spatial resolution analysis, which could restore simultaneous vibration events of different vibration region lengths with optimum SNR in one single measurement. The SNR of the sensing system was improved by 3dB than the average SNR with different SRs. In order to expand the frequency measurement range while suppressing the fading problem in the process, a fading-free broadband Φ-OTDR based on the embedding artificial microstructures and FDM is proposed. Compared with the traditional systems, the detection frequency range, which is 0~440 kHz over 330 m fiber embedded with artificial microstructures, is enhanced by three times in this demonstration system.
It should be mentioned that the current work also has its limitations. In the continuous fading effect suppression method, we only consider the fading problem caused by the phase interference of the light. The polarization also causes fading phenomena, which may lead to deviation of the optimal distortion probability. In addition, further research on the window scale should help to reduce the distortion probability of the experimental results. In the second method for the optimization of SR and SNR performance, the vibration analyzed in the experiment is a sustained single-tone signal, which could not be easily satisfied in most practical situations. The SR is determined by the time delay of the modulator drive signal. It is necessary to use the SR approach for the estimated vibration length by adjusting the time delay, so as to obtain the measurement under the optimal SNR. In the fading-free broadband method, in order to simultaneously solve the problem of extended frequency response range and fading, the complexity of the system is increased. Besides, these three systems work independently. In the future research of DAS system, the above three types of problems will be considered and solved simultaneously.

 ,
, 


