A Review of Electric Impedance Matching Techniques for Piezoelectric Sensors, Actuators and Transducers


Department of Electrical and Computer Engineering, Michigan State University, East Lansing, MI 48824, USA
Electronics 2019, 8(2), 169; https://doi.org/10.3390/electronics8020169
Submission received: 29 December 2018
/
Revised: 29 January 2019
/
Accepted: 29 January 2019
/
Published: 1 February 2019
(This article belongs to the Special Issue RFID, WPT and Energy Harvesting)
Abstract
:Any electric transmission lines involving the transfer of power or electric signal requires the matching of electric parameters with the driver, source, cable, or the receiver electronics. Proceeding with the design of electric impedance matching circuit for piezoelectric sensors, actuators, and transducers require careful consideration of the frequencies of operation, transmitter or receiver impedance, power supply or driver impedance and the impedance of the receiver electronics. This paper reviews the techniques available for matching the electric impedance of piezoelectric sensors, actuators, and transducers with their accessories like amplifiers, cables, power supply, receiver electronics and power storage. The techniques related to the design of power supply, preamplifier, cable, matching circuits for electric impedance matching with sensors, actuators, and transducers have been presented. The paper begins with the common tools, models, and material properties used for the design of electric impedance matching. Common analytical and numerical methods used to develop electric impedance matching networks have been reviewed. The role and importance of electrical impedance matching on the overall performance of the transducer system have been emphasized throughout. The paper reviews the common methods and new methods reported for electrical impedance matching for specific applications. The paper concludes with special applications and future perspectives considering the recent advancements in materials and electronics.
1. Introduction
Devices made of piezoelectric materials perform actuation and sensing tasks covering a wide range of applications. They fall in the category of smart materials and form a basic building material for sensors, actuators, transducers, and smart structures. Some applications require just the proper design of sensor or actuator, for instance buzzers [1], tactile sensors [2,3], vibration sensors [4], and distance measurement [5]. The reason being the less importance of energy efficiency and other less stringent requirements of signal waveform, space and criticality of application. The devices for applications like biomedical imaging [6,7,8], acoustic emission [9,10], condition monitoring [11,12], nondestructive evaluation (NDE) [13,14,15,16,17], and structural health monitoring (SHM) [18,19,20,21,22] are to be designed considering the performance as a whole system due to the criticality of the tasks they perform like damage or defect detection. The system here includes the sensors or actuators, driving electronics and the target object. The target object can be the structure on which the piezoelectric device is mounted or the test structure. The driving system may involve the electronics related to actuation, sensing, or actuation with sensing (pulse-echo ultrasound). The importance of designing as a whole system also comes into play when energy efficiency is important, considering the frequent use of the systems like energy harvesting [23,24,25]. The system involves, not just the sensor or actuator and the structure (mechanical parts), but also the driving and receiver electronics (electrical components). While impedance matching, in general, involves matching of both acoustic and electrical parts [26], we limit our scope in this paper to the electric aspects.
Piezoelectric sensors, actuators, and transducers perform the best electronically when designed, considering the application type and driving/receiving systems along with the piezoelectric device. Ideal piezoelectric material properties for biomedical application are a high piezo-electric voltage constant like (polarized in direction 3), a high piezoelectric strain constant like (thickness mode), or (in plane mode), an electromechanical coupling coefficient , an acoustic impedance close to 1.5 MRayls, and low electrical and mechanical losses. Such ideal materials are seldom available. Inherently, piezoelectric transducers are narrow-banded, due to which they exhibit large response at resonant frequencies. Many applications like NDE, SHM, biomedical imaging, energy harvesting, etc., require a broadband operation. Acoustic impedance matching (AIM) improves the narrowband operation, but increases the electrical impedance. Such high electric impedance results in a mismatch of impedance between the transducer and interface device like driver or data acquisition device. The mismatch causes the loss in signal amplitude and waveform reducing the signal to noise ratio (SNR) and waveform-based damage features. The mismatch is usually high (around 50 Ω) [27], which causes the reduction of electric energy, and can be minimized by an electric impedance matching (EIM) network. Impedance matching at a resonant frequency involves simple network such as LC or shunt inductor or capacitor [28,29,30,31,32]. Such passive impedance matching circuit is more important where power consumption is more important. In LC based impedance matching circuit, the components are uniquely determined, which is unsuitable for a broadband EMI network that needs multiple or variable value of the components.
This paper outlines the tools, models and electrical properties commonly used for electric matching in Section 2. Section 3 describes the methods available to design EIM networks (EIMN). Section 4 briefly reviews the applications that have been realized by commonly available EIMNs reported in Section 3, as well as newly reported EIMNs for special applications. The paper concludes by discussing the advantages of EIMNs and future perspectives in Section 5.
2. Tools, Models and Data Aiding Electrical Impedance Matching
The interdependence of mechanical and electrical impedance matching needs optimization to determine the final design parameters. While Bode’s theory [33] and a solution developed by Youla [34] are available, their complexity and requirement of analytical form of load characteristics limit the use. The computer-aided design method and its recursive stochastic equalization method finds the optimal value, but deciding the type of topology for optimization is difficult from complex problems [35,36]. A single specific tool is unavailable to design EIMN since design process varies depending on the application and power requirements. The EIMN design is also an area that has received less attention due to the above-said difficulties [27]. The broadband requirements of many applications require multiple/variable values of the components in the EIMN, which depends on the characteristics of the piezoelectric device. Whereas, the dimension of the device can only be designed after the EIMN is finished. Simulation models for piezoelectric devices and optimal EIMN models aid in such design process [37]. In the case of ultrasound transducers, the bandwidth of IM transducer can only be determined after the EIMN is finished. Depending on the availability of EIMN components with required specifications, the EIMN has to be redesigned. Considering these aspects, the optimal EIMN is iteratively designed first using the simulation models. Computer simulation models, other tools and material properties that assist in the design of the EIMNs is presented in this section.
2.1. Computerized Smith Chart
Smith charts synthesize the broadband EIMNs from which the gain and bandwidth can be simulated for a matched transducer. The Smith chart is combined with equivalent circuit models to establish an equivalent circuit for a matched transducer. Smith chart is available in the form of commercial software from Fritz Dellsperger [38] and many others. As of now, the program from Iowa Hills Software is a free program Smith Chart Version 3.0 [39]. An online interactive version of the Smith chart is also made available by Telestrian [40].
Maximum power delivers from the source to the load if the load impedance is a complex conjugate of the source impedance. To satisfy this criterion, a two-port network, shown in Figure 1, with conjugate matched input impedance at port one to the source impedance. The impedance of output port two is conjugate to the impedance of the load. The acquisition or sensing circuit acting as a load, having an impedance of 50 Ω, which is located at the center of the Smith chart. The source is the ultrasonic transducer operating as a receiver. A Smith chart synthesizes such a network by moving the source impedance to the center point (50 Ω) by adding capacitors and inductors in parallel or in a series [41], as shown in Figure 2. Addition of a parallel inductor moves the impedance point along the constant resistance curves. A series capacitor moves the impedance point along the constant conductance curves. The inductor and capacitor values being frequency dependent mandates the addition of more components to increase the bandwidth. However, the addition of components results in the reduction of the quality factor Q due to the short paths connecting the transducer impedance and the center impedance of the Smith chart. Different network topologies can meet this criterion, but can have different bandwidths. Thus, final selection of appropriate EIMN require computer simulations [42]. For the transducer acting as an actuator, the impedance of the pulser electronics serves as a source impedance and the impedance of the transducer serves as a load impedance. The EIMN has to be designed for both pulser and receiver circuits to maximize the overall performance due to actuation and sensing.
2.2. Computerized Simulation
Piezoelectric ultrasound transducer being an electro-mechanical component is modeled as an equivalent circuit for the purpose of the EIMN design. The Mason [43], Redwood [44], KLM [45,46], network [32,47], and Butterworth-Van Dyke (BVD) [48] models are popularly used as equivalent circuits for a piezoelectric ultrasound transducer. The model is selected according to the application and system type like pulsed or continuous. The KLM model requires the transducers physical parameters like size, thickness, bonding, or coupling material and thickness. Equations describing insertion loss and pulse echo can be obtained with the KLM model. It serves as an intuitive approach to optimize the transducer performance. The electrical port is used for electrical matching. Software PiezoCAD [49] is based on this model and has been extensively used in transducer design. Whereas the network and the BVD require just the impedance and admittance without requiring the physical parameters. It uses lumped components that are straightforward to implement. These equivalent circuit models are combined with a particular EIMN to simulate a matched ultrasound transducer. Open source software with alternate current (AC) simulation capability like Quite Universal Circuit Simulator (QUCS) [50] or OrCAD PSpice A/D (EMA, Design Automation) [51] calculates the frequency response of the matched transducer. The software PSPICE has been used by some studies related to high frequency and broadband ultrasonic transducers for both actuation and reception capabilities [27,29]. The ratio of the matched and the unmatched transducer gives the gain and bandwidth of the EIMN. The deviations in the component values of the EIMN and the impedance of the load and source can also be investigated. An et al. [52] have proposed a genetic algorithm based design method for EIMN involving complex network to design and optimize their topology.
2.3. Equivalent Circuit Models for Piezoelectric Transducer
Ultrasonic transducers are large family of piezoelectric devices, which are fabricated with different materials and geometries. Transducers made of PZT like cymbal [53], conical [54] and PMUT [55] suit high frequency applications. Transducers made of polymers (PVDF, P(VDF-TrFE)) like hemi-cylindrical [56] suit the low frequency applications. The mechanical resonant frequency of most of these transducers occur when the thickness of the piezoelectric elements equals half of the wavelength of the wave. With the introduction of pulsed systems, the limits of electromechanical conversion efficiency have been explored for broadband applications and higher frequency applications like medical diagnostics. The broadband applications involve many mechanical resonant frequencies. Early models of piezoelectric transducers for pulsed systems ignored the losses arising from mechanical, dielectric, and piezoelectric properties, which are frequency dependent. To design an EIMN at these resonant frequencies, the impedance of the transducer at these frequencies needs to be estimated. The first step is to approximate the transducer by an equivalent circuit model. The BVD equivalent circuit model approximations being popular is described here in detail for single and multiple resonant frequency transducers.
2.3.1. Single Frequency BVD Model
A single-frequency BVD model forms an equivalent circuit of a single resonant frequency transducer as shown in Figure 3. It consists of a resistor (mechanical and radiation loss) and a clamping capacitor (equivalent capacitance due to piezoelectric elements and cables, connections, etc.) as lumped components. The other components capacitor and inductor model the resonant performance of the transducer. Such a circuit has power supplied to mimicking the acoustic power emitted when mechanical losses are negligible. The impedance is represented by series and parallel resonant frequencies and , respectively, as
where is the angular frequency, and .
2.3.2. Multi-Frequency BVD Model
An equivalent circuit of a multi-frequency resonant transducer is represented by the connecting multiple single resonant frequency equivalent circuits in parallel [27], as shown in Figure 4. The admittance of an extended BVD model formed by parallel connection is the sum of admittances of single frequency BVD circuits given by
where the admittance of signal BVD circuit is given by
2.4. Modeling Cable Effect on Transducer Performance
High-frequency transducers typically operating in frequency >10 MHz have been widely used in high-resolution imaging and microscopy [57,58,59,60]. Attenuation significantly increases at high frequencies reducing the signal intensity [61,62]. In most applications related to ultrasonic imaging [63,64,65], flaw detection in NDE [14,66,67], quasi-static sensing [4], vibration and acoustic emission sensing [68,69,70], ultrasonic sensing [71,72,73], damage detection in SHM [18,19,20,74], and distance measurement [5] the frequency range considered is 0.01–10 MHz. The signals are not greatly affected by the cables. Thus, researchers have rarely reported the effect of cables on the performance. In applications involving high frequencies or longer cables like ultrasonic microscopy, interventional ultrasound and structural health monitoring of large structures [18,61,64] significant losses in the amplitude and spectrum can be seen [75]. Due to cable losses, wireless sensor networks have gained more importance [76,77]. The electric impedance mismatch worsens as piezoelectric element size reduces [78,79,80]. Long cables are often required for ultrasonic transducers in practical applications like biological medicine, marine, nuclear power, and aerospace [81,82,83]. Cable can effect in two ways, (1) electrical impedance mismatch causing high-energy reflection ratio between the transducer, and (2) the cable great attenuation of the higher part of the frequencies spectrum. Intravascular ultrasound imaging and endoscopic ultrasonography have thinner cables where the influence can be higher. Pre-amplifiers have been employed to tune output impedance of the transducer to the characteristic impedance of the cable where the energy reflection at the interface is greatly minimized [84,85,86]. Daft et al. [87] used a transformer to match the electric impedance of driving electronics to the cable. These techniques use high-end CMOS technology due to the requirement of space and flexibility. The efficient design depends on the accurate prediction of pulse-echo response of the transducer considering the following losses.
2.4.1. Cable Attenuation, Delay and Reflections
The cable attenuation increases with the cable length and frequency. The cable length increases the resistance. In addition, the higher frequency causes attenuation due to the skin effect and surface roughness. Long cable can introduce significant delay causing the error in the measurement of thickness and distance. Calibration can be done by introducing the correction in time by where is the length of the cable and is the velocity of the light in the cable.
Cable reflection is the reflection of electrical energy back to the pulser resulting from the electric mismatch between the cable and the transducer. This rescues the intensity and creates smaller ring down excitation pulses in the actuation waveform. The reflection is proportional to the reflection coefficient at the load [88,89] given by
where is the load impedance and is the characteristic cable impedance. The cable parameters , , and are the distributed resistance, inductance, conductance and capacitance per unit length respectively. Jian et al. [90] presented a model to estimate the acoustic output considering the cable parameters using the network theory of KLM [91].
2.4.2. Evaluation of Cable Impedance
Jian et al. [90] have reported a theoretical model based on transmission line theory to predict the electric coupling between the transducer and the cable. Network theory of KLM [91] was used to derive the transfer function between electric insulation and acoustic pressure given by
where is the acoustic output and is the electric input. , , and are the matrices corresponding to the electric, backing and matching parts [92]. The electric part is further expressed as
where represents the reactance, represents the frequency dependent transformer and corresponds to the matrix of the cable as per the transmission line theory is given by
where is the complex propagation constant of the cable.
2.4.3. Input Impedance of Coaxial Cable Connected to A Transducer
To simulate the influence of the cable on the performance of the pulse-echo system, the input impedance of the cable connected to the transducer [93,94] is first estimated as
Jian et al. [90] studied the simulated impedance and phase of a 50 MHz transducer with and without the coaxial cable. The properties of a 2.2 m 42AWG cable have been considered = 5 × 10⁻⁷ H/m, = 2.2 m, = 50 Ω and = 3 × 10⁻¹¹ F/m. The addition of cable greatly changed both the resonance impedances and phases with narrower bandwidth and the resonances shifting to higher frequencies. Thus, the cable parameters should be taken into account, while designing the electric and acoustic matching circuits for high-frequency transducers.
2.4.4. T-type and П-Type Matching Networks for Cables
Chen et al. [95] presented T and П type LC networks shown in Figure 5, for electric impedance matching of transducers with long cables. The method involves the determination of equivalent resistance of PZT wafer transducer at resonance by using a parallel inductor or a symmetrical LC 2-port network involving an inductor in series and a capacitor in parallel. Using uniform transmission line theory the characteristic impedance of a matching line is given by
where is the cable characteristic impedance. The components of T and П type LC matching networks were derived and are given by
where is the operating frequency of the transducer. The circuits can increase the power and transfer efficiency by 52.9% and 33.6% in a 200 m long cable [95].
2.5. Acoustic and Electric Material Properties
Electrical and mechanical properties of piezoelectric materials used commonly are tabulated in Table 1. The most important dielectric, piezoelectric and material properties are given below [6].
where and are the thickness and surface electrode area of piezoelectric element, is the elastic constant, is the piezoelectric coefficient, is the clamped capacitance of ultrasonic transducer, is the clamped dielectric permittivity, is the thickness mode electromechanical coupling coefficient, and is the speed of sound in piezoelectric material. Since the piezoelectric material is also a capacitor with two electrodes, the clamped permittivity, area and thickness are properly designed for maximum power transmission. The input electric impedance of the transducer is made real with appropriate electric impedance matching and the resistance is matched to the electrical impedance of the source.
3. Methods of Electrical Impedance Matching
Matching the output impedance of a transmitter driving electronics to a high impedance transducer maximizes the power transfer resulting in a better SNR, spatial resolutions and contrast to noise ratio (CNR). The electric impedance can be matched by many ways including electric networks, material property of transducer, cable length and transducer design. In specific cases, diameter of the piezoelectric element [99], lateral dimension [100,101], or cable length [102] is chosen to match the electric impedance of the transducer. Multilayer transducers are known to increase the SNR and transmitted energy [103]. While developing focused array transducers, Nakazawa et al. [104] increased the capacitance with multilayer lamination of PU thin films to match the electrical impedance. Smith [105] has emphasized the importance of electric impedance matching of PVDF, P(VDF-TrFE) based ceramic composites by altering the dielectric constant through the volume ratio. Zhang et al. [106] modified PMN-PT ceramic with larger permittivity than other piezoelectric materials like PMN-PT and PZN-PT single crystals, PZT-based piezoceramics and lead-free piezo materials to develop transducers with matched electrical impedance.
Electric impedance can be matched with simple shunt and series inductors to cancel the reactive component of the transducer [107,108,109]. Optimization of the EIMNs with driver/receiver electronics for broadband application in high-frequency range is difficult. Different ways have looked to find a compromise between bandwidth and efficiency. The piezoelectric materials can be used as actuator, sensor, and a transducer. Transducers can operate in pitch-catch or pulse-echo due to which they are also called transceivers. In the case of the transmitter, the tuning circuit is placed across the pulser output. In the case of the receiver, the tuning circuit is connected across the electrodes of the piezoelectric probe. The matching scheme for pulse-echo and pitch-catch configurations is shown in Figure 6. In the pulse-echo technique, the matching circuits are placed across the pulser as well as the probe [110]. This is because the probe serves the dual purpose of actuation and reception. A pitch-catch setting explains the different arrangement of the matching circuit in the cases for receiver and transmitter [111].
3.1. Single Resonant Frequency Based Design
The piezoelectric transducer is a capacitive load and not a resistive load at its resonant frequencies. The ultrasonic signal has a phase difference between the voltage and current affecting the resonant effect of the transducer and the power transfer from the power supply [112]. A simple way of matching the electric impedance is by adding an inductor in series or in parallel with the transducer [107,113,114]. At series resonance, a shunt inductor with a value is added. Whereas for parallel resonance, a shunt inductor with value is added. Here, is the capacitance of transducer and , where and are the acoustic impedance of load and backing material, respectively.
The resonant frequency transducers can be simplified from single frequency BVD modes (Figure 7) as in parallel to . The connection of the transducer to the pulser is through a matching circuit. The pulser is a source with output impedance and transducer with impedance acts as a load. Consider and to be the reactance components (due to energy storage in capacitor and inductor) of the matching network and the impedance faced by the source due to the load. The equations for and are obtained using the criteria to maximize the power transfer from the source to the load. The efficiency is maximum when the impedance of the source is a complex conjugate of the load as and for which we get
where . The circuit is simplified assuming purely resistive output excitation and a low pass filter solution for matching circuit to enable excitation operated by any harmonic. The inductance and capacitance components of the matching circuit are given by
3.2. Broadband Multi-Frequency Based Design
The design overview of an EIMN for a broadband ultrasonic transducer [27] is shown in Figure 8. First, the admittance of the ultrasonic transducer is measured. The measurement can be done using commercially available equipment such as impedance analyzer or vector network analyzer. Time domain methods can also be used for this task [115,116]. At the series resonance, the magnitude of admittance being largest lets the series angular frequency to be found by setting the imaginary part of the denominator of Equation (3) to zero as
where is the angular frequency at the series resonance. Thus, Equation (3) reduces to
The real part of the admittance is conductance. Thus, resistance components values can be calculated from the reciprocal of the real part of the admittance by
The capacitance representing the susceptance is the imaginary part of the admittance given by
Using the parallel resonance criteria where the magnitude of the admittance is smallest. Thus, the real part of the numerator of Equation (3) is set to zero. This gives the capacitance and inductance of the matching circuit as
where is the angular frequency at the parallel resonance. Since the component values are evaluated at resonant frequencies, the admittance of BVD circuit values may not match the actual values at other frequencies. Nonlinear regression is carried out in a frequency range containing one resonant frequency to fine-tune the estimated components. For the initial guess, the admittance estimated using Equation (3) and the component values using Equation (23) is provided as an initial guess. This process is repeated for frequency ranges containing other resonant frequencies. The sets of component values determined for these frequency ranges is used as an initial guess for second nonlinear regression fitting, which determines the final component values for the extended multi-resonant frequency BVD model. Nonlinear regression can be easily done using MATLAB nonlinear regression function “nlinfit”.
3.3. Filter Structure Based Network
Increase in the center frequency of the transducers requires the reduction of thickness [64,117,118,119]. It causes the impedance of the transducer to approach zero resulting in a severe electrical impedance mismatch. Electric impedance consists of complex resistive and reactive components given by
Moon et al. [120] presented a filter structure based electrical impedance matching network for high-frequency ultrasound transducers. Figure 9 shows the EIMN where two reactive components are connected to the transducer in series and in parallel when the electrical impedance of a system is larger than that of a transducer and vice versa . When the system has larger electric impedance, the input and output electrical impedance of the matching network is given by
By analysis of the circuit, the frequency dependent resistive and reactive components can be found by
A positive and negative has a low-pass filter structure, whereas the positive and negative has a high-pass filter structure. When the electric impedance of the system is smaller than the transducer, a shunt reactive component is placed near to the transducer whose value is given by
The proposed method modifies the spectral characteristics while increasing the efficiency of electric transfer. The spectrum of the output signal from the EIMN is . When a transducer generates low-frequency high-amplitude components, high-pass filter EIMN structure is suitable to eliminate these components. Zhao et al. [121] have used a low pass filter to function both as a filter and an electric matching circuit for application in structural health monitoring based on piezoelectric wireless sensor-actuator network.
3.4. Selective Damping and Tuning Circuits for High-Efficiency Spike Generation
Most NDE applications involve a multi-probe inspection system. Each probe needs to be tuned for best sensitivity for the given material and geometry under test. Tuning is done using the EIMN where the components are tuned by the operator. Most practical situations involve tuning values manually in specific circuits for each NDE case and testing each channel to find the best sensitivity. Mode of the operation of the transducer determines the placement of matching or tuning circuits that enhance the efficiency of the operation of transmitter or receiver. The tuning circuits enable the user to tune specific components in the circuit to optimize the operation of the transducer for a given operation. A tuned shunt circuit composed of an inductance and a parallel resistance cancel out some reactive components in the transducer input [107,122]. It increases the sensitivity of the piezoelectric transduction, but introduces distortions in signals waveform and reductions in signal bandwidth [107].
Early developments involved general-purpose impedance matching procedures that had complex networks, but high voltage NDE requirements were difficult to be met. For instance, explicit formulas and theoretical limitations of broadband matching impedance has been presented [33,123]. Augustine and Andersen [124] presented an algorithm to achieve lossless and transformer-less broadband equalizer by introducing an algorithm to match a resistive source to the piezoelectric transducer with power gain. A more advanced computer-aided design was also proposed [125,126]. Detailed criteria to determine the tuning and matching criteria have been proposed for stationary driving regime [127], but they did not work well since the driving regime involves transients due to emission and reception electronic units, time-variable complex impedance of spike generation, and multi-channel switching systems [128]. Few applications require the electrical power to be applied to the mechanical branch of the piezoelectric transducer, which other practical situations require the changing of high voltage pulse. Shunt and series tuning can be used, but a parallel connection is most effective in resolving possible oscillations due to fast damping of electrical resonance [129,130].
Tuning procedure for the pulse-echo mode is different from through transmission. In the pulse-echo mode, a tradeoff is decided for the tuning value to fit the suitability for emitter and receiver. In both cases, the frequency selective damping unit is introduced in the emission stage to avoid oscillations in the excitation spike , as shown in Figure 10. This unit includes nonlinear semiconductor circuits. The tuning unit is consistent with a single transducer working as emitter and a receiver in the pulse-echo scheme. The pulse-echo has independent probes for emission and reception. This allows the independent selection of tuning for better considering excitation and reception.
For sophisticated configurations of NDE (like the beam steering), variable focusing, SAFT and other multi-channel schemes are needed. Depending on the type of scanning and probes, the tuning circuits can be shared at different time instances or can be independent. Space limitations entail the use of a simplified circuit but the cross-coupling in the high-frequency range can be notable. The cross-coupling also increases due to high-frequency demultiplexer and cable effect [132,133,134]. An approach of separate damping and tuning stages isolates such spurious effects. Such selective damping and tuning networks have been developed to achieve electric impedance matching for transmitter and receiver [111,131] through a high-efficiency spike generation. The high voltage excitation pulse is examined in the Laplace domain with inductive tuning under loading conditions. Since the damping circuit is same for pulse-echo and pitch-catch configuration, and voltage levels of reception is low for pulse-echo signals. The representation of configurations is shown in Figure 10 as applicable to both the cases. Here the pulser circuit forms the high voltage ramp source in series with the differentiating type shaper , the parallel input circuit of receiver and the tuning network . The equivalent networks may be the classical Mason or KLM based equivalent circuits. The circuit is reduced to a single impedance of capacitive type assuming . Nonlinear semiconductor components connected across terminals A and B to selectively damp the excitation pulse alters the trailing edge of pulse and thus was ignored. Thus, for an inductive parallel tuning, the spike in Laplace transformation is written as
where is an effective load for the pulser, is an equivalent parallel of and and is the fall time of waveform . The temporal behavior of received signal in the open circuit is derived and is given by
where and denote impulsive time responses to be evaluated in real conditions.
3.5. Reconfigurable Complex Conjugate Impedance Matching
Acoustic to electric conversion in miniaturized ultrasonic receivers requires adaptive matching techniques for application in battery operated biomedical devices. Although the use of complex conjugate EIMN design with a fixed value of the electric components has been reported [135,136], the power receiver should be tunable with the source for a wide frequency range of dynamic loads. In addition, the off-resonance tuning ability should be considered for variable application load. Power electronics design for rectifier based power receivers to achieve high efficiency has been extensively reported [137,138]. To optimize the efficiency of the receiver due to a large variation of load, first-order calculations are available to model nonlinear power recovery circuits, which can yield a high efficiency of 80% [139,140]. A typical piezoelectric material can have a two-order change in the magnitude of the real part of impedance when the configuration is changed from short circuit to open circuit. The conventional reactive inductance matching with inductors is not possible to be designed for miniature devices size in a range of millimeters. Pure capacitive matching networks are possible in the range 1–40 pF.
Chang et al. [141] proposed an adaptive matching method for capacitive only matching networks to operate the piezoelectric receivers for dynamically varying load efficiently. They represented the receiver as a Thévenin model with a root-mean-squared open-circuit voltage . A commercial full-wave bridge rectifier (HSMS-282X Surface Mount RF Schottky Barrier Diodes) is used as power recovery circuit. Optimal adaptive matching parameters at various load powers were obtained from simulations performed using Advanced Design System (ADS) from Keysight. Series and L matching networks where and are complex conjugates used. As varies, the operating frequency is tuned to change close to . The remaining inductive part of is matched by tuning the series capacitor in a series matching network. Whereas L network gives additional freedom with extra shunt capacitor to change based on topology and quality factor. A comparison of , where is the incident acoustic power showed an increase of as much as 20% for the L matching network when compared to series matching. A huge increase in efficiency of ~50% was seen with respect to a non-adaptive system. The capacitances values varied from 2–20 pF. Similarly, Lee et al. [142] used L matching network topology to match the electric impedance of interdigital electrode transducer and a signal source. Rekhi et al. [143] also used a single stage L matched topology to realize the network-on-chip or mm-scale off-chip. Ren and Lissenden [144] considered three frequencies to design L-matching networks using Smith chart and ensured the transducer impedance is complex conjugate of the source impedance. Figure 11 shows the predicted amplitude of Lamb wave mode A0 and S0 modes [21] without matching and with matching at 0.35 MHz. The amplitude of the received signal at 0.35 MHz is more than 100%.
4. Electric Impedance Matching for Specific Applications
The EIMNs are used when the sensing signals have low SNR, actuator has a limitation, high power efficiency is required for industrial use and the actuation power is limited. To save significant power, Sherrit et al. [145] measured the admittance of the ultrasonic transducer to design the EIMN for a horn used for cleaning, welding, soldering, cutting and drilling. Qiu et al. [146] used a transformer to match the impedance of the ultrasonic transducer used for neuro-stimulation to the amplifier source. The value of the inductance was determined by the Smith chart. Kuo et al. [147] also used Smith chart (Smith V3.10, Bern University of Applied Sciences, Bern, Switzerland) to design an EIMN for high-intensity focused ultrasound phased array transducer developed for breast tumor treatment. The requirements of the phase 0° and the amplitude 50 Ω at 1 MHz was achieved.
Lin and Xu [148] presented a detailed study discussing the effect of series matching inductor on the resonance or anti-resonance frequency, electromechanical coupling coefficient, electrical quality factor and electro-acoustic efficiency. Lee et al. [149] used a series capacitor and a shunt inductor to match the electric impedance of dual-frequency oblong-shaped-focused transducers used for imaging intravascular tissue. This section reviews some applications where advanced EIMNs are essentially used. Many of these applications are based on the theory and commonly used methods explained in the previous sections. Some new and uncommon or specific applications have also been reviewed. Table 2 summarizes the tools and methods used by the applications and the electric matching parameters.
4.1. Actuation in Resonant Frequency Ultrasonic Transducers
Garcia-Rodriguez et al. designed a BVD based single resonant matching circuit, as discussed in Section 3.1. First, the circuit in Figure 7 with all the components of the BVD model of the transducer with a working frequency of 0.8 MHz is simulated using PSPICE program. The real and imaginary part of the simulated impedance is shown in Figure 12a. The imaginary part is compensated and the real part is matched to 50 Ω using a matching network. Figure 12b shows the simulated acoustic power emitted by the pulsing circuit with the LC matching network. The power output emitted by the matched transducer is nine times higher with a matching circuit. Experiments were conducted to estimate the response of air coupled transducer with a matching circuit. The matching network component values were estimated to be = 560 pF and = 56 µH. The transducer was operated with 15-cycle modulated pulse of 30 V peak-to-peak and a center frequency of 800 kHz. The ultrasonic field was measured by a hydrophone placed 1.7 cm away in front of it. The signal was amplified by 57 dB and recorded by an oscilloscope. An improvement of 300% in the amplitude of the received signal was seen with the matched transducer, as shown in Figure 12c. This improvement leads to improved SNR and better accuracy in measurements.
4.2. Actuation and Sensing of Broadband Ultrasonic Transducers
Huang and Paramo [27] presented a broadband EIMN design using extended BVD model explained in Section 3.2. The matching of an acoustic emission sensor R50α from Physical Acoustics Corp. (Princeton Junction, NJ, USA), was considered in this work with an operating frequency range of 150–400 kHz. It was bonded on an aluminium channel and complex admittances were measured using VNA (ZL3, Rohde and Schwarz International) with a port impedance of 50 Ω. In the operational frequency range, three resonances peaks were observed at 150, 320 and 525 kHz. A simple test involving the measurement of response (using an oscilloscope with 50 Ω coupling) due to lead break also showed these frequencies in the frequency response. A large mismatch and large sensor response was observed at 320 kHz and was selected for EIMN design. The complex admittance and impedances were 0.6 + j0.63 mS or 791 − j840 Ω, respectively. Extended BVD model was considered for which three frequency ranges were considered and component values were determined. Measured conductance and susceptance matched with the simulated curves for different frequencies. The network was designed using Smith v3.10 (Fritz Dellsperger, Bern University of Applied Sciences, Bern, Switzerland) with quality factor Q = 2 and the maximum number of the component as 5. The simulation model was established by inserting the EIMN between the equivalent circuit of the unmatched transducer and a 50 Ω load. Two types of configurations like A and T types were selected for hardware implementation. The authors first studied the variation of the frequency response of matching networks due to the variation of the actual value of commercially acquired components from their ideal values, estimated using simulations. They found similar variations of acquired and simulated responses. The gain value showed drastic improvement at the center frequency over the range considered in both the cases where the transducer used as a sensor or actuator was matched. The EIMN used for sensing showed better performance with network A. The T-network exhibited a resonance at around 300 kHz. The EIMN used for actuation also showed a better performance with network A in the entire range of the frequencies. Thus, the matching networks can be used for ultrasonic transducers operating in a dual mode of actuation and sensing.
4.3. Selective Damping and Tuning for Spike Generation
The effect of damping and tuning on the generated spike was analyzed by Ramos et al. [131] for the reception response. They considered acoustic propagation through the homogeneous plastic medium and neglected diffraction. Pitch-catch mode was considered to analyze the independent effect of tuning in transmitter and receiver stages. Two similar transducer models having a lead zirconate titanate disc of 20 mm diameter were considered. Electrical admittances were computed and the KLM model was used to evaluate the transfer functions of emission and reception. The tuning circuit modifies the excitation pulse applied to the transducer. Improvements was seen by increasing the tuning levels in the exciter and receiver tuning circuits by tuning the inductance parameters and , respectively. The exciter and receiver circuits have been explained in Section 3.4. More than 100% improvement in the bandwidth and amplitude is possible by proper selection of tuning parameters in both exciter and receiver tuning circuits.
4.4. Matching for Energy Transfer from Source to Storage
Smart wireless sensor nodes autonomously report the operating conditions accessed by health monitoring systems installed on cars, buildings, aircraft etc. [152,153]. Piezoelectric based systems not only serve the purpose to sense valuable vibration information of the structures but also generate power from the same vibrations. Since direct powering of any wireless transmitter is not possible, a storage system with highly efficient circuit interface is needed [154]. Determination of mechanical system parameters is the first step that helps in the selection of optimal electronic loads in the circuits in the second step. The final step involves the design of an interface with the storage system. A combination of the bridge rectifier and step-down converter [155] and similar techniques have been reported to increase the conversion efficiency to about 92%. Such a technique has become popular in MEMS applications based energy harvesting [23,24]. In these works, the electric impedance is assumed as capacitive and electric resistance is adapted to suit the piezoelectric equivalent impedance. This is not valid since the harvesters work at resonant frequencies where electric impedance has a considerable real part apart from the reactive (capacitive) component. Thus, the electric impedance of the matching circuit should be equal to the complex conjugate impedance of the piezoelectric generator. Very high real part may make the matching process unrealizable. Brufau-Penella and Puig-Vidal [31] demonstrated complex-conjugate impedance matching for a commercially available piezoelectric bender QP40w from Mide Corporation for energy harvesting applications. A two-port grey box model was presented to obtain the transfer function used for the system identification process. A lumped electromechanical model was derived with base vibration and input voltage as effort variables, and flow variables as input current and beam tip velocity. These lumped models simplify the governing partial differential equations to ordinary differential equations. Thevenin circuit is assumed with the piezo generator as a source and piezoelectric cantilever beam as equivalent load and internal impedance. As per the maximum power transfer theorem, the load impedance value is chosen as the complex conjugate of the equivalent Thevenin impedance value. The governing differential equation of the mechanical system is derived and were compared with the lumped electromechanical model equations involving the effective mass , the effective compliance , and a damping contribution modeled with a resistor . The derived equations for power generated with the matched circuit is given as a function of the voltage of the piezo source by
where sub-index represents the th resonant mode, is the resonant frequency in open-circuit conditions and is the electric capacitance due to the dielectric nature of the piezoelectric materials. Complex conjugate matching process with a 50 mH load inductor at 925 Hz yielded an increase off 20% of the generator power.
4.5. Power Supply and Preamplifier Development Considering Optimal Driving Frequency
Most of the matching circuits are designed for the resonant frequency operation of the transducers [156,157,158]. Considering the power dissipation of the power supply, resonant frequency-based design may not be optimal. At resonance, the loss arises mainly due to the generation of heat, which is proportional to elastic loss. At anti-resonance, the loss results from dielectric, elastic, and piezoelectric losses [159]. Thus, some studies suggest the use of anti-resonant frequency-based design [160]. Mechanical quality factor exhibits the highest value between the resonant and anti-resonant frequencies [161,162,163]. Dong et al. [150] presented the design of a Class E resonant inverter as a capacitive output impedance driver to drive a Langevin transducer with dominant inductive characteristics. First, the mechanical energy constant is determined by driving the transducer HEC#45402 from Honda Electronic Co. Ltd. (Toyohashi, Japan), at single frequency and measuring the vibration using a laser Doppler vibrometer. A frequency sweep was performed adjusting the driving voltage to achieve constant velocity. The voltage, current, and admittance phase curves indicated the lowest voltage and lowest current at 40.07 kHz and 42.05 kHz, respectively, which are the resonance and anti-resonance frequencies, respectively. The lowest actual input power was obtained at 41.27 kHz in between the resonance and anti-resonance frequencies. The mechanical quality factor is the ratio of energy stored (kinetic energy) to energy dissipated (in this case of no load it is the input electric power ) given by
where is the frequency, is the mass and is the measured velocity. The lowest input power was characterized by the inductive impedance for which a capacitive output impedance driver was designed for the transducer impedance = 144.2 + j2065 Ω at 41.27 kHz. The BVD model of the piezoelectric transducer was considered. The cost-effective Class E resonant inverter was used instead of other inverters and since it is intended to drive a resistive load, a series capacitor simulated and estimated by PSpice software was added. Impedance matching circuit with Langevin transducer was considered as a resistor . The impedance matching circuit was connected to a DC signal source through a power MOSFET switch, a choke inductor and a shunt capacitance . The component values were calculated [164] and with a constant input power of the transducer as 15.5 mW, the vibration velocity achieved was 1.7 times larger than that at the resonance frequency. In a similar manner, Bovtun et al. [165] developed preamplifier for a receiver with inbuilt impedance matching having a gain range of 60 dB at 1 MΩ load to 54 dB at 50 Ω load.
4.6. Estimation of Cable Attenuation for High-Frequency Applications
Pulse-echo measurements are common in high-frequency imaging applications. The electric impedance of the transducer is inversely proportional to the capacitance at resonance. Transmission line theory allows the coaxial cable to be modeled as an impedance transformer matching the impedance to the electronics [166]. This reduces the reflections and increases the power delivery. A modified Mason model by Ohigashi et al. [167] allows the user to select a standard shielded coaxial cable like RG-58 and RG-59 [168]. Jian et al. [90] performed experiments to study the attenuation in pulse-echo transducers with different cable length in detail. Transducers of 12 MHz, 20 MHz, and 50 MHz were fabricated with (001)-oriented PZT 5H material with different thickness. A backing material E-Solder 3022 (VonRoll Isola, New Haven, CT) was lapped to 1 mm on one side. The other side was matched with a quarter-wave layer using Epo-tek 301 (EpoxyTechnology Inc., Billerica, MA, USA, acoustic impedance = 6.0 MRayls). The peak-to-peak amplitude of 12 MHz, 20 MHz, and 50 MHz-transducers with different cable lengths showed an exponential reduction with the cable length for all the transducers. With the same cable length, the amplitude decreases with the transducer center frequency.
4.7. Energy Transmission to Ultra-thin Transducer for Cell Manipulation
High-frequency ultrasound is widely used in clinical diagnosis, which has been realized from the decades of research on the design and development of transducers for high-frequency imaging and safety of human tissue [51,169,170]. Very high-frequency ultrasound at frequencies >100 kHz is used in single-cell analysis, acoustic trapping and high-resolution mechanotransduction [171,172,173]. These transducers have a highly focused beam with a large aperture to generate strong acoustic pressure field [174]. It is also safe for the living cells due to lower power and short duration pulse used. The lower power is realized only when the electric impedance of the transducer is matched with driving electronics [175,176]. Impedance mismatch leads to a large portion of electrical energy reflected back to the excitation source, especially in large aperture and high-frequency ultrasonic transducer. This problem is inherent due to piezoelectric materials having high dielectric constants. Various impedance matching schemes have been proposed to achieve broadband operation and high resolution [34,124]. These networks are not appropriate where maximum intensity at a single resonance frequency is required.
Kim et al. [41] suggested the use of Smith chart instead of PiezoCAD from Sonic Concepts, Bothell, WA since it is not applicable for high-frequency design. They sacrificed the bandwidth and used L-type impedance matching network with tuning ability described in Section 3.4, to achieve a sharp peak at the resonance frequency. Figure 13 shows the Smith chart and a developed impedance matching network with transducer fabricated on a printed circuit board. The values of the capacitor and inductor obtained from the design were 100 pF and 8 nH, respectively. Figure 14 shows a 65% increase in the pulse-echo signal obtained from the transducer with the EIMN at 111 MHz. The experiments were performed further on HeLa cell treated by the ultrasonic transducer for four hours. The cells treated with the transducer with EIMN were alive, whereas the cell treated without EIMN was dead. Thus, the transducer with the EIMN was safe for the transducer element as well as the targeted cell. Such impedance matching circuits show great promise in low frequency applications ~200 kHz with transducers of different configurations [177].
4.8. Filter Structure EIMN for Needle Transducer
Pulse-echo response from a custom-made 50 MHz ultrasound needle transducer immersed into a deionized-water-filled container with a steel target was measured to check the filter structure based EIMN discussed in Section 3.3. The fabricated network on a PCB is shown in Figure 15. The electrical impedance of the pulser/receiver system was 50 Ω. Transducer had an electrical impedance with a magnitude of 21.6 Ω, −55.5° phase angle at 50 MHz. Since the electrical impedance of the transducer is smaller than that of the pulser/receiver system, .6−55.5° = 12.236 − j17.8 and 0° = 50 Ω.
Figure 16 shows the response of the needle transducer when high-pass and low-pass filter based EIMNs are used. The low-pass filter based EIMN attenuates the higher frequency components decreasing the center frequency of the needle transducer from 47.5 MHz to 36.1 MHz. However, the bandwidth increased from 50.5% to 90.7%. An increase in the SNR was seen from 65.9 dB to 70.5 dB. The high-pass based EIMN decreased the frequency components lower than its cutoff frequency enhancing the higher frequency components. It increased the bandwidth to 101.6%, but a decrease in the center frequency was minimized.
4.9. Nondestructive Evaluation of Composite and Sandwich Structures
Increase in the energy transfer efficiency is highly desirable when testing composite materials and sandwich structures where the SNR is high due to the inherent wave damping and dispersion characteristics of the structures. Sandwich and composites are extensively used as structural materials in high-performance structures like wind turbine blades, aircraft, spacecraft, unmanned aerial vehicles and rockets. Nondestructive evaluation and SHM are indispensable tools to increase the safety and operating cost. Electric tuning or matching circuits with such high-energy transfer efficiency will greatly help in the design of such systems. Such circuits also minimize power consumed when the transducers are used in industry setting to inspect large parts or a huge number of components.
Gaal et al. [151] developed an ultra-low noise pre-amplifier for air-coupled ultrasonic receiver with an output impedance of 1 to 10 MΩ an extremely high input impedance of 100 MΩ // 10 pF (See Figure 17). Noting the high voltage levels of amplifier close to the breakdown of the exciter, Mariani et al. [13] used PSpice software to design L type networks based EIMN for the receiver side. The resistor-inductor-capacitor (RLC) configuration at 170 kHz was found to yield the best SNR for air-coupled receiver. Figure 18 shows nine-fold improvement in the receiver signal when a matching inductor in connected with improvement in SNR.
5. Conclusions and Future Perspectives
This paper presented the methods available to develop EIMNs considering the requirements of various applications. Common analytical, numerical and software tools available to assist in the design the EIMNs have been discussed. The proper selection of transducer parameters like geometry, electrode design, and material properties during the design stage itself leads to a highly optimized electric impedance matching with great power transfer efficiencies. The simulation tools and software help in the design of complex network for broadband transducers. Since the designed component values and commercially available components of EIMN can differ in the specifications, these tools provide the platform to study the compatibility and redesign without much expense. In the past, electrical impedance matching circuits were designed only for energy efficient systems due to the unavailability of a common tool that could assist in the entire EIMN design process. Cost of the EIMN were also a factor for ignoring them especially in electronics produced on a large-scale. With the availability of computational facilities, versatile simulation tools can be designed to realize the power conversion efficiencies in most applications including cyber-physical systems (CPS) and Internet of Things (IOT).
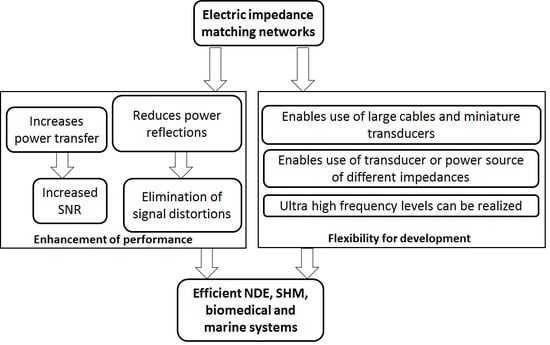
The electric impedance matching is not required when the operating frequencies are low or when the connecting cables are short. However, many applications require a high SNR, preservation of signal waveform and low power consumption. Examples are the biomedical applications where SNR and power is an important factor. This paper presented the transducers reported so far with the development of EIMNs for high-frequency biomedical imaging systems. In aircraft, spacecraft, wind turbines, and civil structures, the sensor-actuator networks for SHM applications are huge with long connecting cables. The presence of EIMNs increases the SNR and helps in eliminating ringing peaks in the sensor response due to electrical reflections. This increases the capability of damage and defect detection. In some heavy-duty industrial settings, significant power saving can be done by implementing the EIMNs. Figure 19 shows the advantages of EIMNs to develop any type of piezoelectric sensor, actuator, or transducer with high SNR, power efficiency, and flexibility. With the rapidly growing embedded electronic systems, flexible electronics and nanotechnology, tunable and programmable EIMNs with miniature sizes can be developed in near future for MEMS and Nanoelectromechanical Systems (NEMS) based applications. Piezoelectric nanocomposites can provide huge flexibility to tune the electric and mechanical properties for realizing optimized EIMNs. The rapidly reducing sizes and cost of the components required for EIMN along with the materials and design tools will enable the engineers and researchers to rapidly design and fabricate the EIMNs for almost all applications.
Funding
This research received no external funding.
Acknowledgments
The author deeply acknowledges Dr. Anjana Jain (Materials Science Division, National Aerospace Laboratories, India), Mr. Thulasi Durai (CSMST, National Aerospace Laboratories, India) and Dr. Gangadharan Raju (Department of Mechanical and Aerospace Engineering, IIT Hyderabad, India) for providing access to various facilities with transducers and instrumentation. It provided valuable experience on the electric impedance and electromechanical properties of various piezoelectric sensors and transducers, motivating me to pursue this review article.
Conflicts of Interest
The author declare no conflict of interest.
References
- Vijaya, M.S. Piezoelectric Materials and Devices: Applications in Engineering and Medical Sciences; CRC Press: Boca Raton, FL, USA, 2016. [Google Scholar]
- Saccomandi, P.; Schena, E.; Oddo, C.M.; Zollo, L.; Silvestri, S.; Guglielmelli, E. Microfabricated Tactile Sensors for Biomedical Applications: A Review. Biosensors 2014, 4, 422–448. [Google Scholar] [CrossRef] [PubMed]
- Zou, L.; Ge, C.; Wang, Z.J.; Cretu, E.; Li, X. Novel tactile sensor technology and smart tactile sensing systems: A review. Sensors 2017, 17, 2653. [Google Scholar] [CrossRef] [PubMed]
- Rathod, V.T.; Roy Mahapatra, D.; Jain, A.; Gayathri, A. Characterization of a large area PVDF thin film for electro-mechanical and ultrasonic sensing applications. Sens. Actuators A 2010, 163, 164–171. [Google Scholar] [CrossRef]
- Carullo, A.; Parvis, M. An ultrasonic sensor for distance measurement in automotive applications. IEEE Sens. J. 2001, 1, 143. [Google Scholar] [CrossRef]
- Zhou, Q.; Lam, K.H.; Zheng, H.; Qiu, W.; Shung, K.K. Piezoelectric single crystal ultrasonic transducers for biomedical applications. Prog. Mater. Sci. 2014, 66, 87–111. [Google Scholar] [CrossRef]
- Jensen, J.A.; Svendsen, N.B. Calculation of pressure fields from arbitrarily shaped, apodized, and excited ultrasound transducers. IEEE Trans. Ultrason. Ferroelectr. Freq. Control 1992, 39, 262–267. [Google Scholar] [CrossRef] [PubMed]
- Manbachi, A.; Cobbold, R.S.C. Development and application of piezoelectric materials for ultrasound generation and detection. Ultrasound 2011, 19, 187–196. [Google Scholar] [CrossRef]
- Li, X. A brief review: Acoustic emission method for tool wear monitoring during turning. Int. J. Mach. Tools Manuf. 2002, 42, 157–165. [Google Scholar] [CrossRef]
- Raju, G.; Prasanna, G.; Bhat, M.R.; Murthy, C.R.L.; Gopalakrishnan, S. Acoustic emission source location and damage detection in a metallic structure using a graph-theory-based geodesic approach. Smart Mater. Struct. 2009, 18, 115022. [Google Scholar]
- Hameed, Z.; Hong, Y.S.; Cho, Y.M.; Ahn, S.H.; Song, C.K. Condition monitoring and fault detection of wind turbines and related algorithms: A review. Renew. Sustain. Energy Rev. 2009, 13, 1–39. [Google Scholar] [CrossRef]
- Kaur, N.; Bhalla, S.; Maddu, S.C.G. Damage and retrofitting monitoring in reinforced concrete structures along with long-term strength and fatigue monitoring using embedded Lead Zirconate Titanate patches. J. Intell. Mater. Syst. Struct. 2018, 30, 100–115. [Google Scholar] [CrossRef]
- Mariani, S.; Nguyen, T.; Zhu, X.; di Scalea, F.L. Field test performance of noncontact ultrasonic rail inspection system. J. Transp. Eng. Part A Syst. 2017, 143, 04017007. [Google Scholar] [CrossRef]
- Ibrahim, M.E. Nondestructive evaluation of thick-section composites and sandwich structures: A review. Compos. Part A Appl. Sci. Manuf. 2014, 64, 36–48. [Google Scholar] [CrossRef]
- Chakrapani, S.; Dayal, V.; Barnard, D.; Krafka, R.; Eldal, A. Nondestructive testing of wind turbine blades using air-coupled ultrasonics. Mater. Eval. 2015, 73, 1047–1055. [Google Scholar]
- Chakrapani, S.K.; Barnard, D.; Dayal, V. Nondestructive evaluation of helicopter rotor blades using guided Lamb modes. Ultrasonics 2014, 54, 826–833. [Google Scholar] [CrossRef] [PubMed]
- Panda, R.S.; Rajagopal, P.; Balasubramanian, K. Rapid guided wave inspection of complex stiffened composite structural components using non-contact air-coupled ultrasound. Compos. Struct. 2018, 206, 247–260. [Google Scholar] [CrossRef]
- Mitra, M.; Gopalakrishnan, S. Guided wave based structural health monitoring: A review. Smart Mater. Struct. 2016, 25, 053001. [Google Scholar] [CrossRef]
- Rathod, V.T.; Roy Mahapatra, D. Ultrasonic Lamb wave based monitoring of corrosion type of damage in plate using a circular array of piezo electric transducers. NDT&E Int. 2011, 44, 628–636. [Google Scholar]
- Chakraborty, N.; Rathod, V.T.; Roy Mahapatra, D.; Gopalakrishnan, S. Guided wave based detection of damage in honeycomb core sandwich structures. NDT&E Int. 2012, 49, 27–33. [Google Scholar]
- Giurgiutiu, V. Structural Health Monitoring with Piezoelectric Wafer Active Sensors; Academic Press: New York, NY, USA, 2008. [Google Scholar]
- Dib, G.; Karpenko, O.; Koricho, E.; Khomenko, A.; Haq, M.; Udpa, L. Ensembles of novelty detection classifiers for structural health monitoring using guided waves. Smart Mater. Struct. 2017, 27, 015003. [Google Scholar] [CrossRef]
- Lu, F.; Lee, H.P.; Lim, S.P. Modeling and analysis of micro piezoelectric power generators for micro-electromechanical systems applications. Smart. Mater. Struct. 2003, 13, 57–63. [Google Scholar] [CrossRef]
- Fang, H.-B.; Liu, J.-Q.; Xu, Z.-Y.; Dong, L.; Di, C.; Cai, B.-C.; Liu, Y. A MEMS-based piezoelectric power generator for low frequency vibration energy harvesting. Chin. Phys. Lett. 2003, 23, 732–734. [Google Scholar]
- Annamdas, V.G.M.; Radhika, M.A. Electromechanical impedance of piezoelectric transducers for monitoring metallic and non-metallic structures: A review of wired, wireless and energy-harvesting methods. J. Intell. Mater. Syst. Struct. 2013, 24, 1021–1042. [Google Scholar] [CrossRef]
- Sittig, E.K. Definitions relating to conversion losses in piezoelectric transducers. IEEE Trans. Sonics Ultrason. 1971, 18, 231–234. [Google Scholar] [CrossRef]
- Huang, H.; Paramo, D. Broadband electrical impedance matching for piezoelectric ultrasound transducers. IEEE Trans. Ultrason. Ferroelectr. Freq. Control 2011, 58, 2699–2707. [Google Scholar] [CrossRef] [PubMed]
- Garcia-Rodriguez, M.; Garcia-Alvarez, J.; Yañez, Y.; Garcia-Hernandez, M.J.; Salazar, J.; Turo, A.; Chavez, J.A. Low cost matching network for ultrasonic transducers. Phys. Procedia 2010, 3, 1025–1031. [Google Scholar] [CrossRef]
- San Emeterio, J.L.; Ramos, A.; Sanz, P.T.; Ruiz, A. Evaluation of impedance matching schemes for pulse-echo ultrasonic piezoelectric transducers. Ferroelectrics 2002, 273, 297–302. [Google Scholar] [CrossRef]
- Molchanov, V.Y.; Makarov, O. Phenomenological method for broadband electrical matching of acousto-optical device piezotransducers. Opt. Eng. 1999, 38, 1127–1135. [Google Scholar]
- Brafau-Penella, J.; Puig-Vidal, M. Piezoelectric energy harvesting improvement with complex conjugate impedance matching. J. Intell. Mater. Syst. Struct. 2009, 20, 597–608. [Google Scholar] [CrossRef]
- Lawry, T.J.; Wilt, K.R.; Roa-Prada, S.; Ashdown, J.D.; Saulnier, G.J.; Das, P.K.; Pinezich, J.D. Electrical optimization of power delivery through thick steel barriers using piezoelectric transducers. In Proceedings of the SPIE 7683, Energy Harvesting and Storage: Materials, Devices, and Applications, Orlando, FL, USA, 28 May 2010. [Google Scholar]
- Fano, R.M. Theoretical limitations on the broadband matching of arbitrary impedances. J. Franklin Inst. 1950, 249, 57–83. [Google Scholar] [CrossRef]
- Youla, D. A New Theory of Broad-band Matching. IEEE Trans. Circuit Theory 1964, 11, 30–50. [Google Scholar] [CrossRef]
- Dedieu, H.; Dehollain, C.; Neirynck, J.; Rhodes, G. New broadband-matching circuit. Int. J. Circuit Theory Appl. 1994, 22, 61–69. [Google Scholar] [CrossRef]
- Dedieu, H.; Dehollain, C.; Neirynck, J.; Rhodes, G. A new method for solving broadband matching problems. IEEE Trans. Circuits Syst. I Fundam. Theory Appl. 1994, 41, 561–571. [Google Scholar] [CrossRef]
- Henning, B.; Rautenberg, J.; Unverzagt, C.; Schroder, A.; Olfert, S. Computer-assisted design of transducers for ultrasonic sensor systems. Meas. Sci. Technol. 2009, 20, 124012. [Google Scholar] [CrossRef]
- Smith-Chart Software and Related Documents. Available online: http://www.fritz.dellsperger.net/smith.html (accessed on 27 October 2018).
- Iowa Hills Software. Available online: http://www.iowahills.com/8DownloadPage.html (accessed on 27 October 2018).
- Interactive Smith Chart. Available online: http://cgi.www.telestrian.co.uk/cgi-bin/www.telestrian.co.uk/smiths.pl (accessed on 27 October 2018).
- Kim, M.G.; Yoon, S.; Kim, H.H.; Shung, K.K. Impedance matching network for high frequency ultrasonic transducer for cellular applications. Ultrasonics 2016, 65, 258–267. [Google Scholar] [CrossRef] [PubMed]
- Gonzalez, G. Microwave Transistor Amplifiers: Analysis and Design, 2nd ed.; Prentice Hall: Upper Saddle River, NJ, USA, 1997. [Google Scholar]
- Mason, W.P. Electromechanical Transducers and Wave Filters; D. Van Nostrand Company Inc.: New York, NY, USA, 1942. [Google Scholar]
- Redwood, M. Experiments with the electrical analog of a piezoelectric transducer. J. Acoust. Soc. Am. 1964, 36, 1872–1880. [Google Scholar] [CrossRef]
- Wu, L.; Chen, Y.C. PSPICE approach for designing the ultrasonic piezoelectric transducer for medical diagnostic applications. Sens. Actuators A Phys. 1999, 75, 186–198. [Google Scholar] [CrossRef]
- Castillo, M.; Acevedo, P.; Moreno, E. KLM model for lossy piezoelectric transducers. Ultrasonics 2003, 41, 671–679. [Google Scholar] [CrossRef]
- Lockwood, G.R.; Foster, F.S. Modeling and optimization of high-frequency ultrasound transducers. IEEE Trans. Ultrason. Ferroelectr. Freq. Control 1994, 41, 225–230. [Google Scholar] [CrossRef]
- Jin, H.; Dong, S.R.; Luo, J.K.; Milne, W.I. Generalised Butterworth-Van Dyke equivalent circuit for thin-film bulk acoustic resonator. Electron. Lett. 2011, 47, 424–426. [Google Scholar] [CrossRef]
- PiezoCAD™—Sonic Concepts. Available online: http://sonicconcepts.com/software/ (accessed on 12 December 2018).
- Quite Universal Circuit Simulator. Available online: http://qucs.sourceforge.net/ (accessed on 28 October 2018).
- OrCAD PSpice A/D. Available online: https://www.ema-eda.com/products/cadence-orcad/pspice-a-d (accessed on 28 October 2018).
- An, J.; Song, K.; Zhang, S.; Yang, J.; Cao, P. Design of a broadband electrical impedance matching network for piezoelectric ultrasound transducers based on a genetic algorithm. Sensors 2014, 14, 6828–6843. [Google Scholar] [CrossRef] [PubMed]
- Newnham, R.E.; Zhang, J.; Meyer, R., Jr. Cymbal transducers: A review. In Proceedings of the IEEE 12th IEEE International Symposium on Applications of Ferroelectrics, Honolulu, HI, USA, 21 July–2 August 2000. [Google Scholar]
- Lee, Y.C.; Lin, Z. Miniature piezoelectric conical transducer: Fabrication, evaluation and application. Ultrasonics 2006, 44, e693–e697. [Google Scholar] [CrossRef] [PubMed]
- Qiu, Y.; Gigliotti, J.V.; Wallace, M.; Griggio, F.; Demore, C.E.M.; Cochran, S.; Trolier-McKinstry, S. Piezoelectric micromachined ultrasound transducer (PMUT) arrays for integrated sensing, actuation and imaging. Sensors 2015, 15, 8020–8041. [Google Scholar] [CrossRef] [PubMed]
- Xu, L.; Cao, J.; Huang, D. Design and characterization of a PVDF ultrasonic acoustic transducer applied in audio beam loudspeaker. In Proceedings of the IEEE International Conference Mechatronics and Automation, Niagara Falls, ON, Canada, 29 July–1 August 2005. [Google Scholar]
- Pavlin, C.J.; Foster, F.S. ULTRASOUND BIOMICROSCOPY: High-frequency ultrasound imaging of the eye at microscopic resolution. Radiol. Clin. N. Am. 1998, 36, 1047–1058. [Google Scholar] [CrossRef]
- Pandian, N.G.; Weintraub, A.; Kreis, A.; Schwartz, S.L.; Konstam, M.A.; Salem, D.N. Intracardiac, intravascular, two-dimensional, high frequency ultrasound imaging of pulmonary artery and its branches in humans and animals. Circulation 1990, 81, 2007–2012. [Google Scholar] [CrossRef] [PubMed]
- Sahai, A.V.; Zimmerman, M.; Aabakken, L.; Tarnasky, P.R.; Cunningham, J.T.; van Velse, A.; Hawes, R.H.; Hoffman, B.J. Prospective assessment of the ability of endoscopic ultrasound to diagnose, exclude, or establish the severity of chronic pancreatitis found by endoscopic retrograde cholangiopancreatography. Gastrointest. Endosc. 1998, 48, 18–25. [Google Scholar] [CrossRef]
- Turnbull, D.H.; Starkoski, B.G.; Harasiewicz, K.A.; Semple, J.L.; From, L.; Gupta, A.K.; Sauder, D.N.; Stuart Foster, F. A 40–100 MHz B-scan ultrasound backscatter microscope for skin imaging. Ultrasound Med. Biol. 1995, 21, 79–88. [Google Scholar] [CrossRef]
- Lockwood, G.R.; Turnball, D.H.; Christopher, D.A.; Foster, F.S. Beyond 30 MHz [applications of high-frequency ultrasound imaging]. IEEE Eng. Med. Biol. Mag. 1996, 15, 60–71. [Google Scholar] [CrossRef]
- Jian, X.; Han, Z.; Liu, P.; Xu, J.; Li, Z.; Shao, W.; Cui, Y. A high frequency geometric focusing transducer based on 1–3 piezocomposite for intravascular ultrasound imaging. BioMed. Res. Int. 2017, 2017, 1–8. [Google Scholar] [CrossRef]
- Hoskins, P.R.; Martin, K.; Thrush, A. Diagnostic Ultrasound: Physics and Equipment; Cambridge Univ. Press: Cambridge, UK, 2010. [Google Scholar]
- Cannata, J.M.; Ritter, T.A.; Chen, W.H.; Silverman, R.H.; Shung, K.K. Design of efficient, broadband single-element (20–80 MHz) ultrasonic transducers for medical imaging applications. IEEE Trans. Ultrason. Ferroelectr. Freq. Control 2003, 50, 1548–1557. [Google Scholar] [CrossRef]
- Giridhara, G.; Rathod, V.T.; Naik, S.; Roy Mahapatra, D.; Gopalakrishnan, S. Rapid localization of damage using a circular sensor array and Lamb wave based triangulation. Mech. Syst. Sig. Process. 2010, 24, 2929–2946. [Google Scholar] [CrossRef]
- Gholizadeh, S. A review of non-destructive testing methods of composite materials. Procedia Struct. Integr. 2016, 1, 50–57. [Google Scholar] [CrossRef]
- Chillara, V.K.; Lissenden, C.J. Review of nonlinear ultrasonic guided wave nondestructive evaluation: Theory, numerics, and experiments. Opt. Eng. 2015, 55, 011002. [Google Scholar] [CrossRef]
- Jain, A.; Kumar, J.S.; Srikanth, S.; Rathod, V.T.; Roy Mahapatra, D. Sensitivity of polyvinylidene fluoride films to mechanical vibration modes and impact after optimizing stretching conditions. Polym. Eng. Sci. 2013, 53, 707–715. [Google Scholar] [CrossRef]
- Rathod, V.T.; Swamy, J.K.; Jain, A. Polymer and ceramic nanocomposites for aerospace applications. Appl. Nanosci. 2017, 7, 519–548. [Google Scholar] [CrossRef]
- Tam, J.H.; Ong, Z.C.; Ismail, Z.; Ang, B.C.; Khoo, S.Y. Identification of material properties of composite materials using nondestructive vibrational evaluation approaches: A review. Mech. Adv. Mater. Struct. 2017, 24, 971–986. [Google Scholar] [CrossRef]
- Rathod, V.T.; Swamy, J.K.; Jain, A.; Roy Mahapatra, D. Ultrasonic Lamb wave sensitivity of P(VDF-TrFE) thin films. ISSS J. Micro Smart Sys. 2018, 7, 35–43. [Google Scholar] [CrossRef]
- Rathod, V.T.; Jain, A. Ultrasonic guided wave sensitivity of piezopolymer films subjected to thermal exposure. ISSS J. Micro Smart Syst. 2018, 7, 15–24. [Google Scholar] [CrossRef]
- Rathod, V.T.; Jeyaseelan, A.A.; Dutta, S.; Roy Mahapatra, D. Ultrasonic guided wave sensing characteristics of large area thin piezo coating. Smart Mater. Struct. 2017, 26, 105009. [Google Scholar] [CrossRef]
- Rathod, V.T.; Roy Mahapatra, D. Lamb wave based monitoring of plate-stiffener debonding using a circular array of piezoelectric sensors. Int. J. Smart Sens. Intell. Syst. 2010, 3, 27–44. [Google Scholar]
- Legg, M.; Yücel, M.K.; Kappatos, V.; Selcuk, C.; Gan, T.H. Increased range of ultrasonic guided wave testing of overhead transmission line cables using dispersion compensation. Ultrasonics 2015, 62, 35–45. [Google Scholar] [CrossRef] [PubMed]
- Yuan, S.; Mei, H.; Qiu, L.; Ren, Y. On a digital wireless impact-monitoring network for large-scale composite structures. Smart Mater. Struct. 2014, 23, 085007. [Google Scholar] [CrossRef]
- Ren, Y.; Yuan, S.; Qiu, L.; Mei, H. Impact localization by a multi-radio sink–based wireless sensor network for large-scale structures. Adv. Struct. Eng. 2016, 20, 157–169. [Google Scholar] [CrossRef]
- Davidsen, R.E.; Jensen, J.A.; Smith, S.W. Two-dimensional random arrays for real time volumetric imaging. Ultrason. Imaging 1994, 16, 143–163. [Google Scholar] [CrossRef] [PubMed]
- Wildes, D.G.; Chiao, R.Y.; Daft, C.M.W.; Rigby, K.W.; Smith, L.S.; Thomenius, K.E. Elevation performance of 1.25D and 1.5D transducer arrays. IEEE Trans. Ultrason. Ferroelectr. Freq. Control 1997, 44, 1027–1037. [Google Scholar] [CrossRef]
- Yuan, S.; Ren, Y.; Qiu, L.; Mei, H. A multi-response-based wireless impact monitoring network for aircraft composite structures. IEEE Trans. Ind. Electron. 2016, 63, 7712–7722. [Google Scholar] [CrossRef]
- Ramesh, R.; Ebenezer, D.D. Equivalent circuit for broadband underwater transducers. IEEE Trans. Ultrason. Ferroelectr. Freq. Control 2008, 55, 2079–2083. [Google Scholar] [CrossRef]
- Roes, M.G.L.; Duarte, J.L.; Hendrix, M.A.M.; Lomonova, E.A. Acoustic energy transfer: A review. IEEE Trans. Ind. Electron. 2013, 60, 242–248. [Google Scholar] [CrossRef]
- Qiu, L.; Deng, X.; Yuan, S.; Huang, Y.; Ren, Y. Impact monitoring for aircraft smart composite skins based on a lightweight sensor network and characteristic digital sequences. Sensors 2018, 17, 2218. [Google Scholar] [CrossRef]
- Wildes, D.; Lee, W.; Haider, B.; Cogan, S.; Sundaresan, K.; Mills, D.M.; Yetter, C.; Hart, P.H.; Haun, C.R.; Concepcion, M.; et al. 4-D ICE: A 2-D array transducer with integrated ASIC in a 10-Fr catheter for real-time 3-D intracardiac echocardiography. IEEE Trans. Ultrason. Ferroelectr. Freq. Control 2016, 63, 2159–2173. [Google Scholar] [CrossRef]
- Chen, C.; Raghunathan, S.B.; Yu, Z.; Shabanimotlagh, M.; Chen, Z.; Chang, Z.Y.; Blaak, S.; Prins, C.; Ponte, J.; Noothout, E.; et al. A prototype PZT matrix transducer with low-power integrated receive ASIC for 3-D transesophageal echocardiography. IEEE Trans. Ultrason. Ferroelectr. Freq. Control 2016, 63, 47–59. [Google Scholar] [CrossRef] [PubMed]
- Daeichin, V.; Chen, C.; Ding, Q.; Wu, M.; Beurskens, R.; Springeling, G.; Noothout, E.; Verweij, M.D.; van Dongen, K.W.; Bosch, J.G.; et al. A broadband Polyvinylidene difluoride-based hydrophone with integrated readout circuit for intravascular photoacoustic imaging. Ultrasound Med. Biol. 2016, 42, 1239–1243. [Google Scholar] [CrossRef] [PubMed]
- Daft, C.; Wagner, P.; Bymaster, B.; Panda, S.; Patel, K.; Ladabaum, I. cMUTs and electronics for 2D and 3D imaging: Monolithic integration, in-handle chip sets and system implications. In Proceedings of the IEEE Ultrasonics Symposium, Rotterdam, The Netherlands, 18–21 September 2005. [Google Scholar]
- Ismail, Y.I.; Friedman, E.G. Basic transmission line theory. In On-Chip Inductance in High Speed Integrated Circuits; Springer: Boston, MA, USA, 2001; pp. 13–39. [Google Scholar]
- Meng, H.; Chen, S.; Guan, Y.L.; Law, C.L.; So, P.L.; Gunawan, E.; Lie, T.T. A transmission line model for high-frequency power line communication channel. In Proceedings of the International Conference on Power System Technology, Kunming, China, 13–17 October 2002. [Google Scholar]
- Jian, X.; Li, Z.; Han, Z.; Xu, J.; Liu, P.; Liu, F.; Cui, Y.; Huang, W. The study of cable effect on high-frequency ultrasound transducer performance. IEEE Sens. J. 2018, 18, 5265–5271. [Google Scholar] [CrossRef]
- Guru, B.S.; Hiziroglu, H.R. Electromagnetic Field Theory Fundamentals; Cambridge Univ. Press: Cambridge, UK, 2004. [Google Scholar]
- Van Kervel, S.J.H.; Thijssen, J.M. A calculation scheme for the optimum design of ultrasonic transducers. Ultrasonics 1983, 21, 134–140. [Google Scholar] [CrossRef]
- Peres, P.L.D.; de Souza, C.R.; Bonatti, I.S. ABCD matrix: A unique tool for linear two-wire transmission line modelling. Int. J. Electr. Eng. Educ. 2003, 40, 220–229. [Google Scholar] [CrossRef]
- Peres, P.L.D.; Bonatti, I.S.; Lopes, A. Transmission line modeling: A circuit theory approach. SIAM Rev. 1998, 40, 347–352. [Google Scholar] [CrossRef]
- Chen, X.; Li, G.; Mu, X.; Xu, K. The design of impedance matching between long cable and ultrasonic transducer under seawater. In Proceedings of the IECON 2016-42nd Annual Conference of the IEEE Industrial Electronics Society, Florence, Italy, 24–27 October 2016. [Google Scholar]
- Kino, G.S. Sound wave propagation. In Acoustic Waves: Devices, Imaging, and Analog Signal Processing; Prentice-Hall: Englewood Cliffs, NJ, USA, 1987. [Google Scholar]
- Zhou, Q.; Lau, S.; Wu, D.; Shung, K. Piezoelectric films for high frequency ultrasonic transducers in biomedical applications. Prog. Mater. Sci. 2011, 56, 139–174. [Google Scholar] [CrossRef]
- Rajan, K.K.; Shanthi, M.; Chang, W.S.; Jin, J.; Lim, L.C. Dielectric and piezoelectric properties of [0 0 1] and [0 1 1]-poled relaxor ferroelectric PZN–PT and PMN–PT single crystals. Sens. Actuators A Phys. 2007, 133, 110–116. [Google Scholar] [CrossRef]
- Lim, H.H.; Cannata, J.M.; Liu, R.; Chang, J.H.; Silverman, R.H.; Shung, K.K. 20 MHz/40 MHz dual element transducers for high frequency harmonic imaging. IEEE Trans. Ultrason. Ferroelectr. Freq. Control. 2008, 55, 2683–2691. [Google Scholar]
- Feng, G.H.; Sharp, C.C.; Zhou, Q.F.; Pang, W.; Kim, E.S.; Shung, K.K. Fabrication of MEMS ZnO domeshaped-diaphragm transducers for high-frequency ultrasonic imaging. J. Micromech. Microeng. 2005, 15, 586–590. [Google Scholar] [CrossRef]
- Sun, P.; Zhou, Q.; Zhu, B.; Wu, D.; Hu, C.; Cannata, J.M.; Tian, J.; Han, P.; Wang, G.; Shung, K.K. Design and fabrication of PIN-PMN-PT single-crystal high-frequency ultrasound transducers. IEEE Trans. Ultrason. Ferroelectr. Freq. Control 2009, 56, 2760–2763. [Google Scholar] [PubMed]
- Cannata, J.M.; Williams, J.A.; Zhang, L.; Hu, C.H.; Shung, K.K. A high-frequency linear ultrasonic array utilizing an interdigitally bonded 2-2 piezo-composite. IEEE Trans. Ultrason. Ferroelectr. Freq. Control 2011, 58, 2202–2212. [Google Scholar] [CrossRef] [PubMed]
- Rizzatto, G. Ultrasound transducers. Eur. J. Radiol. 1998, 27, S188–S195. [Google Scholar] [CrossRef]
- Nakazawa, M.; Kosugi, T.; Nagatsuka, H.; Maezawa, A.; Nakamura, K.; Ueha, S. Polyurea thin film ultrasonic transducers for nondestructive testing and medical imaging. IEEE Trans. Ultrason. Ferroelectr. Freq. Control 2007, 54, 2165–2174. [Google Scholar] [CrossRef] [PubMed]
- Smith, W.A. The application of 1-3 piezocomposites in acoustic transducers. In Proceedings of the IEEE 7th International Symposium on Applications of Ferroelectrics, Urbana-Champaign, IL, USA, 6–8 June 1990. [Google Scholar]
- Zhang, Z.; Li, F.; Chen, R.; Zhang, T.; Cao, X.; Zhang, S.; Shrout, T.R.; Zheng, H.; Shung, K.K.; Humayun, M.S.; et al. High-performance ultrasound needle transducer based on modified PMN-PT ceramic with ultrahigh clamped dielectric permittivity. IEEE Trans. Ultrason. Ferroelectr. Freq. Control 2018, 65, 223–230. [Google Scholar] [CrossRef] [PubMed]
- Hunt, J.W.; Arditi, M.; Foster, F.S. Ultrasound transducers for pulse-echo medical imaging. IEEE Trans. Biomed. Eng. 1983, BME-30, 453–481. [Google Scholar] [CrossRef]
- Li, G.; Qiu, W.; Zhang, Z.; Jiang, Q.; Su, M.; Cai, R.; Li, Y.; Cai, F.; Deng, Z.; Xu, D.; et al. Noninvasive ultrasonic neuromodulation in freely moving mice. IEEE Trans. Biomed. Eng. 2019, 66, 217–224. [Google Scholar] [CrossRef]
- Shung, K.K.; Zippuro, M. Ultrasonic transducers and arrays. IEEE Eng. Med. Biol. Mag. 1996, 15, 20–30. [Google Scholar] [CrossRef]
- Rhyne, T.L. Computer optimization of transducer transfer functions using constraints on bandwidth, ripple, and loss. IEEE Trans. Ultrason. Ferroelectr. Freq. Control 1996, 43, 1136–1149. [Google Scholar] [CrossRef]
- Ramos, A.; San Emeterio, J.L.; Sanz, P.T. Electrical matching effects on the piezoelectric transduction performance of a through transmission pulsed process. Ferroelectrics 1997, 202, 71–80. [Google Scholar] [CrossRef]
- Huang, X.; Chen, Y.; Knog, J.; Du, D. Design of power supply for ultrasonic vibration cutting. In Proceedings of the 13th IEEE Conference on Industrial Electronics and Applications (ICIEA), Wuhan, China, 31 May–2 June 2018. [Google Scholar]
- Desilets, C.S.; Fraser, J.D.; Kino, G.S. The design of efficient broad-band piezoelectric transducers. IEEE Trans. Sonics Ultrason. 1978, 25, 115–125. [Google Scholar] [CrossRef]
- Bronzino, J.D. The Biomedical Engineering Handbook; CRC Press: Boca Raton, FL, USA, 1994; pp. 1077–1092. [Google Scholar]
- Lewis, G.K., Jr.; Lewis, G.K., Sr.; Olbricht, W. Cost-effective broad-band electrical impedance spectroscopy measurement circuit and signal analysis for piezo-materials and ultrasound transducers. Meas. Sci. Technol. 2008, 19, 105102. [Google Scholar] [CrossRef] [PubMed]
- Peairs, D.M.; Park, G.; Inman, D.J. Improving accessibility of the impedance-based structural health monitoring method. J. Intell. Mater. Syst. Struct. 2004, 15, 129–139. [Google Scholar] [CrossRef]
- Cha, J.H.; Chang, J.H. Development of 15 MHz 2-2 piezo-composite ultrasound linear array transducers for ophthalmic imaging. Sens. Actuators A Phys. 2014, 217, 39–48. [Google Scholar] [CrossRef]
- Cha, J.H.; Kang, B.; Jang, J.; Chang, J.H. A 15-MHz 1–3 piezocomposite concave array transducer for ophthalmic imaging. IEEE Trans. Ultrason. Ferroelectr. Freq. Control 2015, 62, 1994–2004. [Google Scholar] [CrossRef] [PubMed]
- Yoon, S.; Williams, J.; Kang, B.J.; Yoon, C.; Cabrera-Munoz, N.; Jeong, J.S.; Lee, S.G.; Shung, K.K.; Kim, H.H. Angled-focused 45 MHz PMN-PT single element transducer for intravascular ultrasound imaging. Sens. Actuators A Phys. 2015, 228, 16–22. [Google Scholar] [CrossRef]
- Moon, J.Y.; Lee, J.; Chang, J.H. Electrical impedance matching networks based on filter structures for high frequency ultrasound transducers. Sens. Actuators A 2016, 251, 225–233. [Google Scholar] [CrossRef]
- Zhao, X.; Qian, T.; Mei, G.; Kwan, C.; Zane, R.; Walsh, C.; Paing, T.; Popovic, Z. Active health monitoring of an aircraft wing with an embedded piezoelectric sensor/actuator network: II. Wireless approaches. Smart Mater. Struct. 2007, 16, 1218–1225. [Google Scholar] [CrossRef]
- Krautkramer, J.; Krautkramer, H. Ultrasonic Testing of Materials; Springer: Berlin, Germany, 1983. [Google Scholar]
- Chen, W.K. Explicit formulas for the synthesis of optimum broad-band impedance-matching networks. IEEE Trans. Circuits Syst. 1977, 24, 157–169. [Google Scholar] [CrossRef]
- Augustine, L.J.; Andersen, J. An algorithm for the design of transformerless broadband equalizers of ultrasonic transducers. J. Acoust. Soc. Am. 1979, 66, 629–635. [Google Scholar] [CrossRef]
- Hjellen, G.A.; Andersen, J.; Sigelmann, R.A. Computer-aided design of ultrasonic transducers broadband matching networks. IEEE Trans. Sonics Ultrason. 1974, 21, 302–305. [Google Scholar] [CrossRef]
- Capineri, L.; Masotti, L.; Rinieri, M.; Rocchi, S. Ultrasonic transducer as a black-box: Equivalent circuit synthesis and matching network design. IEEE Trans. Ultrason. Ferroelectr. Freq. Control 1933, 40, 694–703. [Google Scholar] [CrossRef] [PubMed]
- Thurston, R.N. Effect of electrical and mechanical terminating resistances on loss and bandwidth according to the conventional equivalent circuit of a piezoelectric transducer. IRE Trans. Ultrason. Eng. 1960, UE-7, 16–25. [Google Scholar] [CrossRef]
- Ramos, A.; Sanz, P.T.; Montero, F.R. Broad-band driving of echographic arrays using 10 ns-500 V efficient pulse generators. Ultrasonics 1987, 25, 221–228. [Google Scholar] [CrossRef]
- Thijssen, J.M.; Verhoef, W.A.; Cloostermans, M.J. Optimization of ultrasonic transducers. Ultrasonics 1985, 23, 41–46. [Google Scholar] [CrossRef]
- Coates, R.; Mathams, R.F. Design of matching networks for acoustic transducers. Ultrasonics 1988, 26, 59–64. [Google Scholar] [CrossRef]
- Ramos, A.; San Emeterio, J.L.; Sanz, P.T. Improvement in transient piezoelectric responses of NDE transceivers using selective damping and tuning networks. IEEE Trans. Ultrason. Ferroelectr. Freq. Control 2000, 47, 826–835. [Google Scholar] [CrossRef]
- Ramos, A.; Montero de Espinosa, F.R.; Sanz, P.T.; Torregrosa, J.M. A 5 MHz high-voltage demultiplexed ultrasonic array system for rapid-scan testing of advanced materials. Sens. Actuators A 1993, 37–38, 385–390. [Google Scholar] [CrossRef]
- Lockwood, G.R.; Hunt, J.W.; Foster, F.S. The design of protection circuitry for high-frequency ultrasound systems. IEEE Trans. Ultrason. Ferroelectr. Freq. Control 1991, 38, 48–55. [Google Scholar] [CrossRef] [PubMed]
- Sanz, P.T.; Ramos, A.; San Emeterio, J.L. Distortions on the output waveforms of high-voltage spike generators induced from piezoelectric loads. Ferroelectrics 1999, 224, 47–54. [Google Scholar] [CrossRef]
- Ozeri, S.; Shmilovitz, D. Simultaneous backward data transmission and power harvesting in an ultrasonic transcutaneous energy transfer link employing acoustically dependent electric impedance modulation. Ultrasonics 2014, 54, 1929–1937. [Google Scholar] [CrossRef] [PubMed]
- Seo, D.; Carmena, J.M.; Rabaey, J.M.; Alon, E.; Maharbiz, M.M. Neural dust: An ultrasonic, low power solution for chronic brain-machine interfaces. arXiv, 2013; arXiv:1307.2196. [Google Scholar]
- Hashemi, S.S.; Sawan, M.; Savaria, Y. A high-efficiency low-voltage CMOS rectifier for harvesting energy in implantable devices. IEEE Trans. Biomed. Circuits Syst. 2012, 6, 326–335. [Google Scholar] [CrossRef] [PubMed]
- Khateb, F.; Vlassis, S. Low-voltage bulk-driven rectifier for biomedical applications. Microelectron. J. 2013, 44, 642–648. [Google Scholar] [CrossRef]
- Szarka, G.D.; Stark, B.H.; Burrow, S.G. Review of power conditioning for kinetic energy harvesting systems. IEEE Trans. Power Electron. 2011, 27, 803–815. [Google Scholar] [CrossRef]
- Charthad, J.; Weber, M.J.; Chang, T.C.; Arbabian, A. A mm-sized implantable medical device (IMD) with ultrasonic power transfer and a hybrid bi-directional data link. IEEE J. Solid-State Circuits 2015, 50, 1741–1753. [Google Scholar] [CrossRef]
- Chang, T.C.; Weber, M.J.; Wang, M.L.; Charthad, J.; Khuri-Yakub, B.T.; Arbabian, A. Design of tunable ultrasonic receivers for efficient powering of implantable medical devices with reconfigurable power loads. IEEE Trans. Ultrason. Ferroelectr. Freq. Control 2016, 63, 1554–1562. [Google Scholar] [CrossRef]
- Lee, K.; Shao, H.; Weissleder, R.; Lee, H. Acoustic purification of extracellular microvesicles. ACS Nano 2015, 9, 2321–2327. [Google Scholar] [CrossRef]
- Rekhi, A.S.; Khuri-Yakub, B.T.; Arbabian, A. Wireless power transfer to millimeter-sized nodes using airborne ultrasound. IEEE Trans. Ultrason. Ferroelectr. Freq. Control 2017, 64, 1526–1541. [Google Scholar] [CrossRef]
- Ren, B.; Lissenden, C. Modeling guided wave excitation in plates with surface mounted piezoelectric elements: Coupled physics and normal mode expansion. Smart Mater. Struct. 2018, 27, 045014. [Google Scholar] [CrossRef]
- Sherrit, S.; Askins, S.A.; Gradziol, M.; Dolgin, B.P.; Bao, X.; Chang, Z.; Bar-Cohen, Y. Novel horn designs for ultrasonic/sonic cleaning welding, soldering, cutting and drilling. In Proceedings of the 9th Annual International Symposium on Smart Structures and Materials, San Diego, CA, USA, 9 July 2002. [Google Scholar]
- Qiu, W.; Zhou, J.; Chen, Y.; Su, M.; Li, G.; Zhao, H.; Gu, X.; Meng, D.; Wang, C.; Xiao, Y.; et al. A portable ultrasound system for non-invasive ultrasonic neuro-stimulation. IEEE Trans. Neural Syst. Rehabil. Eng. 2017, 25, 2509–2515. [Google Scholar] [CrossRef] [PubMed]
- Kuo, L.W.; Chiu, L.C.; Lin, W.L.; Chen, J.J.; Dong, G.C.; Chen, S.F.; Chen, G.S. Development of an MRI-compatible high-intensity focused ultrasound phased array transducer dedicated for breast tumor treatment. IEEE Trans. Ultrason. Ferroelectr. Freq. Control 2018, 65, 1423–1432. [Google Scholar] [CrossRef] [PubMed]
- Lin, S.; Xu, J. Effect of the matching circuit on the electromechanical characteristics of sandwiched piezoelectric transducers. Sensors 2017, 17, 329. [Google Scholar] [CrossRef] [PubMed]
- Lee, J.; Shin, E.J.; Lee, C.; Chang, J.H. Development of dual-frequency oblong-shaped-focused transducers for intravascular ultrasound tissue harmonic imaging. IEEE Trans. Ultrason. Ferroelectr. Freq. Control 2018, 65, 1571–1582. [Google Scholar] [CrossRef] [PubMed]
- Dong, X.; Yuan, T.; Hu, M.; Shekhani, H.; Maida, Y.; Tou, T.; Uchino, K. Driving frequency optimization of a piezoelectric transducer and the power supply development. Rev. Sci. Instrum. 2016, 87, 105003. [Google Scholar] [CrossRef] [PubMed]
- Gaal, M.; Bartusch, J.; Dohse, E.; Schadow, F.; Köppe, E. Focusing of ferroelectret air-coupled ultrasound transducers. AIP Conf. Proc. 2016, 1706, 080001. [Google Scholar]
- Townsend, P.; Arms, S.W. Wireless sensor networks: Principles and applications. In Sensor Technology Handbook; Elsevier: New York, NY, USA, 2005; pp. 575–589. [Google Scholar]
- Zahedi, F.; Yao, J.; Huang, H. A passive wireless ultrasound pitch–catch system. Smart Mater. Struct. 2015, 24, 085030. [Google Scholar] [CrossRef]
- Sodano, H.A.; Park, G.; Inman, D.J. Estimation of electric charge output for piezoelectric energy harvesting. Strain 2004, 40, 49–58. [Google Scholar] [CrossRef]
- Ottman, G.K.; Hofmann, H.F.; Lesieutre, G.A. Optimized piezoelectric energy harvesting circuit using step-down converter in discontinuous conduction mode. IEEE Trans. Power Electron. 2002, 18, 696–703. [Google Scholar] [CrossRef]
- Li, T.; Chen, Y.; Ma, J. Development of a miniaturized piezoelectric ultrasonic transducer. IEEE Trans. Ultrason. Ferroelectr. Freq. Control 2009, 56, 649–659. [Google Scholar]
- Nishimura, T.; Hosaka, H.; Morita, T. Resonant-type smooth impact drive mechanism (SIDM) actuator using a bolt-clamped Langevin transducer. Ultrasonics 2012, 52, 75–80. [Google Scholar] [CrossRef] [PubMed]
- Butler, S.C. Triple-resonant transducers. IEEE Trans. Ultrason. Ferroelectr. Freq. Control 2012, 59, 1292–1300. [Google Scholar] [CrossRef] [PubMed]
- Uchino, K.; Zhuang, Y.; Ural, S.O. Loss determination methodology for a piezoelectric ceramic: New phenomenological theory and experimental proposals. J. Adv. Dielectr. 2011, 1, 17–31. [Google Scholar] [CrossRef]
- Hirose, S.; Aoyagi, M.; Tomikawa, Y.; Takahashi, S.; Uchino, K. High power characteristics at antiresonance frequency of piezoelectric transducers. Ultrasonics 1996, 34, 213–217. [Google Scholar] [CrossRef]
- Shekhani, H.N.; Uchino, K. Evaluation of the mechanical quality factor under high power conditions in piezoelectric ceramics from electrical power. J. Eur. Ceram. Soc. 2015, 35, 541–544. [Google Scholar] [CrossRef]
- Shi, W.; Zhao, H.; Ma, J.; Yao, Y.; Uchino, K. Investigating the frequency spectrum of mechanical quality factor for piezoelectric materials based on phenomenological model. Jpn. J. Appl. Phys. 2015, 54, 101501. [Google Scholar] [CrossRef]
- Shi, W.; Shekhani, H.N.; Zhao, H.; Ma, J.; Yao, Y.; Uchino, K. Losses in piezoelectrics derived from a new equivalent circuit. J. Electroceram. 2015, 35, 1–10. [Google Scholar] [CrossRef]
- Coates, R.; Maguire, P.T. Multiple-mode acoustic transducer calculations. IEEE Trans. Ultrason. Ferroelectr. Freq. Control 1989, 36, 471–473. [Google Scholar] [CrossRef]
- Bovtun, V.; Döring, J.; Wegener, M.; Bartusch, J.; Beck, U.; Erhard, A.; Borisov, V. Air-coupled ultrasonic applications of ferroelectrets. Ferroelectrics 2008, 370, 11–17. [Google Scholar] [CrossRef]
- Wang, Z.; Heath Martin, K.; Huang, W.; Dayton, P.A.; Jiang, X. Contrast enhanced superharmonic imaging for acoustic angiography using reduced form-factor lateral mode transmitters for intravascular and intracavity applications. IEEE Trans. Ultrason. Ferroelectr. Freq. Control. 2017, 64, 311–319. [Google Scholar] [CrossRef]
- Ohigashi, H.; Itoh, T.; Kimura, K.; Nakanishi, T.; Suzuki, M. Analysis of frequency response characteristics of polymer ultrasonic transducers. Jpn. J. Appl. Phys. 1988, 27, 354–360. [Google Scholar] [CrossRef]
- Brown, L.F. Design considerations for piezoelectric polymer ultrasound transducers. IEEE Trans. Ultrason. Ferroelectr. Freq. Control 2000, 47, 1377–1396. [Google Scholar] [CrossRef] [PubMed]
- Kim, M.G.; Choi, H.; Kim, H.H.; Shung, K.K. Bipolar pulse generator for very high frequency (>100 MHz) ultrasound applications. In Proceedings of the IEEE International Ultrasonics Symposium (IUS), Prague, Czech Republic, 21–25 July 2013. [Google Scholar]
- Silverman, R.H.; Lizzi, F.L.; Ursea, B.G.; Cozzarelli, L.; Ketterling, J.K.; Deng, C.X.; Folberg, R.; Colemen, D.J. Safety levels for exposure of cornea and lens to very high-frequency ultrasound. J. Ultrasound Med. 2001, 20, 979–986. [Google Scholar] [CrossRef] [PubMed]
- Hwang, J.Y.; Yoon, C.W.; Lim, H.G.; Park, J.; Yoon, S.; Lee, J.; Shung, K.K. Acoustic tweezers for studying intracellular calcium signaling in SKBR-3 human breast cancer cells. Ultrasonics 2015, 63, 94–101. [Google Scholar] [CrossRef] [PubMed]
- Hwang, J.Y.; Lin, H.G.; Yoon, C.W.; Lam, K.H.; Yoon, S.; Lee, C.; Chiu, C.T.; Kang, B.J.; Shung, K.K. Non-contact high-frequency ultrasound microbeam stimulation for studying mechanotransduction in human umbilical vein endothelial cells. Ultrasound Med. Biol. 2014, 40, 2172–2182. [Google Scholar] [CrossRef] [PubMed]
- Lee, J.; Teh, S.Y.; Lee, A.; Kim, H.H.; Lee, C.; Shung, K.K. Single beam acoustic trapping. Appl. Phys. Lett. 2009, 95, 1–3. [Google Scholar] [CrossRef] [PubMed]
- Lee, J.; Teh, S.Y.; Lee, A.; Kim, H.H.; Lee, C.; Shung, K.K. Transverse acoustic trapping using a Gaussian focused ultrasound. Ultrasound Med. Biol. 2010, 36, 350–355. [Google Scholar] [CrossRef] [PubMed]
- Stephen, N.G. On the maximum power transfer theorem within electromechanical systems. J. Mech. Eng. Sci. 2006, 220, 1261–1267. [Google Scholar] [CrossRef]
- Kong, S. A general maximum power transfer theorem. IEEE Trans. Educ. 1995, 38, 296–298. [Google Scholar] [CrossRef]
- Fiorillo, A.S.; Grimaldi, D.; Paolino, D.; Pullano, S.A. Low-frequency ultrasound in medicine: An in vivo evaluation. IEEE Trans. Instrum. Meas. 2012, 61, 1658–1663. [Google Scholar] [CrossRef]
Figure 1.
Block diagram of a two-port network for electric impedance matching showing the complex conjugate matching of source and load impedance with the two ports.
Figure 1.
Block diagram of a two-port network for electric impedance matching showing the complex conjugate matching of source and load impedance with the two ports.

Figure 2.
The EIMN design procedure using Smith chart (shown at the left) where the input electrical impedance of the ultrasonic transducer is moved toward the center of the Smith chart by appropriately adjusting the inductor and capacitor component values and topology, at the center frequency. Reproduced with permission from Reference [41], Copyright Elsevier, 2016.

Figure 3.
Electric Butterworth-Van-Dyke (BVD) model to represent an equivalent circuit of a single resonant frequency transducer [28,48].

Figure 4.
Electric Butterworth-Van-Dyke (BVD) model to represent an equivalent circuit of a multiple resonant frequency transducer [27].
Figure 4.
Electric Butterworth-Van-Dyke (BVD) model to represent an equivalent circuit of a multiple resonant frequency transducer [27].

Figure 5.
Impedance matching networks for cables (a) T-type and (b) П-type [95].
Figure 5.
Impedance matching networks for cables (a) T-type and (b) П-type [95].

Figure 6.
Electric impedance matching schemes for ultrasonic nondestructive evaluation system operating in pulse-echo and pitch-catch configurations.
Figure 6.
Electric impedance matching schemes for ultrasonic nondestructive evaluation system operating in pulse-echo and pitch-catch configurations.

Figure 7.
An equivalent circuit at series resonance being simplified assuming purely resistive output excitation and a low pass filter solution for electrical impedance matching circuit.
Figure 7.
An equivalent circuit at series resonance being simplified assuming purely resistive output excitation and a low pass filter solution for electrical impedance matching circuit.

Figure 8.
Block diagram representing an electric impedance matching network design process [27].
Figure 8.
Block diagram representing an electric impedance matching network design process [27].

Figure 9.
Schematic circuitry of the EIMN in the case where the electrical impedance magnitude of a system is larger than that of a transducer based on Low-pass (left) and high-pass (right) filter structures. and indicate series and parallel inductors and and are series and parallel capacitors [120].

Figure 10.
Equivalent circuit diagram representing the tuning of a piezoelectric transceiver for excitation and reception in a pitch-catch mode [131].
Figure 10.
Equivalent circuit diagram representing the tuning of a piezoelectric transceiver for excitation and reception in a pitch-catch mode [131].

Figure 11.
The predicted Lamb wave mode A0 and S0 amplitudes with (a) no matching network (b) matching at 0.35 MHz. Reproduced with permission from Reference [144], Copyright IOP, 2018.
Figure 11.
The predicted Lamb wave mode A0 and S0 amplitudes with (a) no matching network (b) matching at 0.35 MHz. Reproduced with permission from Reference [144], Copyright IOP, 2018.

Figure 12.
(a) Simulated impedance using PSPICE simulation software corresponding to an air-coupled ultrasonic transducer. (b) Simulated power using PSPICE simulation software corresponding to an air-coupled ultrasonic transducer with and without the matching circuit components. (c) Comparison of experimental signals received by a hydrophone due to excitation of an air-coupled transducer at 800 kHz with and without electrical impedance matching circuit. Reproduced from Reference [28] under a creative commons license from Elsevier.

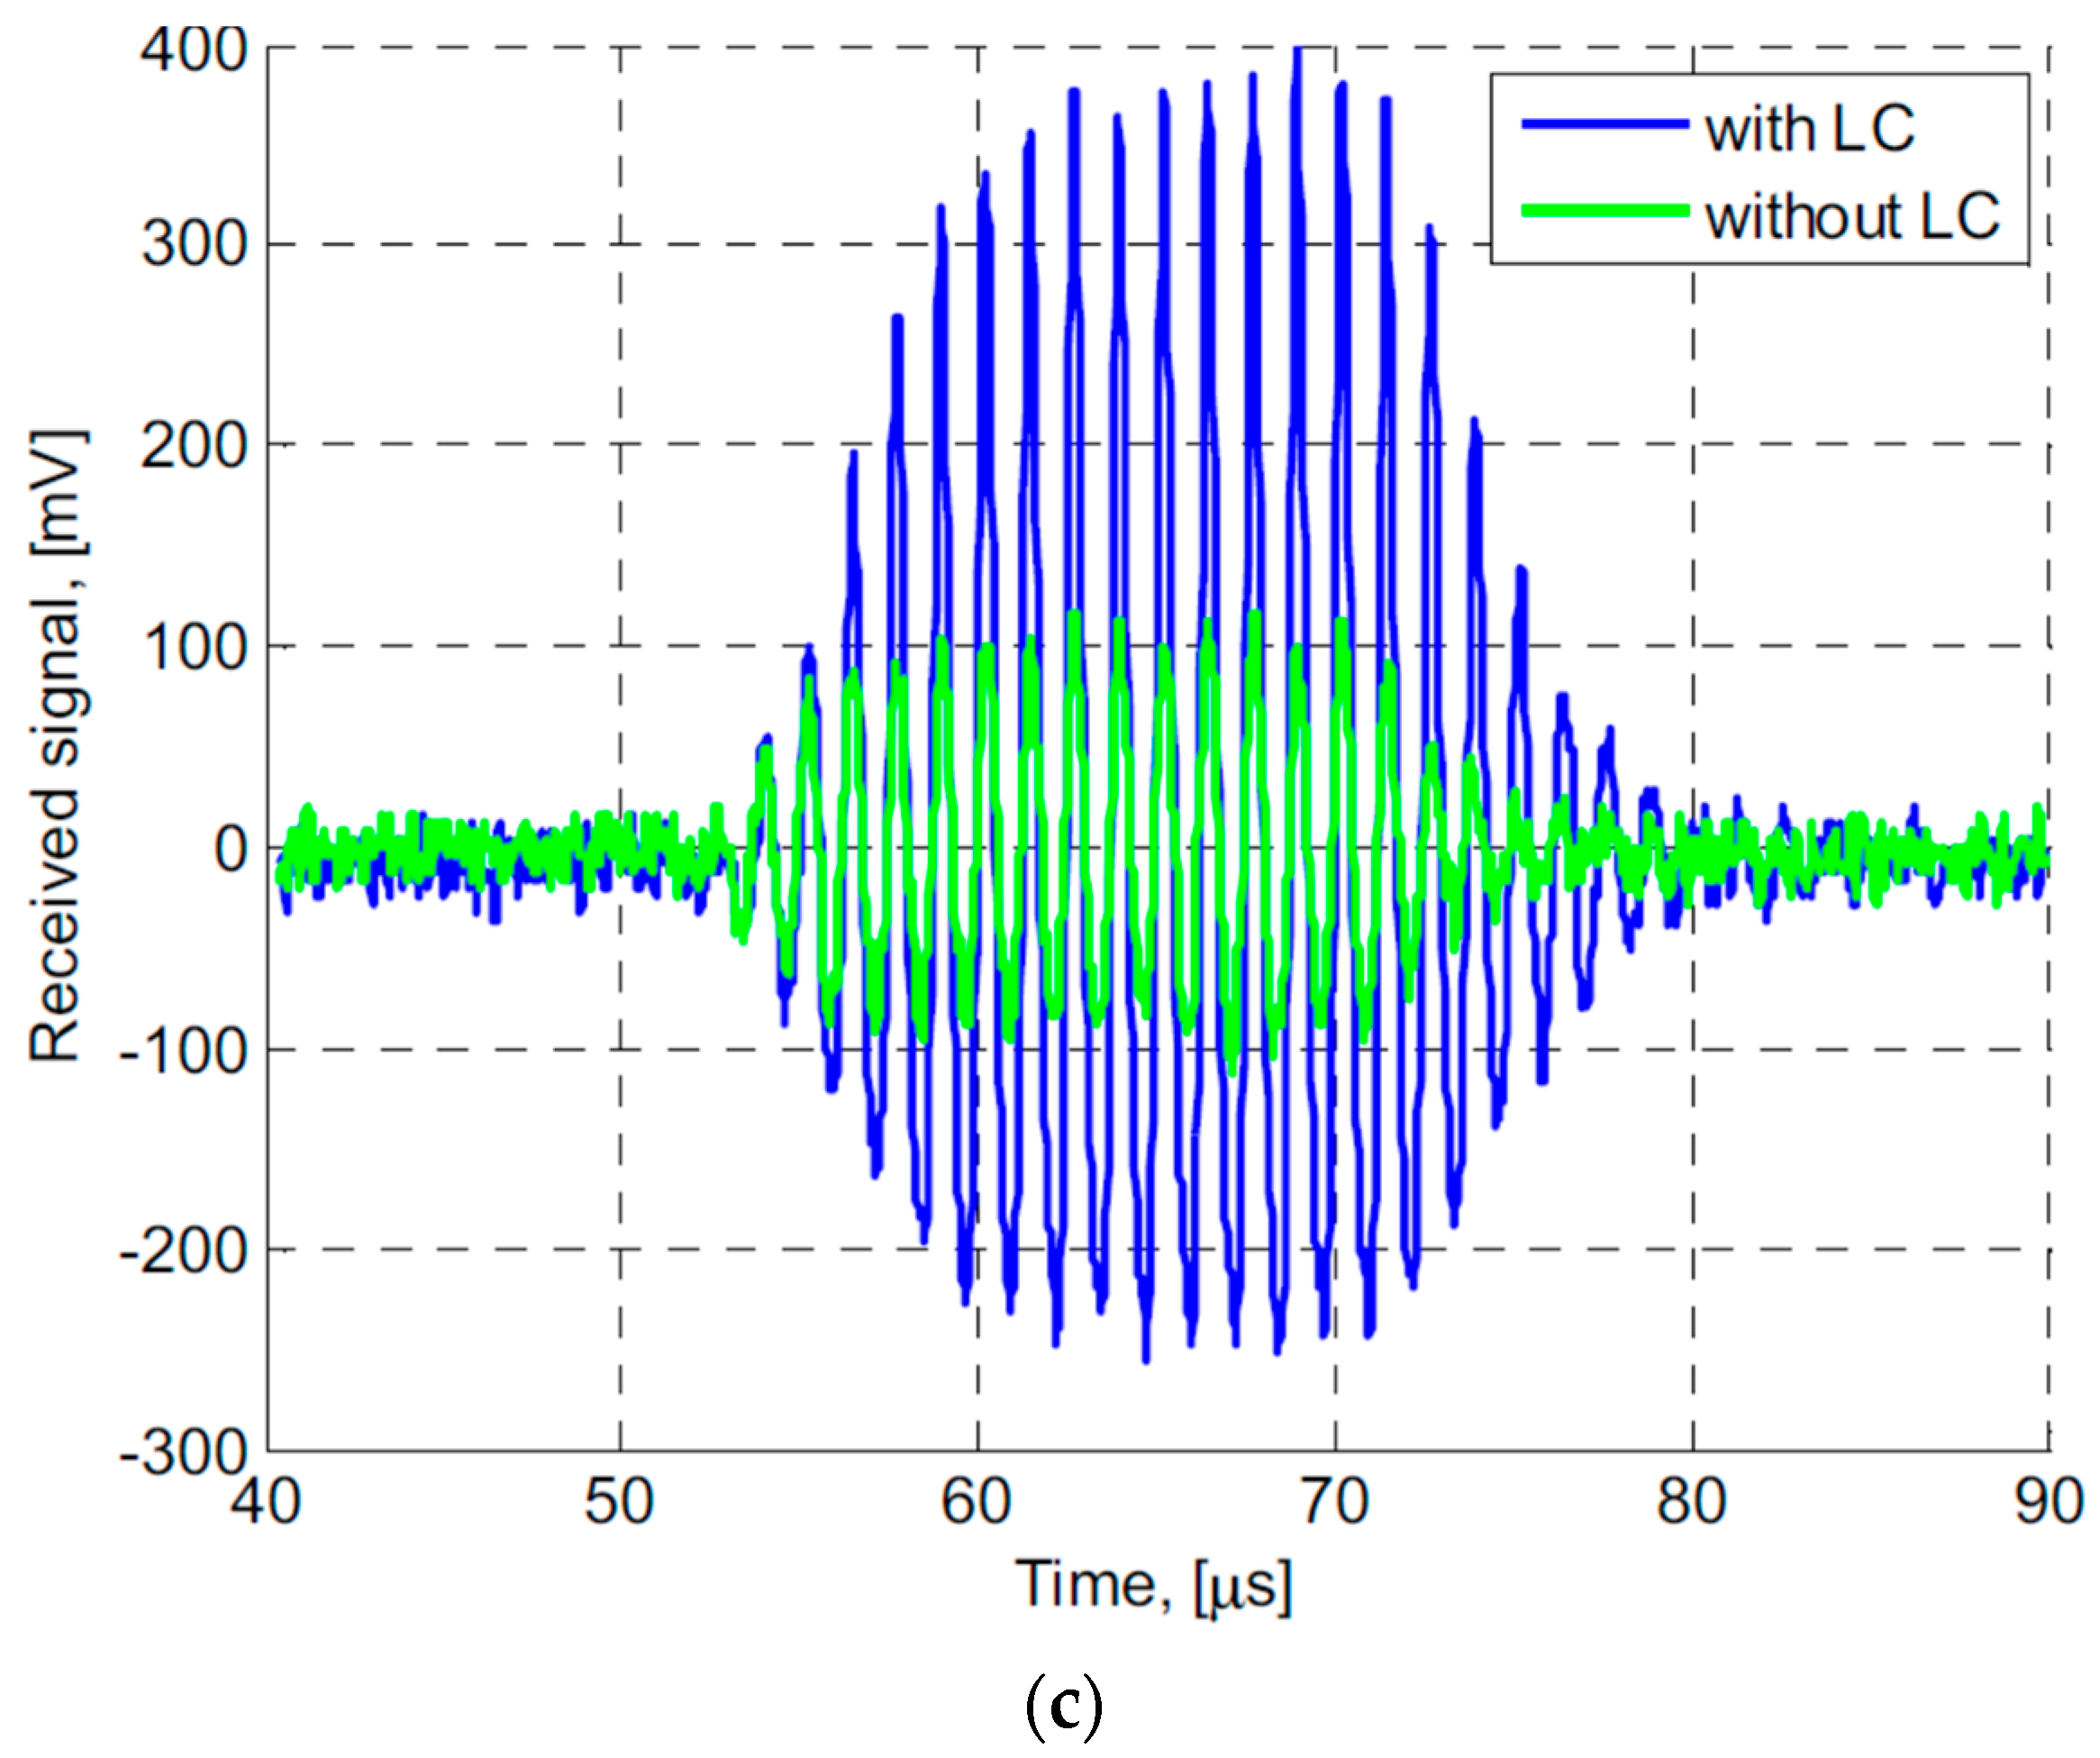
Figure 13.
Picture of EIMN with an ultrasonic transducer showing the printed circuit board (PCB) implemented with shunt capacitor of 100 pF and series inductor of 8 nH. Reproduced with permission from Reference [41], Copyright Elsevier, 2016.
Figure 13.
Picture of EIMN with an ultrasonic transducer showing the printed circuit board (PCB) implemented with shunt capacitor of 100 pF and series inductor of 8 nH. Reproduced with permission from Reference [41], Copyright Elsevier, 2016.

Figure 14.
Pulse-echo waveform and echo spectrum of the ultrasonic transducer with showing the pulse-echo measurement (a) without and (b) with impedance matching network respectively. Reproduced with permission from Reference [41], Copyright Elsevier, 2016.
Figure 14.
Pulse-echo waveform and echo spectrum of the ultrasonic transducer with showing the pulse-echo measurement (a) without and (b) with impedance matching network respectively. Reproduced with permission from Reference [41], Copyright Elsevier, 2016.

Figure 15.
Needle ultrasonic transducer with filter based electric impedance matching network. Reproduced with permission from Reference [120], Copyright Elsevier, 2016.
Figure 15.
Needle ultrasonic transducer with filter based electric impedance matching network. Reproduced with permission from Reference [120], Copyright Elsevier, 2016.

Figure 16.
Needle ultrasonic transducer with filter based electric impedance matching network. Reproduced with permission from Reference [120], Copyright Elsevier, 2016.
Figure 16.
Needle ultrasonic transducer with filter based electric impedance matching network. Reproduced with permission from Reference [120], Copyright Elsevier, 2016.

Figure 17.
Focusing transducer based on cellular polypropylene with an electric matching unit shown in the background for air-coupled ultrasonic testing. Reproduced with permission from Reference [151], Copyright AIP, 2016.
Figure 17.
Focusing transducer based on cellular polypropylene with an electric matching unit shown in the background for air-coupled ultrasonic testing. Reproduced with permission from Reference [151], Copyright AIP, 2016.

Figure 18.
Comparison of signals from air-coupled receivers due to leaky surface acoustic waves from a rail section, (a) without impedance matching and (b) with impedance matching. Reproduced with permission from Reference [13], Copyright ASCE, 2017.
Figure 18.
Comparison of signals from air-coupled receivers due to leaky surface acoustic waves from a rail section, (a) without impedance matching and (b) with impedance matching. Reproduced with permission from Reference [13], Copyright ASCE, 2017.

Figure 19.
Advantages of using electric impedance matching networks.


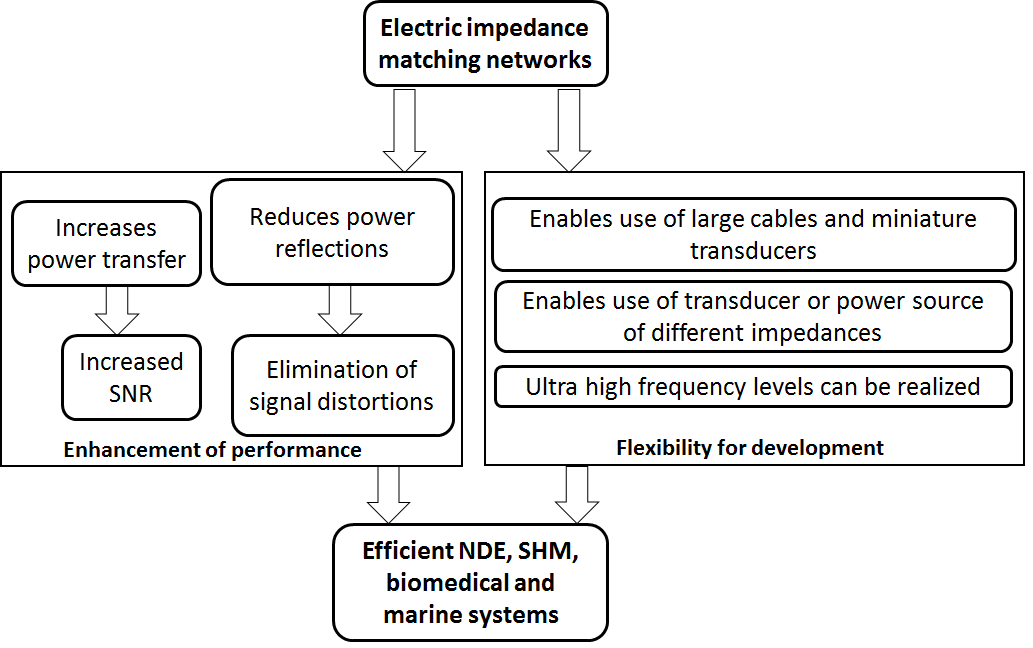
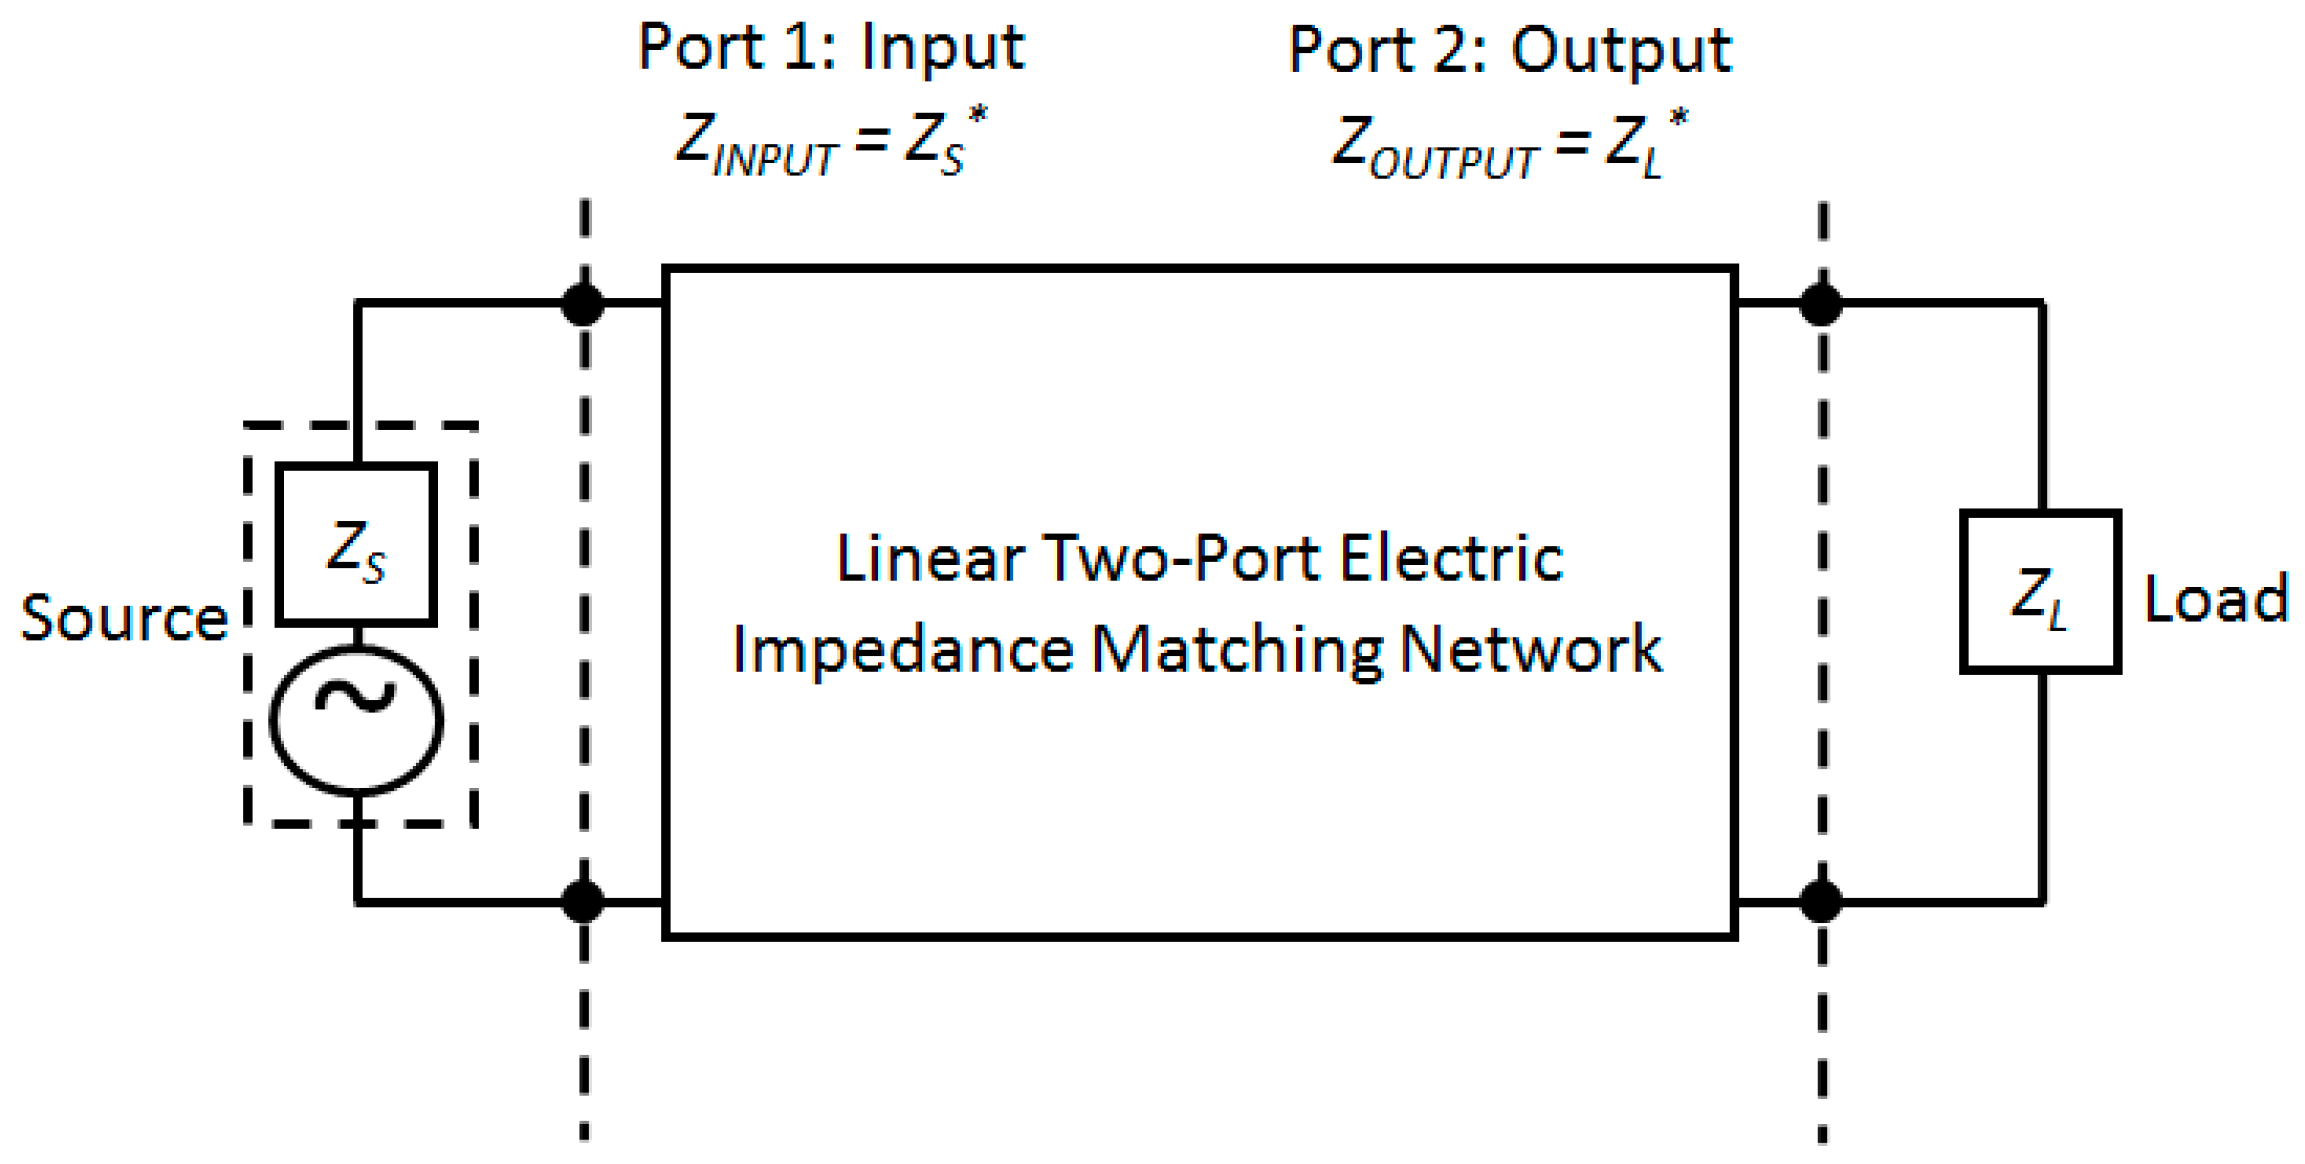
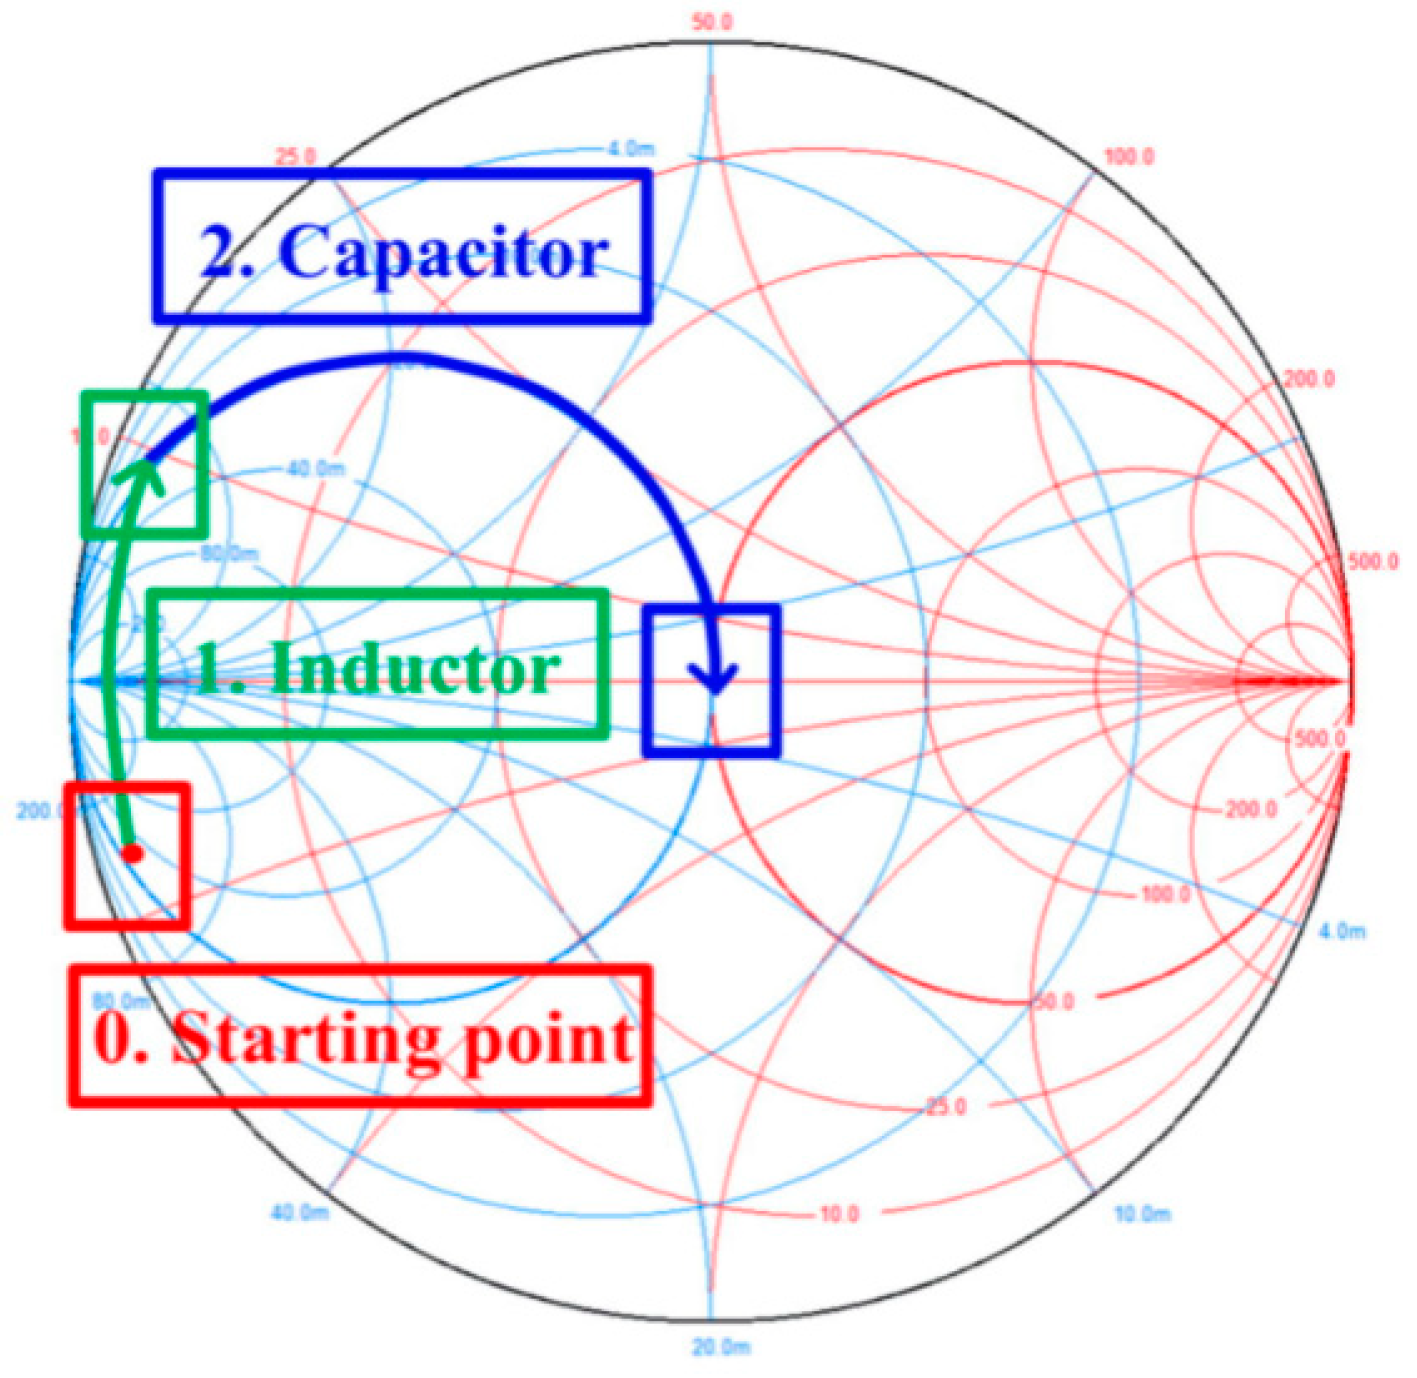
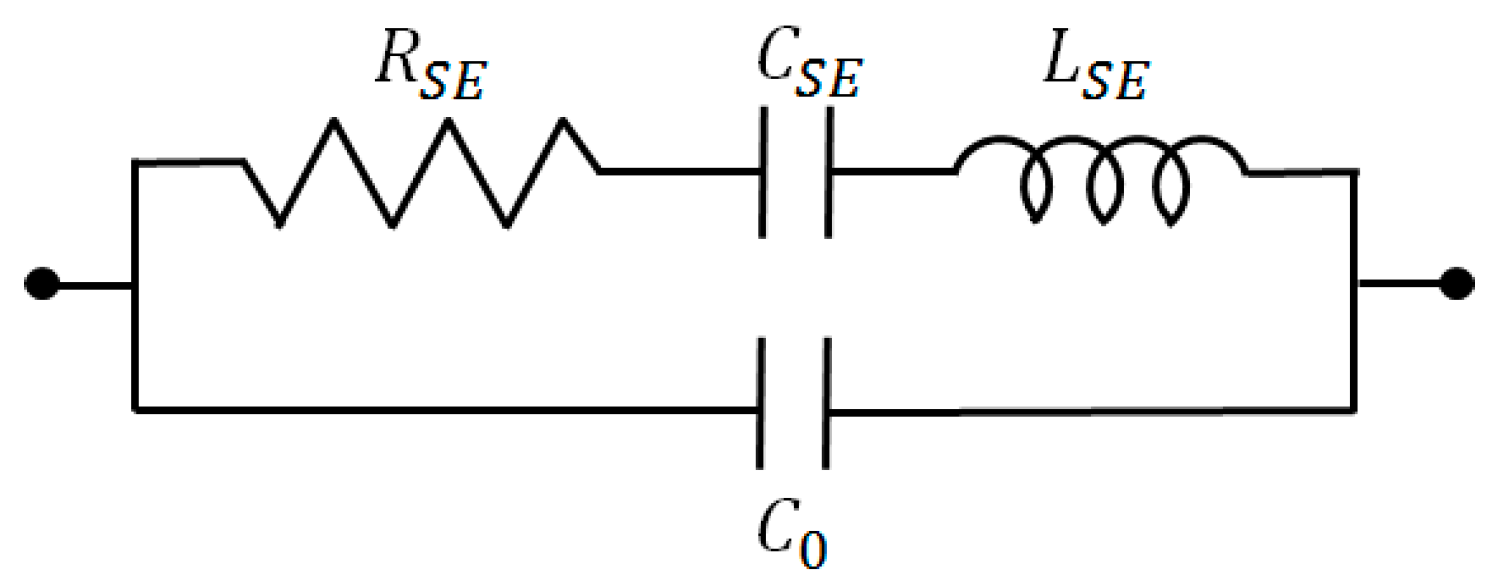
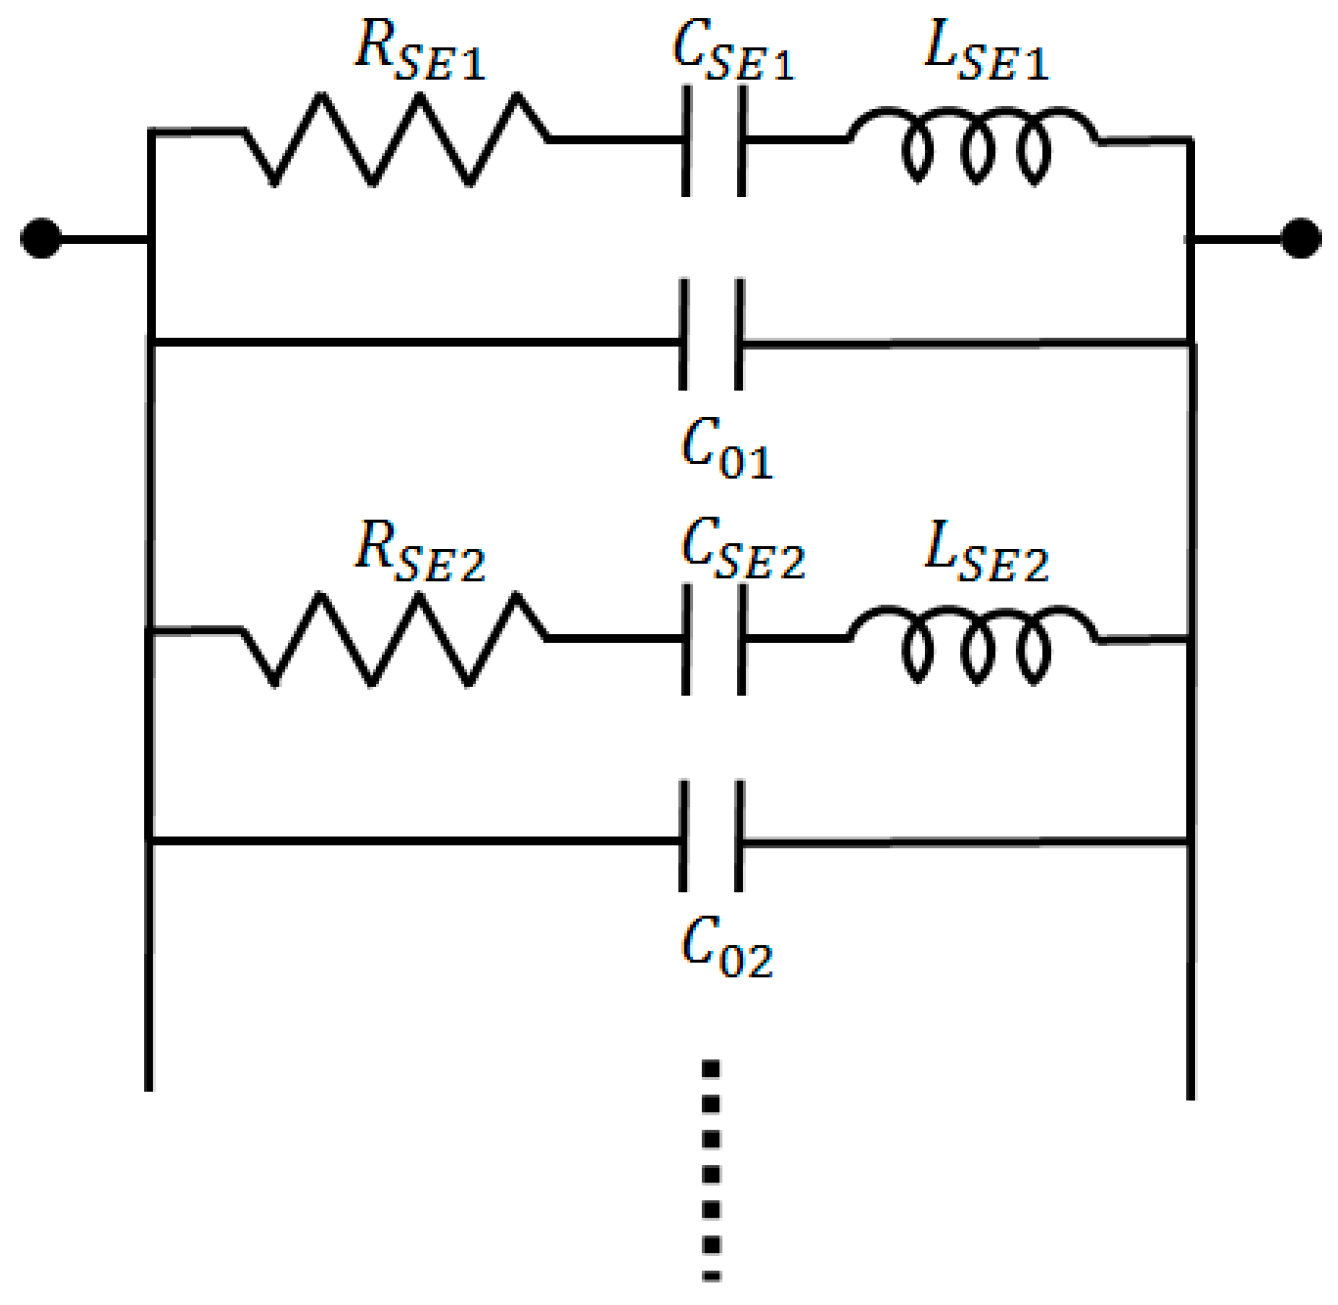
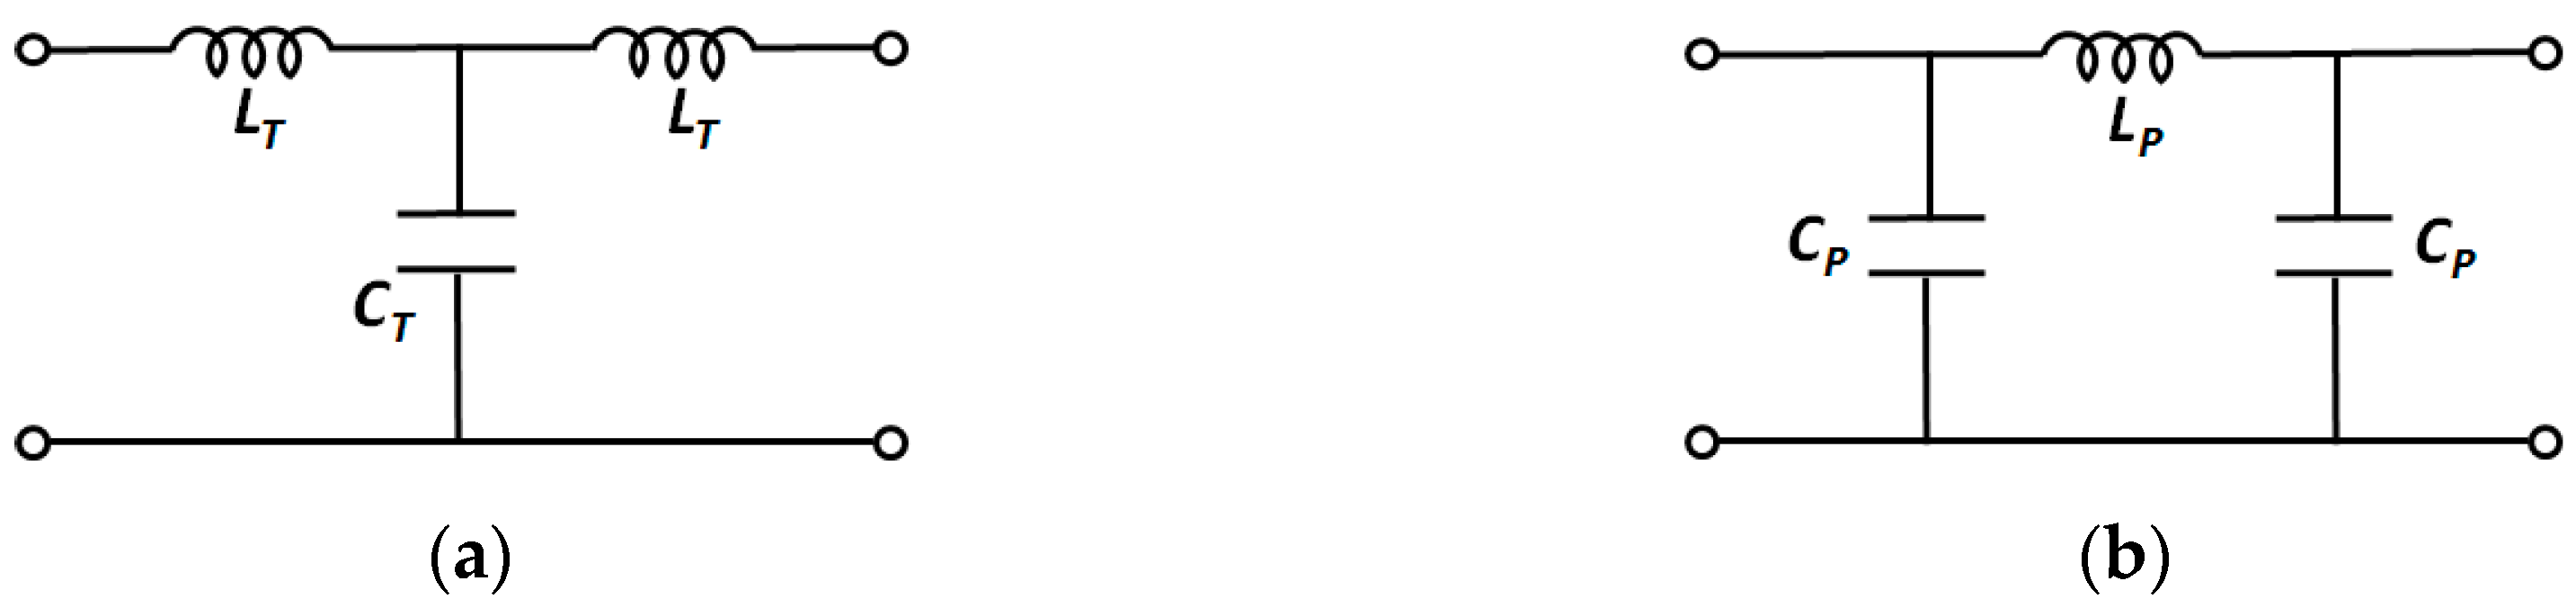
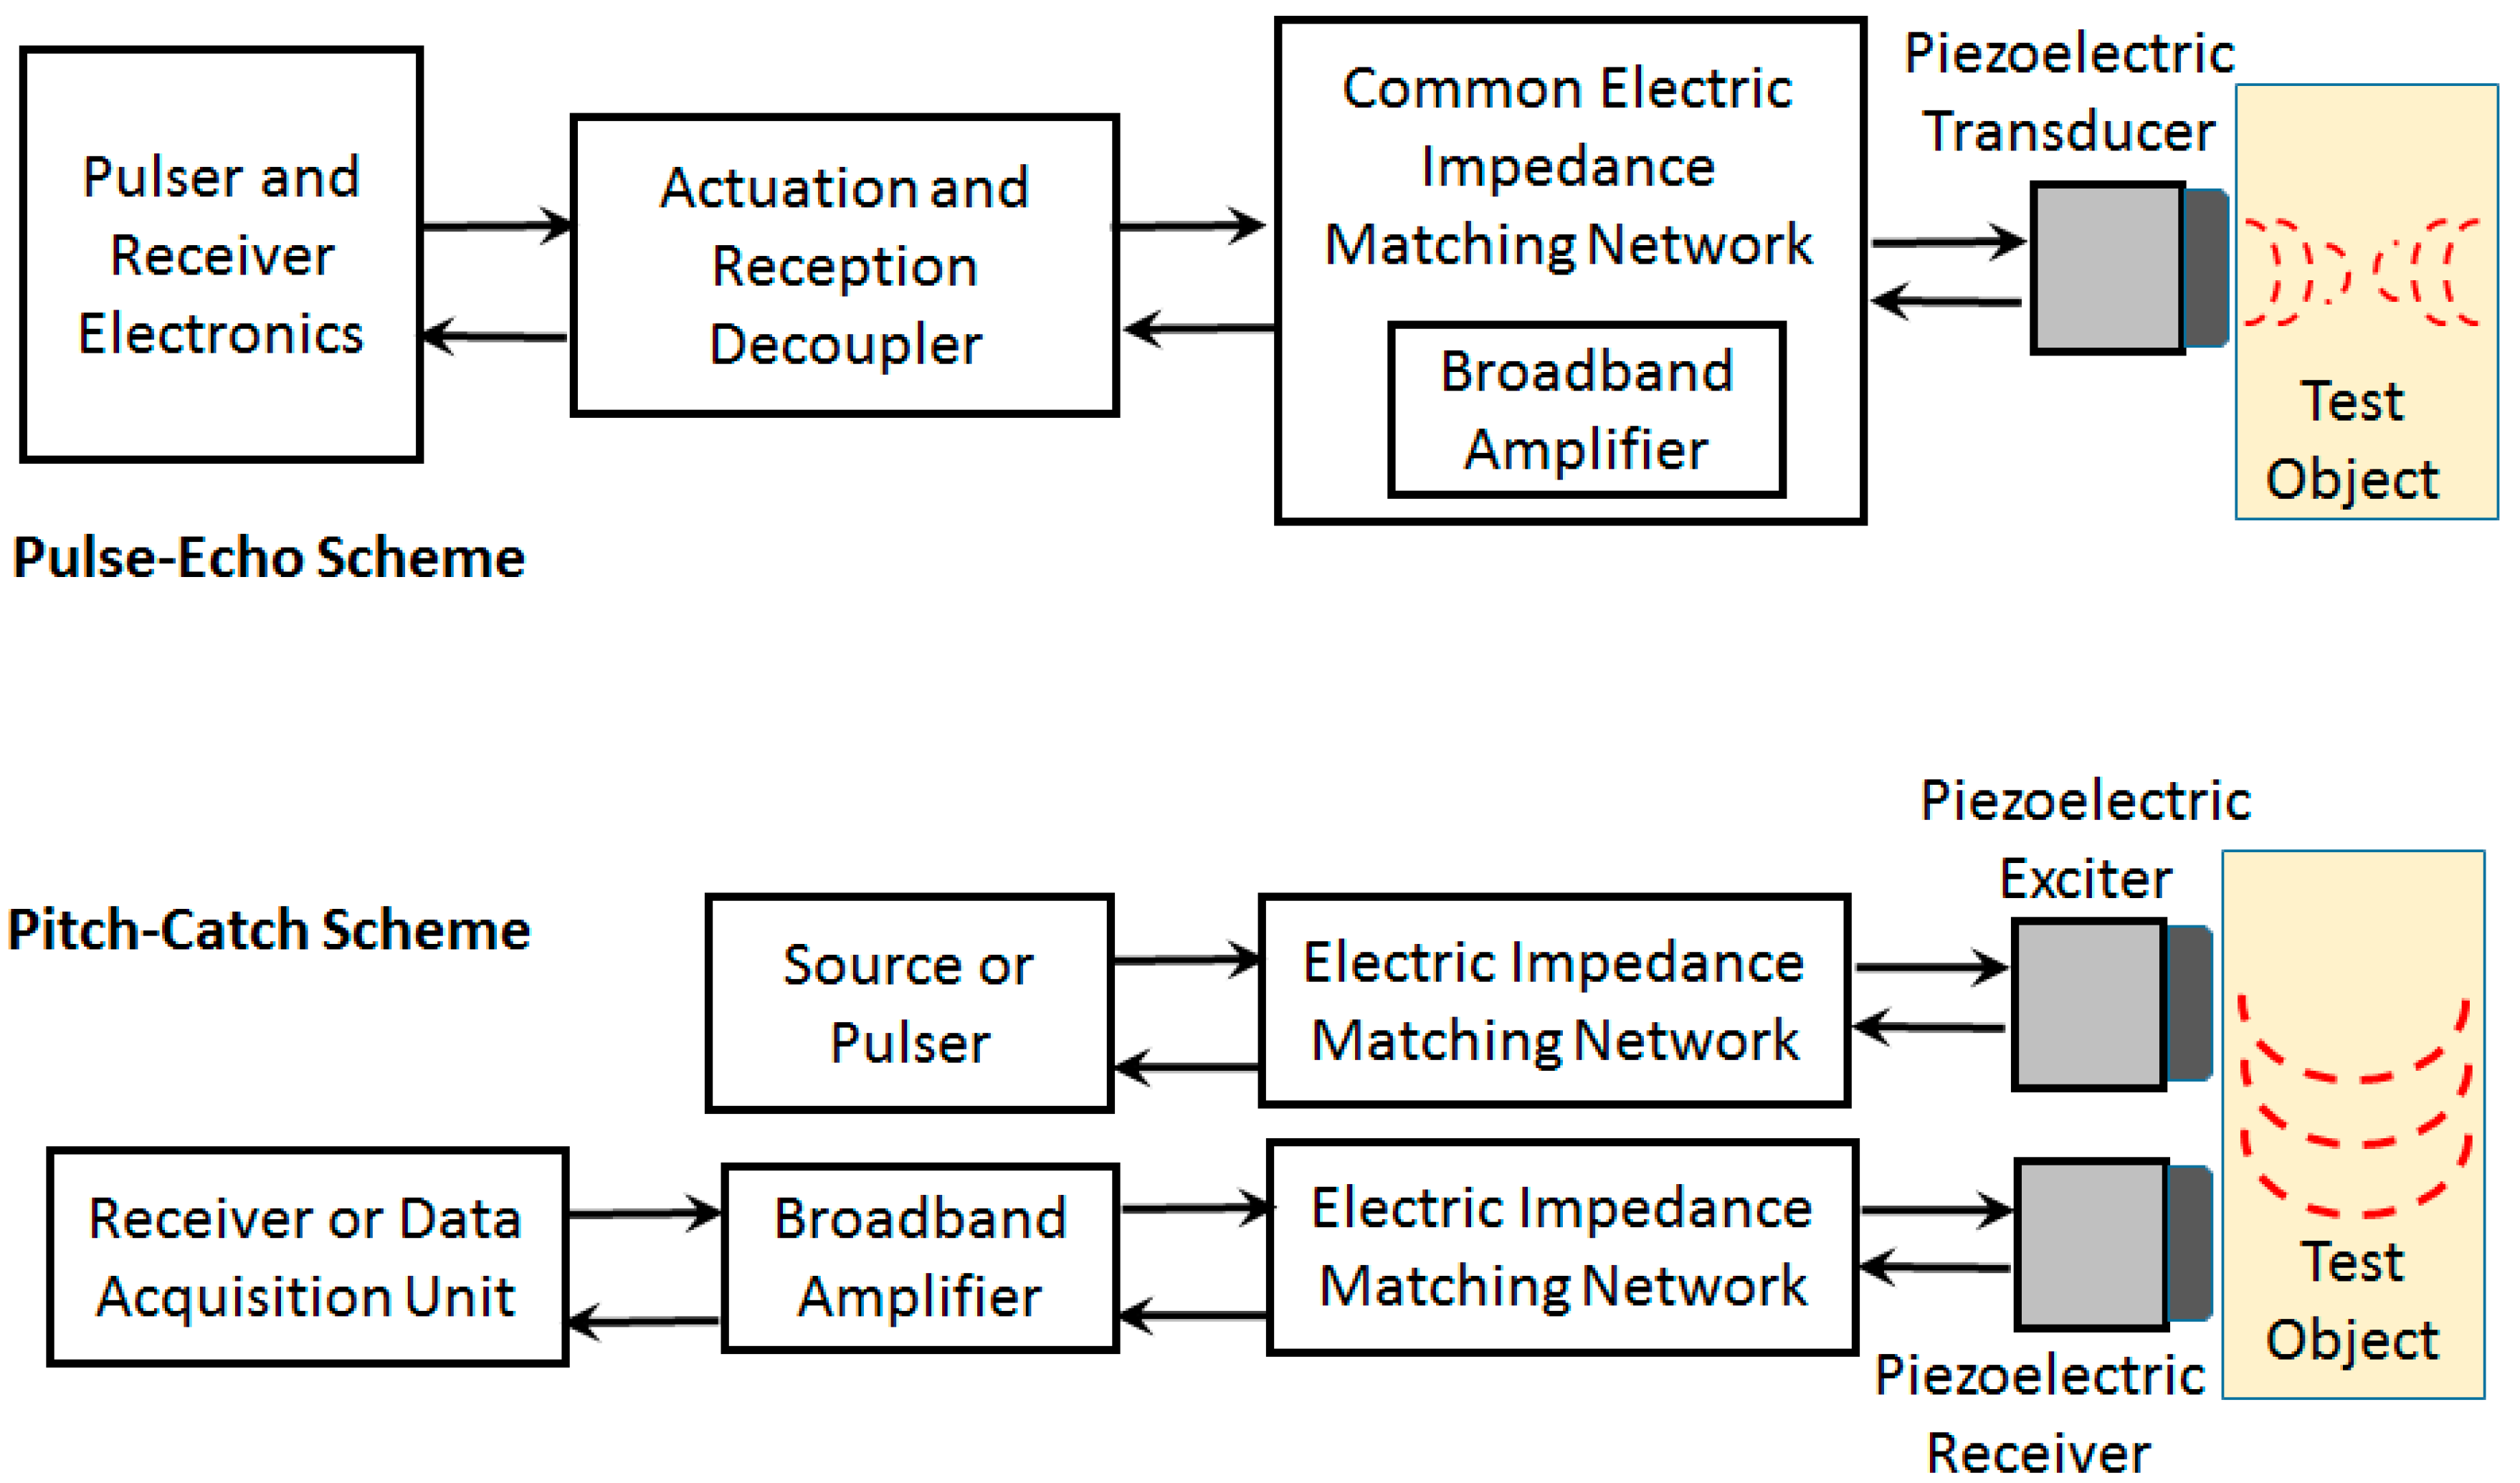
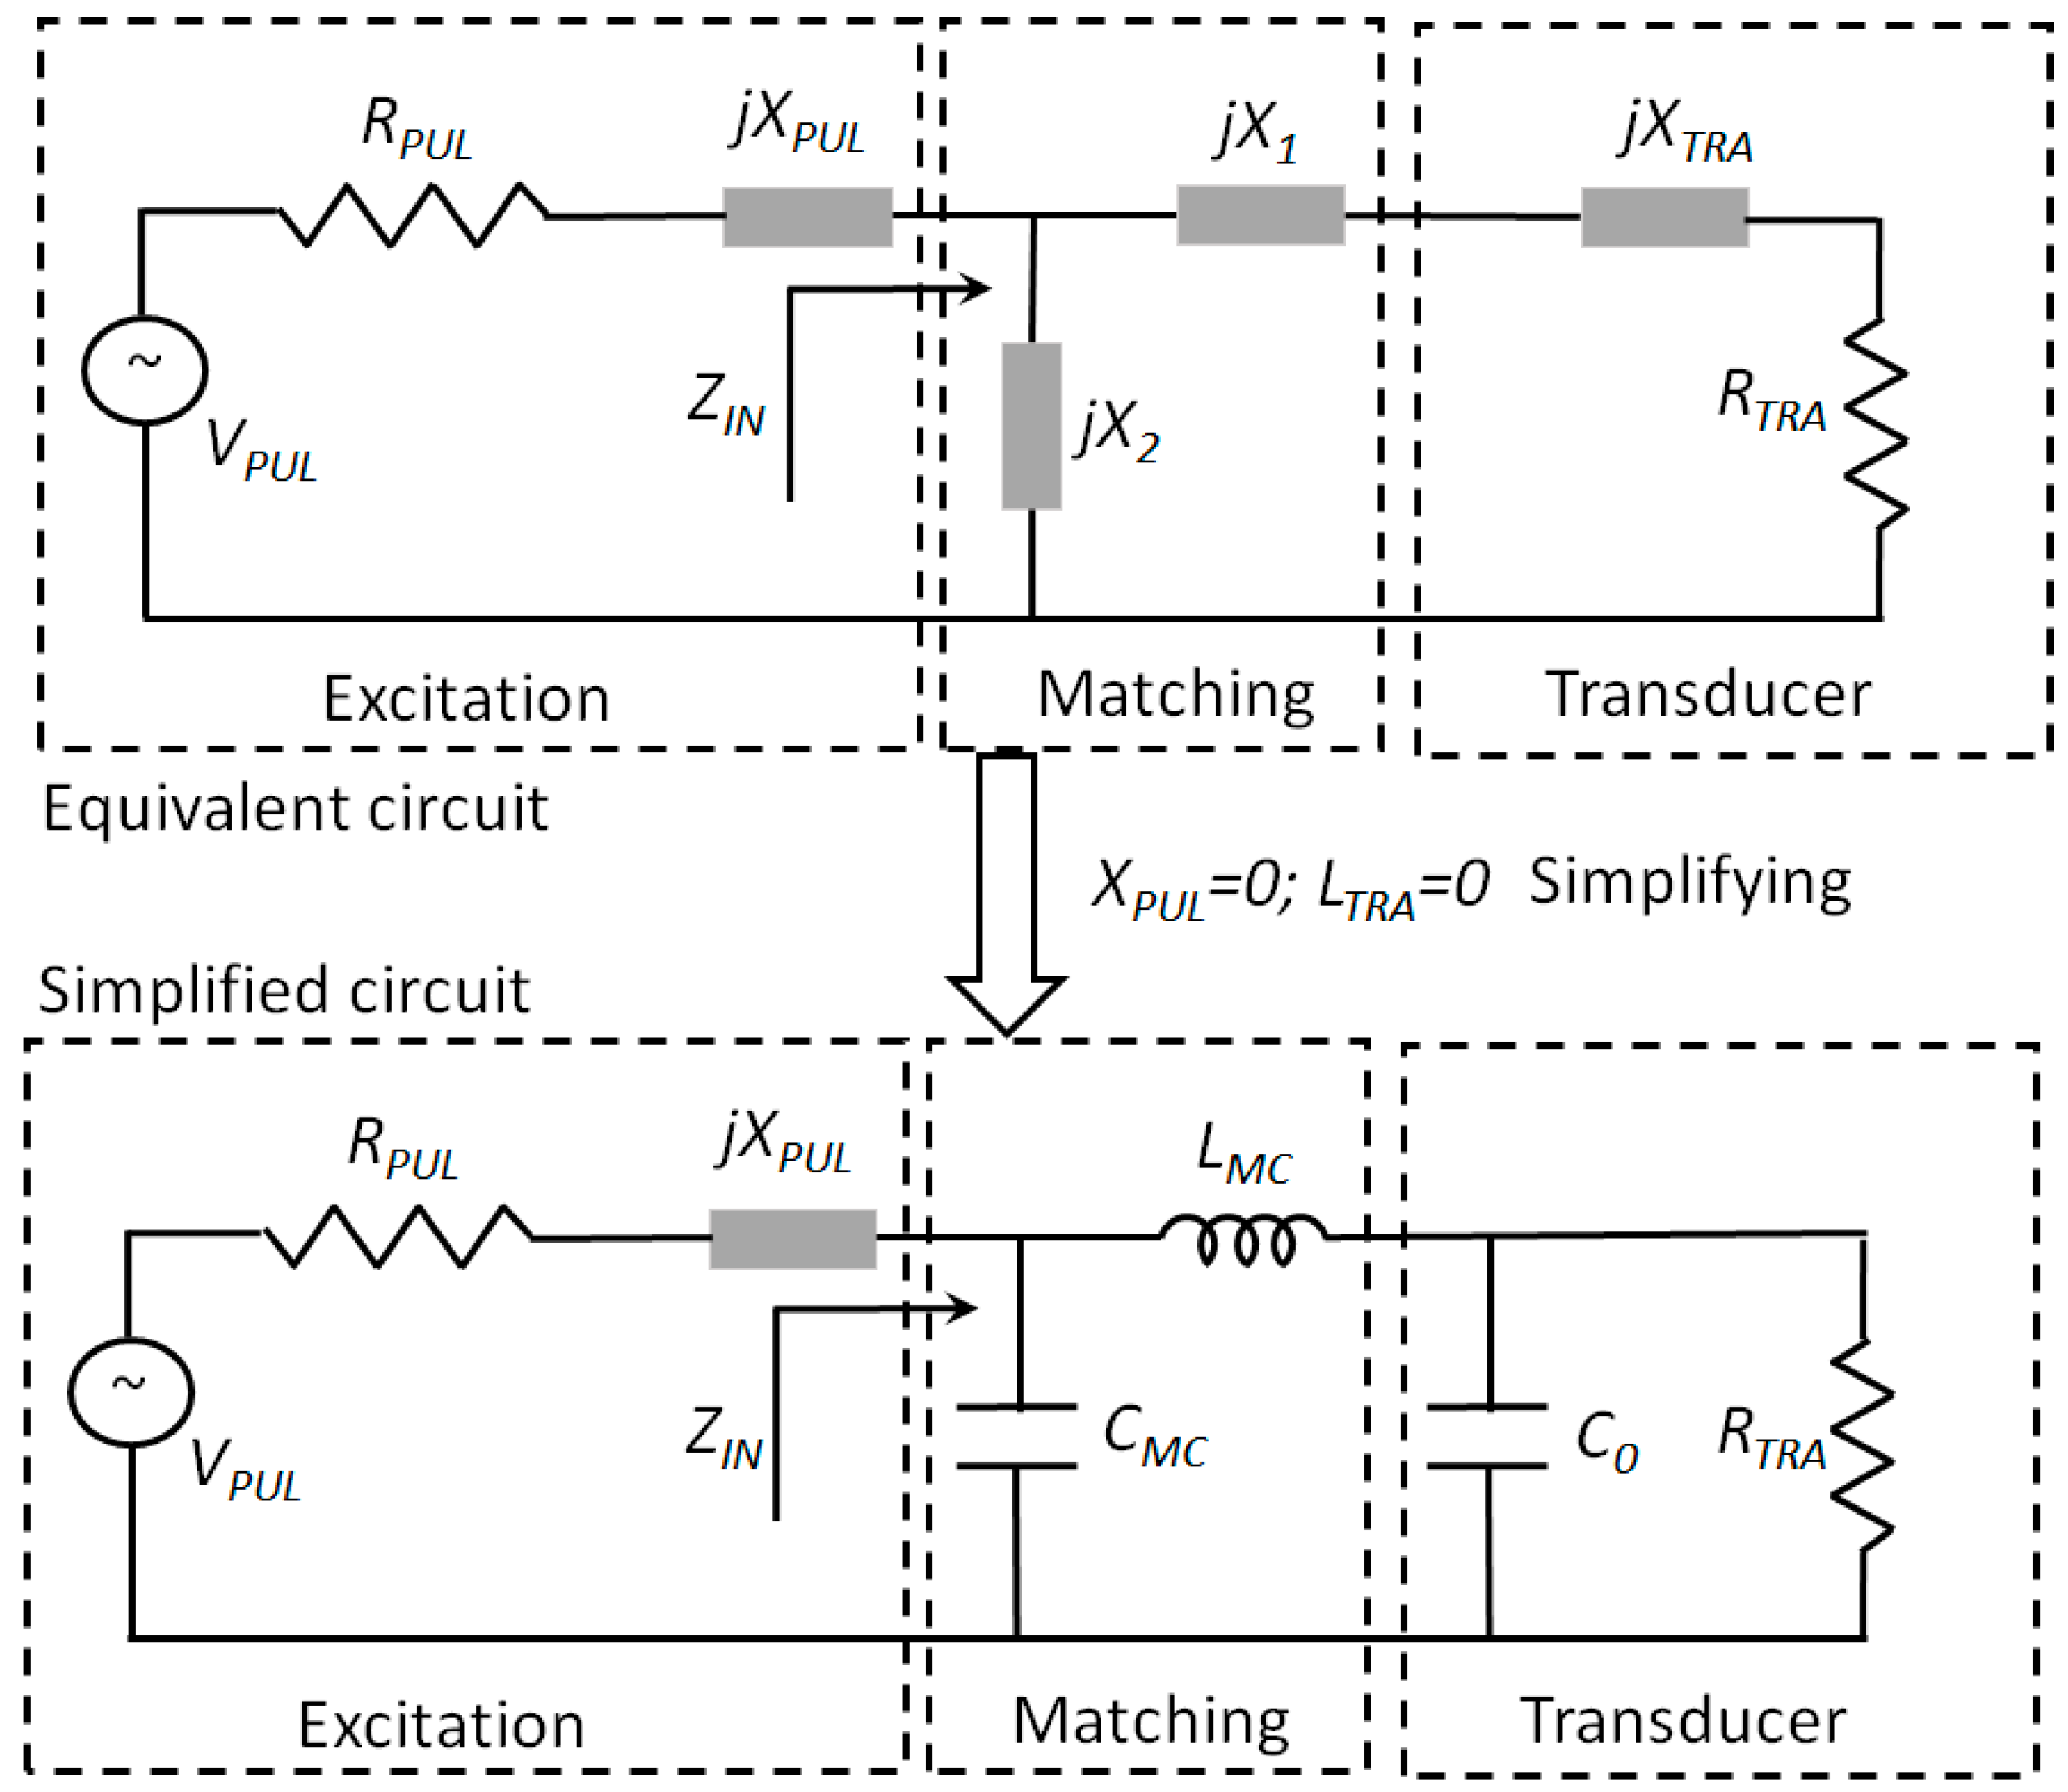
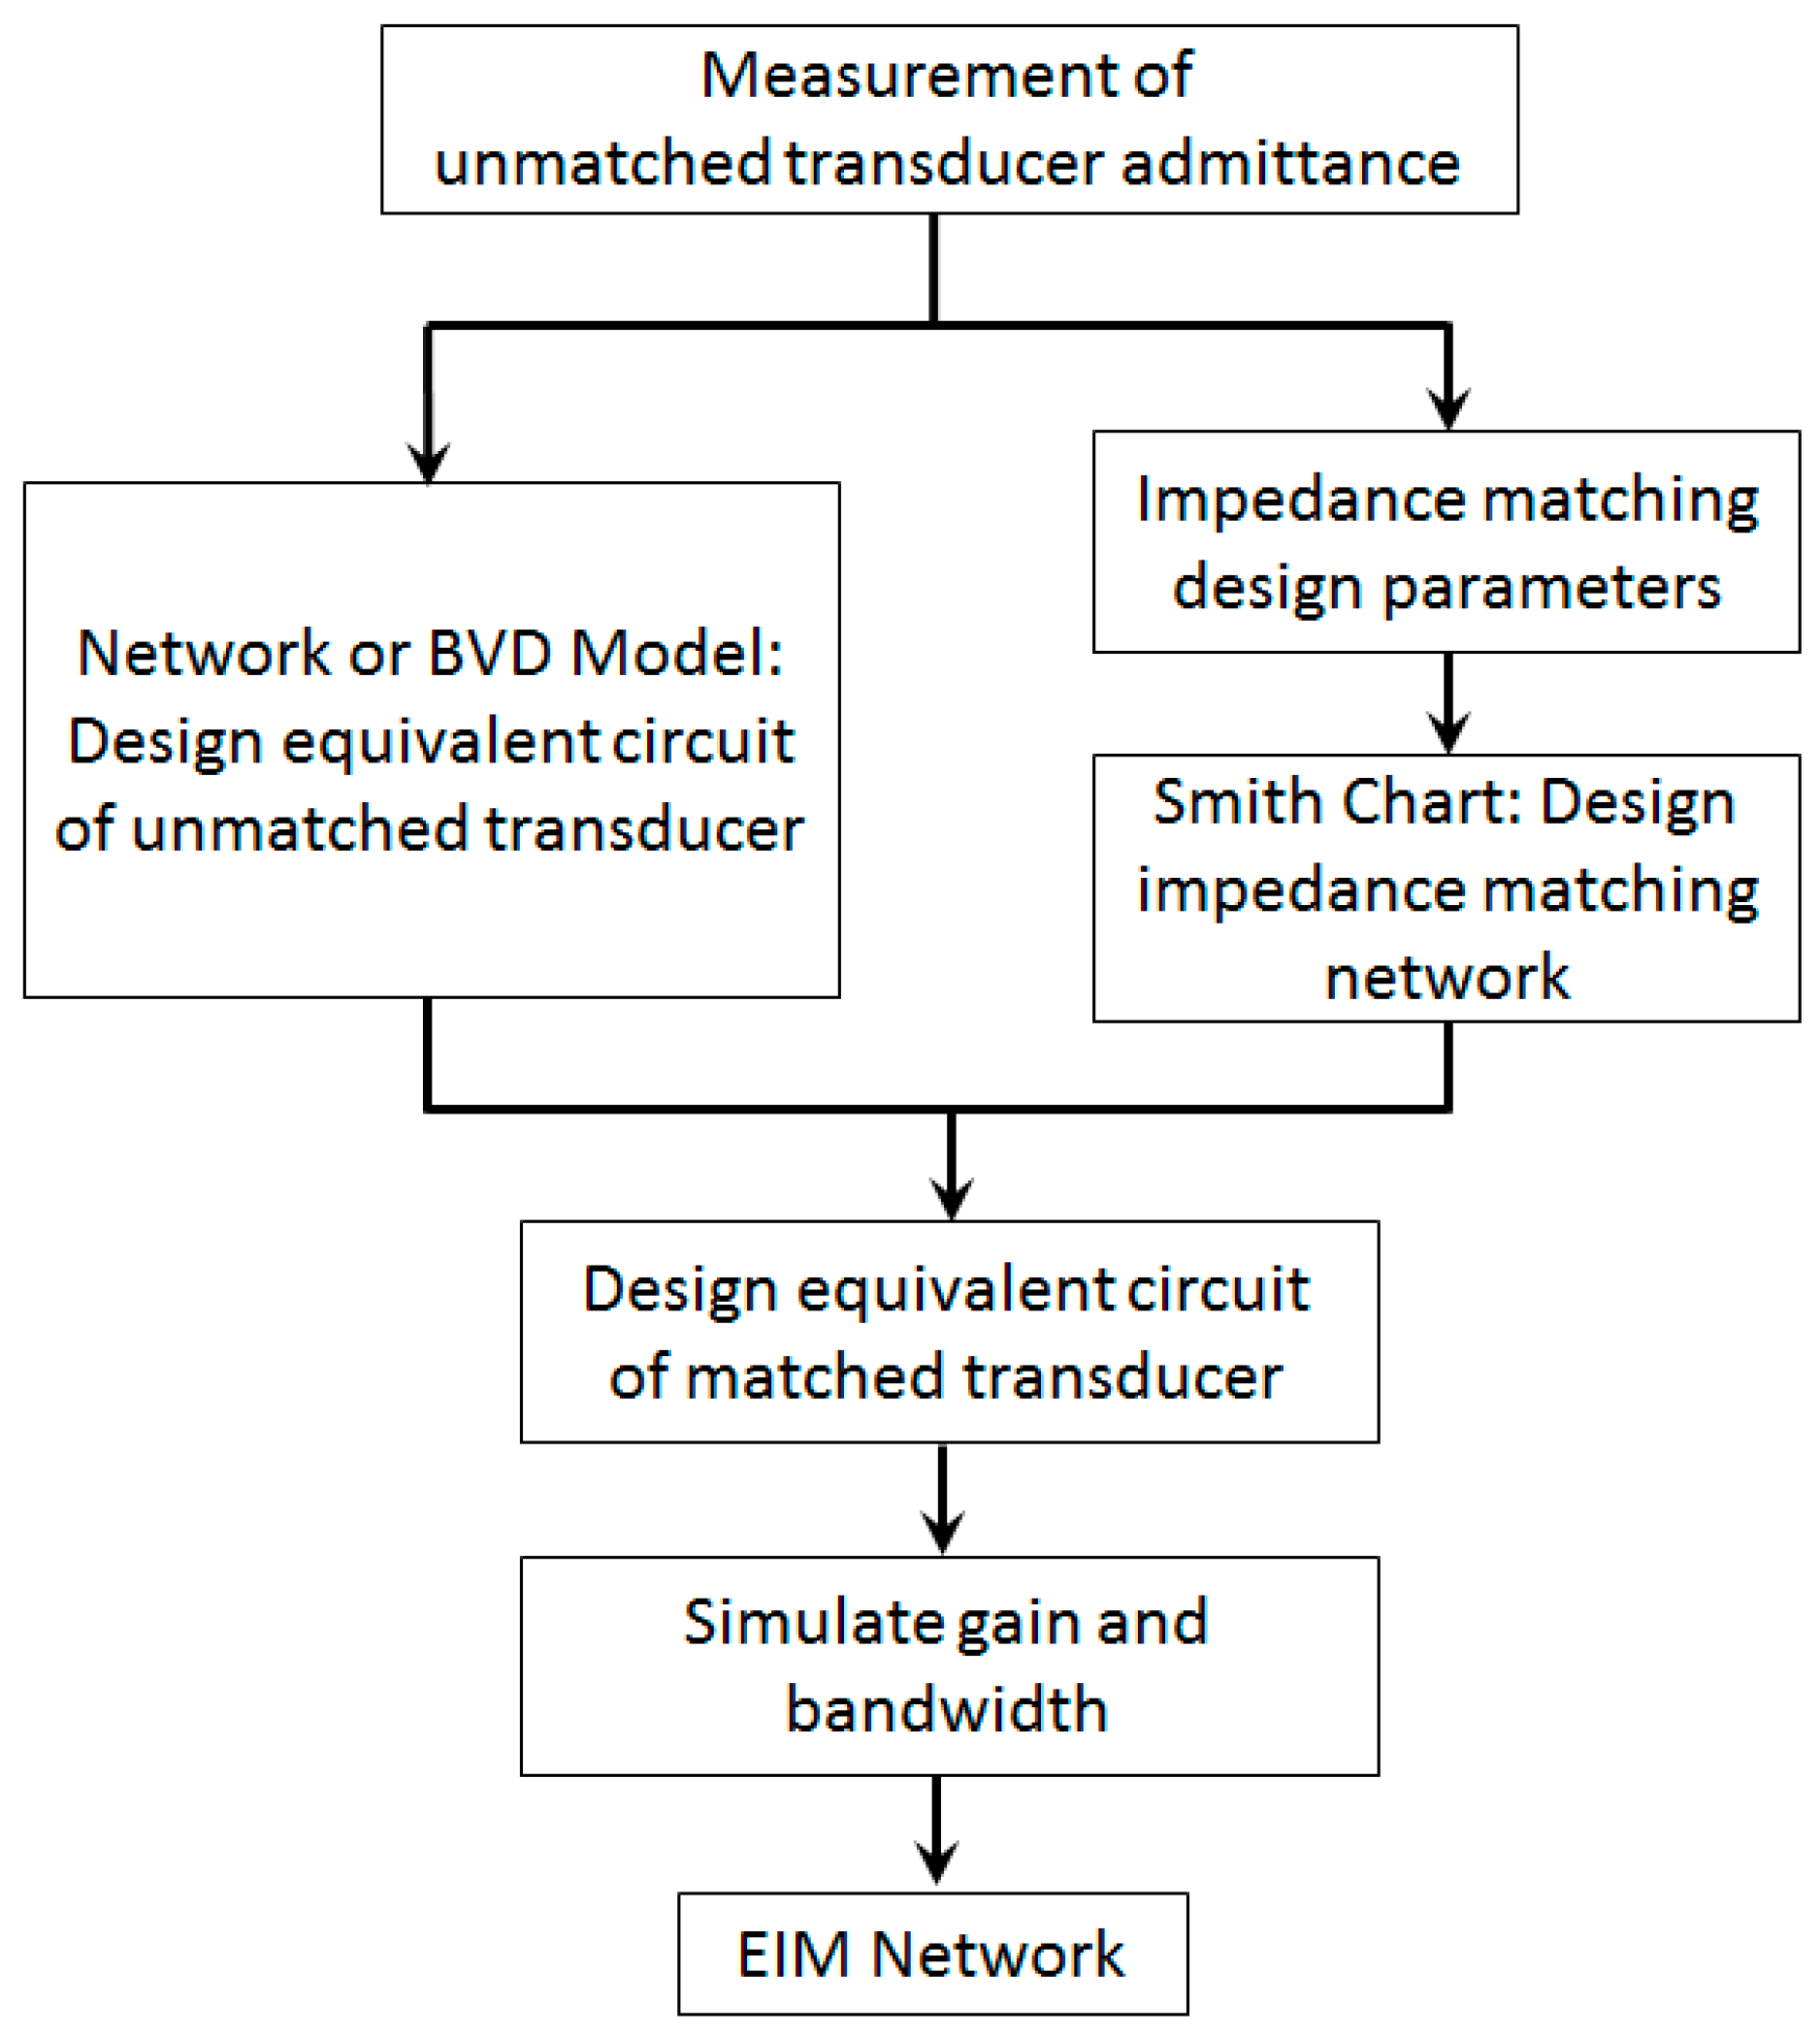
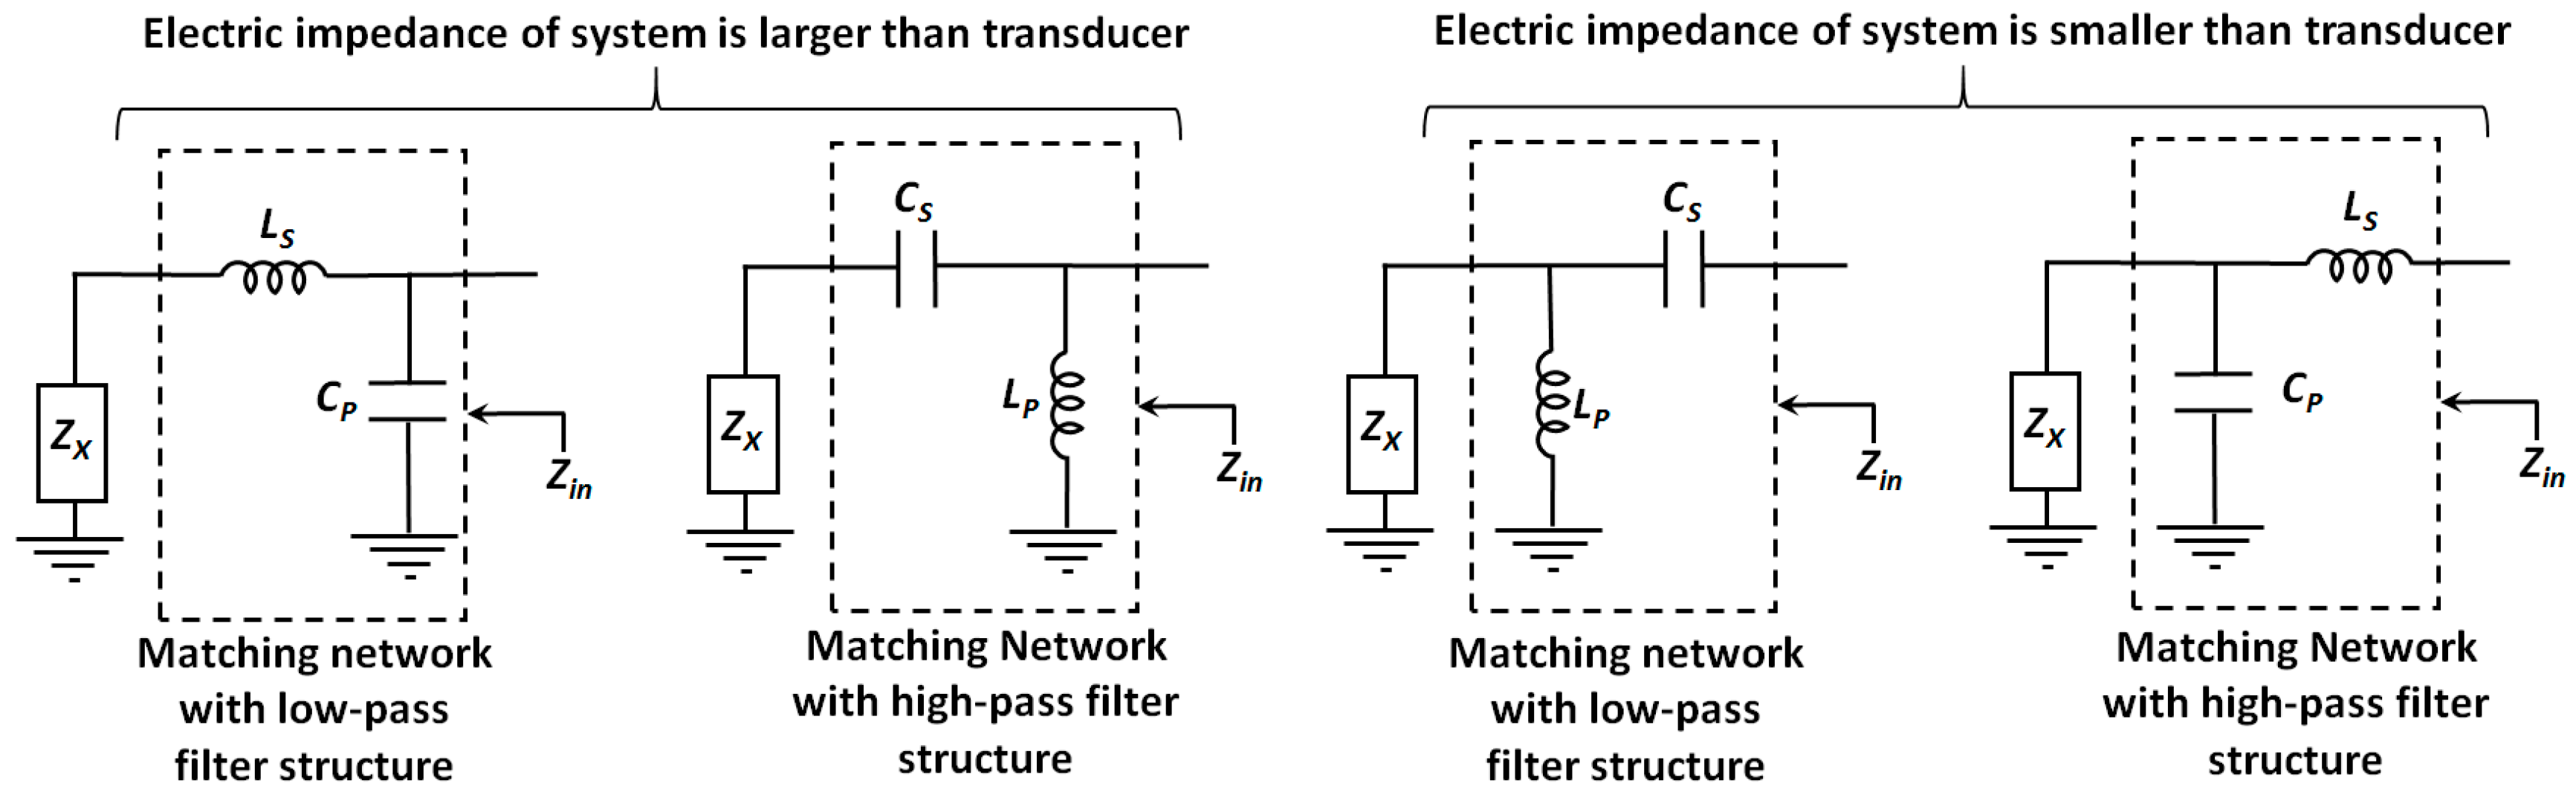
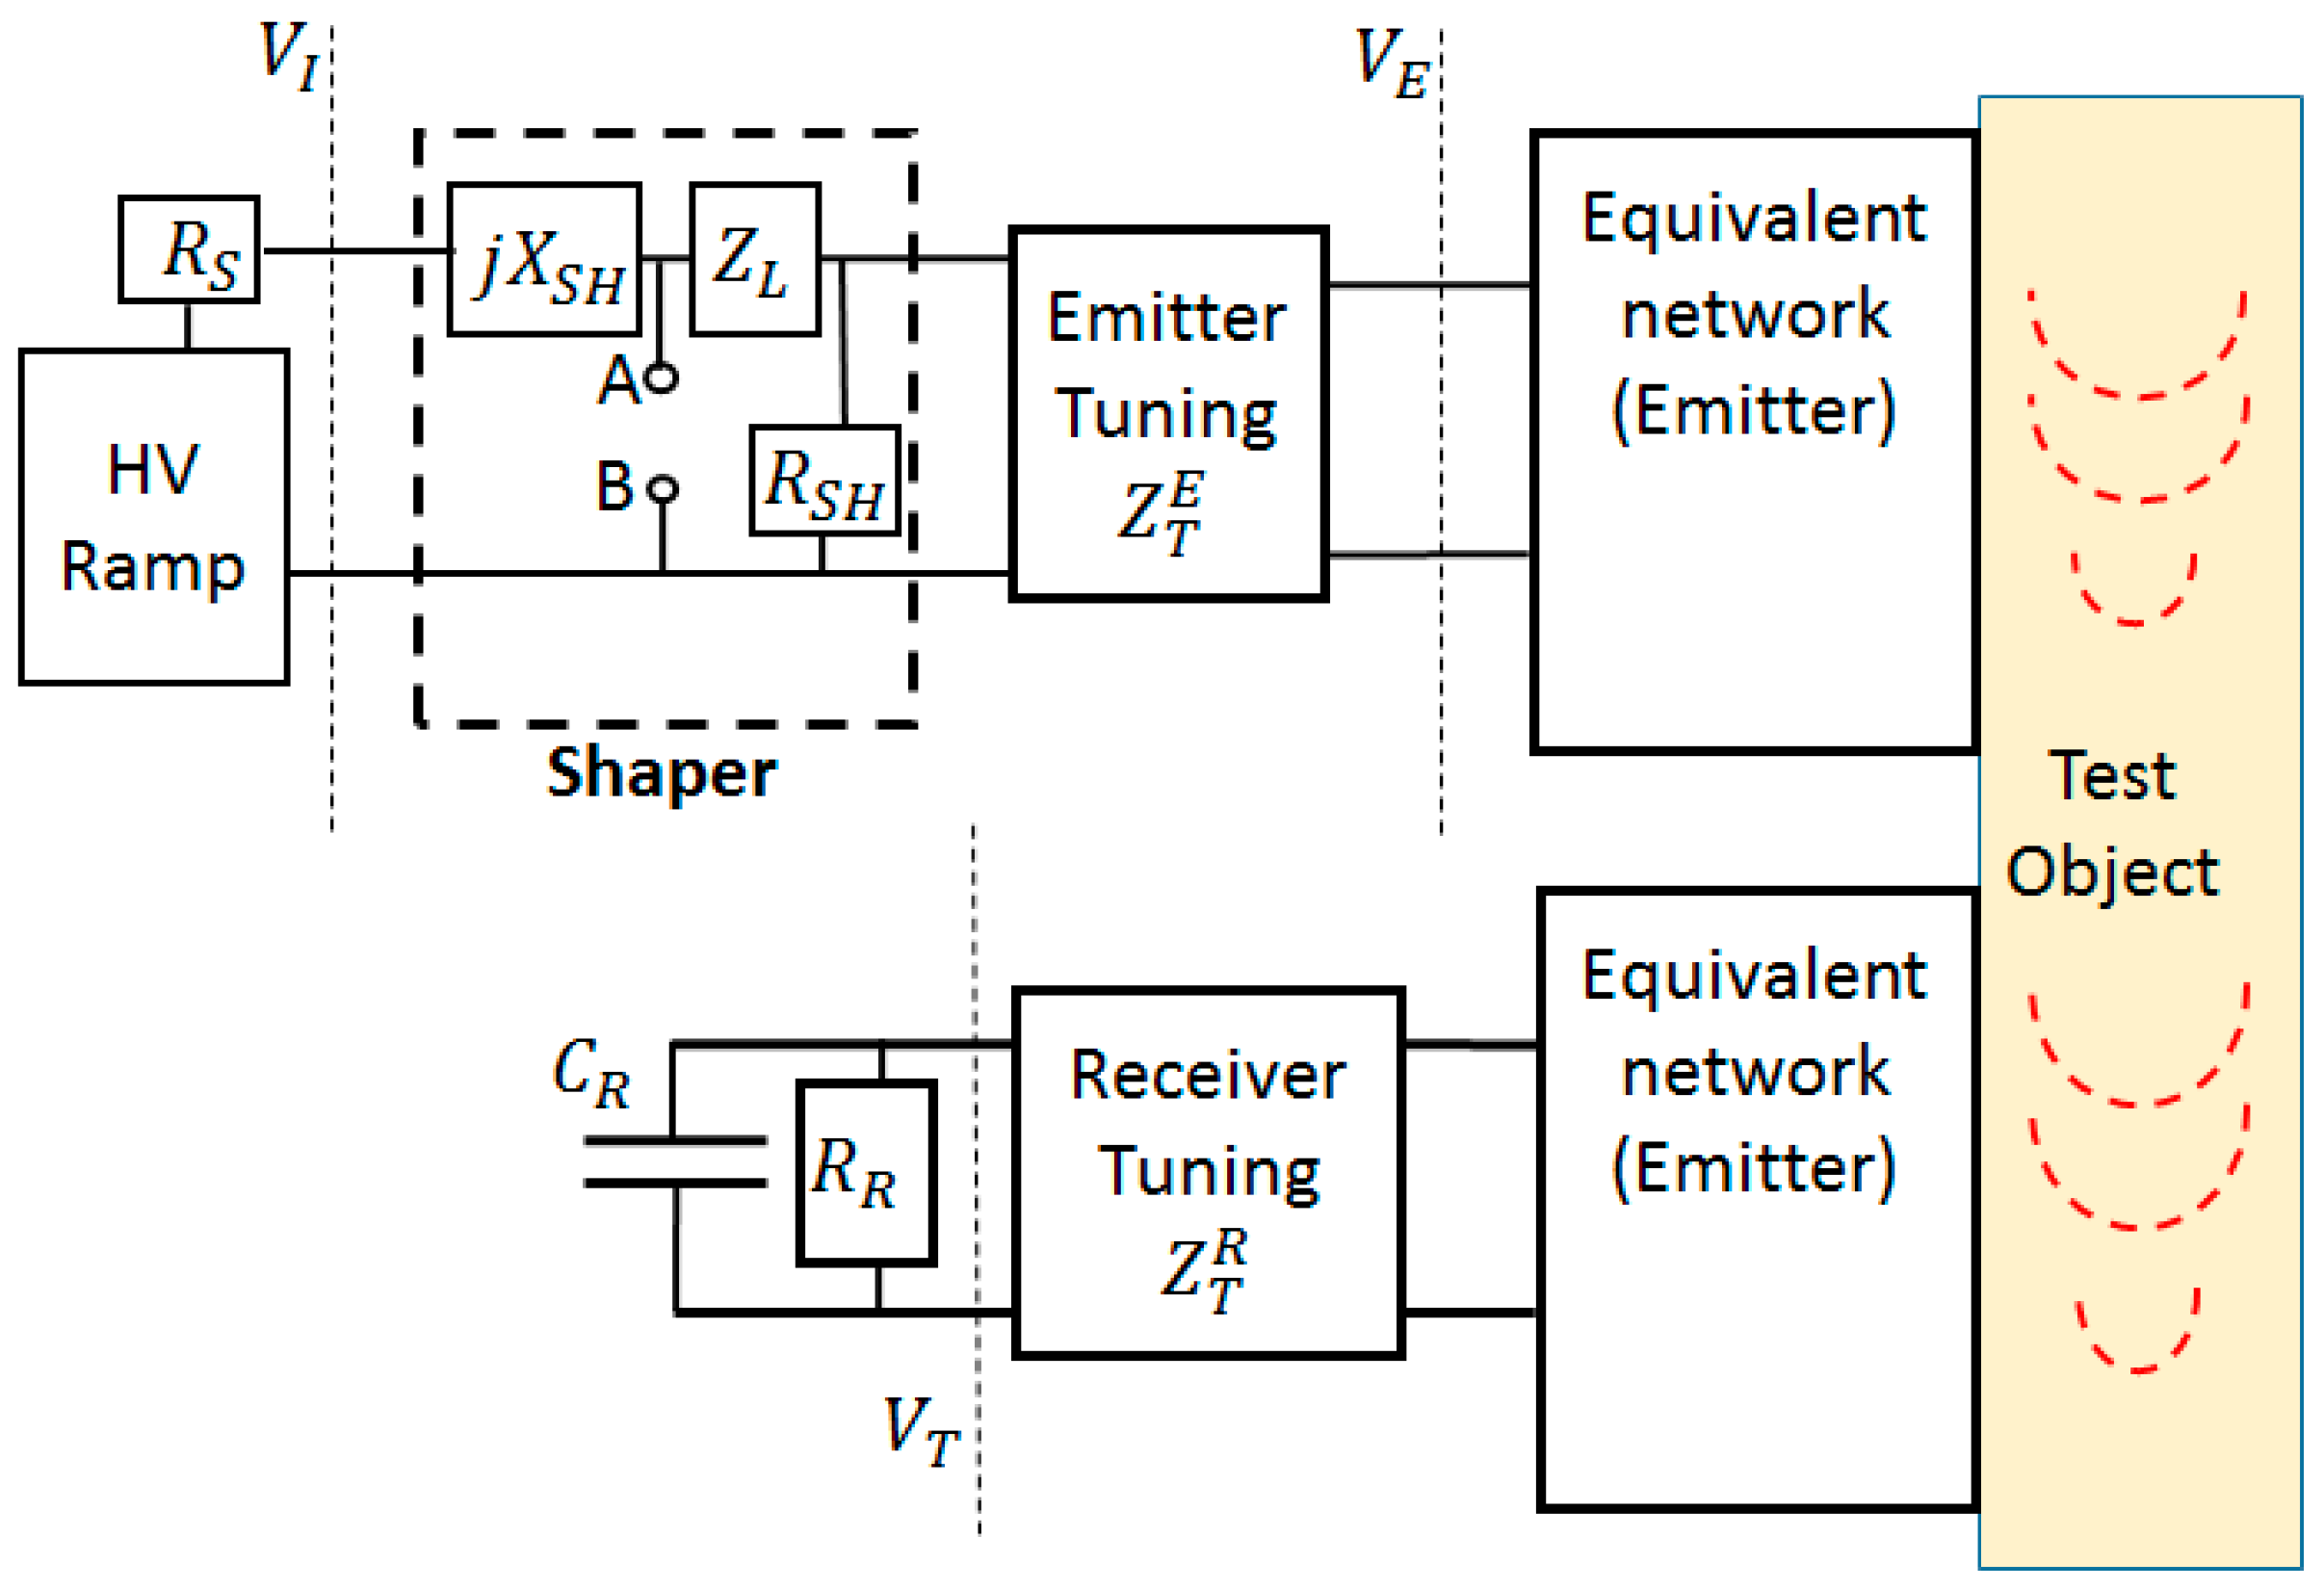
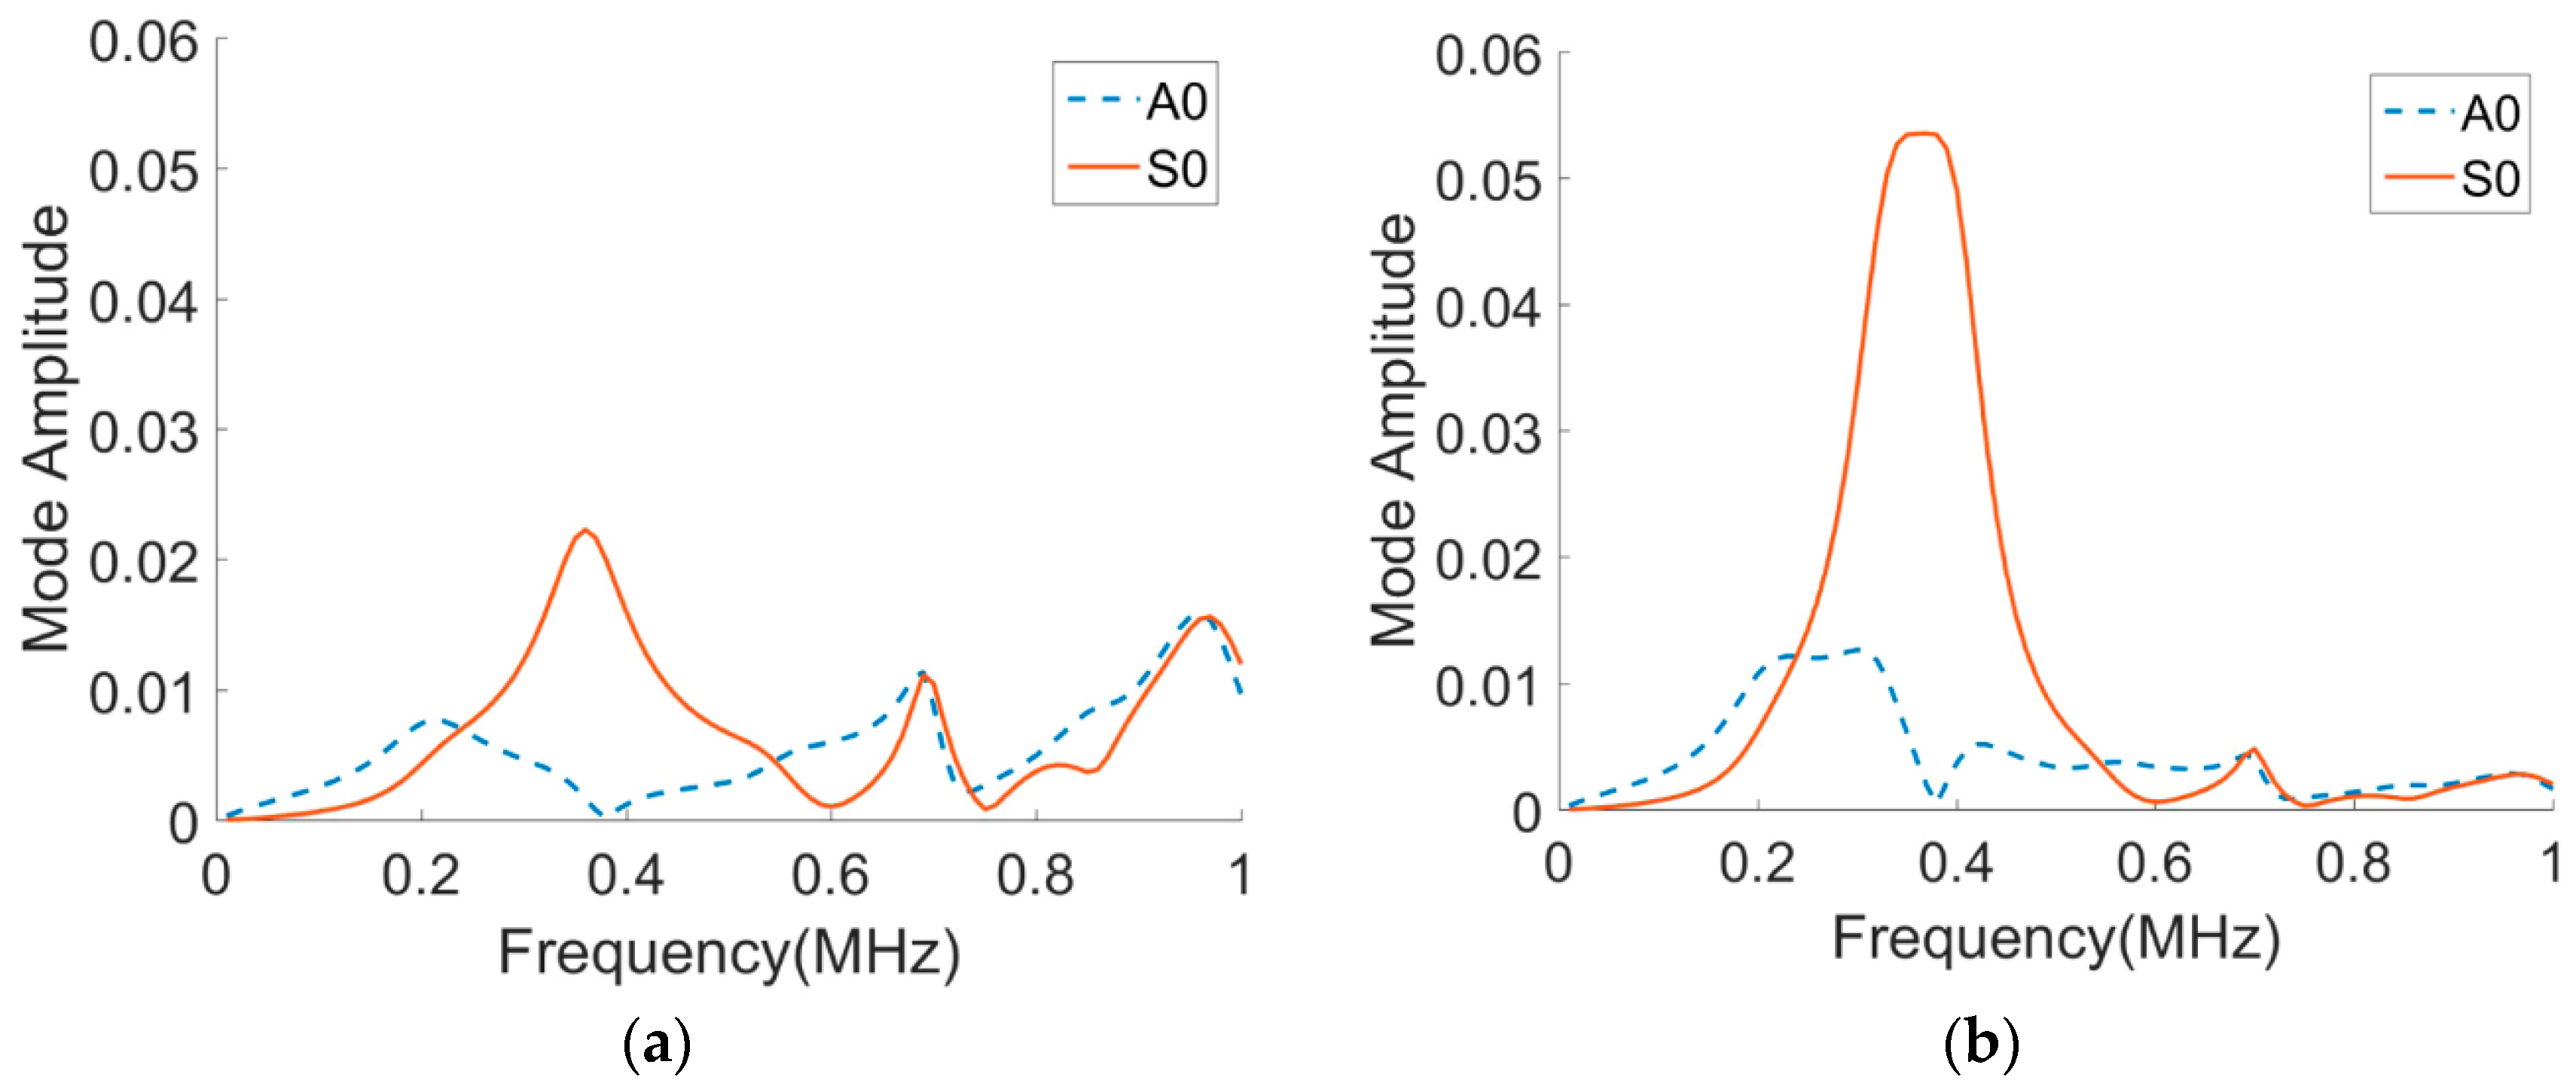
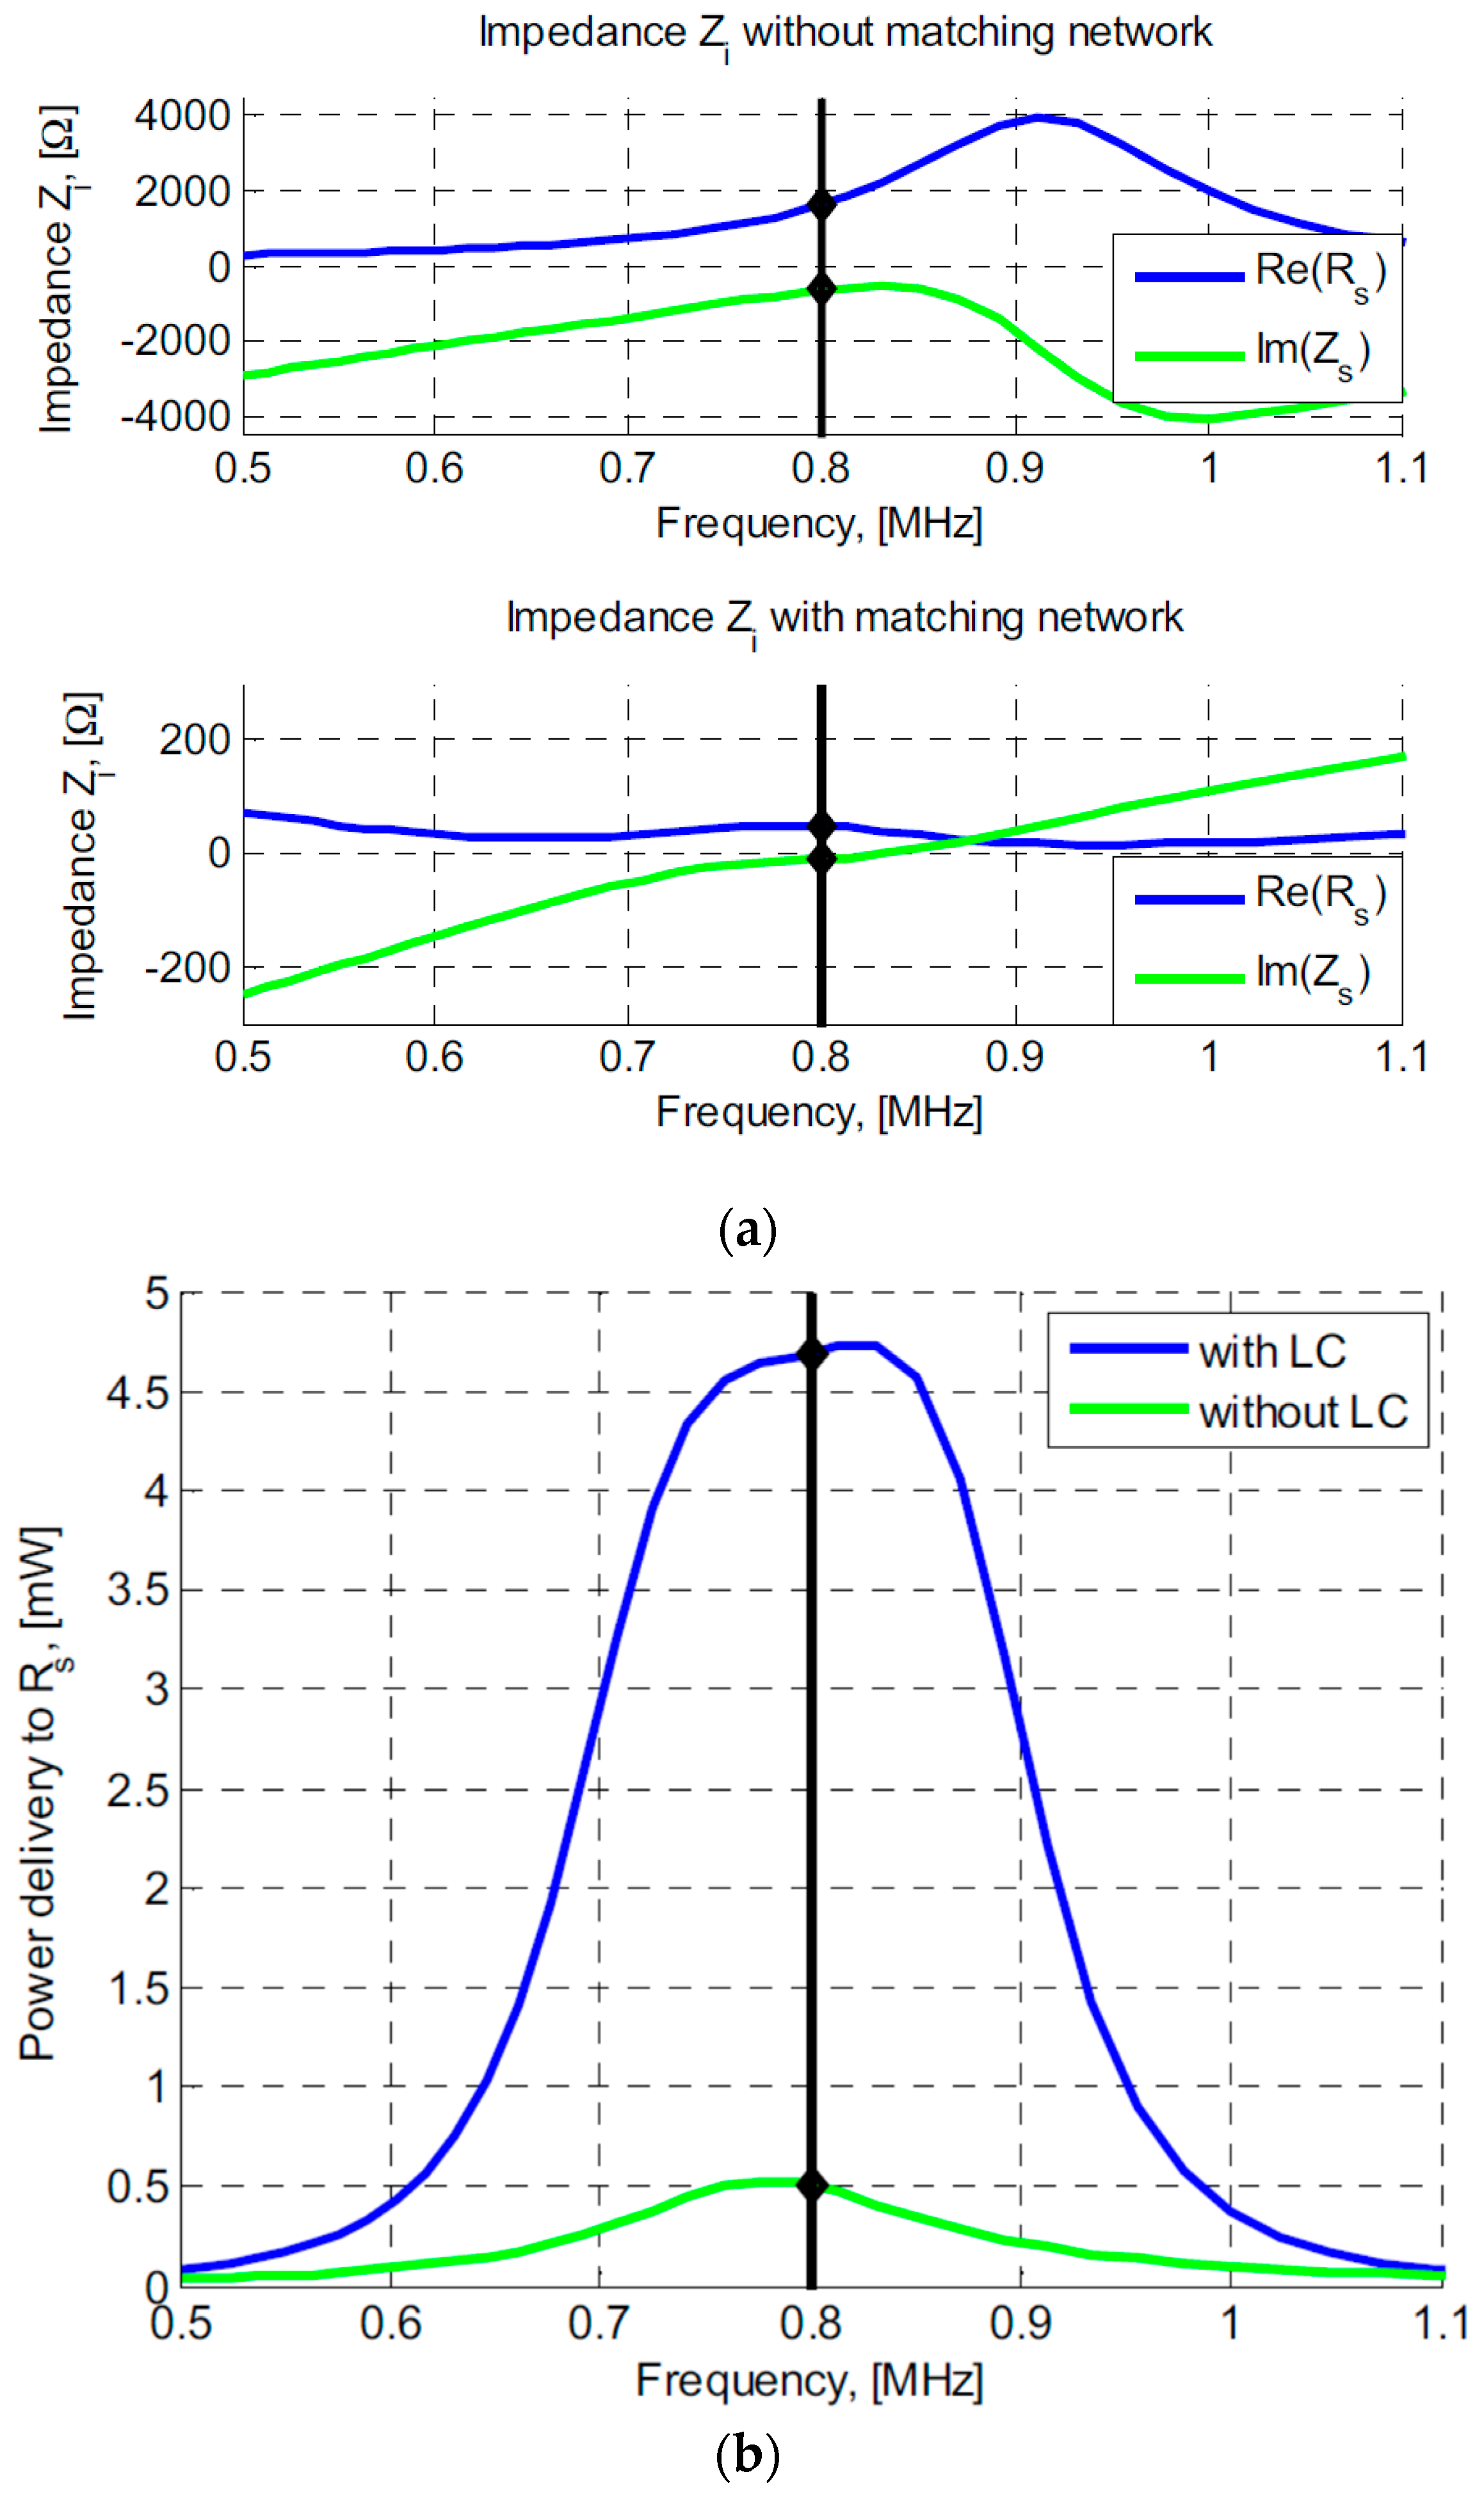
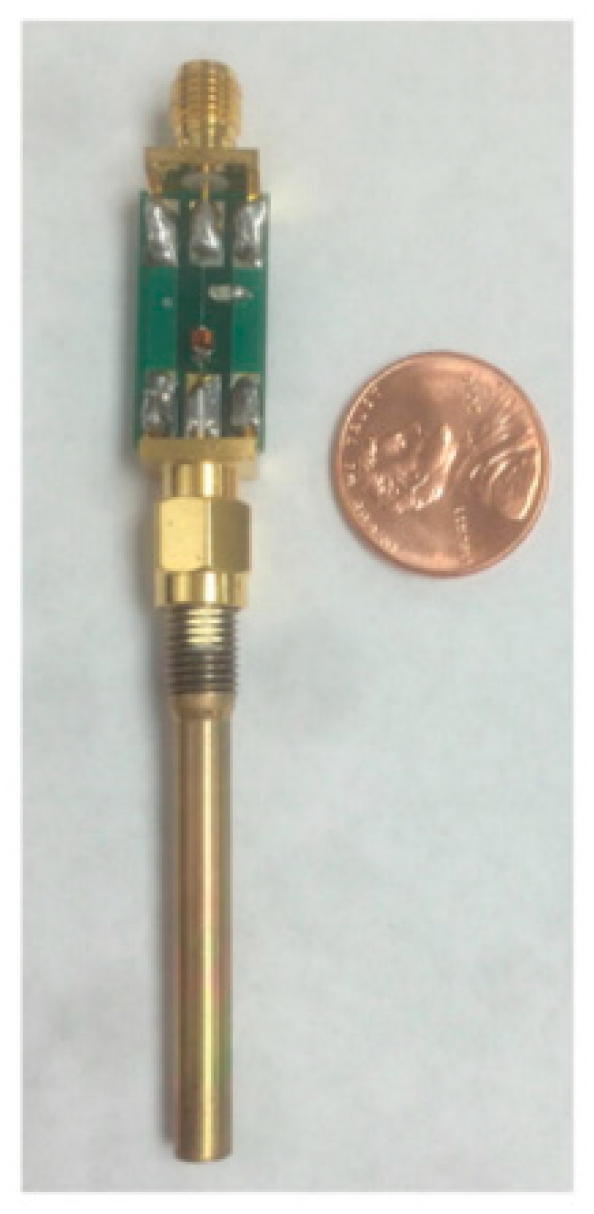
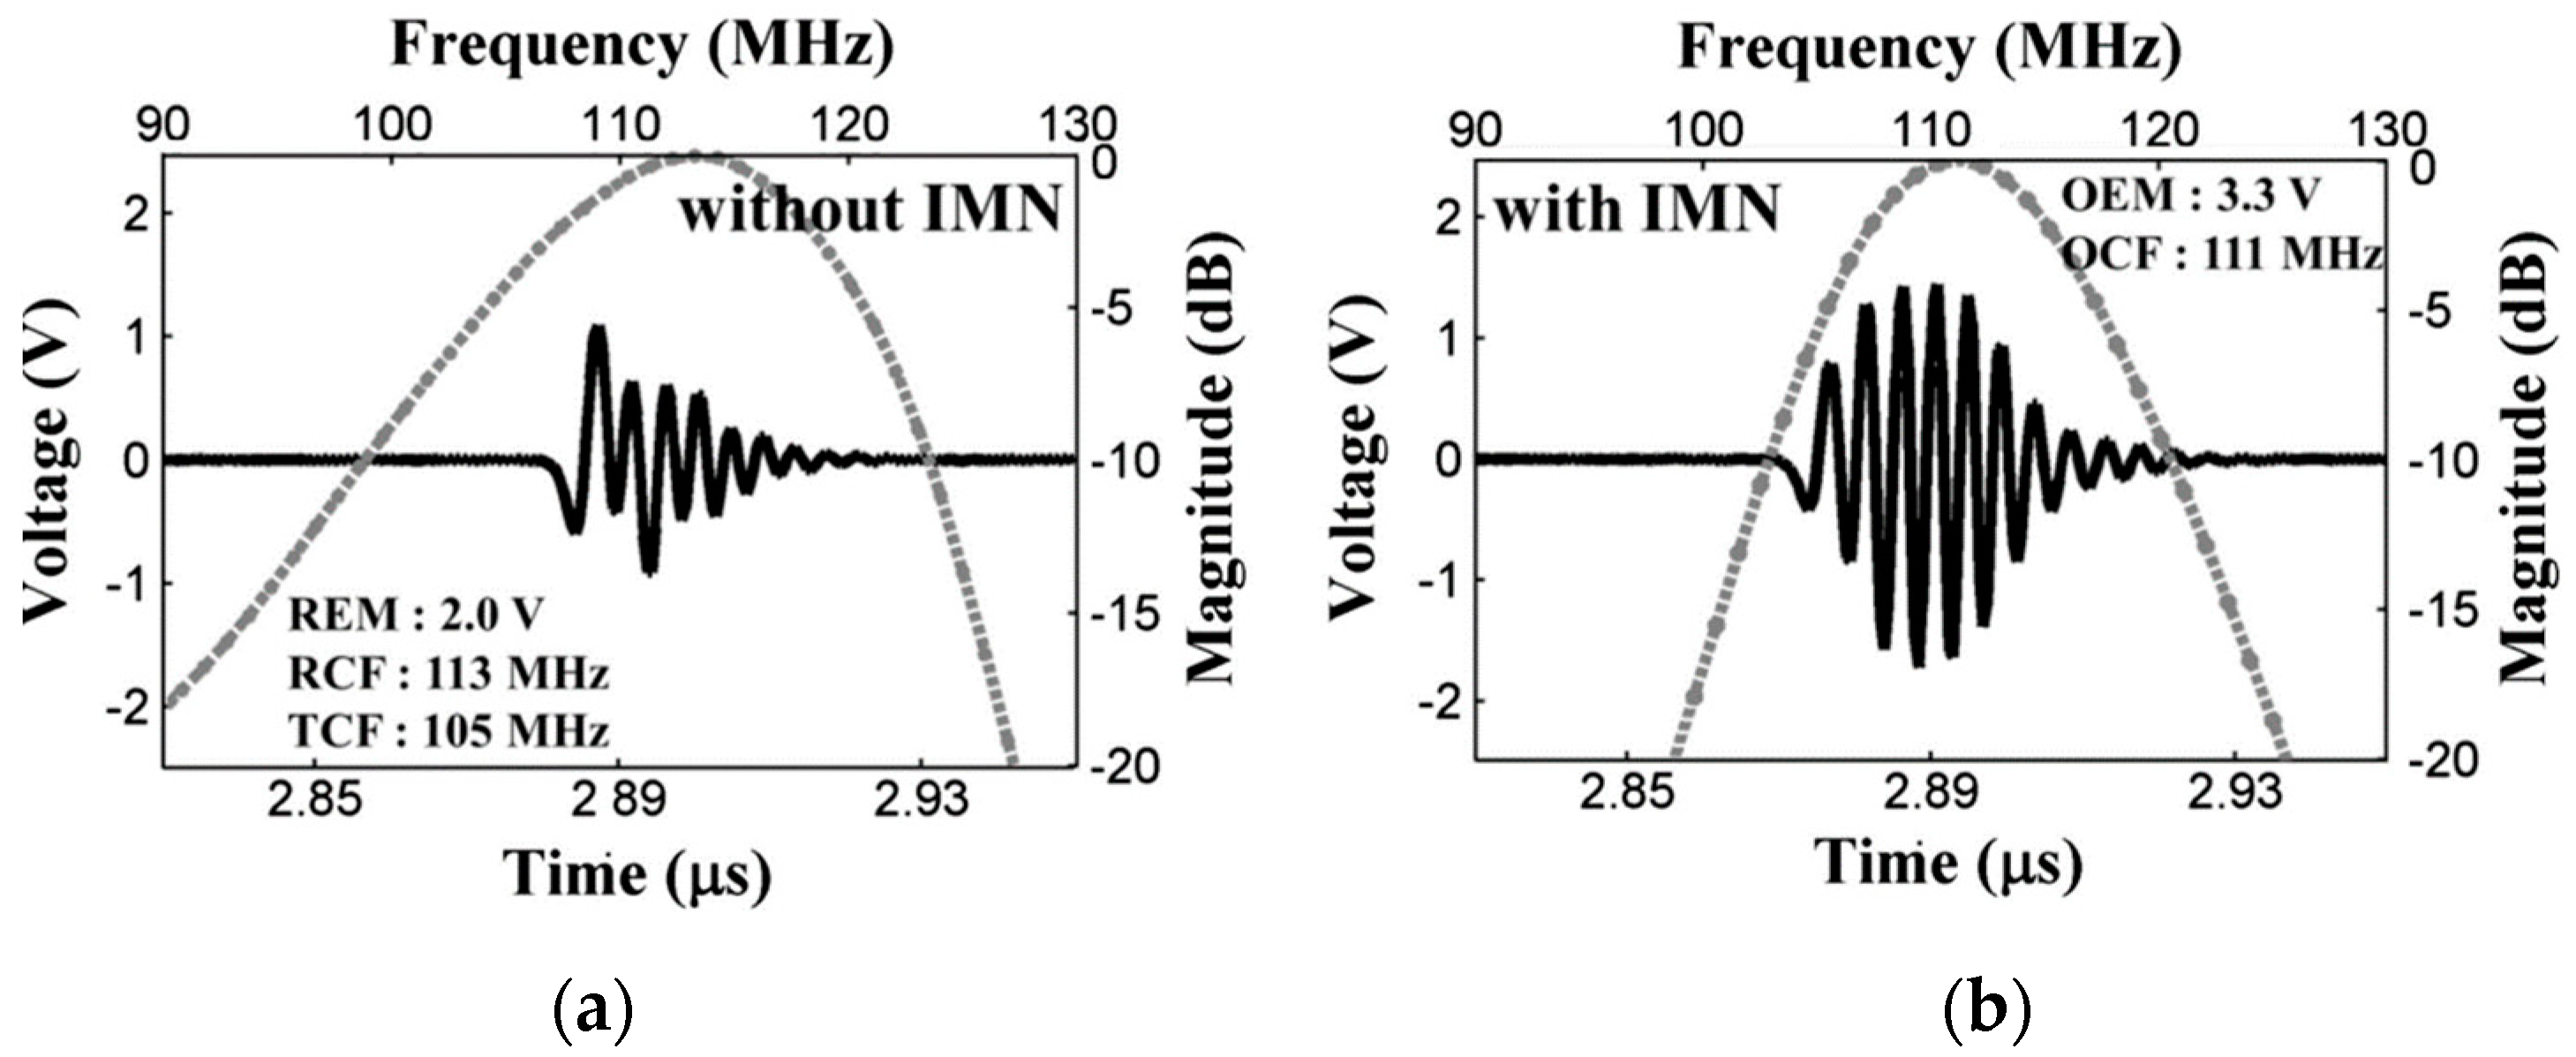
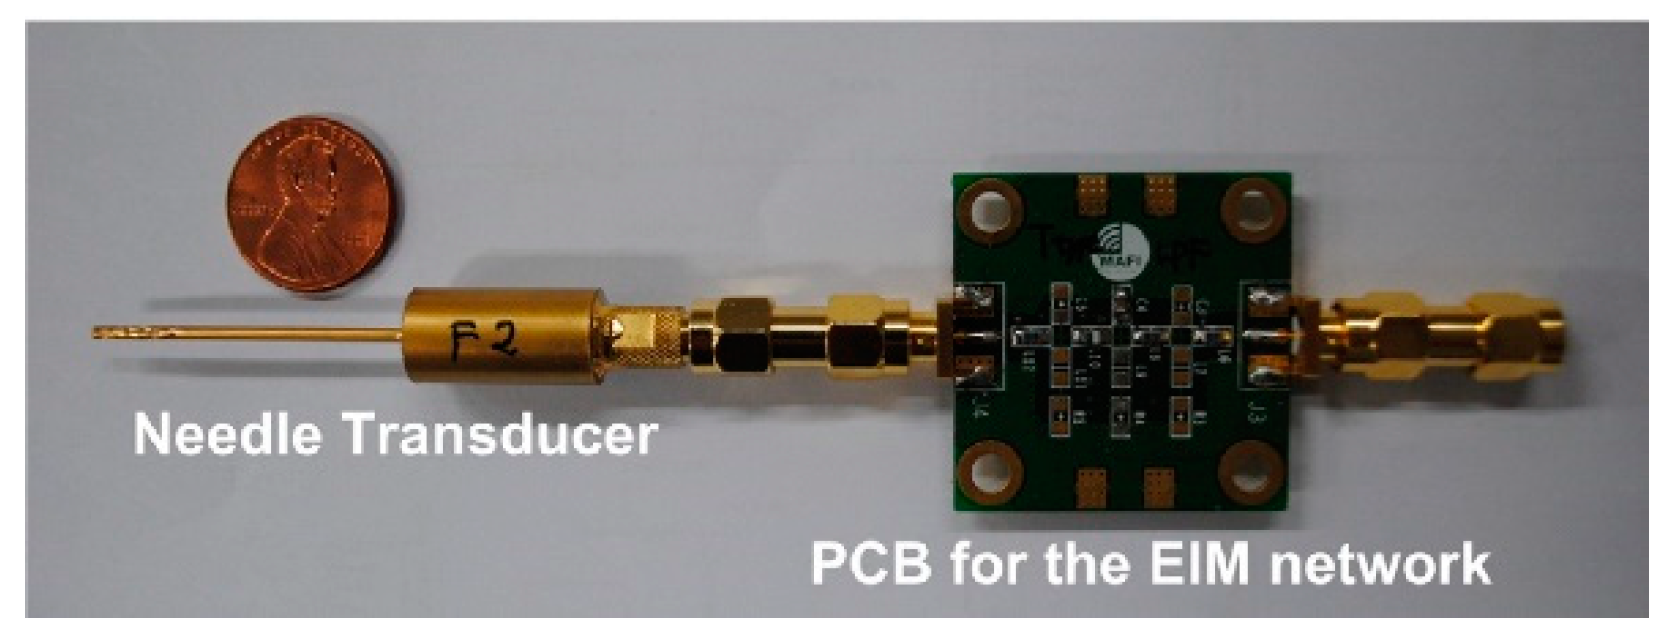
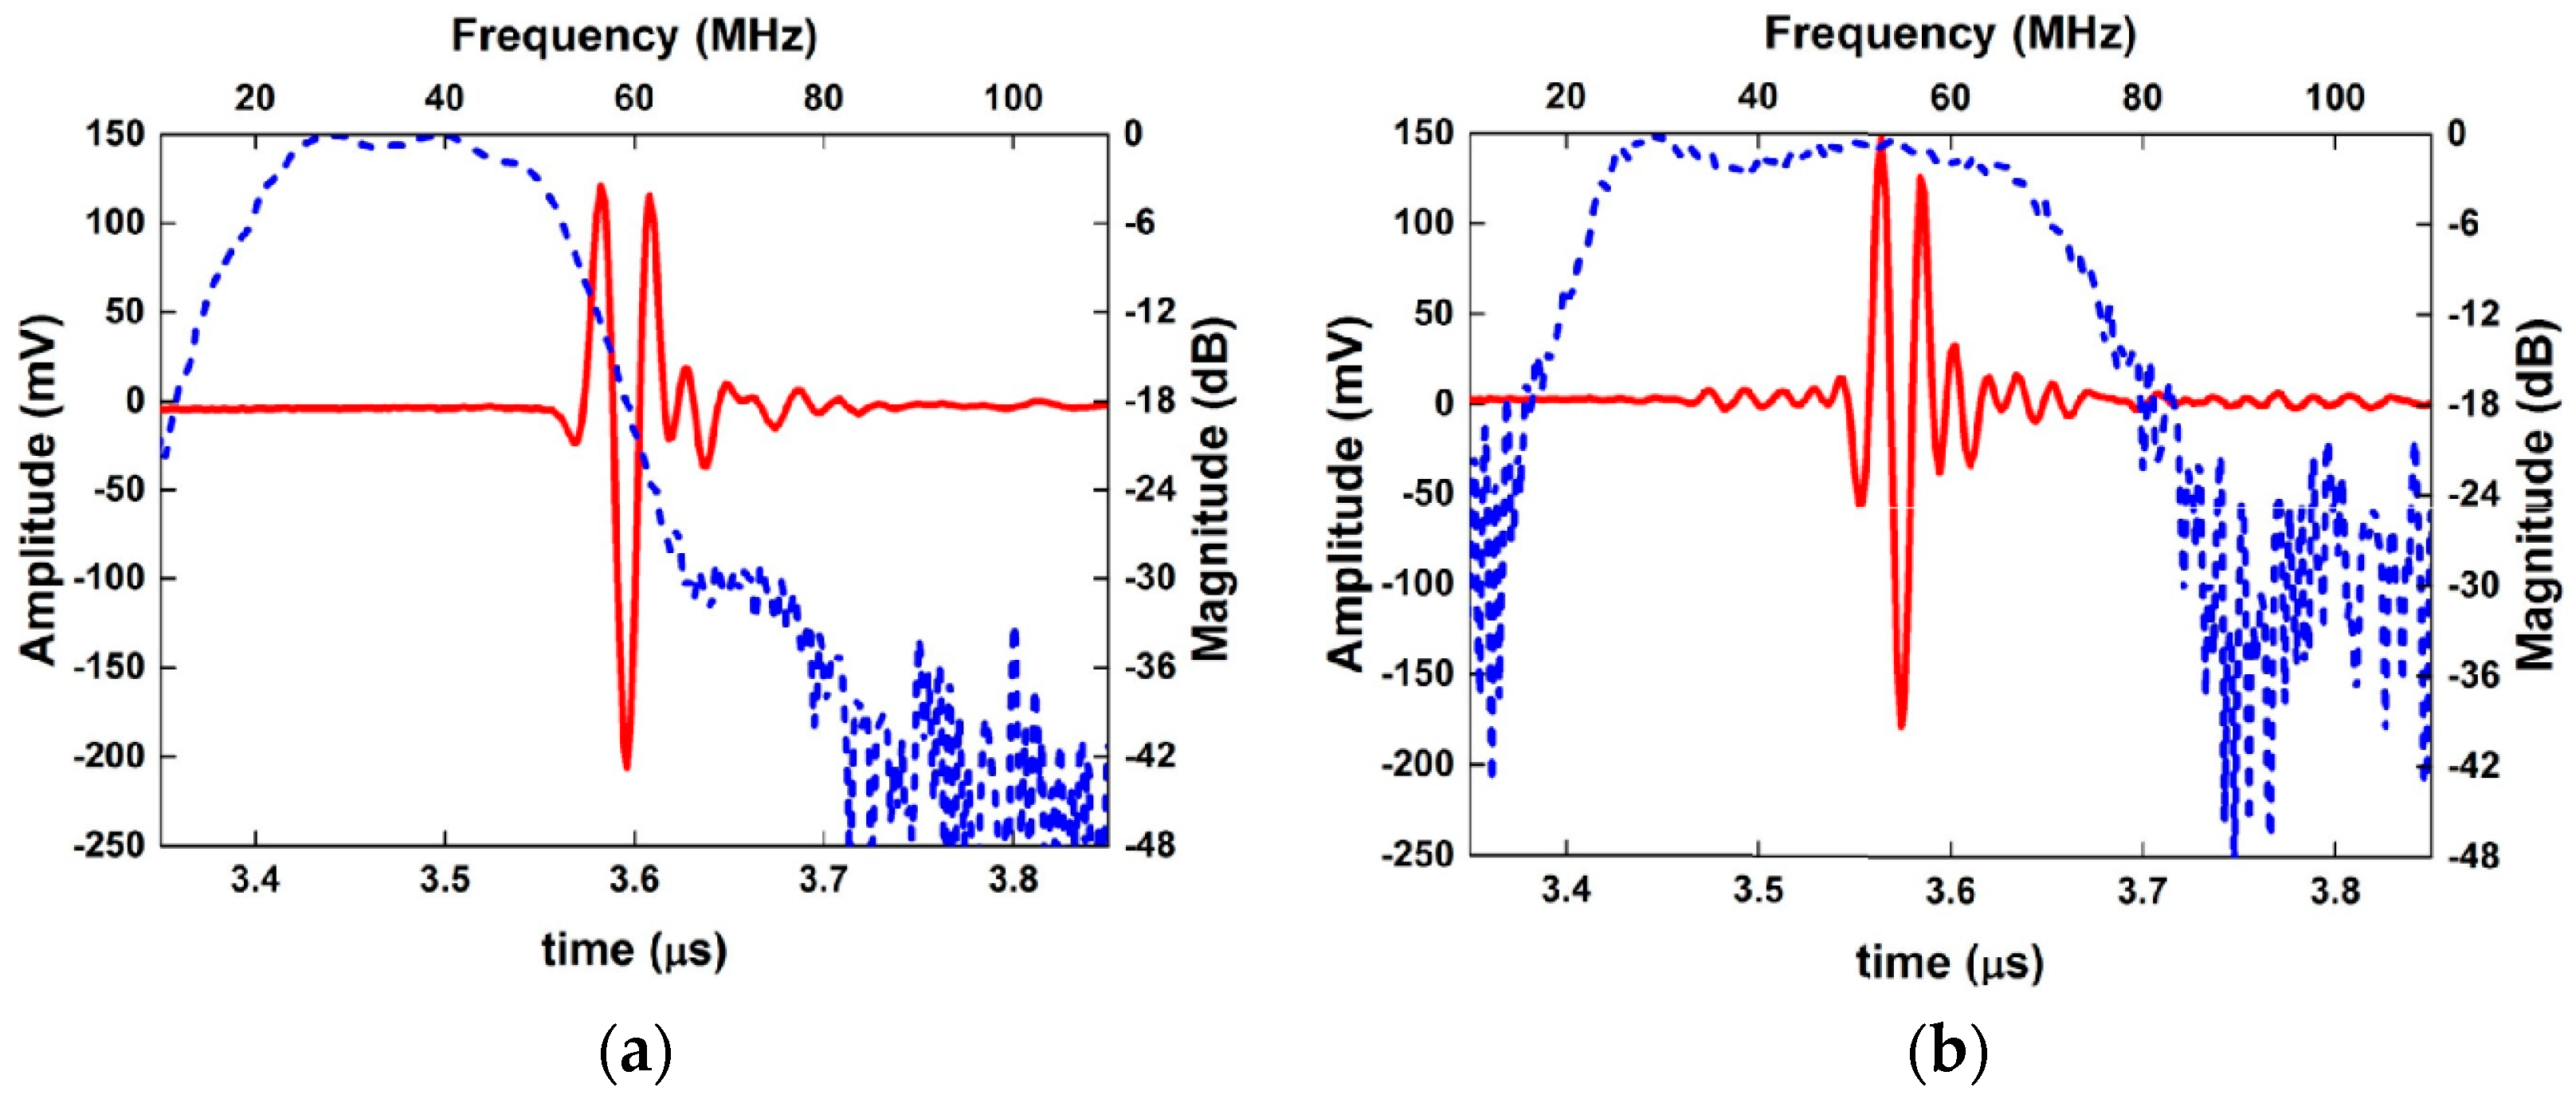
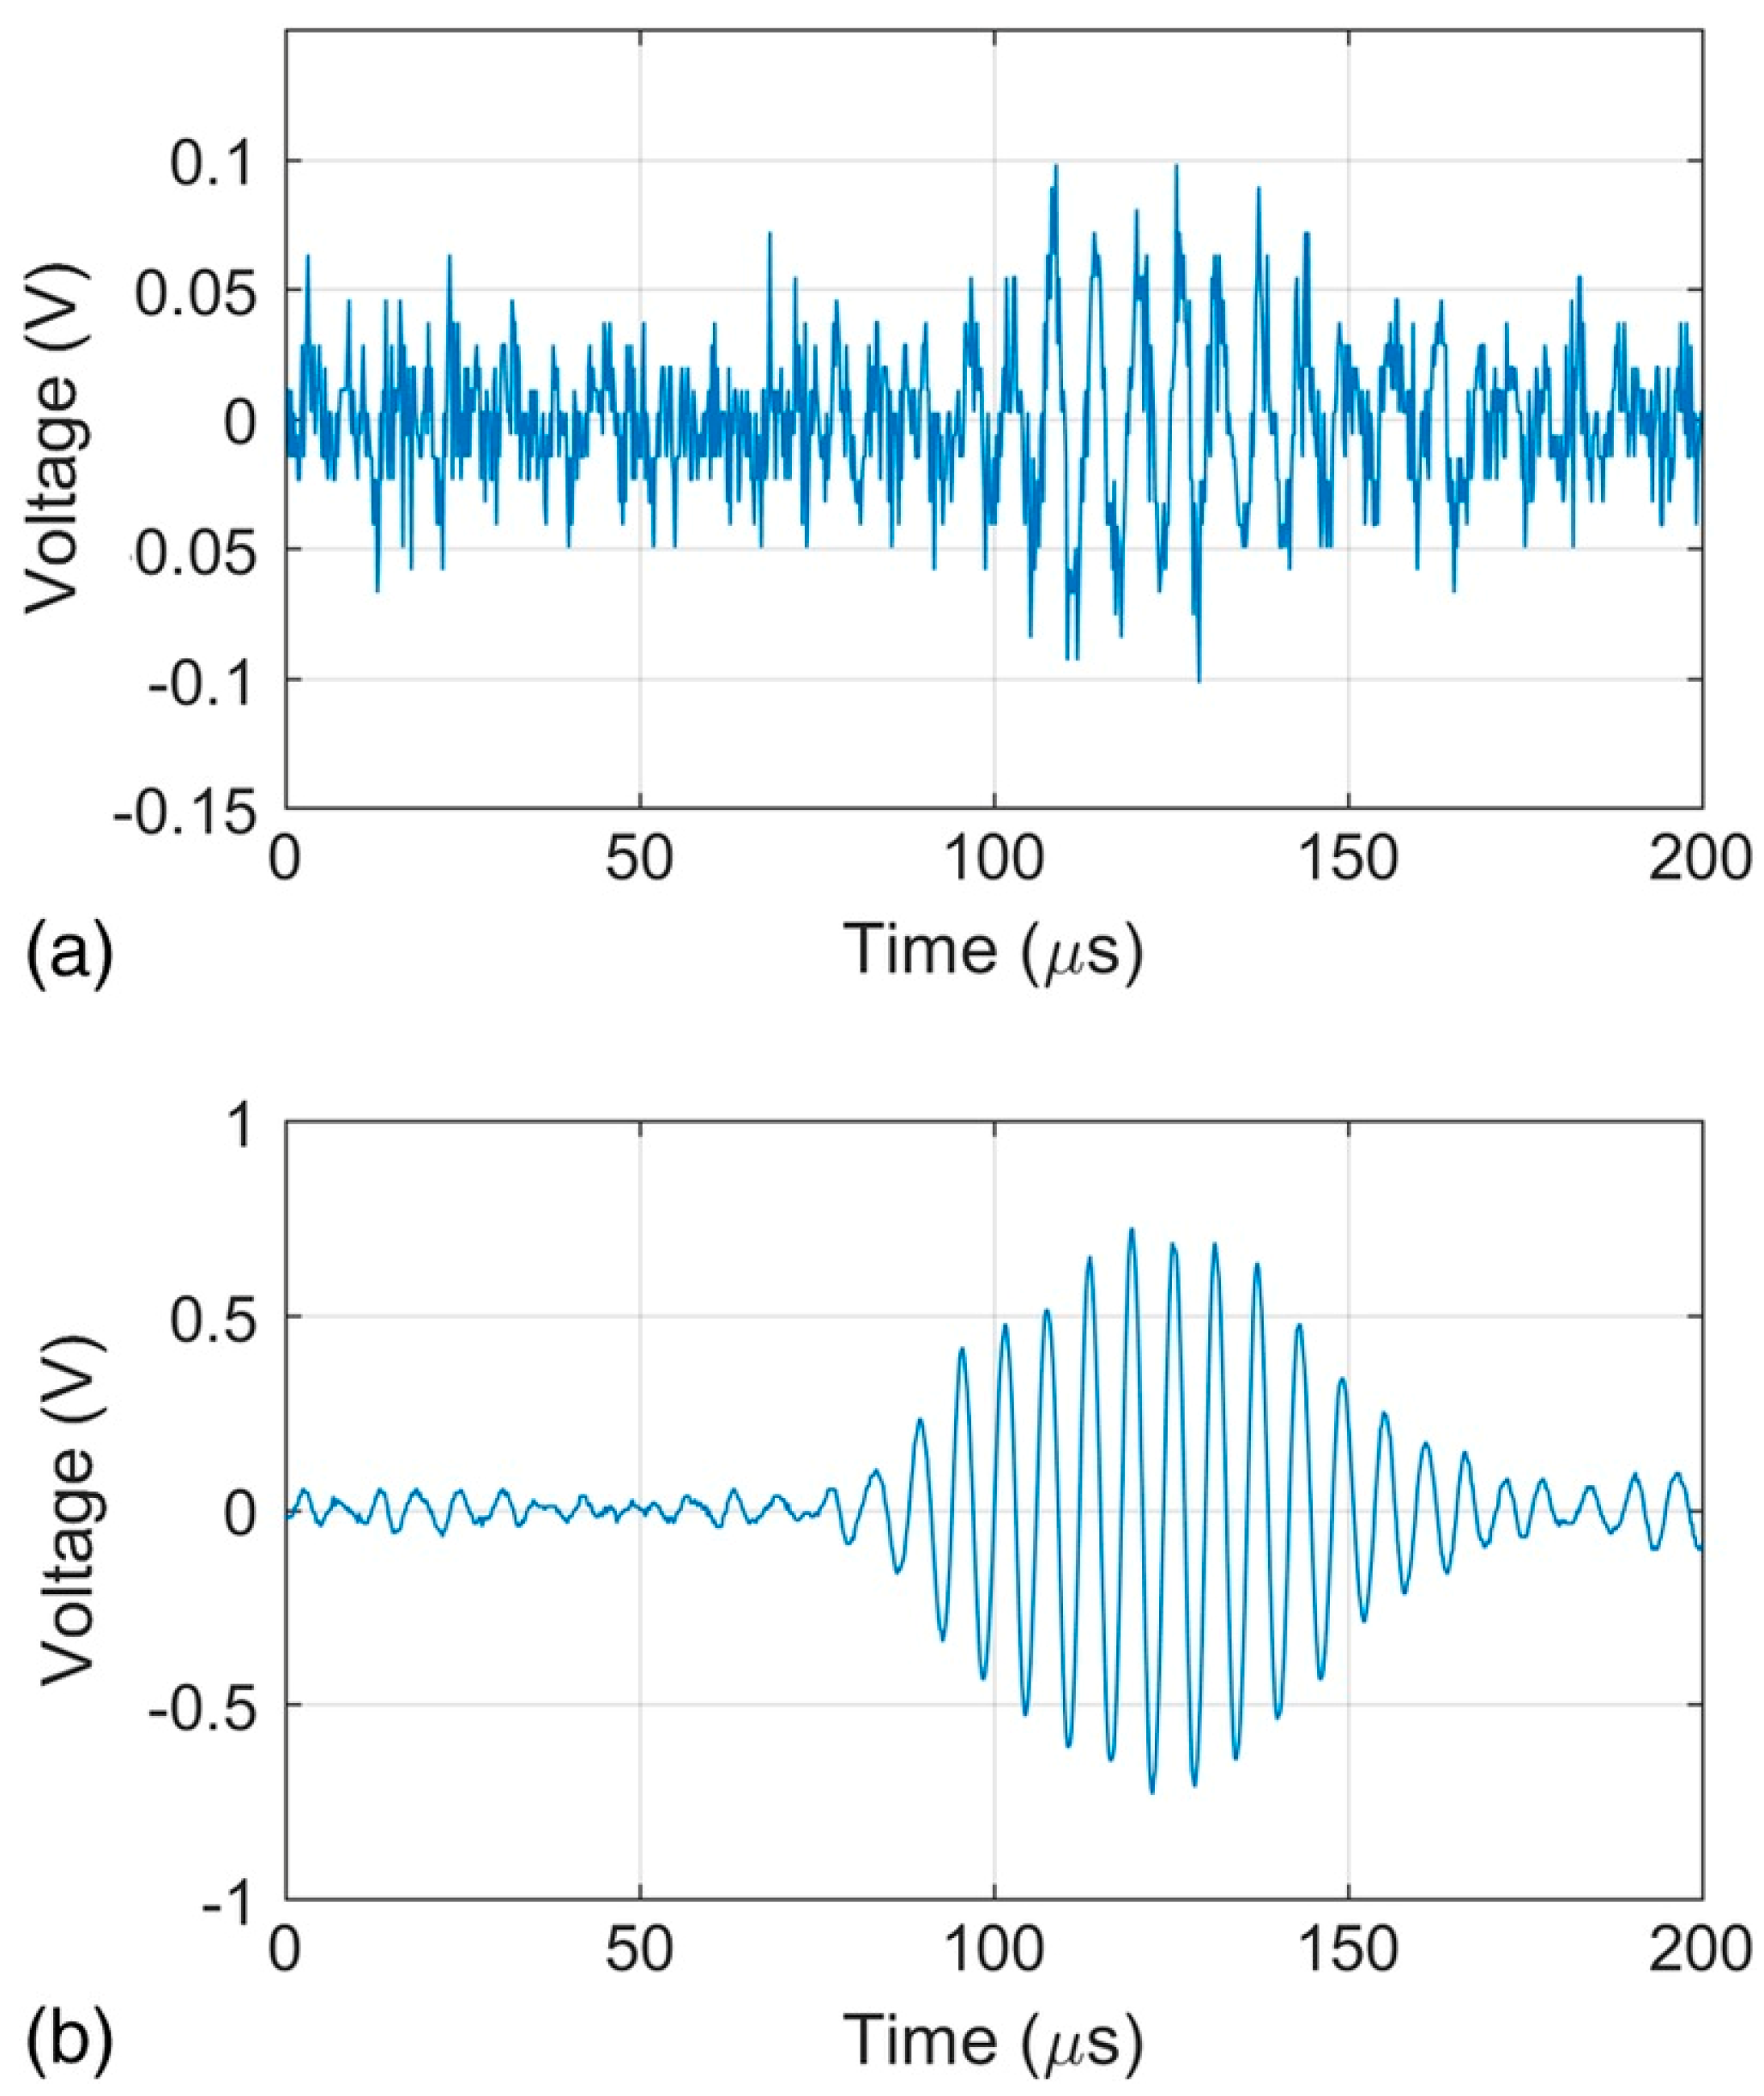
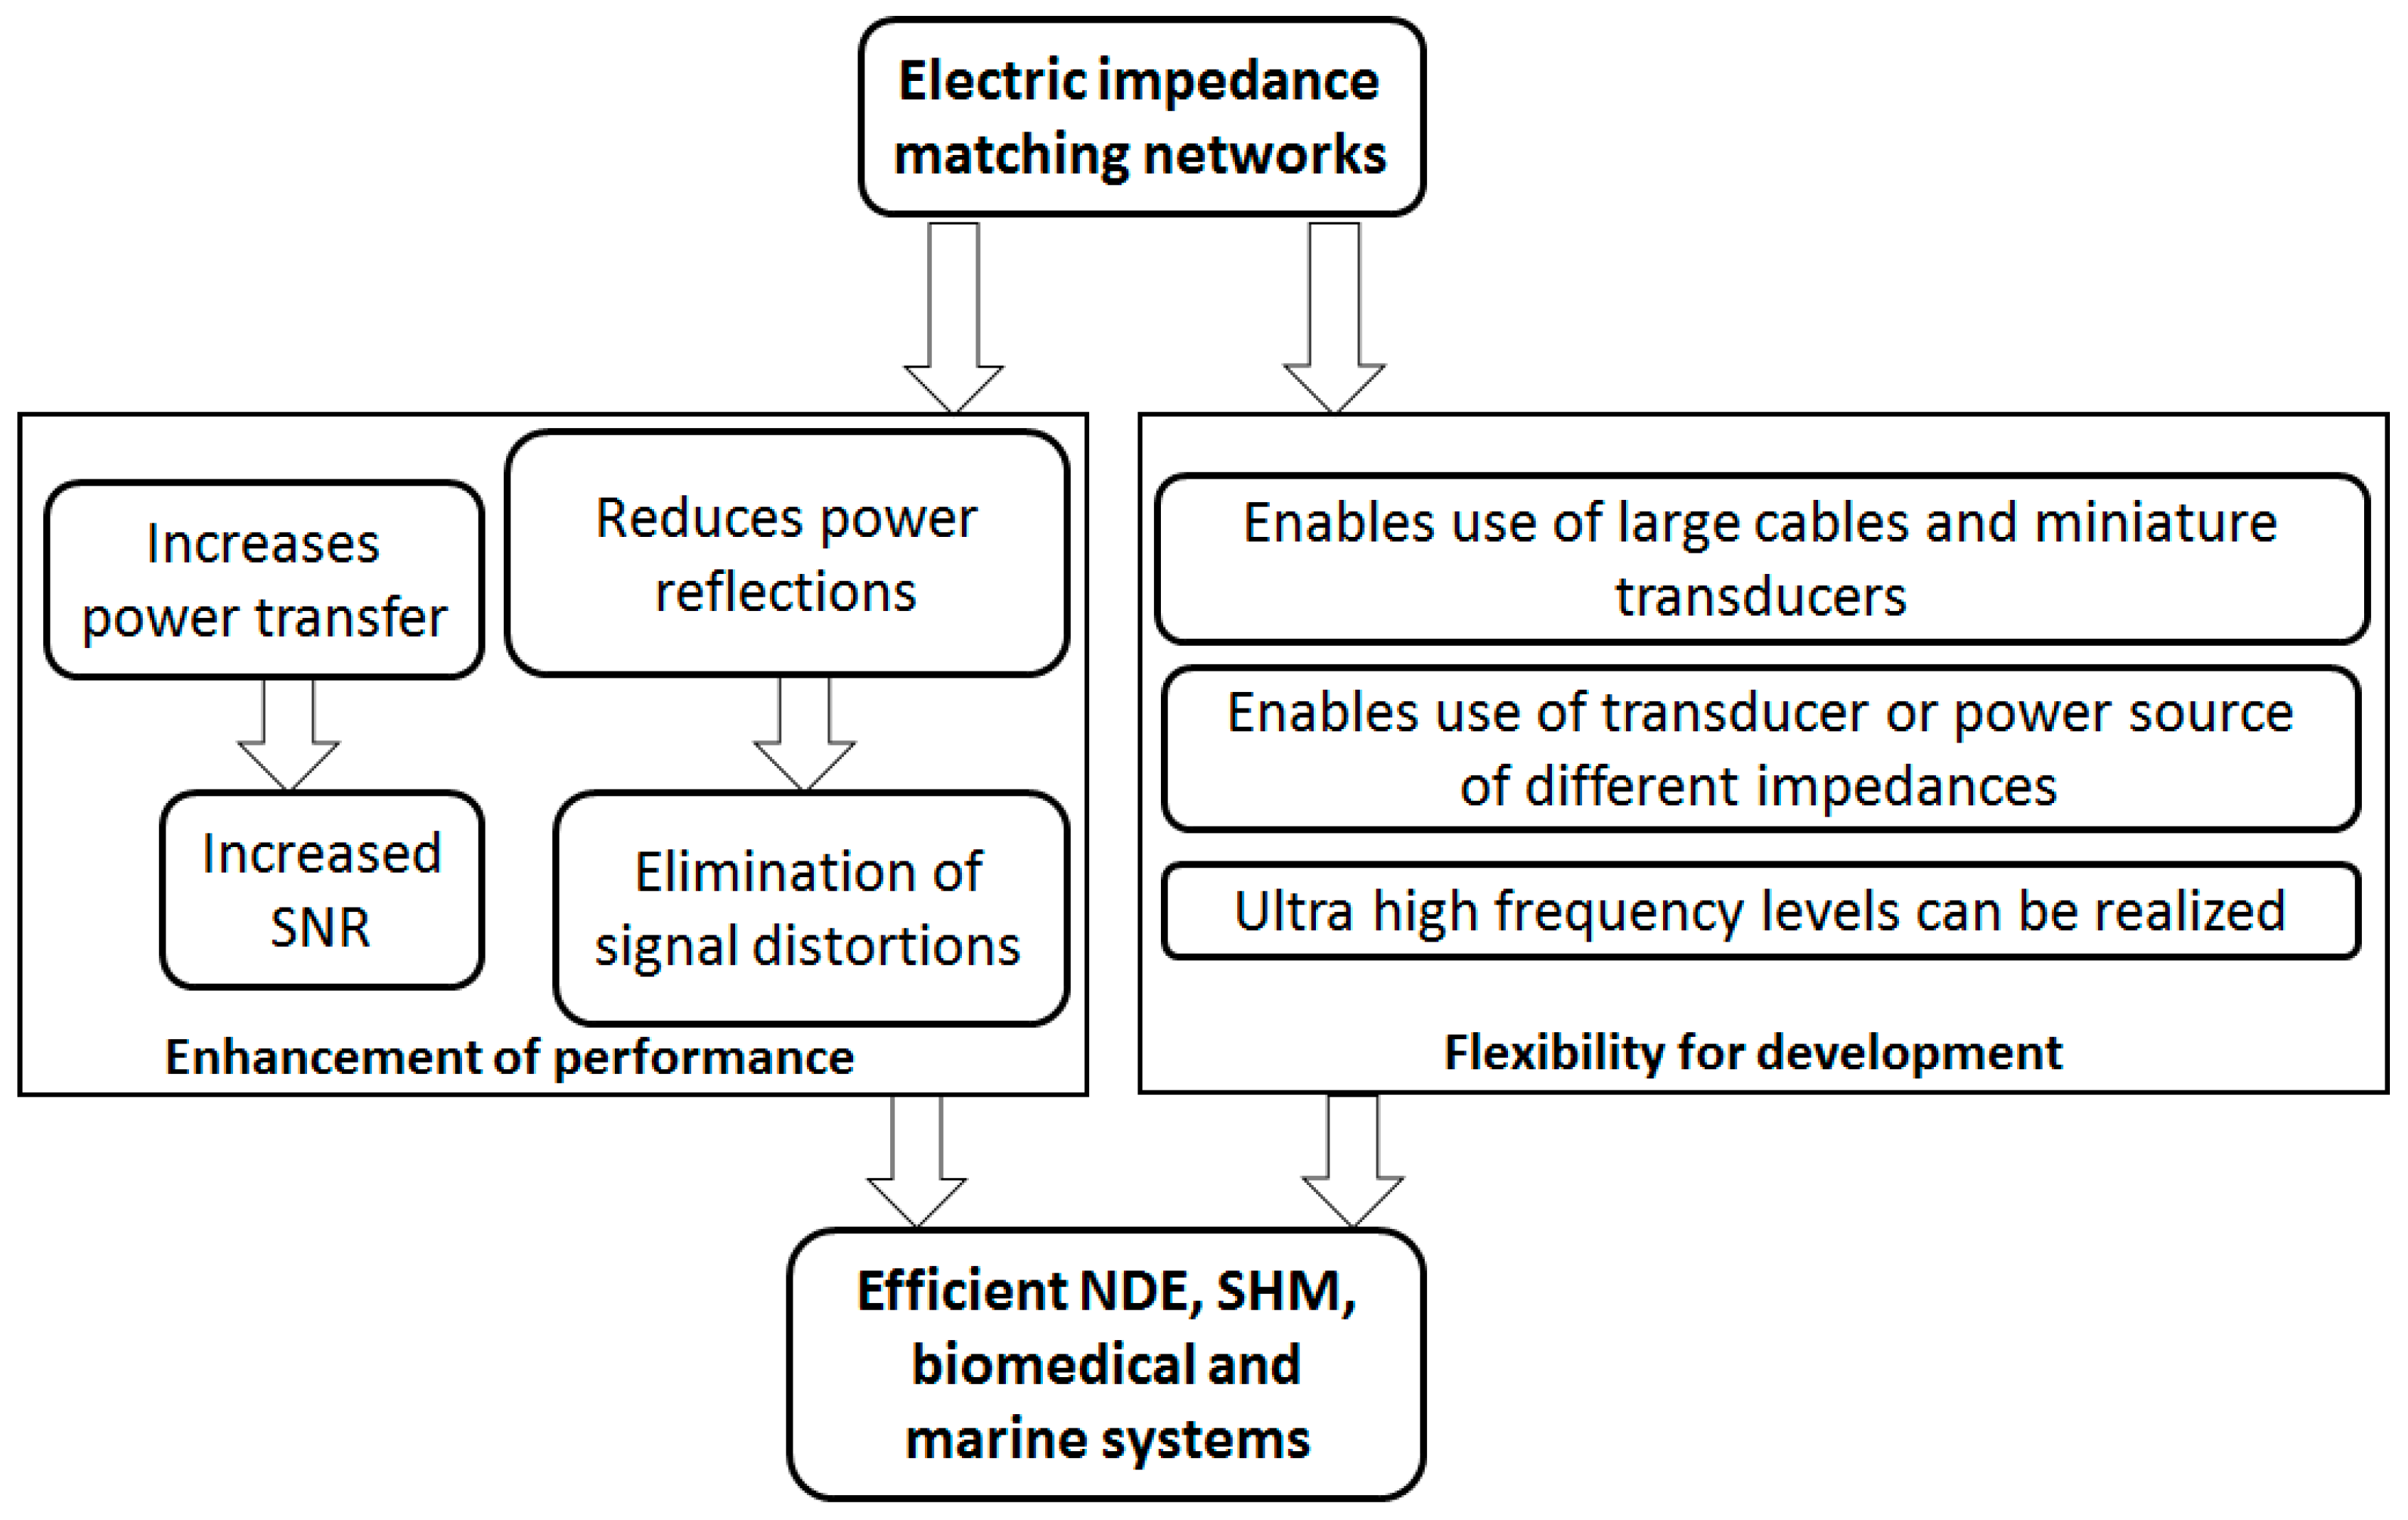
Table 1.
Acoustic and electric material properties of commonly used piezoelectric materials. Density-, sound velocity-, acoustic impedance-, electro-mechanical coupling-, quality factor-, and relative permittivity-.
Table 1.
Acoustic and electric material properties of commonly used piezoelectric materials. Density-, sound velocity-, acoustic impedance-, electro-mechanical coupling-, quality factor-, and relative permittivity-.
| Material | (kg/m3) | (m/s) | (MRayls) | Ref | |||
|---|---|---|---|---|---|---|---|
| PZT4 | 7500 | 4100 | 30.8 | 0.7 | 1300 | 500 | [96] |
| PZT5H | 7500 | 3850 | 28.9 | 0.75 | 3400 | 65 | [96] |
| BaTiO3 | 5700 | 5000 | 28.5 | 0.5 | 1700 | 300 | [96] |
| LiNbO3 | 4640 | 6400 | 29.7 | 0.5 | 30 | >1000 | [96] |
| PbTiO3 | 7660 | 5200 | 39.8 | 0.51 | 180 | — | [97] |
| PVDF | 1780 | 2200 | 3.9 | — | 5–13 | — | [97] |
| PMN-PT | 8030 | 4610 | 37.1 | 0.9 | 5000 | — | [97,98] |
Table 2.
Applications using electric impedance matching networks with appropriate tools, models, and methods used with appropriate reference for new techniques.
Table 2.
Applications using electric impedance matching networks with appropriate tools, models, and methods used with appropriate reference for new techniques.
| Sec | Application | Matching Components | Tool or Model Used | Method Used | Improved Parameter | Ref |
|---|---|---|---|---|---|---|
| 4.1 | Resonant frequency actuation | Actuator with power supply | BVD model | Single frequency | Voltage 300% | [28] |
| 4.2 | Broadband actuation and sensing | Transducer with power supply and receiver circuit | BVD model | Multi-frequency | Gain | [27] |
| 4.3 | Spike generation | Actuator with power supply | KLM model | Selective Damping | Bandwidth and voltage | [131] |
| 4.4 | Energy storage | Piezo-source with storage | Thevenin circuit | — | Power >20% | [31] |
| 4.5 | Power supply and preamplifier | Actuator with power supply and sensor with amplifier | — | — | Transducer velocity >1.7 | [150] |
| 4.6 | Cable attenuation | Transducer with power supply and receiver | — | — | Voltage | [90] |
| 4.7 | Ultra-thin transducer | Actuator with power supply | SMITH chart | L-type matching | Voltage >65% | [41] |
| 4.8 | Needle transducer | Transducer with pulser/receiver | Filter structure | — | Bandwidth, SNR | [120] |
| 4.9 | NDE | Transducer with preamplifier | L-type matching | — | Voltage >9x | [151] |
© 2019 by the author. Licensee MDPI, Basel, Switzerland. This article is an open access article distributed under the terms and conditions of the Creative Commons Attribution (CC BY) license (http://creativecommons.org/licenses/by/4.0/).
Share and Cite
MDPI and ACS Style
Rathod, V.T. A Review of Electric Impedance Matching Techniques for Piezoelectric Sensors, Actuators and Transducers. Electronics 2019, 8, 169. https://doi.org/10.3390/electronics8020169
AMA Style
Rathod VT. A Review of Electric Impedance Matching Techniques for Piezoelectric Sensors, Actuators and Transducers. Electronics. 2019; 8(2):169. https://doi.org/10.3390/electronics8020169
Chicago/Turabian StyleRathod, Vivek T. 2019. "A Review of Electric Impedance Matching Techniques for Piezoelectric Sensors, Actuators and Transducers" Electronics 8, no. 2: 169. https://doi.org/10.3390/electronics8020169
Note that from the first issue of 2016, this journal uses article numbers instead of page numbers. See further details here.