1. Introduction
Power Line Communication (PLC) designates the technology that allows for the transmission of data through the electrical grid. The use of PLC technology offers several advantages when compared to wireless communication [
1]. Like wireless communication, additional cabling is not required. PLC technology can be used as an alternative for data exchange among devices connected to the electrical grid. However, this communication carried out through the electrical grid is affected by several factors, such as attenuation and noise of equipment connected to it.
The measurement of variables of the industrial environment, such as electric current, voltage, temperature, position, humidity and vibration, among others, can be used for decision making, contributing to better performance in the productive process. PLC technology can also bring advantages and facilitate the transmission of this information to decision makers [
2].
This technology can contribute to the transition from traditional industry to the fourth industrial revolution, called industry 4.0. The industrial production of this new era will be highly flexible in terms of production volume and customization, extensive in integration among consumers, companies and suppliers and, above all, sustainable, making use of the existing legacy network [
3].
PLC systems can be divided into groups, according to the frequency bands allocated for operation. PLC systems can be generally classified into two groups: NBPLC, also known as narrowband PLC and BPLC, known as broadband PLC.
Broadband PLC is recommended for Smart Home applications and solutions [
4], while the use of narrowband PLC systems seems to be more appropriate for remote data acquisition and automatic measuring systems [
5].
This technology can be an alternative to wireless communication networks, for the recent applications that require great capillarity of communication, such as Machine-to-Machine (M2M) and Internet of Things (IoT) [
6].
PLC technology can contribute to the transition from traditional industry to the fourth industrial revolution called Industry 4.0, which proposes high flexibility in industrial production in terms of volume of production and customization, extensive integration among consumers, companies and suppliers and above all, making use of the existing legacy [
7].
Today, the Power Line Communication can be considered interesting for the implementation of Smart Grids in the industrial context [
8]. Unfortunately, adverse industrial environment, noisy communication channel, installation problems and interfering communications can reduce the PLC’s reliability and require that preliminary site surveys be performed and can be used in applications to provide non-time critical information [
9].
Thus, the use of PLC can be an excellent alternative, especially by making use of the legacy infrastructure existing in older industries, which had no last mile communication included in the design of their manufacturing plants. This communication protocol can help, at a low cost of implementation, the data collection of field devices, subsidizing the implementation of concepts of technologies such as Industrial Internet of Things (IIoT) [
10] and Industry 4.0 [
11]. These technologies require in many situations a great capillarity of sensors and actuators, which has characteristics of low volume of data packets [
12,
13].
In this context, aspects related to the interferences caused by industrial equipment on the electrical grid used for data communication must be evaluated in order to obtain reliability and quality in the use of PLC technology. The choice of a communication protocol, modulation techniques and signal demodulation, as well as characteristics of the scenario where the PLC system is used can influence the performance of the PLC communication system [
14].
Thus, the analysis of behavior and performance of a communication protocol that allows the transmission of data through the electrical grid is fundamental for its application in an industrial environment.
In this scenario, some papers analyzed the communication performance of Broadband-PLC or Narrowband PLC based on PRIME technology, in different noise scenarios [
15,
16,
17]. In this study, the G3-PLC standard was chosen to perform an analysis in a representative last-mile industrial environment with different noise scenarios, with the objective of verifying the technical feasibility of the standard in an industrial environment and the influence of noise interference generated by other equipment in its communication.
This paper is organized as follows:
Section 2 details the features of the electrical grid communication;
Section 3 presents introduce industrial communication networks;
Section 4 describes in detail the experimental methodology used in this study;
Section 5 describes the results obtained in the different test scenarios, which are discussed in
Section 6; final considerations are in
Section 7.
2. Power Line Communication—PLC
The PLC technique is characterized by making it possible to transmit data using the same physical medium that is used for the distribution of electric energy. According to [
8], PLC technology had its first implementations developed in the last century, for automation of high and medium voltage distribution grids.
According to [
18], the PLC channel presents hostile conditions for transmission of communication signals, such as the presence of noise and interference.
Four unified narrowband PLC international standards are developed including PRIME, G3, IEEE P1901.2 and G.HNEM and according to the CENELEC (European Committee for Electrotechnical Standardization) frequency bands, all these four standards are applied in CENELEC A band (35.9–90.6 kHz), with the utilization of the U.S. Federal Communication Commission (FCC) band [
16].
Table 1 summarizes the Narrowband PLC technologies.
Narrowband PLC operates in low and medium frequency bands (3–500 kHz) and presents as an appropriate technique for data acquisition and intelligent measuring systems [
5]. Its frequency bands are determined by regulators such as ARIB (Association of Radio Industries and Businesses), US FCC (United States Federal Communications Commission) and CENELEC (European Committee for Electrotechnical Standardization) [
19].
In special, CENELEC regulates four frequency bands for communication through the electrical grid at medium and low voltage, separated according to the application [
20]. Are listed in Class from A to D: CENELEC-A is used to Electricity providers and their concessionaires; CENELEC-B is used to Consumer use without defined access protocols; CENELEC-C is used to Consumer use with CSMA Compliant Protocol; and CENELEC-D is used to Consumer use without defined access protocols. The CENELEC A band operates in the frequency range of 3 kHz to 95 kHz, this same range was used to perform the tests of this article.
According to the IEEE 1901.2 standard for narrowband PLC, there are two proposals related to the physical layer and access control to the PLC medium, known as G3 and PRIME [
21].
Using the G3-PLC standard, carriers can be modulated using techniques known as BPSK, QPSK or 8PSK. According to [
22], carriers can also be modulated using ROBO mode, (robust operation). ROBO is a variation of BPSK modulation, developed especially to operate under high noise conditions.
In the G3-PLC standard, the normal FEC encoder mode consists of Reed-Solomon (with 16 bytes of parity), whereas in the robust mode encoder (ROBO), the FEC encoder consists of a Reed-Solomon encoder (with 8 bytes of parity) and a convolutional encoder followed by a repetition code (RC). When operating in robust mode, the RC encoder repeats each bit 4 times, making the system more robust to adverse conditions; however, the transfer rate is lower than that of other modulations [
21].
The PLC presents some valuable advantages to potential coverage due to the electrical wires, making every line-powered device a potential target of value-added services through PLC. Moreover, the installation is already deployed, easy to manage and stable. On the other hand, the greatest disadvantages of PLC are mainly related to the electric line-powered, due to existing disturbances, noises and attenuations and consequently, the global capacity of PLC in terms of bandwidth is less than other technologies [
16].
In view of the different modulation characteristics available, it is necessary to choose the appropriate modulation that will transmit the information via the carriers.
3. Industrial Communication Networks
An industrial control network is a system of interconnected equipment used for the monitoring and control of physical equipment in an industrial environment, with three main purposes: control, diagnosis and security information [
23]. Nowadays, the vast majority of industries have digital, bidirectional and multipoint communication between intelligent devices used in factory automation applications, based on IEC 61158 standardization [
24].
In recent years, Ethernet-based standards have been successful and have even been standardized for some critical applications that require real-time support. In addition, for situations in which cabling is critical, the industrial control and automation sectors invested in the development and standardization of new wireless solutions (WirelessHART, ISA 100.11a and WIA-PA) are aimed at the automation of processes to support non-critical control functions and control functions [
25].
Every major standard has advantages and disadvantages when it comes to the industrial environment, as the applications are diverse. While some applications require real-time, others can withstand small delays when it comes to monitoring, for example. In addition, there are noisy environments, which cause interference in the transmitted data, requiring shielded cables for communication, characteristic of some protocols.
One of the lower-speed communication protocols is the AS-i which was defined and developed in the 90s and is still widely used, is suitable for connecting sensors and simple actuators. Its main characteristics are:
bus distance up to 100 m without repeaters, or 500 m with repeater use;
maximum of 62 slaves; 16-bit transmission; and the need for power supply [
26].
These network features were used as a reference for industrial communication for the analysis of the G3-PLC Standard.
Connection/disconnection commands could also be introduced within the available data rate in PRIME-G3. Connection/disconnection commands allow switching on/off different assets remotely, according to prefixed set points.
In addition, some applications are also included with implementing IP (Internet Protocol) over a PLC-PRIME deployment is that the implementation benefits from the features of the standard (e.g., network autoconfiguration, robustness and topological information, among others), as well as having direct access to the assets [
15].
4. Experimental Methodology
To realize the experimental setup, two PLC modems were used in an experimental industrial last mile. To characterize the industrial noise, different electric machine test sets in an academic power laboratory are connected together to represent the last-mile industrial environment.
The communication hardware used was based on the Texas Instruments development TMDSPLCKITV4-CEN and the Zero Configuration and Intermediate, manufacturer’s proprietary software of configuration and analysis software.
This Developer Kit enables development of software based Power Line Communication (PLC) modems. The kit includes two PLC modems based on the C2000 TMS320F28069 controlCARD and advanced PLC analog front end AFE031. The included PLC SUITE software supports several communication techniques, including OFDM (PRIME/G3-PLC and 1901.2) and is SFSK-capable.
As main features, through a USB communication, it allows you to configure one of the CENELEC frequency bands, choose the transmission modulation (8PSK, BPSK, QPSK and ROBO), as well as other characteristics such as data packet size in bytes, time interval between the sending of data packets and also the number of data packets to be sent.
The frequency range chosen was CENELEC A 36, using 36 carriers located between 36 kHz and 91 kHz [
27]. This frequency was chosen after verification, through the first tests carried out, that there was less noise present in the spectrum range of its carriers, besides being the largest spectrum range available.
In a first investigation moment, was available the four protocols and various data length to reduce the set of tests with the best performance options of the use of the G3-PLC technique.
To available the noise in the transmission, a controlled and sequential drive of motors based in random order was used to perform 3 parallel analyses, among them:
- (i).
verify the behavior of four signal modulations to transmit data via electrical grid: 8PSK, QPS, BPSK and ROBO;
- (ii).
evaluate the sending of data packets with variable sizes of (1, 2, 4, 8, 16, 32 and 64 Bytes); and
- (iii).
verify the efficiency and reliability of the modulations in an industrial environment, at different noise levels (characterized by the actuating of 0–10 inverters/motors).
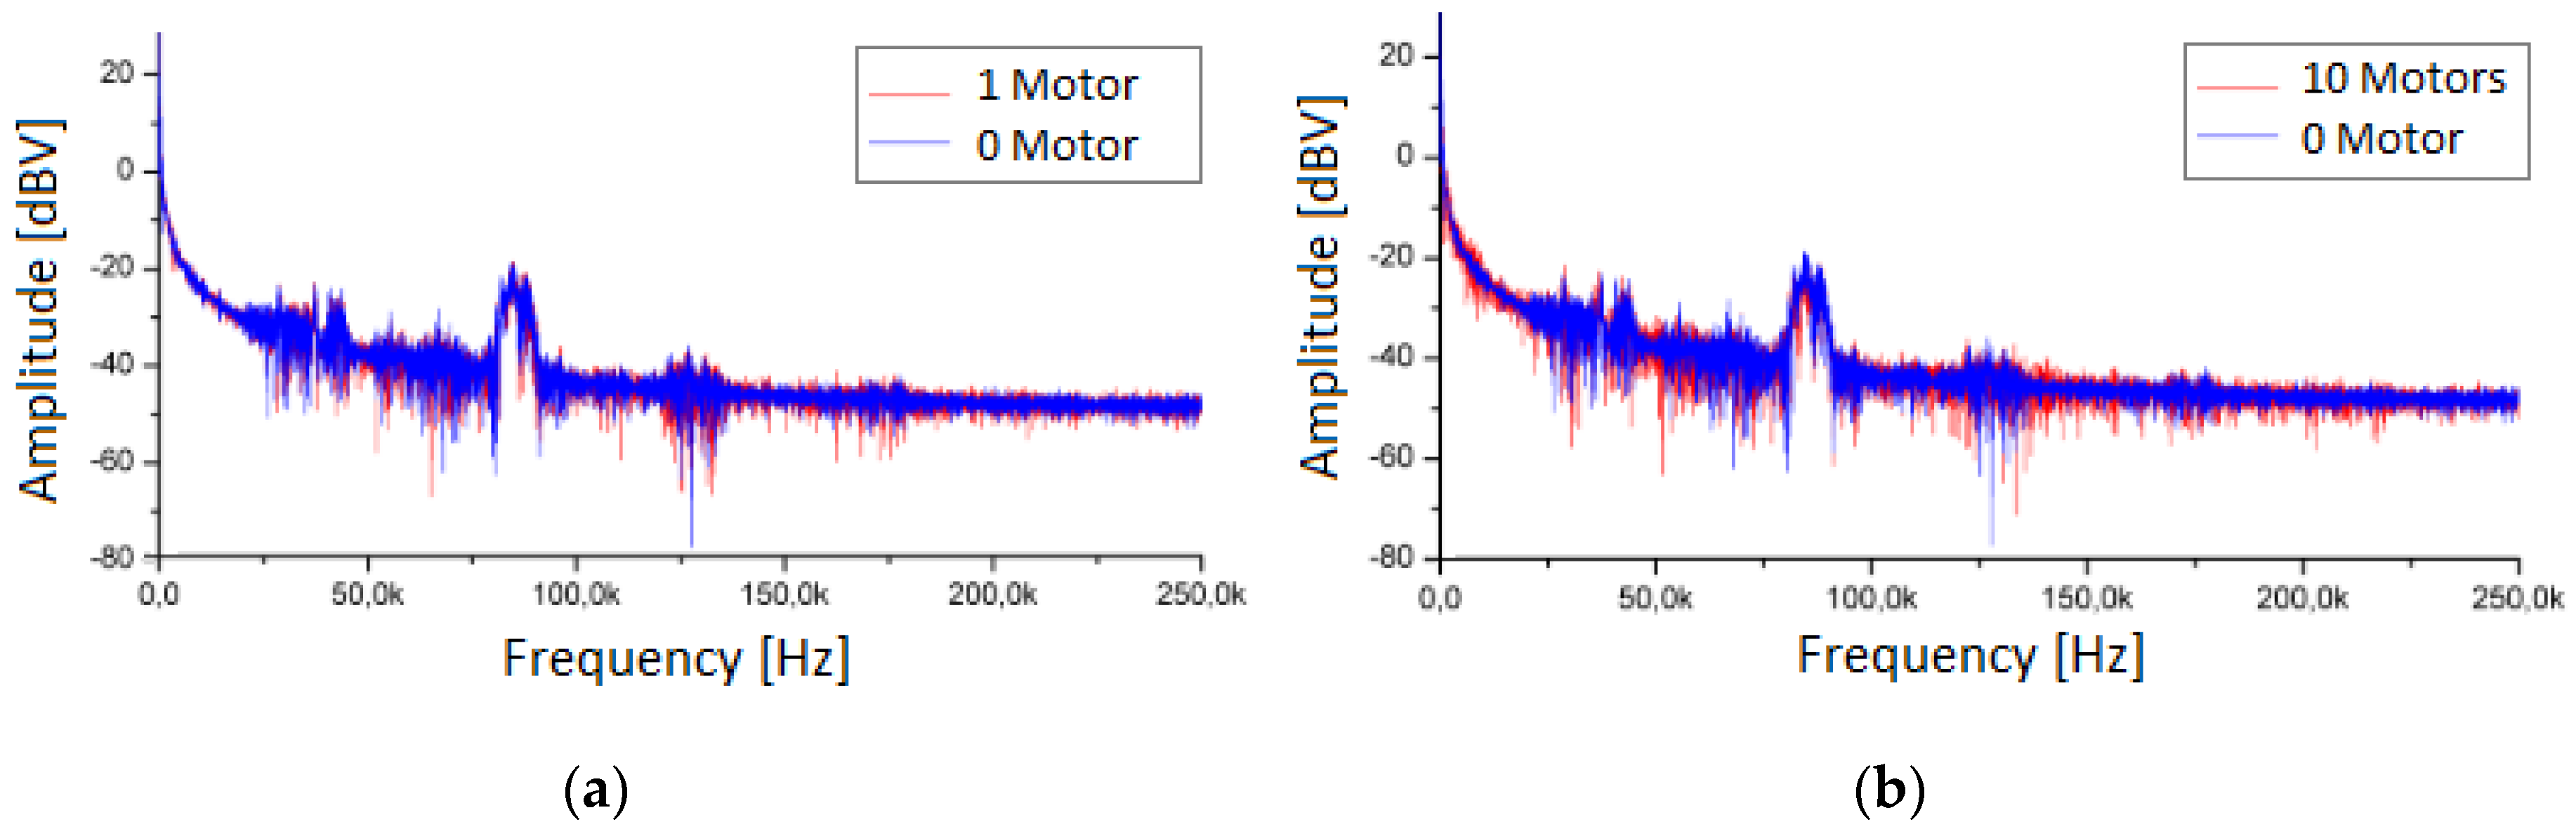
To illustrate the noise in the last-mile powerline,
Figure 1 presents two spectrums of frequencies in the PLC window. The first, to compare the white noise of the network and the one motor noise. The second, to compare the white noise and ten motors noise. Is possible to verify that the noise increase with the motor noise insertion.
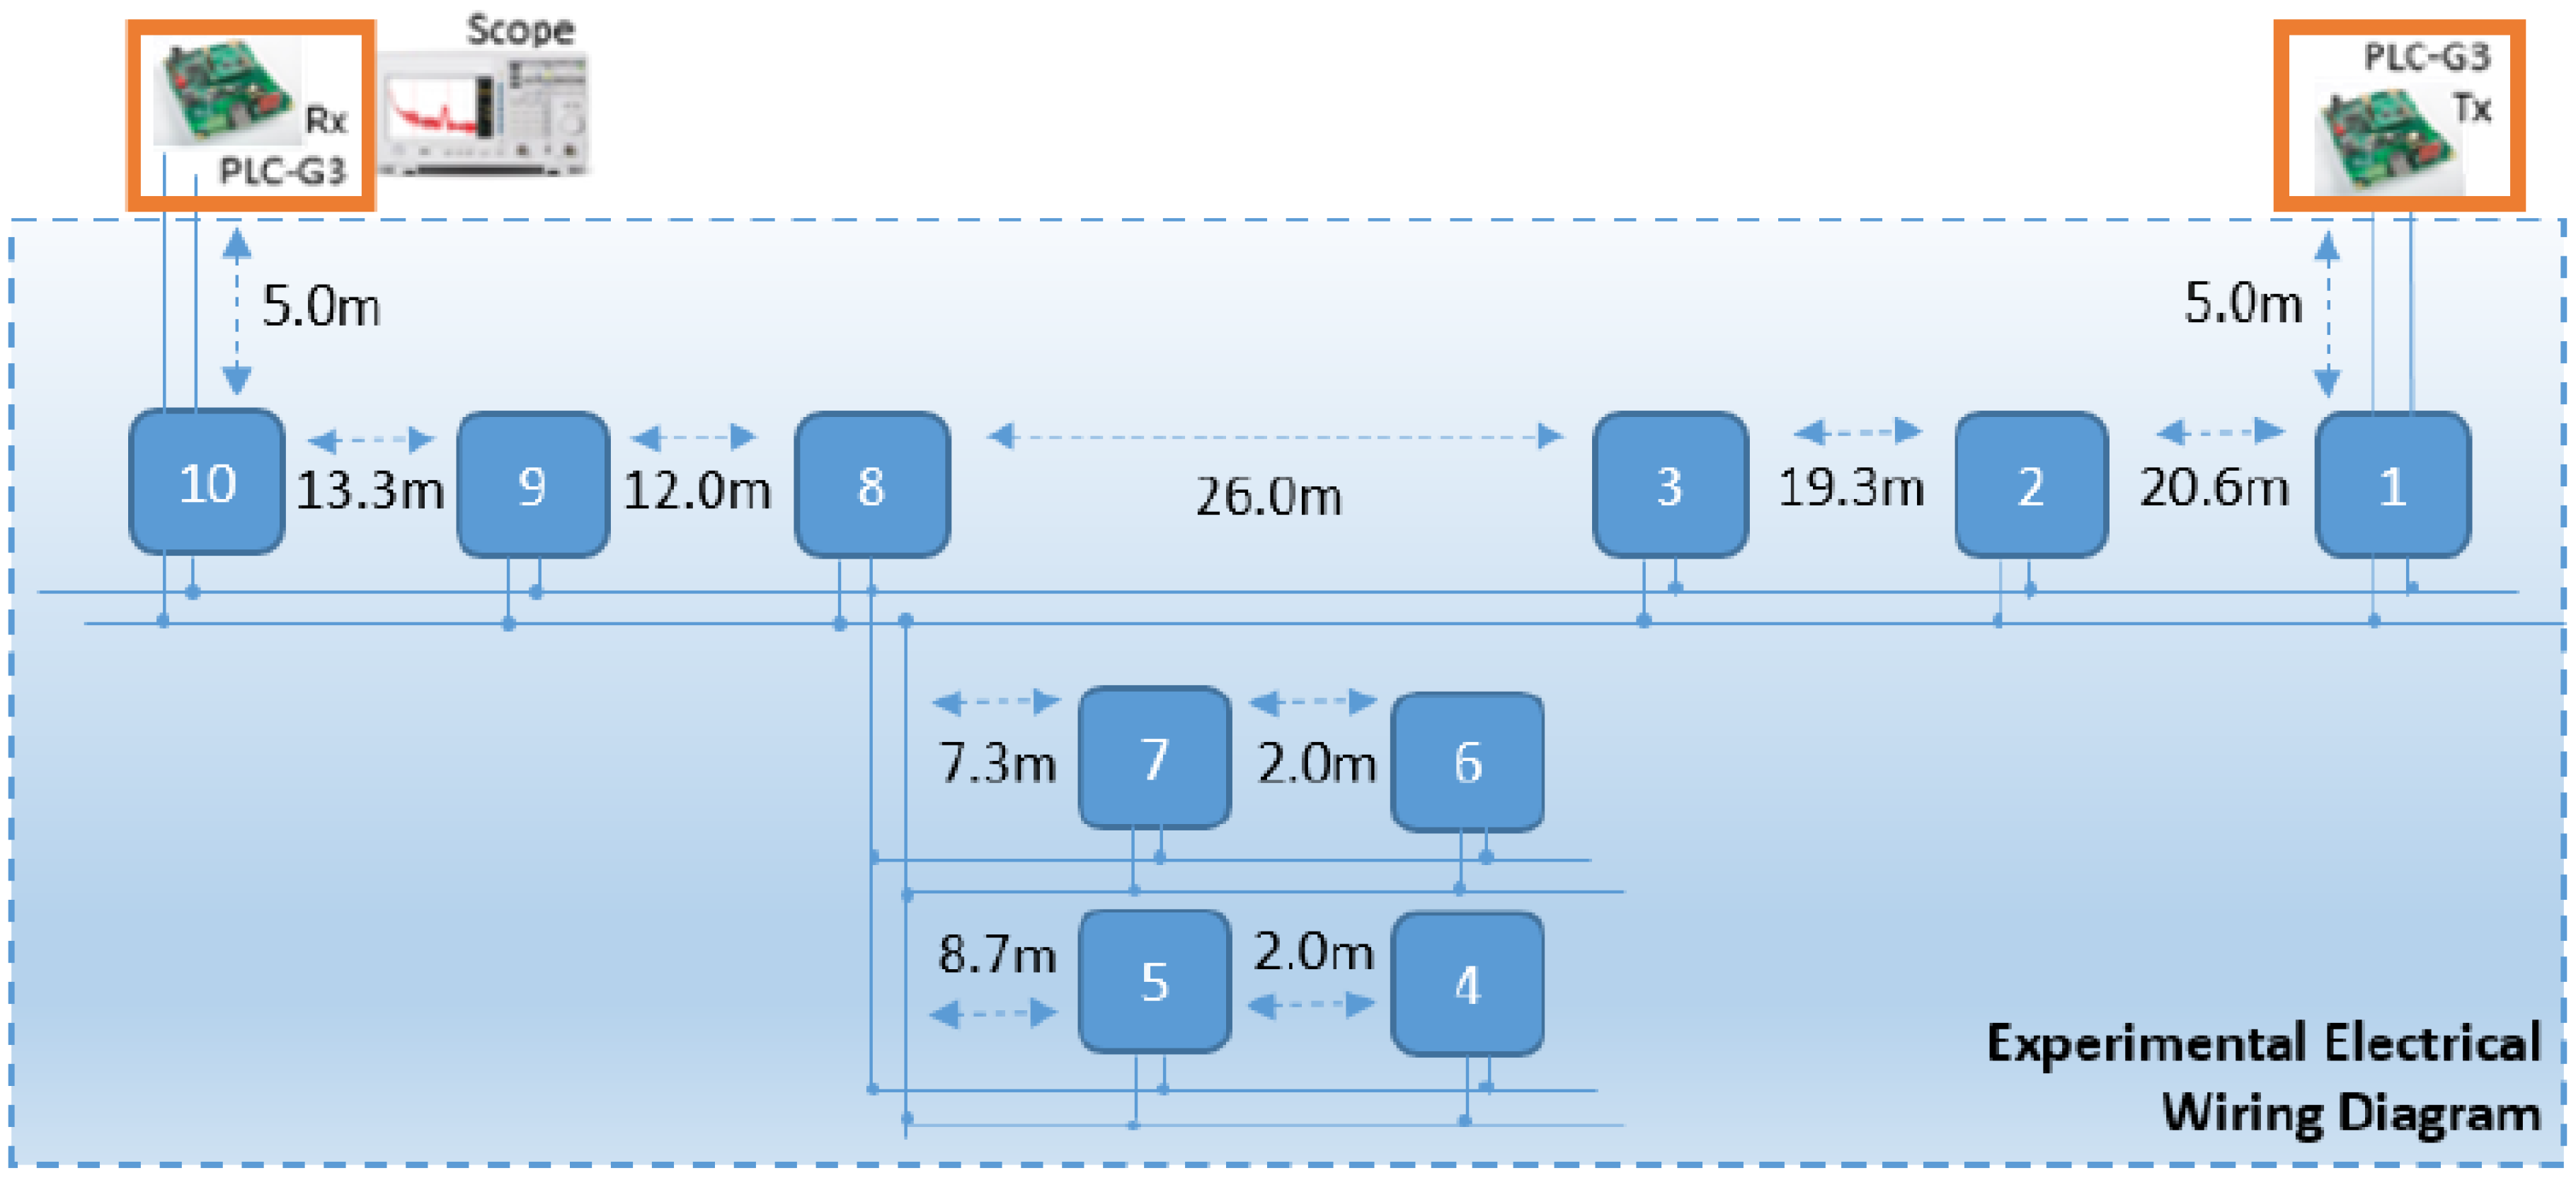
The simplified electric diagram of
Figure 2 represents the laboratory of the test scenarios with the representation of the last-mile industrial environment. This figure also shows the noise sources (motors/inverters), numbered from 1 to 10, to control the order of the actuators, the modems (Tx/Rx), the spectrum analyzer and the distances between all the elements of this diagram.
The diagram in
Figure 2 shows that the workbenches are basically connected in 4 branches parallel to each other to a grid connected to the electrical grid. In this way, the maximum distance of the link is composed of the sum of the branches formed by the workbenches (10, 9 and 5) and (6, 7 and 8), totaling 101.2 m. The other branches insert noise in the middle of the transmission, without increasing the maximum length of the link between Tx and Rx. Thus, in proposing the G3-PLC protocol as an access medium for industry network use, the length of the bus used in the test scenario was equivalent to that of the AS-i industrial protocol, where the maximum bus length, without the need for a signal repeater, is 100 m.
In addition, it is important to note that this set of motor noise is inserted in a network with numerous fluorescent lighting reactors and switching sources of computer equipment, among other equipment, generating what can be denominated white or background noise.
For each data size, 1000 packets were sent five times. In each transmission window, the number of packets received with errors was analyzed, as well as the data transmission rate.
Through this first analysis, it is possible to reduce the number of modulations and the set of data length to be analyzed, so that, from this, can better analyze the performance according to the industrial characteristics.
In a second investigation, three different test scenarios were created to simulate an industrial environment for analysis of the proposed communication. They enabled to characterize some situations present in this type of environment, that is, high noise levels due to electronic equipment, especially those that are responsible for the control of electric motors.
4.1. Scenario 1: Evaluation of Inverter/Motor Interference in the Quality of PLC Communication
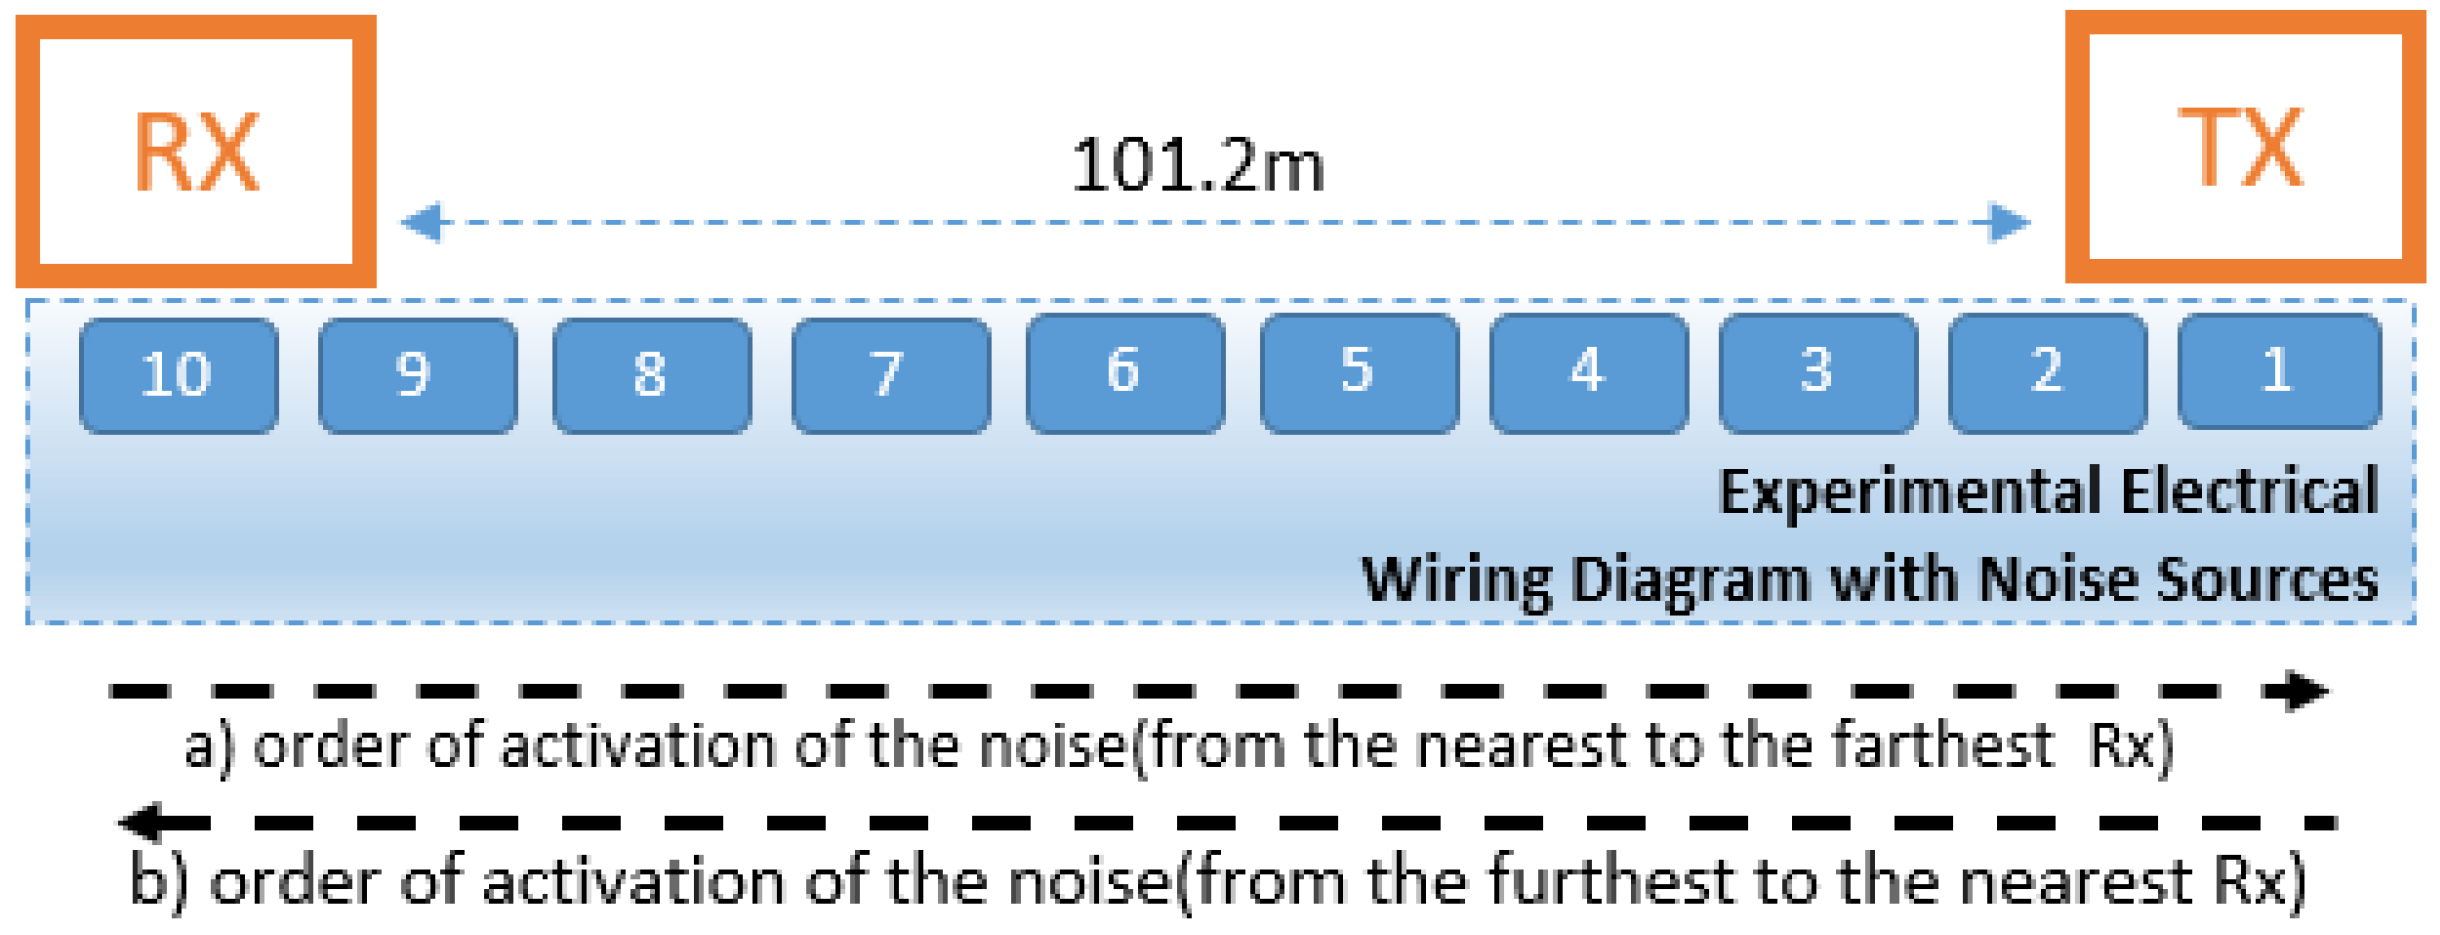
This scenario was characterized to verify the noise interference caused by inverters/motors in PLC communication in order to verify if there is any difference between the noise being close to the transmitting or receiving modem. To this end, the noise was inserted over the grid in ascending and descending orders.
In the first analysis, the noise sources were activated according to their distances from the Tx modem and the graded inserts were evaluated in two ways: from the closest to the Tx to the farthest; and in the opposite way, from the farthest to the nearest, as shown in
Figure 3.
4.2. Scenario 2: Evaluation of the Distance between the Sending/Receiving Modem and the Noise Source
Parallel to the technical modulation, the electrical parameters of the transmission medium intervene directly in the communication characteristics. In this direction, it is important to analyze the influence of the impedance and, in particular, the inductance insertion must be analyzed using classical equations for parallel cables and a precision LCR meter to confirm [
28].
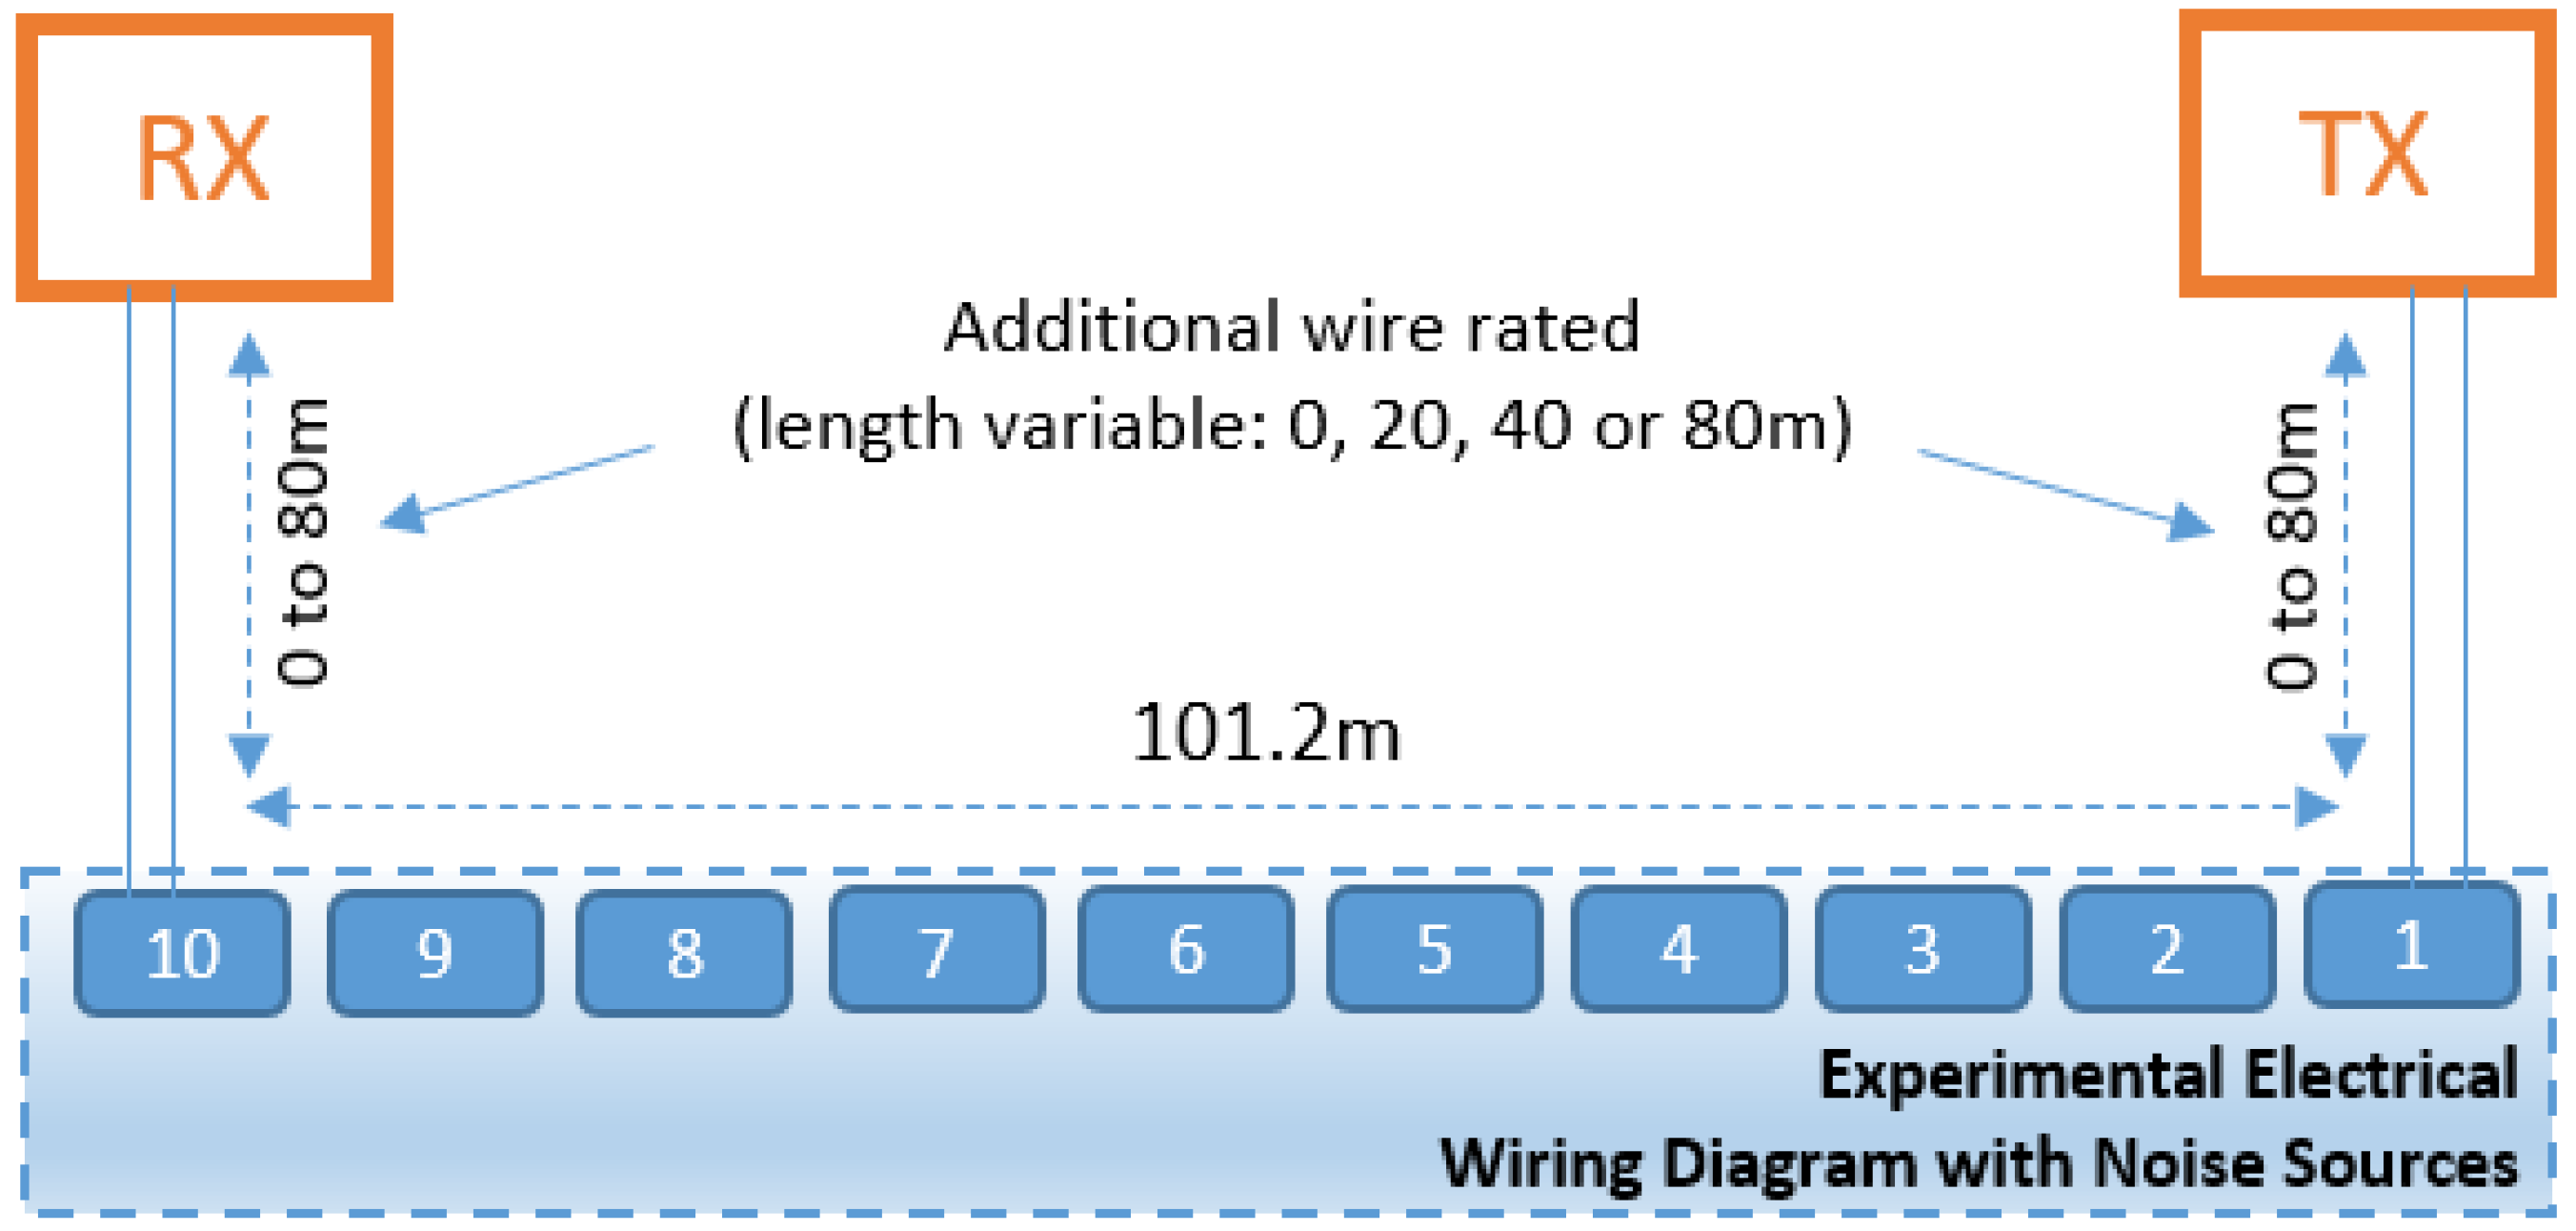
Thus, from the results obtained in the first test scenario, it was verified the need to evaluate the influence of noise closer to the transmitting modem separately from the receiving modem. Thus, in this scenario, at first, a distance of 5 m was maintained separating the receiving modem from the noise source, while the distance separating the transmitting modem from the noise source was gradually increased for every 20 m stretched. It started with a distance of 20 m until reaching 80 m between the transmitting modem and the noise source, as showed in
Figure 4.
The same evaluation was performed for the receiving modem, gradually lengthening the distance of the cable separating the receiving modem from the noise source and maintaining a distance of 5 m between the transmitting modem and the noise source. To do this was defined as our worst case of noise insertion (10 actuated inverters/motors, besides the white noises of the network).
In this scenario, it was possible to observe the interference of the distances inserted in PLC communication. The additional cable inserted can be considered as an inductive impedance. A GW INSTEK LCR-819 Precision LCR Meter was used to measure the inductance value present in the stretched cables distanced 100 mm.
Thus, 5 m of stretched cabled was measured and multiplied by 4, 8, 12, 16 (representing the number of 5-m pieces required to obtain the distances used between the 20, 40, 60 and 80 m modems), since the characteristic inductance of the electric grid is summed. From this analysis, the values shown in
Table 2 were obtained.
Due to the perception that the inductive characteristic presents in the electrical grid interfere with the quality of PLC communication, the inductance values were maximized by winding the cables, giving rise to scenario 3.
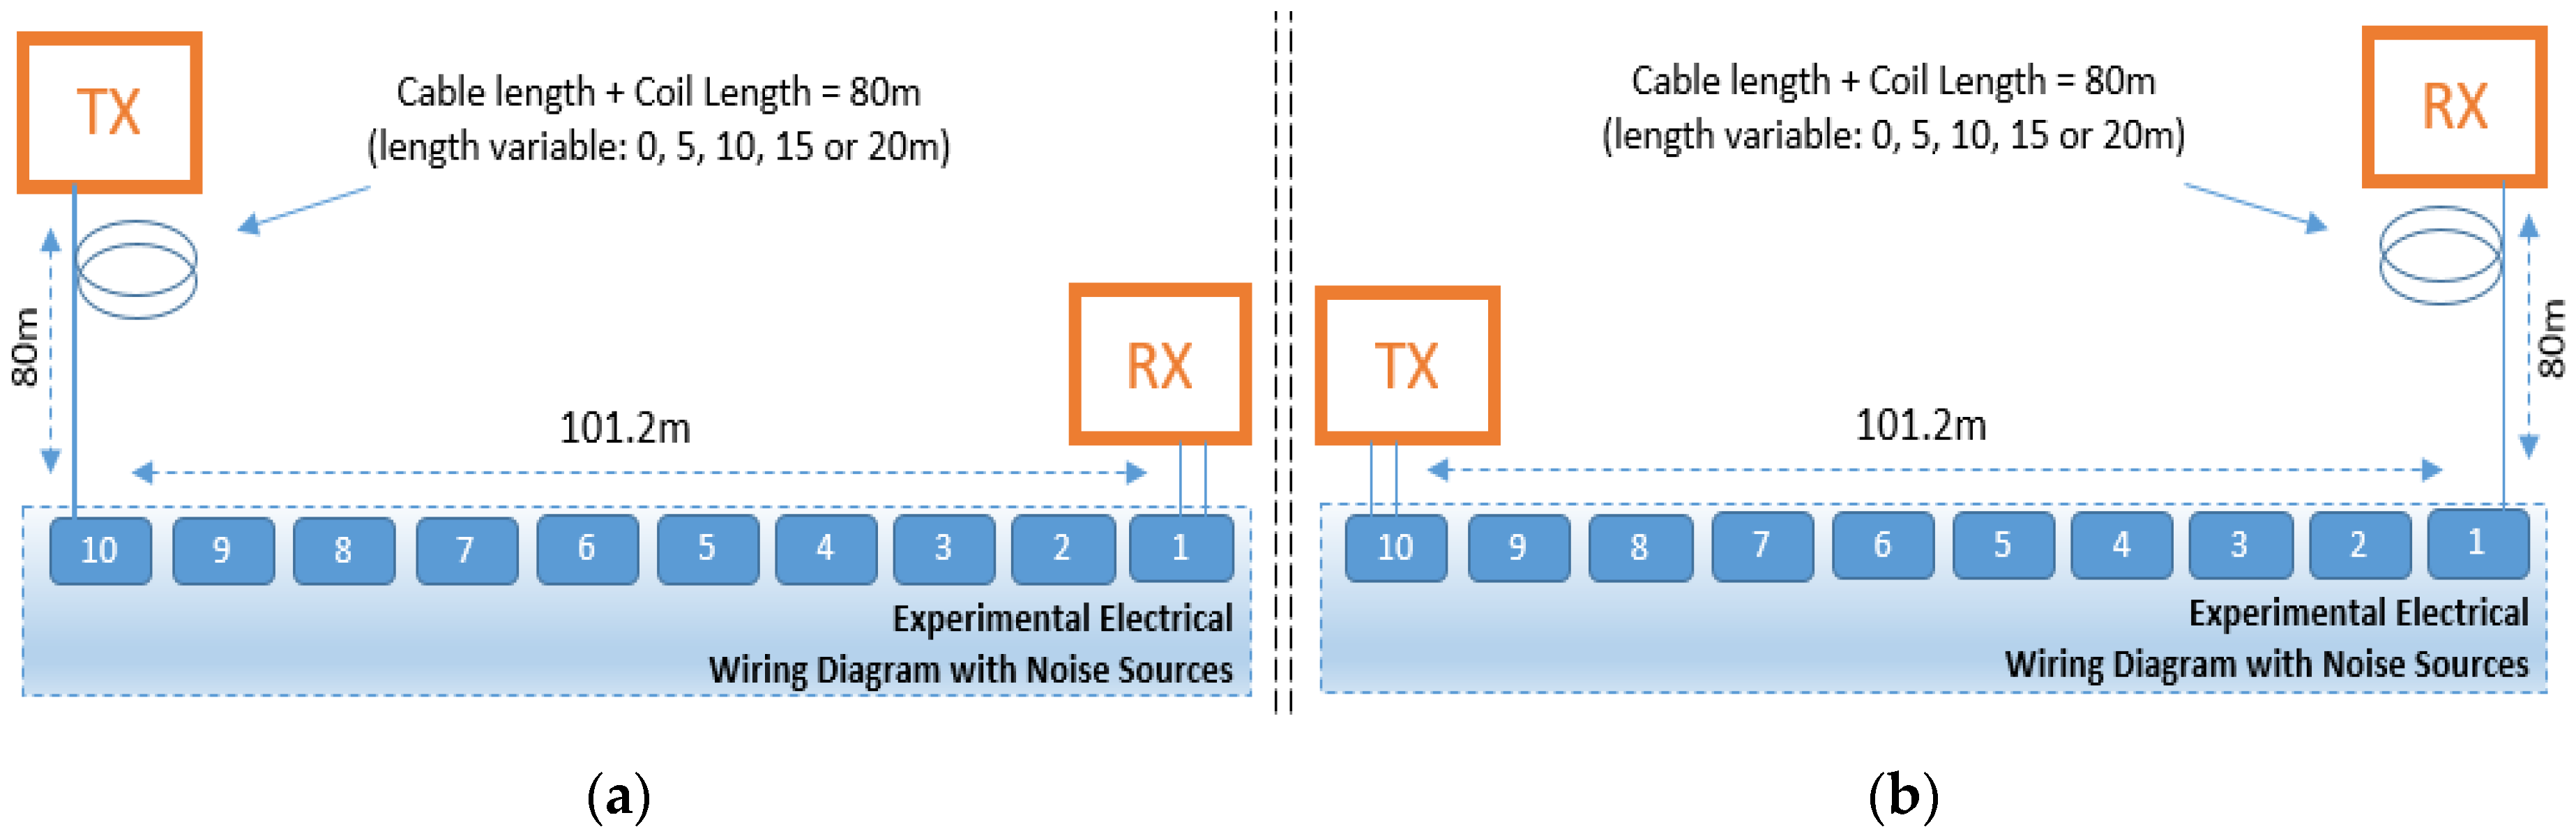
4.3. Scenario 3: Evaluation of the Influence of Cabling Inductance between the Transmitter/Receiver Modem and the Noise Source
Coils were created with the same cables used in the experiments of scenario 2, simulating a common situation in an industrial environment, where the cable is leftover when performing a service and, in order to avoid future amendments, the technician just winds the cable and leaves it in a corner of the facility. It also makes it possible to evaluate inductance interference in the quality of PLC communication, since the larger the coil, the greater the characteristic inductance present in it.
The coils were wound every 5 m, with a circumference of approximately 20 cm in diameter. At first, the shortest distance between the transmitter/receiver modem and the noise source, in this case 20 m, was used. After verifying how much inductance was necessary in order to no longer be able to perform PLC communication, the same procedure was performed for the greater distance (80 m) between the transmitter/receiver (Tx/Rx) modem and the noise source. This scenario is illustrated in
Figure 5.
The LCR-819 bridge was used to find the inductance (L) value of the wound coil every 5 turns and coil circumference area of 0.0311 m
2 (20 cm of diameter). The inductance values obtained for each coil size are shown in
Table 3.
The coils created in this scenario were important to simulate the wound cables that are present in industrial environments, in addition to requiring fewer cables to simulate the same amount of inductance present in stretched cables.
5. Results
In this section, the results obtained in the three test scenarios described in Section IV are presented. All the received packets were analyzed. This makes it possible to verify the interference that the noises inserted in the network are causing in PLC communication as well as the interference of the positioning of transmitter/receiver modems from the noise source.
5.1. Efficiency Analysis of the Four Modulations Used in the Study
The first analysis was a performance comparison between the four modulations used in this study, for different packet size (1, 2, 4, 8, 16, 32 and 64 bytes). These packet sizes were chosen to have a variation and to be able to choose an intermediate packet size to follow the tests, since the tests performed to take a long time to complete.
Table 4 shows the average of the results obtained in all noise levels applied in this study. As can be observed, the packet size sent did not interfere with the quality of PLC communication using ROBO modulation, considered the most robust. However, with 8PSK (less robust) modulation, it is possible to observe that the larger the packet size to be sent, the greater the packet rate received with errors, reaching 100% when sending 64 byte packets.
Following the analysis, BPSK modulation managed to remain as efficient as ROBO modulation sending packets up to 32 bytes. However, QPSK modulation was unsuitable in this analysis.
According to [
29], data packets transmitted at industrial levels are relatively small, usually ranging from 1 bit to 2 bytes, as opposed to commercial networks, where smaller packets have 64 bytes. In this sense, by observing the results obtained, 4 byte packets were chosen to perform the analyses of this study as they are twice the size of the most sent packets in industrial environments. Furthermore, it is the maximum packet size sent via the AS-i protocol, one of the most used protocols in the industrial environment.
Thus, using 4 byte packets for analysis, it is observed in
Table 5 that 8PSK and QPSK modulations obtained much lower performance when compared to the more robust modulations, BPSK and ROBO. While in the noisiest scenario 8PSK and QPSK modulations obtained a received packet rate with errors of approximately 70% and 40%, respectively, BPSK and ROBO modulations obtained 0% of received packets with error, avoiding the need to send packets to correct the packets received with error.
The number of lost packets was also analyzed. These packets cannot be retransmitted since they were lost during transmission. As can be presented in
Table 6, the results obtained with all modulations were very similar from a behavioral point of view. Taking into account the noisiest scenario, both modulations had an approximately 30% packet loss during the transmission of the 1000 data packets.
However, the efficiency of BPSK and ROBO (presented in
Table 5) modulations for packets arriving at the destination is emphasized. The packets that were not lost during the transmission arrived at the destination without a single corrupted bit, dispensing the necessity of retransmission.
In addition to the above-mentioned transmission quality analyses, which highlight the efficiency of BPSK and ROBO modulations, this study aimed to analyze whether there is any relationship between the amount of noise inserted in the network and its tendency to stabilize the quality of communication, regardless of that amount of noise.
Another trouble to be evaluated is the distance between network devices and noise elements need to be better studied, since, as noted, the number of lost packets doubled when the workbench closest to the receiving modem was activated.
For the next analyses, the modulations considered to be more robust and efficient, when compared among them, will be used. In this case, BPSK and ROBO modulations.
5.2. Verifying If the Quality of PLC Communication Is Related to the Positioning of the Noise between the Transmitter-Receiver Modem
Two test sequences were performed, in addition to the sequential actuating mode that gave rise to this perception. One called increasing turn on and turn off (the workbenches closest to the transmitting modem were triggered first) and another called the decreasing turn on and turn off (the workbenches closest to the receiving modem were triggered first).
5.2.1. Increasing Turn on and Turn off: Results Obtained with BPSK and ROBO Modulation
Table 7 shows the results obtained using the increasing order of turn on and turn off for ROBO and BPSK modulations. The values representing the received packets (RP) are nothing more than the number of packets that reached the destination, regardless of which packets were lost along the way. Although the values representing the packets received with errors (RBwE) are related to the packets that arrived at their destination; however, they arrived with some corrupted bits.
It is possible to realize that the closer to the transmitter modem is the noise insertion, the greater its interference. The first noise insertion reduces the number of packets received without error by two-thirds (505 packets). Already from the insertion of the fourth noise element, the number of received packages stabilizes between 27.8% and 35.1% of the packages already received. This fourth element of noise is located approximately 59 m from the transmitter modem and 37 m from the receiving modem. However, it can be seen that the ROBO modulation practically does not present received packages with errors (around 0.5%).
Still in
Table 7, it is possible to verify that the proportion of received packets was very similar for both modulations. However, using BPSK modulation, the number of corrupted (buggy) packets of the second noise level insertion was already 100% of the received packets, making modulation impracticable for industrial applications or applications with high noise levels. This unfeasibility occurs due to the fact that all communication between two devices (transmitter/receiver) establishes a timeout, also known as a timeout. When this timeout has expired, the connection is broken and incoming packets cannot be received. While the timeout is not reached, the packets can be retransmitted; however, since the packet error rate received is 100%, all packets are likely to arrive with errors again.
5.2.2. Decreasing Turn on and Turn off: Results Obtained with BPSK and ROBO Modulations
Table 8 shows the results obtained in this scenario. The same stabilization as in the previous scenario can be seen. However, noise is less significant when it is close to the receiver’s modem, which can be verified by comparing the very small variation of received packets (RP) to the third noise insertion.
In the same way as the previous analysis, with the insertion of more noise and closer and closer to the transmitter the RP rate sets between 30 and 40%.
Similar situation to the previous one occurs with the BPSK modulation, where, from the third level of noise, the BPSK modulation was unable to transmit and receive a single package without error, obtaining an error rate (PER) of 100% for received packets.
Therefore, with the results obtained in these first scenarios, it was possible to verify if the closer, the source of noise is to the receiving modem, the more packets are corrupted. This makes it appear that the distances between the noise modules and their order of operation interfere with the quality of PLC communication.
5.3. Lengthening the Distance between the Transmitter/Receiver Modems and the Noise Source
Once verified that there is the influence of the distance between the source of noise and the modems of the transmitter/receiver in the quality of the communication of the PLC. It is necessary to verify how this influence of this distance occurs through the insertion of cables and if it is different between transmitter and noise when compared between receiver and noise.
To do this, was defined the worst case of noise insertion (10 actuated inverters / motors, besides the white noises of the network), on which, in different tests, was inserted cable segments of 20, 40, 60 and 80 m, to increase the distance of these modems (Tx or Rx) from the noise source. The results are shown in
Table 8.
5.3.1. Lengthening the Distance between the Transmitting Modem and the Noise Source
Table 9 presents data of the behavior of packets that were received and contained errors in a PLC transmission with ROBO modulation, lengthening the distance between the transmitting modem (Tx) and the noise sources with the addition of cable lengths of 20 m and their equivalent in inductance.
Note that the farther the transmitting modem is from the noise source, the worse the quality of PLC communication. In other words, the characteristic inductance attenuating the signal before reaching and exceeding the noise source inserted in the tests is acting as a filter. Thus, a tendency of cable (stretched) increase between the emitter and a source of radios causes increased signal attenuation sufficient to inhibit a transmission of the data.
The same tendency occurs when using BPSK modulation, however, we noticed that the packet rate lost is already very large and after a distance of 40 m away, BPSK modulation receives all packets corrupted, demonstrating its inferiority when compared to ROBO modulation.
5.3.2. Lengthening the Distance between the Receiving Modem and the Noise Source
In this test scenario, it was possible to clearly observe that the positioning of the transmitter/receiver modems interferes with the quality of PLC communication.
Table 10 illustrates the results obtained using the ROBO modulation, distancing the receiving modem from the noise source.
Among the first 40 m, there was a tendency to decrease the number of packets received. However, from 60 m onwards, this trend reversed and the quality of PLC communication was superior even to the scenarios presented previously, where the only distance was from the electric grid of the simulated industrial plan, in addition to 5 m to distance the modems from the noise blocks used to simulate industrial noise.
It is noteworthy that in this test scenario, the ROBO modulation did not receive any corrupted packets. Reinforcing the idea that when used in the correct measurements and in the correct position within the PLC channel, the inductance acts as a filter of the noise and improves the quality of PLC communication.
The same trend presented by the ROBO modulation is presented by the BPSK modulation. It is possible to observe that, between 20 and 40 m, there is a decrease in the quality of the PLC communication. However, after the 60 m insertion between the receiving modem and the noise source, the number of received packets increases to 88% to 80 m. In both cases, there was improvement in the received packets without error.
5.4. Evaluating Cabling Inductance between the Transmitter/Receiver and the Noise Source
In order to prove and verify inductance interference in the quality of PLC communication, a scenario without new insertion of noise (all ten noise blocks off and only the background noise was used), 80 m of which, sections of 5 m are coiled at the end of the cable (5 to 20m, with a diameter of 20 cm) to form the inductances in the same previous patterns.
5.4.1. Insertion of Coils between the Transmitting Modem and the Noise Source
Table 11 illustrates the results obtained to two modulations, with the insertion of coils between the electric grid and the transmitter module. Analyzing it, we can prove the previously observed tendency is true, that the more inductance between the transmitting modem and the noise source, the worse the quality of PLC communication.
When a coil of approximately 0.2184 mH (65 m of cable + 15 m coiled) was inserted, practically there was not received data, making it impossible to use PLC communication in a scenario with these characteristics. The same happened when using BPSK modulation, with the difference that, even for lower inductances, all package received presented error.
5.4.2. Insertion of Coils between the Receiving Modem and the Noise Source
Table 12 shows the results obtained with the cable and coil inserted on the side of the receiver, for ROBO and BPSK modulations. In this scenario, it is possible to affirm that the positioning in which the coil was inserted can improve PLC communication to both modulations. As can be observed, the utilization of the received packets increased to 100% without changing any item in the scenario, besides the inversion of the positioning of the transmitter/receiver modems.
In view of all tests, it is possible to state that, when there is a characteristic inductance is near the transmitter modem, this coil can act as a filter and attenuate the data before it passes through the noise source, interfering negatively in PLC communication.
Unlike when this coil is behind the noise source and before the receiving modem, where it acts as a low-pass filter and positively interferes with the quality of PLC communication, raising the efficiency ratio of packets sent/received to up to 100%. In addition to received packet error rates to 0% using coils in front of the receiver modem (in this case, allowing the lengthening the enlace in 60%, by 160 m, by the insertion of 0.25 mH).
6. Discussion of Results
Through the three test scenarios proposed in this study, it was possible to verify that for G3-PLC communication to be a reality in last-mile industrial environments, the electrical installations must be organized and properly stretched by the channels. As shown in (
Section 4.1), the quantity and position of the inverters/motors influence the quality of PLC communication; however, even in the noisiest environment simulated in the laboratory, ROBO modulation was able to transmit/receive information through the PLC channel.
The experiments performed in the laboratory showed ROBO modulation efficiency even in the noisiest environment simulated with noise insertion (10 actuated inverters/motors, added by the random noise of the network).
Through the controlled insertion of noise (demonstrated by inverter/motor turn on and turn off), it was possible to verify the existence of a tendency to stabilize the received packet rate by approximately 31% (±3%). It was also possible to verify that in scenarios with high noise insertion ROBO modulation showed its superiority to the other modulations studied.
In the last experiments, we made an extension in the connection of the modems and analyzed the influence of this length of wire by winding part of it, in order to generate an inductive impedance. With these experiments, it was possible to verify that the presence of a coil worsens communication quality when it is close to the transmitting modem, since it attenuates the signal until it reaches the point where the transmitting modem cannot send the information. However, when the coil is located closer to the receiving modem it acts as a filter and raises the received packet rate to up to 100% and decreases the received packet error rate to 0%, showing itself as an element to be used to improve the performance of PLC communication in noisy environments.
7. Final Considerations
The use of PLC technology in last-mile industrial environment can become a viable alternative to existing industrial communication networks, solving problems related to infrastructure, reducing costs and installation time of systems for data communication.
Different from its use in a residential or commercial environment, the noise present in the industrial environment can affect the performance of this communication, making it important to know the characteristics of the main noise sources in the range of PLC communication frequencies, as well as the different modulation techniques that can be employed.
An academic environment was used to simulate the industrial environment, in which 3 scenarios were created for tests with different characteristics that may exist in an industrial environment, such as different quantity of inverters/motors connected in the grid and distance between the transmitter/receiver modems. In addition, between these distances, in an industrial environment, there may also be cables that were not unwound, forming coils and increasing the amount of inductance present with a PLC channel.
These distances used are similar to some industrial network like AS-Interface and the results obtained with regard to error rate and delivery efficiency allow us to state that its narrowband use can be considered, especially when it comes to the last mile in data communication applications to Industry 4.0.
Through the controlled insertion of noise (simulated by the turn on and turn of inverters/motors), it was possible to verify the existence of a tendency to stabilize the received packet rate and the superiority of ROBO modulation compared to BPSK modulation.
Through these scenarios, it was possible to verify the influence of the electrical parameters of the powerline. In special, of the inductive interference of impedance insertion in PLC communication, based on the manipulation of 80 m of cable added. When this cable is inserted between the transmitter and the noise sources and part of it is coiled, increasing its inductive impedance, PLC communication becomes less successful. On the other hand, if the cable is positioned between the noise sources and the receiver, the characteristic inductance of the impedance acts as a filter, managing to raise the quality of PLC communication. It was shown that, within the case study, the insertion of a small inductance resulted in almost 100% of the data received without errors.
The experiments carried out showed that the use of frequency inverters and motor affect the quality of PLC communication operating in the CENELEC-A range, causing losses of data packets. However, the G3-PLC standard, even when presenting packet loss, showed that its robust mode is capable of sending and receiving data in noisy environments.
The analysis of the use of this standard in an industrial environment showed that this technology is promising for the development of applications in the last-mile industrial environment, supporting the principles of technologies as Industrial Internet of Things (IIoT). This technology can have the focus to help the monitoring of industrial variables, giving main support to the areas of industrial supervision that require the acquisition of data, without compromising information delivery time.
In addition, light control situations, when there is no need for real time, also allow the use of the proposed technique; however, it is important to observe the topology of the electrical grid that will be used, since, in addition to noise, it can interfere with and attenuate the signal, even in smaller distances.


