Chitosan-Based Quartz Crystal Microbalance for Alcohol Sensing

 , , , , ,
Abstract
:
1. Introduction
2. Materials and Method
3. Results and Discussion
4. Conclusions
Author Contributions
Acknowledgments
Conflicts of Interest
References
- Ayad, M.M.; Torad, N.L. Alcohol vapours sensor based on thin polyaniline salt film and quartz crystal microbalance. Talanta 2009, 78, 1280–1285. [Google Scholar] [CrossRef] [PubMed]
- Pohanish, R.P. Sittig’s Handbook of Toxic and Hazardous Chemicals and Carcinogens, 5th ed.; William Andrew: Norwich, NY, USA, 2008; ISBN 9780815515531. [Google Scholar]
- Ayad, M.M.; Salahuddin, N.; Minisy, I.M. Detection of some volatile organic compounds with chitosan-coated quartz crystal microbalance. Monomers Polym. 2014, 17, 795–802. [Google Scholar] [CrossRef] [Green Version]
- Bai, H.; Shi, G. Gas Sensors Based on Conducting Polymers. Sensors 2007, 7, 267–307. [Google Scholar] [CrossRef] [Green Version]
- Wang, L.; Wang, Z.; Xiang, Q.; Chen, Y.; Duan, Z.; Xu, J. High performance formaldehyde detection based on a novel copper (II) complex functionalized QCM gas sensor. Sens. Actuators B Chem. 2017, 248, 820–828. [Google Scholar] [CrossRef]
- Ayad, M.M.; Salahuddin, N.A.; Minisy, I.M.; Amer, W.A. Chitosan/polyaniline nanofibers coating on the quartz crystal microbalance electrode for gas sensing. Sens. Actuators B Chem. 2014, 202, 144–153. [Google Scholar] [CrossRef]
- Rianjanu, A.; Hidayat, S.N.; Julian, T.; Suyono, E.A.; Kusumaatmaja, A.; Triyana, K. Swelling Behavior in Solvent Vapor Sensing based on Quartz Crystal Microbalance (QCM) Coated Polyacrylonitrile (PAN) Nanofiber. IOP Conf. Ser. Mater. Sci. Eng. 2018, 367, 012020. [Google Scholar] [CrossRef]
- Cha, X.; Yu, F.; Fan, Y.; Chen, J.; Wang, L.; Xiang, Q.; Duan, Z.; Xu, J. Superhydrophilic ZnO nanoneedle array: Controllable in situ growth on QCM transducer and enhanced humidity sensing properties and mechanism. Sens. Actuators B Chem. 2018, 263, 436–444. [Google Scholar] [CrossRef]
- Hidayat, S.N.; Julian, T.; Rianjanu, A.; Kusumaatmadja, A.; Triyana, K.; Roto, R. Quartz crystal microbalance coated by PAN nanofibers and PEDOT:PSS for humidity sensor. In Proceedings of the International Seminar Sensors, Instrumentation, Meas. Metrol (ISSIMM 2017), Surabaya, Indonesia, 25–26 August 2017; pp. 119–123. [Google Scholar]
- Gupta, V.K.; Yola, M.L.; Eren, T.; Atar, N. Selective qcm sensor based on atrazine imprinted polymer: its application to wastewater sample. Sens. Actuators B Chem. 2015, 218, 215–221. [Google Scholar] [CrossRef]
- Zhang, K.; Fan, G.; Hu, R.; Li, G. Enhanced dibutyl phthalate sensing performance of a quartz crystal microbalance coated with au-decorated zno porous microspheres. Sensors 2015, 15, 21153–21168. [Google Scholar] [CrossRef] [PubMed]
- Lu, H.-L.; Lu, C.-J.; Tian, W.-C.; Sheen, H.-J. A vapor response mechanism study of surface-modified single-walled carbon nanotubes coated chemiresistors and quartz crystal microbalance sensor arrays. Talanta 2015, 131, 467–474. [Google Scholar] [CrossRef] [PubMed]
- Jia, Y.-T.; Gong, J.; Gu, X.-H.; Kim, H.-Y.; Dong, J.; Shen, X.-Y. Fabrication and characterization of poly (vinyl alcohol)/chitosan blend nanofibers produced by electrospinning method. Carbohydr. Polym. 2007, 67, 403–409. [Google Scholar] [CrossRef]
- Pourret, A.; Guyot-Sionnest, P.; Elam, J.W. Atomic layer deposition of zno in quantum dot thin films. Adv. Mater. 2009, 21, 232–235. [Google Scholar] [CrossRef]
- Chotimah; Rianjanu, A.; Winardianto, B.; Munir, M.; Kartini, I.; Triyana, K. Electrical conductivity improvement of polyvinyl alcohol nanofiber by solvent vapour treatment. Int. J. Adv. Sci. Eng. Inf. Technol. 2016, 6, 675. [Google Scholar] [CrossRef]
- Rianjanu, A.; Kusumaatmaja, A.; Suyono, E.A.; Triyana, K. Solvent vapor treatment improves mechanical strength of electrospun polyvinyl alcohol nanofibers. Heliyon 2018, 4. [Google Scholar] [CrossRef] [PubMed]
- Xu, X.; Zhang, N.; Brown, G.M.; Thundat, T.G.; Ji, H.-F. Ultrasensitive Detection of Cu2+ Using a Microcantilever Sensor Modified with L-Cysteine Self-Assembled Monolayer. Appl. Biochem. Biotechnol. 2017, 183, 555–565. [Google Scholar] [CrossRef] [PubMed]
- Chen, D.; Li, J. Interfacial design and functionization on metal electrodes through self-assembled monolayers. Surf. Sci. Rep. 2006, 61, 445–463. [Google Scholar] [CrossRef]
- Rianjanu, A.; Roto, R.; Julian, T.; Hidayat, S.N.; Kusumaatmaja, A.; Suyono, E.A.; Triyana, K. Polyacrylonitrile Nanofiber-Based Quartz Crystal Microbalance for Sensitive Detection of Safrole. Sensors 2018, 18, 1150. [Google Scholar] [CrossRef] [PubMed]
- Moccelini, S.K.; Fernandes, S.C.; Vieira, I.C. Bean sprout peroxidase biosensor based on l-cysteine self-assembled monolayer for the determination of dopamine. Sens. Actuators B Chem. 2008, 133, 364–369. [Google Scholar] [CrossRef]
- Rianjanu, A.; Julian, T.; Hidayat, S.N.; Suyono, E.A.; Kusumaatmaja, A.; Triyana, K. Polyacrylonitrile nanofiber as polar solvent N,N-dimethyl formamide sensor based on quartz crystal microbalance technique. J. Phys. Conf. Ser. 2018, 1011, 012067. [Google Scholar] [CrossRef] [Green Version]
- Song, X.-Z.; Song, S.-Y.; Zhao, S.-N.; Hao, Z.-M.; Zhu, M.; Meng, X.; Wu, L.-L.; Zhang, H.-J. Single-Crystal-to-Single-Crystal Transformation of a Europium(III) Metal-Organic Framework Producing a Multi-responsive Luminescent Sensor. Adv. Funct. Mater. 2014, 24, 4034–4041. [Google Scholar] [CrossRef]
- Lyashkov, A.Y.; Tonkoshkur, A.S. Gas sensitivity of zno-based ceramics to vapors of saturated monohydric alcohols. Mater. Chem. Phys. 2013, 140, 31–36. [Google Scholar] [CrossRef]
- Bai, X.-Y.; Ji, W.-J.; Li, S.-N.; Jiang, Y.-C.; Hu, M.-C.; Zhai, Q.-G. Nonlinear Optical Rod Indium-Imidazoledicarboxylate Framework as Room-Temperature Gas Sensor for Butanol Isomers. Cryst. Growth Des. 2017, 17, 423–427. [Google Scholar] [CrossRef]
- Long, G.L.; Winefordner, J.D. Limit of detection. A closer look at the IUPAC definition. Anal. Chem. 1983, 55, 712A–724A. [Google Scholar]
- Fraden, J. Handbook of Modern Sensors; Springer: Berlin, Germany, 2013; ISBN 978-1-905209-66-8. [Google Scholar]
- Sembiring, A. Characteristic of Quartz Crystal Microbalance Based on Chitosan for Alcohol Vapors Sensor. Bachelor Thesis, Universitas Gadjah Mada, Yogyakarta, Indonesia, 7 March 2018. [Google Scholar]
- Sauerbrey, G. Verwendung von Schwingquarzen zur Wägung dünner Schichten und zur Mikrowägung. Z. Angew. Phys. 1959, 155, 206–222. [Google Scholar]


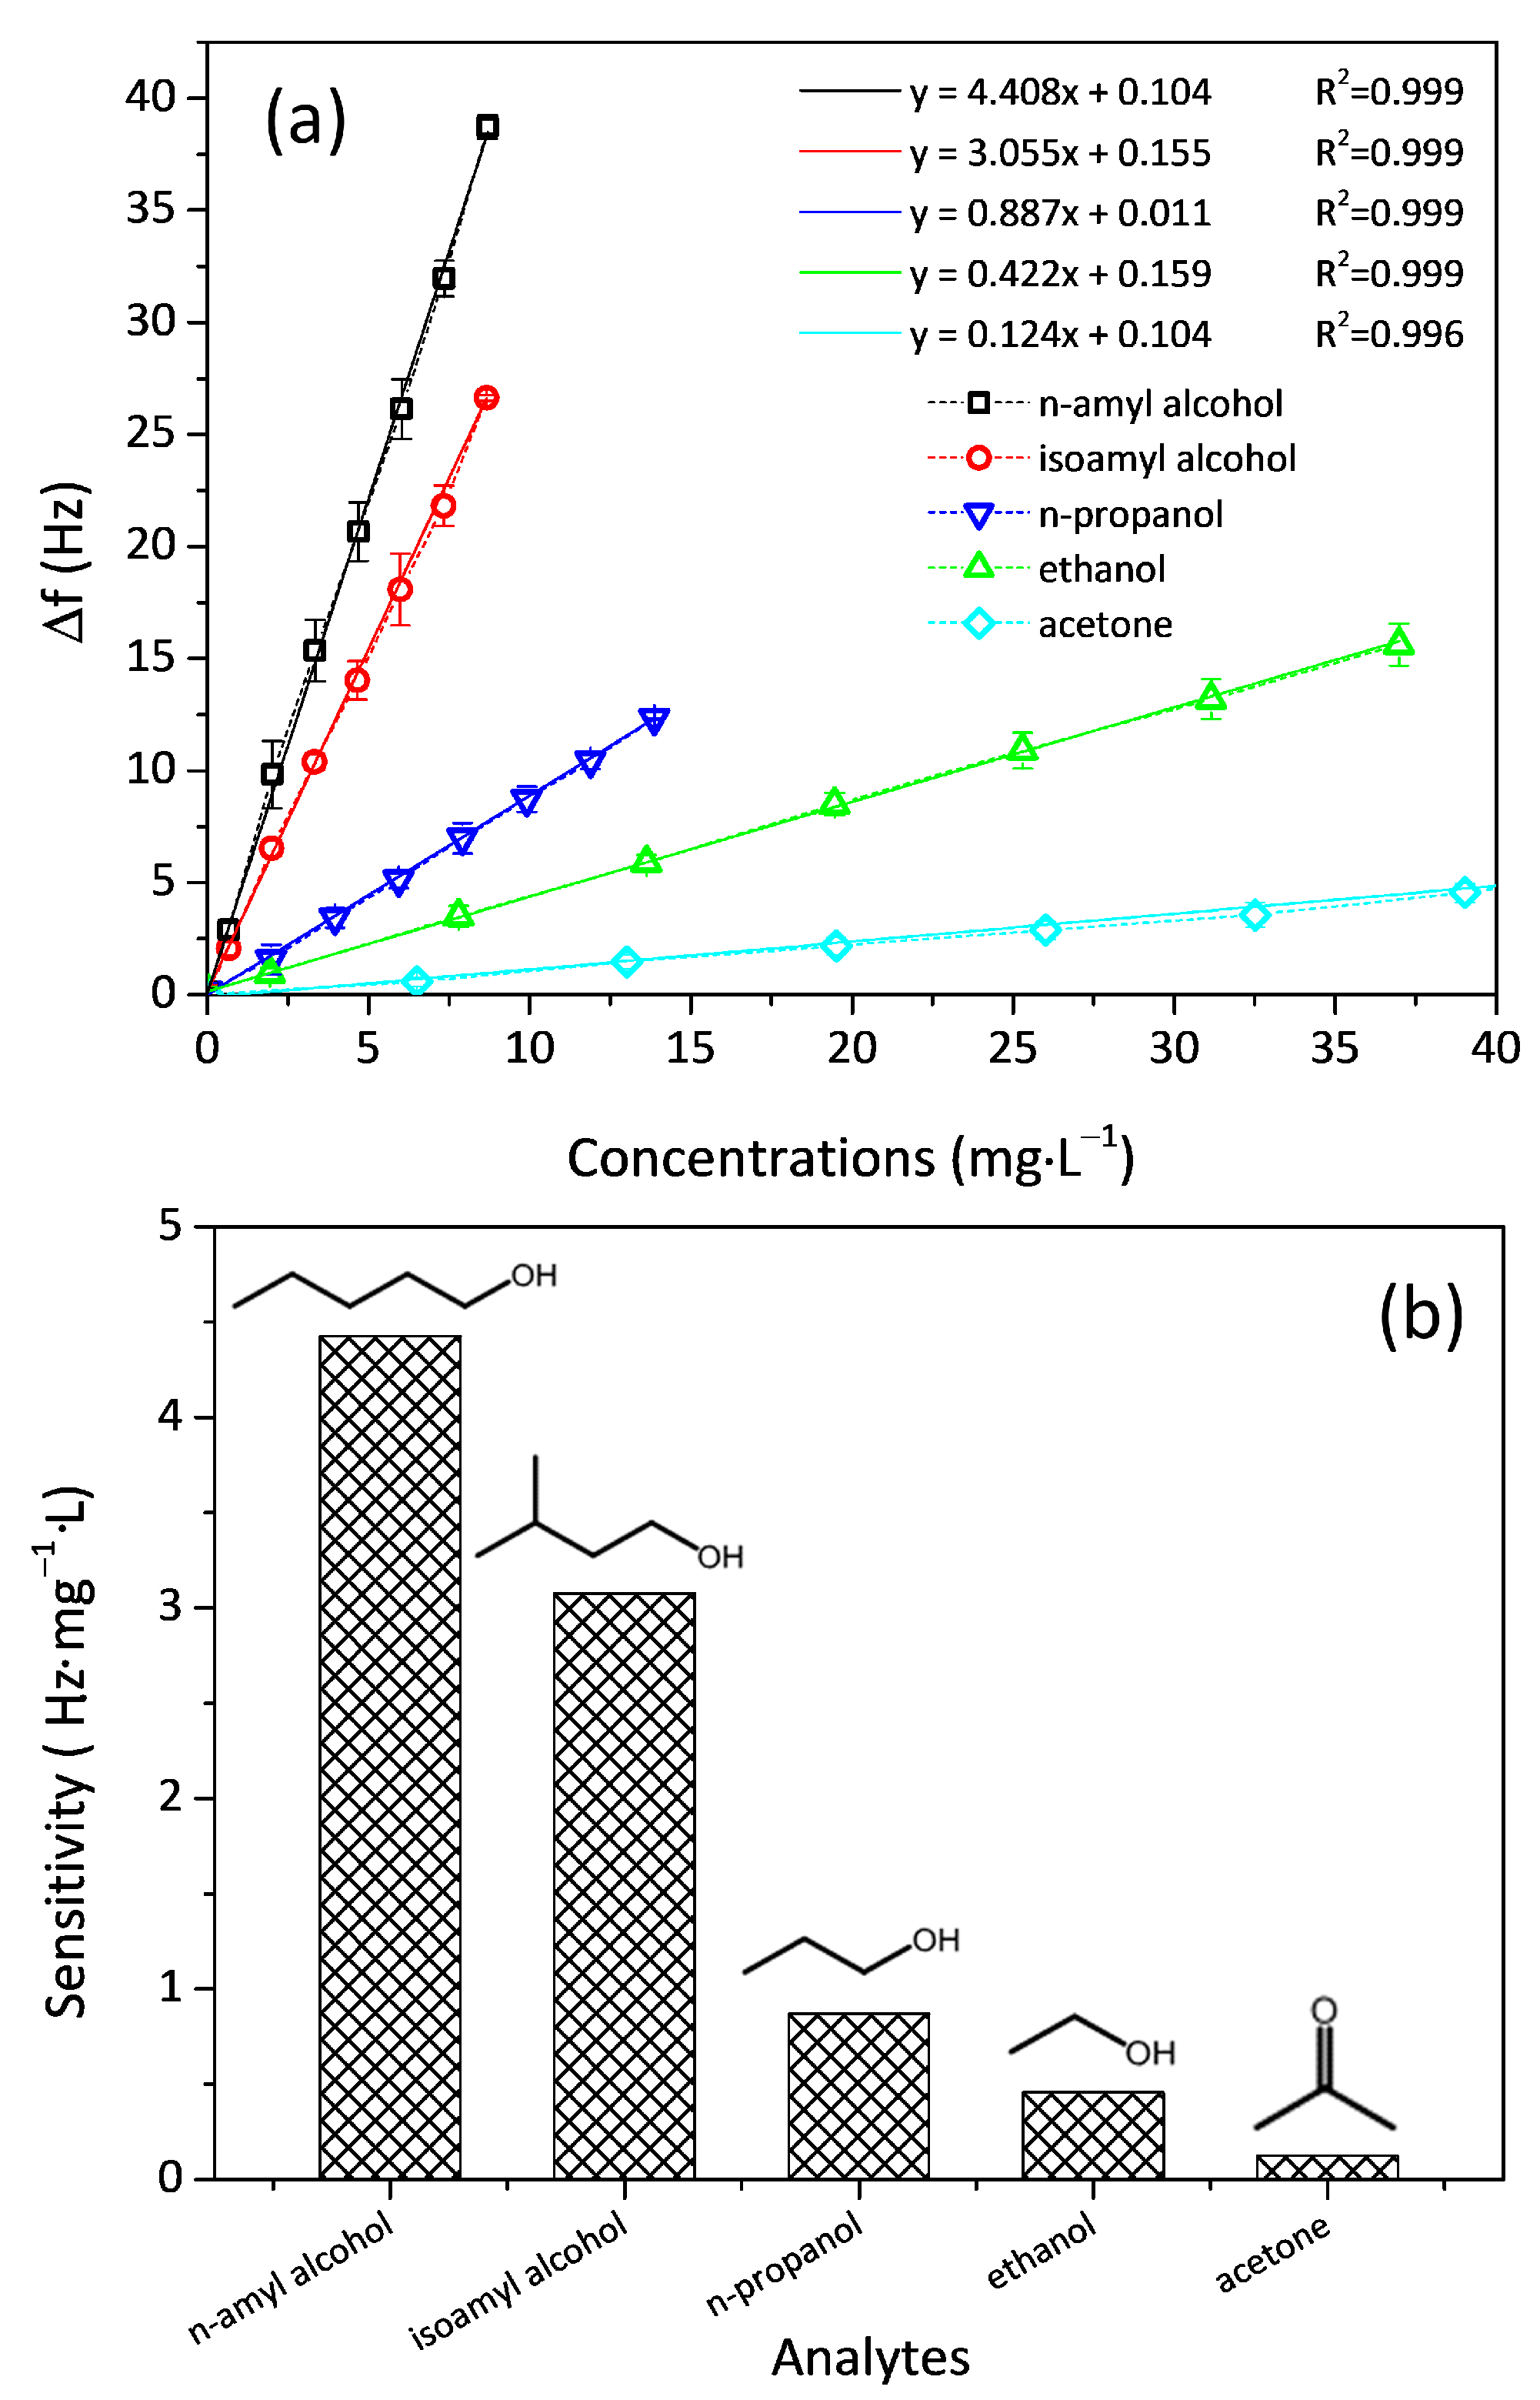
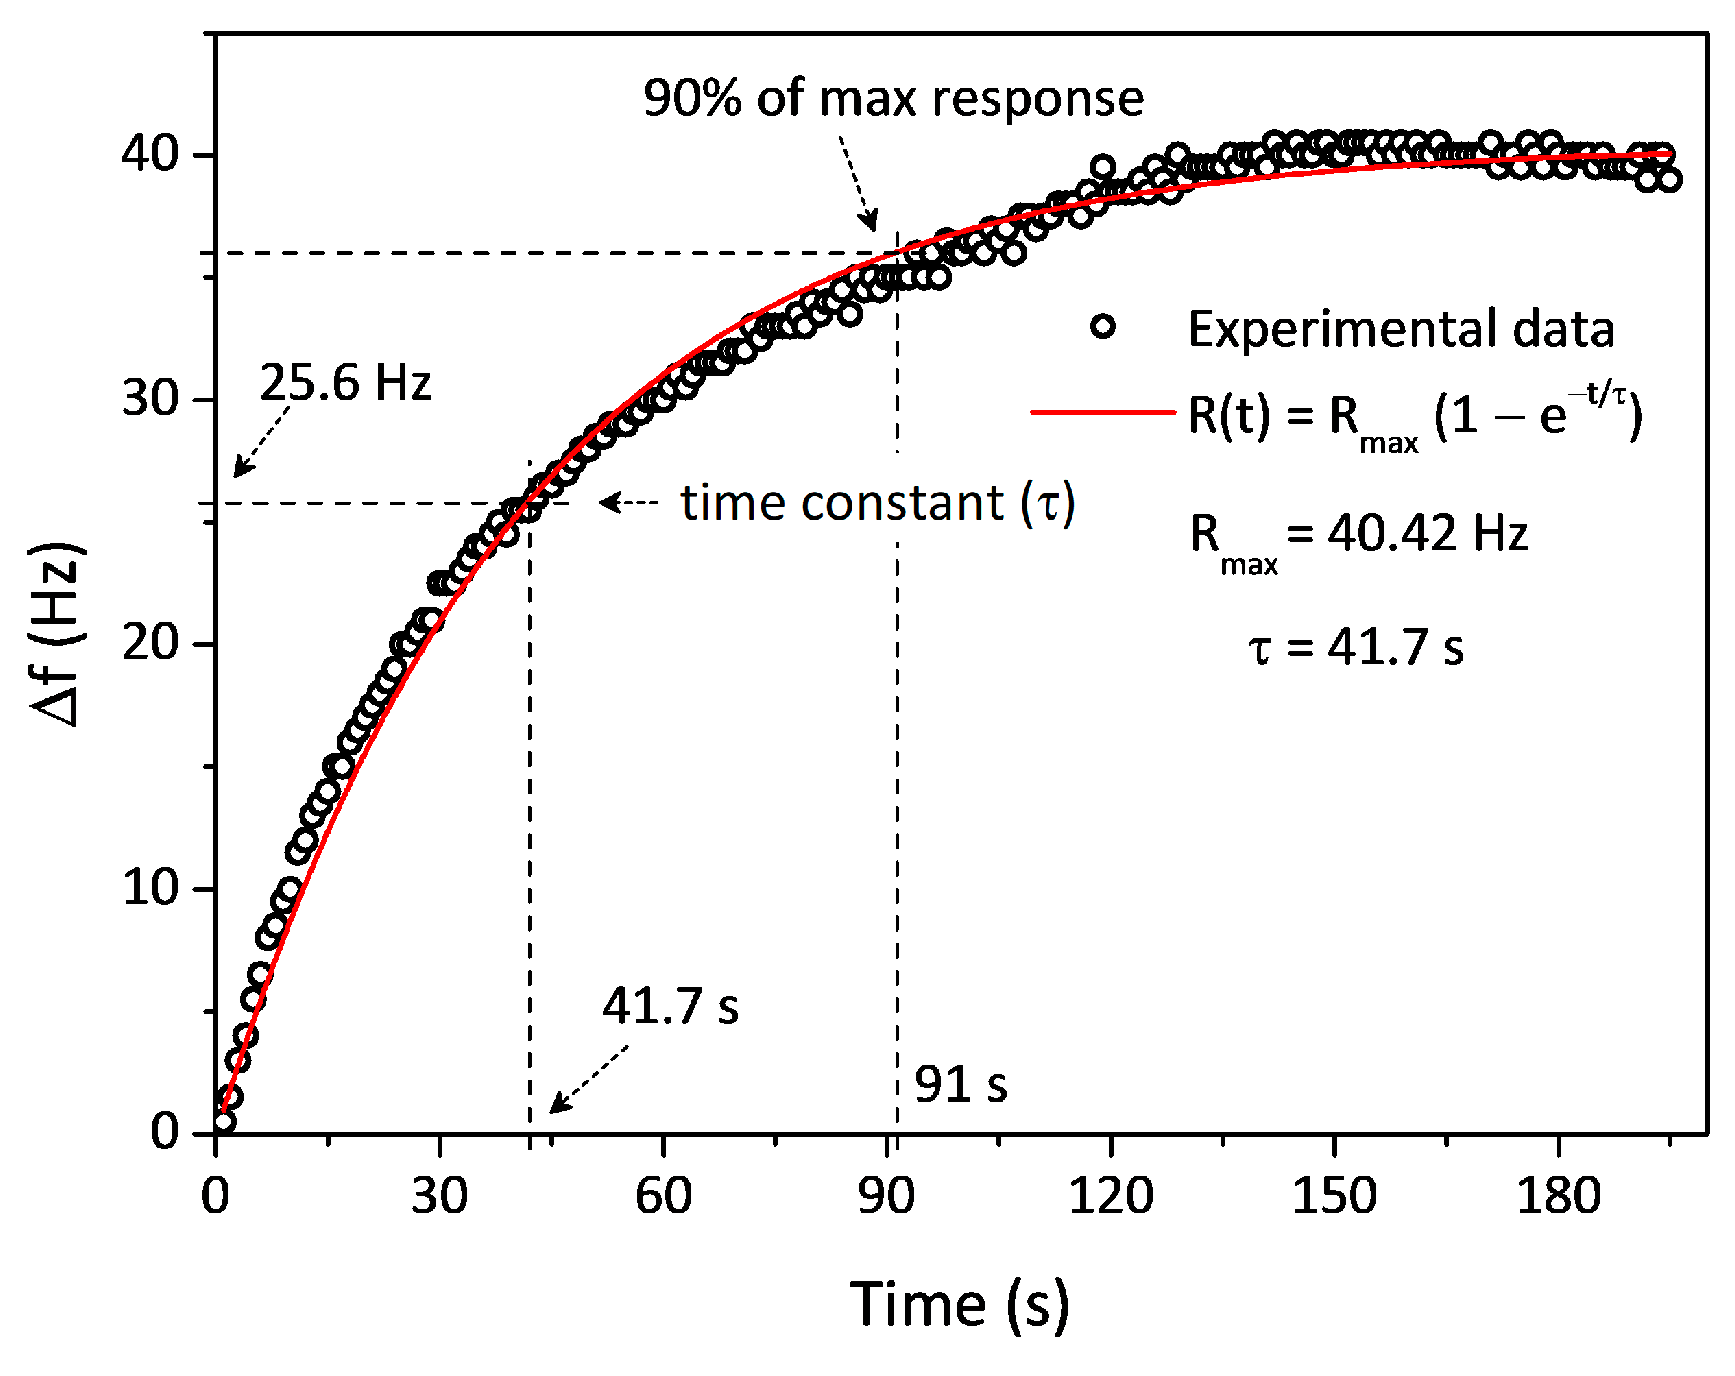
| Analytes | Molecular Weight (g·mol−1) | Vapor Pressure (mmHg) | Boiling Point (°C) | Sensitivity (Hz‧mg−1·L) | LOD (mg·L−1) | Time Constant/t90 (s) |
|---|---|---|---|---|---|---|
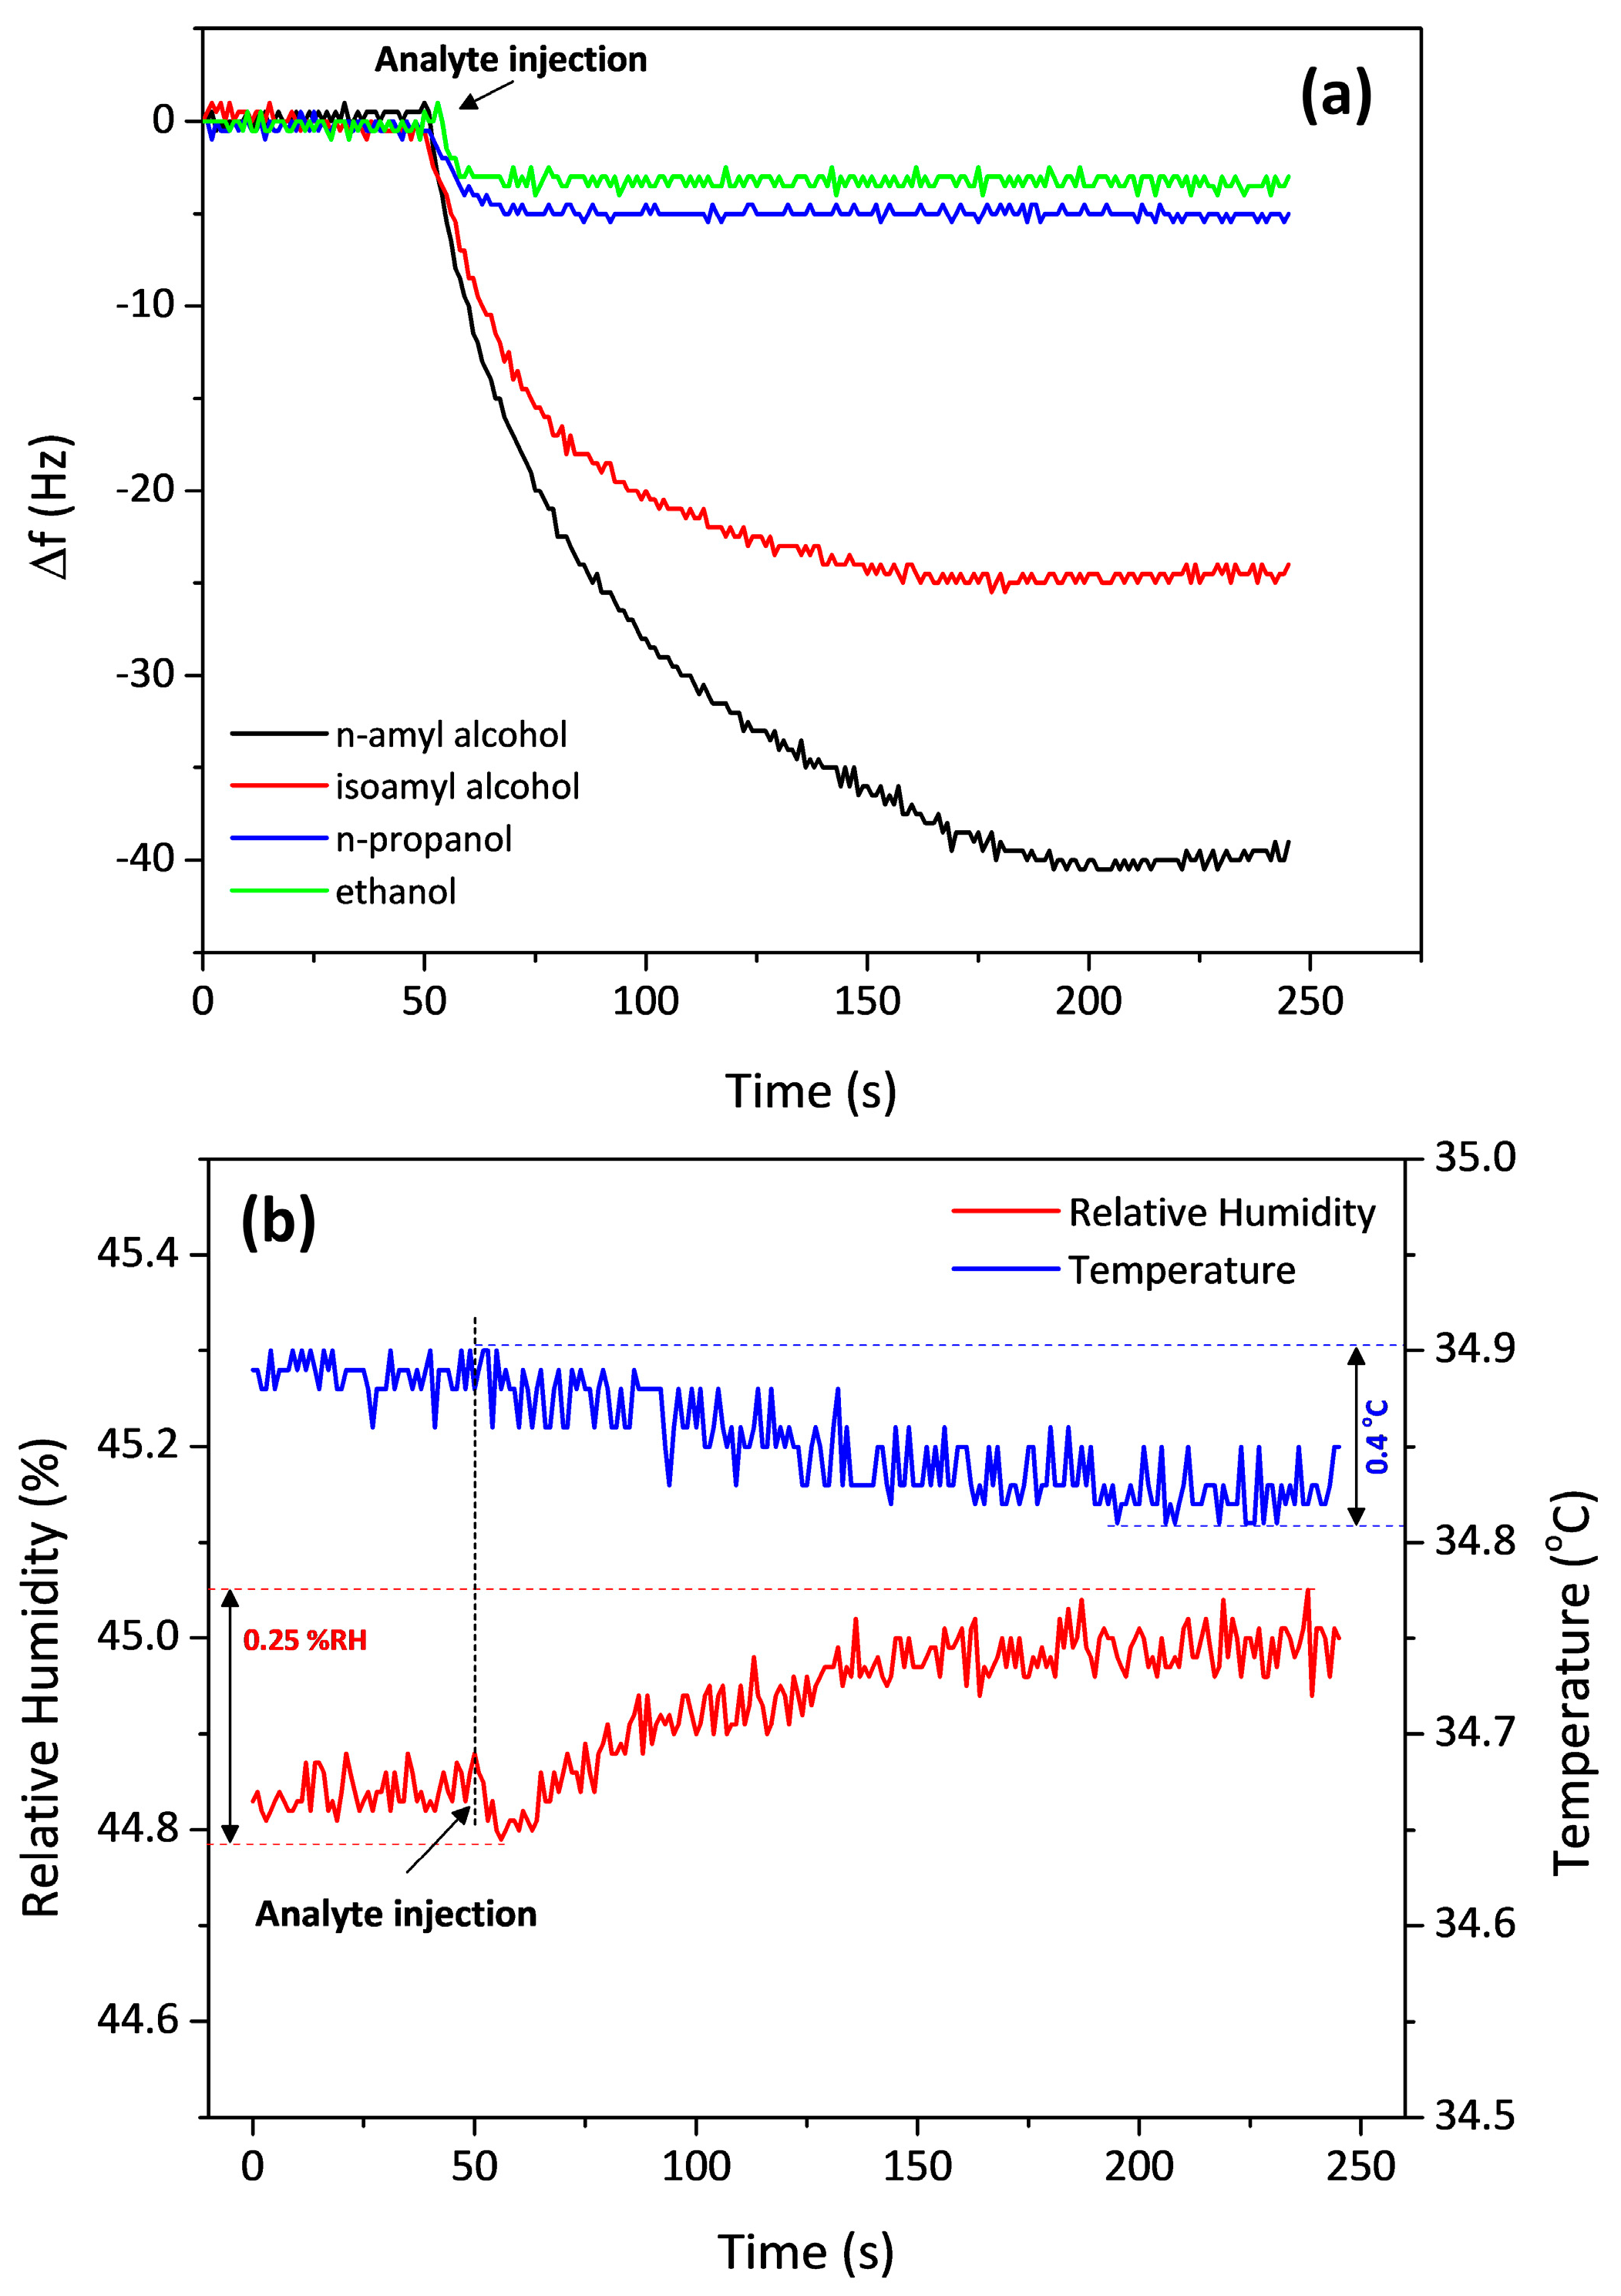
| n-Amyl alcohol | 88.15 | 2.20 | 138 | 4.4 | 0.25 | 42/91 |
| Isoamyl alcohol | 88.14 | 2.37 | 131 | 3.1 | 0.50 | 28/62 |
| n-Propanol | 60.09 | 21 | 97 | 0.9 | 1.22 | 7.2/17 |
| Ethanol | 46.07 | 55 | 78 | 0.4 | 2.86 | 6.7/15 |
| Acetone | 58.08 | 231 | 56 | 0.1 | 11.43 | 1.6/3.6 |
© 2018 by the authors. Licensee MDPI, Basel, Switzerland. This article is an open access article distributed under the terms and conditions of the Creative Commons Attribution (CC BY) license (http://creativecommons.org/licenses/by/4.0/).
Share and Cite
Triyana, K.; Sembiring, A.; Rianjanu, A.; Hidayat, S.N.; Riowirawan, R.; Julian, T.; Kusumaatmaja, A.; Santoso, I.; Roto, R. Chitosan-Based Quartz Crystal Microbalance for Alcohol Sensing. Electronics 2018, 7, 181. https://doi.org/10.3390/electronics7090181
Triyana K, Sembiring A, Rianjanu A, Hidayat SN, Riowirawan R, Julian T, Kusumaatmaja A, Santoso I, Roto R. Chitosan-Based Quartz Crystal Microbalance for Alcohol Sensing. Electronics. 2018; 7(9):181. https://doi.org/10.3390/electronics7090181
Chicago/Turabian StyleTriyana, Kuwat, Agustinus Sembiring, Aditya Rianjanu, Shidiq Nur Hidayat, Riowirawan Riowirawan, Trisna Julian, Ahmad Kusumaatmaja, Iman Santoso, and Roto Roto. 2018. "Chitosan-Based Quartz Crystal Microbalance for Alcohol Sensing" Electronics 7, no. 9: 181. https://doi.org/10.3390/electronics7090181