Evaluating the Application of Electrical Resistivity Tomography for Investigating Seawater Intrusion

1
Department of Civil Engineering and Engineering Management, National Quemoy University, No. 1 University Rd., Kinmen County 892, Taiwan
2
Department of Urban Planning and Landscape, National Quemoy University, No. 1 University Rd., Kinmen County 892, Taiwan
3
Department of Electronic Engineering, National Quemoy University, No. 1 University Rd., Kinmen County 892, Taiwan
*
Author to whom correspondence should be addressed.
Electronics 2018, 7(7), 107; https://doi.org/10.3390/electronics7070107
Revised: 31 May 2018
/
Accepted: 15 June 2018
/
Published: 5 July 2018
(This article belongs to the Special Issue Selected Papers from the IEEE ICASI 2018)
Abstract
:Seawater intrusion is a major issue in coastal areas, and the traditional technology of investigation mainly makes use of drilling for water level observation and sample analysis of groundwater; as drilling data is an information of points, it will cost more if it is extended to be information on the surface. Non-destructive geophysical exploration technology has been used in the investigation of the underground environments at all kinds of contaminated sites in recent years. Seawater intrusion is also a groundwater pollution situation, and “Surface and Space” information can be obtained with a small amount of drilling data. This research will use Electric Resistivity Tomography as a geophysical exploration technology to assess the situation at the interface of seawater intrusion and to explore the dynamic changes of seawater intrusion through long-term monitoring. The test site of this research is situated in the seawater intrusion area along Kinmen Island. The research results showed that the front edge of the seawater intrusion could be detected with Electric Resistivity Tomography, and a delay effect existing between seawater intrusion and tidal action was observed by means of Time-lapse. If a long-term observation system is established in future, it could contribute to the confrontation of seawater intrusion and salinization phenomena.
1. Introduction
The Kinmen area has an uneven distribution of natural water resources, including long-term rainfall, but morphology and evapotranspiration do not allow the formation of surface water bodies, and the fluctuation of the underground water level is significant in the wet and dry season. Drinking water needs to combine the use of tap water and groundwater resources; additionally, overpumping of groundwater is serious, due to the poor water quality of the lake and reservoir, the long-term insufficiency of the water sources and the demand for water use in agricultural irrigation. According to the statistics from the Water Resources Agency, the household usage rate of tap water in 2017 was about 95% in the Kinmen area, but the usage rate of groundwater resources was about 49%, both of which demonstrate that the Kinmen area is dependent on groundwater resources. Parts of wells in coastal areas have been found to exhibit salinization phenomena as a result of long-term overpumping. According to the background information monitoring the water level at the Kinmen Water Plant, the groundwater level at most monitoring wells has dropped significantly from 2 m to 5 m. the groundwater level at most monitoring wells is lower than the water level during the same period of last year. There are 16 monitoring wells in Kinmen in which the water has lowered and which are facing seawater intrusion. It has been reported that the Juguang and Shangyi deep wells have been sealed due to salinization caused by seawater intrusion into the groundwater wells, which are necessary for the livelihood of the water supply in the Kinmen area. Therefore, investigation into the salinization of underground water on the island, as well as long-term monitoring in the future, is urgently needed.
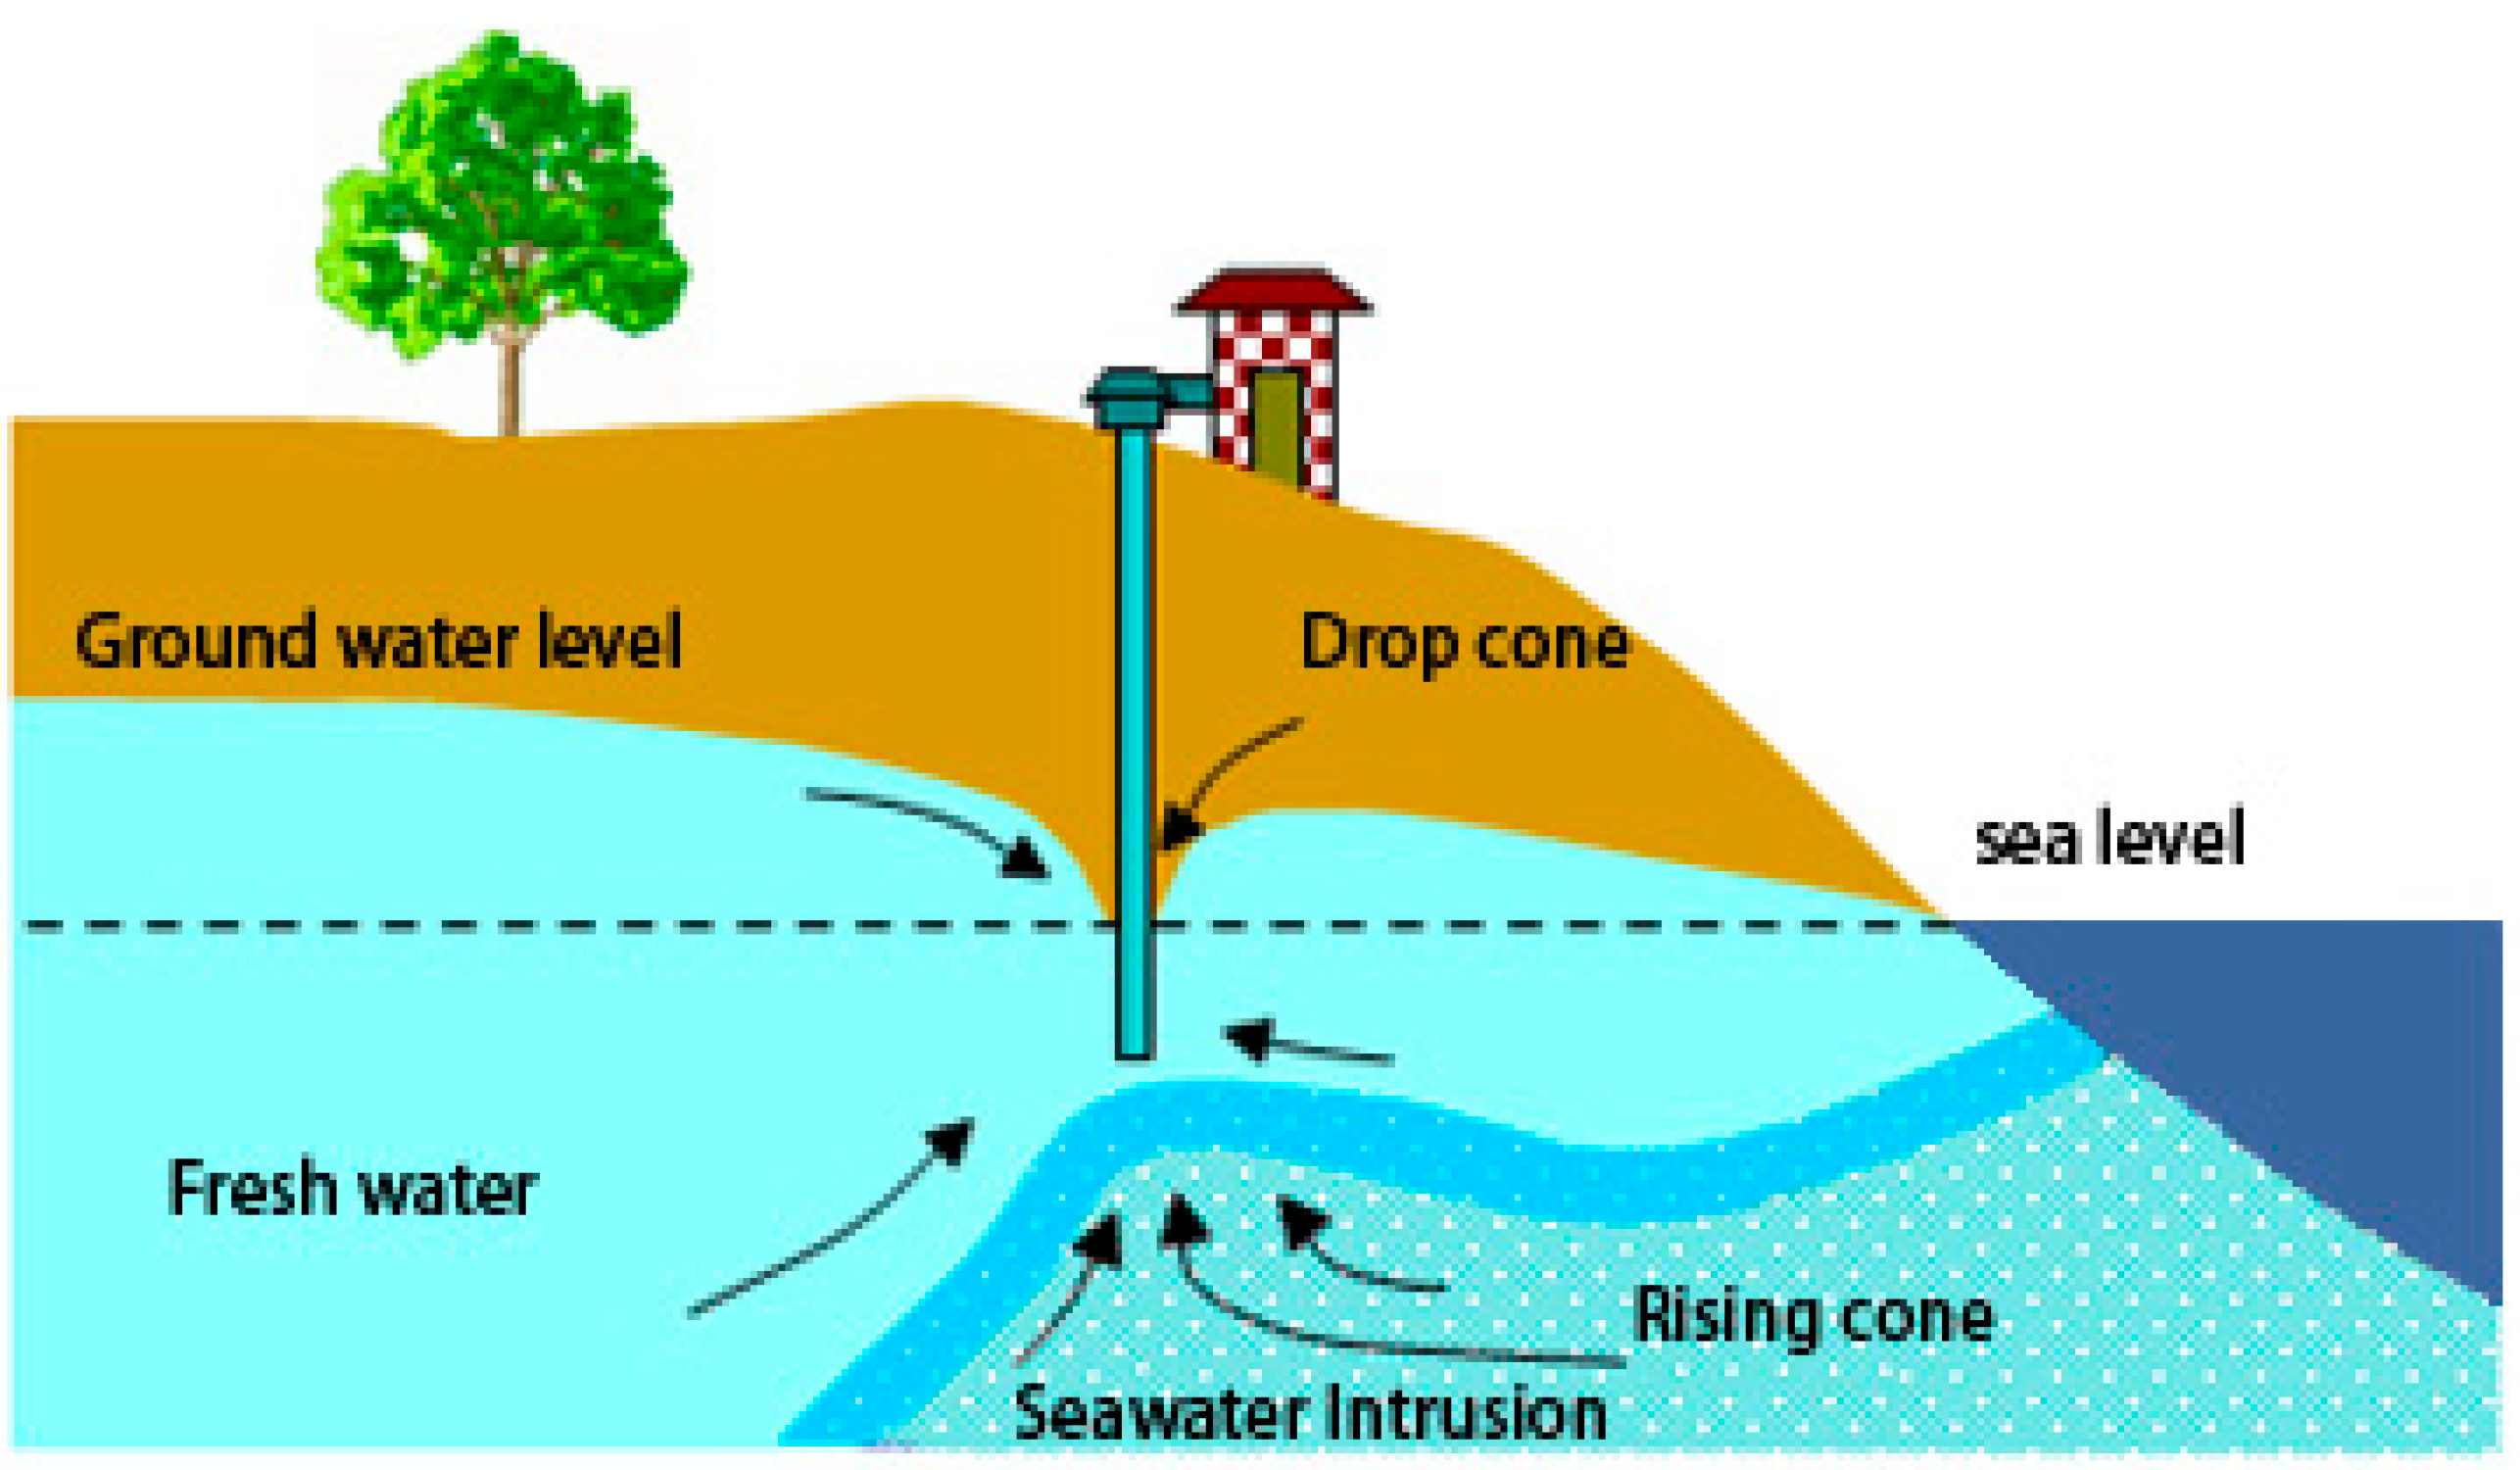
Seawater intrusion is a common major problem in coastal aquifers all over the world. Seawater intrusion is mainly caused by the development of groundwater in coastal areas, which leads to the flow of seawater into freshwater aquifers; water in the aquifer in connection with the seawater, is pumped, and the induced hydraulic gradient leads to the seawater flowing into pumping wells containing aquifer, making freshwater highly salinized and unable to be used. Figure 1 is a diagram of seawater intrusion caused by the overpumping of groundwater.
Since 1960, the exploration of the seawater intrusion problem has mainly used drilling for water level observation and to obtain groundwater samples in order to analyze and understand the flow direction of groundwater and water quality. As drilling data provides evidence related to a single point, more time and budget must be spent setting groundwater observation wells so as to extend the information related to the point into information related to a surface. Non-destructive geophysical exploration technology has increasingly been used to investigate the underground environment of all kinds of contaminated sites in recent years. Seawater intrusion also constitutes a groundwater pollution situation, and the “Surface and Space” information can be obtained by collocation using a small amount of drilling data.
Therefore, this research uses ERT in geophysical exploration technology to assess the interface situation of seawater intrusion in the measured areas and to explore the dynamic changes of the seawater intrusion interface by implementing long-term monitoring during the research period.
Drilling is used to analyze whether water quality is contaminated through groundwater samples for the traditional seawater intrusion problem, which consumes lots of time and requires large expenditures. It is difficult to obtain a detailed scope of the seawater intrusion and real causes in a short time. As the drilling data is evidence of single point, more time and budget must be spent to set groundwater observation wells so as to extend information on point to information on surface. Geophysical technology has been widely used in groundwater investigation abroad, so the geophysical investigation method is applied to the observation of seawater intrusion, and it is found that geophysical observation technology can provide more information and that the measurement is faster than traditional drilling technology. Results obtained with traditional drilling investigation technology all belong to the pollution situation of “Point”, but the information on “Surface” can be obtained with geophysical exploration technology. Non-destructive geophysical exploration technology has been increasingly used in the investigation on underground environment of all kinds of contaminated sites in recent years, and seawater intrusion is also a groundwater pollution situation, and the information related to “Surface and Space” can be obtained by collocating with a small amount of drilling data. Therefore, it is really necessary to research the feasibility of the investigation of seawater intrusion with Electrical Resistivity Tomography. Time Lapse Electrical Resistivity Tomography has already been applied in the investigation and monitoring of the underground environment and the exploration result. Therefore, this research uses ERT to assess the interface situation of seawater intrusion in measured areas and to explore the dynamic changes of seawater intrusion at the interface through long-term monitoring.
2. Literature Review and Research Method
2.1. Electrical Resistivity Tomography
ERT has developed rapidly in recent years. The apparent resistivity under the ground has been obtained through wiring, and the resistivity of subterranean soils has been obtained through inversion. It has been widely used in engineering geological exploration and environmental hydrological surveys and monitoring [1]. Lipfert et al. [2] successfully used long-term resistivity to monitor seawater intrusion. Allen et al. [3] used geophysics, geology and geochemistry to investigate seawater intrusion potential. Hodlur [4] used the ERT and monitoring well data to successfully divide the aquifer partition between seawater and freshwater. R. de Franco et al. [5] performed ERT on the coastal boundary of the Venice Lagoon in southern Italy and found that some factors in the environment, such as rainfall and tide, also affect the resistivity changes. Nura Umar Kura et al. [6] used ERT to initially evaluate the effects of seawater intrusion and upconing in a small tropical island. Oyeyemi et al. [7] used ERT to investigate seawater intrusion in alluvial areas in southwestern Nigeria. Pidlisecky et al. [8] used ERT to investigate the seawater intrusion into the Monterey Bay aquifer system, and found the interface between seawater and freshwater underground. Mohd Muzamil et al. [9] used ERT to determine seawater intrusion in coastal aquifer, and confirmed that the profile of seawater intrusion can effectively be investigated through ERT. Goebel et al. [10] demonstrated the value of spatially continuous information derived from long-offset ERT data when used in conjunction with traditional data sets for understanding the distribution of freshwater and seawater.
2.2. Time-Lapse Resistivity Detection
Time-lapse Resistivity Inversion analysis is a detection method that has been gaining popularity abroad in recent years, as it measures data within the same line at different times; thus, the differences between the former and the latter information can be obtained with time intervals, and the slight changes under the stratum can be understood according to the differences of the two data points. Time-lapse Resistivity Inversion can provide another time dimension during ERT investigation, and it is expected to be able to carry out reasonable interpretation of the change of resistivity profiling based on the change of resistivity profiling with time [11].
Many scholars combine ERT with time-lapse and get good experimental results. Carter [12] used time-lapse resistivity to investigate the interface between freshwater and seawater. Singha and Gorelick [13] visualized saline tracer with three-dimensional electrical resistivity tomography. Swarzenski [14] combined time-lapse resistivity and geochemical tracer techniques to examine submarine groundwater discharge at Dor Beach.
In recent years, scholars have combined many different elements for time-lapse ERT. Kazakis [15] used electrical resistivity tomography and hydrochemical data to map seawater intrusion in the coastal area of eastern Thermaikos Gulf, Greece. Sutter and Ingham [16] used time-lapse DC resistivity traversing to monitor seasonal saline intrusion of a shallow coastal aquifer. Menéndez [17] used electrical resistivity tomography to assess the effectiveness of managed aquifer recharge in a salinized coastal aquifer.
2.3. Impact of Tidal Action on Underground Water
In 2012, Santos et al. [18] conducted research into the driving force that affects the flow of underground water in coastal areas; the research results divided major driving forces into 12 kinds that affect the flow of underground water in coastal areas, and the results showed that the impact of tidal and wave action on the flow and transmission process of underground water along the coast is the most significant.
Su et al. [19] conducted a study on the south bank of Laizhou Bay and found that the water levels of the monitored wells were all affected by tidal action, and the impact of the tide on the underground water level weakens gradually with the increase in distance towards the land.
Many experts and scholars [20,21,22,23] have conducted research related to the impact of tidal action on groundwater in coastal areas, and the research results have shown that tidal action affects groundwater in coastal areas; thus, the impact of tidal action is a factor that must be considered during the investigation and research of seawater intrusion. This research conducts detection with ERT specifically for the time of the tide beyond the test site and considering that the cycle of spring tide and neap tide is about 15 days, this research conducts detection consecutively for 15 days from the new moon to the full moon. As shown in Table 1, detection was carried out when the tide rose, and then one day was chosen on which to conduct detection on the rise tide and ebb tide, respectively, in order to observe spring tide, neap tide and the impact of tide rise and ebb on seawater intrusion.
2.4. Research Method
The measuring method of DC Electrical Resistivity Tomography (ERT) is to insert an electrode stick into the ground surface to conduct DC current or low-frequency AC current underground in order to produce an artificial electric field, and measure potential differences via a pair of potential poles, which correspond to different space geometrical factors to obtain resistivity on the basis of different electrode arrangement modes and the movement of the electrode, which is called apparent resistivity, and a resistivity value close to reality is obtained through numerical analysis. Figure 2 shows the measuring principle diagram with the DC Electrical Resistivity Method.
The measuring principle for ERT is to use DC current or low-frequency AC current to conduct the current into the ground through a pair of C1 and C2 electrodes, in order to build an artificial electric field. As different media between strata have different electrical conductivity, another pair of potential P1 and P2 electrodes can be used to measure the potential difference of the electric field between P1 and P2, thus obtaining the apparent resistivity of strata and further estimating the conductivity distribution of the underground strata. The four electrodes method is adopted for exploration of the stratum, where there is electrical heterogeneity in the semispace strata, and the resistivity of the stratum is calculated with Equation (1): where K is the geometry parameters for the electrode array in Equation (1), ΔV is equal to the potential difference of the potential electrode measured, I is the intensity of the input current, and resistivity has nothing to do with the geometric shape of the material. As the stratum is not actually a homogeneous isotropic semispace medium, the subsoil may be composed of multilayers; thus, Resistivity calculated according to Equation (1) is called Apparent Resistivity. Usually, Apparent Resistivity is not necessarily the actual resistivity of the underground electrical stratum, but a comprehensive effect smaller than all the strata within a certain depth, as related to the electrode array under the set electrode array. Apparent Resistivity shall be used to calculate the actual resistivity distribution of the underground stratum with an appropriate inversion method [24]. Due to the differences in composition materials and cementation conditions, the strata show different electrical conductivity, and generally resistivity represents the conductive property of the material.
Different lithology and water conditions correspond to different resistivity distributions. Resistivity Spectrum provides us with an idea; namely, if the resistivity of underground strata can be understood by means of instrument measurement and analysis technology supplemented by appropriate geological information, it can be used to understand the lithology distribution of underground strata and further interpret geological structure and groundwater pollution.
3. Introduction to Test Site
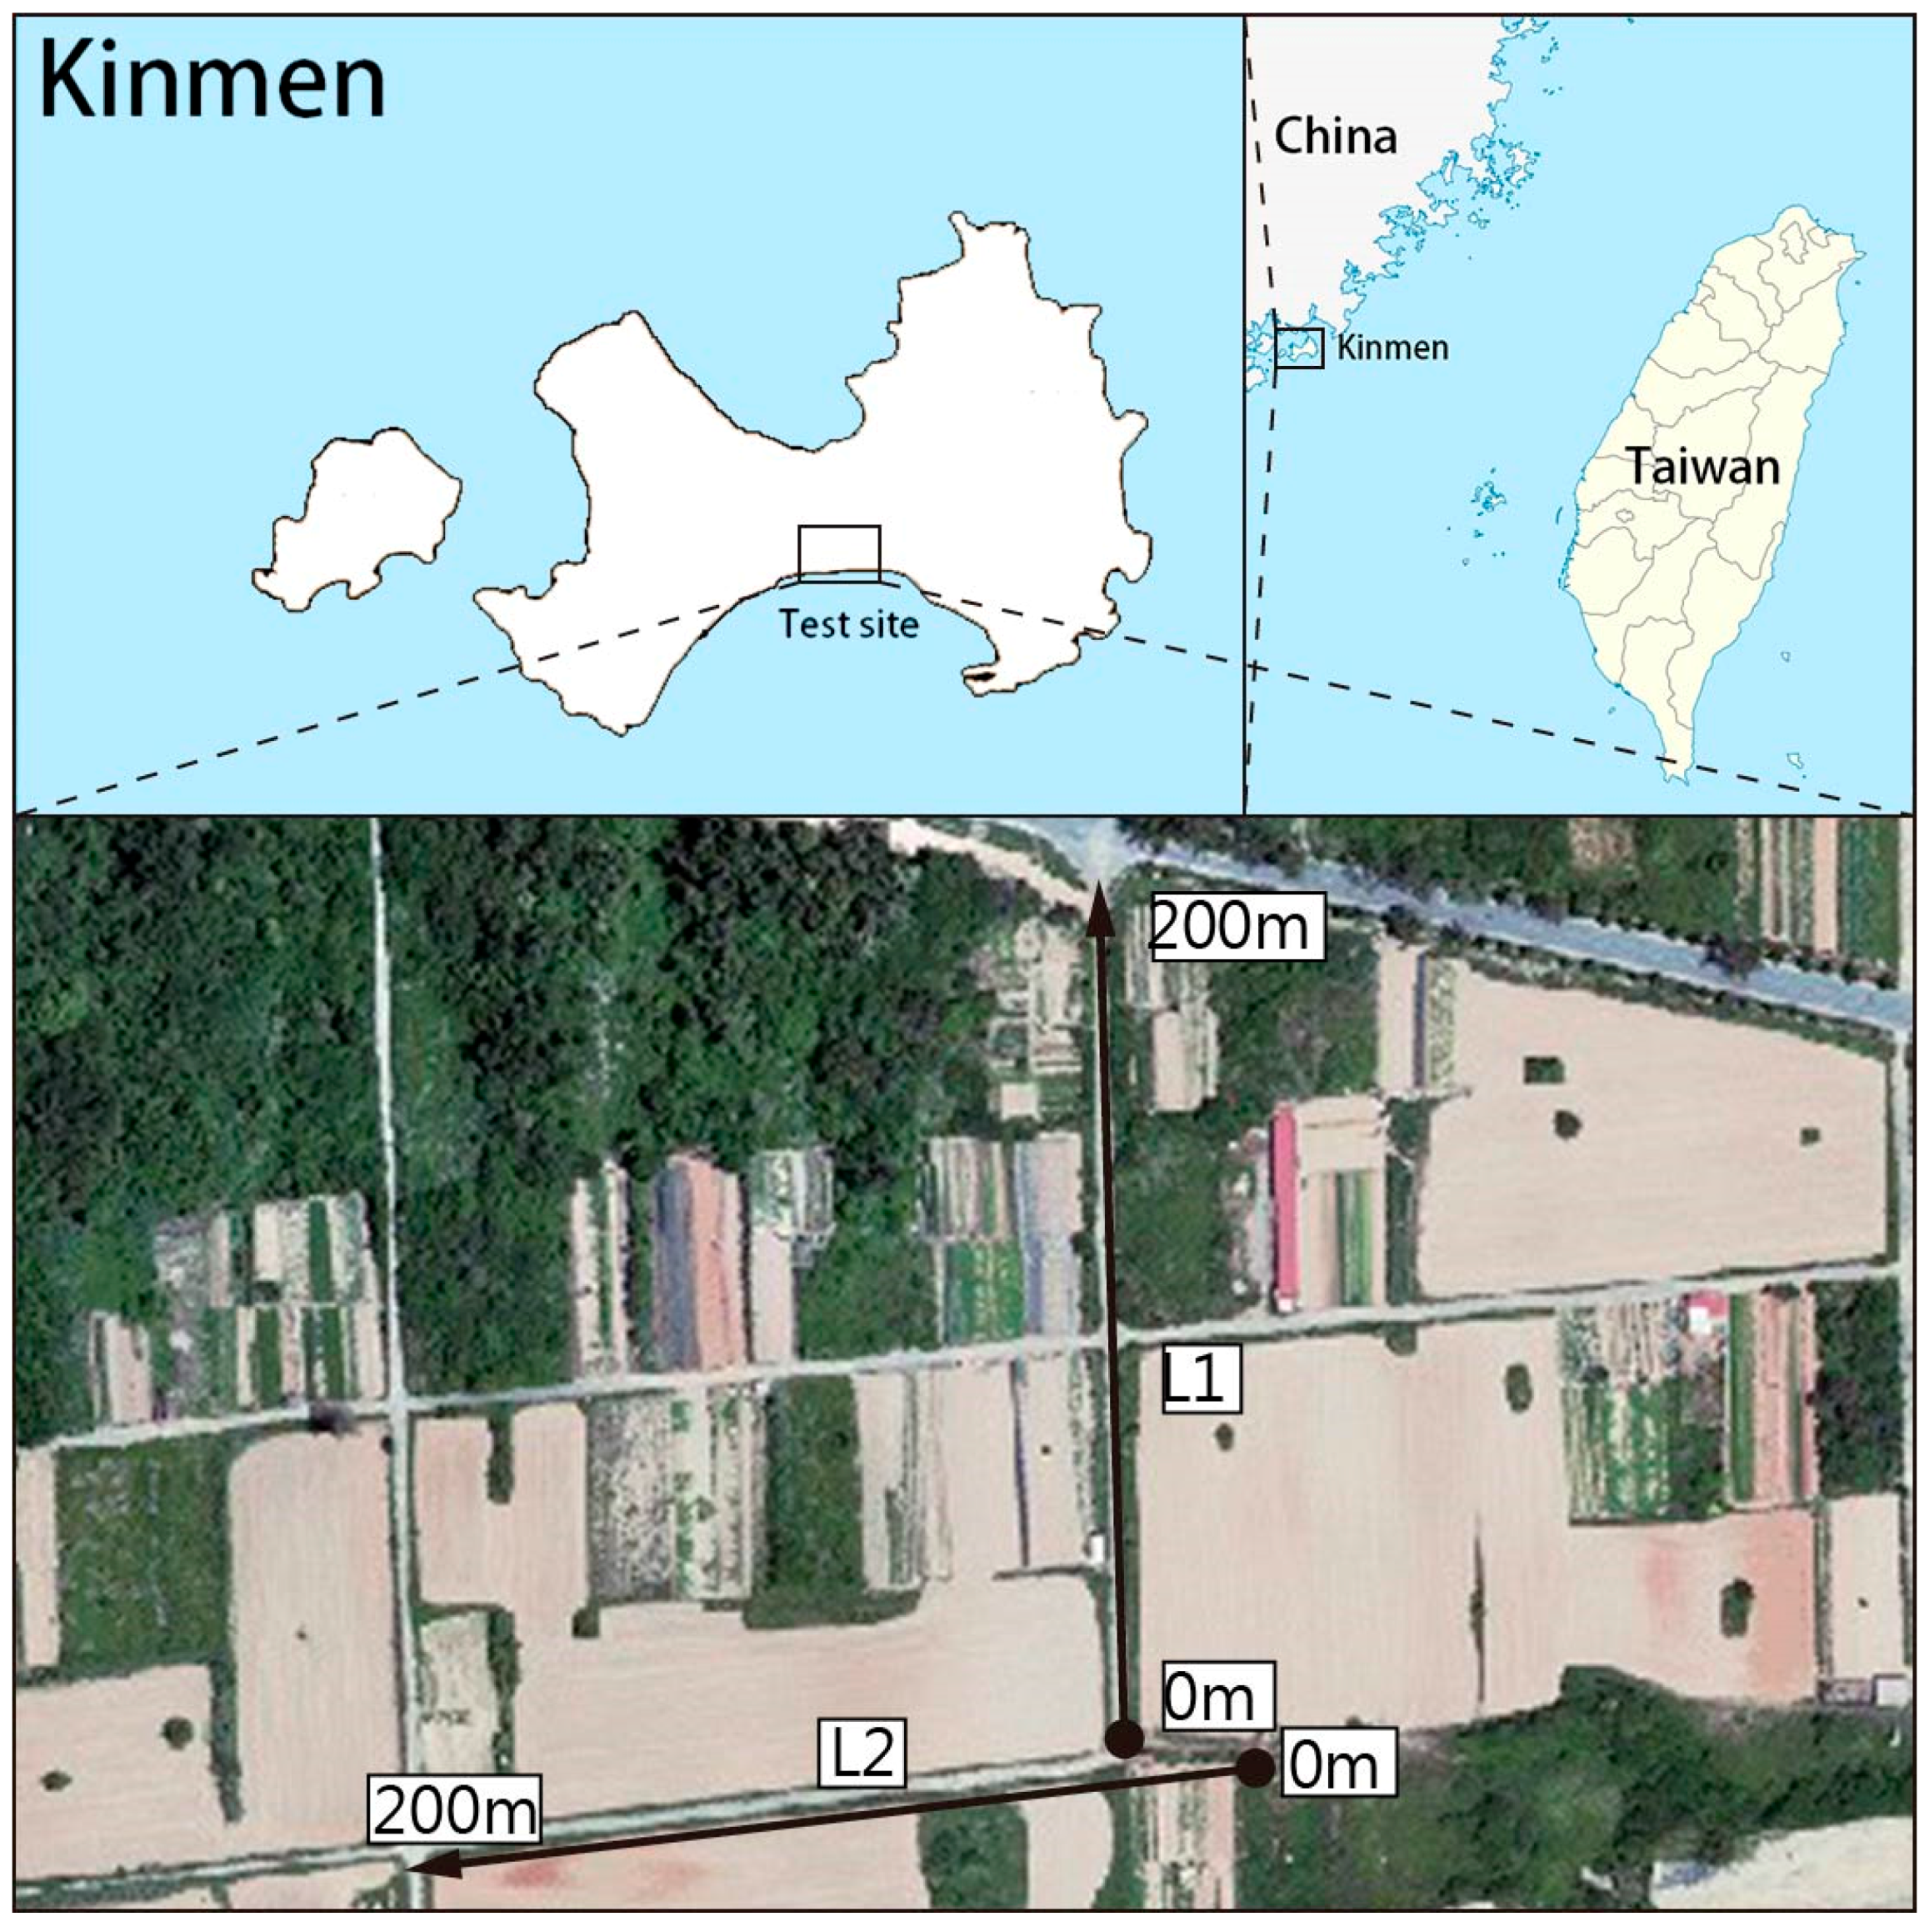
Kinmen is located at Xiamen bay, between China and Taiwan (see Figure 3). Kinmen includes 12 islands of different shapes, for example, Kinmen island, Lishou, Dadan Islet, Erdan Islet, etc., which is about 151 square kilometers in total. The Shangyi Village site is located in the middle coastal area along Kinmen Island. This study collected underground hydrogeological literature regarding two water supply wells on Kinmen Island that had been sealed due to salinization. In addition, on-site investigation found that some farmers once used shallow pumping wells for irrigation in measured areas. Local farmers expressed that underground water used for irrigation had crystals under strong sunlight. Therefore, this research chose Shangyi Village, which is an area more sensitive to seawater intrusion, as the test site. Figure 3 shows the location diagram of Shangyi Village, which is provided for the test with two-dimensional ERT.
This study laid two measuring lines near the pumping wells at the Shangyi test site, where measuring line L1 is vertical to the coast line and L2 is parallel to the coast line, in order to master the clearest change situation; Figure 3 is the location diagram of the laying of measuring lines. The two measuring lines are both about 200 m long, the electrode spacing is 5 m, and the Wenner-Schlumberger Array, which has excellent resolution both vertically and laterally, is adopted during on-site measurement for data collection. This investigation work uses the ground resistivity instrument SYSCAL PRO Switch 48, produced by the French IRIS Company, and each batch of measurement data is measured repeatedly in order to ensure the measuring quality and the difference of values obtained from each repeated measurement remains within 3%. In addition, the current values of the obtained data are controlled to ensure data with a high signal-to-noise ratio.
4. Test Results
4.1. ERT Field Acquisiton and Data Analysis
4.1.1. L1 Measuring Line
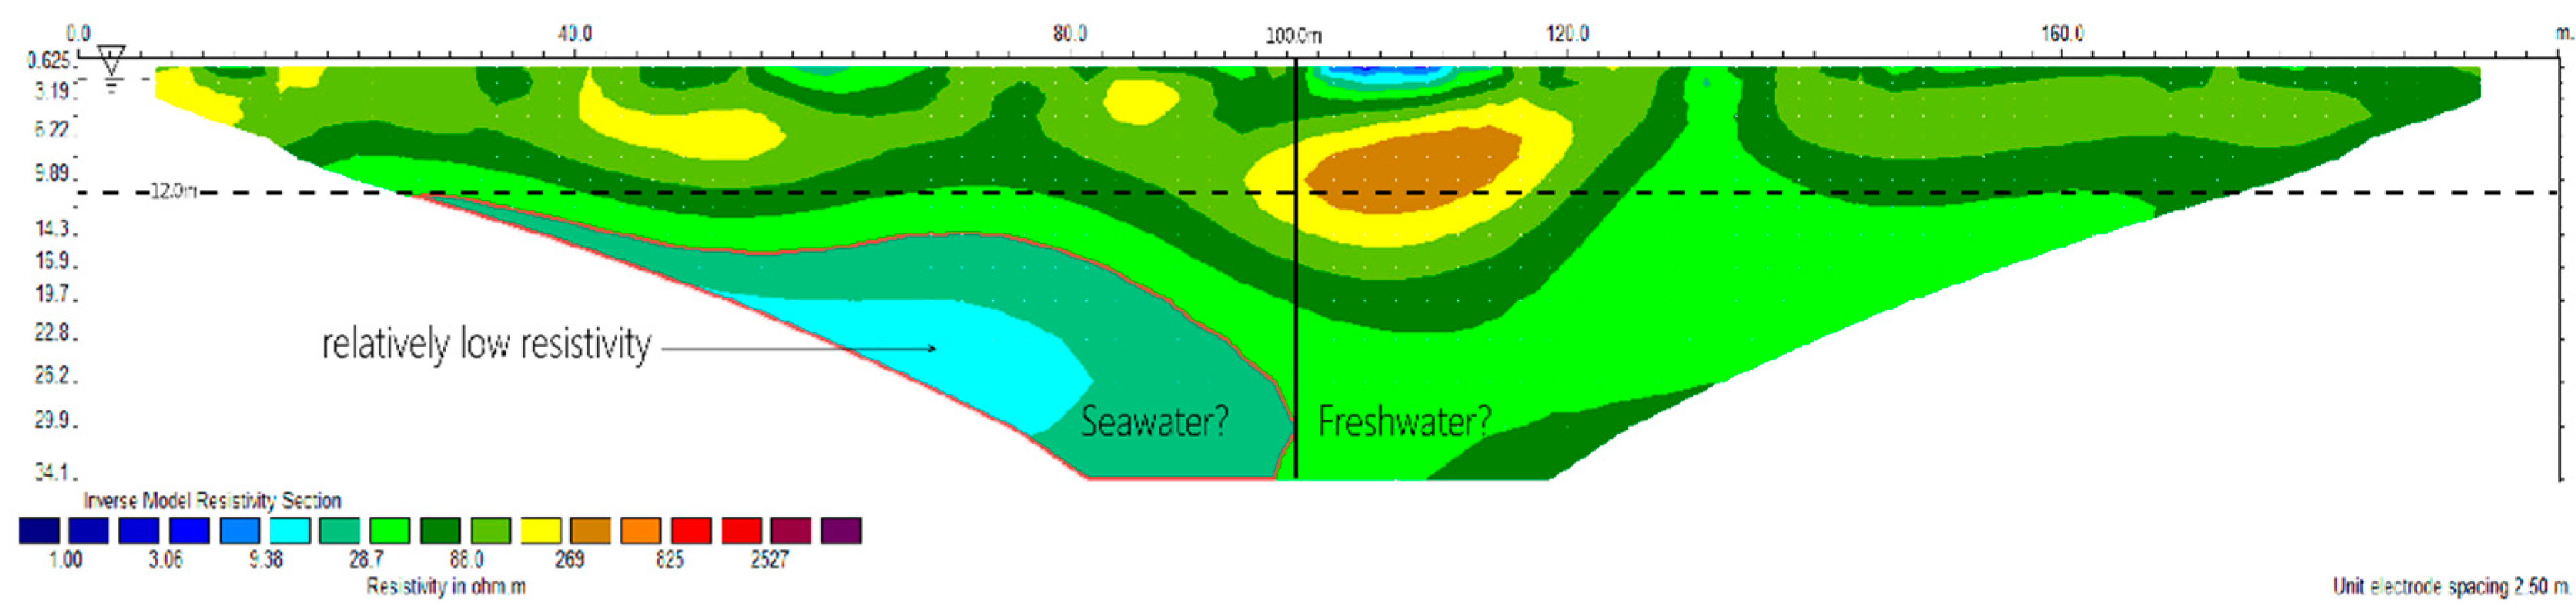
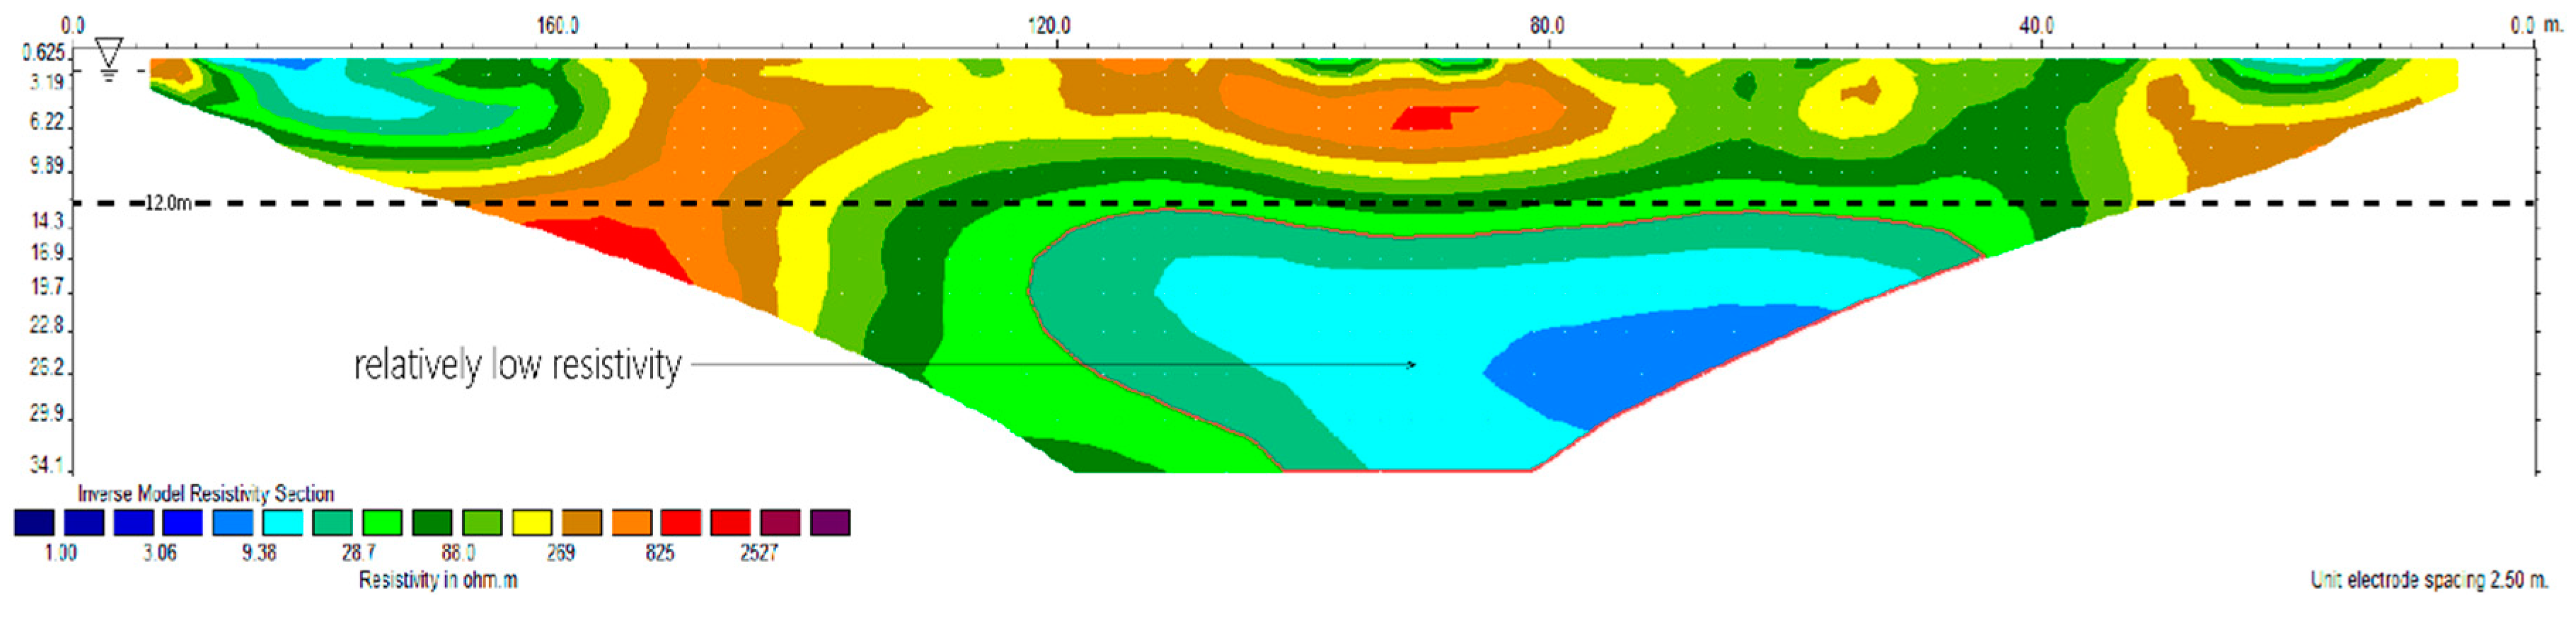
According to the measurement results of the Wenner-Schlumberger Array (Figure 4), the electrical stratum can be roughly divided into two layers, and resistivity is distributed in a high-low sequence from shallow to deep. The resistivity of the first layer mainly presents relatively high resistivity phenomena; the depth is below 12 m and the thickness is about 22 m. Low resistivity areas different from surrounding areas are found from the ground resistivity image 100 m away from the starting point of the measuring line, and it is preliminarily inferred that it is the front edge of the seawater intruding into the underground water.
4.1.2. L2 Measuring Line
According to the measurement results of the Wenner-Schlumberger Array (Figure 5), the electrical stratum can be roughly divided into two layers, and resistivity is distributed in a high-low sequence from shallow to deep. The resistivity of the first layer of the electrical stratum of the L2 measuring line mainly presents relatively high resistivity phenomena; the depth is within 12 m, and there is a relatively low resistivity group between 20 m and 170 m from the starting point of the measuring line, which is initially judged to have something to do with the adjacent water trench and nothing to do with seawater intrusion; the resistivity of the second layer mainly presents relatively low resistivity phenomena; the depth is below 12 m, the thickness is about 22 m, the low resistivity area of these two are at the same elevation, as compared with the L1 measuring line, and it is initially inferred that this area may be the flow path of the seawater.
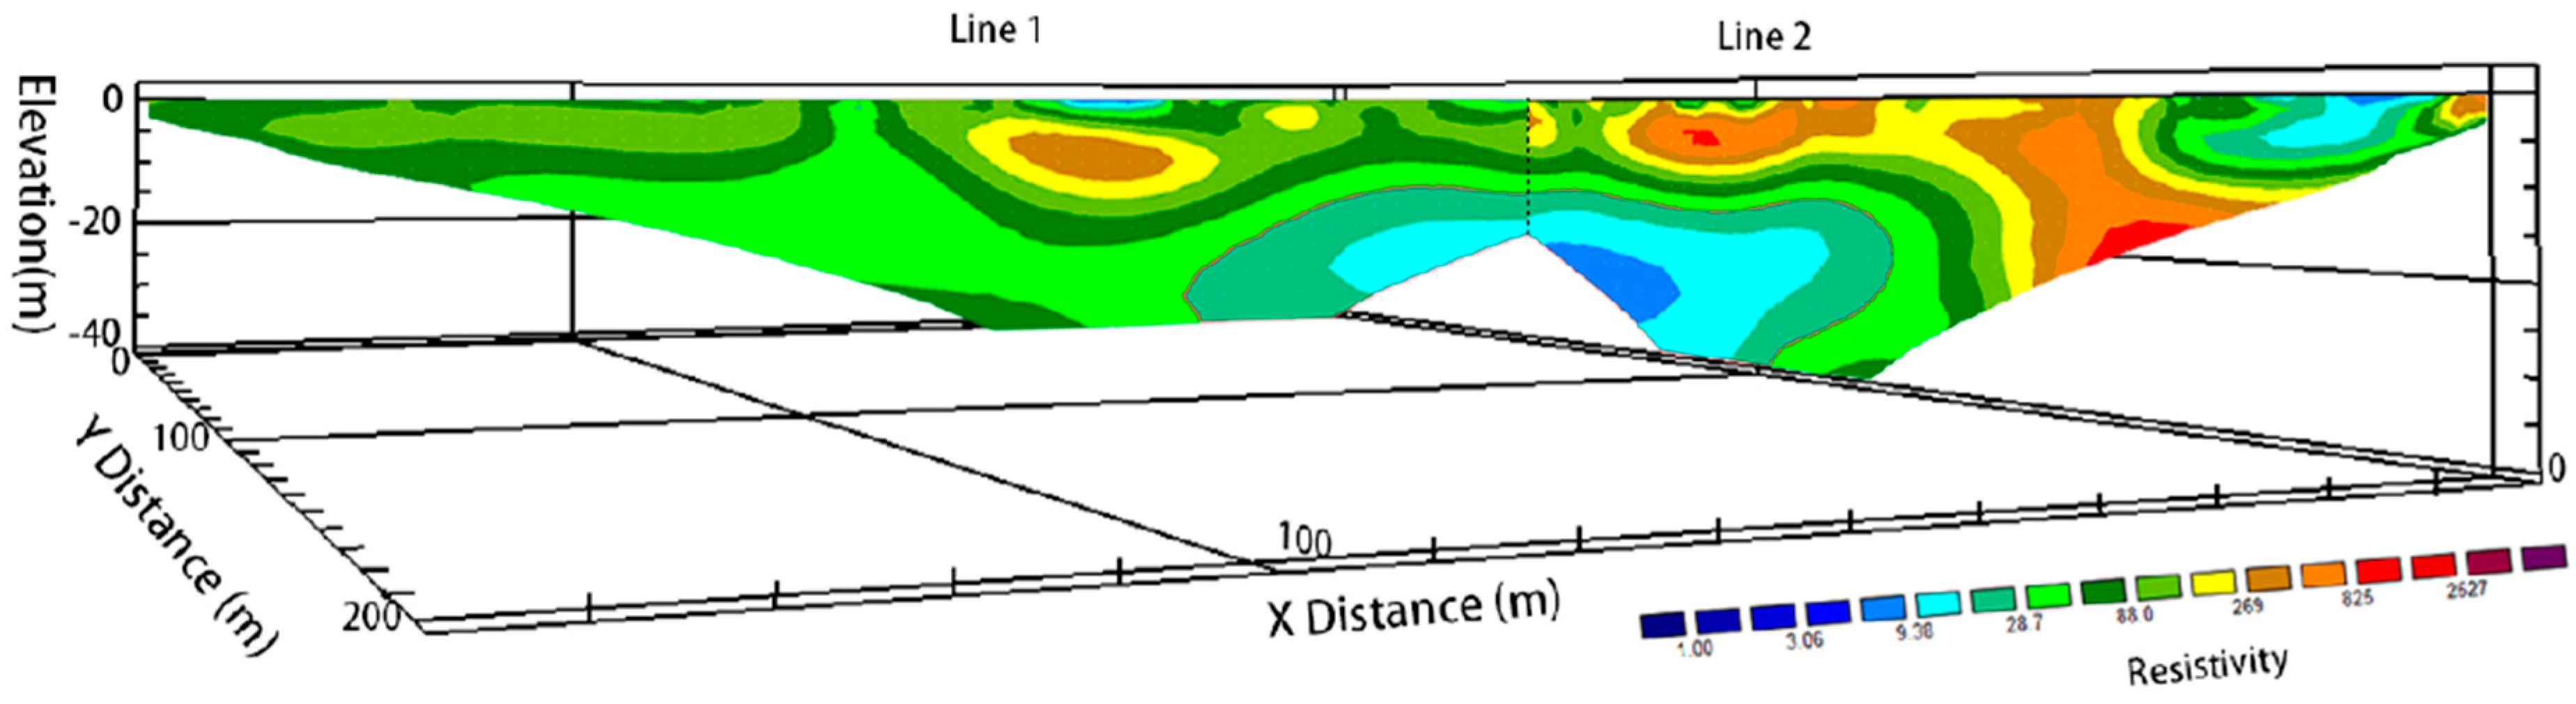
4.1.3. Comprehensive Interpretation
The low resistivity areas in the Line L1 cross-section appear to spatially correlate with the Line L2 cross-section. This study further simulates the 2.5D schematic of seawater intrusion (Figure 6) by combining L1 and L2. Figure 6 shows that the front edge of seawater intrusion on L1 is at the same elevation as the low resistivity area of L2, indicating that seawater is invading through the location of the L2 low resistivity area. This study concludes that the low resistivity area 12 m below L2 line is the flow path of the seawater.
Due to the lack of borehole data, it is difficult to interpret the data correctly. After the collection of the drilling data of the Kinmen area and by reference to the results of the “Foundation Survey Report on Drilling Operation Entrusted for Landing Field of Kinmen Shangyi Airport”, as implemented by the adjacent Kinmen Airport in 2012, it is shown that the geology of this location is silty layers with little gravel until 20 m below the ground surface. As shown in Table 2. The unified soil classification belongs to SP, and it is thus inferred that the water permeability of soil within 20 m of the ground surface is good and relatively uniform. The ground resistivity image should present uniformity without obvious resistivity difference. If there exist obvious resistivity differences, the main impact factors may be water in the soil. Therefore, the data obtained by L1 is judged to imply that the position at about 100 m from the measuring line is possibly the position of the front edge of seawater intrusion. If the inference regarding the L1 measuring line is established, then L2, which is laid near the coast, should be located in a seawater area. With reference to the ground resistivity result of L2, it is found from the ground resistivity image that a low resistivity area different from the surrounding area is found at the position of a depth of about 12 meters, and between 40 m and 140 m from the measuring line, which is the same as the elevation of the front edge of the seawater intrusion inferred from the L1 measuring line; therefore, this area is the flow path of the seawater.
The interface between seawater and freshwater was found in the L1 profile. In order to confirm whether the water quality in front of and behind the interface is indeed different, the water sampling test was conducted in the L1 line at 100 m (the front edge of the seawater intrusion) and at 125 m (Table 3), and the water sample depth is about 1 m below the ground. The test results showed that the electrical conductivity, chlorine salt, and total dissolved solid values of sample 1 are all higher than freshwater, indicating that sample 1 is already affected by seawater intrusion. Sample 2 is slightly affected by seawater intrusion, but less than sample 1. This result is consistent with the front edge of seawater intrusion of Figure 4.
In this comprehensive interpretation, the seawater flow path is assumed to be in the low-resistance region with a depth of 12 m below the L2 line and L1 line through the ground resistivity image of L1 and L2. By obtaining geological data from nearby geological drilling and performing water quality sampling tests to obtain water quality data, the ground resistance image obtained in this research experiment was used to determine the results. The analysis results show that the front edge position of seawater intrusion can be captured with Electrical Resistivity Tomography, which is beneficial to early warning for seawater intrusion.
4.2. Time-Lapse
Preliminary detection results confirm that ERT can capture the position of the front edge of seawater intrusion; thus, this study further measured the test site with the Time-lapse method. As seawater intrusion is most affected by tidal action, the change of the measurement results of the measurement line on the time axis, as well as the impact model on seawater intrusion, are observed with a tidal cycle of 15 days as the measuring cycle.
4.2.1. L1 Measuring Line
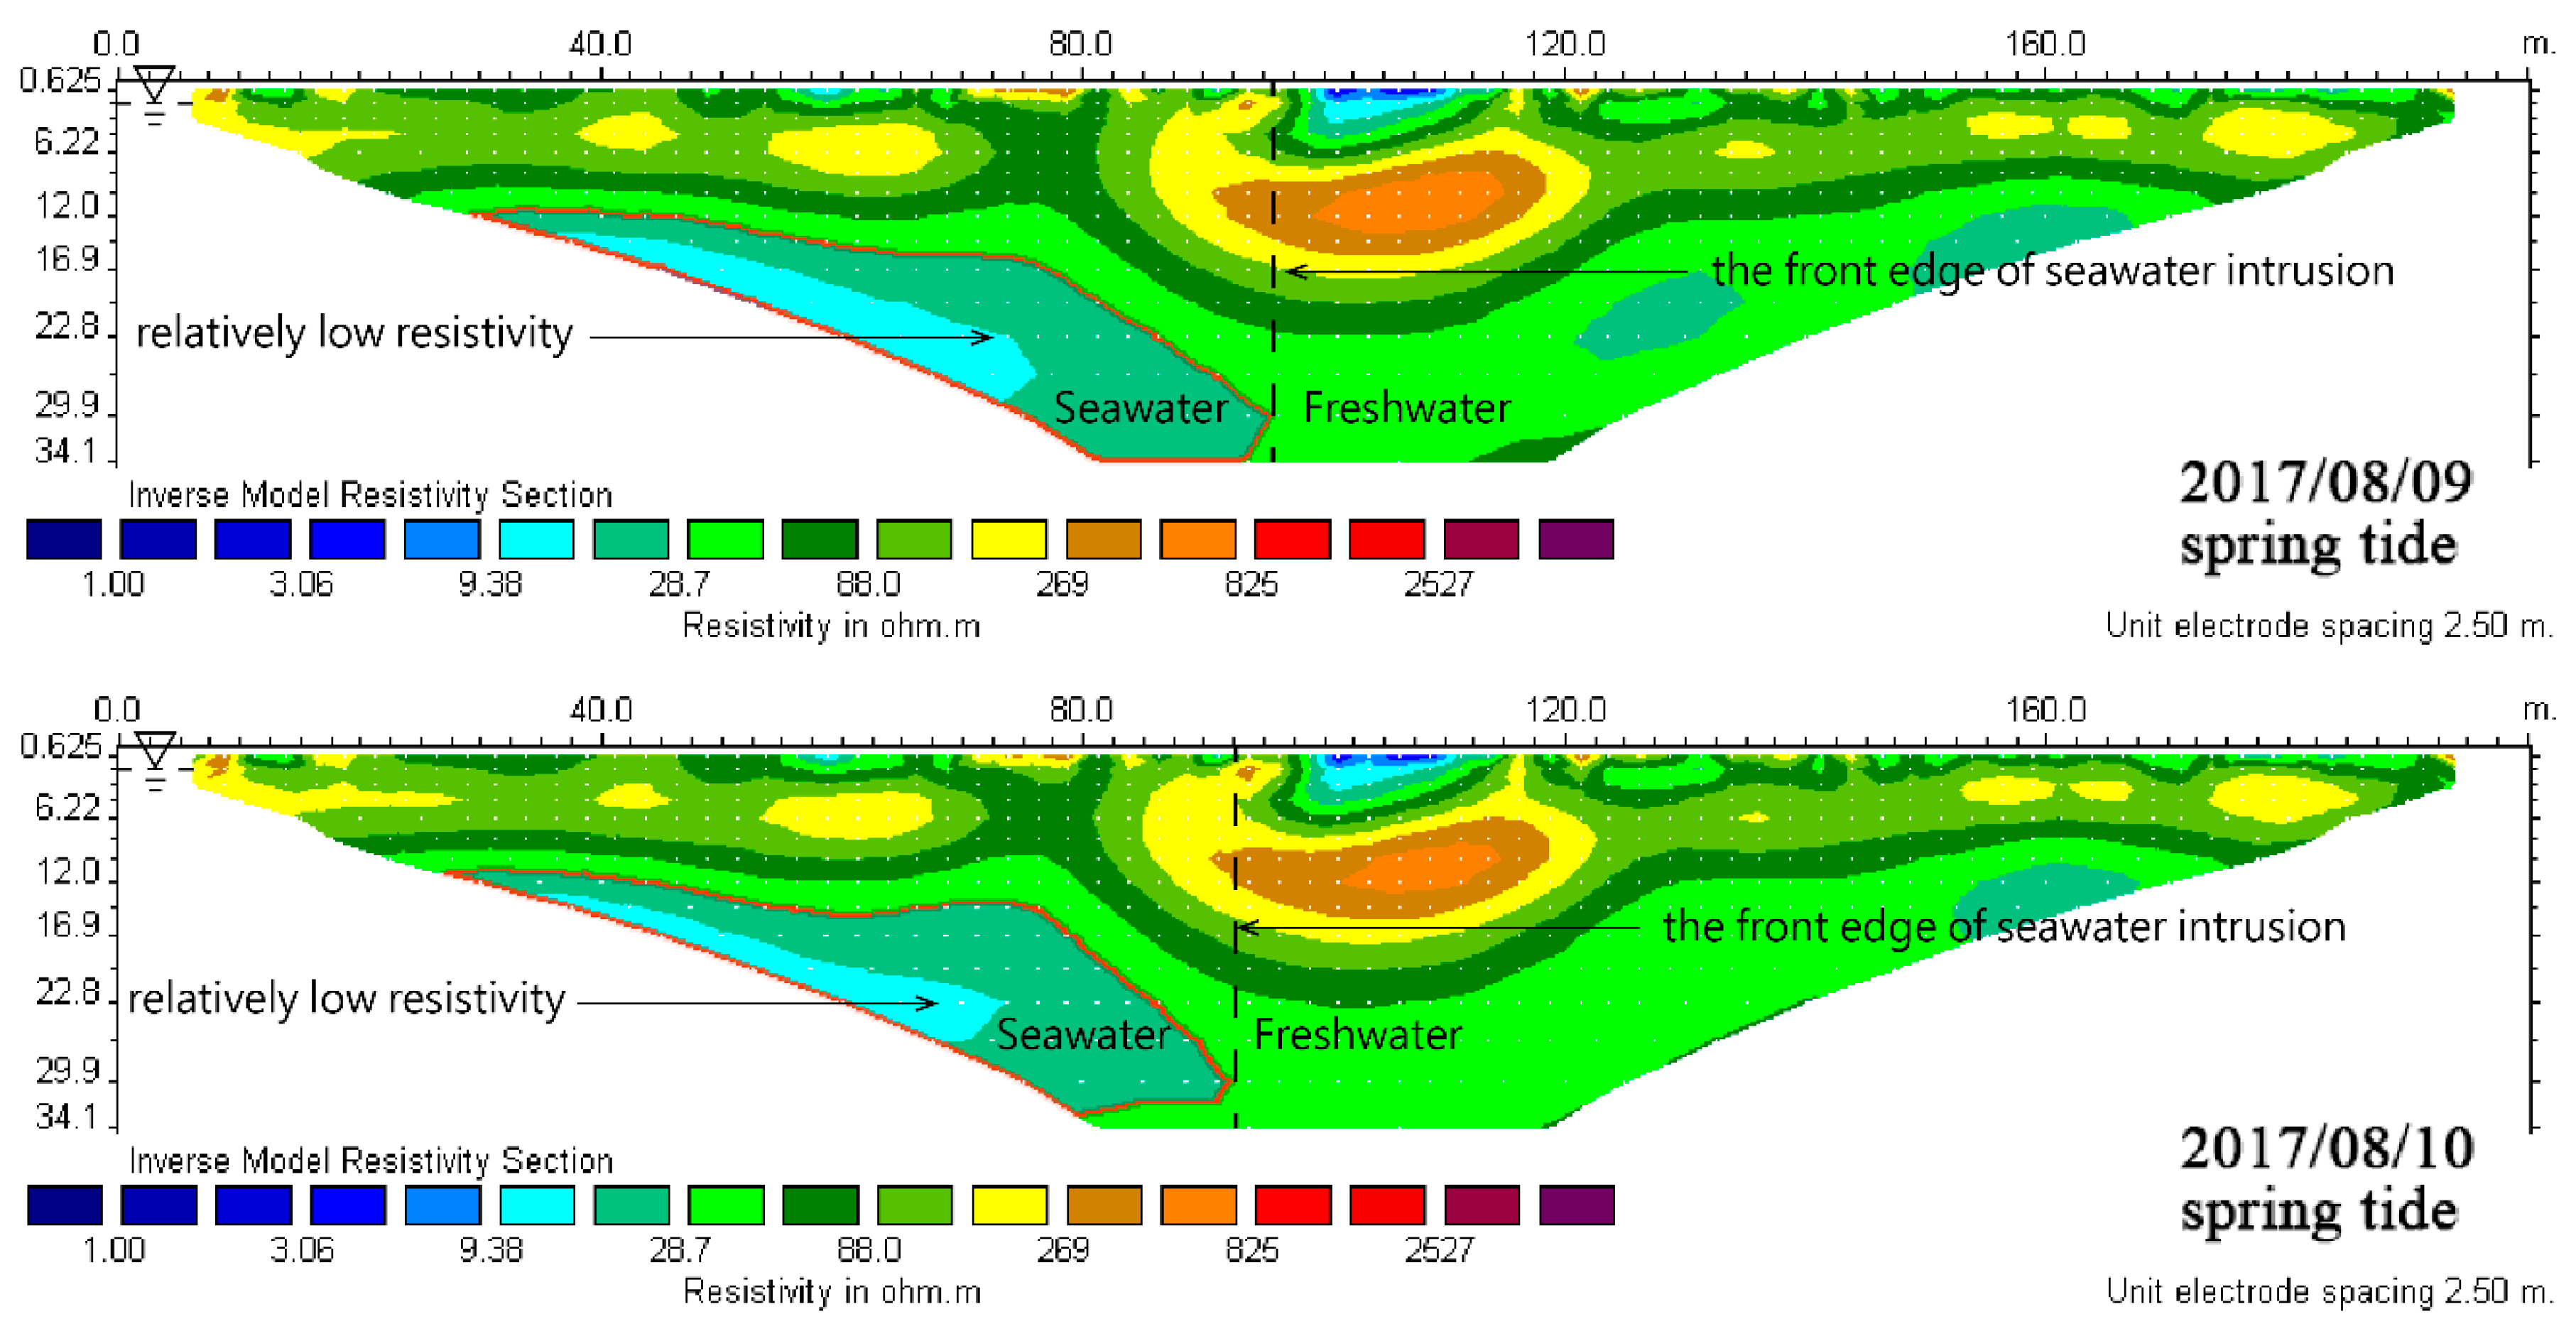
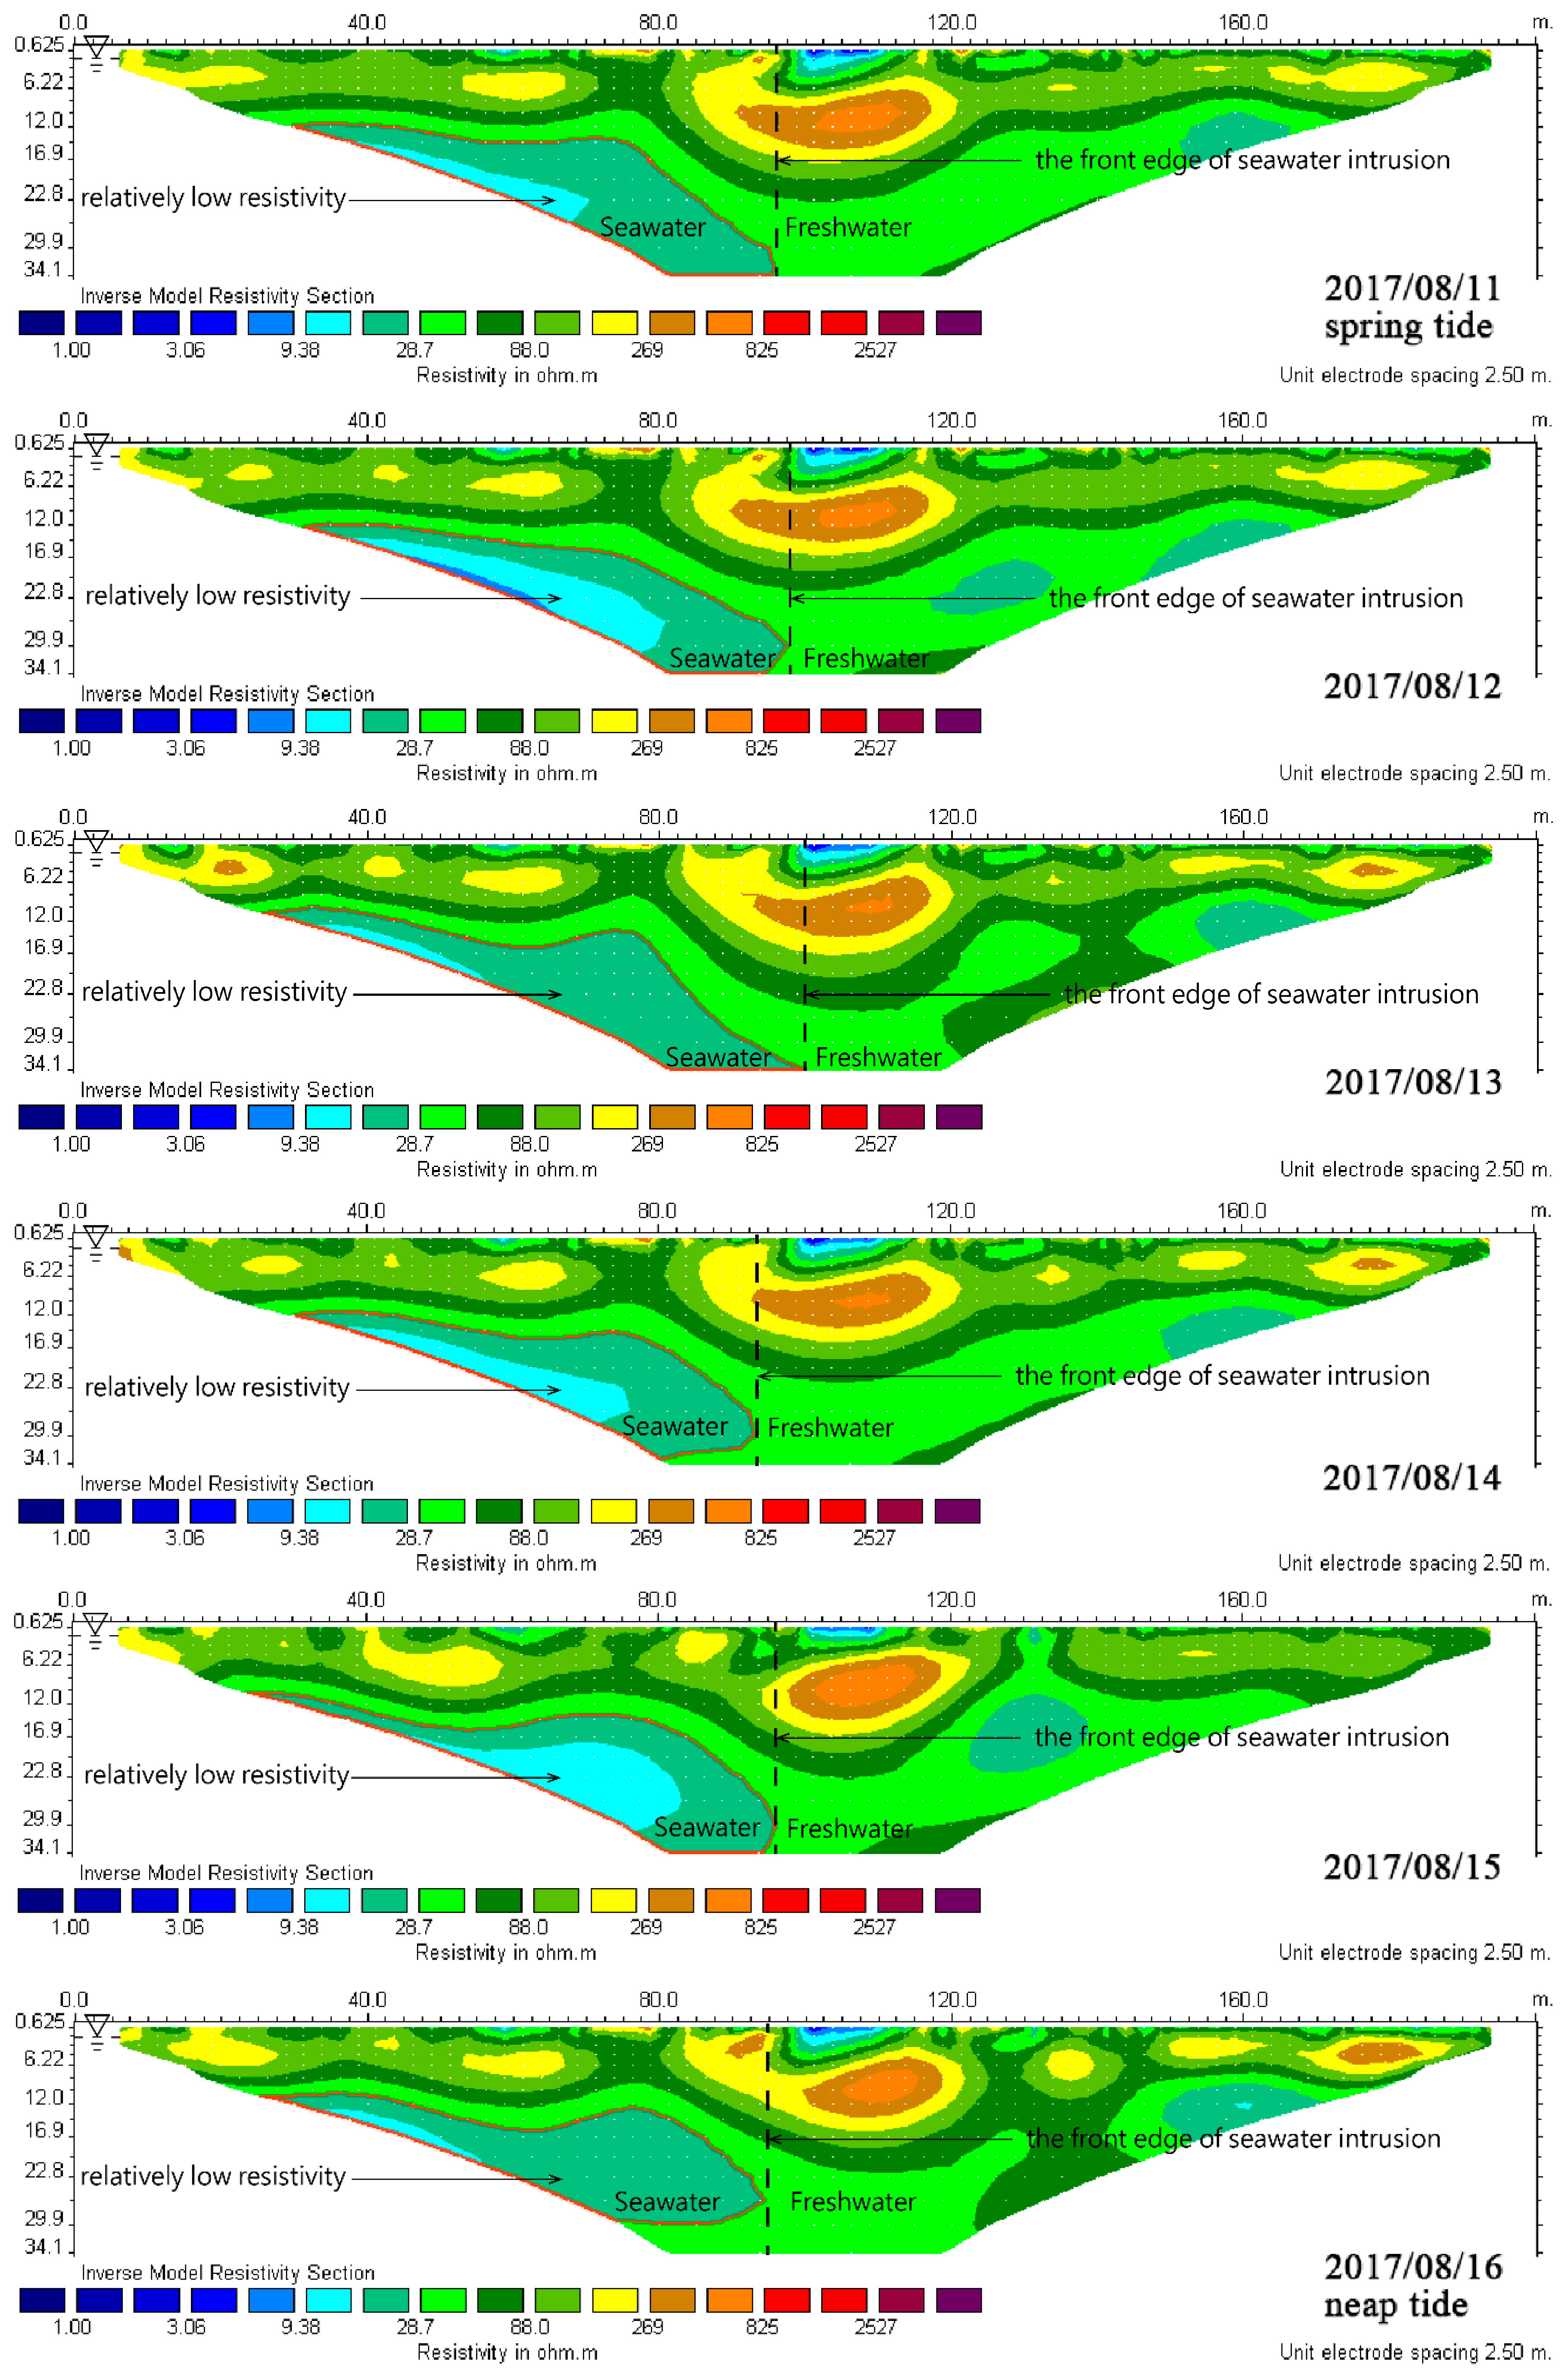
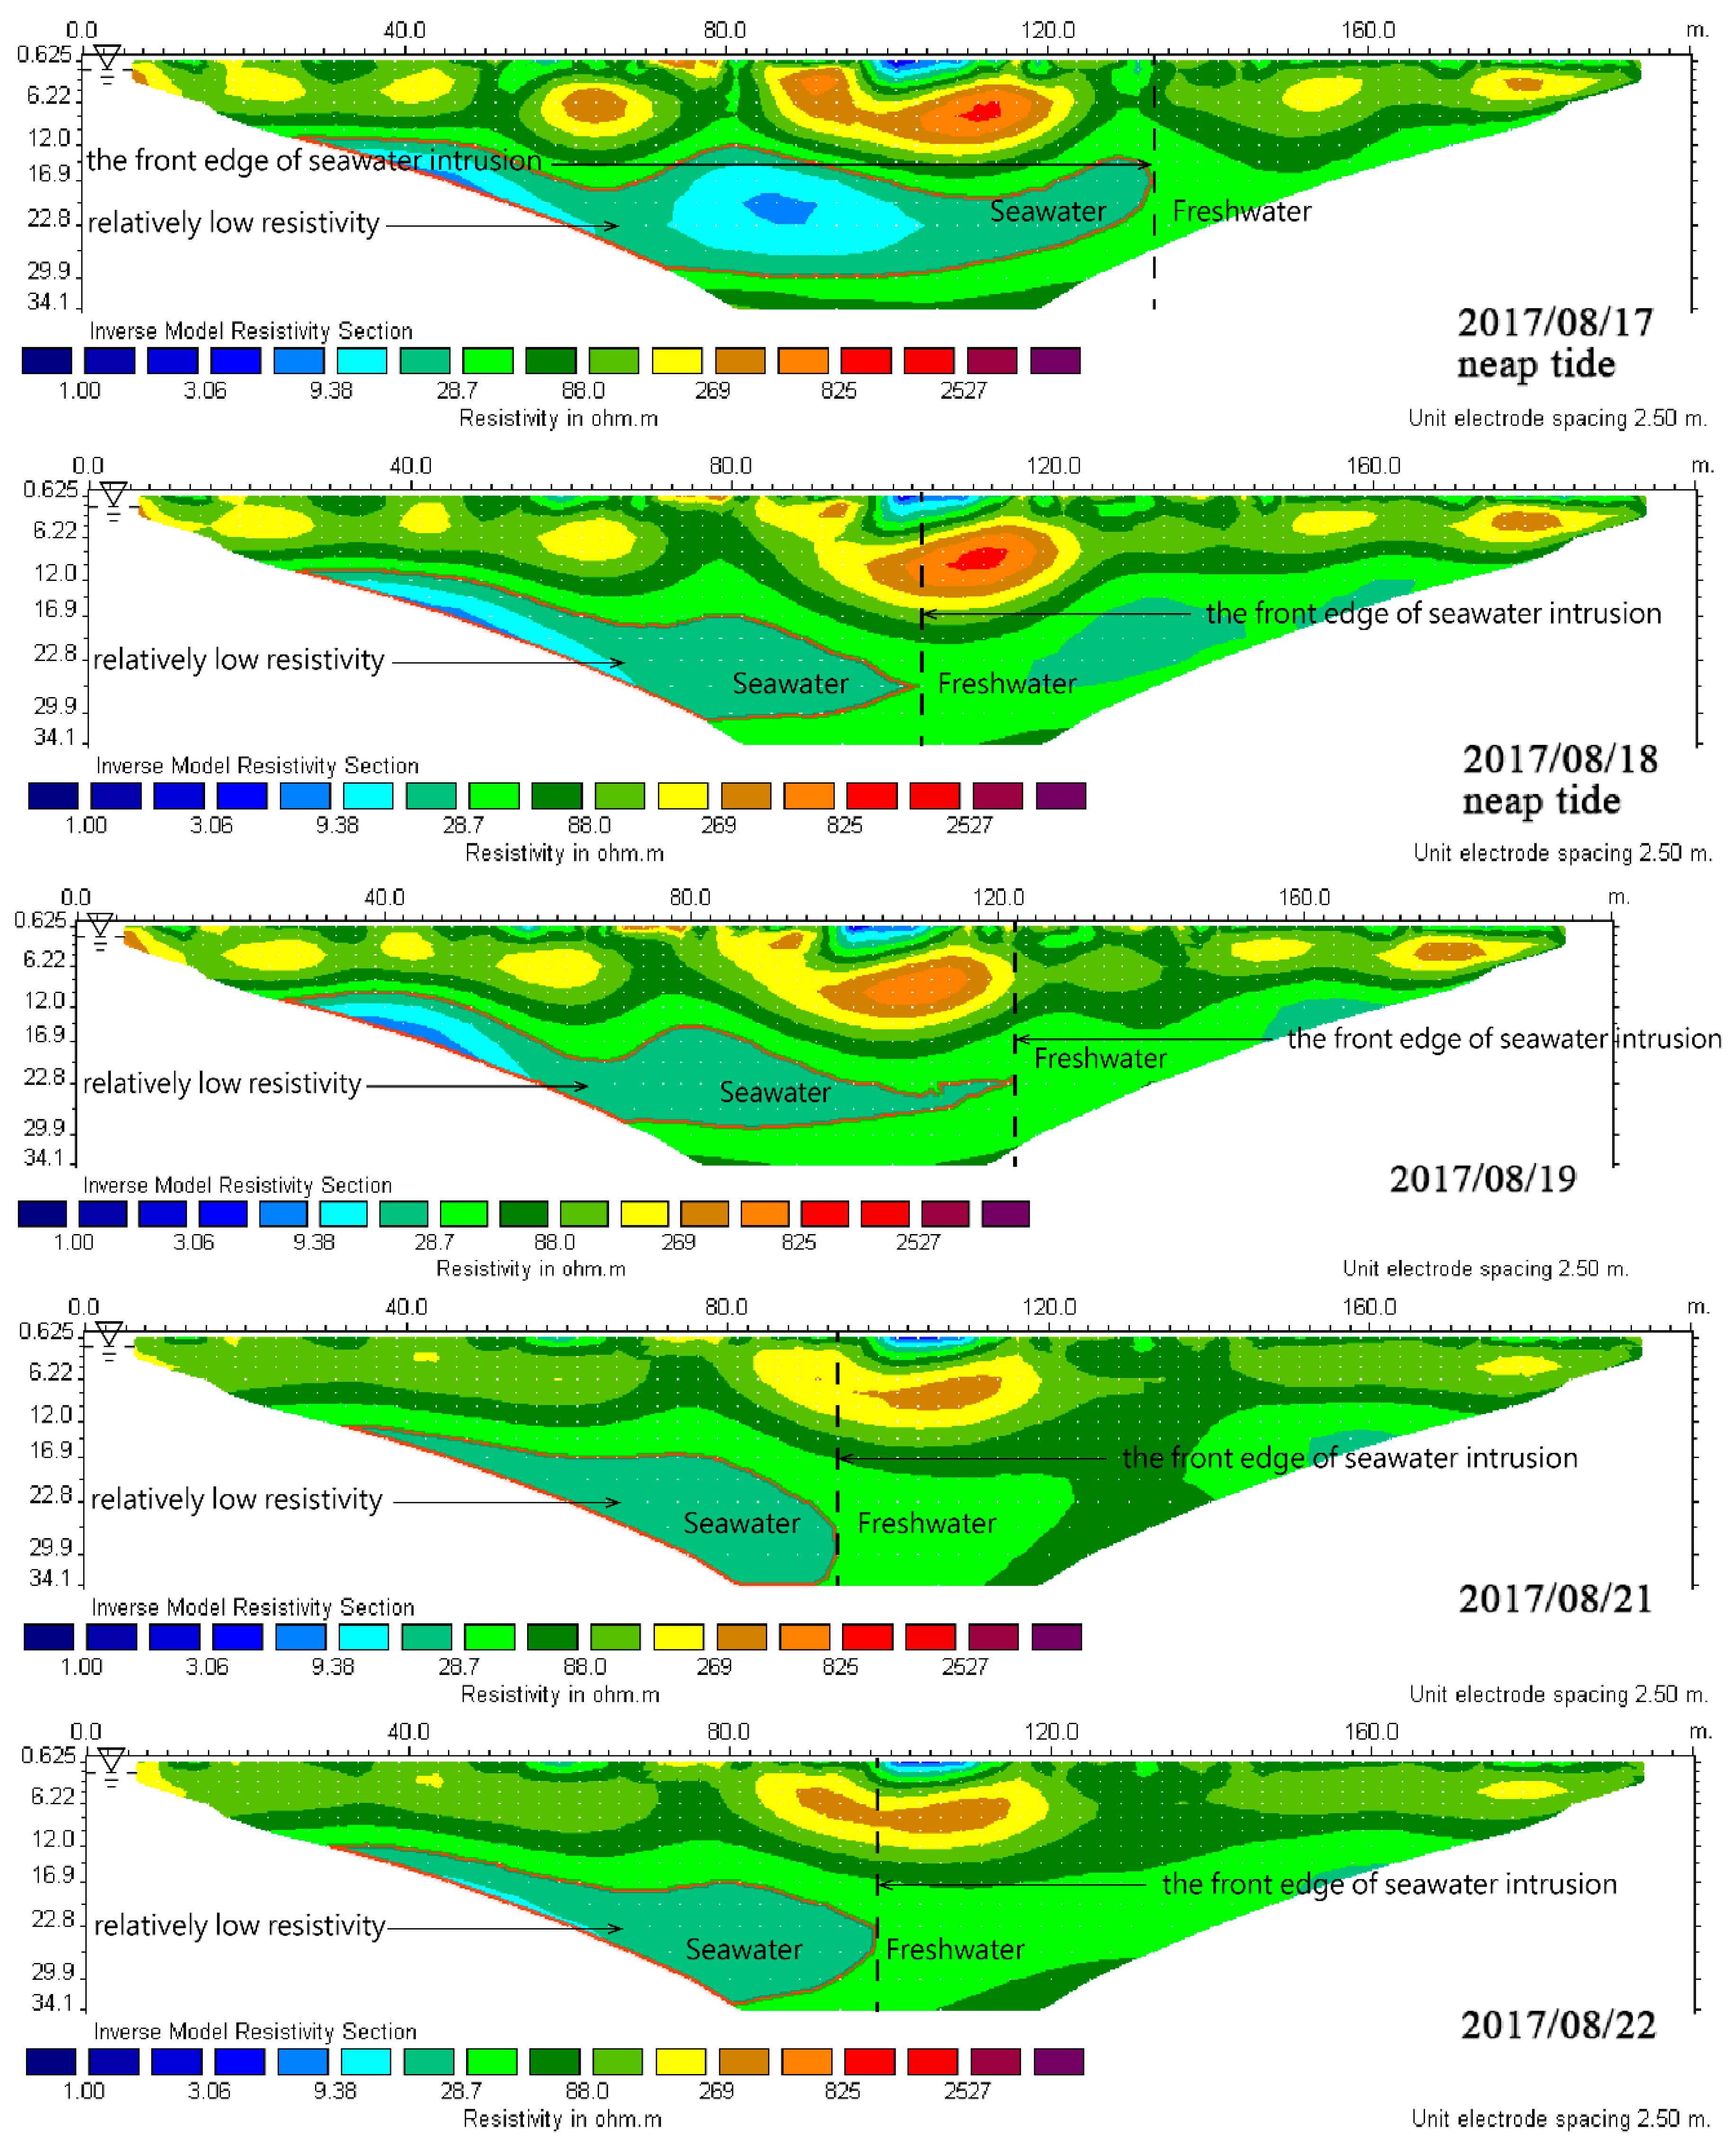
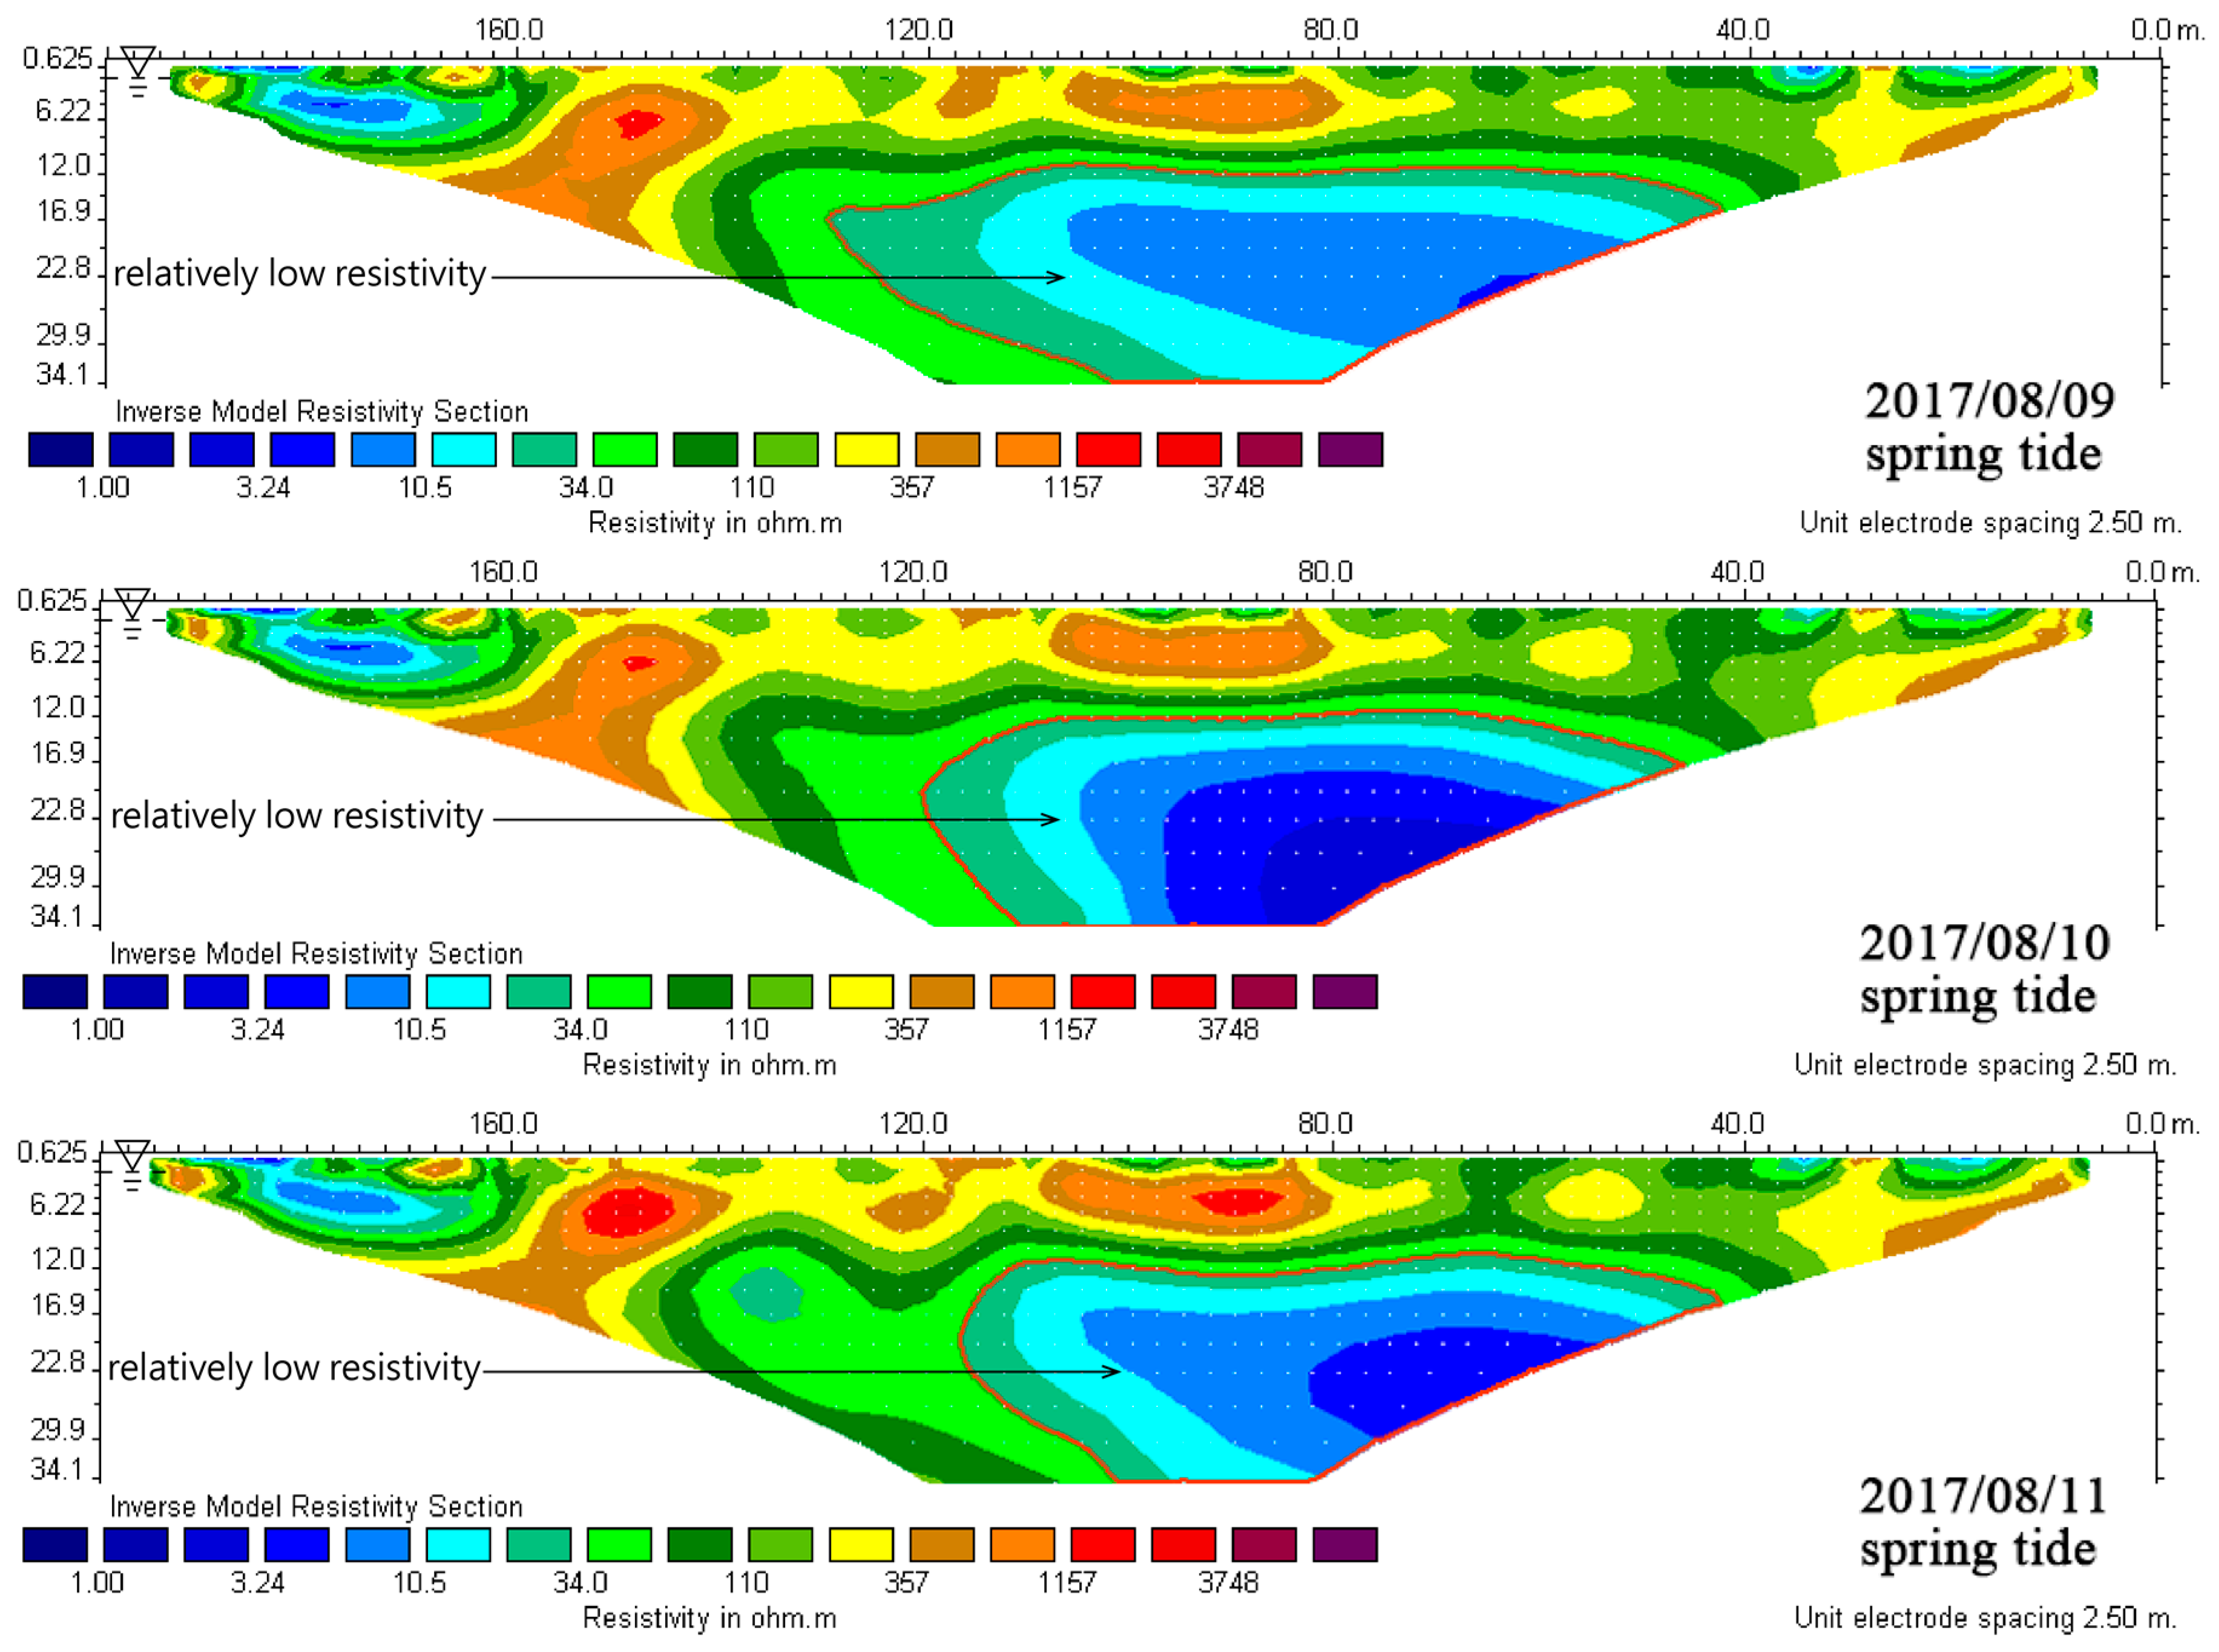
Figure 7 is the ground resistivity image, as measured for 15 consecutive days at the L1 measuring line, which shows that the resistivity within 12 m of the depth of the L1 measuring line fails to present abnormal change with the change of time axis; the resistivity of the area 12 m below the L1 measuring line exhibits regular change with the change of time axis, and from 9 August 2017 to 17 August 2017, the low resistivity area extends from about 80 meters away from the starting point of the measuring line to about 140 meters; while the low resistivity area holds back from about 140 m away from the starting point of the measuring line to about 80 m from 17 August 2017 to 25 August 2017. The change rule is consistent with the tidal cycle, and it can be inferred that both the driving force of tidal action and the elevation change of sea surface will affect the depth of seawater intruding inland.
4.2.2. L2 Measuring Line
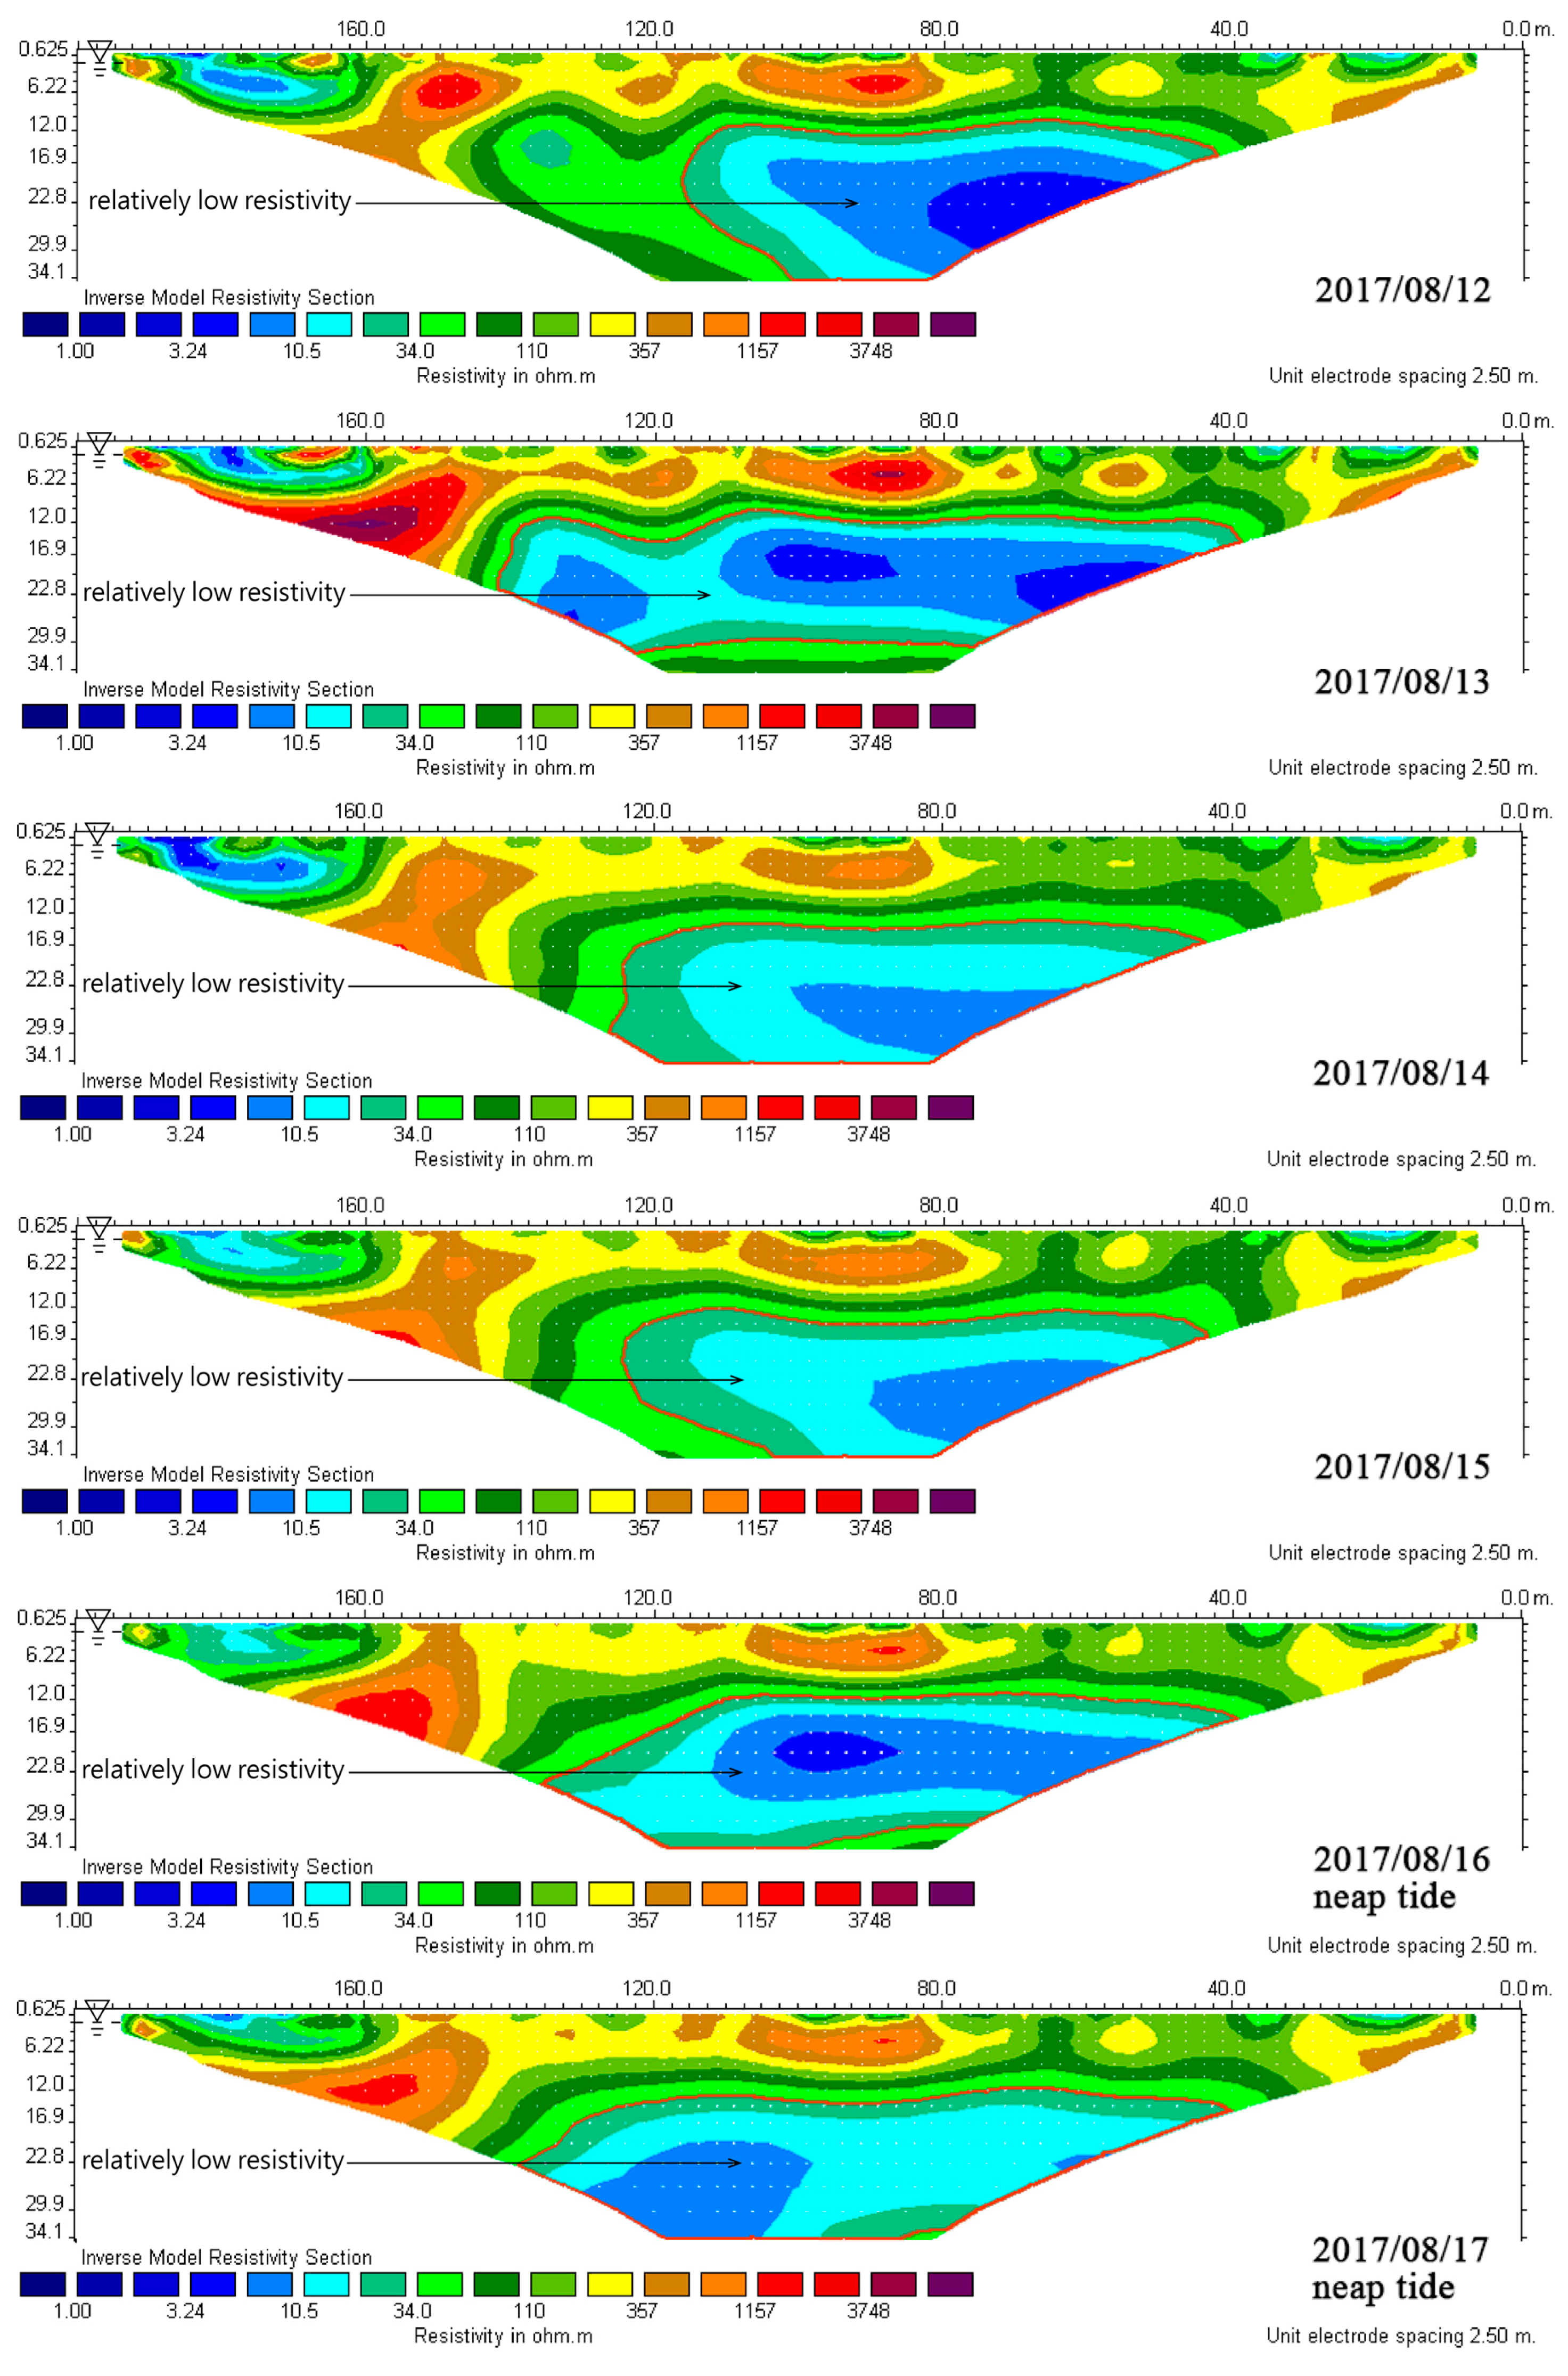
Figure 8 shows the ground resistivity image of the L2 measuring line measured consecutively for 15 days; it is observed from the time axis that the resistivity profile of the L2 measuring line has no obvious abnormal changes during these 15 days—all the profile images have consistency, the caliber of the flow path of seawater presents periodic change from large to small and from small to large with the change of time axis only in the area of flow path of seawater, and this rule is the same as the change of the L1 measuring line; thus, it is initially judged that the flow path of seawater will be jointly affected when the tidal action affects the depth of seawater intrusion.
4.3. Tidal Action
It can be found from the time-lapse analysis above that the change of the resistivity profile of L1 and L2 measuring lines has a relationship with tide; thus, this study further studied the relationship between the phenomena of tidal action and seawater intrusion, tide rise and ebb with half a day as the cycle, and spring tide and neap tide with 15 days as the cycle are measured and analyzed, and the measurement results are as follows.
4.3.1. L1 Measuring Line of Tide Rise and Tide Ebb
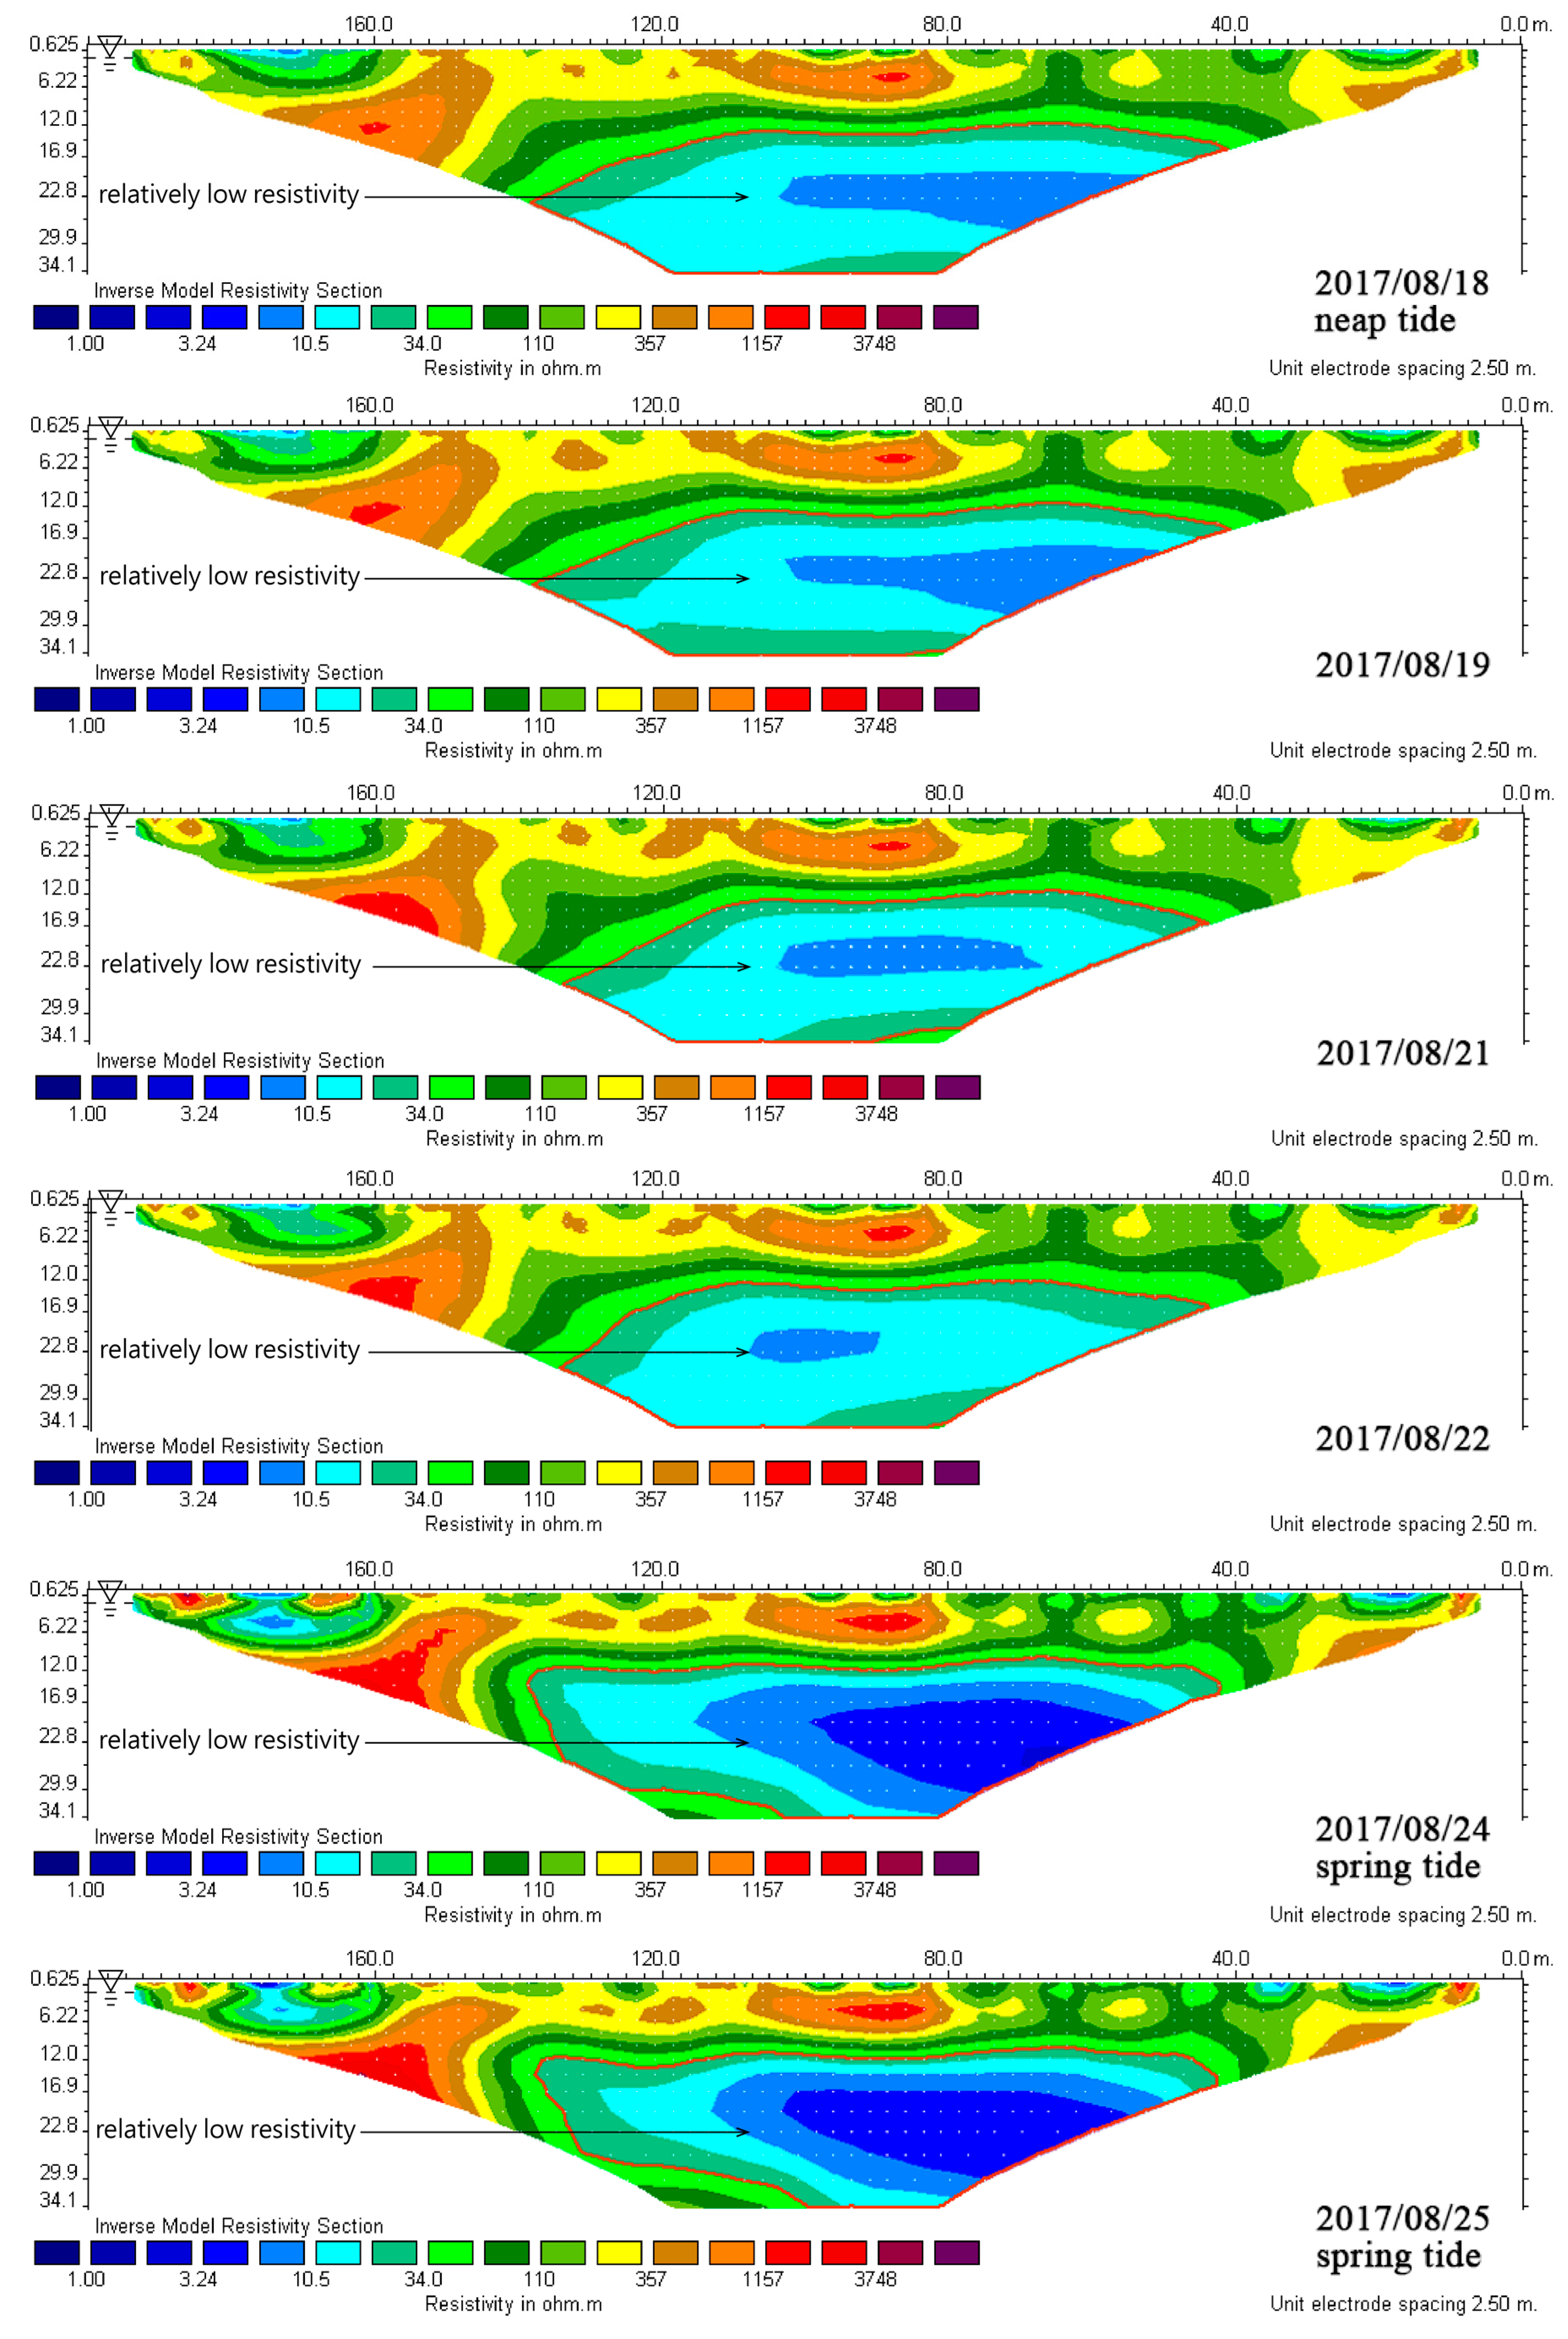
In order to observe the effect of rising tide on seawater intrusion, this study measured high tide and low tide levels on 27 July, and the measuring results in Figure 9 show that the position of the front edge of seawater intrusion is at about 170 m from the measuring line for the low tide level, while the position of the front edge of seawater intrusion is about 130 m from the measuring line for the high tide level. These research results also show that the rising tide has a delaying effect on the underground water of seawater intrusion; when the tide ebbs to the low tide level, the water level gradually decreases, the seawater intruding inland needs time to slowly seep, and the soil is still in a moist condition. Therefore, it can be seen from the image obtained that the front edge of the seawater intrusion penetrates inland; when the tide rises to a high tide level, the sea level rises gradually, and the seawater takes time to penetrate inland. Thus, it is seen from the image obtained that the front edge of seawater intrusion penetrates shallowly.
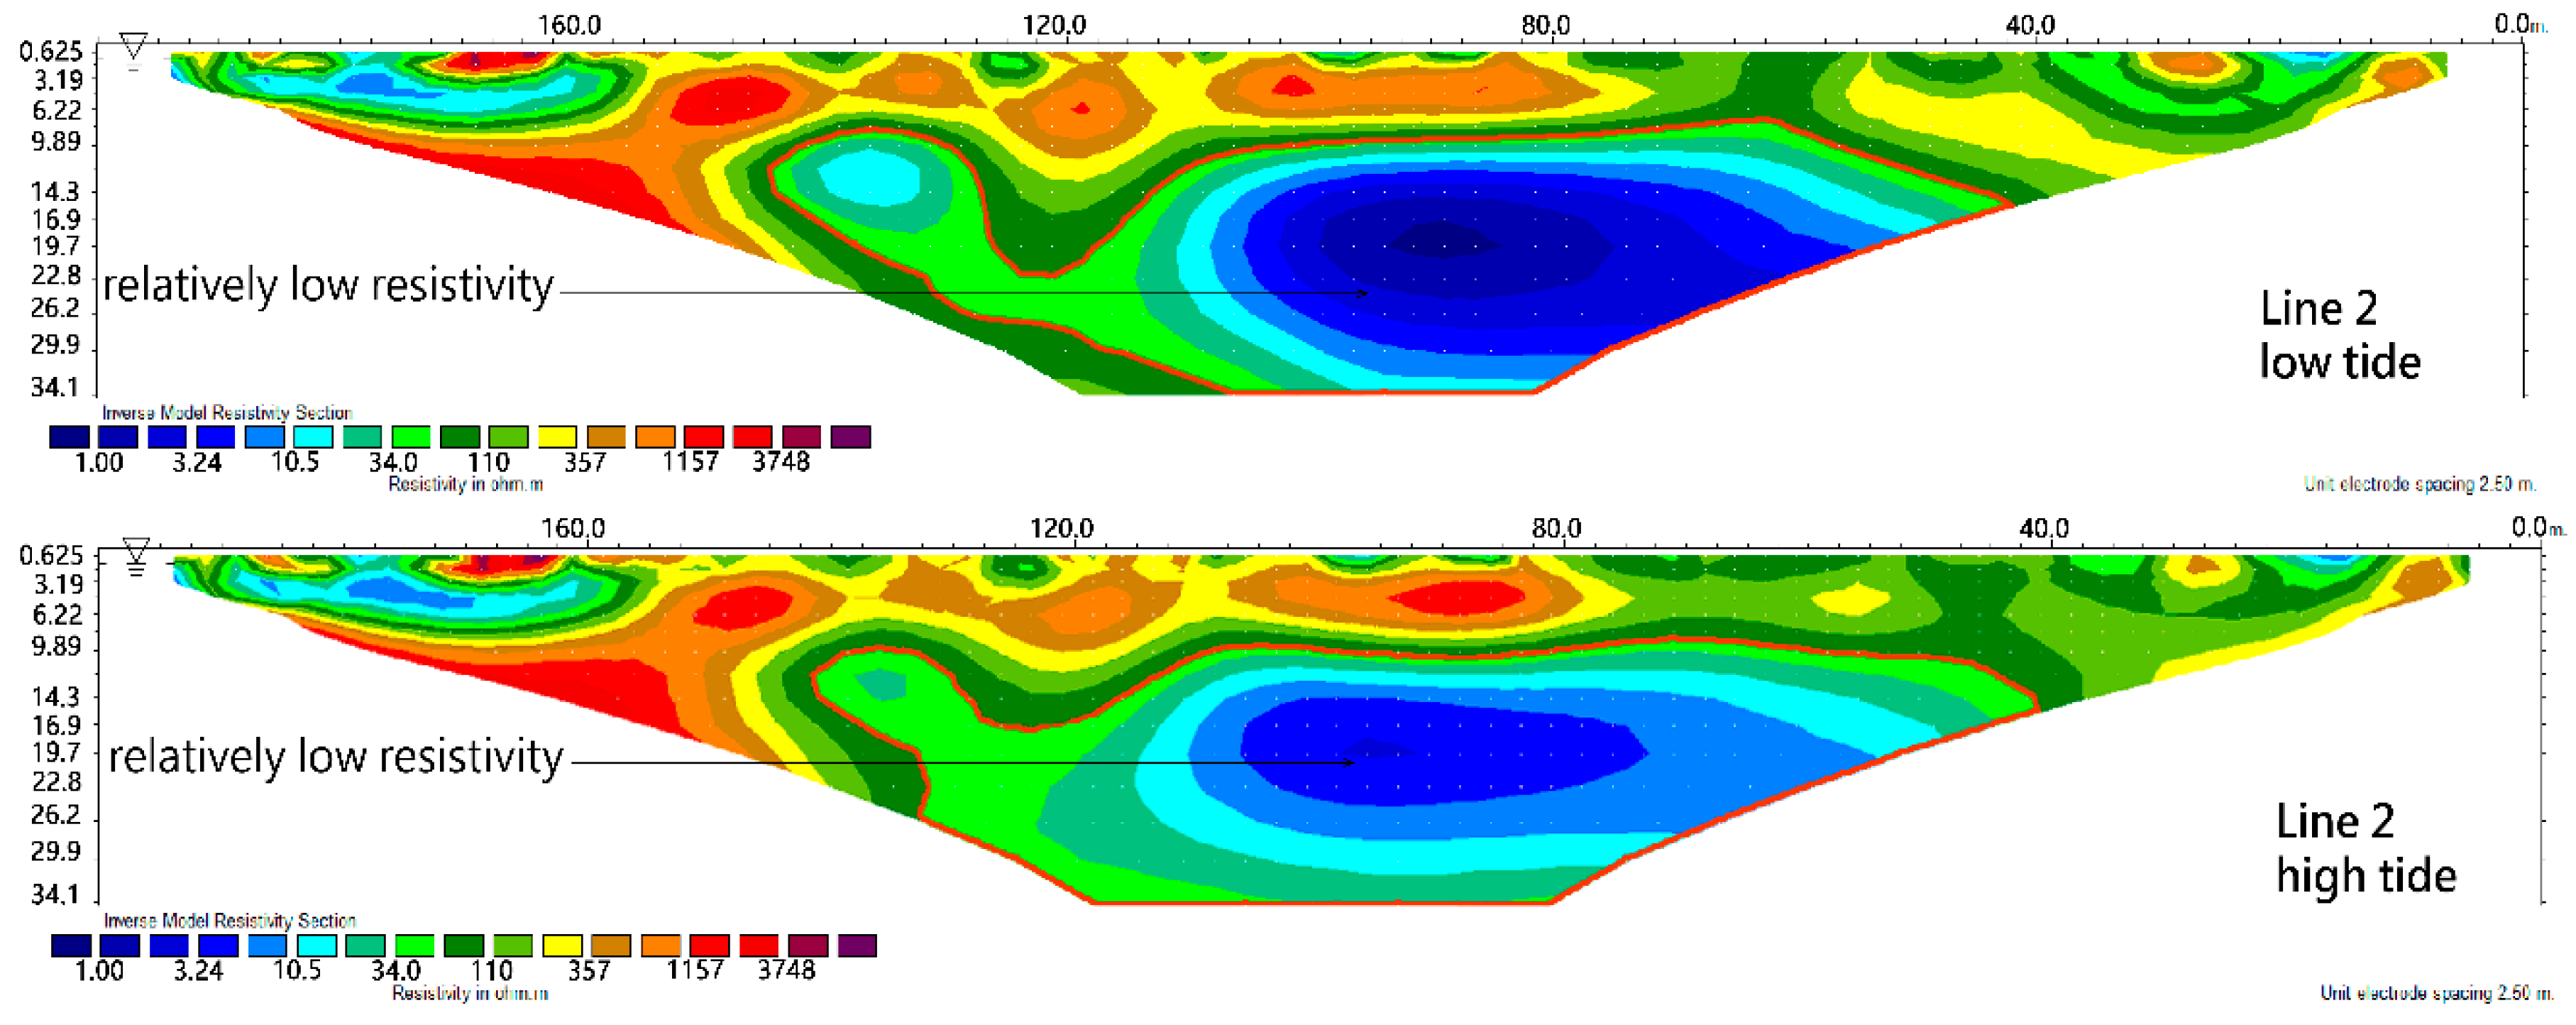
4.3.2. L2 Measuring Line of Tide Rise and Tide Ebb
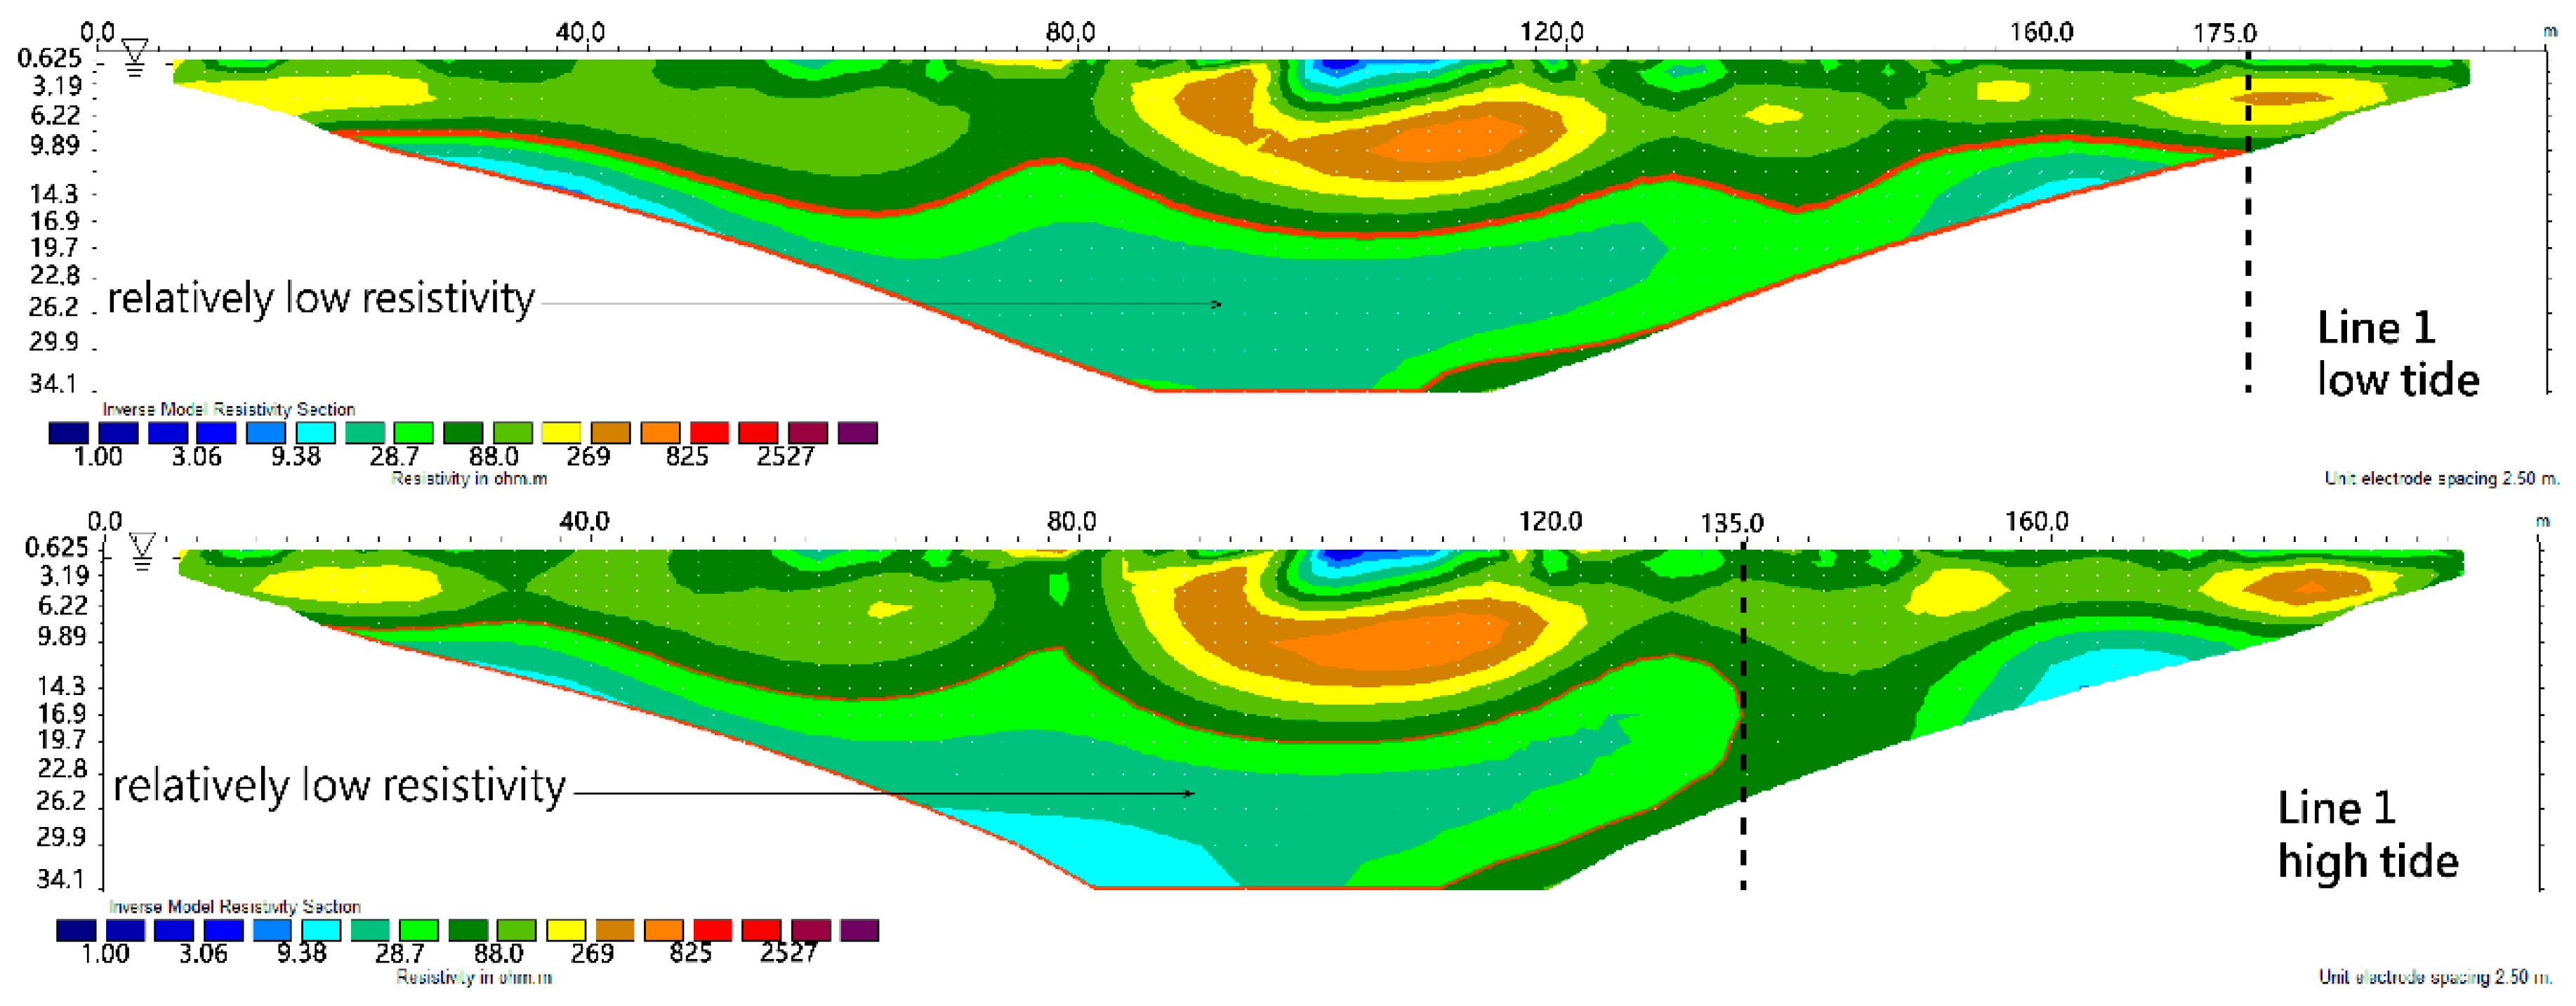
According to the combination of the preliminary detection results, meaning the two measuring lines above and the schematic of seawater intrusion, it is inferred that the low resistivity area at about 12 m below the L2 measuring line is the flow path of the seawater. The measuring results (Figure 10) show that the flow path of the seawater presents a low resistivity area different from the surrounding area at the low tide level and the high tide level, and the low resistivity area changes little. The results show that the flow path of the seawater on the coastal side is in a state of seawater intrusion whether at a high tide level or a low tide level, and the underground water on the coastal side may be contaminated by seawater for the long term.
4.3.3. L1 Measuring Line of Spring Tide and Neap Tide
In order to eliminate the impact of low tide and high tide levels on the measurement results, when the impact of spring tide and neap tide on seawater intrusion is observed, all measurements are carried out during the high tide of one day; the spring tide generally appears 1 to 3 days after the new moon and full moon, while neap tide appears 1 to 3 days after the first quarter and the last quarter of the moon. The measuring results show (Figure 7) that the position of the front edge of seawater is about 100 m from the measuring line during spring tide, while the deepest position of the front edge of the seawater is about 170 m during neap tide; this result may be caused due to the tidal range and delay effect, meaning the tidal range is large during spring tide, the change of seawater level is large, and the seawater has no sufficient time to intrude inland, while seawater levels change little during neap tide, it has sufficient time to seep into the soil.
4.3.4. L2 Measuring Line of Spring Tide and Neap Tide
Measurement results show (Figure 8) that, while the flow path of seawater presents low resistivity areas different from the surrounding areas during spring tide and neap tide, the caliber of the flow path of seawater is relatively large and obvious during neap tide and it is relatively small and not obvious during spring tide. Such results may be affected by the degree of seawater intrusion, as seawater intrusion reaches inland completely during neap tide; thus, the caliber of the flow path of seawater is relatively large; the seawater intrudes inland shallowly during spring tide, thus, the caliber of the flow path of seawater is relatively small.
4.3.5. Comprehensive Interpretation
Tidal action is one of the main factors affecting seawater intrusion, and the actual situations can be explored to achieve prevention effect only when the rule of tidal action affecting seawater intrusion is understood during ground resistivity image exploration.
The results indicate that the possible deepest position of the front edge of seawater intrusion can be detected at low tide on neap tide day, in order to control the pumping scope of groundwater and prevent the full-scale invasion of seawater due to overpumping; when the flow path of seawater is observed, it can be observed clearly at high tide on neap tide day.
5. Conclusions and Suggestions
5.1. Conclusions
This study obtained good initial results for groundwater salinization investigation through ERT, and comprehensive interpretation speculates that it can effectively obtain the location of the front edge and flow path of seawater, the diagram of seawater intrusion can be preliminarily simulated, and the location of the joining of freshwater and seawater can be shown through continuous monitoring in the future in cooperation with the relevant numerical simulation and tidal data of groundwater, in order to further observe the changing situation of the joining of freshwater and seawater, which can serve as a warning as to when the situation of seawater pushing inland continuously occurs.
This study used the time-lapse analysis method to observe the ground resistivity images of seawater intrusion over a period of time, and it is found that the change has certain regularity, according to the tide cycle; moreover, it was proved after evaluation that the tidal action was a major external force affecting seawater intrusion; further analysis of the tide phenomenon also found that the position of the front edge of the seawater is the deepest at the low tide position, the position of the front edge of the seawater is the deepest during neap tide, and the caliber of the flow path of the seawater is the largest during spring tide; thus, the ideal time point can be selected for the exploration of ground resistivity images according to the characteristics of when long-term measurements are carried out in the future.
5.2. Suggestions
Although the test site in this study obtained good results, it is suggested that subsequent study continues to further clarify uncertain factors on the basis of the results to ensure the authenticity of seawater intrusion investigation results with ERT. Therefore, further research directions are suggested as follows:
1. Supplement of Geological Boreholes and Setting of Observation Wells
If the results obtained with ERT lack auxiliary geological data, it will lack evidence information for interpretation of the results; therefore, it is suggested that geological drills of 40 m depth are carried out and sampled 80 m and 160 m away from the L1 measuring line of this planned site. In order to increase our understanding of geological situations, full screening of water level observation wells should be set up; groundwater salinization trends can be effectively obtained by measuring the conductivity of observation wells and water quality sampling in order to give feedback and compare the results obtained from ERT, thus providing a reference for the further establishment of a model. In addition, it can facilitate placing electrodes in the holes for future ground resistivity detection, which can improve the resolution for the exploration of ground resistivity in depth.
2. Carry out Monthly Measurement with Ground Resistivity Time-Lapse Method
The resistivity of saturated soil is affected by terrestrial factors and the resistivity of pore water; thus, the replacement of fresh water with seawater is a factor for the success of seawater intrusion investigation with the use of Time-lapse Resistivity Detection. As single investigation results cannot eliminate the impact of terrestrial factors, the technology of the time-lapse analysis method should be further applied in order to eliminate it. By referring to the long-term and monthly measurement results of resistivity, the relationships between resistivity and rainfall or tide in abnormal and normal areas are further analyzed, respectively, in order to infer the position of seawater intrusion, as well as the possible mechanism and position, and discuss the dynamically changing situation of seawater intruding into underground water with the change of time.
3. Increase Other Geophysical Detection Methods
Increase other geophysical detection methods, in order to provide accurate of comprehensive interpretation and reliability analysis; thus, it is suggested that further research can use other geophysical methods, such as the natural potential method and transient electromagnetics, which can help this study to conduct comprehensive interpretation according to the two-dimensional ground resistivity profile results and data results, as measured with the natural potential method, to improve the accuracy of interpretation.
4. Analysis Method for Increase of Reliability
In order to investigate the reliability of two-dimensional ground resistivity profile results, it is suggested to establish a positive calculation model of seawater intrusion through correct drilling data to verify the correctness of the measured data.
Author Contributions
All authors contributed to the paper. Y.-C.H. and T.-T.C. conceived, designed, and performed the research; M.-W.H. and Y.-H.Y. assisted with the onsite testing, computer simulations, and writing the paper; K.-W.W. contributed conclusions and suggestions.
Funding
The authors would like to thank the Ministry of Science and Technology of the Republic of China, Taiwan, for financially supporting this research under Contract No. MOST 104-2218-E-507-001.
Conflicts of Interest
The authors declare no conflict of interest.
References
- Dahlin, T. The development of DC resistivity imaging techniques. Comput. Geosci. 2001, 27, 1019–1029. [Google Scholar] [CrossRef]
- Lipfert, G.; Sandberg, S.; Slater, L.; Reeve, A.; Loiselle, M. The Temporal Variation of a Saltwater Contaminant Plume as Evidenced through Long-Term Resistivity Monitoring. In Symposium on the Application of Geophysics to Engineering and Environmental Problems; Environment and Engineering Geophysical Society: Denver, CO, USA, 1999; pp. 497–506. [Google Scholar]
- Allen, D.; Abbey, D.; Mackie, D.; Luzitano, R.; Cleary, M. Investigation of Potential Saltwater Intrusion Pathways in a Fractured Aquifer using an Integrated Geophysical, Geological and Geochemical Approach. J. Environ. Eng. Geophys. 2002, 7, 19–36. [Google Scholar] [CrossRef]
- Hodlur, G.; Dhakate, R.; Andrade, R. Correlation of vertical electrical sounding and borehole-log data for delineation of saltwater and freshwater aquifers. Geophysics 2006, 71, G11–G20. [Google Scholar] [CrossRef]
- De Franco, R.; Biella, G.; Tosi, L.; Teatini, P.; Lozej, A.; Chiozzotto, B.; Giada, M.; Rizzetto, F.; Claude, C.; Mayer, A.; et al. Monitoring the saltwater intrusion by time lapse electrical resistivity tomography: The Chioggia test site (Venice Lagoon, Italy). J. Appl. Geophys. 2009, 69, 117–130. [Google Scholar] [CrossRef]
- Kura, N.U.; Ramli, M.F.; Ibrahim, S.; Sulaiman, W.N.A.; Zaudi, M.A.; Aris, A.Z. A Preliminary Appraisal of the Effect of Pumping on Seawater Intrusion and Upconing in a Small Tropical Island Using 2D Resistivity Technique. Sci. World J. 2014, 2014, 796425. [Google Scholar] [CrossRef] [PubMed]
- Oueuemi, K.D.; Aizebeokhai, A.P.; Oladunjoye, M.A. Integrated Geophysical and Geochemical Investigations of Saline Water Intrusion in a Coastal Alluvial Terrain, Southwestern Nigeria. Int. J. Appl. Environ. Sci. 2015, 10, 1275–1288. [Google Scholar]
- Pidlisecky, A.; Moran, T.; Hansen, B.; Knight, R. Electrical resistivity imaging of seawater intrusion into the monterey bay aquifer system. Groundwater 2015, 54, 255–261. [Google Scholar] [CrossRef] [PubMed]
- Hashim, M.M.M.; Samuding, K.; Zawawi, M.H.; Daung, J.A.D.; Zulkurnain, M.H.; Mohamad, K. Application of Geophysical Method for Determining Seawater Intrusion in Coastal Aquifer. INIS 2017, 48, 24. [Google Scholar]
- Goebel, M.; Pidlisecky, A. Rosemary Knight, Resistivity imaging reveals complex pattern of saltwater intrusion along Monterey coast. J. Hydrol. 2017, 551, 746–755. [Google Scholar] [CrossRef]
- Lin, C.-P.; Hung, Y.-C.; Yu, Z.-H.; Wu, P.-L. Investigation of Abnormal Seepages in an Earth Dam Using Resistivity Tomography. J. GeoEng. 2013, 8, 61–70. [Google Scholar]
- Carter, A.R.J. Investigation into the Use of Resistivity Profiling in the Detection of the Fresh/Saline Water Interface within Coastal Settings. Bachelor’s Thesis, University of Lancaster, Lancaster, UK, 2002; p. 71. [Google Scholar]
- Singha, K.; Gorelick, S.M. Saline tracer visualized with three dimensional electrical resistivity tomography: Field-scale spatial moment analysis. Water Resour. Res. 2005, 41. [Google Scholar] [CrossRef]
- Swarzenski, P.W.; Burnett, W.C.; Greenwood, W.J.; Herut, B.; Peterson, R.; Dimova, N.; Shalem, Y.; Yechieli, Y.; Weinstein, Y. Combined time-series resistivity and geochemical tracer techniques to examine submarine groundwater discharge at Dor Beach, Israel. Geophys. Res. Lett. 2006, 33. [Google Scholar] [CrossRef] [Green Version]
- Kazakis, N.; Pavlou, A.; Vargemezis, G.; Voudouris, K.S.; Soulios, G.; Pliakas, F.; Tsokas, G. Seawater intrusion mapping using electrical resistivity tomography and hydrochemical data. An application in the coastal area of eastern Thermaikos Gulf, Greece. Sci. Total Environ. 2016, 543, 373–387. [Google Scholar] [CrossRef] [PubMed]
- Sutter, E.; Ingham, M. Seasonal saline intrusion monitoring of a shallow coastal aquifer using time-lapse DC resistivity traversing. Near Surf. Geophys. 2017, 15, 59–73. [Google Scholar]
- García-Menéndez, O.; Ballesteros, B.J.; Renau-Pruñonosa, A.; Morell, I.; Mochales, T.; Ibarra, P.I.; Rubio, F.M. Using electrical resistivity tomography to assess the effectiveness of managed aquifer recharge in a salinized coastal aquifer. Environ. Monit. Assess. 2018, 190, 100. [Google Scholar] [CrossRef] [PubMed]
- Santos, I.R.; Eyre, B.D.; Huettel, M. The driving forces of porewater and groundwater flow in permeable coastal sediments: A review. Estuar. Coast. Shelf Sci. 2012, 98, 1–15. [Google Scholar] [CrossRef]
- Su, Q.; Xu, X.; Chen, G.; Fu, T.; Liu, W. Study on the Impact of Tides on Groundwater Table Fluctuation in Coastal Aquifer. Adv. Mar. Sci. 2017, 35, 568–578. [Google Scholar]
- Inouchi, K.; Kishi, Y.; Kakinuma, T. The motion of coastal groundwater in response to the tide. J. Hydrol. 1990, 115, 165–191. [Google Scholar] [CrossRef]
- Nielsen, P. Tide dynamics of the water table in beaches. Water Resour. Res. 1990, 26, 2127–2134. [Google Scholar]
- Li, L.; Barry, D.A.; Pattiaratchi, C.B. Numerical modeling of tide-induced beach water table fluctuations. Coast. Eng. 1997, 30, 105–123. [Google Scholar] [CrossRef]
- Nielsen, P. Groundwater Dynamics and Salinity in Coastal Barriers. J. Coast. Res. 1999, 15, 732–740. [Google Scholar]
- Koefoed, O. Geosounding Principles; Elsevier Scientific Publishing Company: Amsterdam, The Netherlands, 1979. [Google Scholar]
Figure 1.
Diagram of seawater intrusion caused by the overpumping of groundwater.

Figure 2.
Schematic diagram for detection with the DC Resistivity method.

Figure 3.
Location diagram of Shangyi Village and laying of lateral lines.

Figure 4.
L1 measuring result diagram of the measuring line of the Wenner-Schlumberger Array.

Figure 5.
L2 measuring result diagram of the measuring line of the Wenner-Schlumberger Array.

Figure 6.
2.5D seawater intrusion diagram.

Figure 7.
Ground resistivity profile of measuring line L1 from 9 August 2017 to 25 August 2017.


Figure 8.
Ground Resistivity Profile of Measuring Line L2 from 9 August 2017 to 25 August 2017.


Figure 9.
Comparison diagram of tide rising of L1 measuring line (dotted line is front edge of seawater intrusion).
Figure 9.
Comparison diagram of tide rising of L1 measuring line (dotted line is front edge of seawater intrusion).

Figure 10.
Comparison diagram of tide rising of L2 Measuring Line.


Table 1.
Tide table of the test site.
| AUG | ||||||||||||||
|---|---|---|---|---|---|---|---|---|---|---|---|---|---|---|
| Tide Time | Tide Height | Tide Time | Tide Height | Tide Time | Tide Height | |||||||||
| 9 | 1:04 | 222 | 507 | H | 15 | 4:52 | 205 | 490 | H | 21 | 5:18 | −171 | 115 | L |
| 7:00 | −190 | 96 | L | 11:10 | −209 | 76 | L | 11:19 | 224 | 509 | H | |||
| 12:53 | 216 | 501 | H | 17:29 | 174 | 459 | H | 17:41 | −274 | 11 | L | |||
| 19:15 | −257 | 28 | L | 23:32 | −159 | 126 | L | |||||||
| 10 | 1:37 | 227 | 512 | H | 16 | 5:47 | 193 | 478 | H | 22 | 0:12 | 248 | 533 | H |
| 7:35 | −195 | 90 | L | 12:11 | −212 | 73 | L | 6:06 | −188 | 97 | L | |||
| 13:30 | 220 | 505 | H | 18:40 | 163 | 448 | H | 12:08 | 242 | 527 | H | |||
| 19:48 | −252 | 33 | L | 18:28 | −277 | 8 | L | |||||||
| 11 | 2:10 | 228 | 513 | H | 17 | 0:44 | −136 | 149 | L | 23 | 0:53 | 257 | 542 | H |
| 8:10 | −198 | 87 | L | 6:51 | 182 | 467 | H | 6:49 | −202 | 84 | L | |||
| 14:08 | 218 | 503 | H | 13:19 | −218 | 67 | L | 12:52 | 252 | 537 | H | |||
| 20:23 | −243 | 43 | L | 20:01 | 162 | 447 | H | 19:11 | −271 | 14 | L | |||
| 12 | 2:44 | 227 | 512 | H | 18 | 2:03 | −126 | 159 | L | 24 | 1:31 | 259 | 544 | H |
| 8:48 | −201 | 84 | L | 8:02 | 178 | 463 | H | 7:29 | −210 | 75 | L | |||
| 14:49 | 212 | 497 | H | 14:34 | −230 | 55 | L | 13:33 | 254 | 539 | H | |||
| 21:01 | −229 | 56 | L | 21:23 | 178 | 463 | H | 19:50 | −258 | 27 | L | |||
| 13 | 3:22 | 222 | 507 | H | 19 | 3:18 | −133 | 152 | L | 25 | 2:06 | 255 | 540 | H |
| 9:30 | −203 | 82 | L | 9:15 | 185 | 470 | H | 8:08 | −214 | 72 | L | |||
| 15:35 | 202 | 487 | H | 15:45 | −248 | 38 | L | 14:13 | 247 | 532 | H | |||
| 21:43 | −210 | 75 | L | 22:31 | 204 | 489 | H | 20:26 | −239 | 46 | L | |||
| 14 | 4:04 | 215 | 500 | H | 20 | 4:22 | −150 | 135 | L | |||||
| 10:17 | −206 | 79 | L | 10:22 | 203 | 488 | H | |||||||
| 16:27 | 188 | 473 | H | 16:47 | −264 | 21 | L | |||||||
| 22:33 | −186 | 99 | L | 23:26 | 229 | 514 | H | |||||||
Table 2.
List of drilling data for Shangyi Airport in Kinmen.
| Depth (m) | Thickness (m) | Rock or Soil Properties Description |
|---|---|---|
| 0–0.5 | 0.5 | Concrete and Granite Blocks |
| 0.5–4.5 | 4 | Brown crude sand, Granite Blocks, clay |
| 4.5–20 | 15.5 | Brown crude sand, Granite Blocks, clay |
Source: “Foundation Survey Report on Drilling Operation Entrusted for Landing Field of Kinmen Shangyi Airport” and Reorganization of this Research Plan.
Table 3.
Water quality sampling test.
| Sample | Sample 1 (On the L1 Line at 100 m) | Sample 2 (On the L1 Line at 125 m) | Freshwater |
|---|---|---|---|
| Electrical conductivity(μS/cm) | 1455 | 898 | <1200 |
| Chlorine salt value (ppm) | 440 | 268 | <250 |
| Total dissolved solids (ppm) | 724 | 440 | <500 |
© 2018 by the authors. Licensee MDPI, Basel, Switzerland. This article is an open access article distributed under the terms and conditions of the Creative Commons Attribution (CC BY) license (http://creativecommons.org/licenses/by/4.0/).
Share and Cite
MDPI and ACS Style
Chen, T.-T.; Hung, Y.-C.; Hsueh, M.-W.; Yeh, Y.-H.; Weng, K.-W. Evaluating the Application of Electrical Resistivity Tomography for Investigating Seawater Intrusion. Electronics 2018, 7, 107. https://doi.org/10.3390/electronics7070107
AMA Style
Chen T-T, Hung Y-C, Hsueh M-W, Yeh Y-H, Weng K-W. Evaluating the Application of Electrical Resistivity Tomography for Investigating Seawater Intrusion. Electronics. 2018; 7(7):107. https://doi.org/10.3390/electronics7070107
Chicago/Turabian StyleChen, Tung-Tsan, Yin-Chun Hung, Ming-Wei Hsueh, Yung-Hsin Yeh, and Ko-Wei Weng. 2018. "Evaluating the Application of Electrical Resistivity Tomography for Investigating Seawater Intrusion" Electronics 7, no. 7: 107. https://doi.org/10.3390/electronics7070107
Note that from the first issue of 2016, this journal uses article numbers instead of page numbers. See further details here.