Implementation of a Cost-Effective Didactic Prototype for the Acquisition of Biomedical Signals


1
Facultad de Ingeniería, Universidad del Magdalena, Carrera 32 No. 22-08, Santa Marta 470004, Colombia
2
Departamento de Ingeniería Eléctrica y Electrónica, Universidad del Norte, Km 5 Vía Puerto Colombia, Barranquilla 080015, Colombia
*
Author to whom correspondence should be addressed.
Electronics 2018, 7(5), 77; https://doi.org/10.3390/electronics7050077
Submission received: 19 April 2018
/
Revised: 15 May 2018
/
Accepted: 18 May 2018
/
Published: 22 May 2018
Abstract
:This paper presents the implementation of a cost-effective didactic prototype, which was designed as a tool for theoretical and practical learning in the biomedical instrumentation area for engineering students. The prototype provides integrated hardware and software components that allow online acquisition, processing, and visualization of electrocardiographic (ECG), electroencephalographic (EEG), electromyographic (EMG), and electrooculographic (EOG) signals, as well as measurements of bio-impedance from the skin. A control system using an Arduino Uno board and the PIC16F877A and PIC18F2550 microcontrollers was implemented. This control system allows selecting the type of module; the lead to be used in the ECG module; the input channel for the EEG, EMG, and EOG modules; and controlling the signal generator for the bioimpedance module. In addition, a graphical interface was developed in LabVIEW, in which all the acquired biomedical signals can be visualized in real time. It is highlighted as a novelty the modular implementation of the prototype, the incorporation of five modules in a single device and the graphical user-friendly interface. The final result is a low-cost device capable of processing and visualizing bioelectric signals through an interface in LabVIEW, which also allows the user to interact with each of the stages.
1. Introduction
Bioelectrical signals are generated in the human body due to the functioning of organs such as the heart, brain, muscles, and eyes. For each organ mentioned, there are registers of biopotentials called electrocardiogram, electroencephalogram, electromyogram, and electrooculogram, respectively. These signals are generated by the membrane potential, which consists of the potential difference that exists between the inner surface and the outer surface of the cells. Bioelectric signals are the most important biomedical signals, because most biological systems have excitable cells and can be studied by means of them [1,2,3].
The ECG signal is the graphical representation obtained by measuring the electrical activity of the heart from the surface of the body. Because it is a non-invasive technique, it is the most commonly used method to study the blood pumping cycle. This signal varies between 0.5 and 4 mV with a bandwidth between 0.01 and 250 Hz, and its measurement can be made using surface electrodes. The acquisition of the ECG signal depends on the leads, which vary according to the placement of the electrodes and their combinations. In electrocardiography, 12 leads are usually used for a better diagnosis: limb, augmented limb, and precordial [4,5,6,7].
The EEG signal is a graphical representation of brain activity. The electroencephalogram allows one to study the electrical activity of the cortex, by means of surface electrodes located in certain areas of the scalp. The representation of the EEG is done in a 2D graph with the axes of amplitude and time. The amplitude of the signal ranges between 5 and 300 μV with a bandwidth between 0.01 and 150 Hz [8,9,10].
The EMG signal is a register produced due to muscles activity. This signal is caused by the exchange of ions in the membrane of muscle cells due to a contraction and is a very useful signal for the diagnosis of pathologies in the muscular and nervous systems. The amplitude of the EMG signal ranges from 100 μV to 5 mV with a bandwidth between 0.01 Hz and 10 KHz. The amplitude of this signal depends on many factors, such as the time and intensity of muscle contraction, the distance between the electrode and the area of muscle activity, the properties of the skin, and the properties of the electrode [11,12,13,14].
The EOG signal allows for the registering of the position and movement of the eyeballs, using electrodes located either at each side of eye temples, for horizontal channel, or above and below the eye for a vertical channel. Due to the distance between the electrodes and the eye, the impedance of the skin, and other factors, the EOG signal oscillates between 250 and 1000 μV. The bandwidth is between 0 and 100 Hz; however, the saccades oscillate between 0 and 30 Hz [15,16,17].
The information in the frequency domain of all the signals mentioned is useful for diagnosis of diseases. For example, the ECG signal is especially useful for diagnosing cardiac, pulmonary, and cardiovascular diseases [18,19,20], while the EMG signal is for neurological and neuromuscular problems [21,22]. Additionally, all the mentioned signals are used in human-machine interfaces for the control of different types of devices [23,24,25,26].
Taking into account the previous context, the design and implementation of devices for the acquisition, processing, and visualization of biomedical signals take on great relevance in the academic and research fields. A literature review shows different investigations that address the implementation of this type of device. In [27], a LabVIEW-based system of acquisition, processing, and analysis of ECG signals was presented. In [28], an ECG system was developed to monitor the heart condition of a human. The authors in [29] implemented a wearable biomedical measurement system in order to monitor the level of stress in combatants. In [30], a low cost acquisition system for the ECG, EMG, and EOG signals was developed.
This paper presents the design and implementation of a low-cost prototype, battery powered device that allows the acquisition, processing, and visualization of the ECG, EEG, EMG, and EOG signals, and, additionally, it allows one to measure the bio-impedance of the skin. The prototype was designed as a support for theoretical and practical learning in the area of electrophysiology for undergraduate students of electronic engineering, allowing them to test the individual performance of each of the stages that make up the modules.
In this way, the main novelty of this work is the incorporation of the skin bioimpedance measurement module in the prototype for the acquisition of biomedical signals. It is highlighted as a contribution of the modular implementation of the prototype, which allows each of the stages to be evaluated independently by the users in order to corroborate the theoretical concepts. The graphical user-friendly interface developed in LabVIEW for the real-time visualization of all the signals is also highlighted. This interface works in conjunction with the control system to show in a didactic way the performance of each of the developed modules. In this way, users can verify the electrical characteristics of biomedical signals.
This work is organized as follows: Section 2 shows the general and detailed architecture of each of the modules that make up the prototype: ECG, EEG, EMG, EOG, and bioimpedance. Section 3 shows the experimental results obtained by each of the stages individually, as well as for each of the modules. Finally, in Section 4, the conclusions are presented.
2. Materials and Methods
In this section the prototype development for biomedical measurements is presented. The measurement system is composed of 5 modules: ECG, EEG, EOG, EMG, and bio-impedance. Each of these modules has a series of stages that comes isolated between them, and the user is one who must interconnect the stages according to the module that is being worked on. This allows the user to interact with the design stages (see Figure 1).
The connection between the stages is made by the control unit and a set of quad analog switches MC14066B. The control system allows communication with the PC, in which signals are visualized through a graphical user interface developed in LabVIEW.
For the recording of the ECG, EMG, EEG, and EOG signals, surface electrodes composed of a metallic conductor that makes contact with the skin were used, which used a gel as a chemical interface between the skin and the metal part of the electrode. The compound Ag/AgCl is the most used compound for the metallic part of the electrodes, since it allows better circulation of the current emitted by the human body through the junction between the gel and the electrode.
Before starting with the description of the stages of the measurement system, it is necessary to specify the type of source that was used to energize the circuits. In this case, 18,650 Li-ion batteries with a voltage of 3.7 V and a current of 2200 mA were used. With the use of batteries, the 60 Hz noise was minimized.
Next, a detailed description of each of the stages that make up the 5 modules of the prototype is presented. Initially, a general explanation of the modules is shown, and then the design procedure carried out for each of the stages is explained. This description aims to highlight the modular implementation of the device and the cost reduction achieved by implementing common stages for the 5 modules.
2.1. ECG Module
The general diagram of the circuit for the acquisition of the ECG signal is shown in Figure 2. The ECG circuit has the 12 conventional leads: limb, augmented limb, and precordial. This leads were acquired using 10 electrodes: RA (Right Arm), LL (Left Leg), LA (Left Arm), RL (Right Leg), and V1–V6. The RL electrode was used to obtain the reference signal using the driven right leg circuit. Table 1 shows the leads and the equation that was used to obtain them.
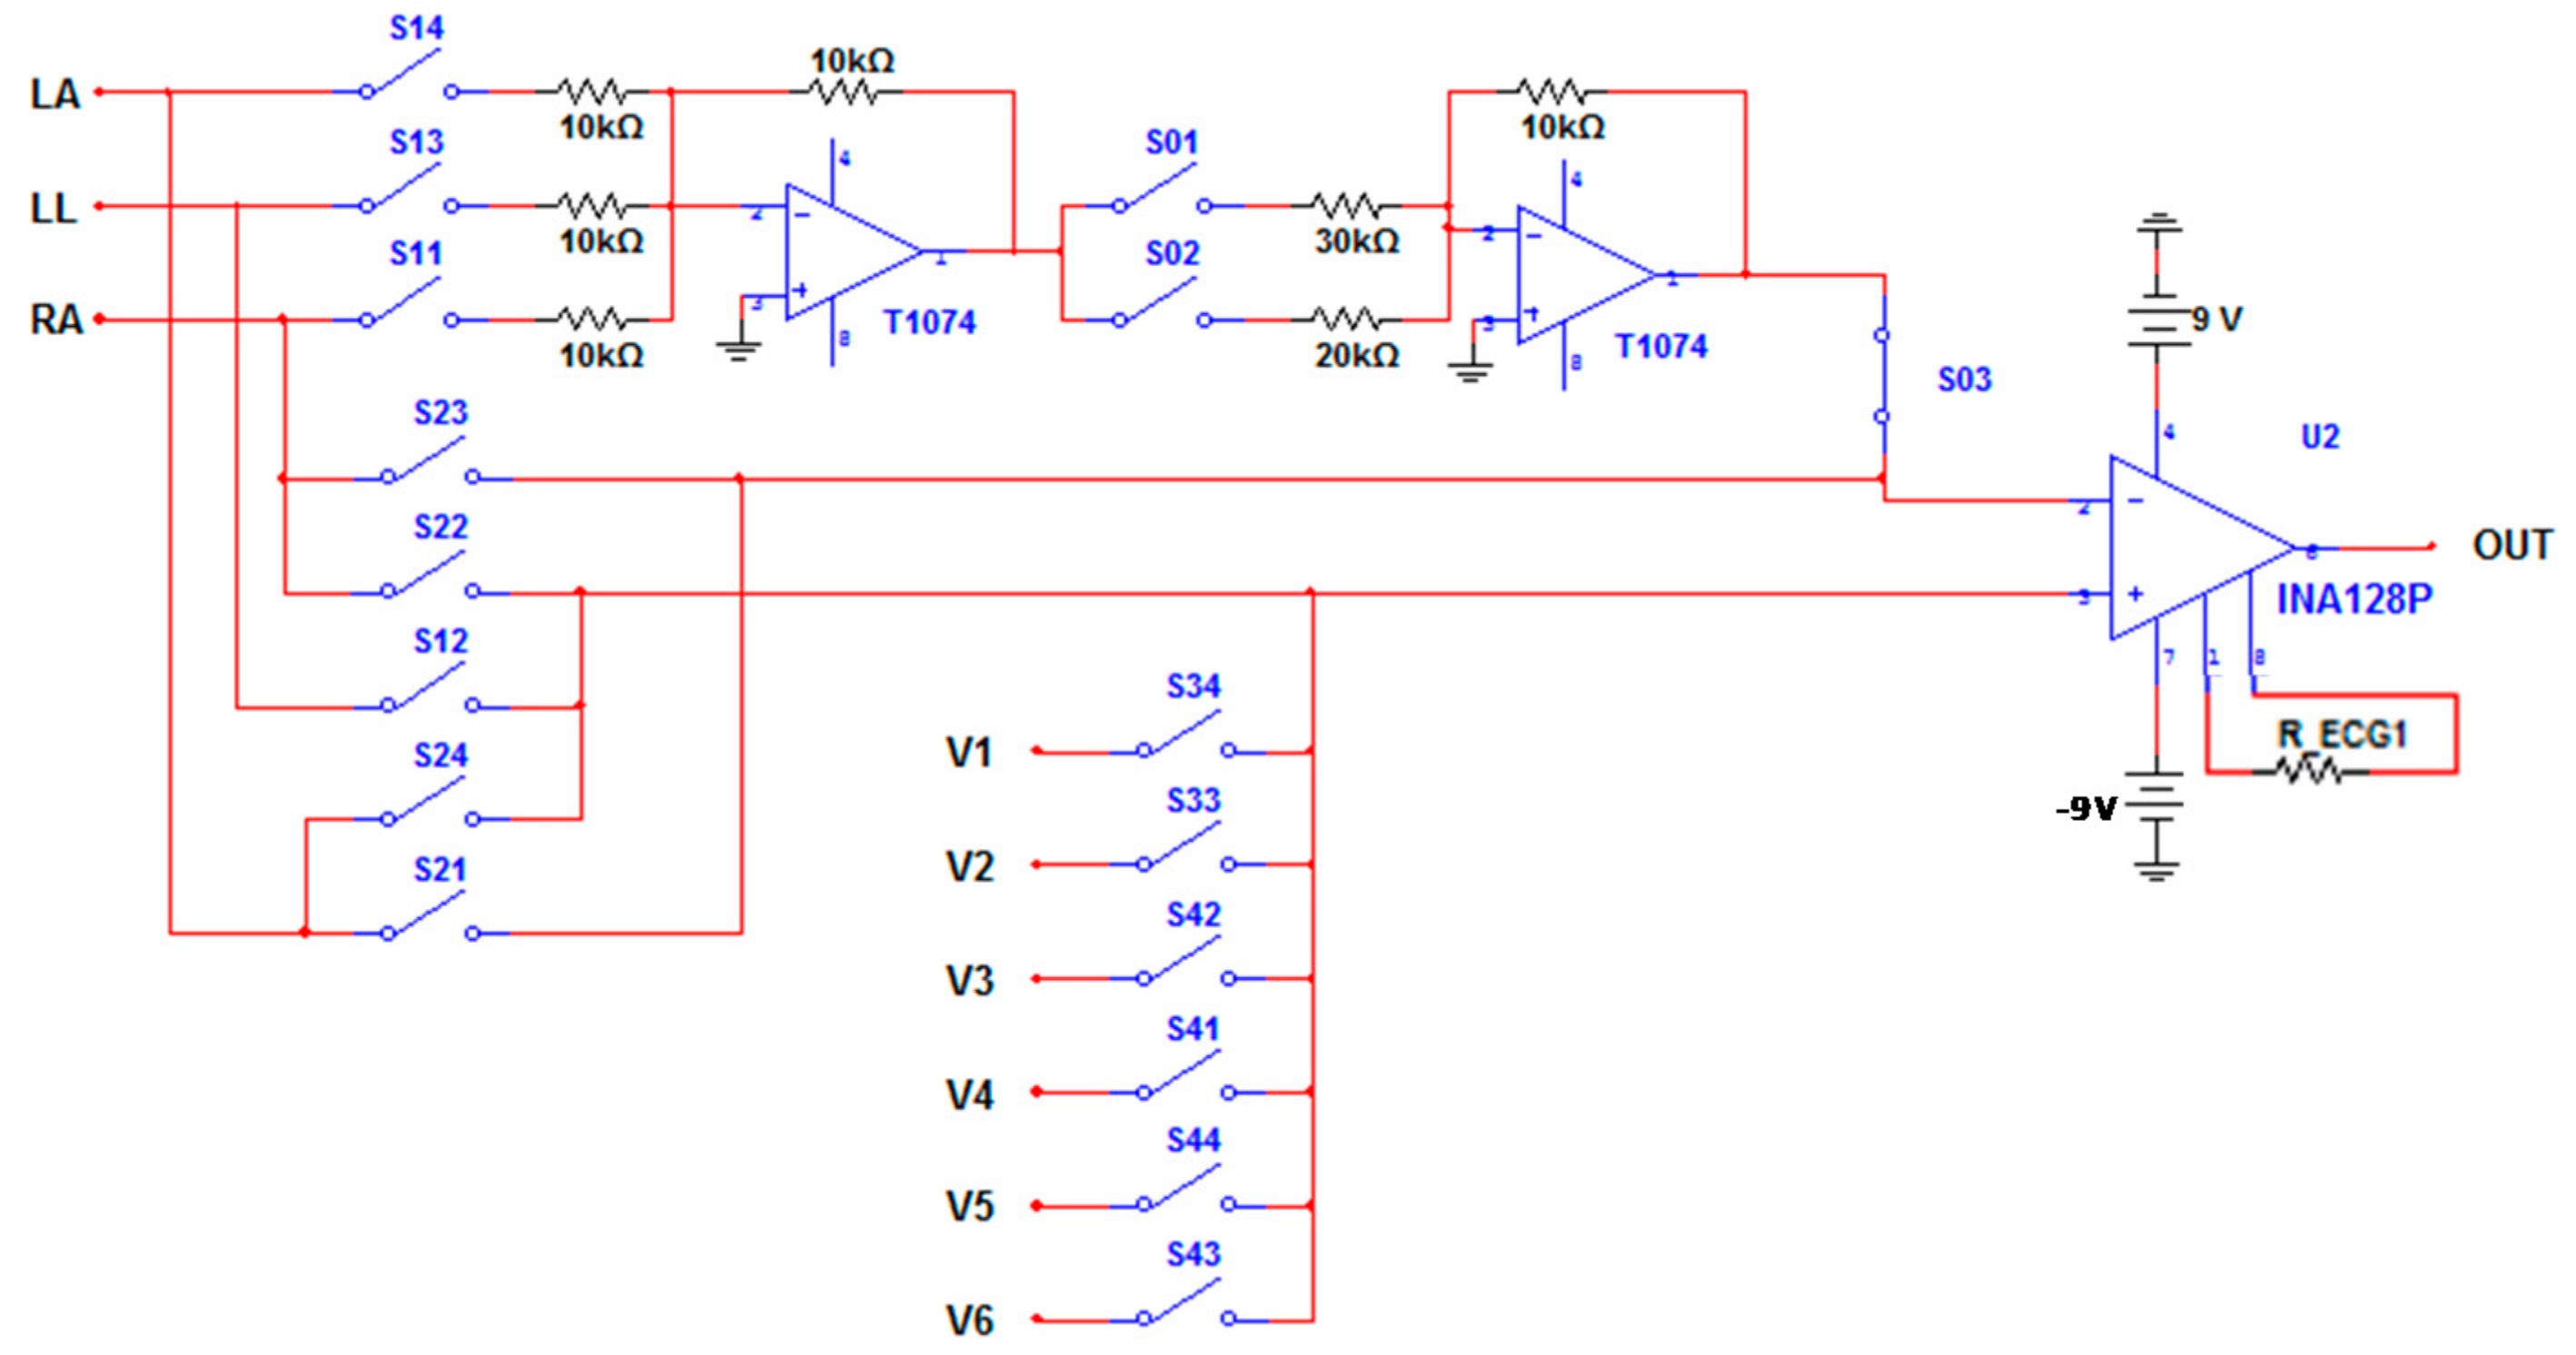
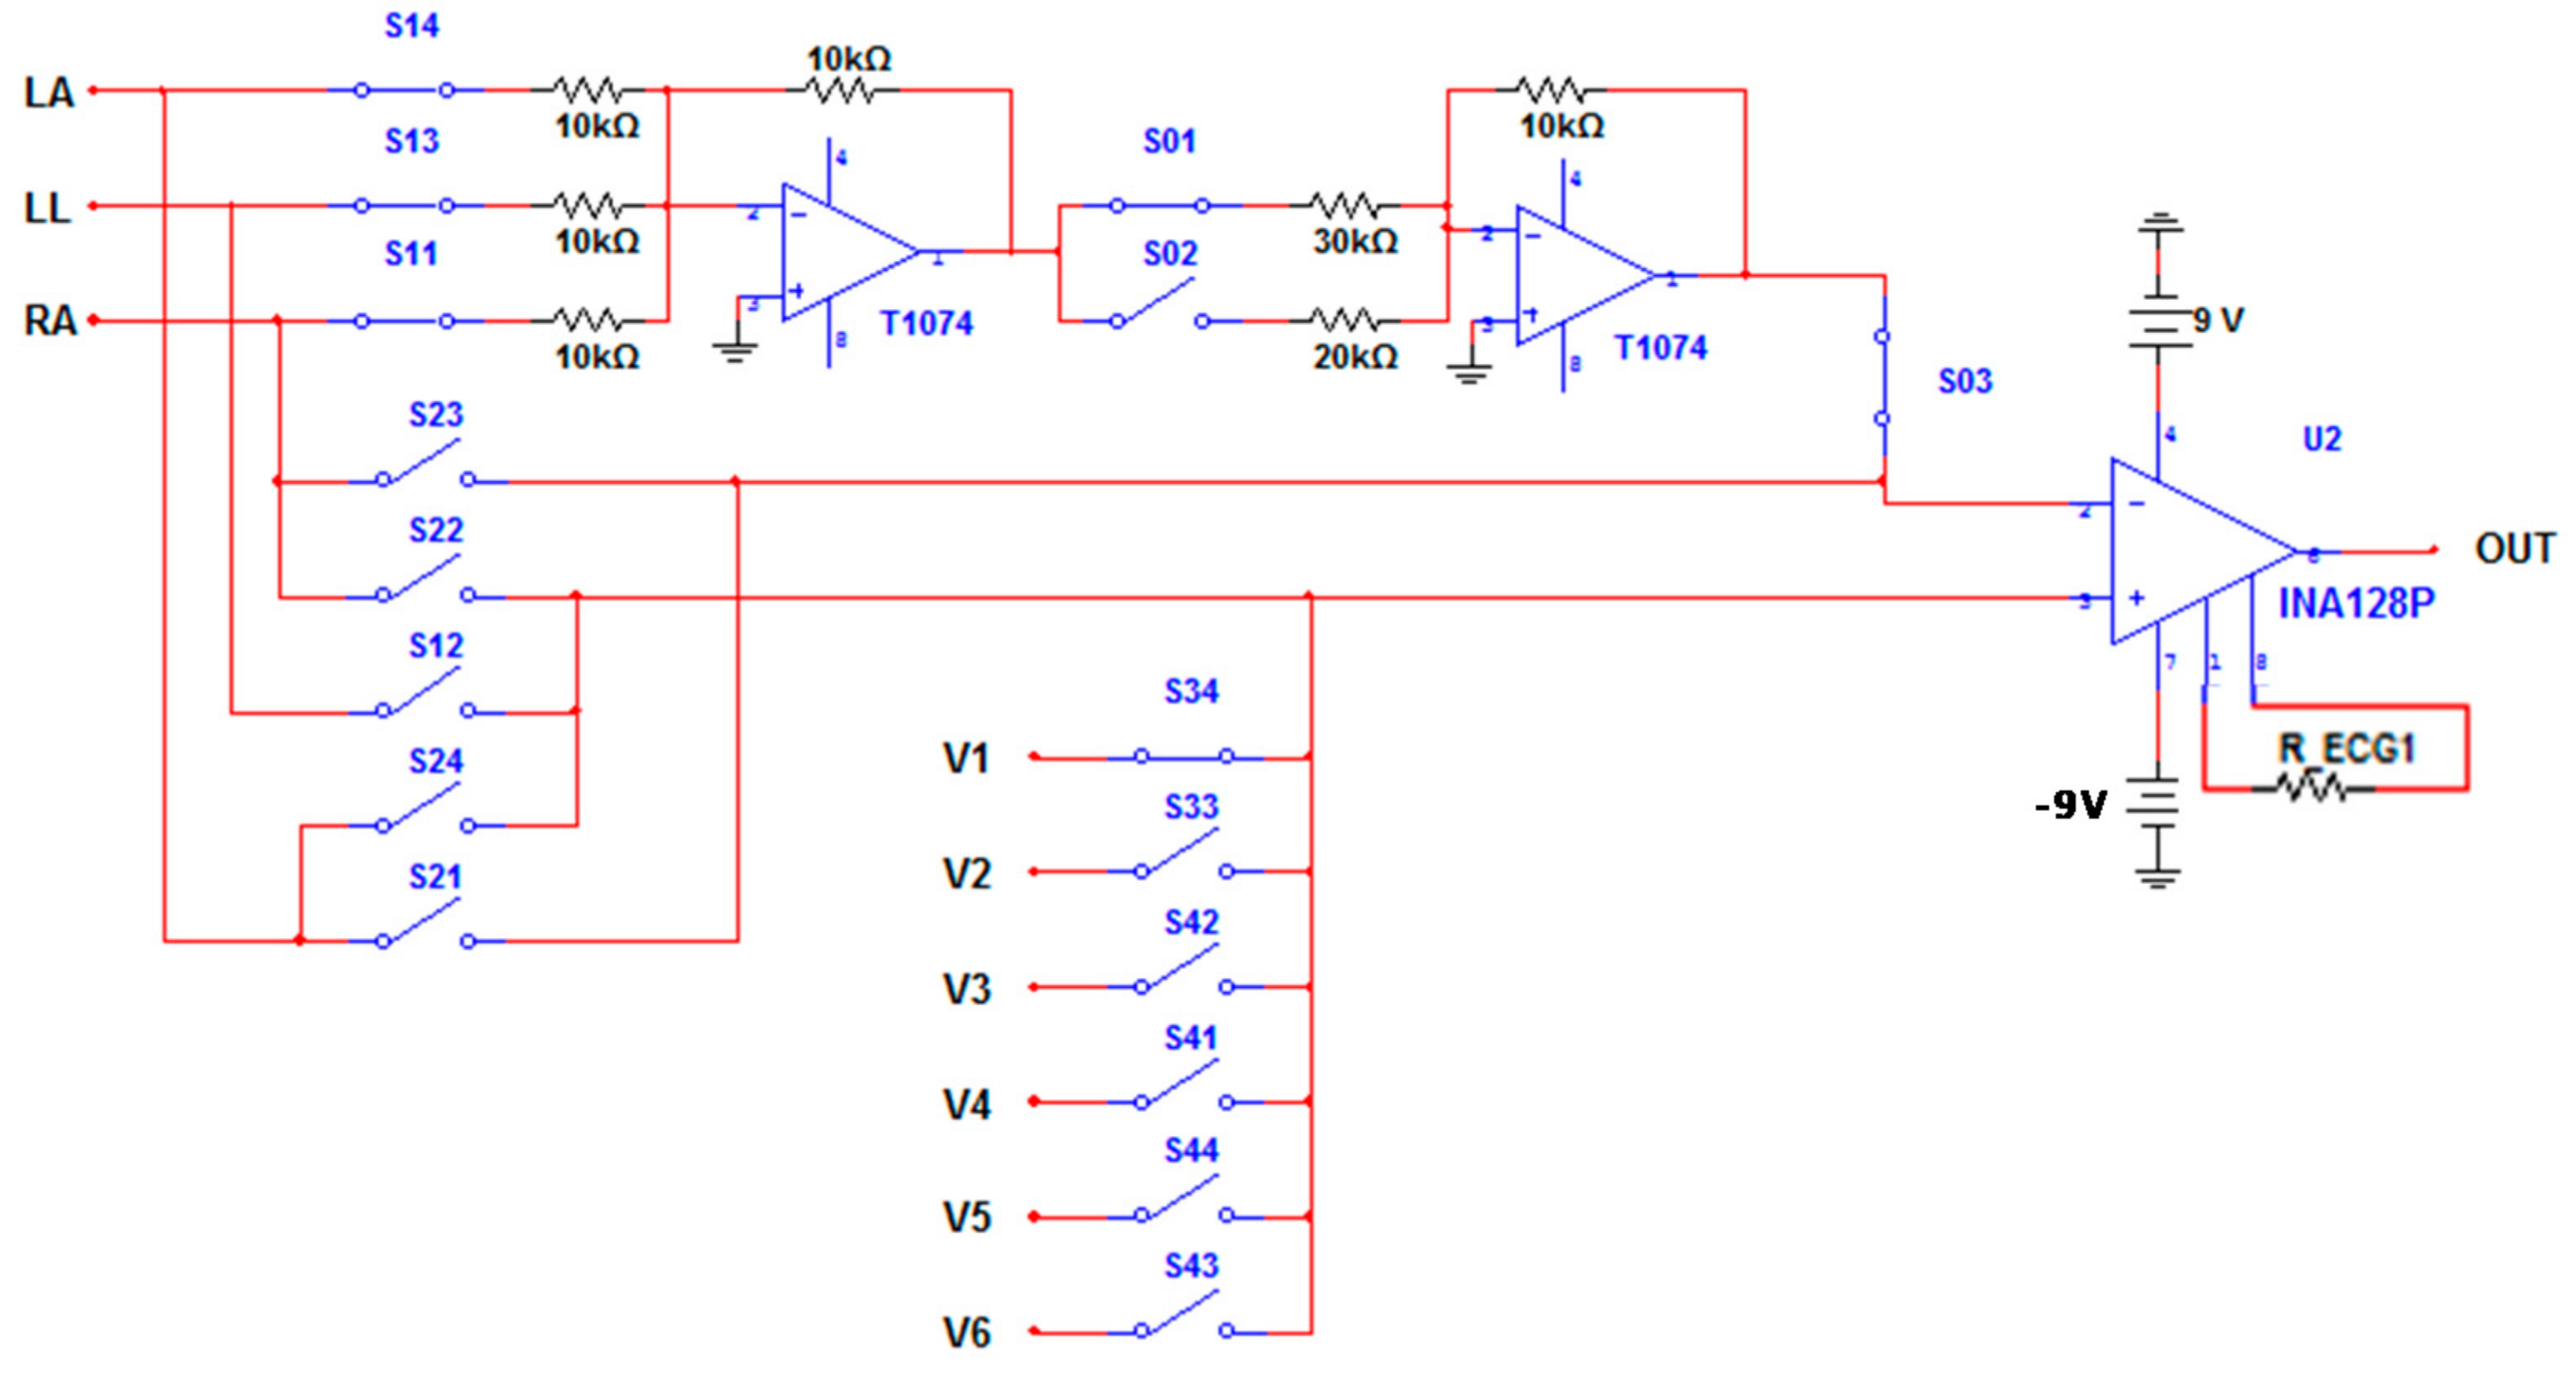
Figure 3 shows the circuit designed for the acquisition of limb, augmented limb, and precordial leads. The INA128P was used as a differential amplifier, while the TL074 operational amplifiers were used in the inverting summing amplifier configuration. The activation of the switches allows one to obtain each one of the leads according to the equations presented in Table 1.
The other stages that make up the diagram presented in Figure 2 will be detailed in later sections, since there are common stages with the EEG, EOG, and EMG modules.
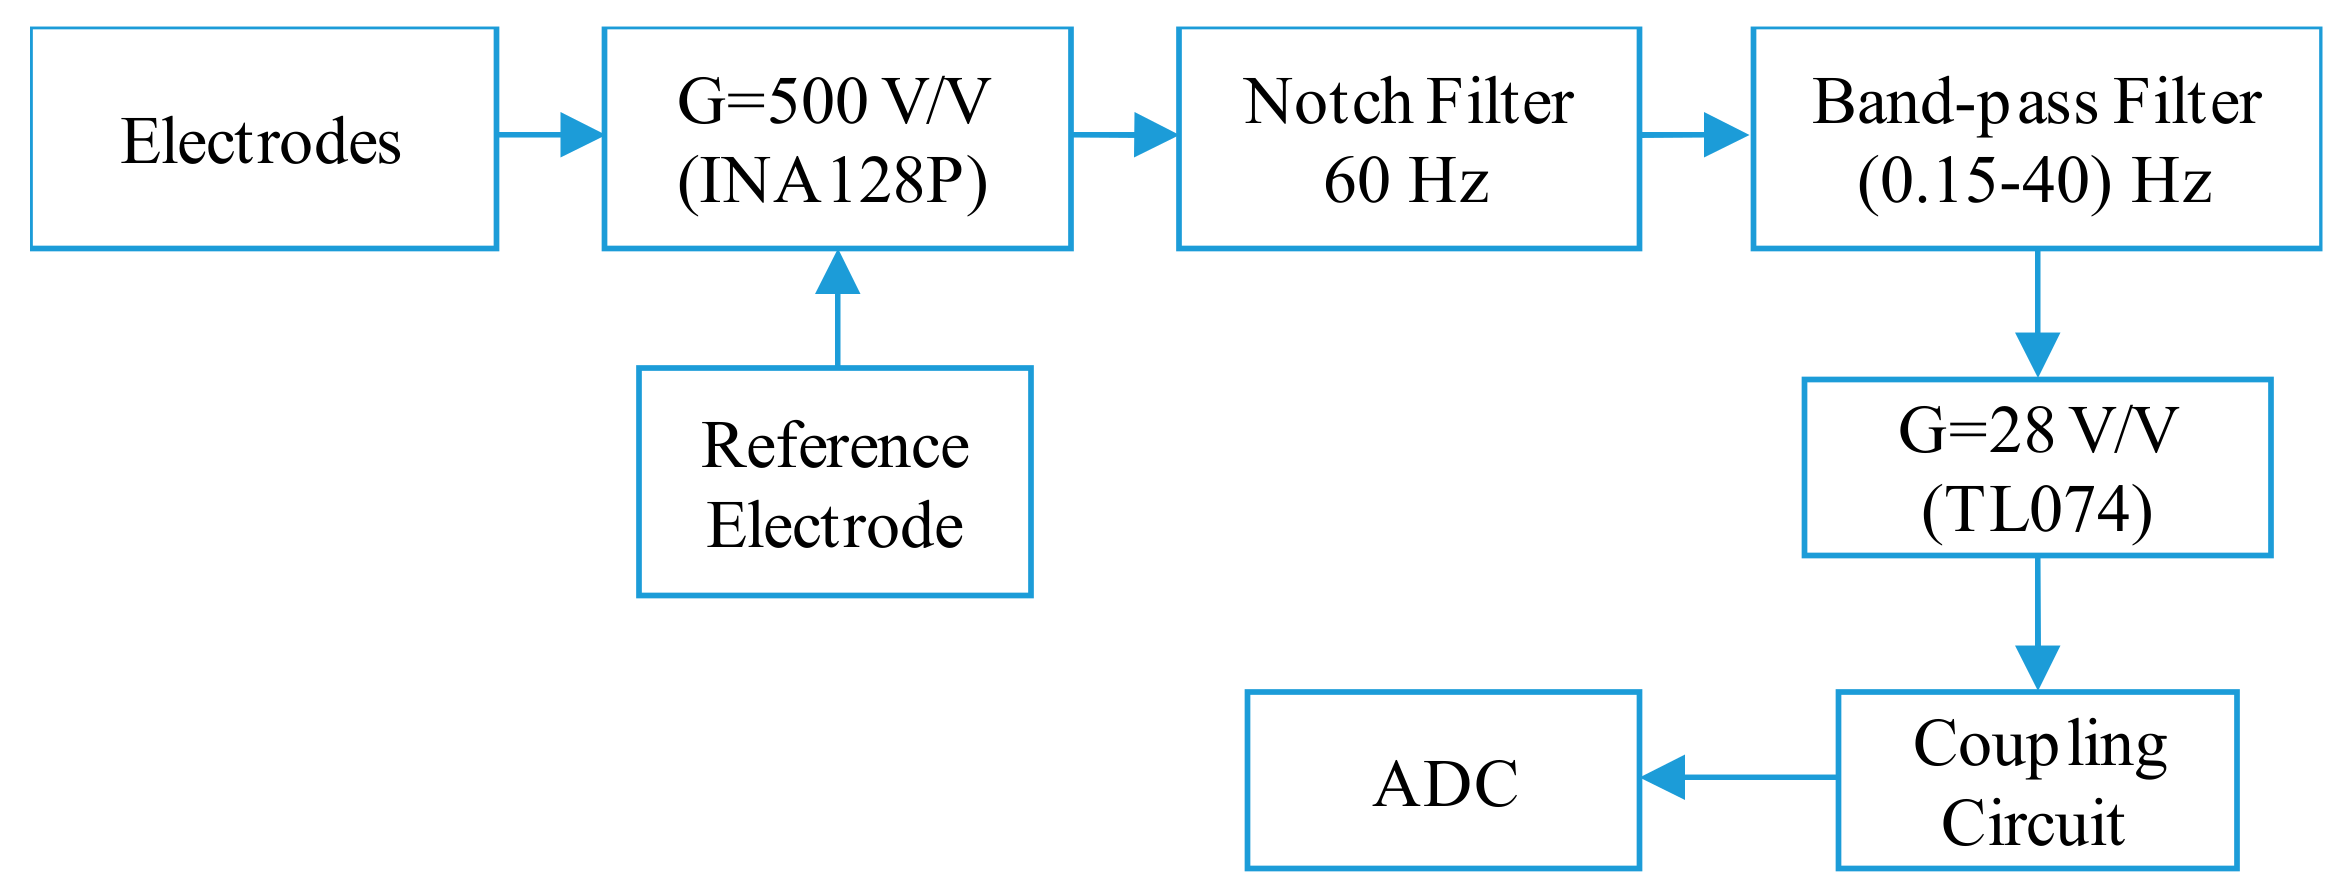
2.2. EEG and EOG Modules
The diagram for the acquisition of the EEG and EOG signals is shown in Figure 4.
For the arrangement of the electrodes in the EEG module, three types of montages must be taken into account: unipolar, longitudinal bipolar, and transverse bipolar. The most commonly used are bipolar montages, such as those shown in Figure 5a,b. With these methods, it is possible to make a large number of registers, depending on the number of available channels.
In the case of EOG signals, the recording of horizontal and vertical movement is carried out by means of 5 electrodes: 4 for direct recording of the EOG signal and 1 for reference. The potential difference in the Horizontal Lead (HL) is proportional to the horizontal movement of the eyes. In the same way, it happens with the vertical movement of the eyes and the potential in the Vertical Lead (VL). In Figure 5c, the electrodes A–B belong to the horizontal lead, while the electrodes C–D correspond to the vertical lead. The electrode E is the reference electrode.
2.3. EMG and Bioimpedance Modules
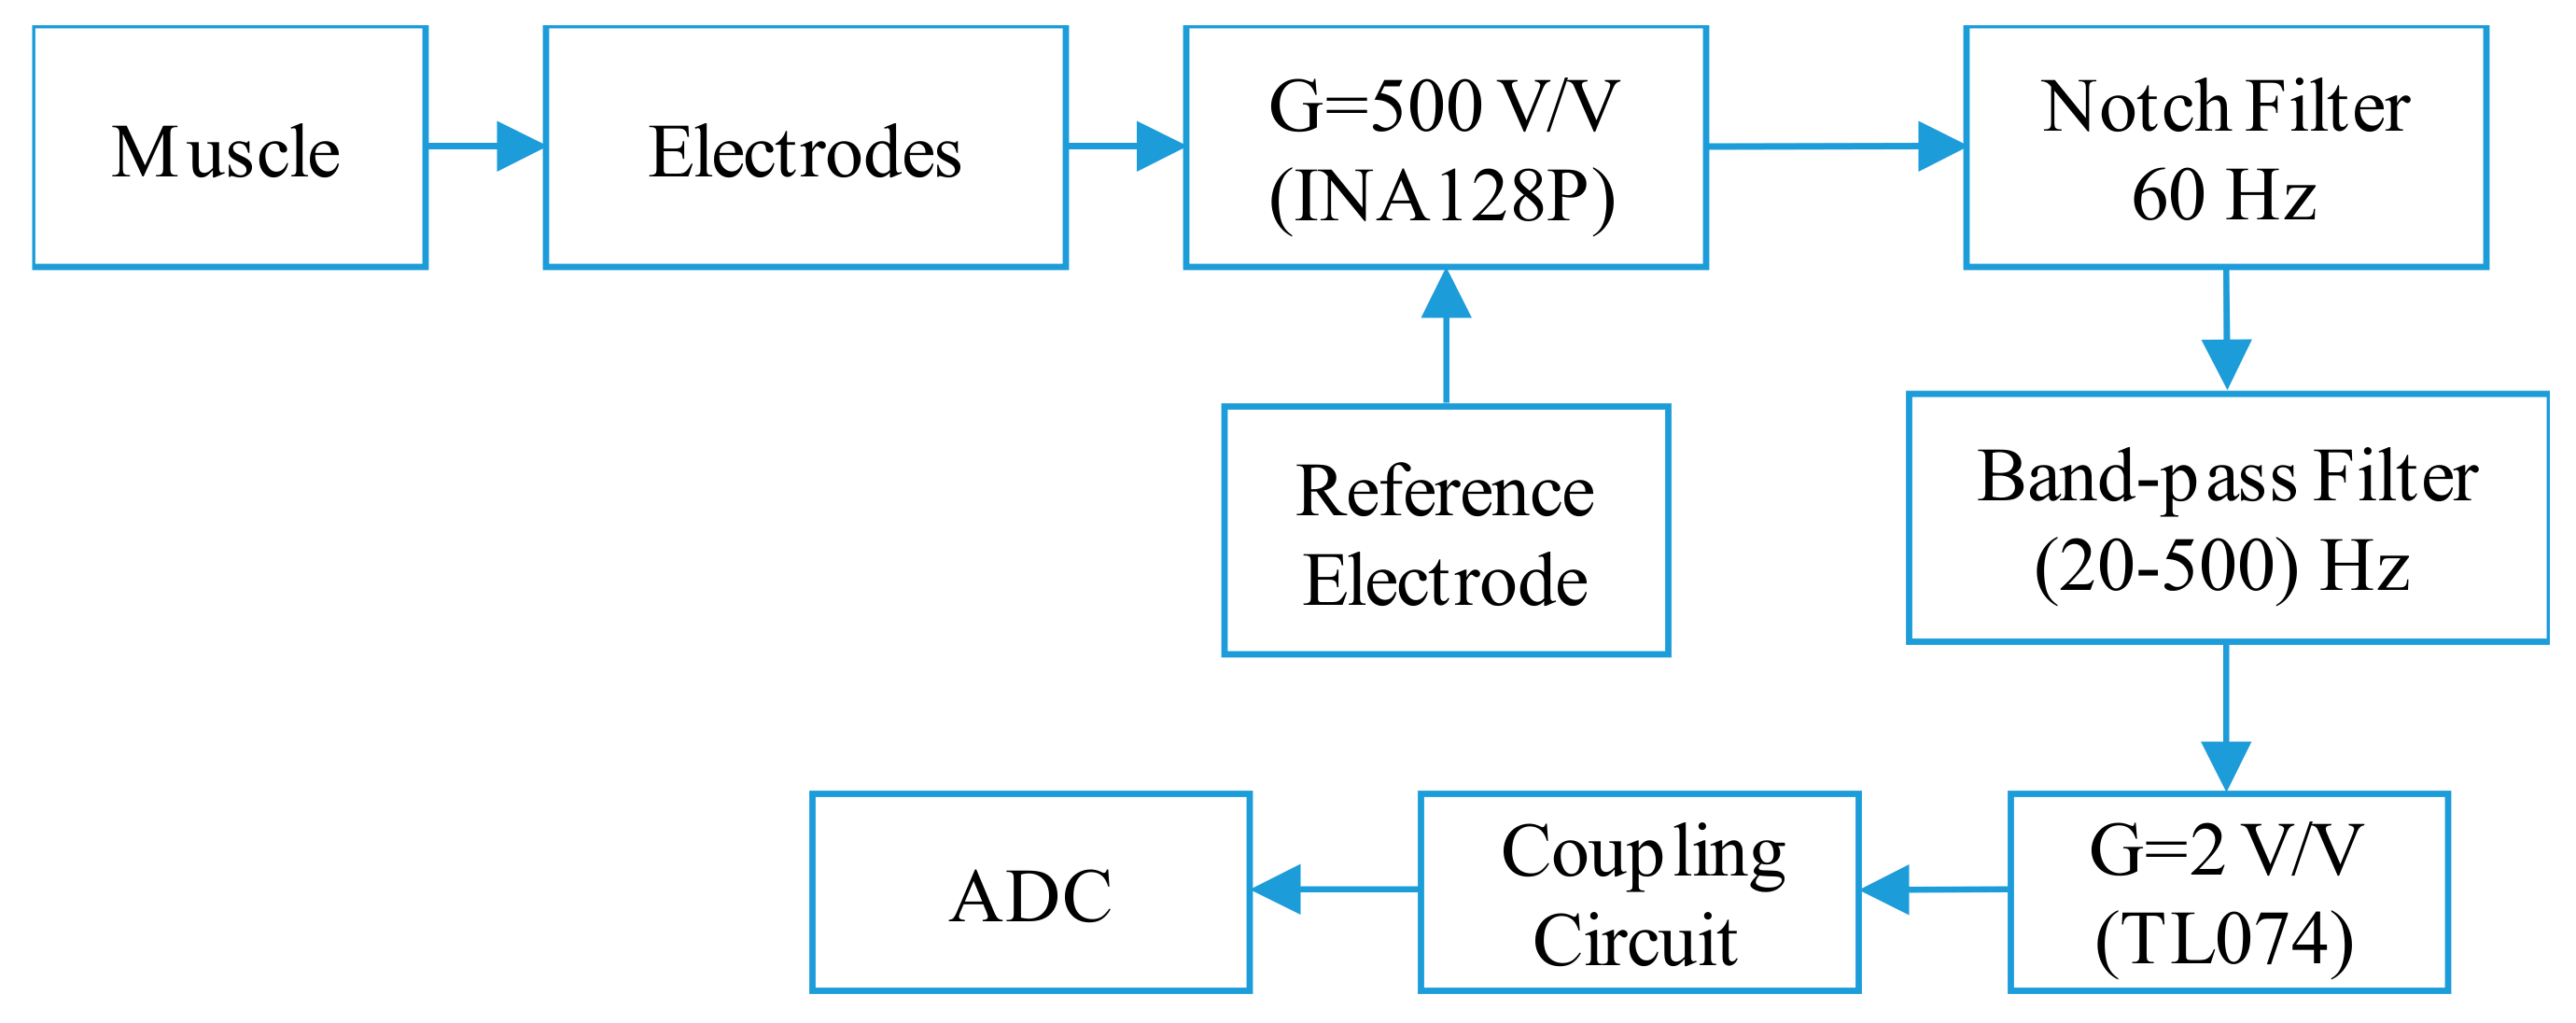
The diagram of the circuit for the acquisition of the EMG signal is shown in Figure 6. The arrangement of the electrodes for obtaining the EMG signal was made taking into account the standards of the Surface Electromyography for Noninvasive Assessment of Muscles (SENIAM) [33].
SENIAM is a project that emerged in Europe, which establishes a series of standards to determine the distance, location, shape, and size of surface electrodes for the acquisition of EMG signals. SENIAM establishes the following recommendations: The distance between the electrodes should be approximately 20 mm to 30 mm, and when working with small muscles, the distance should not exceed ¼ of the length of the muscle fiber.
The arrangement of the electrodes can be done transverse or longitudinal. The first consists of locating the bipolar electrode in the middle of the muscle, in such a way that the line joining the electrodes is parallel with the longitudinal axis of the muscle, while the second consists of locating the bipolar electrode in the middle zone of the muscle, that is, between the end of the motor neuron that sends the electrical impulse to the muscle and the distal tendon.
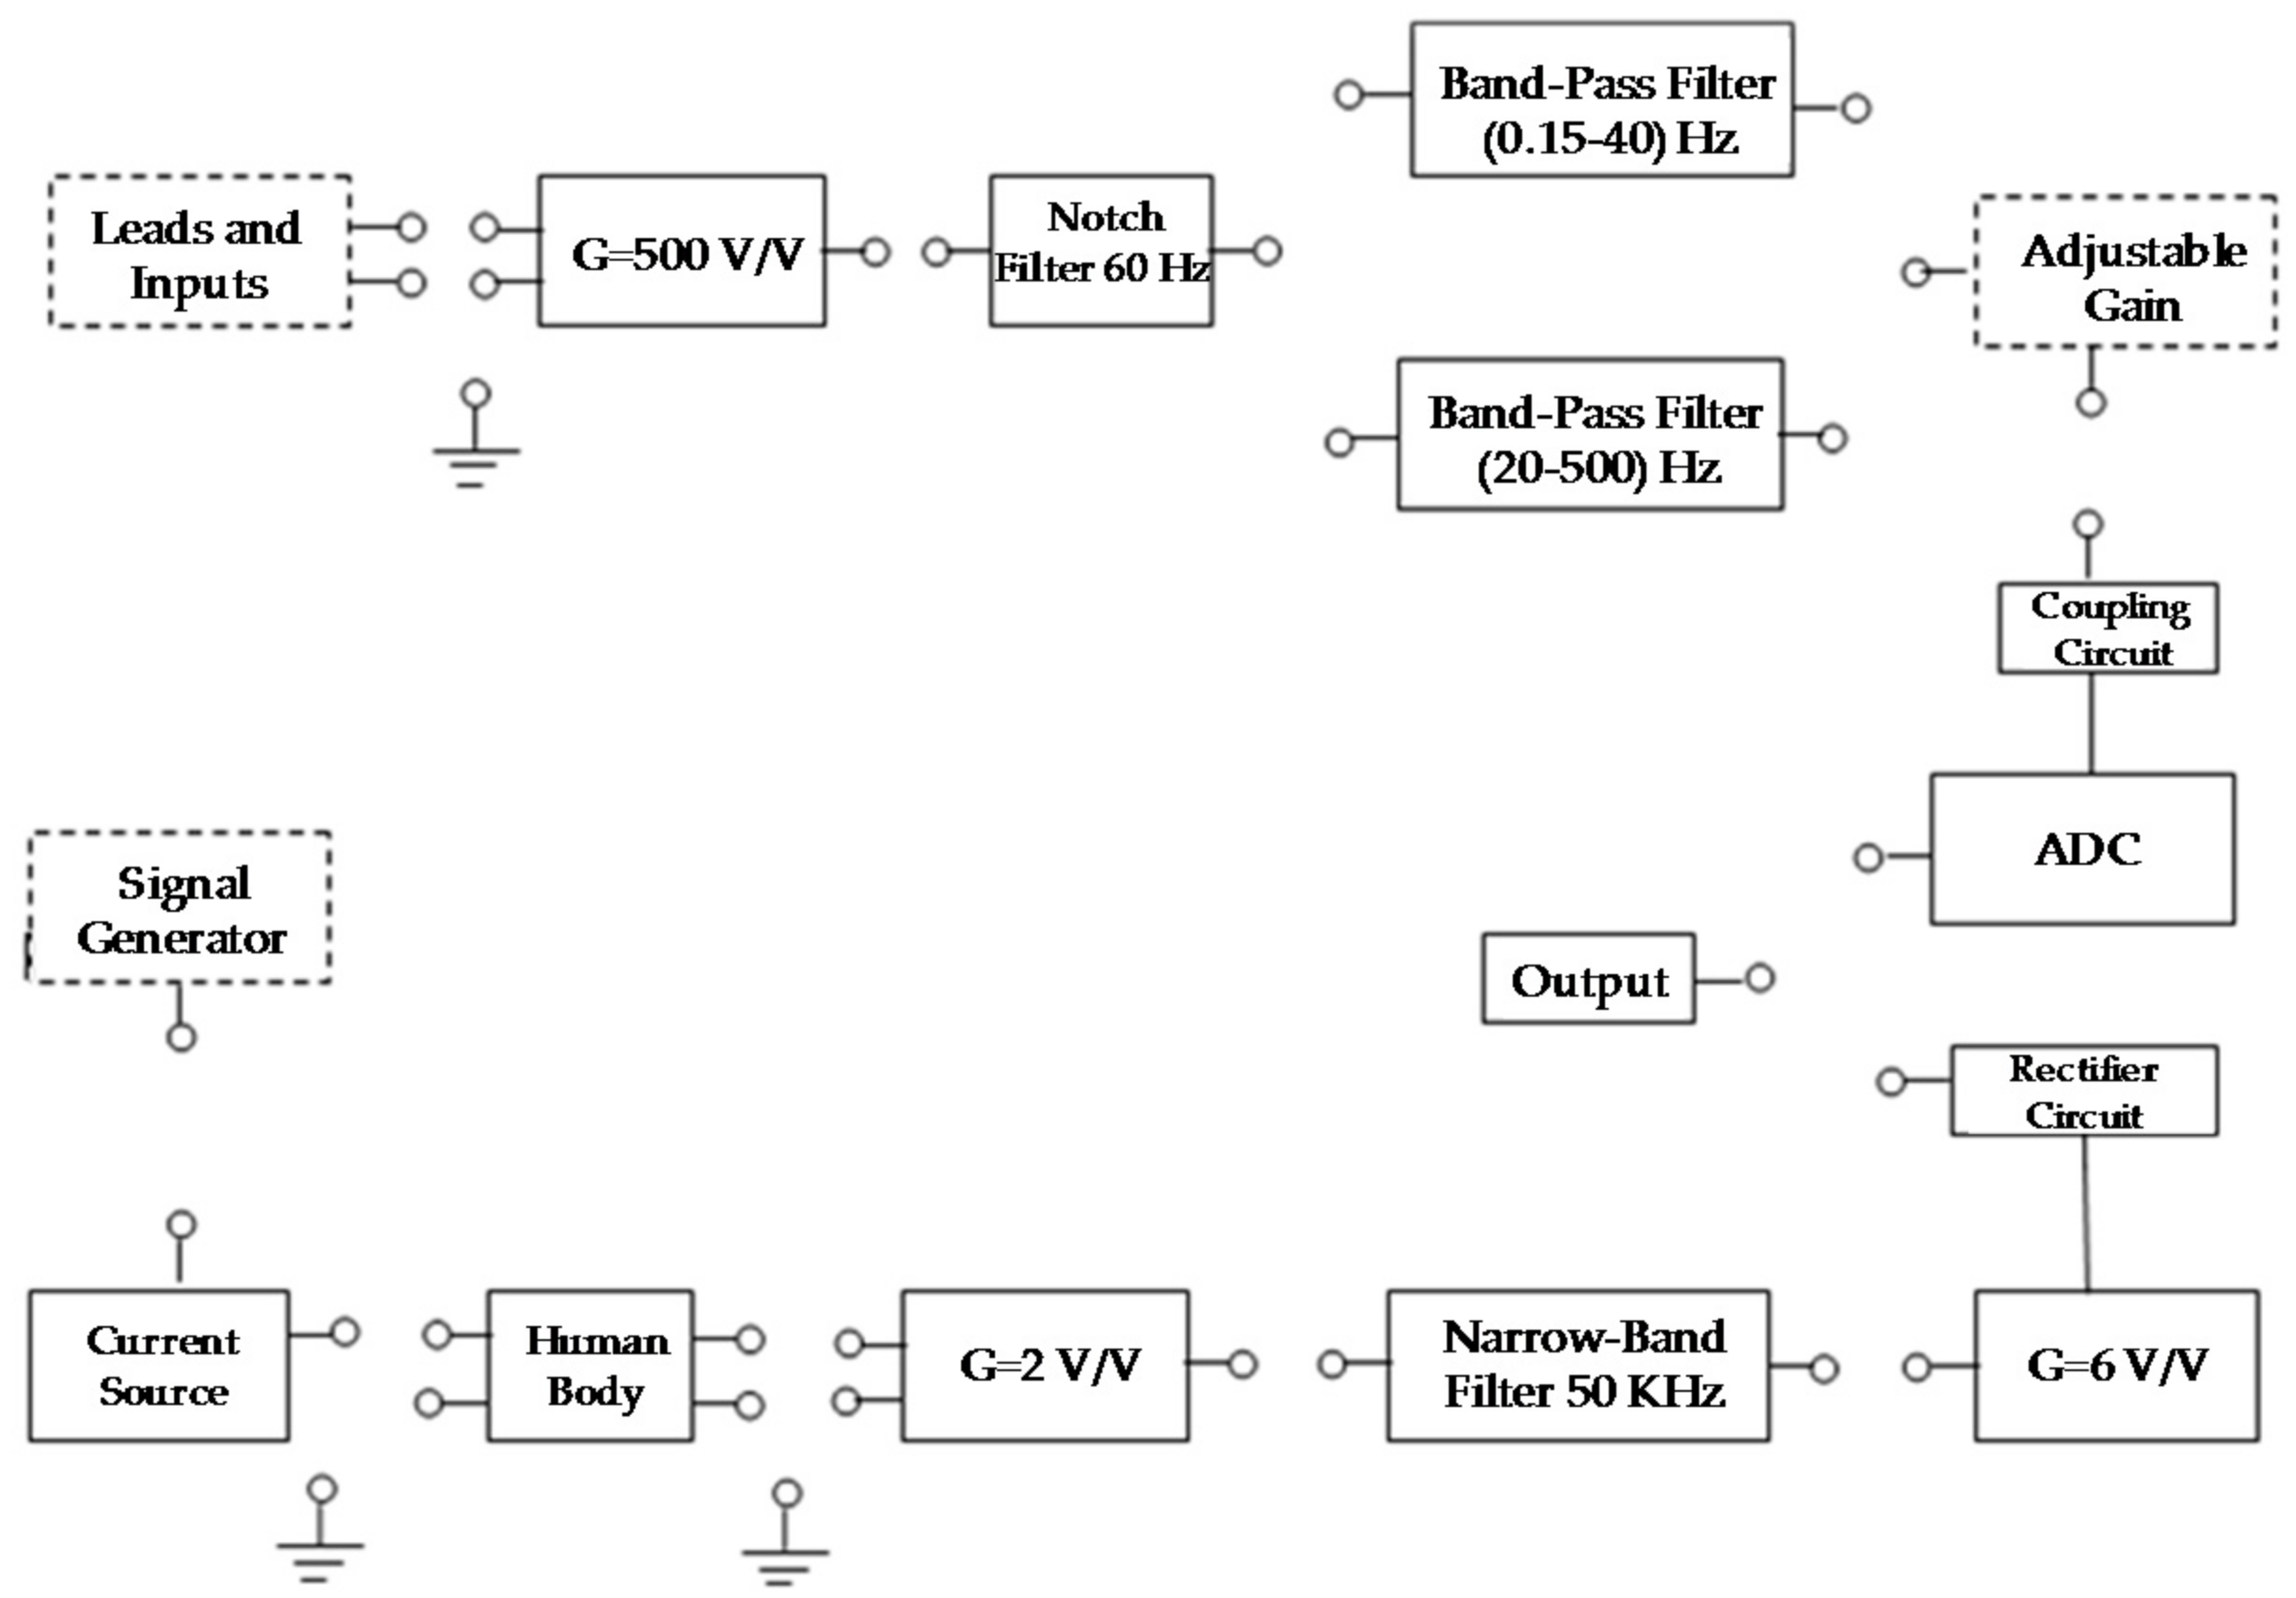
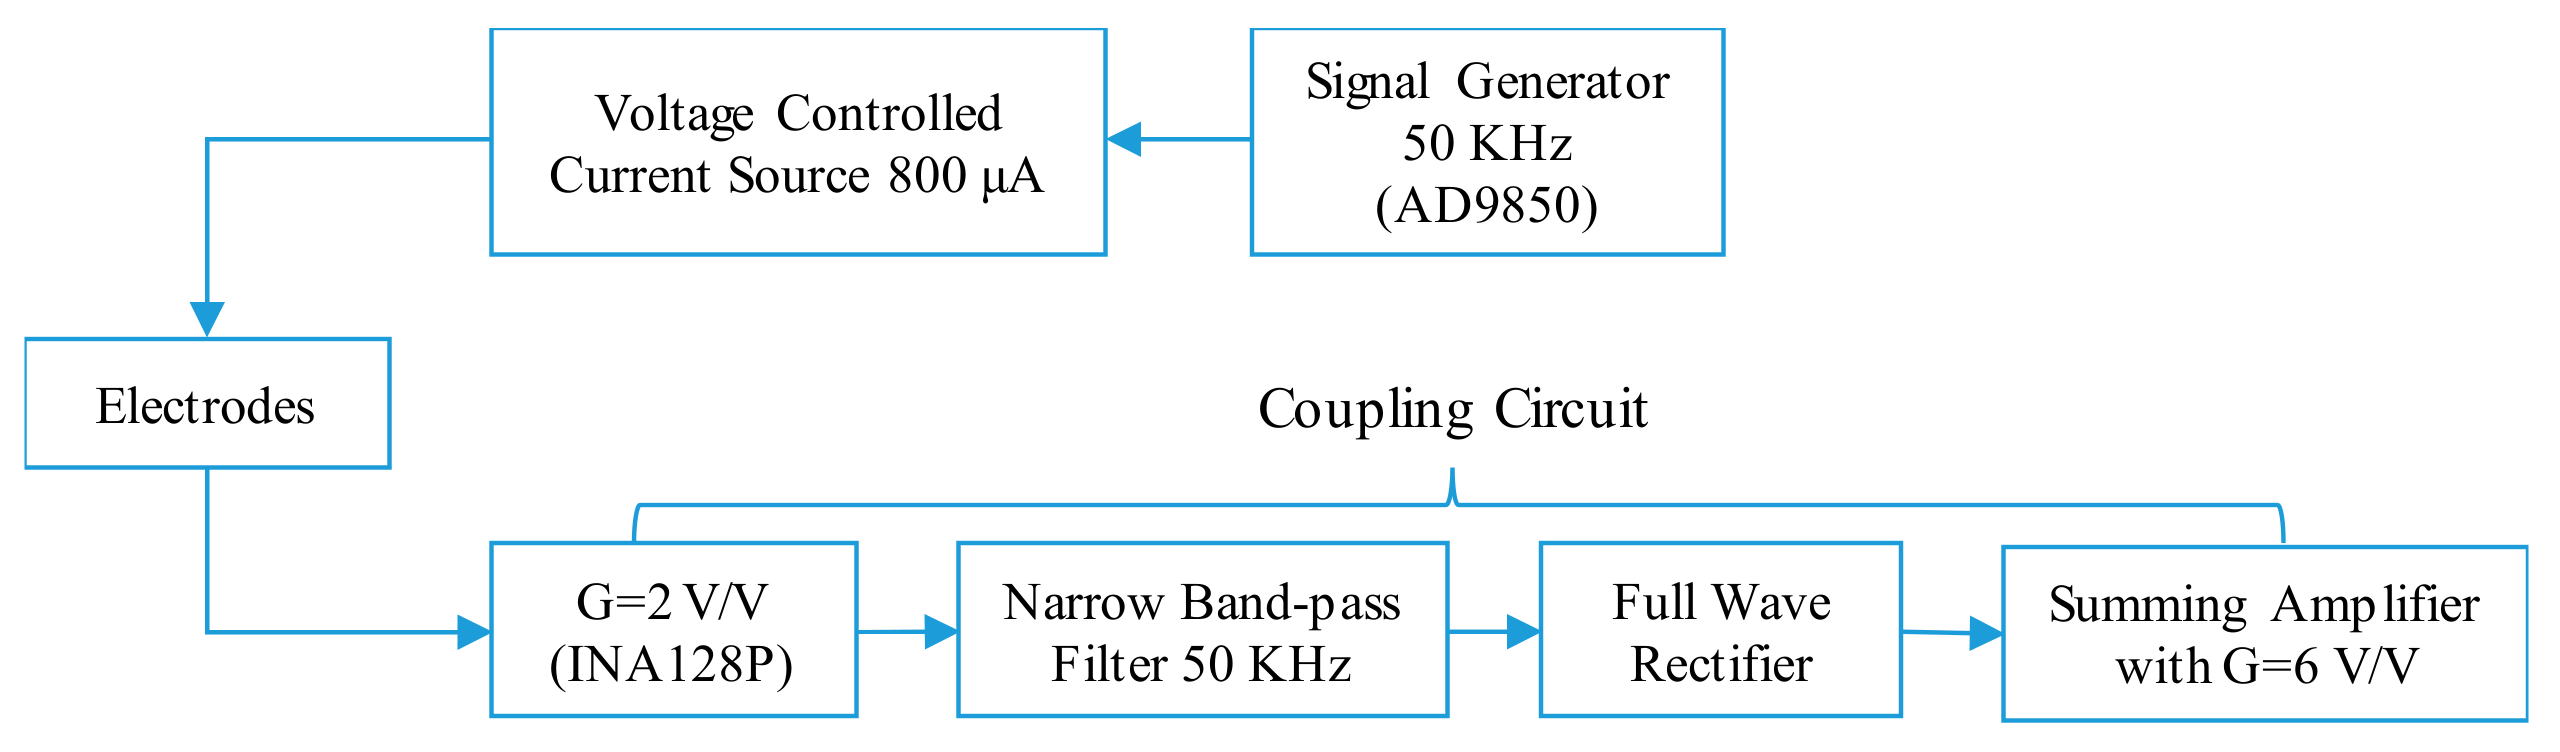
Bioimpedance is a technique used to measure the percentage of body fat, based on the electrical properties of biological tissues. The diagram of the bioimpedance module is shown in Figure 7, which has the main stages for the acquisition of the signal.
The purpose of this module is to provide a tool that allows users to understand the variations of bioelectrical impedance in different parts of the human body. The signal generator incorporated in the device is used to inject current into the body.
2.4. Design of the Stages of the ECG-EEG-EOG-EMG Modules
2.4.1. Gain of G = 500 V/V and Driven Right Leg Circuit
To amplify the biomedical signals (ECG, EEG, EOG, and EMG), the INA128P instrumentation amplifier was used. This amplifier is recommended to work with biomedical signals due to its accuracy and high common-mode rejection ratio. The gain is given by the ratio that the manufacturer specifies in the datasheet.
For a gain of G = 500 V/V, an RG of 100.2 Ω was obtained.
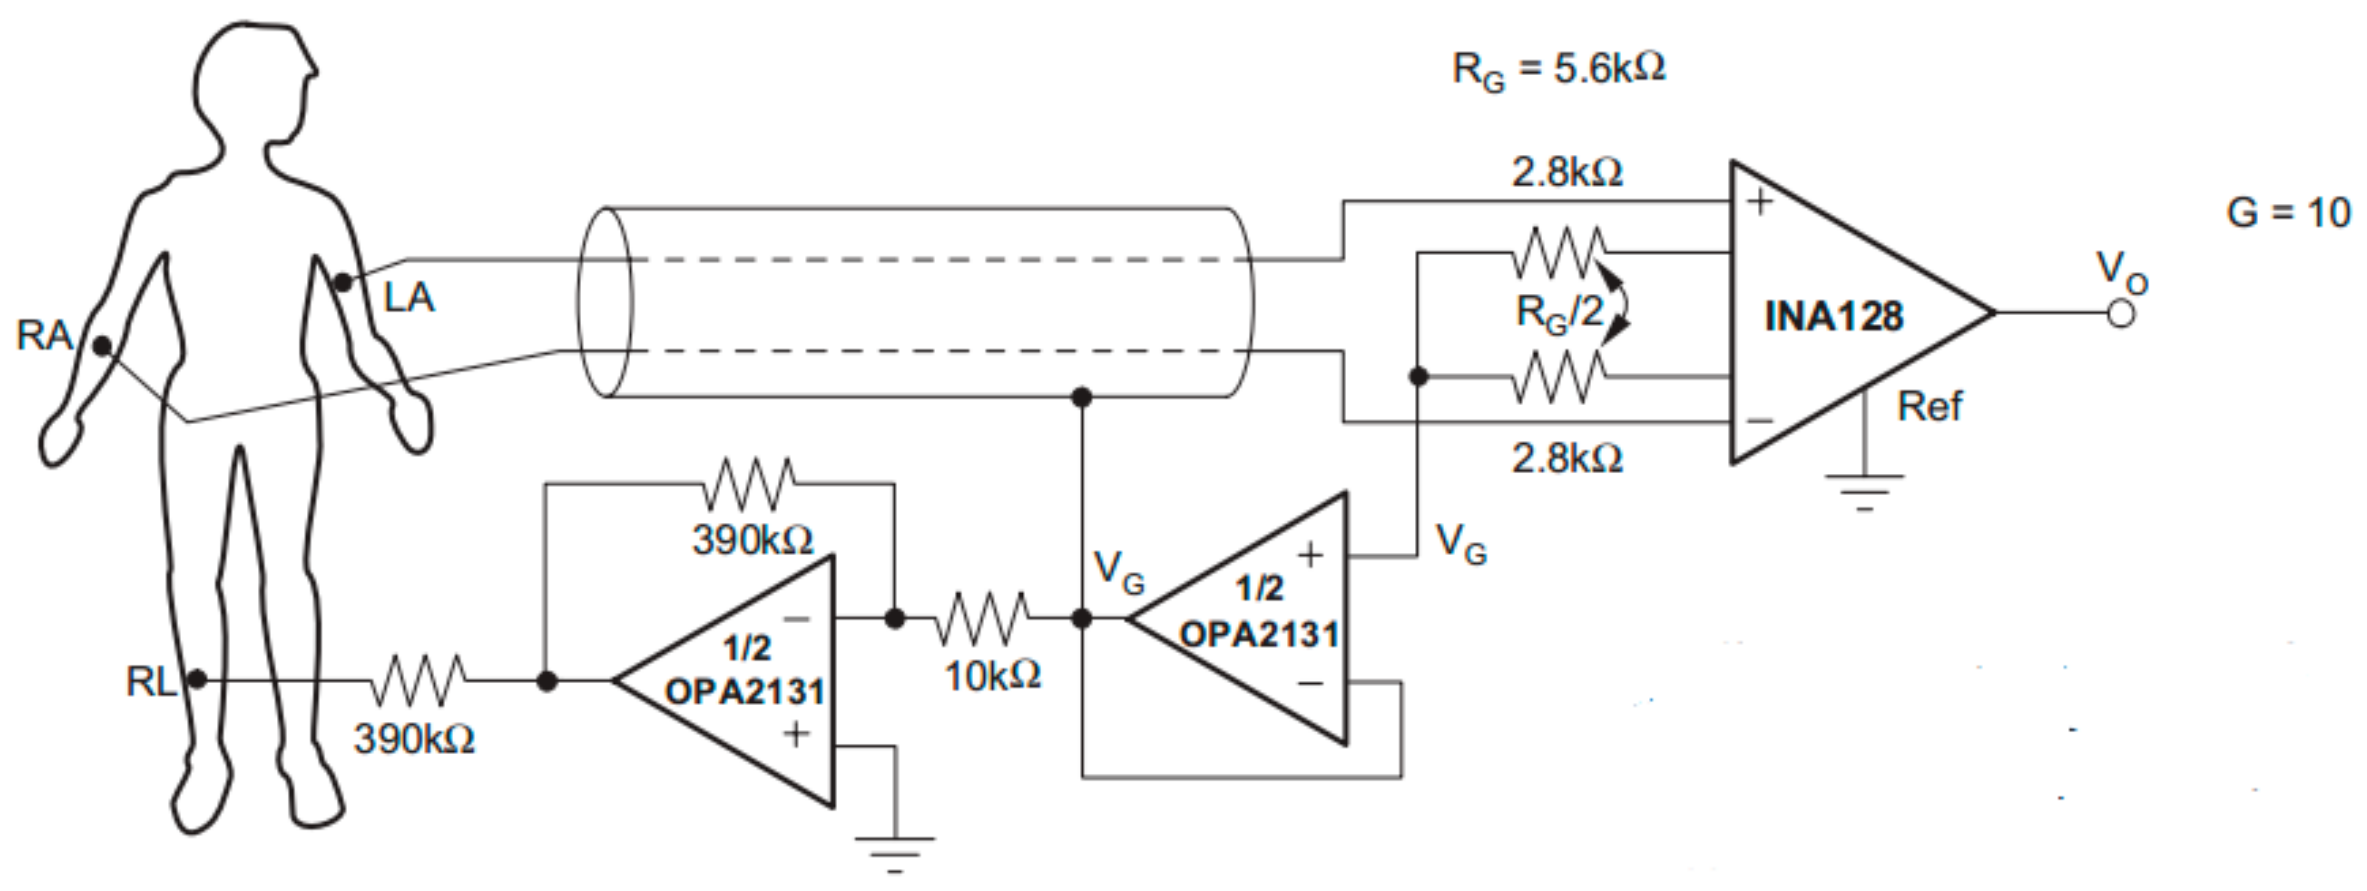
The RL electrode was used to implement a driven right leg circuit for the ECG module. This circuit is of great importance for the protection of the person and allows one to avoid unbalance currents and to compensate common-mode noise problems in the differential input of the instrumentation amplifier. Figure 8 shows the circuit and the arrangement of the electrodes for acquiring the ECG signal, using the INA128P instrumentation amplifier [34].
2.4.2. 60 Hz Notch Filter
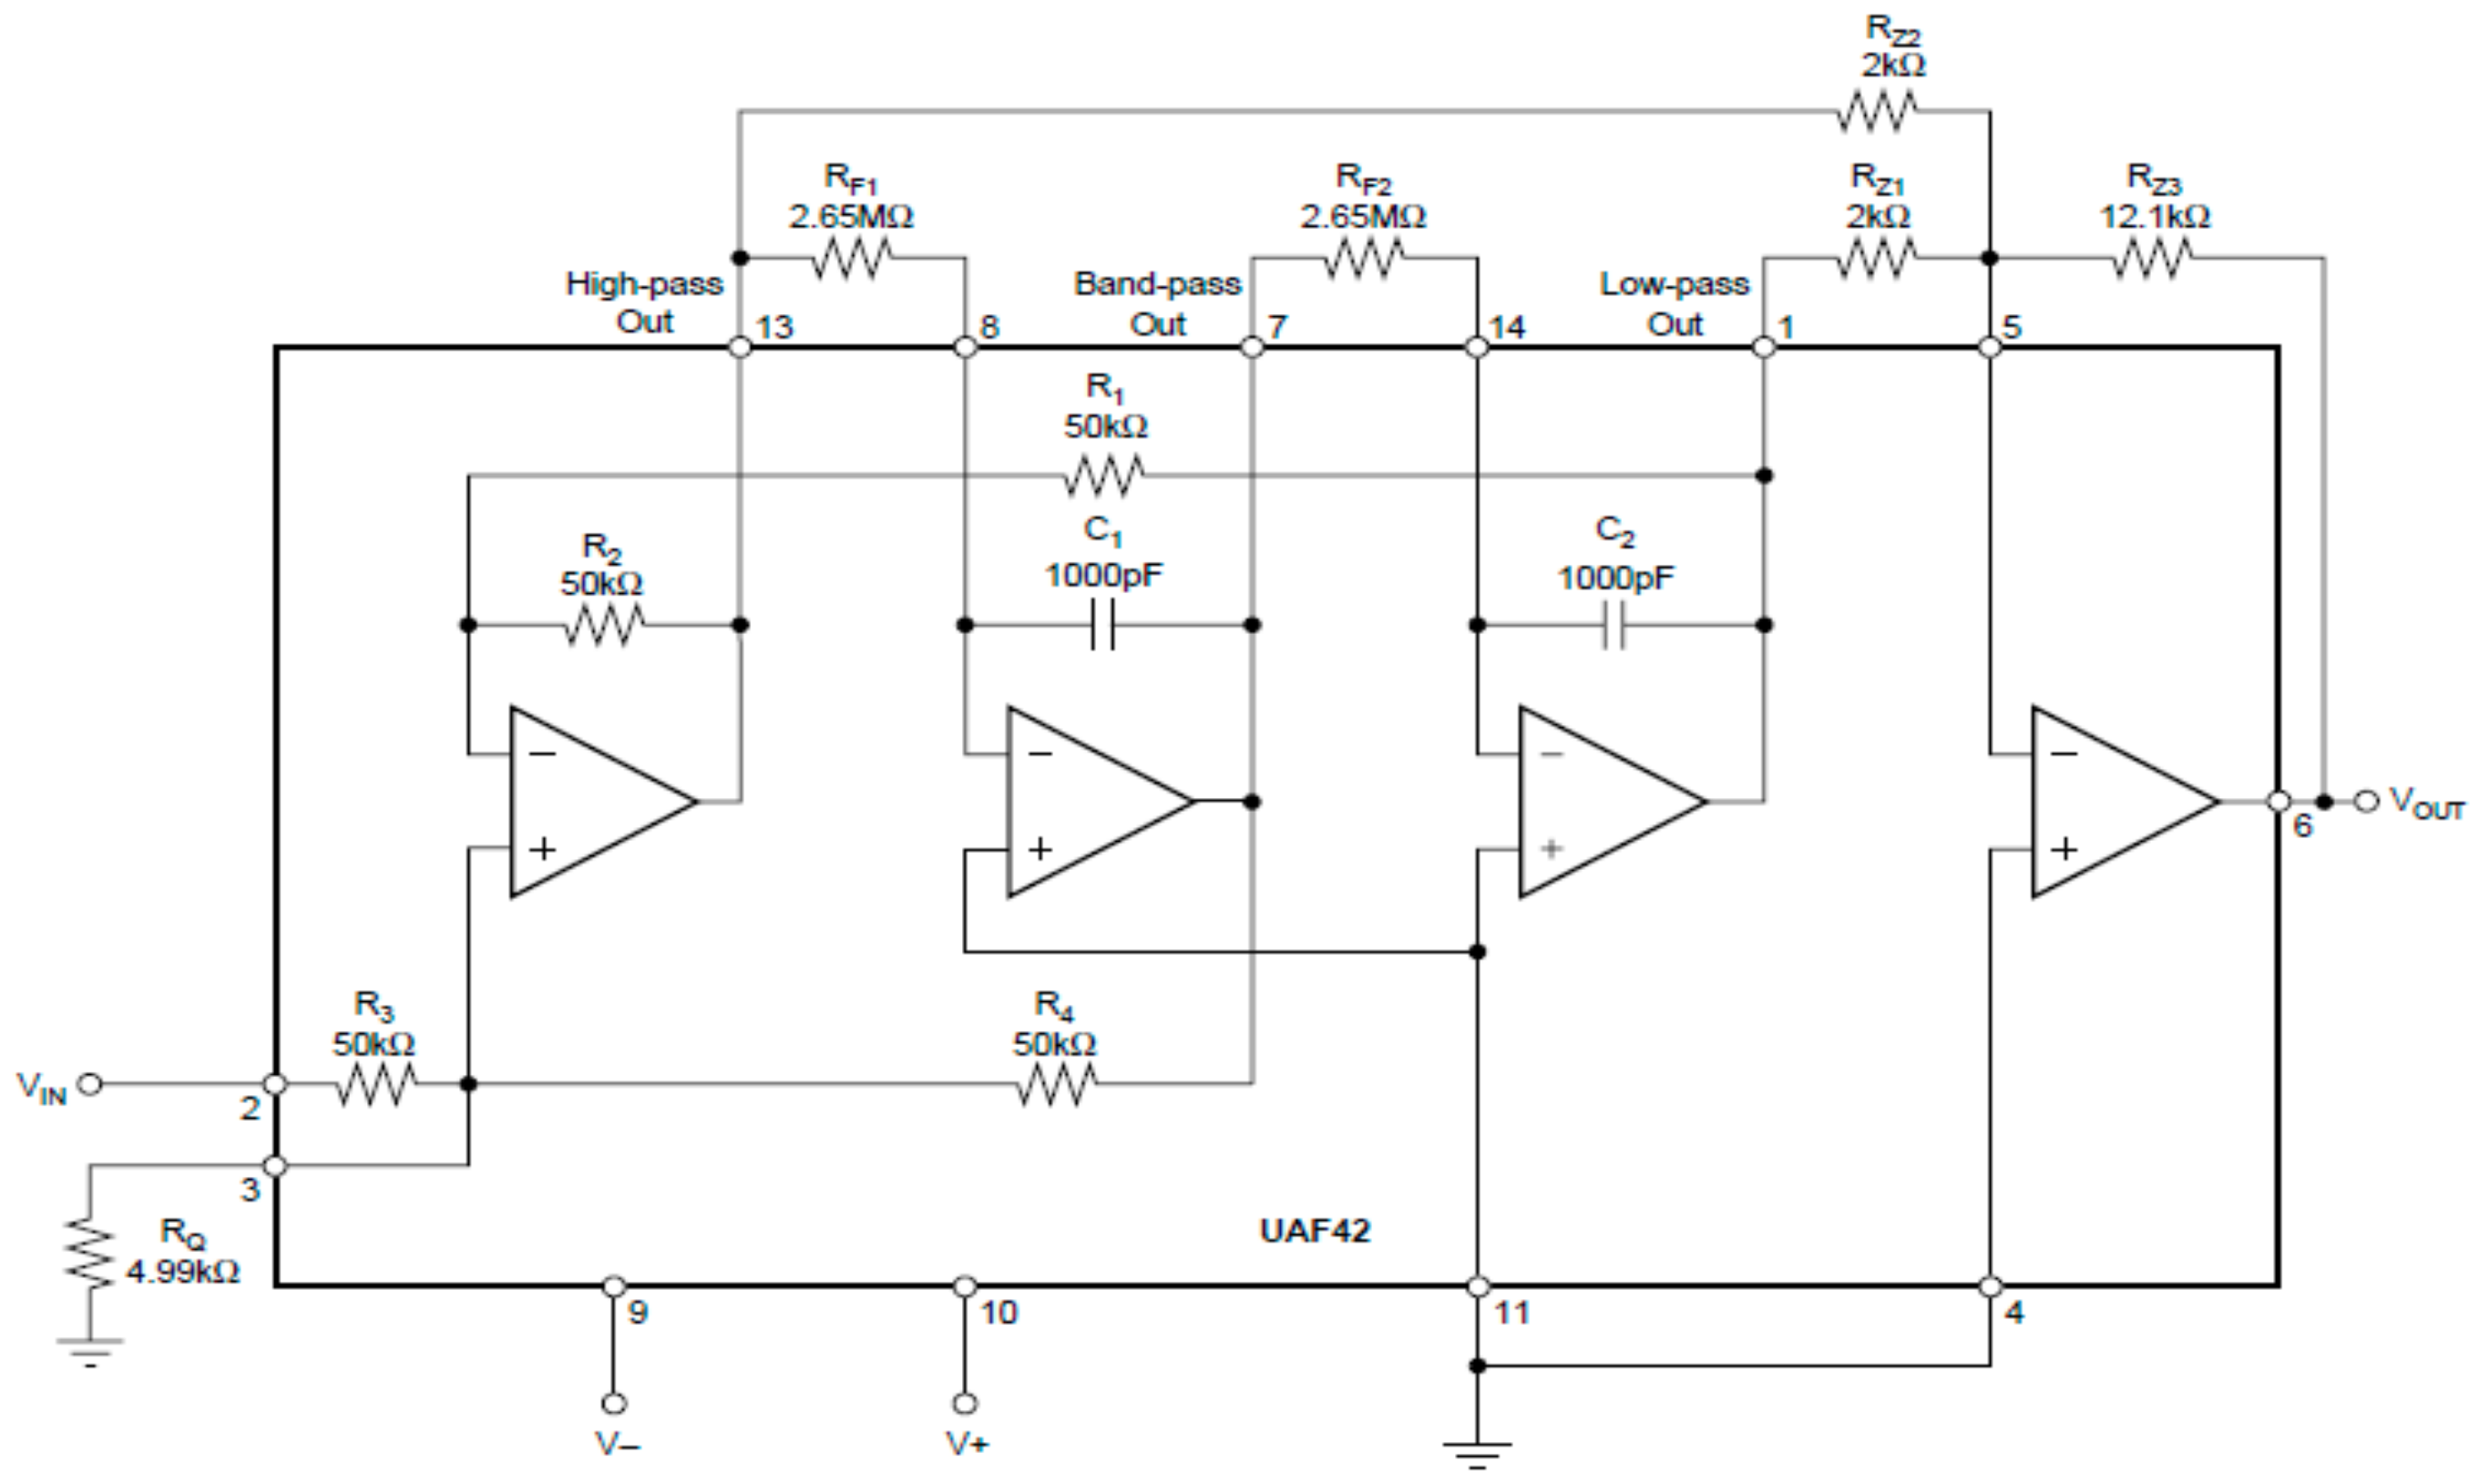
To implement the Notch filter in the ECG, EEG, EOG, and EMG modules, the integrated circuit UAF42 was used. This integrated circuit is a second-order active filter in the Sallen-Key topology, which can be configured from 6 resistors (RF1, RF2, RZ1, RZ2, RZ3, and RQ). The Notch frequency is given by
in which ALP is the gain from the input to low-pass out and AHP is the gain from the input to the high pass output for f >> f0. Typically, ALP/AHP = RZ2/RZ1, which simplifies fNotch = f0. Now, f0 is given by
in which RF = RF1 = RF2, and C = C1 = C2. In this way, for C = 1000 pF and f0 = 60 Hz, it was obtained that RF = 2.65 MΩ. Using a quality factor Q = 6, the value of RQ was obtained.
To obtain the values of RZ1, RZ2, and RZ3, the equation for the quality factor Q was used [35].
For Q = 6, RZ3 = 2 kΩ and RZ2 = RZ3 = 2 kΩ were obtained.
2.4.3. Band-pass Filter: 0.15 to 40 Hz
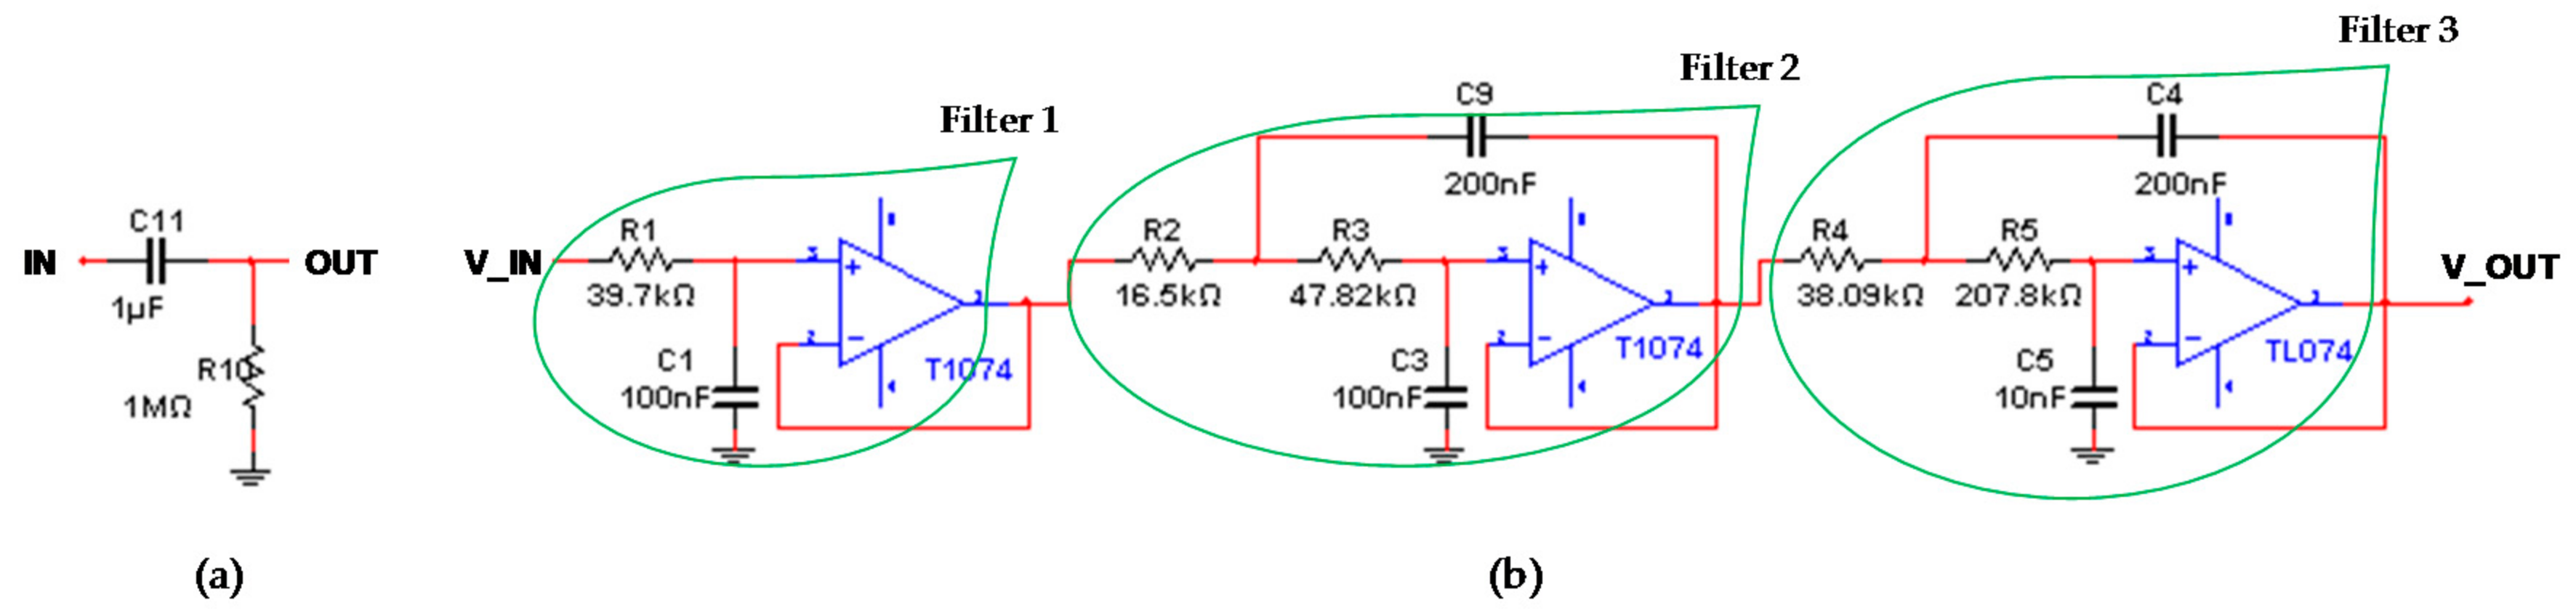
For the ECG, EEG, and EOG modules, a band-pass filter was designed, consisting of a first-order passive high-pass filter and a fifth-order active low-pass filter. For the design of the first-order high-pass filter, C11 = 1 μF and fc = 0.15 Hz were used, whereby an R10 = 1/(2 × π × C × fc) = 1 MΩ was obtained. See Figure 10a.
The low pass filter was designed using fifth-order, Butterworth optimization, Sallen-Key topology, unity gain, and 40 Hz cutoff frequency. For this purpose, three cascade filters were carried out. Then, for each filter, the coefficients described in Table 2 [36] were used.
Filter 1: With C1 = 100 nF, the resistance R1 is obtained.
Filter 2: With C3 = 100 nF, the minimum value for the capacitor C9 is established.
In this way, a C9 = 200 nF was used. Once the capacitors were defined, the resistances R3,2 were calculated.
With this procedure, the values of the resistors R2 = 16.55 kΩ and R3 = 47.82 kΩ were obtained.
Filter 3: This stage was designed with the same procedure presented in filter 2, with the difference that the coefficients a2 and b2 are replaced by the coefficients a3 and b3 of Table 2. Therefore, the values obtained in the design of this stage were as follows: C5 = 10nF, C4 = 200 nF, R4 = 38.09 kΩ, and R5 = 207.79 kΩ. In Figure 10b, the designed filter is shown.
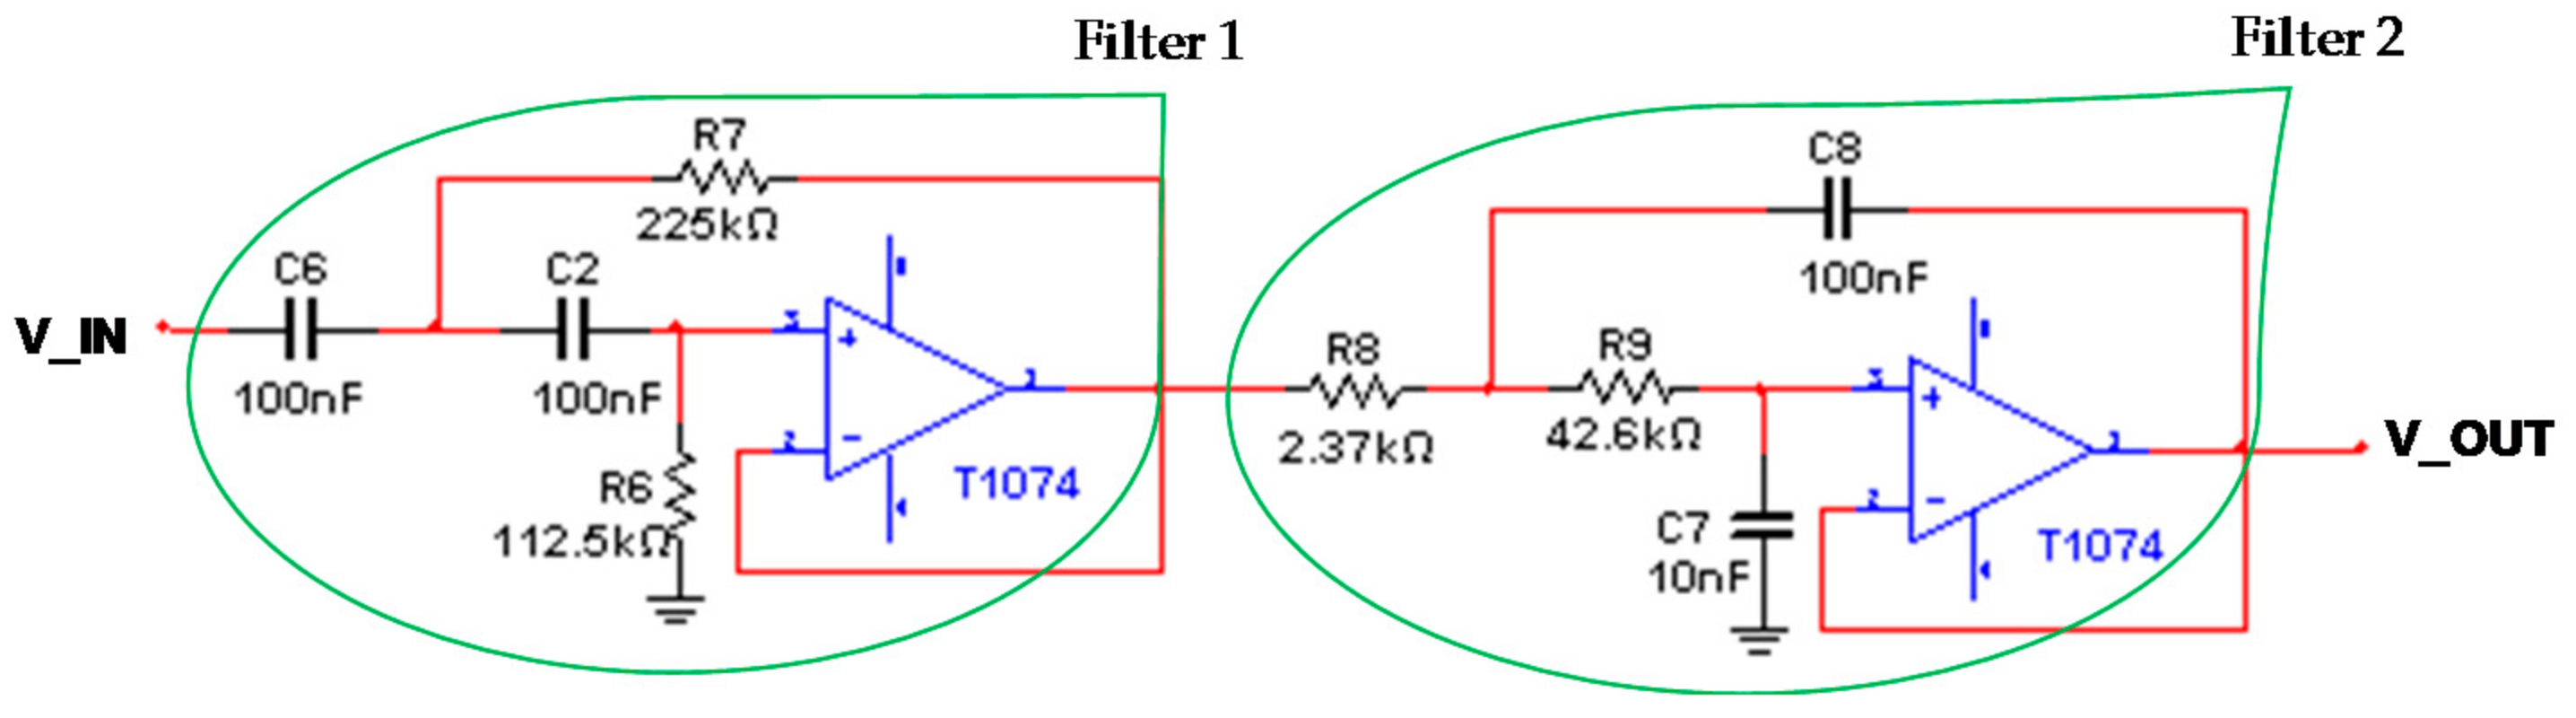
2.4.4. Band-pass Filter: 20 to 500 Hz
A band-pass filter of 20 Hz to 500 Hz for the EMG module was designed, which consists of a cascaded, second-order active high-pass filter and a second-order active low-pass filter (see Figure 11).
Filter 1: Initially, the second-order active high-pass filter, Butterworth optimization, Sallen-Key topology, unity gain, and 20 Hz cutoff frequency was designed. For a1 = 1.41425 and b1 = 1 [36], with C2 = C6 = C = 100 nF, the values of the resistances R7 and R6 were obtained.
Filter 2: Subsequently, the second-order active low-pass filter, Butterworth optimization, Sallen-Key topology, unity gain, and 500 Hz cutoff frequency was designed. The same coefficients of the high pass filter were used, since they are of the same type and order. (a1 = 1.41425 and b1 = 1). For C7 = 10 nF and using Equations (7) and (8), the other components of this filter are obtained: C8 ≥ 20 × 10−9 F (C8 = 100 nF was used), R8 = 2.376 kΩ, and R9 = 42.63 kΩ.
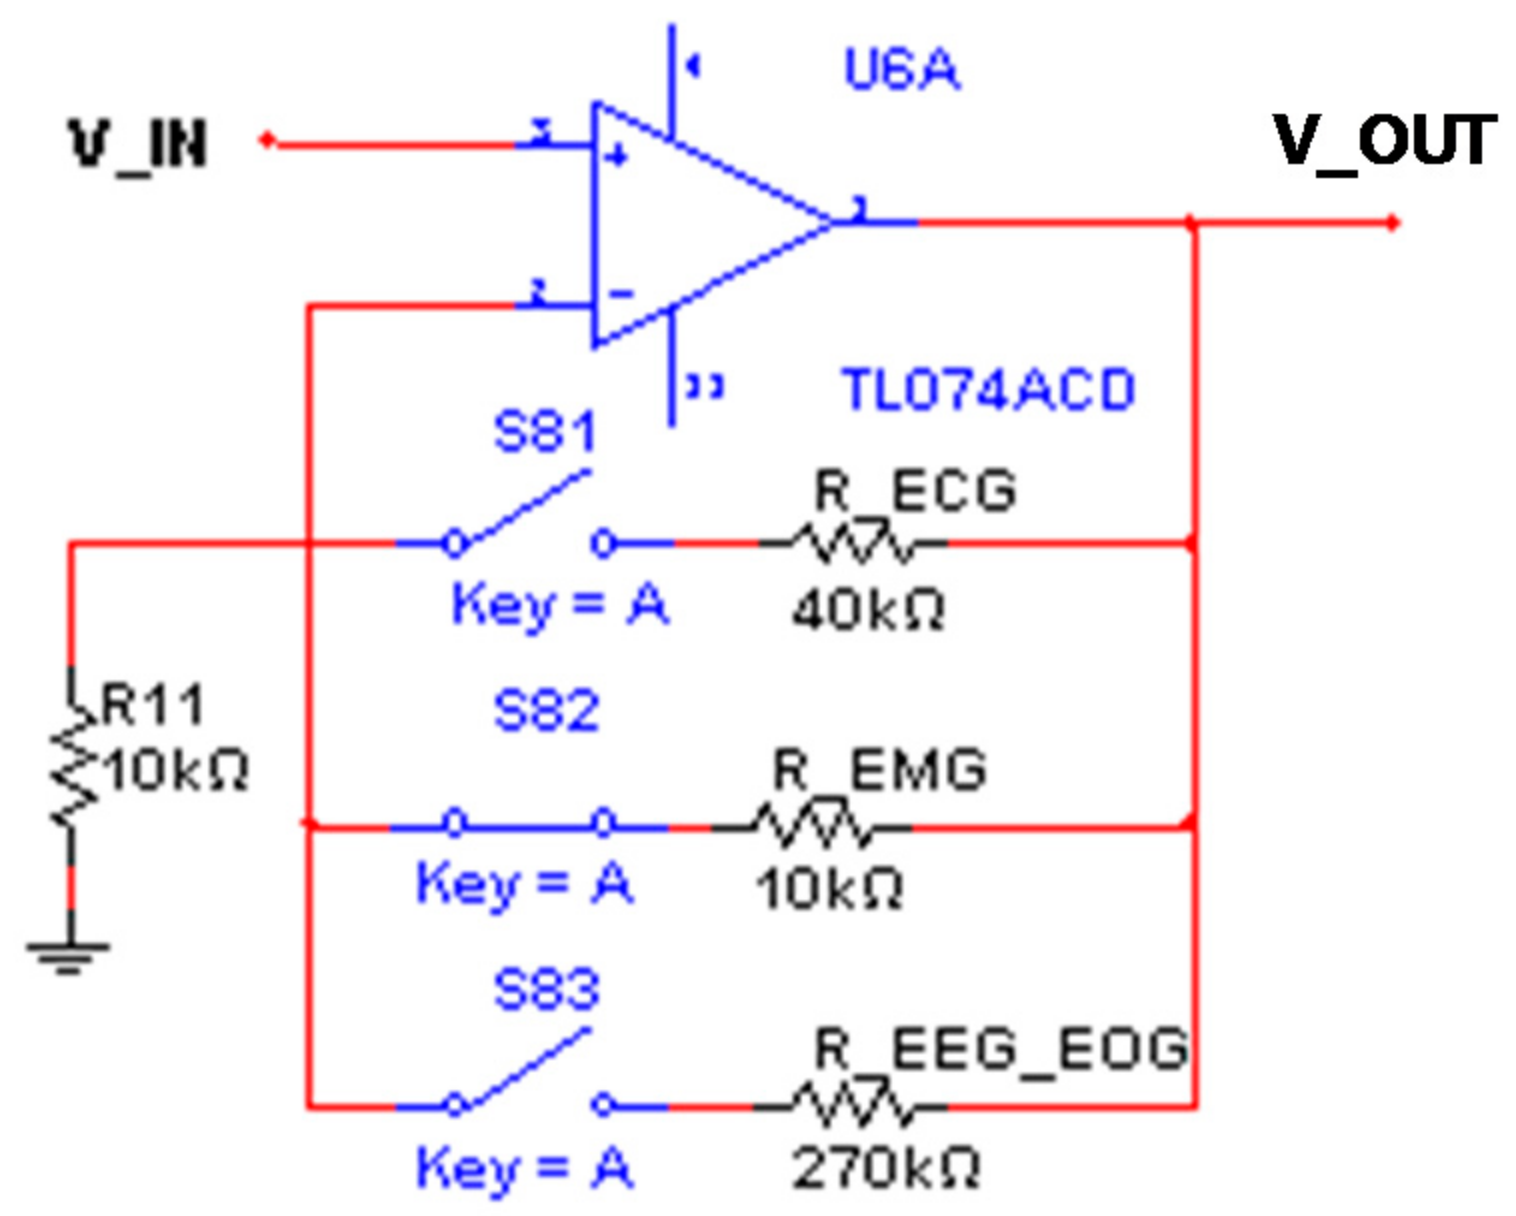
2.4.5. Adjustable Gain
In this stage, the total gain of each module was adjusted, taking into account the first amplification of 500 V/V designed with the INA128P. In this way, an amplifier with adjustable gain of 5, 2, and 28 V/V was designed, which was selected using the quad analog switches MC14066B.
In the case of the ECG module, a 5 V/V gain was used in a non-inverting configuration with the TL074 operational amplifier. In this way, for G = 5 V/V, R11 = 10 kΩ and RECG = 40 kΩ were obtained.
For the EEG and EOG modules, an amplification of 28 V/V was designed. Thus, a REEG_EOG = 270 kΩ was obtained. In the case of the EMG module, a gain of 2 V/V was used, whereby a REMG = 10 kΩ was obtained. See Figure 12.
2.5. Stages of the Bioimpedance Module
The electronic design of the bioimpedance module is divided into three blocks: signal generator, voltage controlled current source, and conditioning circuit of the resulting signal.
2.5.1. Signal Generator and Voltage Controlled Current Source
The objective of the signal generator is to deliver a sinusoidal signal at a frequency of 50 kHz with an amplitude of 1 Vp-p. With this signal, intra and extracellular behaviors can be determined.
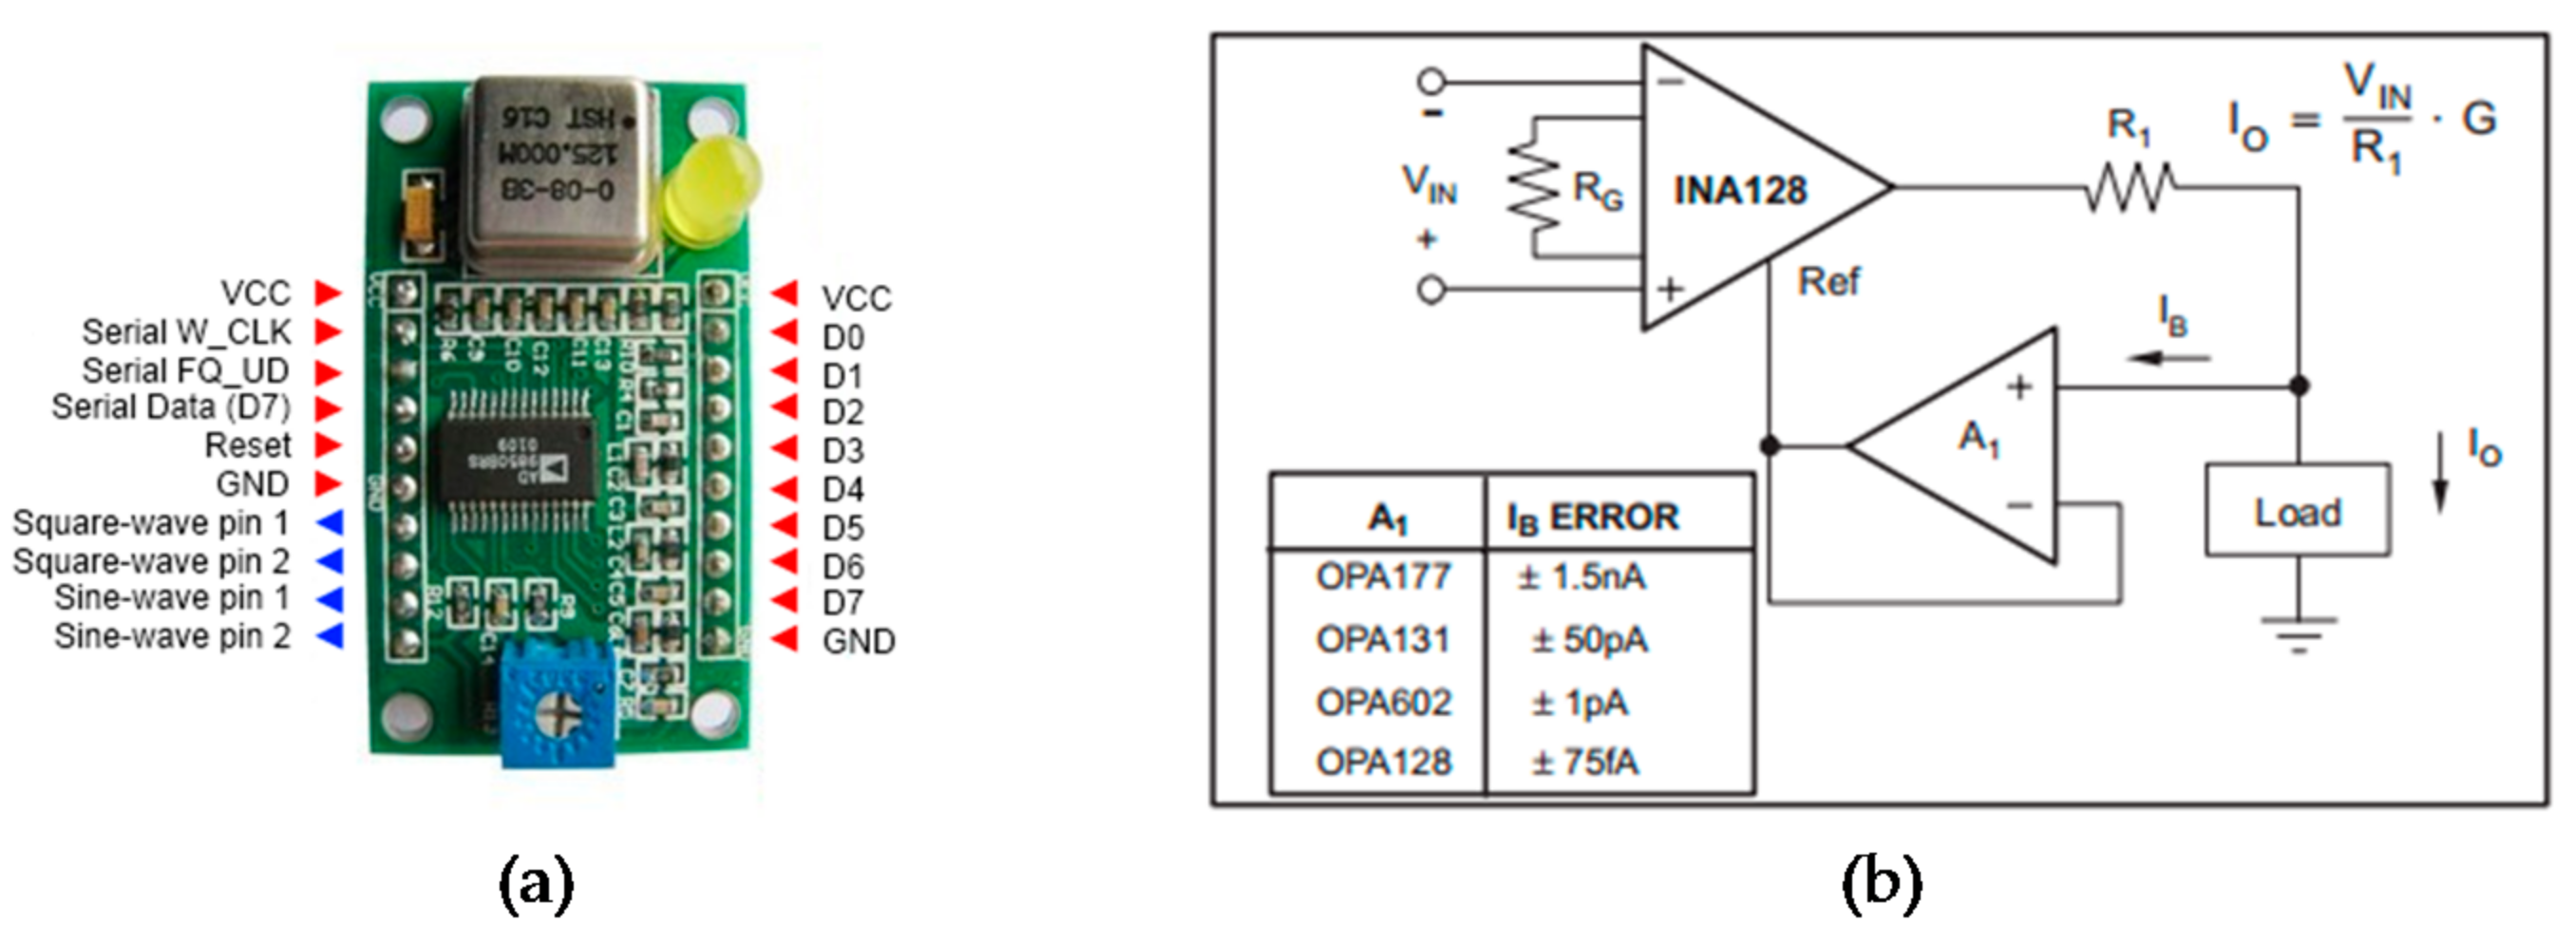
In this way, a generator to deliver a sinusoidal signal with a frequency of 50 kHz and an amplitude of 1 Vp-p was designed. For this, the AD9850 integrated circuit was used (see Figure 13a), which is a signal generator that can be controlled by a microcontroller with a parallel or serial format. The signal supplied by the generator must be transformed into current for its application, without altering the frequency and phase. The programming of the AD9850 was done through an Arduino board, and will be detailed in a later section.
The current source must not exceed 800 μA at its output, with a control voltage of 1 Vp-p (supplied by the generator). This current is imperceptible to the human body, so the injection of this current is not invasive. For this reason, the voltage to current converter configuration with the INA128P was used. See Figure 13b.
The gain of the amplifier is 2 V/V; therefore, a resistance RG of 50 kΩ was used (G = 1 + 50 KΩ/RG). To calculate the resistance R1, the following equation was used:
in which VIN = 1 Vp-p, Io = 800 uA, and G = 2 V/V. Therefore, R1 = 2.5 kΩ.
2.5.2. Conditioning of the Bioimpedance Signal
The conditioning begins with an instrumentation amplifier, followed by a band-pass filter with a central frequency of 50 kHz, and the circuit for the A/D conversion, which is composed of an amplifier and a full-wave rectifier.
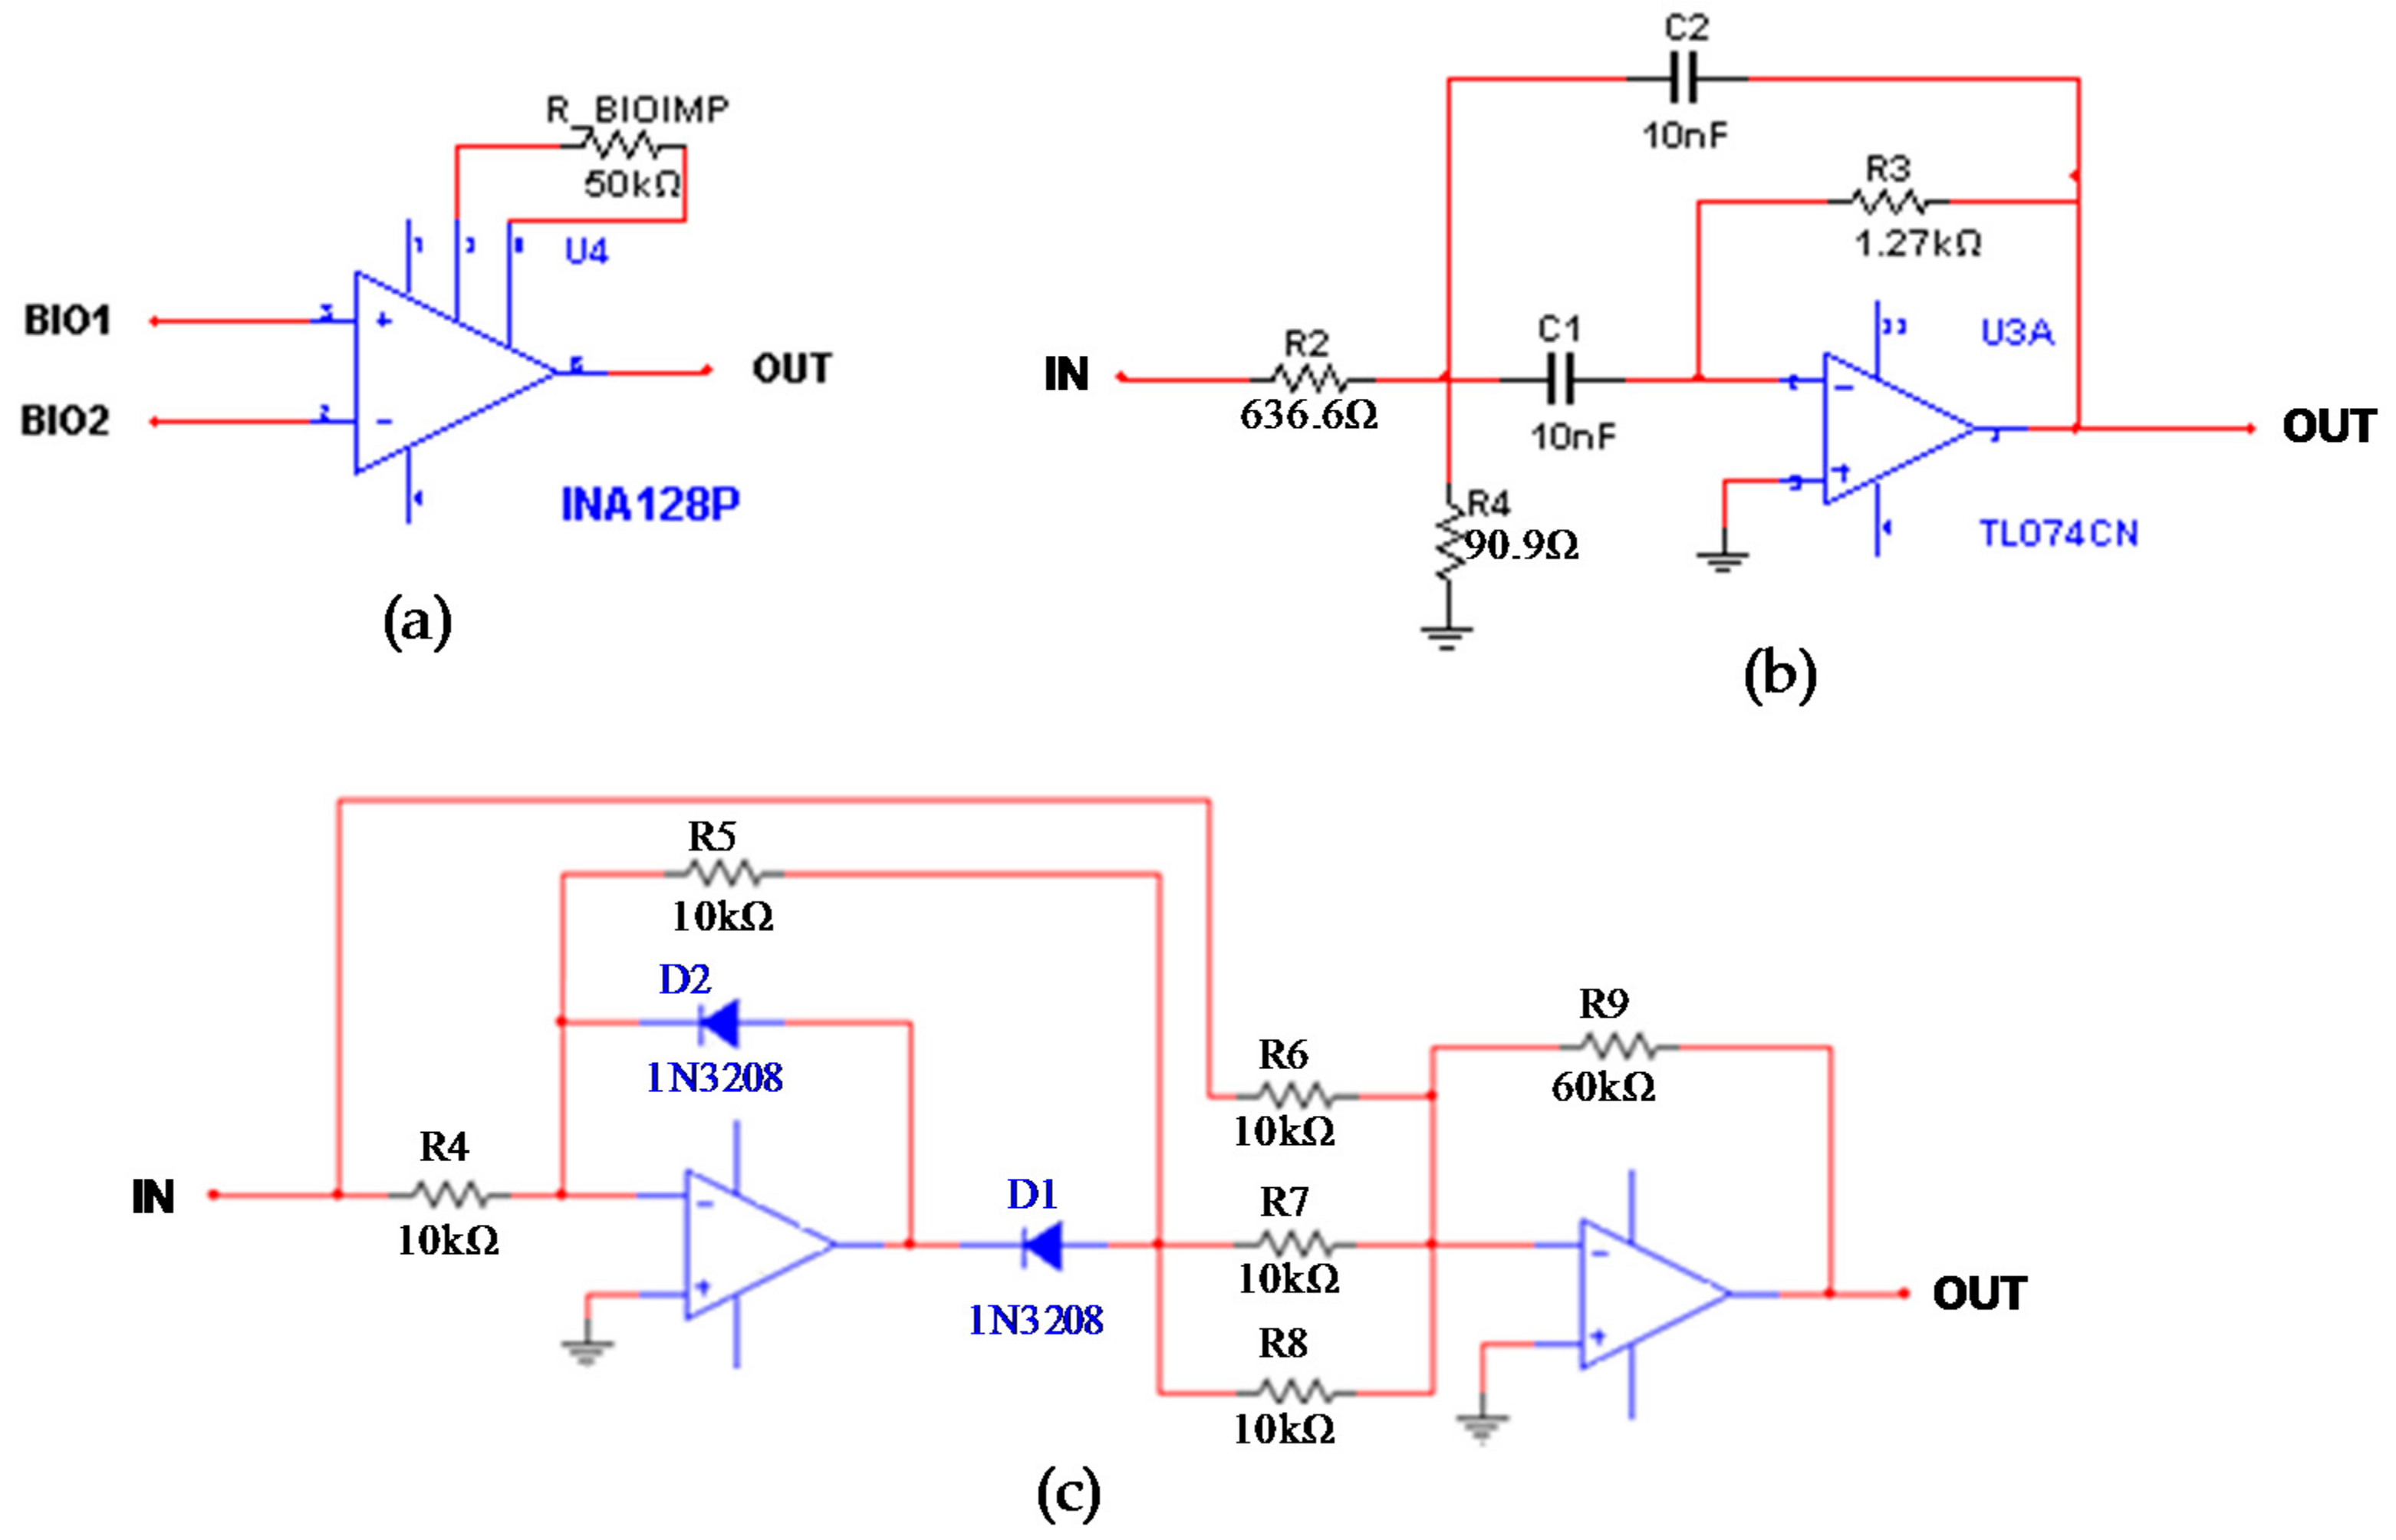
Stage 1: this stage obtains the voltage signal from the electrodes connected to the skin, in which the 800 μA current flows. An amplification with the INA128P was performed: G = 2 V/V, R_BIOIMP = 50 kΩ (see Figure 14a).
Stage 2: The output of the amplifier may have some distortion due to the difference of voltages derived from the voltage sources. Therefore, a second-order narrow-band filter with multiple feedback topology, unity gain (Am = −1), and central frequency of 50 kHz was designed. See Figure 14b.
Capacitors with the same value to facilitate the design were chosen: C1 = C2 = C = 10 nF. For a quality factor of Q = 2, the values of the resistors R2, R3, and R4 are determined.
Stage 3: A precision full wave rectifier was implemented. The circuit of Figure 14c includes a half-wave rectifier with negative output and an inverting summing amplifier with gain of 6 V/V. This stage allows one to adapt the signal for the A/D converter, in order to keep it in the range of 0 to 5 V.
2.6. Control System
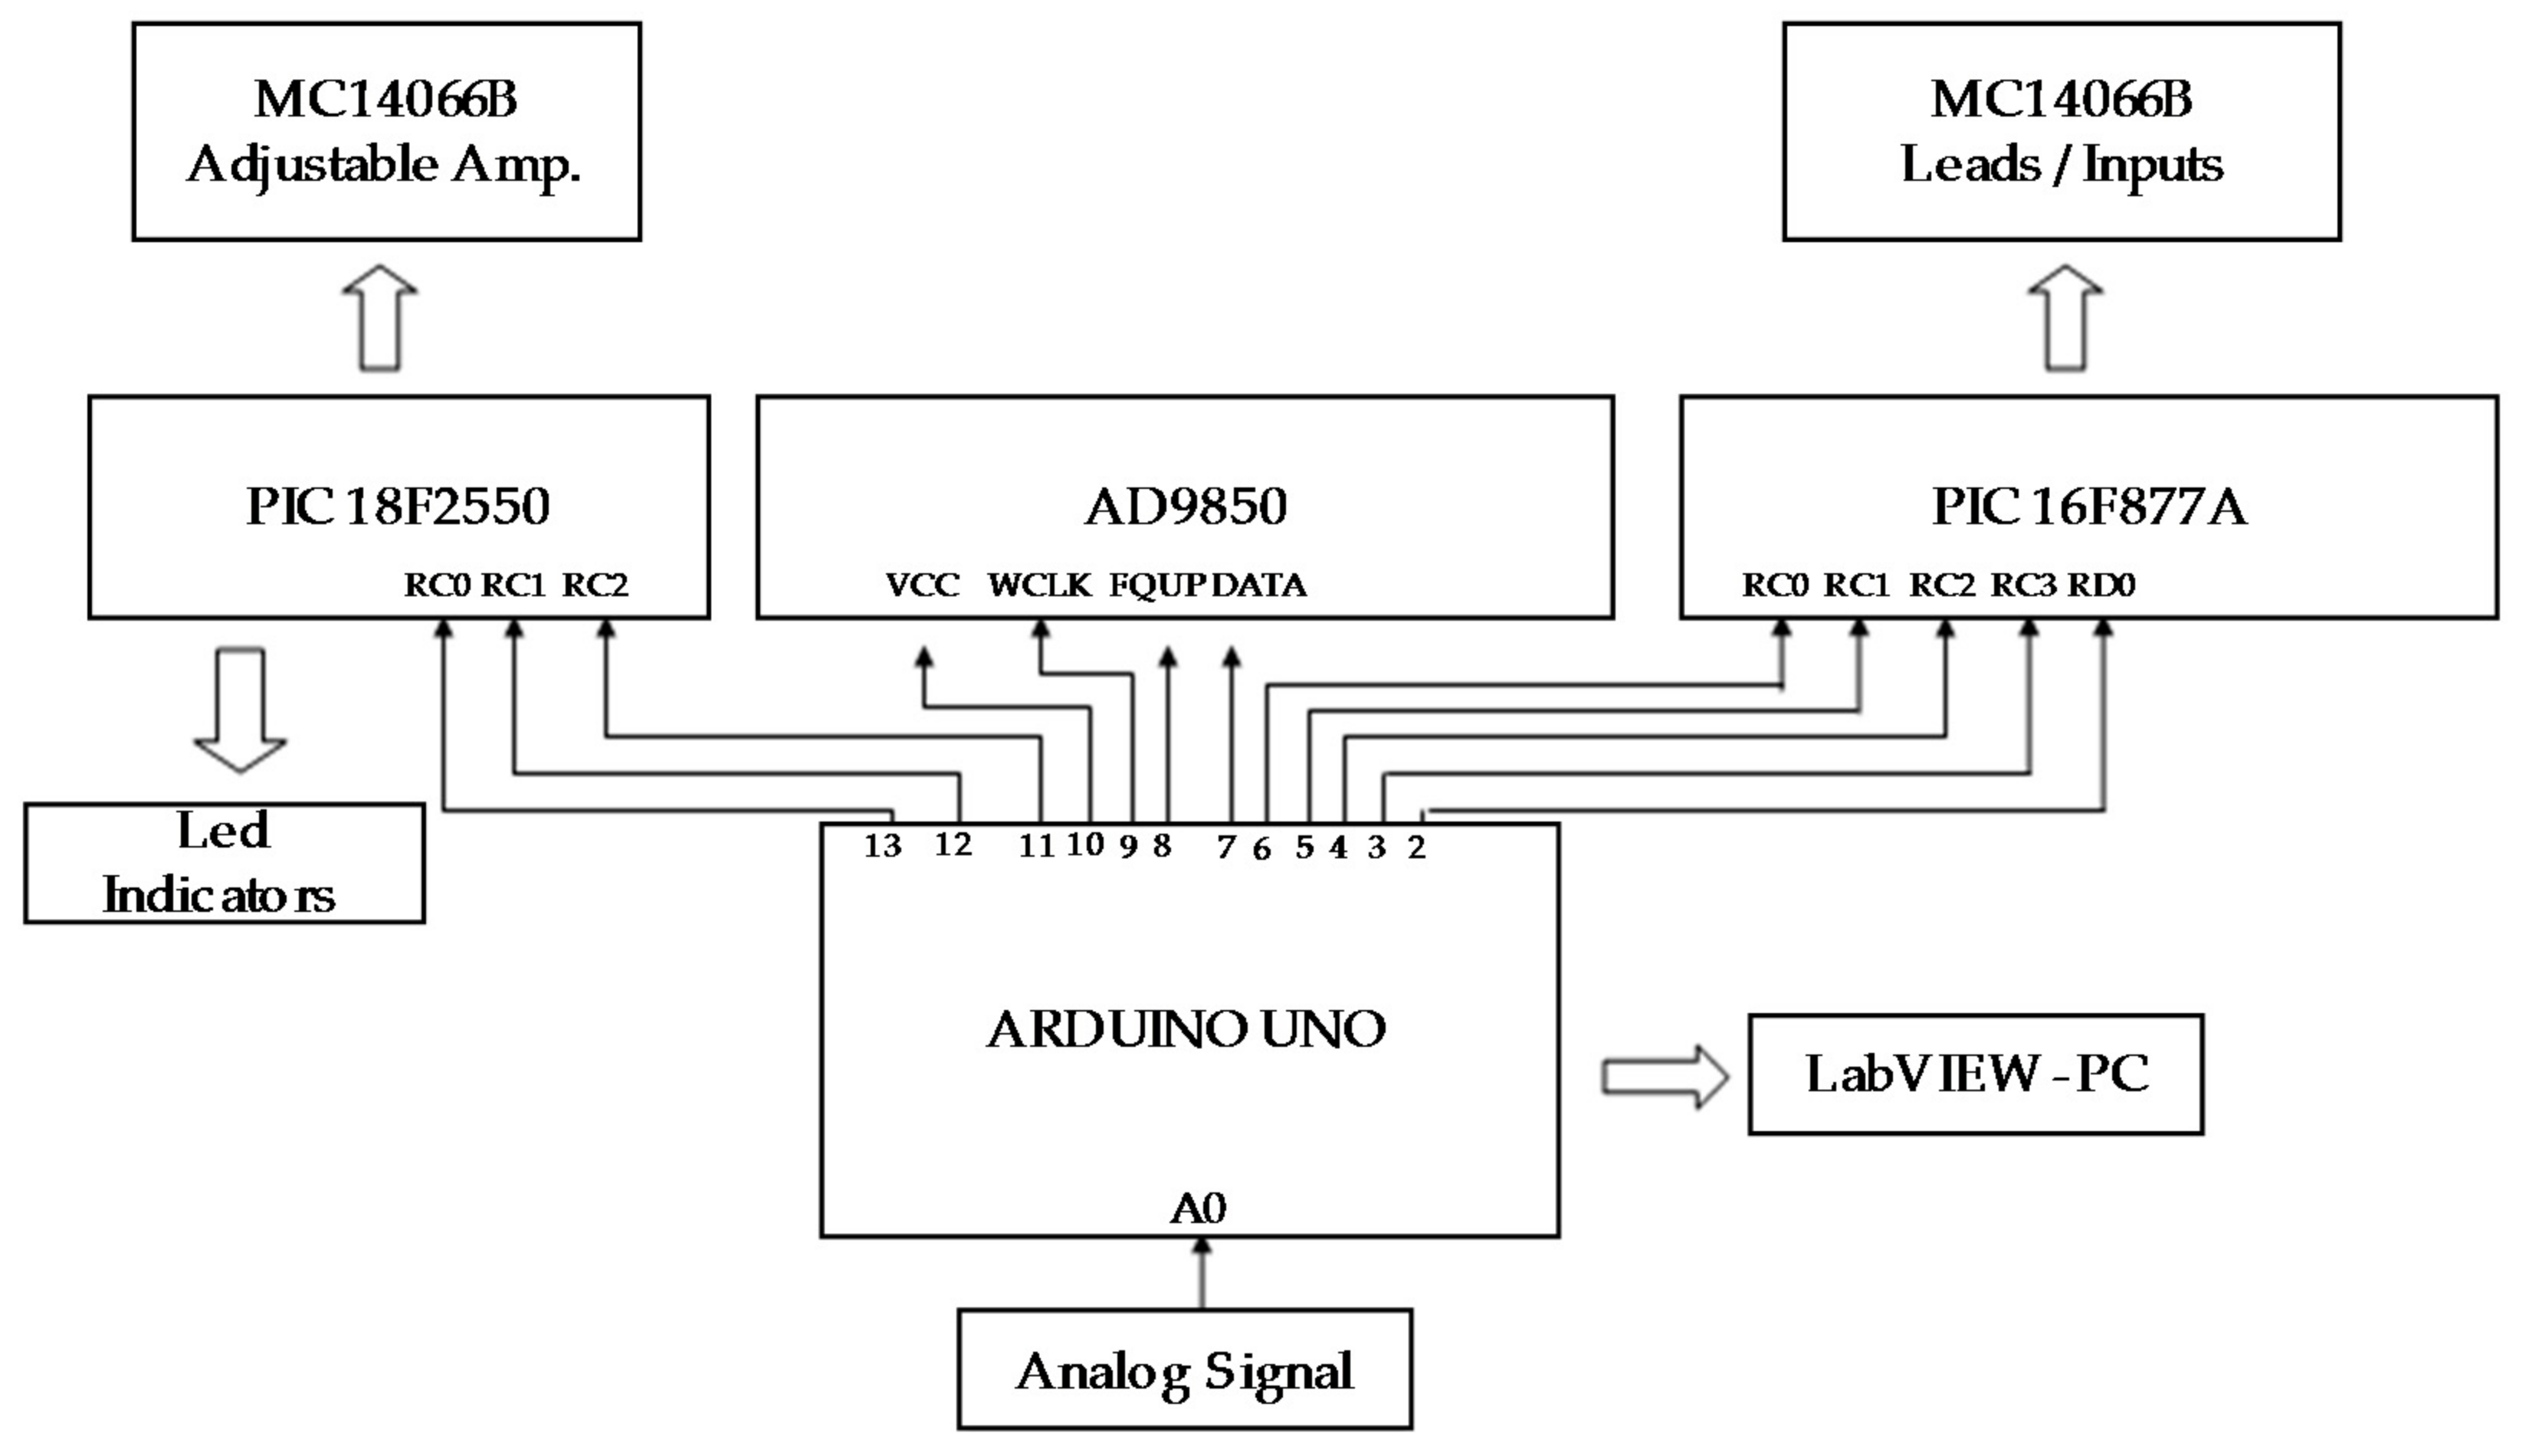
The control system is responsible for controlling the 12 leads of the ECG module, the inputs (IN1, IN2, IN3, and IN4), the adjustable amplification stage, and the signal generator. The control is done through an Arduino Uno board, two microcontrollers (PIC16F877A, PIC182550), and a set of quad analog switches MC14066B. Figure 15 shows the block diagram of the control system.
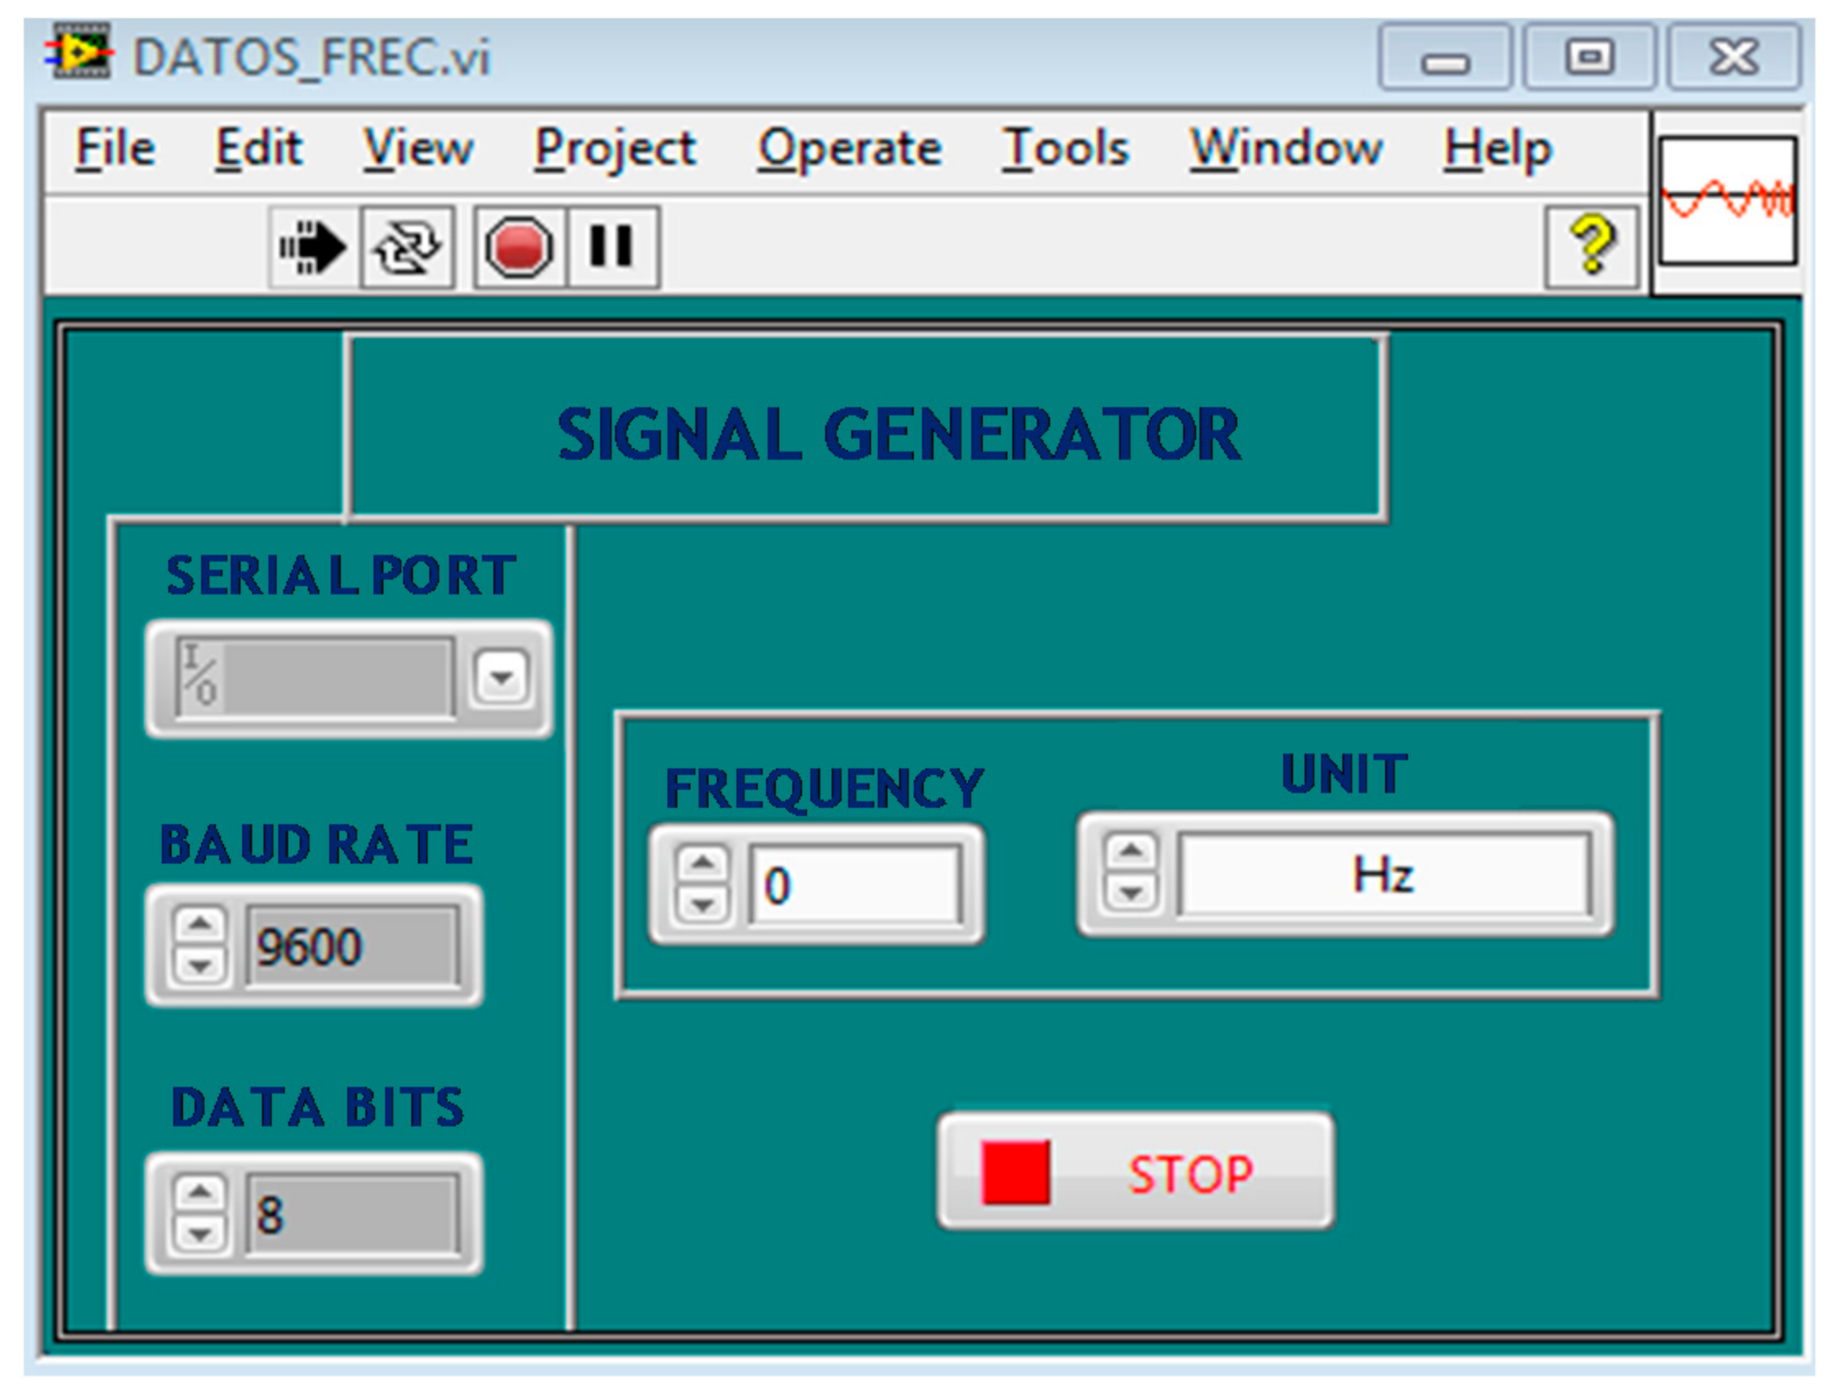
In the case of the signal generator, the integrated device AD9850 was used, through a serial communication with the Arduino Uno board. The user is responsible for sending the desired frequency from the graphical interface developed in LabVIEW; the Arduino receives the code and sends the data to the AD9850.
The Arduino board is the prototype’s central unit [37]; it is responsible for performing the A/D conversion, communicating with LabVIEW, sending the commands to the microcontrollers to activate the switches, and controlling the signal generator. Its specific functions are the following:
- Convert the analog signal.
- Manage communication with LabVIEW.
- Send the control code to select the work module (ECG, EMG, EEG, EOG, Bioimpedance, and Signal Generator) and turn on the LED with the PIC18F2550.
- Send the control code to select the ECG lead type, or the input for the EMG-EEG-EOG modules, using the PIC16F877A.
- Send the code to activate the adjustable amplifier corresponding to the work module, by means of the PIC18F2550.
- Send the code for communication between the AD9850 and LabVIEW.
Control Stage for the Leads and for the Adjustable Gain
The Arduino is responsible for receiving commands from the graphical interface made in LabVIEW. Depending on the type of command received, the Arduino sends a data to the PIC16F877A through the digital pins 2, 3, 4, 5, and 6. The microcontroller receives the data in pins RC0, RC1, RC2, RC3, and RD0. According to the data received, the switches allow for the activation of the lead selected by the user. The PIC16F877A is responsible for controlling the switches to select the ECG leads and the inputs for the EMG, EEG, and EOG modules.
In Table 1, the equations to obtain the 12 leads of the ECG were specified. Based on this table, the switching control with the quad analog switches was designed. Figure 16 shows an example of the switches that must be activated to choose the V1 precordial lead: (S34, S11, S13, S14, S12, and S74).
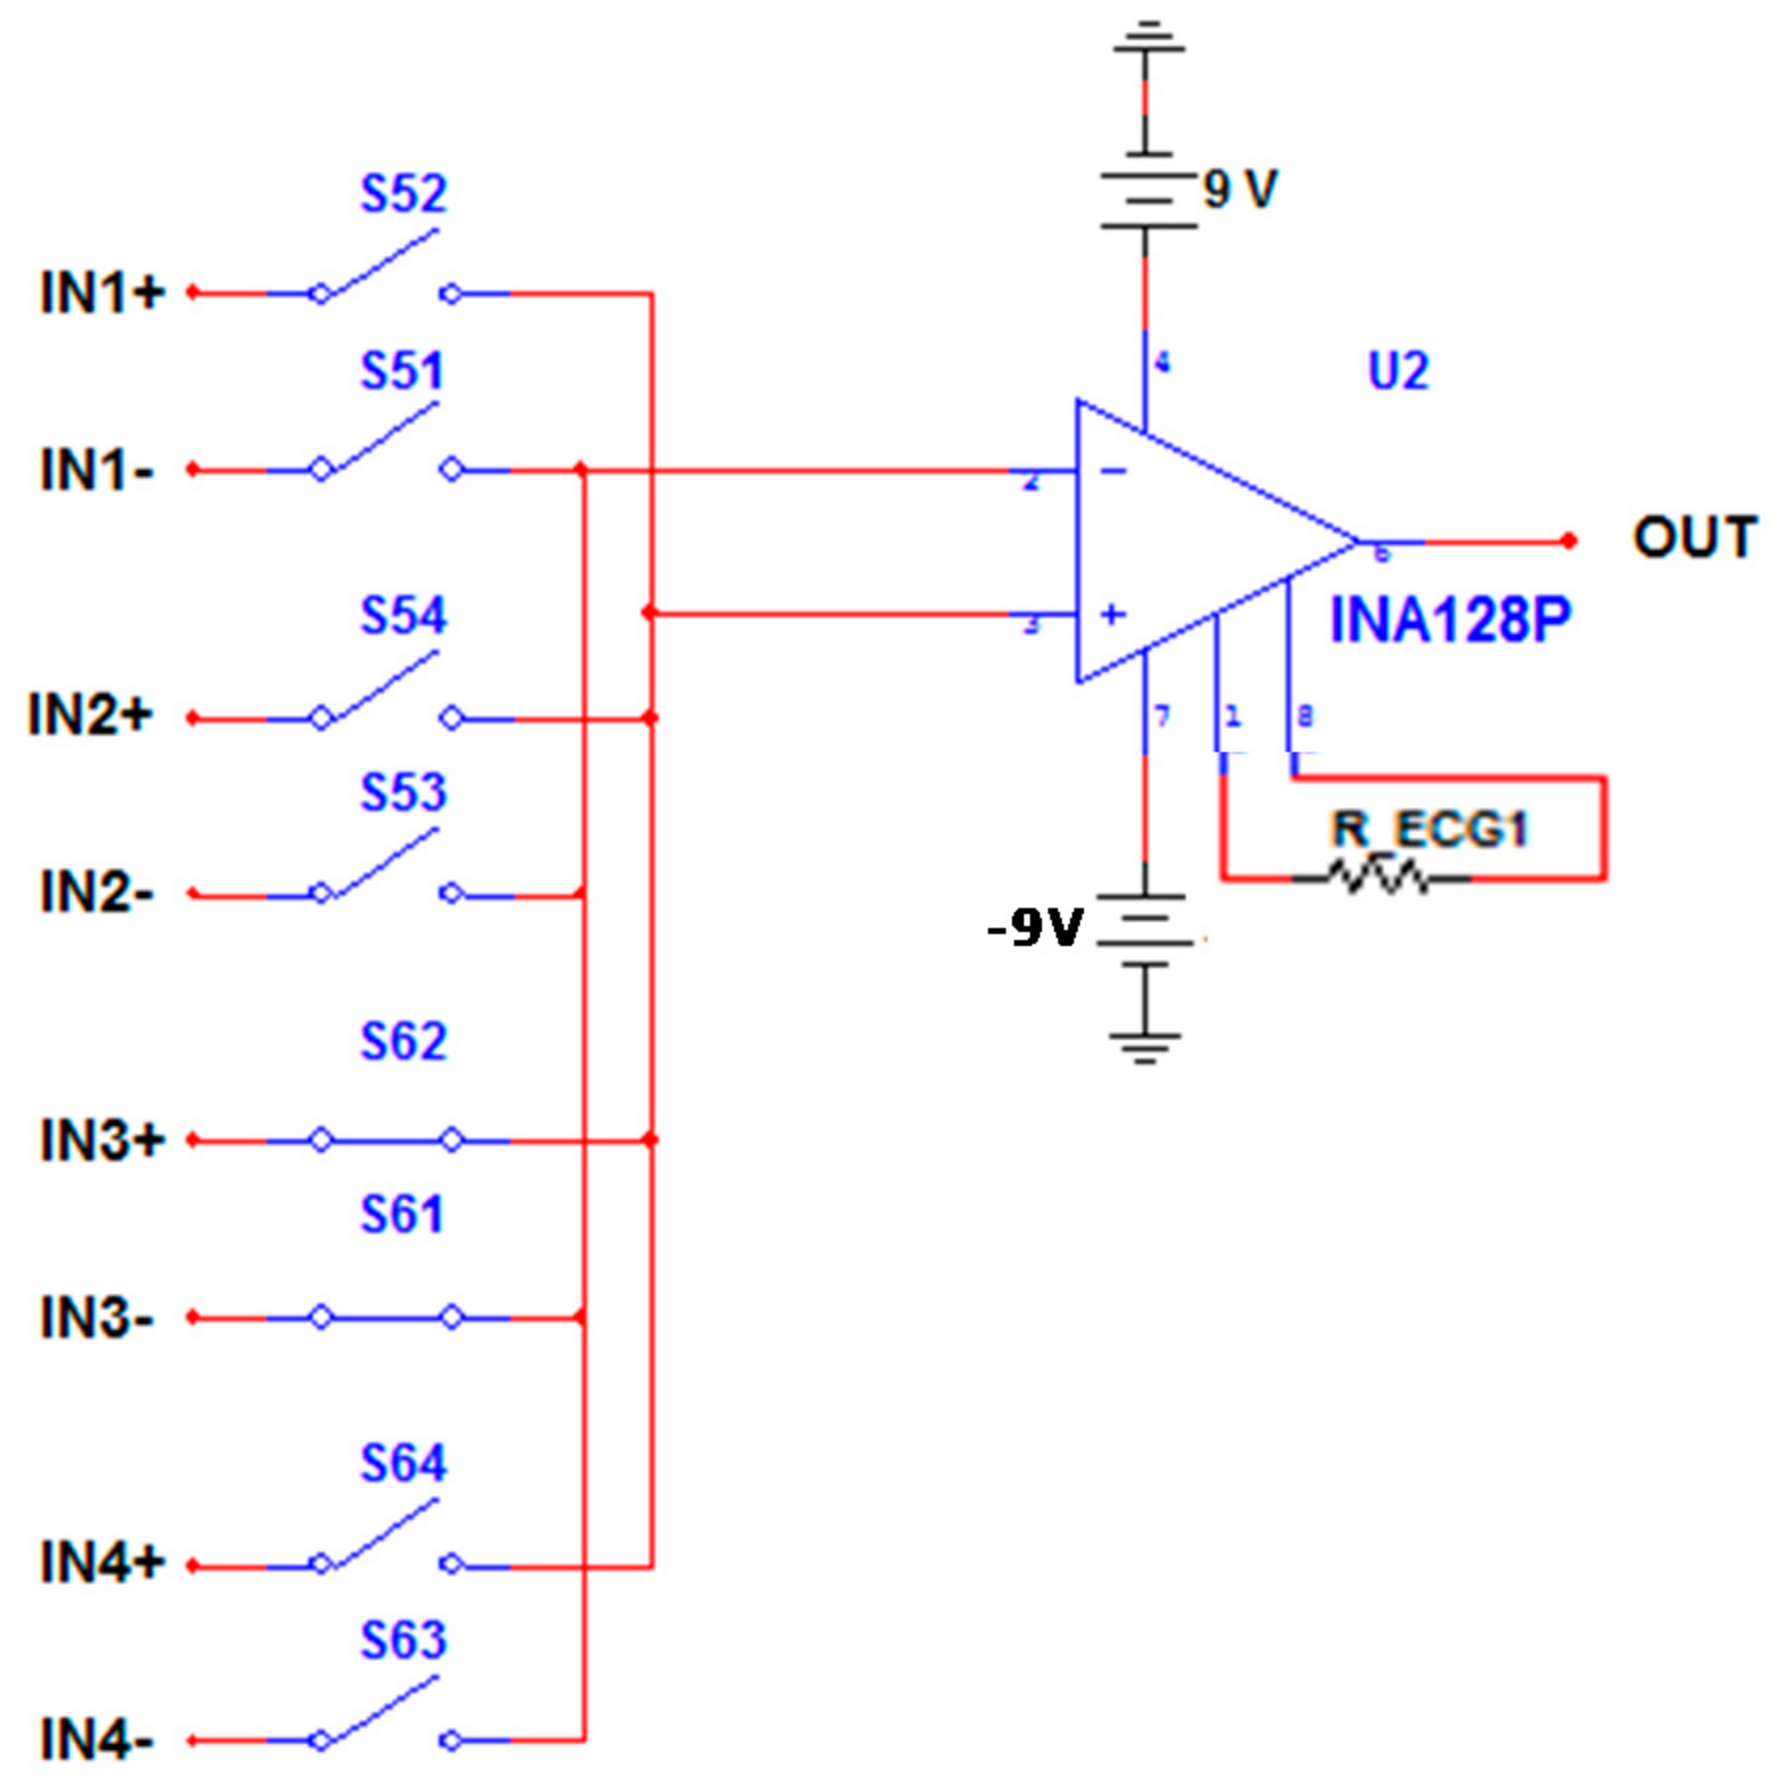
In the same way, it happens with the selection of the channels. To select channel 3, switches S61 and S62 must be activated. See Figure 17.
The adjustable gain stage for the ECG, EMG, EEG, and EOG modules is carried out with an operational amplifier in a non-inverting configuration. Figure 12 shows the circuit with the switches in series with the feedback resistors; depending on the module to be used, the corresponding switch is activated. These switches are activated by the PIC18F2550 on pins RB0, RC6, and RC7. The PIC18F2550 is responsible for activating the switches that correspond to the final amplification and turning on the LED’s of the modules.
2.7. Graphical Interface in LabVIEW
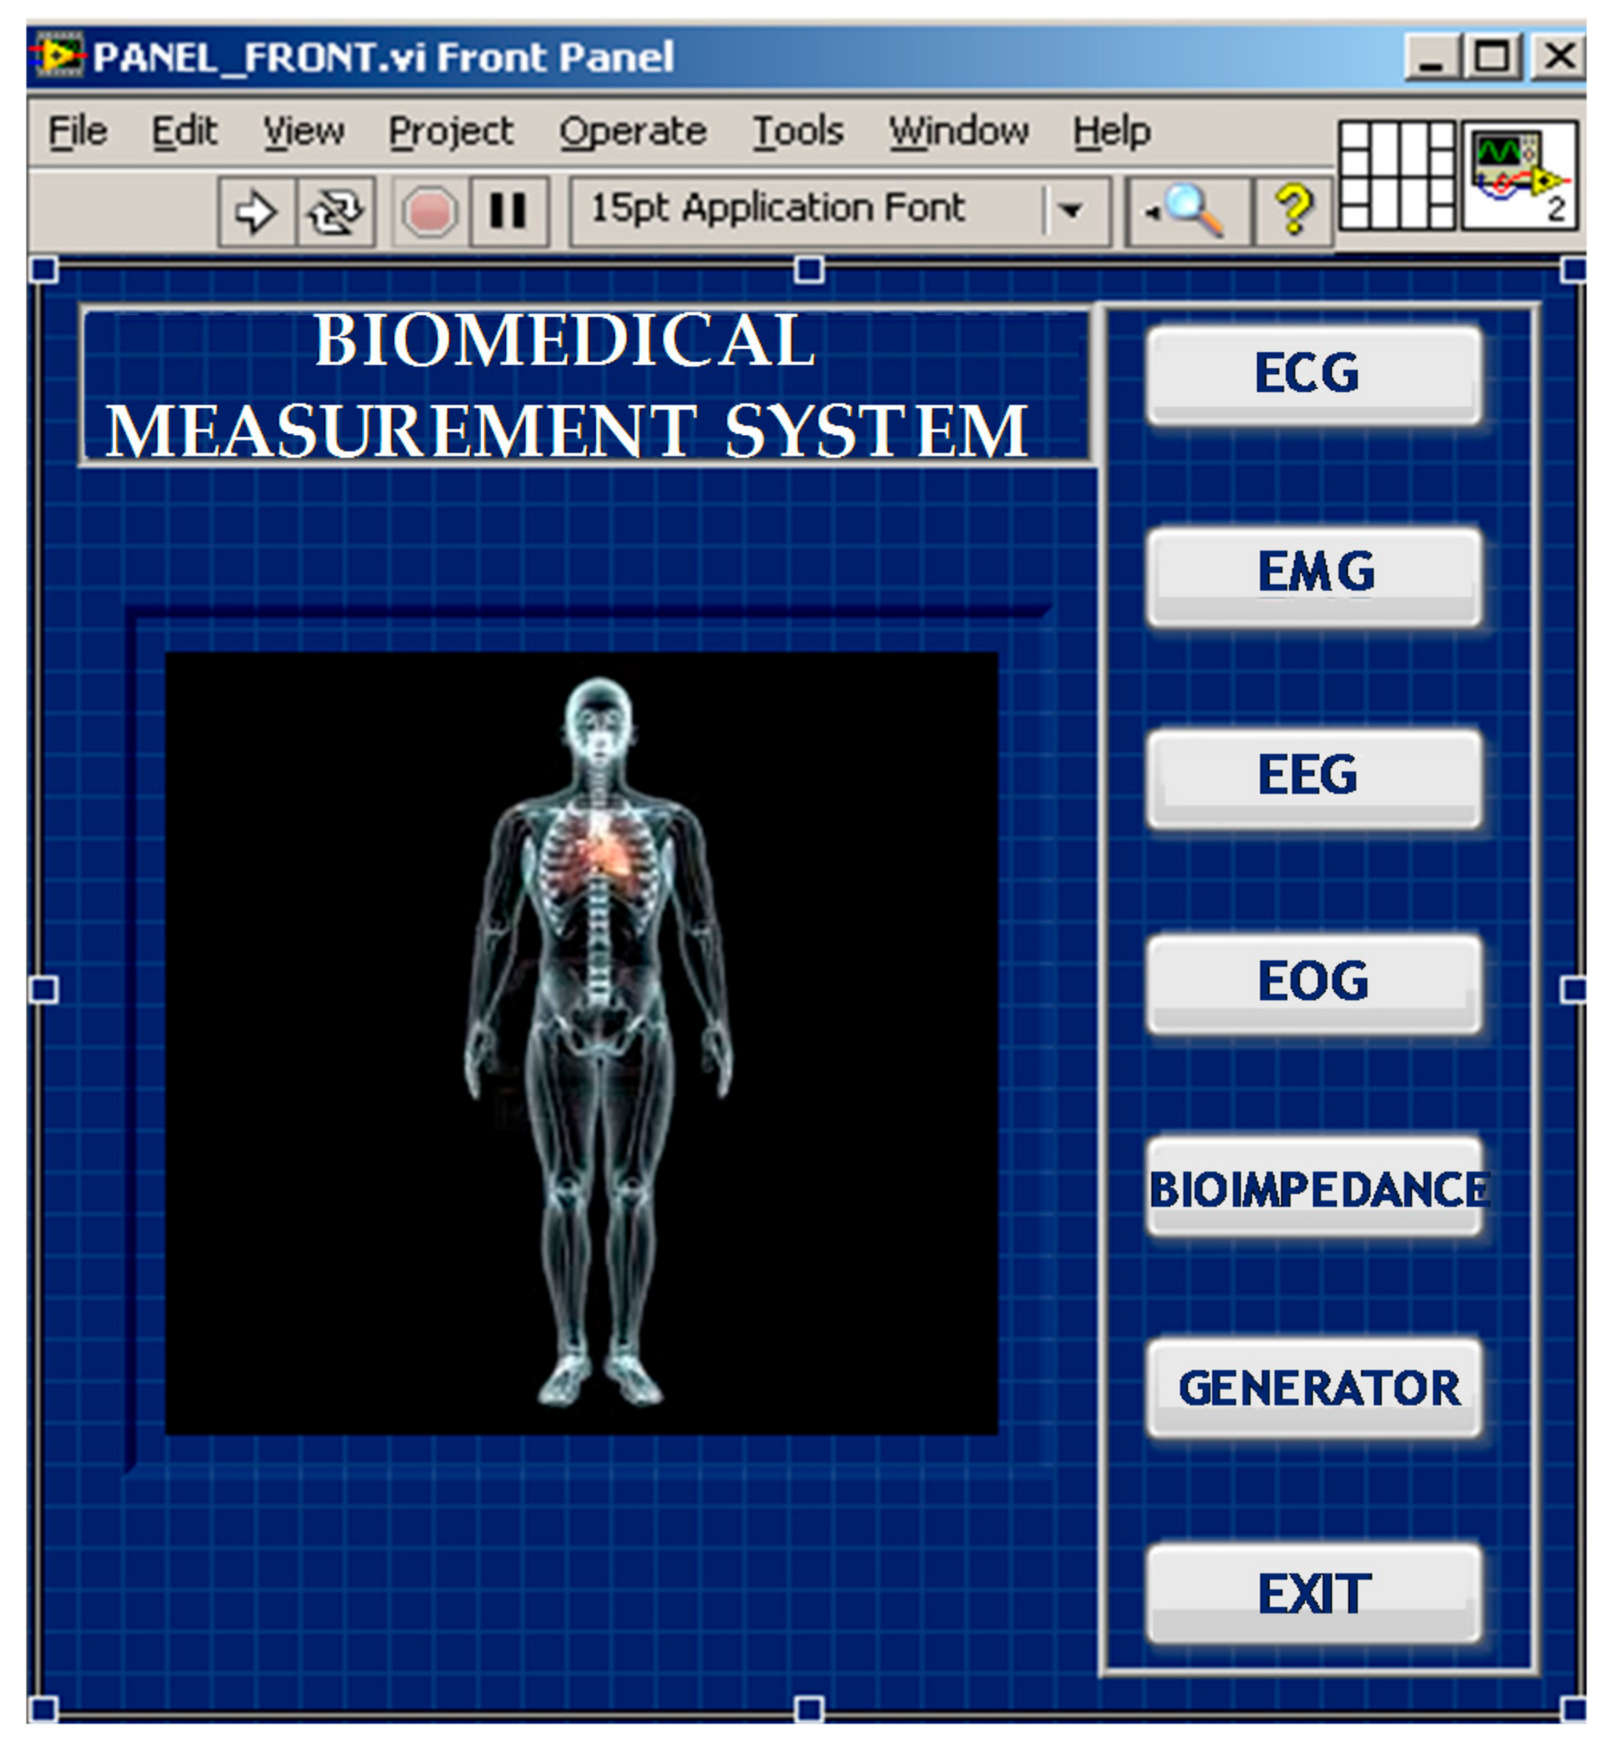
Figure 18 shows the graphical interface of the project, which consists of seven buttons: five that correspond to the measurement modules, one for the signal generator, and one for the exit function, which allows the interface to be closed. When a button is pressed, a window corresponding to the chosen module is opened.
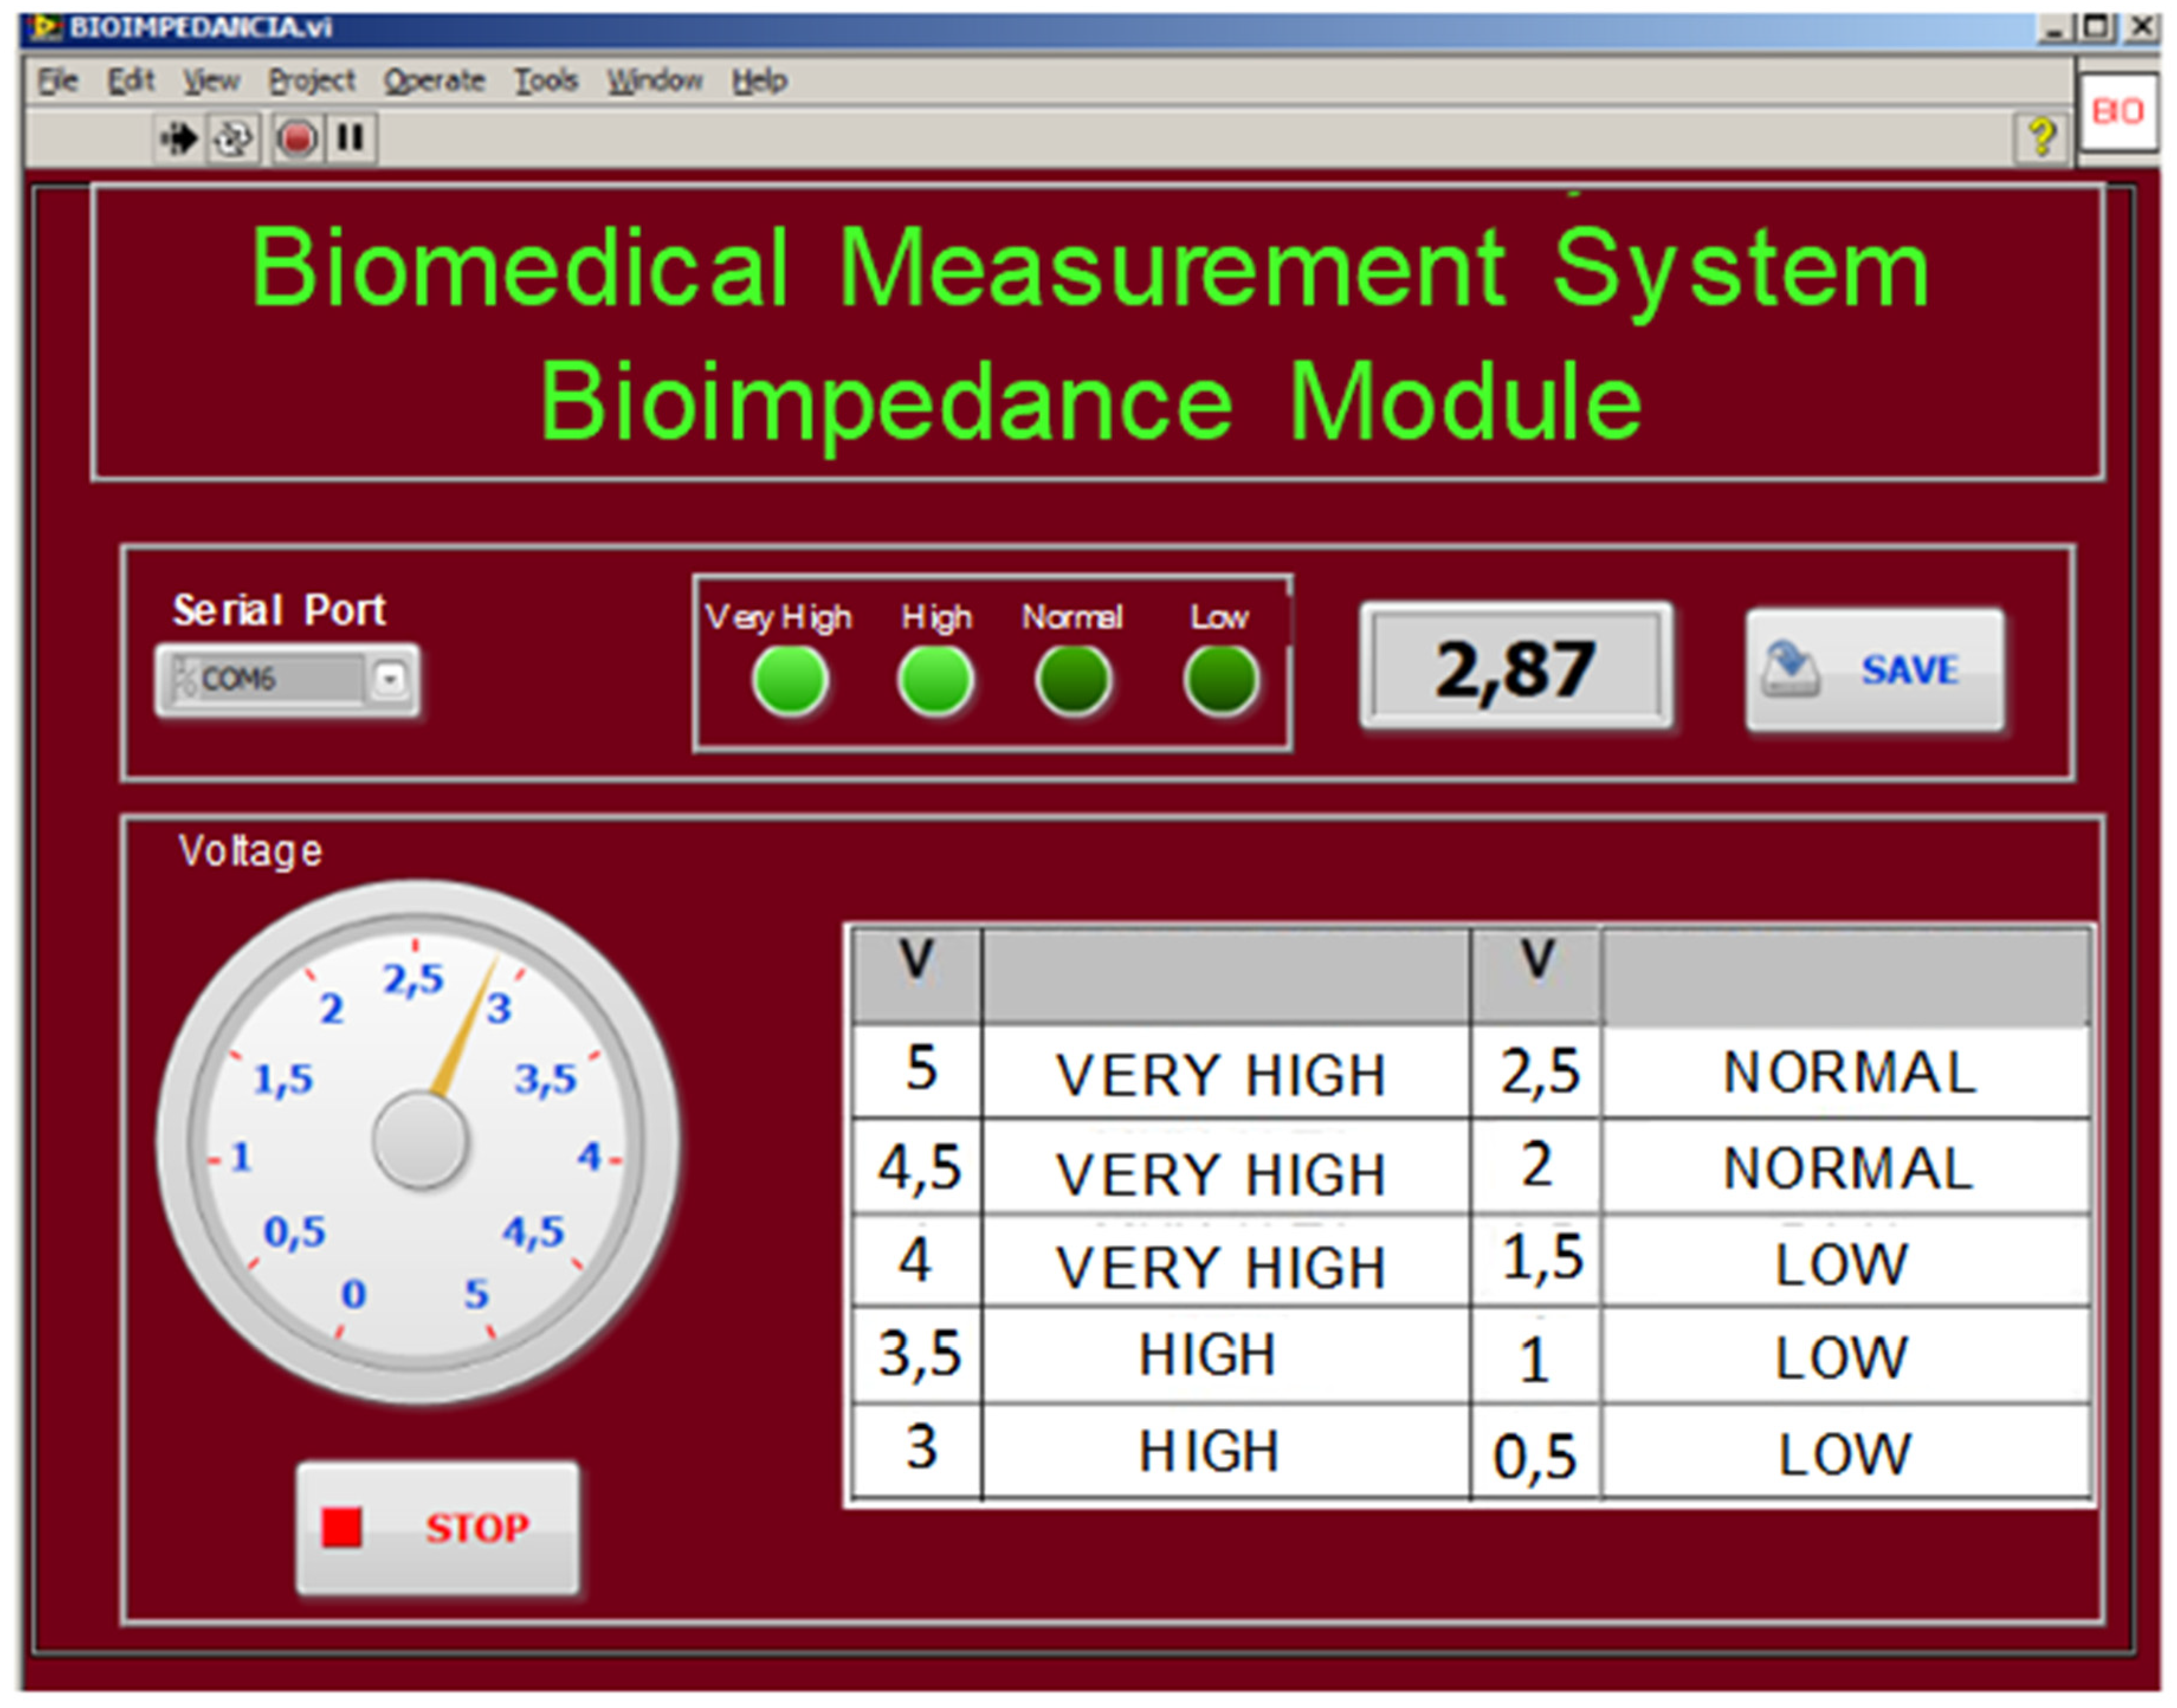
In general, the graphical interfaces of all the modules have the configuration options and a visualization window that allows one to observe in the time domain the biomedical signal that is being measured. Additionally, the bioimpedance interface has a calibration table to relate the output voltage to the bioimpedance level. In the results section, the interfaces of each of the modules will be presented.
On the other hand, the interface of the signal generator is composed of controls for frequency selection and to configure serial communication. See Figure 19.
3. Results
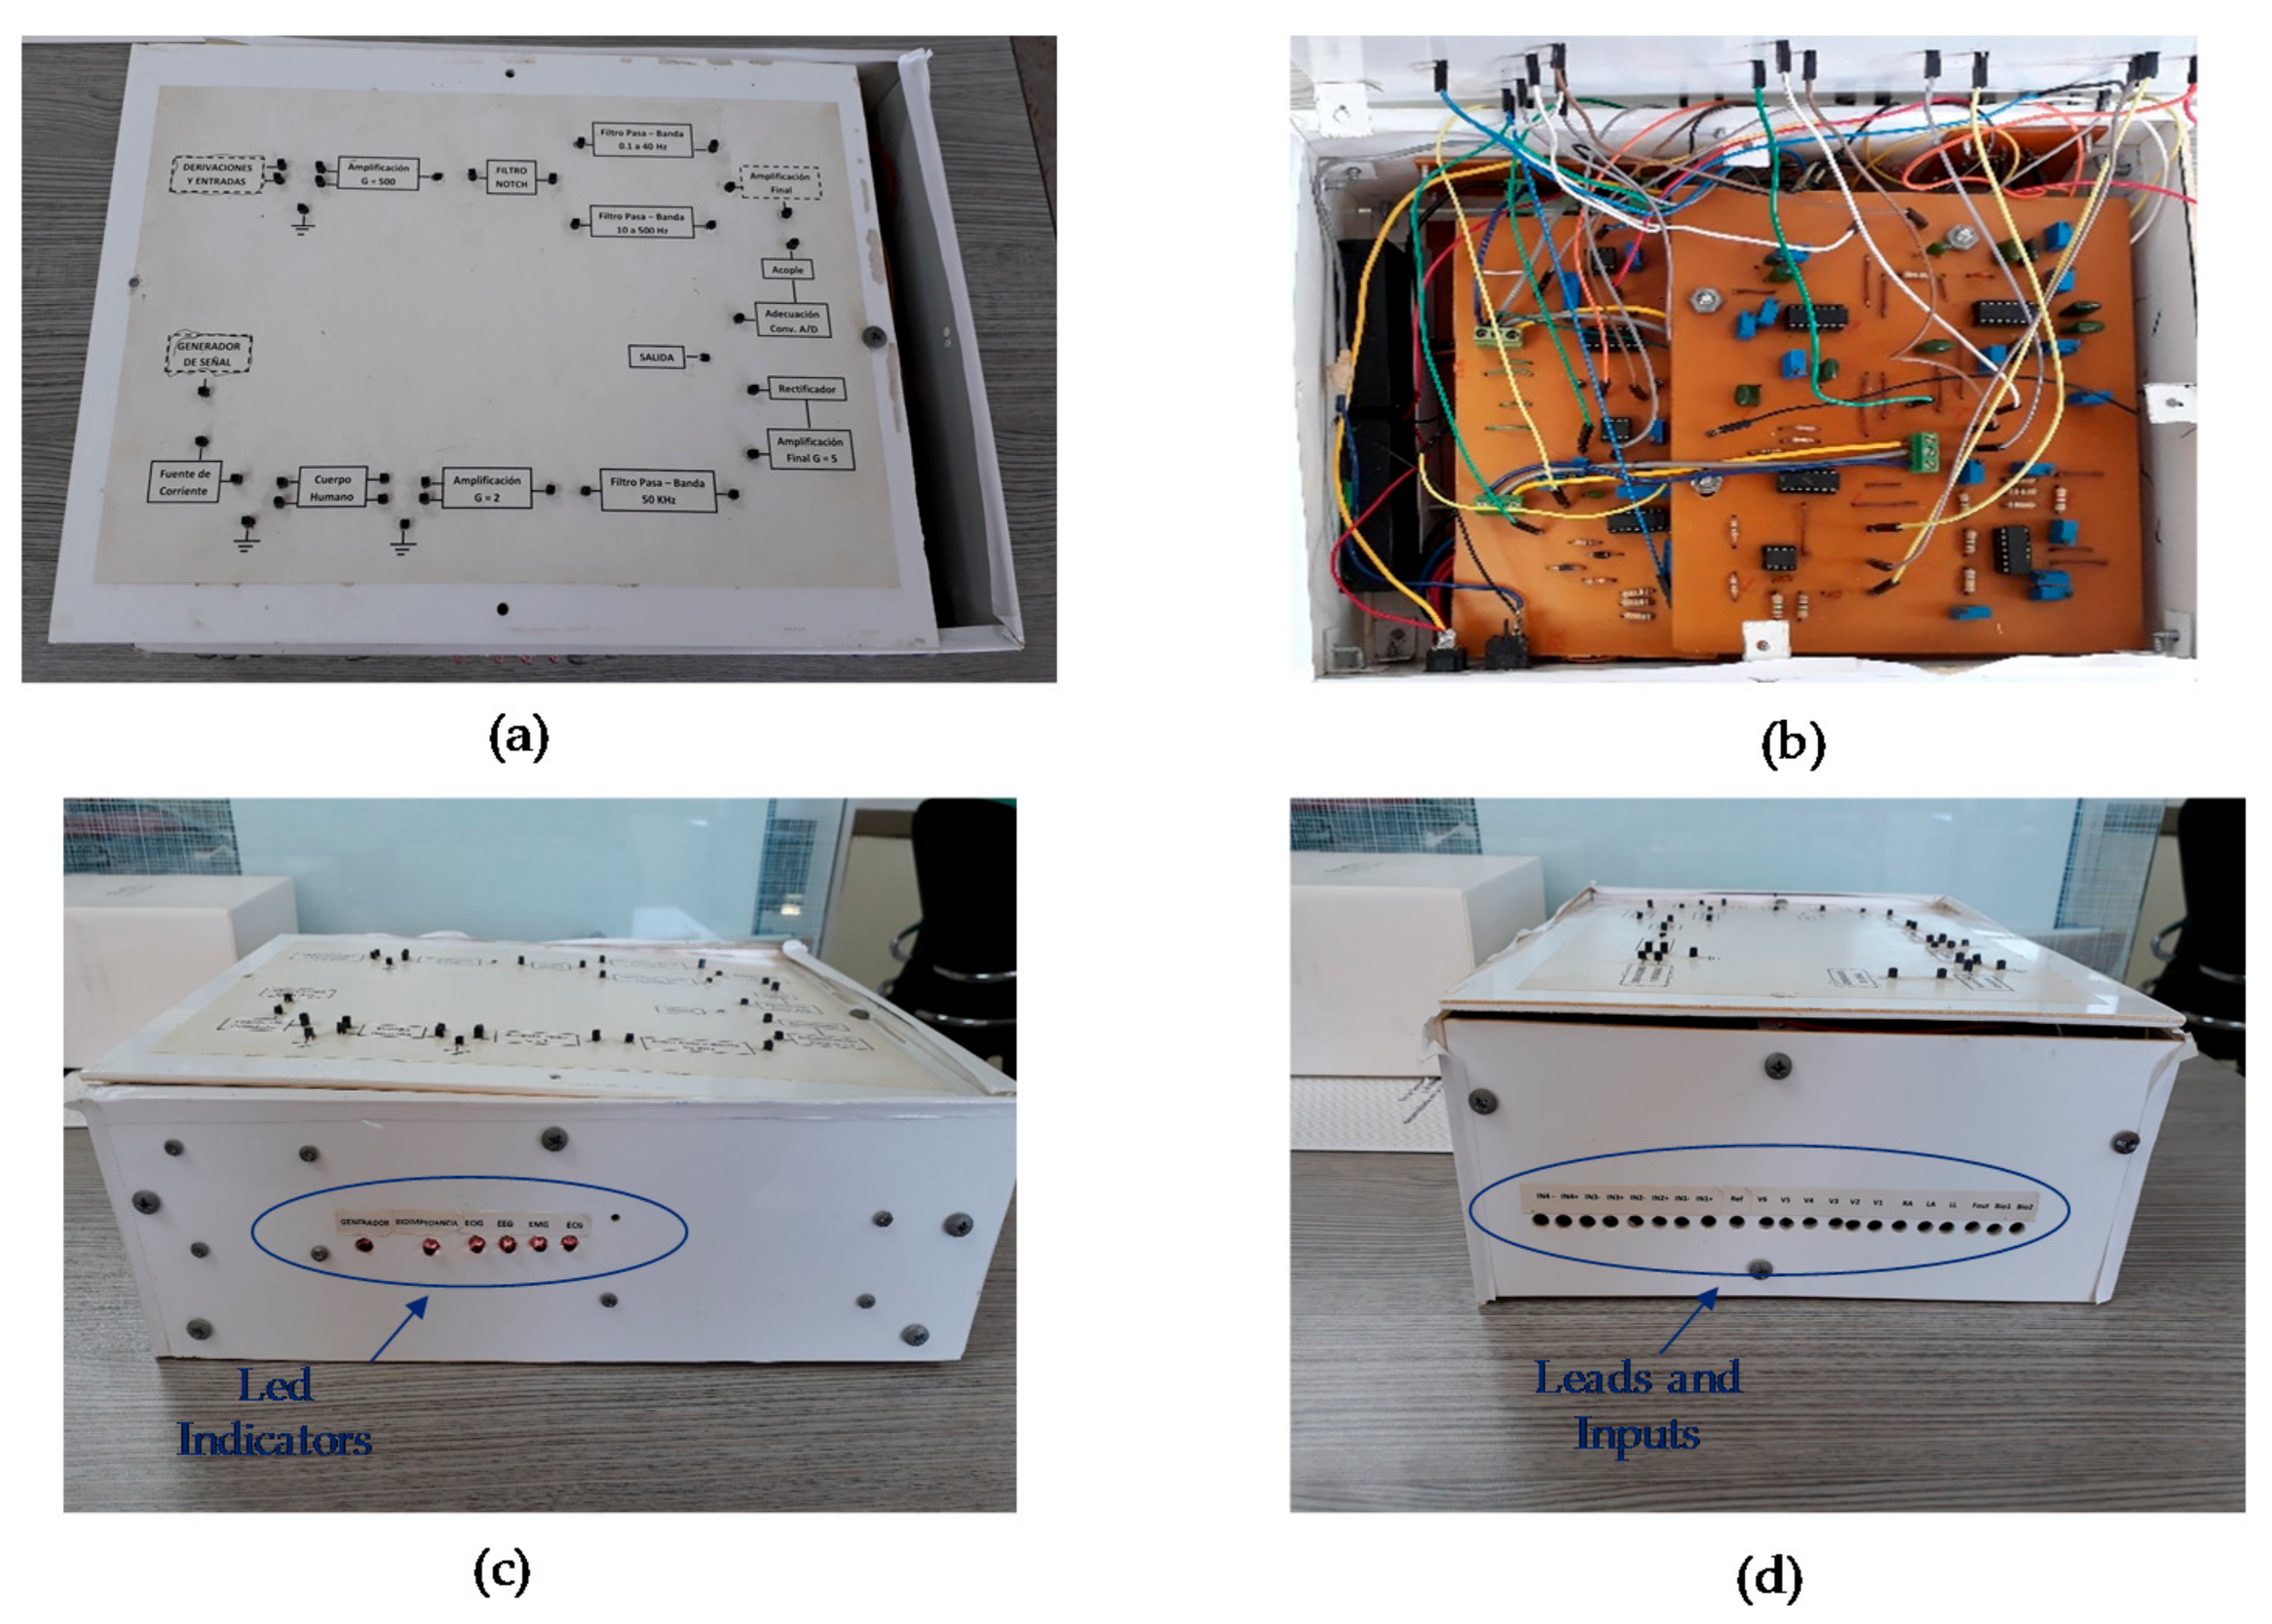
It was possible to implement a biomedical measurement system capable of acquiring, processing, and visualizing the ECG, EMG, EEG, and EOG signals, as well as measuring the bioimpedance in the skin. The device is composed of the following elements (see Figure 20).
- On/Off switch.
- Analog inputs: 10 Inputs for the ECG module: RA (Right Arm), LA (Left Arm), RL (Right Leg), LL (Left Leg), V1-V2-V3-V4-V5-V6 (Precordial Inputs), and REF (Reference Electrode).
- Four channels for the EMG, EEG, and EOG signals: IN1+, IN1− (Input IN1), IN2+, IN2− (Input IN2), IN3+, IN3− (Input IN3), IN4+, and IN4− (Input IN4).
- Three inputs for the bioimpedance module: Fout, BIO1, and BIO2.
- USB communication port.
- Indicator LEDs for the modules and signal generator.
- Terminals for the connection of the stages.
The prototype allows didactically to verify the operation of the stages that make up the modules through a set of terminals that can be seen in Figure 20a. In this way, before evaluating the performance of each module, the operation of each of the stages was verified using the NI myDAQ portable data acquisition device.
To evaluate the 500 V/V gain stage implemented with the INA128, a 10 mVp-p sinusoidal signal with a frequency of 100 Hz was used. For the gain stages implemented with the TL074, a sinusoidal signal of 1 Vp-p and 100 Hz was used.
For the stages of the filters, a 1 Vp-p sinusoidal signal with variable frequency was used, in order to establish the experimental cutoff frequencies. In relation to the bioimpedance module, a 2 kΩ load resistance to verify the operation of the voltage controlled current source was used. Table 3 shows the experimental results obtained for each of the stages, which agree with the theoretical values.
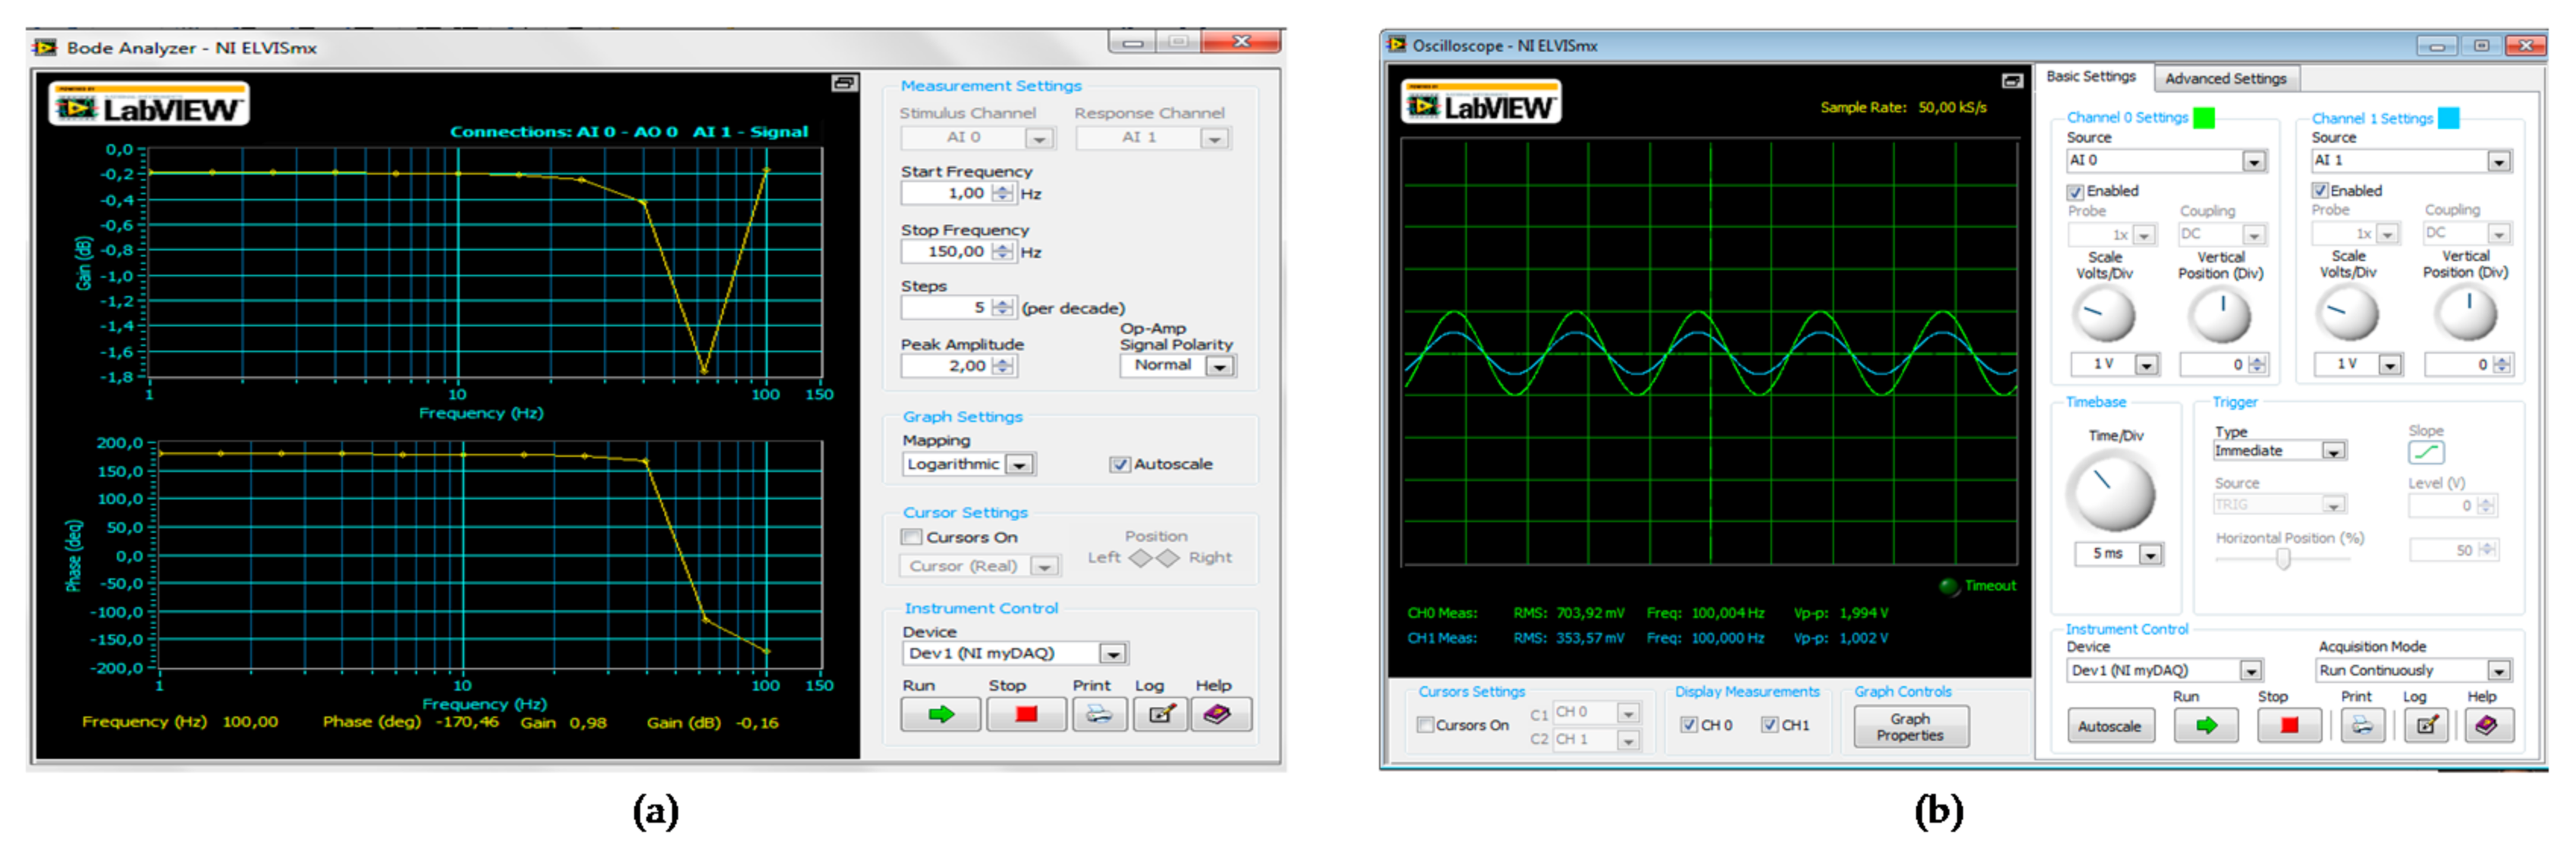
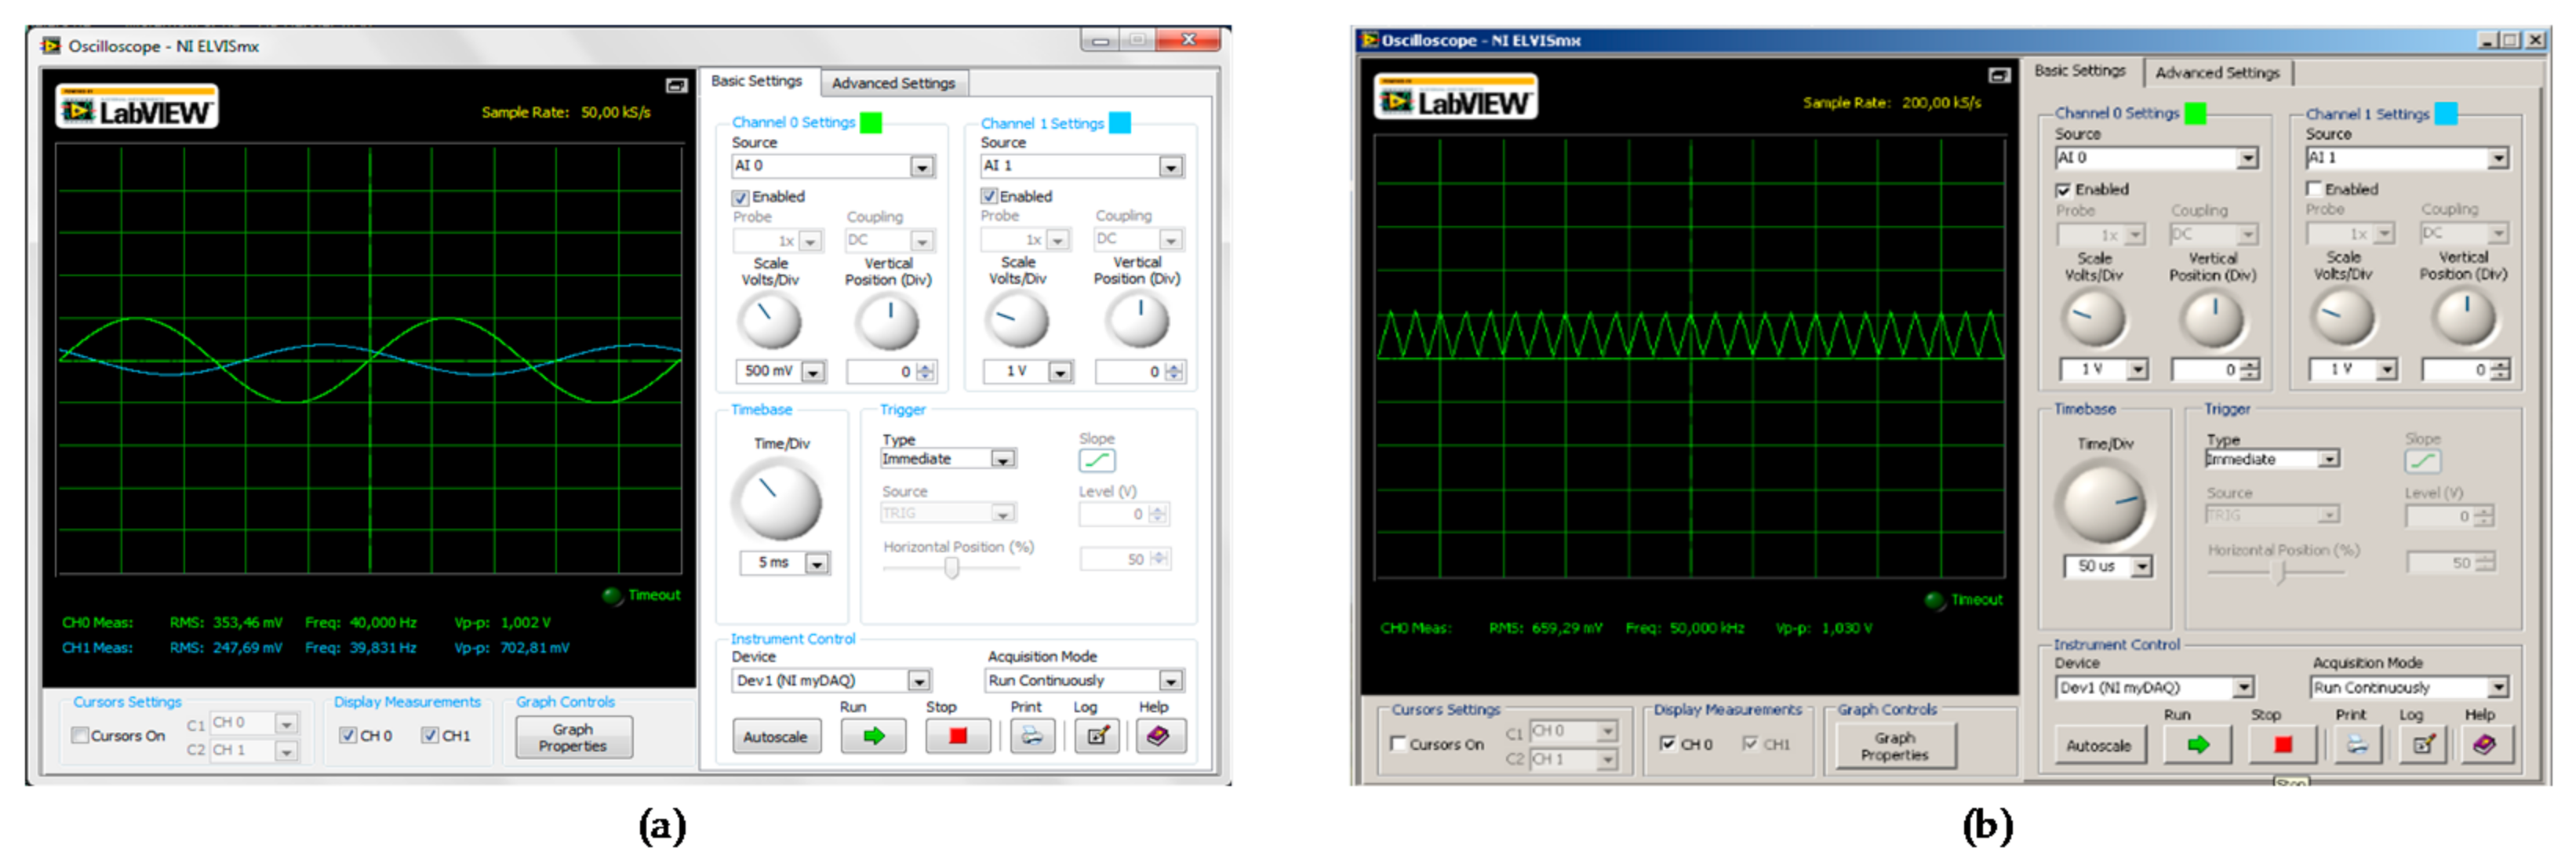
With the NI myDAQ portable data acquisition device, it was possible to verify the modular approach of the prototype, which allows students to understand the operation of each of the stages of the modules. Figure 21 and Figure 22 show the results obtained for some stages: Notch filter, gain stage of 4, low pass filter of 40 Hz, and signal generator stage. By analyzing these types of figures, students can contrast the experimental results with the theoretical data.
Next, the results obtained for each of the modules implemented will be presented. For the ECG, EEG, EOG, and EMG modules, tests were performed with a male subject of 23 years, with a height of 1.76 m and a weight of 76 kg who exercised frequently. Before performing the tests, the subject signed an informed consent that was reviewed by the ethics committee of Universidad del Magdalena. In Colombia, informed consent is defined as the free acceptance by a patient of a diagnostic or therapeutic act after having properly communicated their clinical situation.
For the tests of the modules, the subjects should not use metallic jewelry and should sit comfortably. In the case of the EMG module, bend the elbow to 90° with the palm facing upwards.
In relation to the experiment with the bioimpedance module, this experiment involves the application of electrical stimuli through the electrodes located in the skin. People who have a heart pacemaker or who have neurological disorders should not be offered this exercise. The experiment should not exceed 10 min, and the arms should be separated from the thorax at an angle of approximately 30° and the legs separated from each other by 45°. In case of obese people who cannot keep their legs apart, use an insulating material.
3.1. Tests with the ECG and EEG Modules
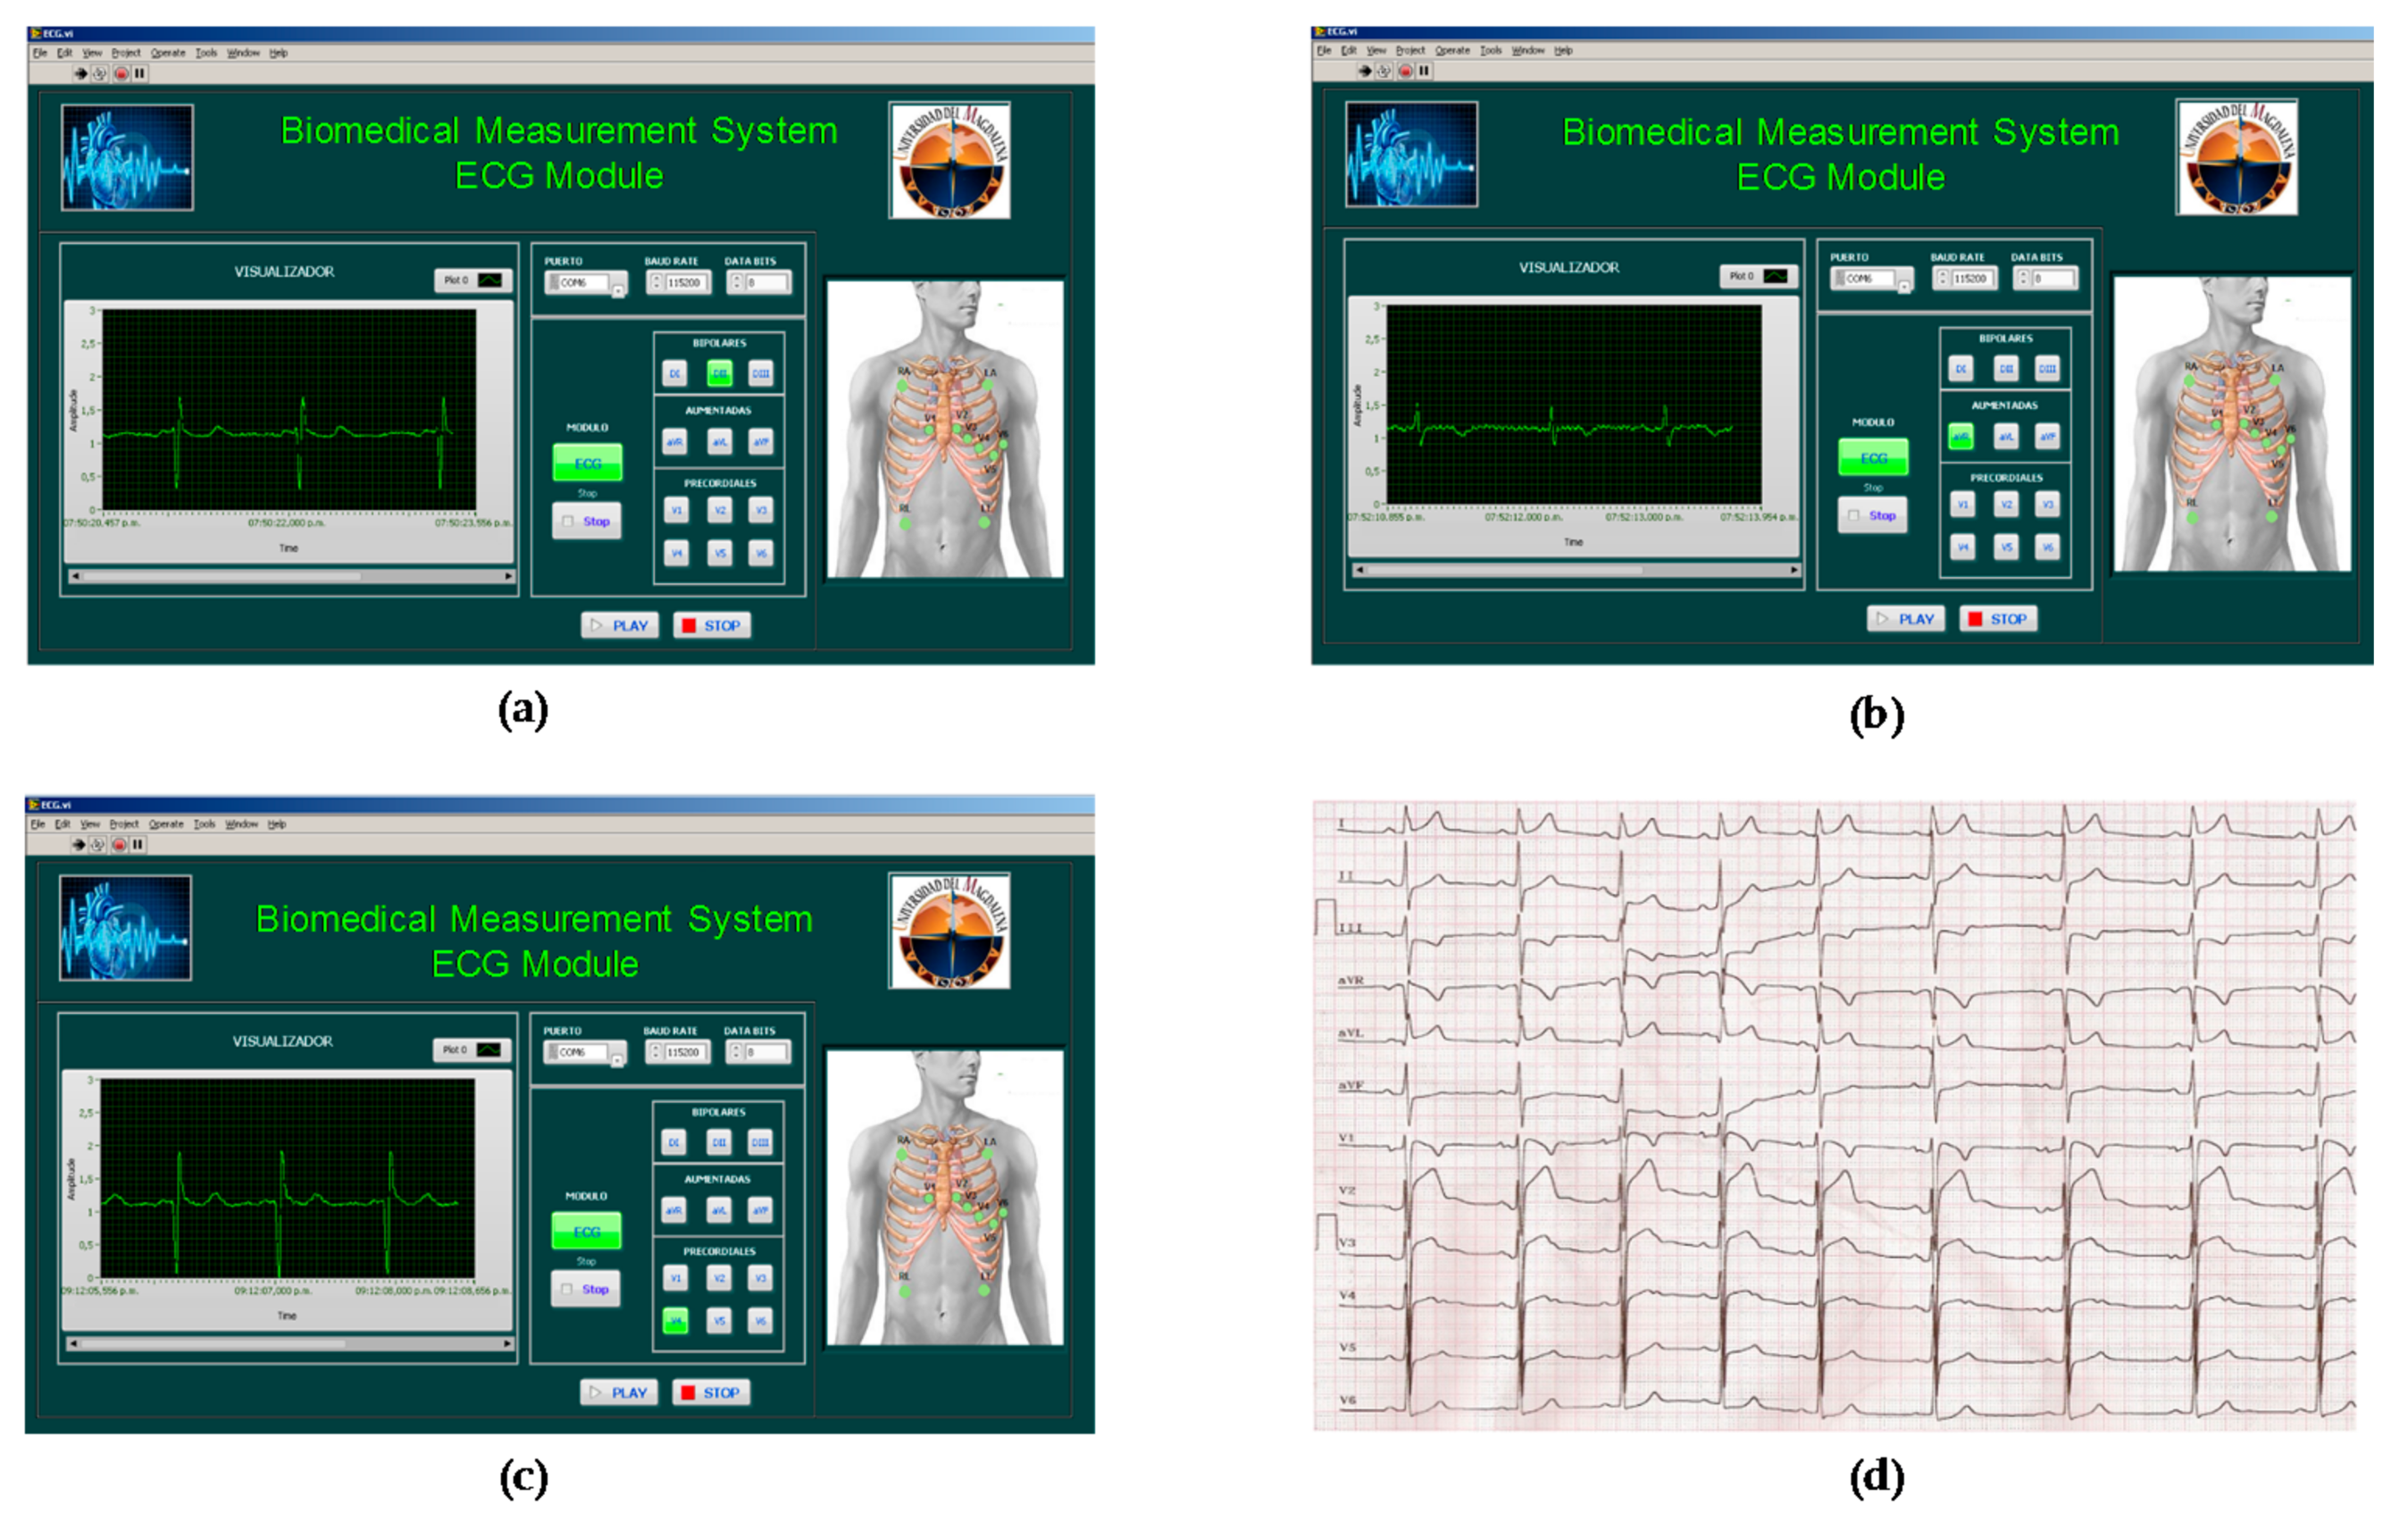
The signals obtained with the ECG module for leads II, aVR, and V4 are shown in Figure 23a–c. Figure 23d shows reference ECG signals of a 30-year-old male subject, who also performs exercise frequently. However, this subject has a family history of sudden death in one of their parents. It can be established that the signals obtained agree with the typical signals of an ECG module. It is to note that all individuals do not present the same wave amplitudes, segments, or intervals. Additionally, the location of the electrodes also significantly affects the waveform.
To evaluate the performance of the EEG module, a bipolar montage with the electrodes located in positions FP1 and FP2 (Frontal Pole) was performed. During the tests, the subject was awake and with normal mental activity. The results obtained for the EEG module are shown in Figure 24a. The normal rhythms obtained in electroencephalography are shown in Figure 24b, in which it can be seen that the signal obtained from the module is similar to the beta wave.
3.2. Tests with the EOG and EMG Modules
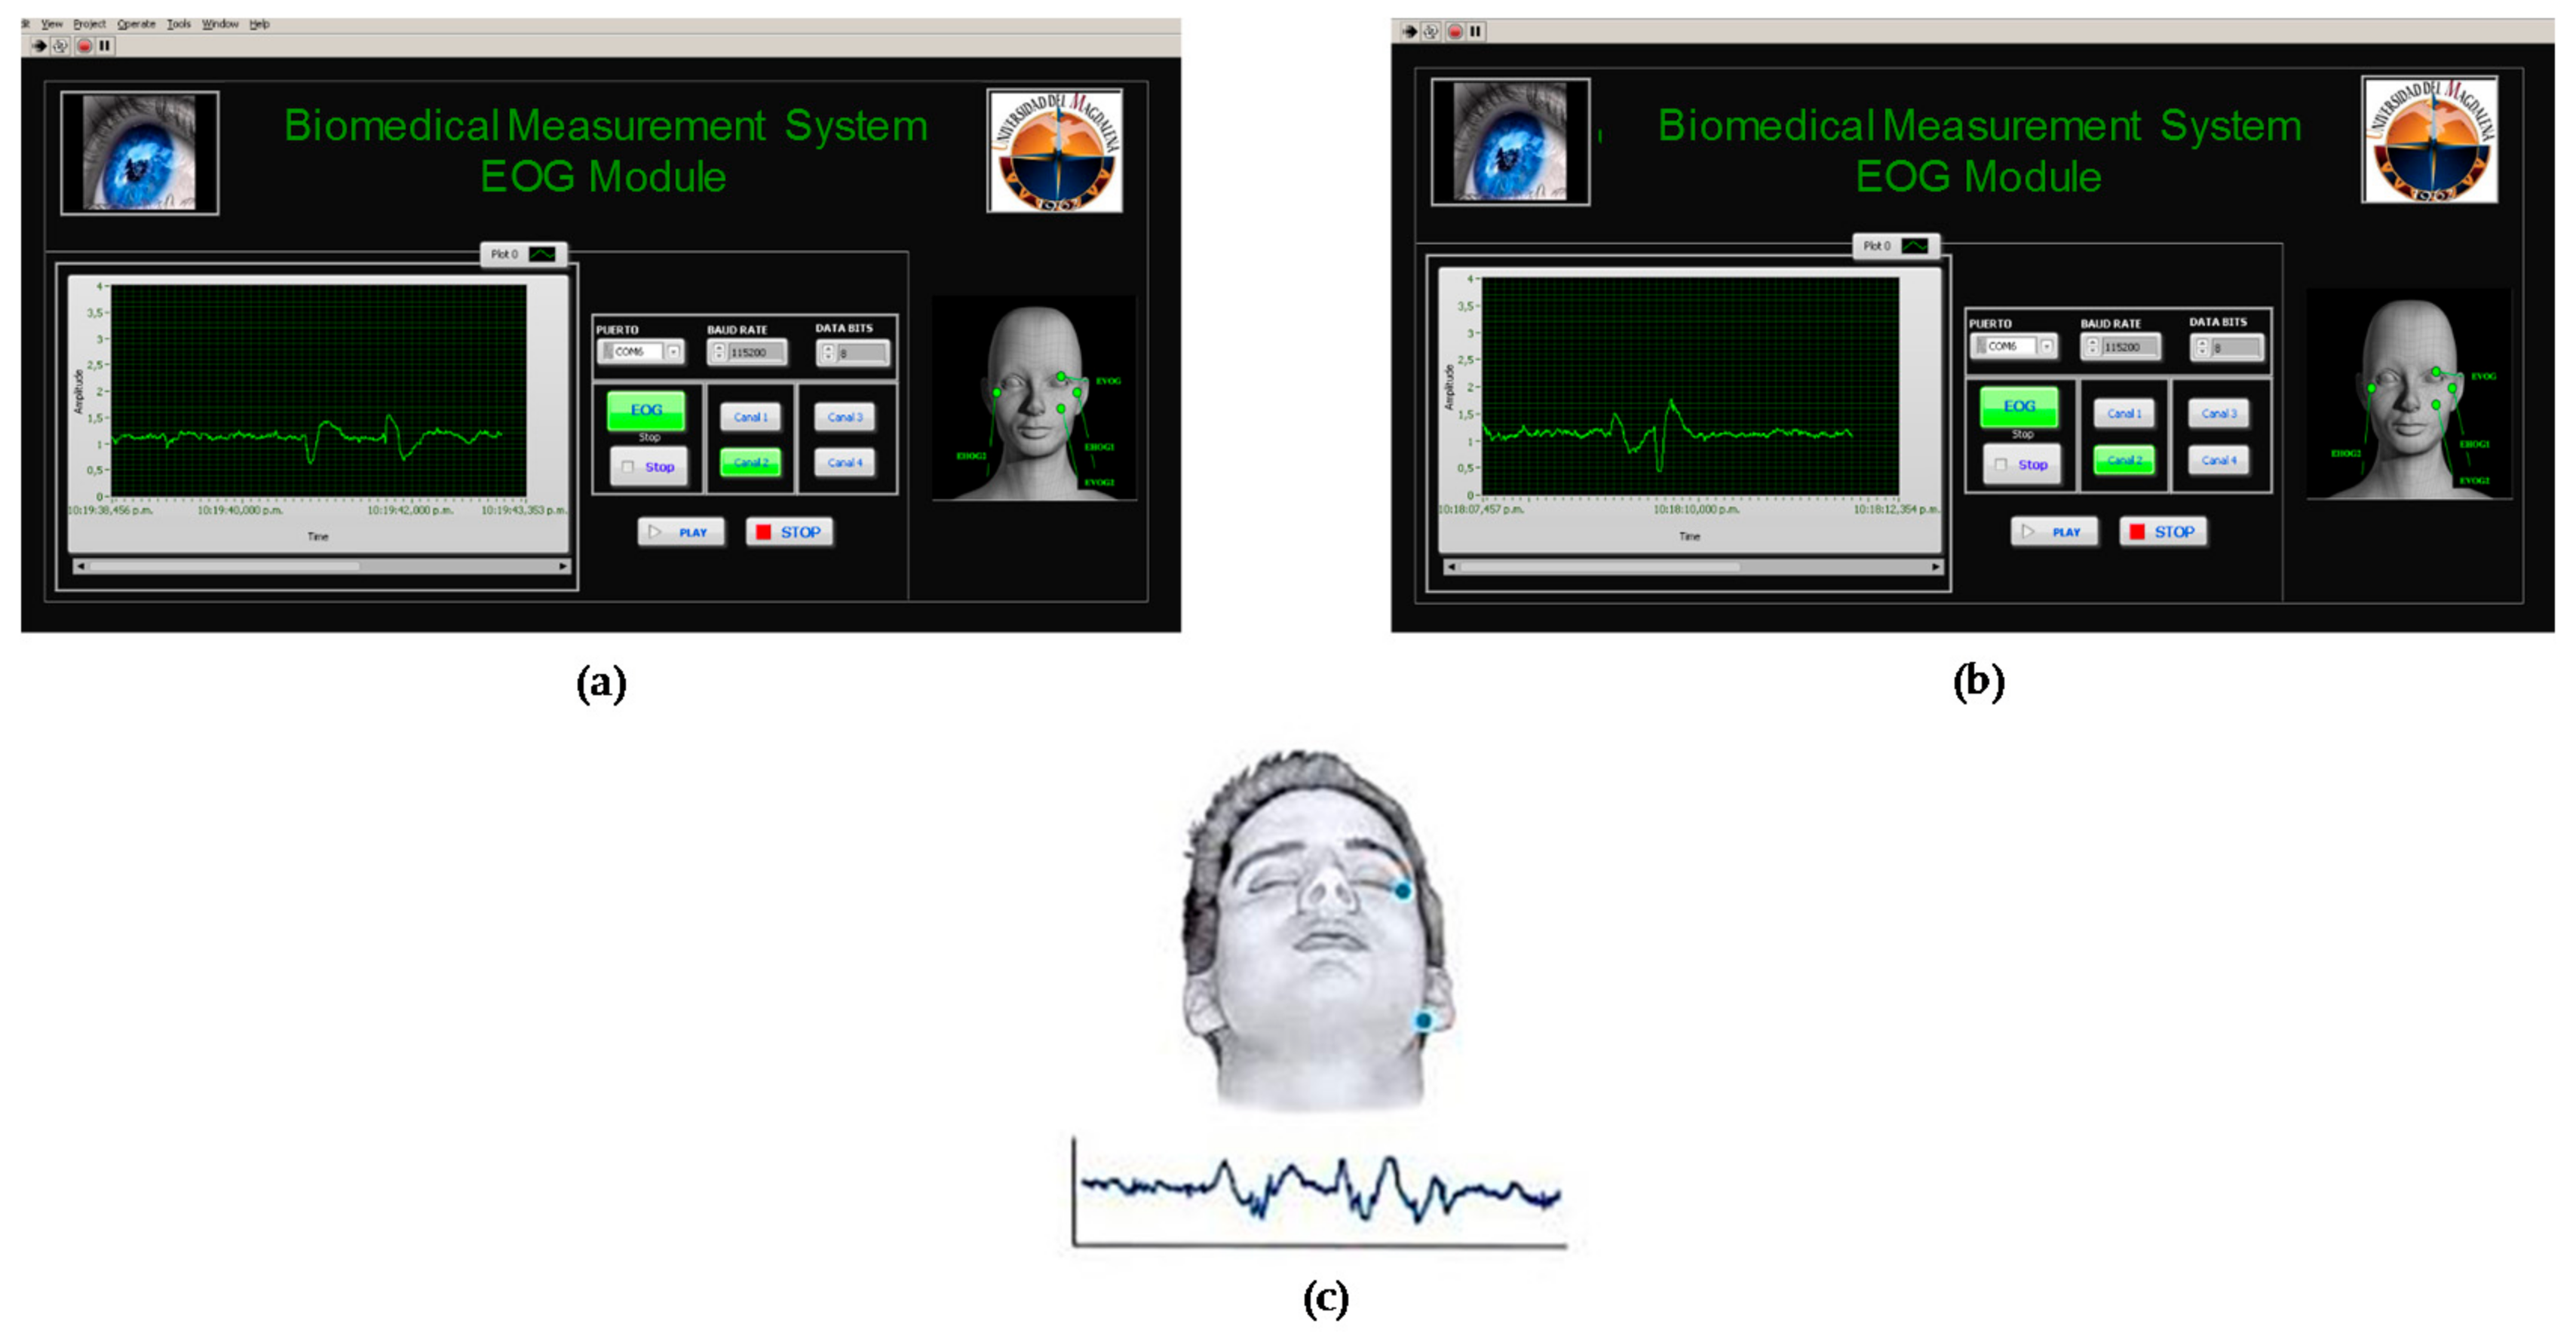
The signals obtained from the EOG module have the common characteristics of this type of bioelectrical signals. Horizontal and vertical movements were made, and it was determined that the waveform is similar in both cases (see Figure 25). In addition, in Figure 25c a standard EOG signal is shown, with repetitive movements in the ocular lobe, which agrees with the results obtained.
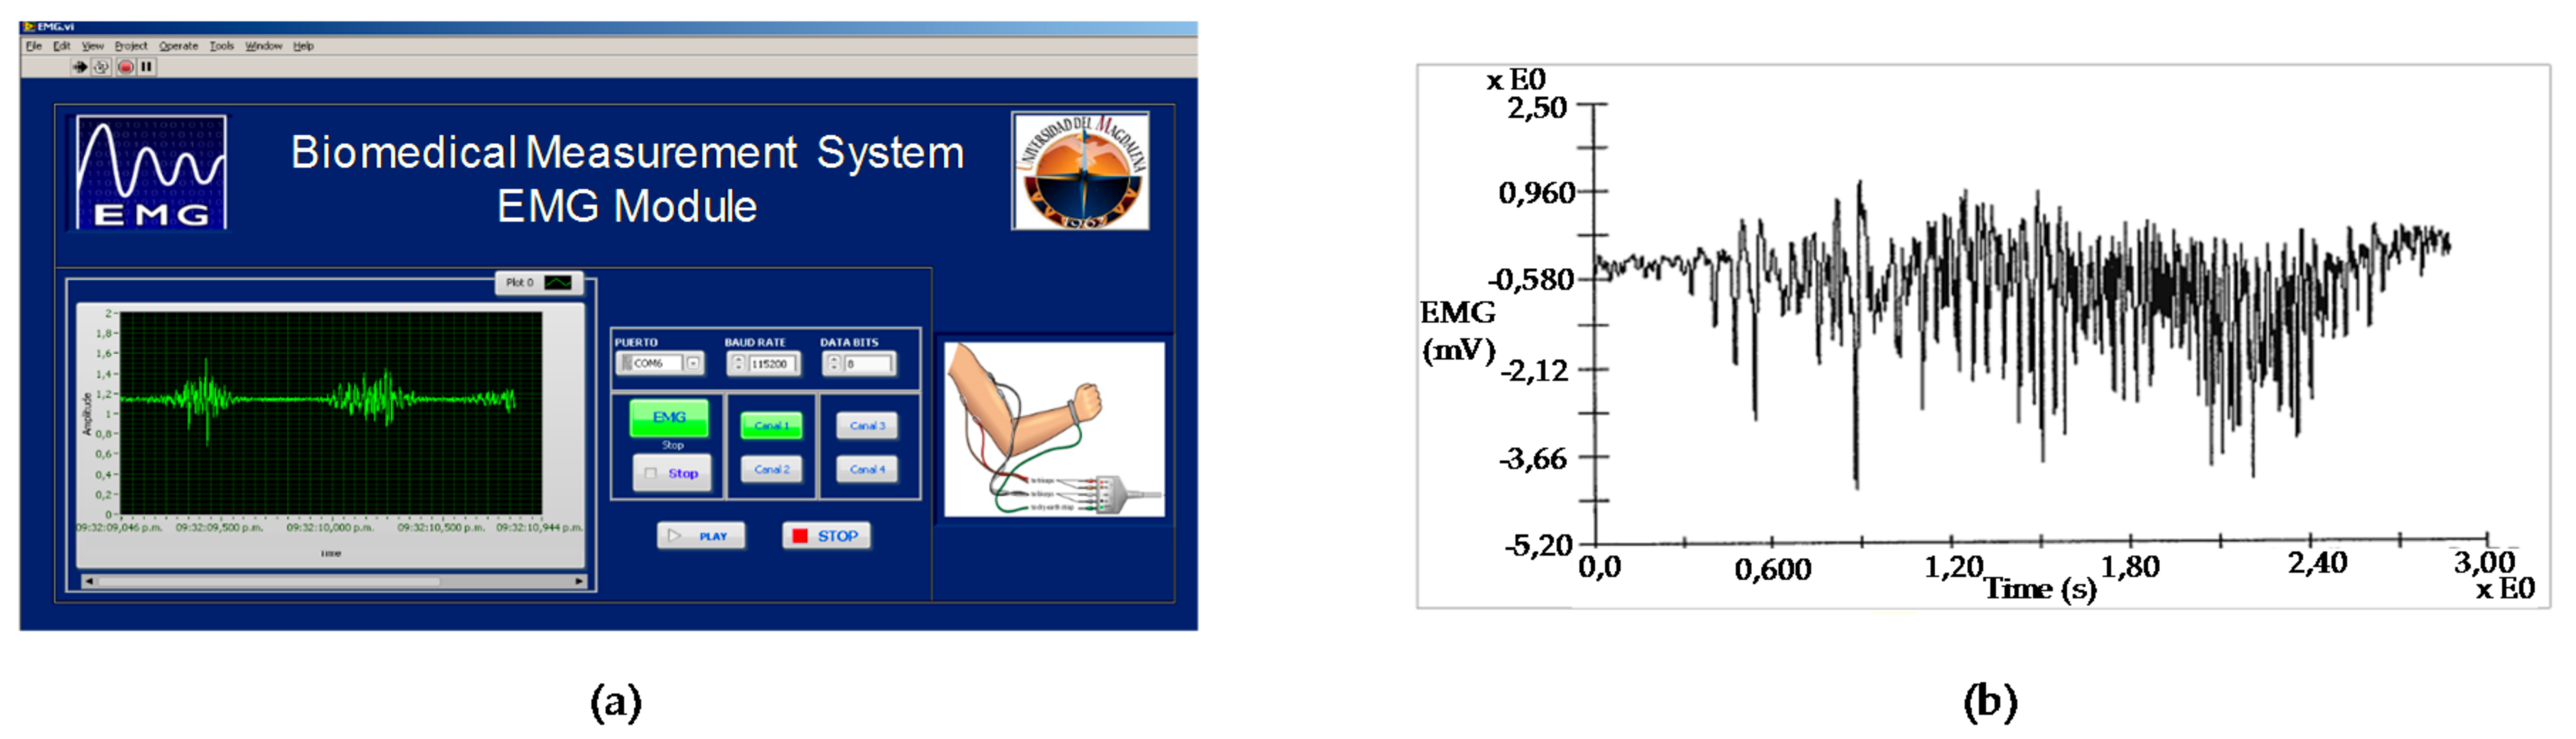
The EMG signal was acquired from the right biceps muscle. Short-term and repetitive contractions were performed. The results obtained are shown in Figure 26a. An EMG signal derived from the biceps for a subject lifting weight is shown in Figure 26b. It can be seen that this signal has a longer contraction and greater amplitude. However, it has characteristics similar to those obtained in the EMG module.
3.3. Tests with the Bioimpedance Module
After having checked the proper functioning of the bioimpedance module stages, bioimpedance detection in the skin of three people with different body weights was carried out. The results obtained are shown in Table 4. Before performing the experiments, the subjects also signed an informed consent reviewed by the ethics committee.
A measurement with four electrodes for the acquisition of the signal was implemented. Two electrodes were used for the injection of current into the body, which were located in the medial position of the dorsal surfaces of the right hand and the right foot. The two remaining electrodes were used for the acquisition of the voltage, and were located between the distal epiphyses of the ulna and the radius.
The table that is shown in the graphical interface of the bioimpedance module (see Figure 27) represents the calibration of the device. For this calibration, the results obtained from a bioimpedance measurement study were used as a reference for a population of 1432 subjects (867 men and 565 women). The measurements were made with a BioScan equipment, which generates an injection current of 800 uA with a frequency of 50 kHz.
4. Discussion
With the present work, it was possible to implement a prototype of biomedical measurements that became the first didactic tool for the undergraduate students from the electronic engineering program of the Universidad del Magdalena in order to verify the theoretical concepts addressed in the area of Electrophysiology.
The modular implementation of the prototype allowed the students to evaluate the individual performance of each of the stages that make up the measurement system. In this way, students can study the operation of active filters in their different frequency responses: high-pass, low-pass, band-pass, and band-stop. A satisfactory response with the operational amplifiers and the instrumentation amplifiers was obtained, since they allowed to implement coupling and gain stages with good performance and excellent common-mode rejection ratio. The design of the signal generator was initially based on the integrated circuit XR2206, but later it was decided to use the AD9850 because of the versatility offered by this integrated circuit for serial communication with LabVIEW.
The working group fulfilled the main objective of the project, which consisted of integrating in a single prototype the measurement of the five electrophysiological signals ECG, EEG, EMG, EOG, and bioimpedance of the skin. However, the implementation of a more compact and robust prototype was postponed for a second phase in order to have a suitable device for the daily activities carried out by the approximately 60 students of the elective courses in the area of biomedical instrumentation. In addition, during this phase it is expected that a wireless connection will be made between the prototype and the graphical interface, and that different digital signal processing stages for the analysis of biomedical signals will be implemented.
With the ECG module, it was possible to analyze the 12 leads of the human body, as well as the heart rate. With the tests conducted in this module, students were able to understand the phenomenon of electrical activity that occurs during the cardiac cycle.
With the EMG module, students were able to study the change in electrical potential that occurs when performing different muscle activities. In the same direction, with the EEG module, tests were carried out to familiarize students with the electrical activity of the human brain. In addition, with the EOG module it was possible to understand the electrical alteration in the muscles that control the movement of the eyeball. It is worth noting that for the implementation of the prototype, 4 input channels were used, which are common for the EMG, EEG, and EOG modules. Finally, the bioimpedance module allowed one to understand the variations of bioelectrical impedance in different parts of the body.
All of the above allowed one to verify the novelty of the system implemented in the present work by achieving the integration of 5 modules in a single prototype. The low cost biomedical measurement systems found in the literature focus on the analysis of maximum 3 biomedical signals. In this sense, it can be mentioned that the results obtained with the ECG module are in line with the results presented in [27], in which a system for acquisition, processing, and analysis of ECG signals was implemented. The use of LabVIEW and a battery powered system stand out as common points. In addition, for the second phase of the present investigation, the working group seeks to use the LabVIEW biomedical toolkit recommended in [27] to study heart rate variability. The work shown in [30] is also highlighted, in which the authors presented a biosignal acquisition system for three types of signals: ECG, EMG, and EOG.
5. Conclusions
In this paper, it was possible to implement a prototype of biomedical measurement systems, which allows one to test the performance of the EEG, ECG, EMG, EOG, and the bioimpedance of the skin modules in a didactic way. The use of batteries and the Notch filter allowed the suppression of 60 Hz noise and electrical noise. All stages of the device can be evaluated independently, which allows users to corroborate the theoretical concepts. It was possible to implement a control system with the Arduino Uno board and the MC14066B analog switches; in this way, it was possible to reduce the implementation costs by optimizing the number of instrumentation amplifiers used for the gain stages. During the tests, it was necessary to clean the skin of the subjects and use shielded cables to avoid interference. It was found that the voltage amplitudes vary in each subject, regardless of whether the same design conditions are used and the subjects have good health conditions. As future work, the research group will focus on implementing a more compact and portable device. In addition, a module that allows one to perform the spectral analysis of the signals will be developed.
Author Contributions
A.P. conceived and designed the experiments. P.N. implemented the designs of the electronic circuits and the graphical interface. C.R.A. performed the experiments and wrote the paper.
Acknowledgments
This work was supported by the Vicerrectoría de Investigación of the Universidad del Magdalena.
Conflicts of Interest
The authors declare no conflict of interest.
References
- Artuğ, N.T.; Goker, I.; Bolat, B.; Osman, O.; Orhan, E.K.; Baslo, M.B. New features for scanned bioelectrical activity of motor unit in health and disease. Biomed. Signal Process. 2018, 41, 109–128. [Google Scholar] [CrossRef]
- Ding, J.; Zhang, L.; Yan, F.; Li, X.; Wang, J.; Guo, L. An improved front end design for bioelectrical signal acquisition. In Proceedings of the 16th IEEE Sensors Conference, Glasgow, UK, 30 October–1 November 2017; pp. 1–3. [Google Scholar]
- Simon, V.A.; Gerasimov, V.A.; Kostrin, D.K.; Selivanov, L.M.; Uhov, A.A. Method of recording bioelectrical signals using a capacitive coupling. J. Phys. Conf. Ser. 2017, 929, 1–4. [Google Scholar] [CrossRef]
- Rezaeiyan, Y.; Zamani, M.; Shoaei, O.; Serdijn, W.A. A 0.5 μA/Channel front-end for implantable and external ambulatory ECG recorders. Microelectron. J. 2018, 74, 79–85. [Google Scholar] [CrossRef]
- Rosli, K.A.; Omar, M.H.; Hasan, A.F.; Musa, K.S.; Fadzil, M.F.M.; Neu, S.H. Development of Electrocardiograph Monitoring System. In Proceedings of the Malaysian Technical Universities Conference on Engineering and Technology, Penang, Malaysia, 6–7 December 2017. [Google Scholar]
- Abuzairi, T.; Matondang, J.S.; Purnamaningsih, R.W.; Basari; Ratnasari, A. Design of portable electrocardiogram device using DSO138. In Proceedings of the 2nd Biomedical Engineering’s Recent Progress in Biomaterials, Drugs Development, and Medical Devices, Bali, Indonesia, 25–26 July 2018. [Google Scholar]
- Lynn, W.D.; Escalona, O.J.; McEneaney, D.J. A Low Latency Electrocardiographic QRS Activity Recovery Technique for Use on the Upper Left Arm. Electronics 2014, 3, 409–418. [Google Scholar] [CrossRef]
- Bhattacharyya, A.; Sharma, M.; Pachori, R.B.; Sircar, P.; Acharya, U.R. A novel approach for automated detection of focal EEG signals using empirical wavelet transform. Neural Comput. Appl. 2018, 29, 47–57. [Google Scholar] [CrossRef]
- Mohamed, S.; Haggag, S.; Nahavandi, S.; Haggag, O. Towards automated quality assessment measure for EEG signals. Neurocomputing 2017, 237, 281–290. [Google Scholar] [CrossRef]
- Losonczi, L.; Márton, L.F.; Brassai, T.S.; Farkas, L. Embedded EEG Signal Acquisition Systems. Procedia Technol. 2014, 12, 141–147. [Google Scholar] [CrossRef]
- Feng, N.; Shi, Q.; Wang, H.; Gong, J.; Liu, C.; Lu, Z. A soft robotic hand: Design, analysis, sEMG control, and experiment. Int. J. Adv. Manuf. Technol. 2018, 1–15. [Google Scholar] [CrossRef]
- Sadikoglu, F.; Kavalcioglu, C.; Dagman, B. Electromyogram (EMG) signal detection, classification of EMG signals and diagnosis of neuropathy muscle disease. Procedia Comput. Sci. 2017, 120, 422–429. [Google Scholar] [CrossRef]
- Subasi, A. Classification of EMG signals using combined features and soft computing techniques. Appl. Soft Comput. 2012, 12, 2188–2198. [Google Scholar] [CrossRef]
- Cho, G.-Y.; Lee, G.-Y.; Lee, T.-R. Efficient Real-Time Lossless EMG Data Transmission to Monitor Pre-Term Delivery in a Medical Information System. Appl. Sci. 2017, 7, 366. [Google Scholar] [CrossRef]
- Yang, J.-J.; Gang, G.W.; Kim, T.S. Development of EOG-Based Human Computer Interface (HCI) System Using Piecewise Linear Approximation (PLA) and Support Vector Regression (SVR). Electronics 2018, 7, 38. [Google Scholar] [CrossRef]
- Dasgupta, A.; Chakraborty, S.; Routray, A. A two-stage framework for denoising electrooculography signals. Biomed. Signal Process. 2017, 31, 231–237. [Google Scholar] [CrossRef]
- Deng, L.Y.; Hsu, C.-L.; Lin, T.-C.; Tuan, J.-S.; Chang, S.-M. EOG-based Human–Computer Interface system development. Expert Syst. Appl. 2010, 37, 3337–3343. [Google Scholar] [CrossRef]
- Kaur, I.; Rajni, R.; Marwaha, A. ECG Signal Analysis and Arrhythmia Detection using Wavelet Transform. J. Inst. Eng. 2016, 97, 499–507. [Google Scholar] [CrossRef]
- Sengupta, P.P.; Kulkarni, H.; Narula, J. Prediction of Abnormal Myocardial Relaxation from Signal Processed Surface ECG. J. Am. Coll. Cardiol. 2018, 71, 1650–1660. [Google Scholar] [CrossRef] [PubMed]
- Deng, M.; Wang, C.; Tang, M.; Zheng, T. Extracting cardiac dynamics within ECG signal for human identification and cardiovascular diseases classification. Neural Netw. 2018, 100, 70–83. [Google Scholar] [CrossRef] [PubMed]
- Son, C.; Kim, S.; Kim, S.-J.; Choi, J.; Kim, D. Detection of muscle activation through multi-electrode sensing using electrical stimulation. Sens. Actuator A Phys. 2018, 275, 19–28. [Google Scholar] [CrossRef]
- Shiraz, A.; Leaker, B.; Mosse, C.A.; Solomon, E.; Craggs, M.; Demosthenous, A. Design of sEMG assembly to detect external anal sphincter activity: A proof of concept. Physiol. Meas. 2017, 38, 17–27. [Google Scholar] [CrossRef] [PubMed]
- Ishii, C.; Murooka, S.; Tajima, M. Navigation of an electric wheelchair using EMG, EOG and EEG. IJMERR 2018, 7, 143–149. [Google Scholar]
- Dhatchayeny, D.R.; Cahyadi, W.A.; Chung, Y.-H. An Assistive VLC Technology for Smart Home Devices Using EOG. Kluw. Commun. 2018, 98, 81–89. [Google Scholar] [CrossRef]
- Amaro, B.; Antunes, J.; Cunha, P.; Soares, F.; Carvalho, V.; Carvalho, H. Monitoring of bioelectrical and biomechanical signals in Taekwondo training: First insights. Lect. Notes Comput. Vis. Biomech. 2018, 27, 417–426. [Google Scholar]
- Li, Y.; He, S.; Huang, Q.; Gu, Z.; Yu, Z.L. A EOG-based switch and its application for “start/stop” control of a wheelchair. Neurocomputing 2018, 275, 1350–1357. [Google Scholar] [CrossRef]
- Djermanova, N.; Marinov, M.; Ganev, B.; Tabakov, S.; Nikolov, G. LabVIEW based ECG signal acquisition and analysis. In Proceedings of the 25th International Scientific Conference Electronics, Sozopol, Bulgaria, 12–14 September 2016. [Google Scholar]
- Nikhil Kumar, V.; Mohana, J. A real time setup for acquisition of ECG data. Int. J. Pharm. Technol. IJPT 2016, 8, 20332–20338. [Google Scholar]
- Seoane, F.; Mohino-Herranz, I.; Ferreira, J.; Alvarez, L.; Buendia, R.; Ayllón, D.; Llerena, C.; Gil-Pita, R. Wearable Biomedical Measurement Systems for Assessment of Mental Stress of Combatants in Real Time. Sensors 2014, 14, 7120–7141. [Google Scholar] [CrossRef] [PubMed]
- Ahamed, M.A.; Ahad, M.A.U.; Sohag, M.H.A.; Ahmad, M. Development of Low Cost Wireless Biosignal Acquisition System for ECG EMG and EOG. In Proceedings of the 2nd International Conference on Electrical Information and Communication Technologies (EICT), Khulna, Bangladesh, 10–12 December 2015; pp. 195–199. [Google Scholar]
- Sirven, J.I.; Stern, J.M. Atlas of Video-EEG Monitoring, 1st ed.; McGraw-Hill: New York, NY, USA, 2011; pp. 1–20. ISBN 978-0-07-159742-5. [Google Scholar]
- Pinos, E.; Mendez, X. Cursor control system of a computer by electro-oculographs signs for motor disability. In Proceedings of the IEEE Canada International Humanitarian Technology Conference (IHTC), Montreal, QC, Canada, 1–4 June 2014; pp. 1–4. [Google Scholar]
- Sacco, I.C.N.; Gomes, A.A.; Otuzi, M.E.; Pripas, D.; Onodera, A.N. A method for better positioning bipolar electrodes for lower limb EMG recordings during dynamic contractions. J. Neurosci. Meth. 2009, 180, 133–137. [Google Scholar] [CrossRef] [PubMed]
- Texas Instruments. Available online: https://goo.gl/FEkJdw (accessed on 15 April 2018).
- Burr-Brown. Available online: https://goo.gl/LujPNc (accessed on 10 April 2018).
- Texas Instruments. Available online: https://goo.gl/3Pq3nr (accessed on 15 April 2018).
- Robles Algarín, C.; Callejas Cabarcas, J.; Polo Llanos, A. Low-Cost Fuzzy Logic Control for Greenhouse Environments with Web Monitoring. Electronics 2017, 6, 71. [Google Scholar] [CrossRef]
Figure 1.
Diagram of the biomedical measurement system. The ADC block is the Analog to Digital Converter.
Figure 1.
Diagram of the biomedical measurement system. The ADC block is the Analog to Digital Converter.

Figure 2.
Block diagram of the electrocardiographic (ECG) module. RA (Right Arm), LL (Left Leg), LA (Left Arm), RL (Right Leg).
Figure 2.
Block diagram of the electrocardiographic (ECG) module. RA (Right Arm), LL (Left Leg), LA (Left Arm), RL (Right Leg).
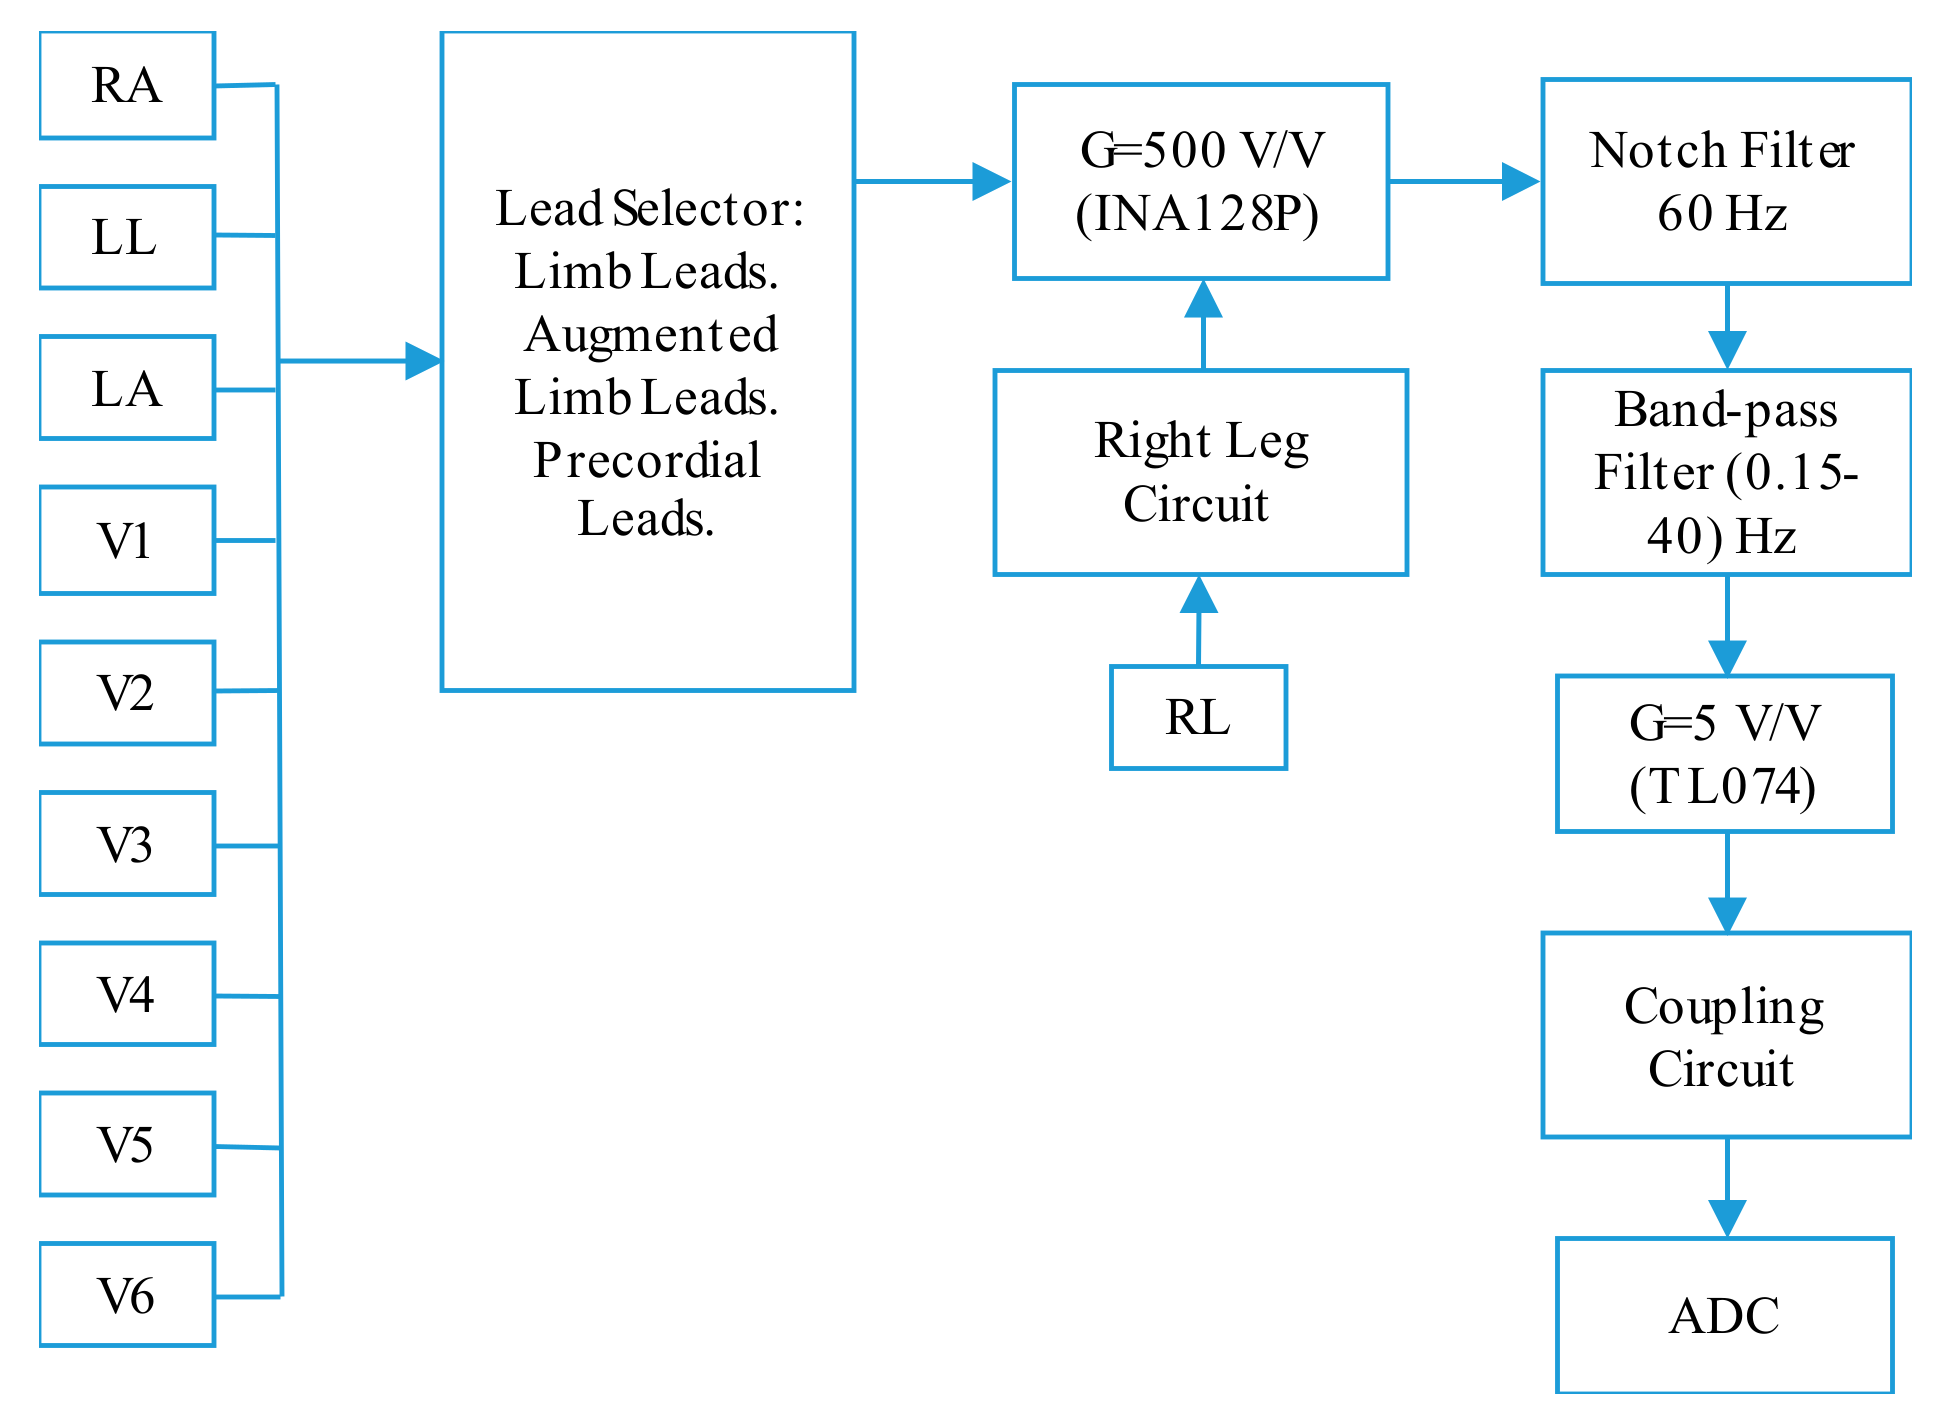
Figure 3.
Electronic schematic to obtain the leads of the ECG module.

Figure 4.
Block diagram for the electroencephalographic (EEG) and electrooculographic (EOG) modules.
Figure 4.
Block diagram for the electroencephalographic (EEG) and electrooculographic (EOG) modules.

Figure 5.
(a) Longitudinal bipolar montage for EEG signals [31], (b) transverse bipolar montage for EEG signals [31], and (c) montage of the electrodes for EOG signals [32].

Figure 6.
Block diagram of the electromyographic (EMG) module.

Figure 7.
Block diagram of the bioimpedance module.

Figure 8.
Driven right leg circuit [34].
Figure 8.
Driven right leg circuit [34].

Figure 9.
60 Hz Notch filter with UAF42 [35].
Figure 9.
60 Hz Notch filter with UAF42 [35].

Figure 10.
Band-pass filter: (a) first-order passive high-pass filter and (b) fifth-order active low-pass filter.
Figure 10.
Band-pass filter: (a) first-order passive high-pass filter and (b) fifth-order active low-pass filter.

Figure 11.
Band-pass filter for the EMG module.

Figure 12.
Adjustable gain for the ECG, EEG, EOG, and EMG modules.

Figure 13.
(a) AD9850 module and (b) differential Voltage to Current Converter [34].
Figure 13.
(a) AD9850 module and (b) differential Voltage to Current Converter [34].

Figure 14.
(a) Stage 1: G = 2 V/V, (b) Stage 2: second-order narrow-band filter, and (c) Stage 3: full wave rectifier with G = 6 V/V.
Figure 14.
(a) Stage 1: G = 2 V/V, (b) Stage 2: second-order narrow-band filter, and (c) Stage 3: full wave rectifier with G = 6 V/V.

Figure 15.
Block diagram of the control system.

Figure 16.
States of the switches to select the V1 precordial lead.

Figure 17.
States of the switches to select the channel 3.

Figure 18.
Front panel of the graphical interface.

Figure 19.
Front panel of the signal generator.

Figure 20.
Prototype of the biomedical measurement system. (a) Stages and connection terminals, (b) PCB circuits, (c) LED indicators, and (d) leads and inputs.
Figure 20.
Prototype of the biomedical measurement system. (a) Stages and connection terminals, (b) PCB circuits, (c) LED indicators, and (d) leads and inputs.

Figure 21.
(a) Bode plot for Notch filter and (b) results for stage of G = 2 in the bioimpedance module.
Figure 21.
(a) Bode plot for Notch filter and (b) results for stage of G = 2 in the bioimpedance module.

Figure 22.
(a) Results for the low-pass filter of 40 Hz and (b) tests of the signal generator stage.
Figure 22.
(a) Results for the low-pass filter of 40 Hz and (b) tests of the signal generator stage.

Figure 23.
Results obtained with the ECG module. (a) Lead II, (b) Lead aVR, (c) Lead V4, and (d) ECG signals of a 30-year-old male athlete.
Figure 23.
Results obtained with the ECG module. (a) Lead II, (b) Lead aVR, (c) Lead V4, and (d) ECG signals of a 30-year-old male athlete.

Figure 24.
(a) Results obtained with the EEG module with the electrodes in FP1 and FP2 and (b) reference signals in electroencephalography.
Figure 24.
(a) Results obtained with the EEG module with the electrodes in FP1 and FP2 and (b) reference signals in electroencephalography.

Figure 25.
Results obtained with the EOG module. (a) Horizontal movement, (b) vertical movement, and (c) reference signal.
Figure 25.
Results obtained with the EOG module. (a) Horizontal movement, (b) vertical movement, and (c) reference signal.

Figure 26.
(a) Results obtained with the EMG module in the biceps muscle; (b) Reference signal of a subject lifting weights.
Figure 26.
(a) Results obtained with the EMG module in the biceps muscle; (b) Reference signal of a subject lifting weights.

Figure 27.
Results obtained for the bioimpedance measurement of the subject 1.


Table 1.
Leads of the ECG module. RA (Right Arm), LL (Left Leg), LA (Left Arm), RL (Right Leg).
| Lead | Type | Equation |
|---|---|---|
| I | Limb | LA − RA |
| II | Limb | LL − RA |
| III | Limb | LL − LA |
| aVR | Augmented limb | RA − (LA + LL)/2 |
| aVL | Augmented limb | LA − (RA + LL)/2 |
| aVF | Augmented limb | LL − (RA + LA)/2 |
| V1 | Precordial | V1 − (RA + LA + LL)/3 |
| V2 | Precordial | V2 − (RA + LA + LL)/3 |
| V3 | Precordial | V3 − (RA + LA + LL)/3 |
| V4 | Precordial | V4 − (RA + LA + LL)/3 |
| V5 | Precordial | V5 − (RA + LA + LL)/3 |
| V6 | Precordial | V6 − (RA + LA + LL)/3 |
Table 2.
Coefficients for a fifth-order Butterworth filter.
| ai | bi | |
|---|---|---|
| Filter 1 | a1 = 1 | b1 = 0 |
| Filter 2 | a2 = 1.618 | b2 = 1 |
| Filter 3 | a3 = 0.618 | b3 = 1 |
Table 3.
Experimental results obtained for each of the stages of the modules.
| Stage | Theoretical Value | Experimental Value |
|---|---|---|
| Gain of 500 with the INA128P | 500 V/V | 523 V/V |
| Notch Filter | 60 Hz | 63.70 Hz |
| Band-pass Filter (0.15–40) Hz | (0.15–40) Hz | (0.21–39.81) Hz |
| Band-pass Filter (20–500) Hz | (20–500) Hz | (21.23–487.80) Hz |
| Adjustable Gain with the TL074 | 5 V/V | 4.96 V/V |
| 2 V/V | 1.92 V/V | |
| 28 V/V | 26.39 V/V | |
| Signal Generator | 50 KHz, 1 Vp-p | 50 kHz, 1.03 Vp-p |
| Voltage Controlled Current Source | 800 µA, 50 kHz, 1 Vp-p | 788.50 µA, 50 kHz, 1.03 Vp-p |
| Gain of 2 with the INA128P | 2 V/V | 1.99 V/V |
| Narrow Band-pass Filter | 50 kHz | 49.92 kHz |
| Gain of 6 with the TL074 | 6 V/V | 6.05 V/V |
Table 4.
Results obtained with the bioimpedance measurement module.
| N° | Gender | Weight | Age (Years) | Height | Output Voltage | Range of Bioimpedance |
|---|---|---|---|---|---|---|
| 1 | Male | 81 kg | 23 | 1.76 m | 2.87 V | Normal |
| 2 | Male | 56 kg | 24 | 1.58 m | 3.35 V | High |
| 3 | Female | 60 kg | 25 | 1.65 m | 1.63 V | Low |
© 2018 by the authors. Licensee MDPI, Basel, Switzerland. This article is an open access article distributed under the terms and conditions of the Creative Commons Attribution (CC BY) license (http://creativecommons.org/licenses/by/4.0/).
Share and Cite
MDPI and ACS Style
Polo, A.; Narvaez, P.; Robles Algarín, C. Implementation of a Cost-Effective Didactic Prototype for the Acquisition of Biomedical Signals. Electronics 2018, 7, 77. https://doi.org/10.3390/electronics7050077
AMA Style
Polo A, Narvaez P, Robles Algarín C. Implementation of a Cost-Effective Didactic Prototype for the Acquisition of Biomedical Signals. Electronics. 2018; 7(5):77. https://doi.org/10.3390/electronics7050077
Chicago/Turabian StylePolo, Aura, Pedro Narvaez, and Carlos Robles Algarín. 2018. "Implementation of a Cost-Effective Didactic Prototype for the Acquisition of Biomedical Signals" Electronics 7, no. 5: 77. https://doi.org/10.3390/electronics7050077
Note that from the first issue of 2016, this journal uses article numbers instead of page numbers. See further details here.