
Photothermal Radiometry for Skin Research

School of Engineering, London South Bank University, 103 Borough Road, London SE1 0AA, UK
Cosmetics 2016, 3(1), 10; https://doi.org/10.3390/cosmetics3010010
Submission received: 3 December 2015
/
Revised: 15 February 2016
/
Accepted: 17 February 2016
/
Published: 29 February 2016
Abstract
:Photothermal radiometry is an infrared remote sensing technique that has been used for skin and skin appendages research, in the areas of skin hydration, hydration gradient, skin hydration depth profiling, skin thickness measurements, skin pigmentation measurements, effect of topically applied substances, transdermal drug delivery, moisture content of bio-materials, membrane permeation, and nail and hair measurements. Compared with other technologies, photothermal radiometry has the advantages of non-contact, non-destructive, quick to make a measurement (a few seconds), and being spectroscopic in nature. It is also colour blind, and can work on any arbitrary sample surfaces. It has a unique depth profiling capability on a sample surface (typically the top 20 µm), which makes it particularly suitable for skin measurements. In this paper, we present a review of the photothermal radiometry work carried out in our research group. We will first introduce the theoretical background, then illustrate its applications with experimental results.
1. Introduction
Photothermal radiometry (PTR), or opto-thermal radiometry (OTR), is an infrared remote sensing technique that was independently developed by Tam et al. [1] and Imhof et al. [2] back in the 1980s. It has since been used for biomedical applications [3,4,5] and for industrial non-destructive testing (NDT) [6,7]. Photothermal radiometry uses a modulated (sinusoidal or pulsed) light source (i.e., laser, etc.) to heat up the sample surface, and uses a fast infrared detector (e.g., Mercury Cadmium Telluride or MCT) to pick up the sample’s corresponding blackbody radiation due to the temperature increase. By analyzing the shape of the signal, we can get information on sample’s optical properties, thermal properties, the thickness of the sample, and its layer structure. The pulsed laser version—Opto-Thermal Transient Emission Radiometry (OTTER)—developed initially by Imhof et al. [2,8,9], and consequently by Xiao et al. [9,10,11,12,13,14,15,16,17,18,19], has been intensively used for skin and skin appendage measurements.
2. Theoretical Background
When an incident light beam reaches the skin’s surface, a small fraction of the light will be reflected due to the change in refractive index between air (nair = 1.0) and stratum corneum (nsc = 1.55). The rest of the light will pass through the surface and go into the skin, undergoing a process of multiple scattering and absorption [20]. Absorbed light energy is converted to heat, which increases the temperature of the skin. Scattered light contributes to a diffuse distribution of light within the skin. Scattering and absorption determine the light penetration depth and light distribution within the skin. The degree of scattering and absorption depends on the wavelength of the incident light and the optical properties of the skin, which can be described by its absorption coefficient, scattering coefficient, and the anisotropy.
Some of the light travelling in the skin will also be reflected at the interfaces of the skin layers and blood vessels. Some of this reflected and back scattered light can travel through the skin and finally go back into the air. This is called the remitted light. The remittance from epidermis and dermis, together with the regular reflectance from the skin surface form the total remittance of the incident radiation, which give the colour of the skin. The measurement of this remittance can give information on erythema, blanching, melanin, glucose level, oxygen level, haemoglobin, blood flow, and skin structure.
These light–tissue interactions can normally be divided into three domains: absorption domain, scattering domain, and equal scattering and absorption domain. Absorption domain is where absorption events occur more rapidly than effective scattering events. This is true for some UV (193, 248, 308 nm of ArK, KrF, XeCl excimer lasers) and the IR (2.94 µm Er:YAG, 10.6 µm CO2 lasers) wavelengths, where tissue absorption can be substantially larger than scattering. Scattering domain is where multiple scattering events occur before an absorption event occurs. This is true for wavelengths between 600 and 1300 nm, where haemoglobin and melanin pigments do not absorb strongly [21]. The band between 600 and 1300 nm is often called the “therapeutic window”, which offers the possibility of treating large volumes with certain long-wavelength photosensitizers. Equal scattering and absorption domain is where both absorption and scattering are substantial, and light in the skin has a strongly collimated component surrounded by a region where light is multiply scattered. This is true for wavelengths between 450 and 590 nm, which include the argon laser and Nd:YAG laser wavelengths, the penetration depth is approximately 0.5 to 2.5 mm [22].
OTTER technology mainly works in the absorption domain when 2.94 µm Er:YAG laser is used and in the equal scattering and absorption domain when Nd:YAG laser (532 nm) or OPO (optical parametric oscillator) laser (420–590 nm) is used. OTTER is only sensitive to absorbed light, due to the MCT infrared detector used. The reflected light, scattered light, and remitted light make no contribution to the OTTER signal.
After the laser pulse, the absorbed laser light energy will decay exponentially into deeper skin according to the Beer-Lambert law, and the corresponding temperature changes inside skin can be described as:
where is the temperature at time t = 0 of the skin at position z, with z = 0 at the surface and increasing toward the inside of the skin. α is the absorbance for the excitation laser, C the specific heat, the density, and the energy density absorbed from the excitation laser. This initial temperature will then re-distribute following the diffusion law, which, in general, can be expressed as:
where is the thermal diffusivity of the skin, and k is thermal conductivity of the skin. In skin measurements, we are mainly interested in optical properties, as thermal properties do not change very much. Therefore, it is safe to assume that the skin is thermally homogeneous; then, Equation (2) can be solved by using Green’s function method, to yield a time-dependent transient temperature field as [10]:
where is the complementary error function and is the error function.
The corresponding OTTER signal generated by this transient temperature can be calculated by:
where is the skin’s absorption coefficient for the emitted thermal radiation, and the parameter includes factors that depend on the black body emission curve, detector sensitivity, focusing and alignment, but is independent of the properties of the sample per se [2,8,9,10].
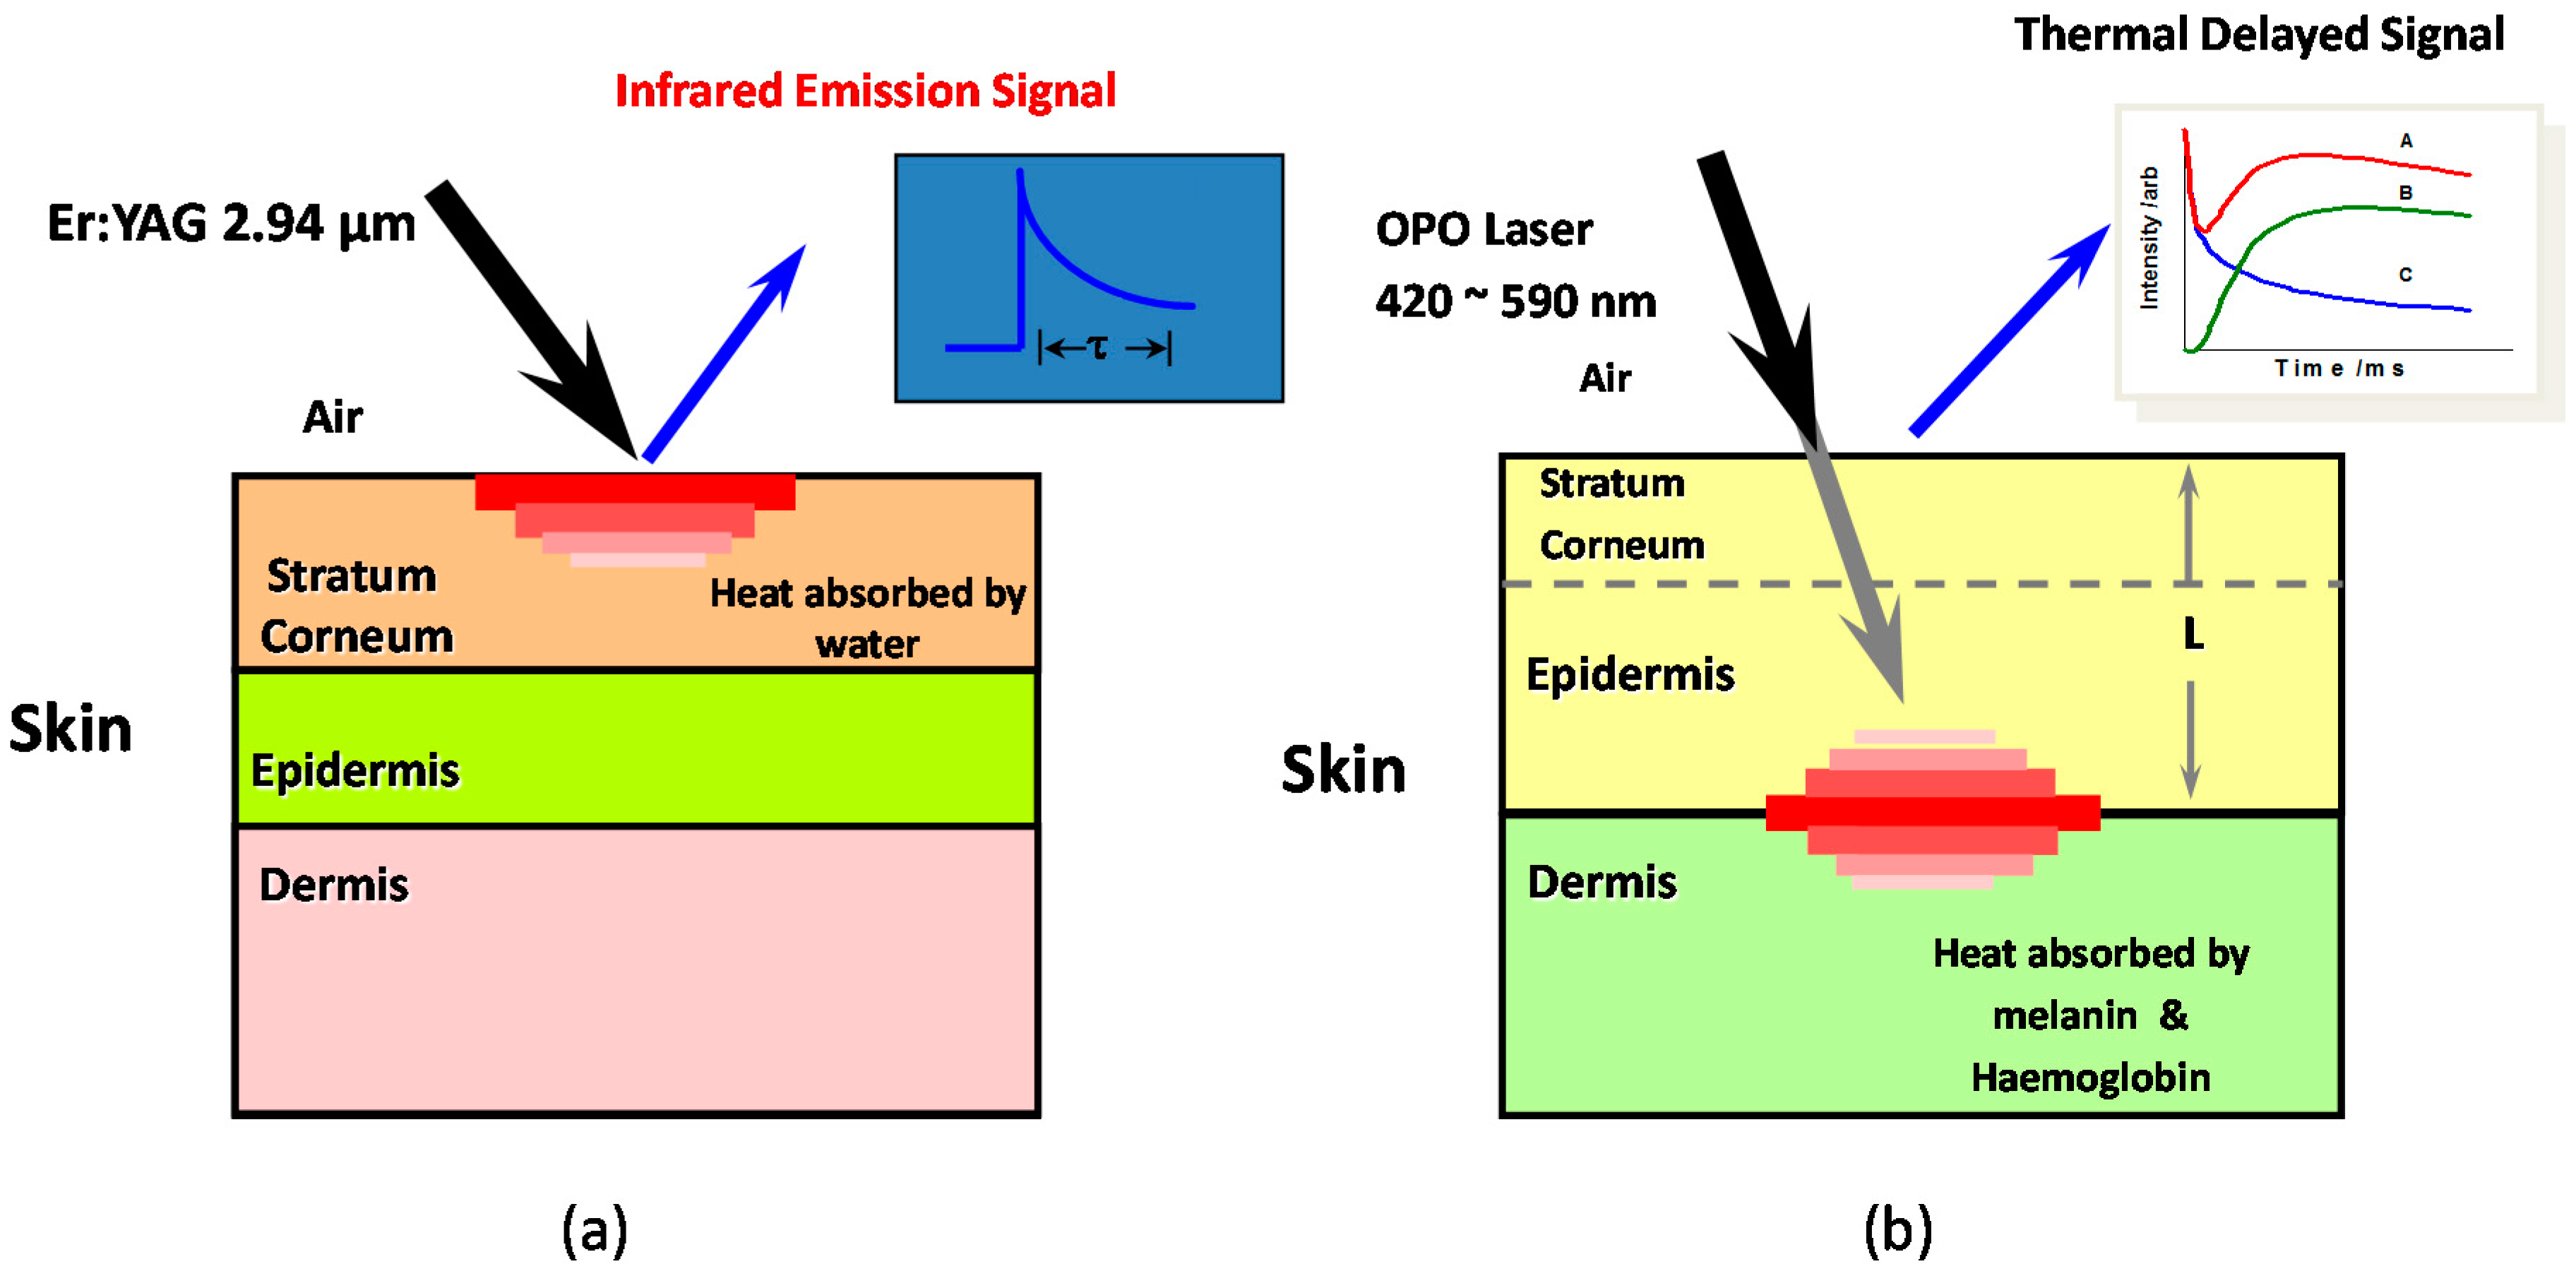
Figure 1 shows the schematic diagram for OTTER measurements. When Nd:YAG laser (532 nm, 10 ns pulse width) or OPO laser (420–590 nm, 10 ns pulse width) is used as the excitation heat source, see Figure 1b, the laser is mainly absorbed by melanin and haemoglobin deep inside the skin. In this case, we are measuring the skin pigments and epidermis thickness [10,11,12,13,14]. OTTER signal is typically a delayed thermal wave signal, and Equation (4) can be solved and expressed as:
where and are the signal amplitudes and . Using Equation (5) to fit the signal we can get the melanin and haemoglobin absorption () and epidermis thickness (L).
When the Er:YAG laser (2.94 µm wavelength, 100 ns pulse width, a few mille joules per pulse) is used as the heat source, see Figure 1a, the laser is absorbed at the skin surface, by the water in the skin, and the measurements are confined within stratum corneum, the outmost skin layer (~20 µm in thickness). In this case, OTTER signal is typically a decay signal, and depending on the detection wavelength, the OTTER signals can either reflect the water concentration information in skin (13.1 µm), or solvent concentration information within skin (9.5 µm). By applying different mathematical models, we can get the average water content in stratum corneum [10], the water concentration gradient in stratum corneum [10,15], and water concentration depth profiles or solvent concentration depth profiles in stratum corneum [16].
2.1. Homogeneous Model
If we assume the skin is optically homogeneous, and under the excitation saturation condition, i.e., , (this is true when an Er:YAG laser is used), then Equation (4) can be solved and expressed as [1,8,9,10]:
where A is the amplitude of the signal, is the signal decay lifetime. By fitting Equation (6) to OTTER signals we can the best-fit value for , which can then be related to average water or solvent concentration in the skin, depending on the detection wavelengths used.
2.2. Gradient Model
If we assume the skin is optically non-homogeneous, but has a linear gradient distribution, e.g.:
where is the absorption coefficient of the surface of the skin, and is the gradient of the absorption coefficient. Then, Equation (4) can be solved and expressed as [10,15]:
where W = wD is the effective gradient and is the signal decay lifetime. By fitting Equation (8) to OTTER signals we can get information on and W, which can then be related to the skin surface water (or solvent) concentration, and the water (or solvent) concentration gradient within the skin [10,15].
2.3. Non-Homogeneous Model
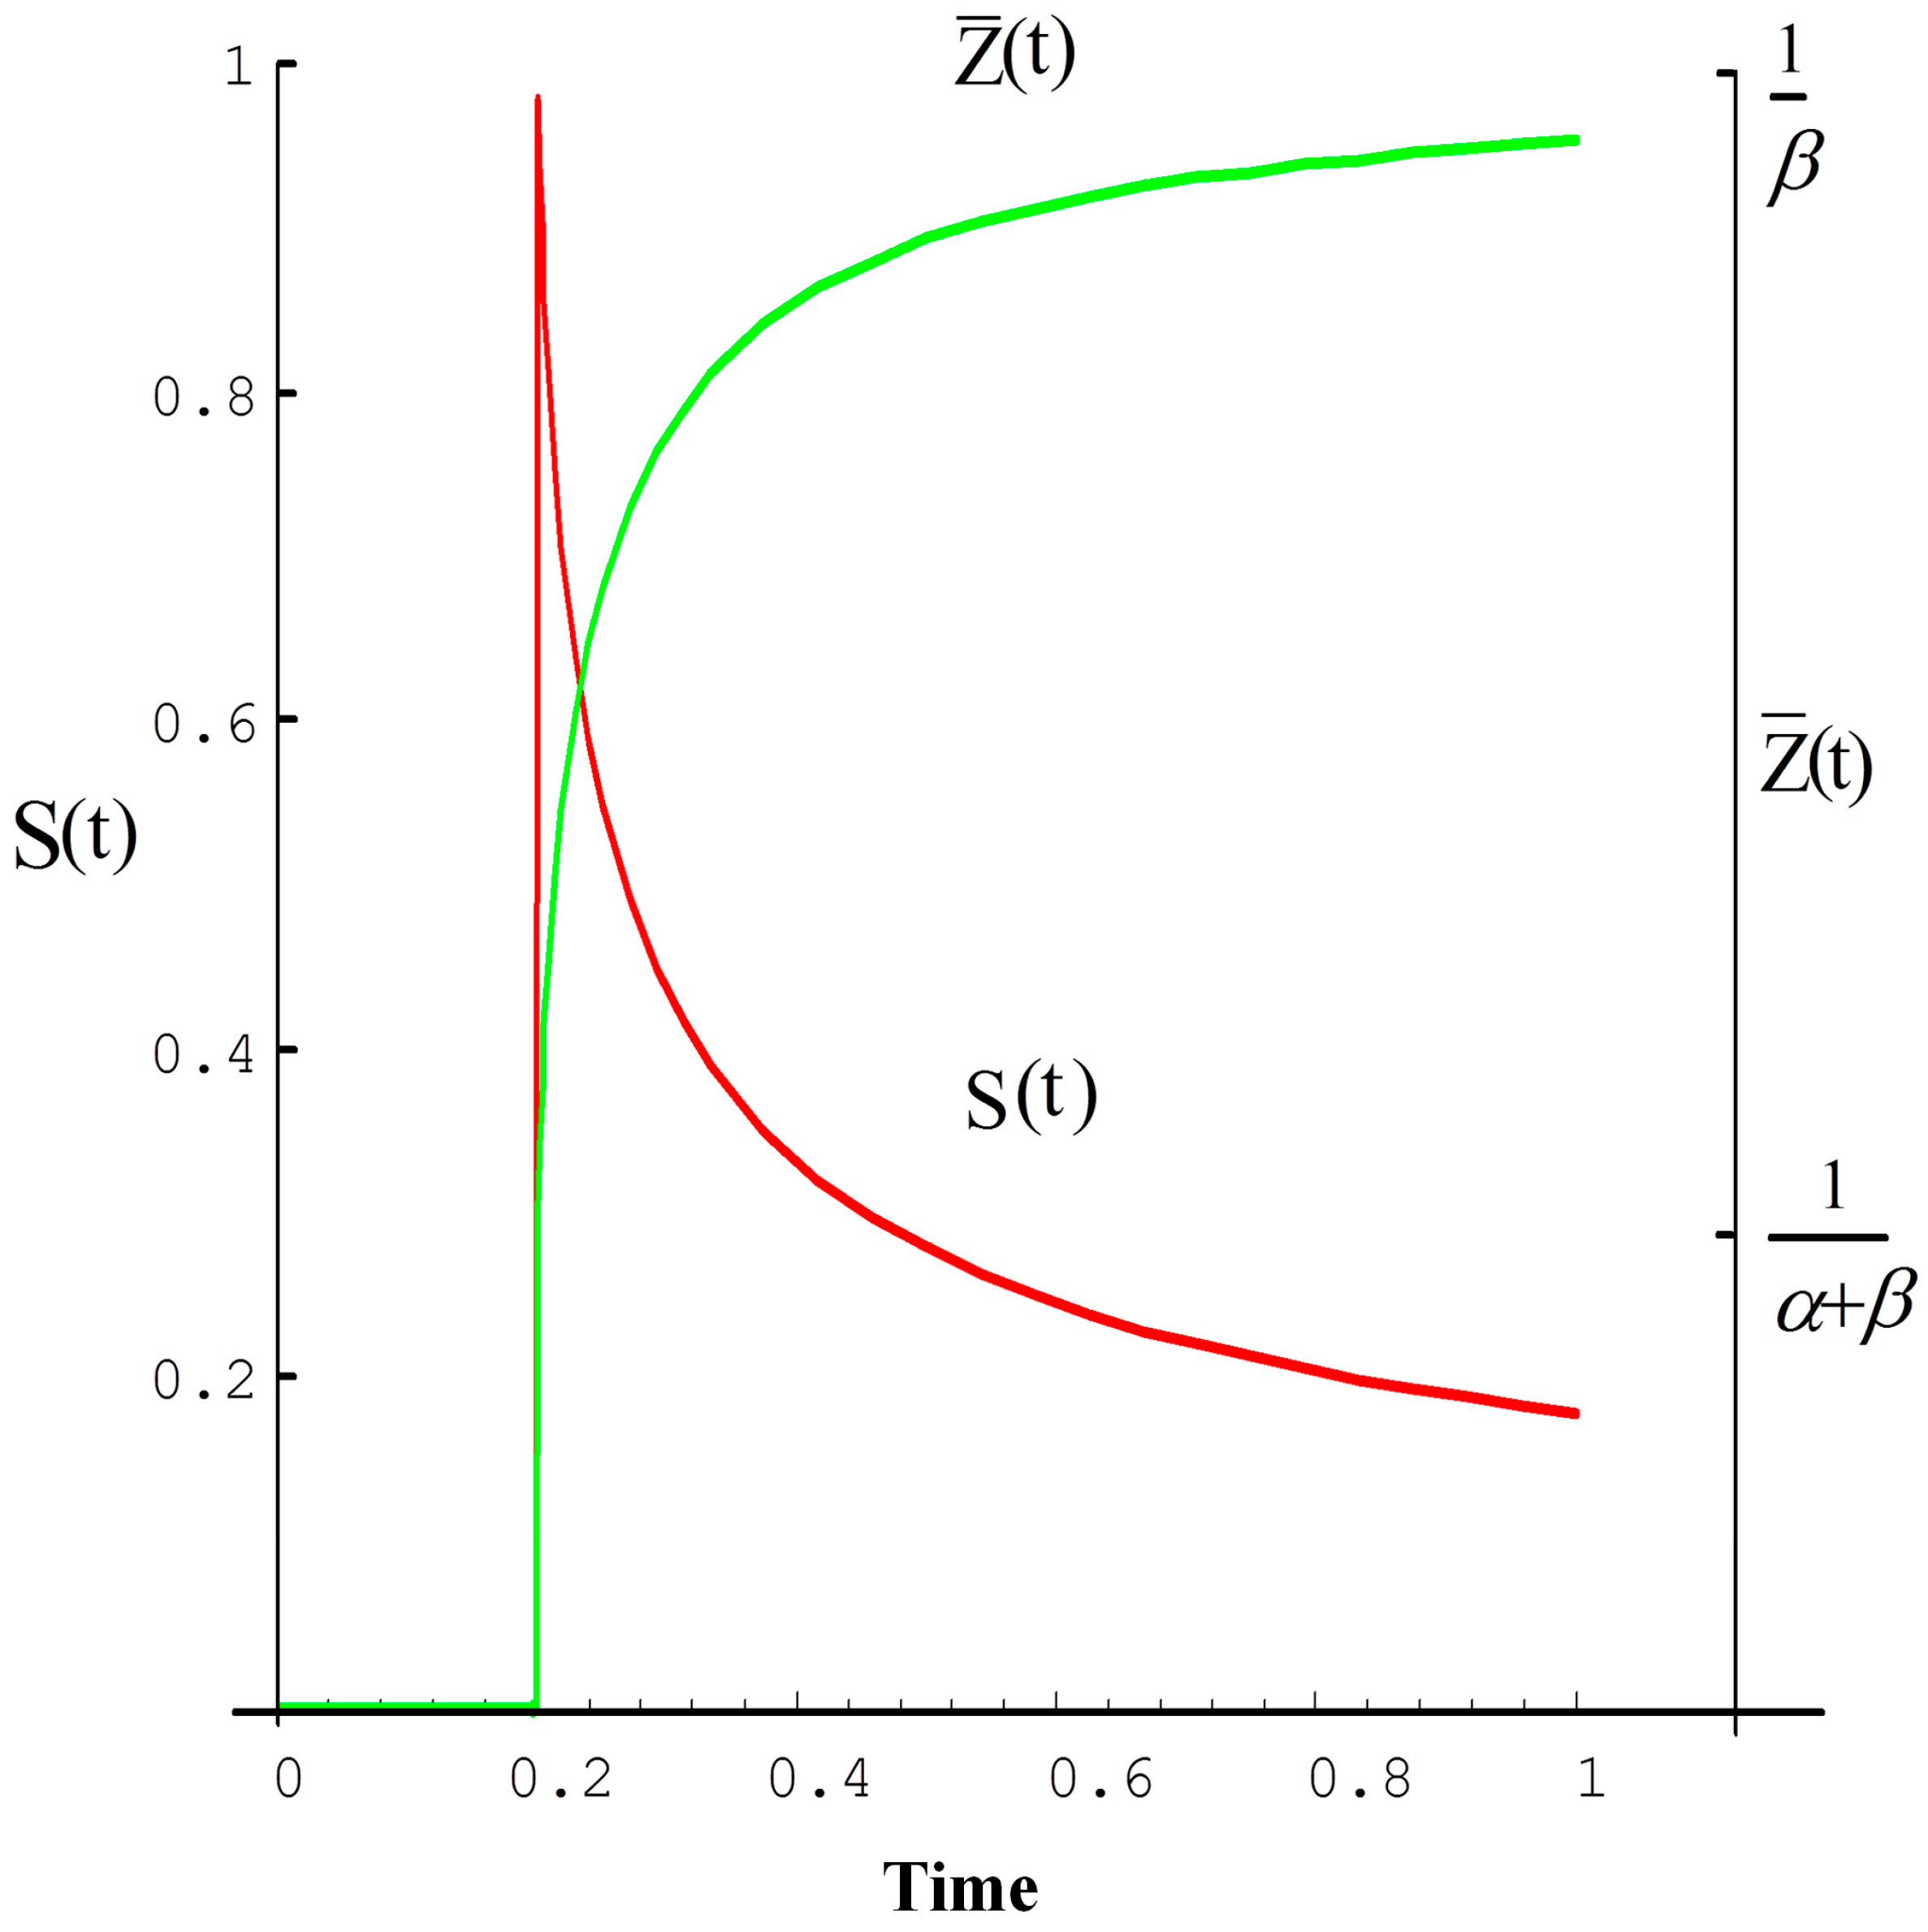
If we assume that skin is optically irregularly non-homogeneous, then Equation (4) will be difficult to solve. However, we can resolve this non-homogeneous issue using our Segmented Least-Squares (SLS) fitting technique [16]. Our previous study shows that, for an OTTER decay signal, at different times after the laser excitation, on average, the signal comes from different depths, which we call the “mean detection depth”, . It can be calculated as [9]:
where is the transient temperature field. Again, under the excitation saturation condition (), we have:
where is the average value of β, calculated by using Equation (6) to fit the whole time-span of the signal. Figure 2 shows a typical relationship between the OTTER signal S(t) and its corresponding mean detection depth for a semi-infinite homogenous sample. Thus, in the case of surface dominant absorption, the initial signal data points give information about the surface of the sample, and later signal data points give information about deeper parts of the sample. In other cases, it depends on the sample’s actual transient temperature and emission absorption coefficient β.
Our Segmented Least-Squares (SLS) fitting data analysis technique is based on the above-mentioned principles [16]. First, we divide the signal data points into a series of small pieces. Second, we use a least-squares fitting routine to fit each piece separately to Equation (6), to get the best-fit value of the decay lifetime for that piece. Finally, we relate each piece’s to its mean radiation depth using Equation (10), to create a depth-resolved profile, which can then be related to the water (or solvent) concentration depth profiles within skin.
3. OTTER Applications
3.1. Skin Pigment Measurements
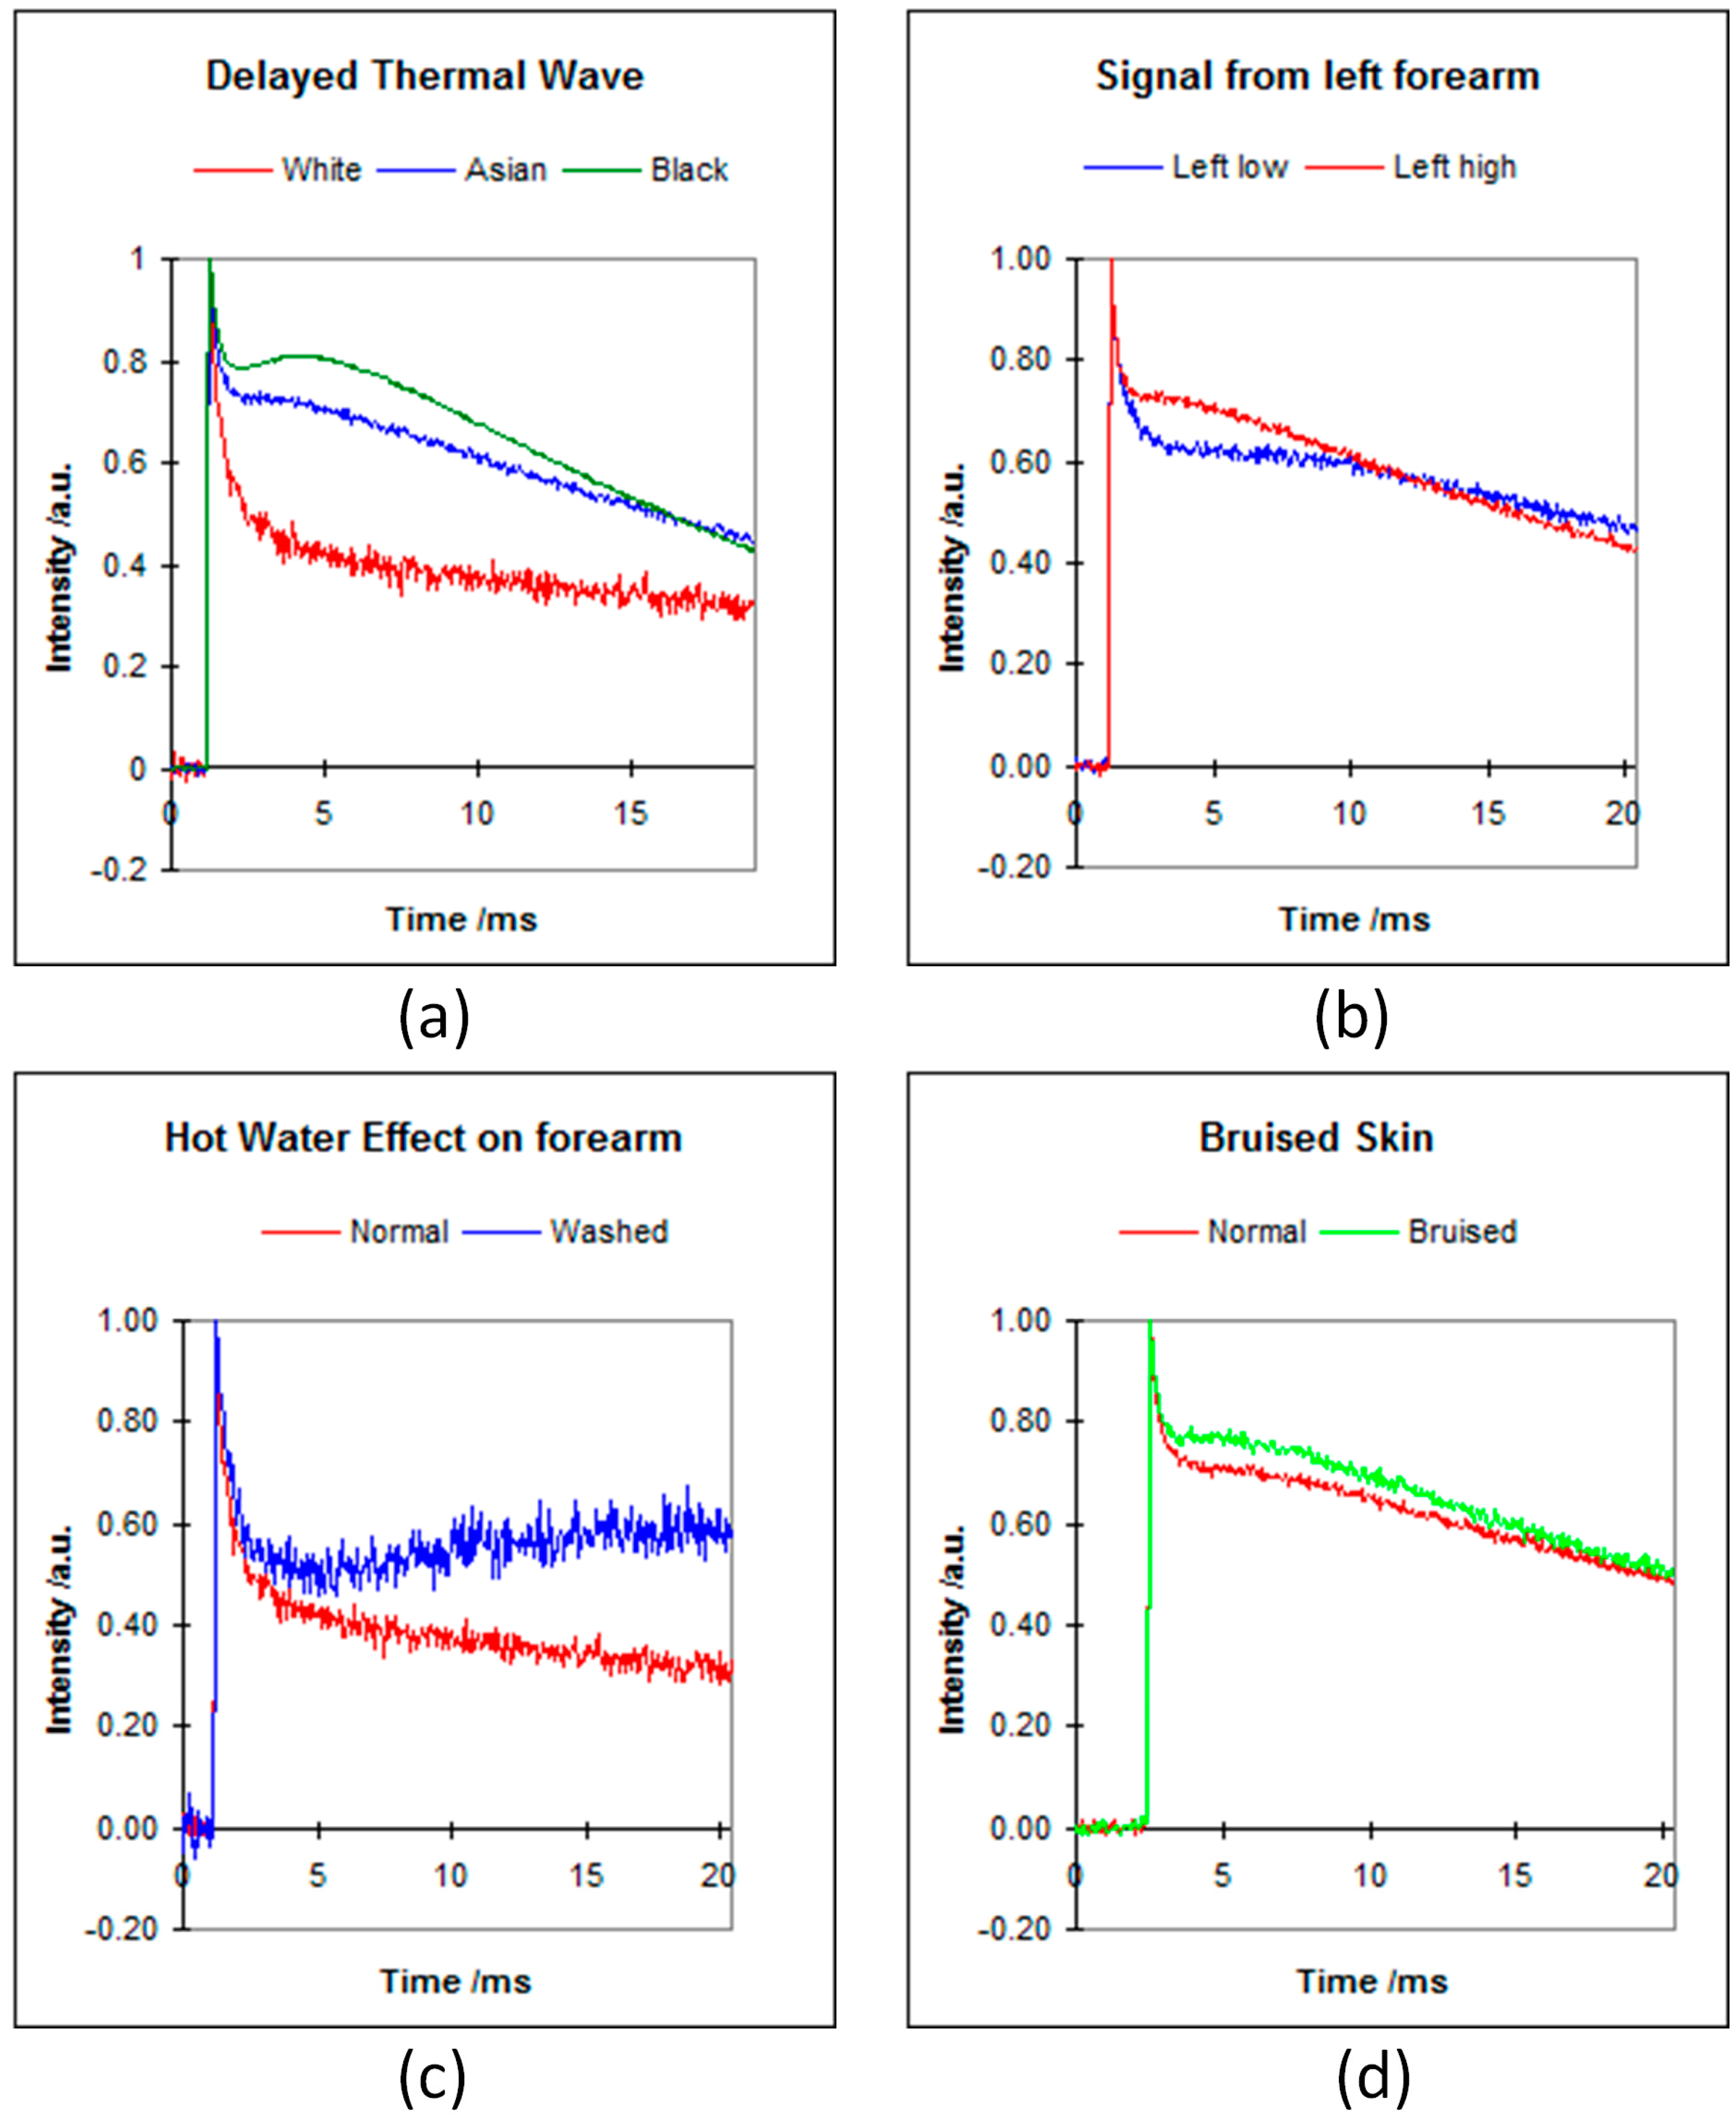
In this case, a Nd:YAG laser (532 nm) or OPO laser (420–590 nm) is used as the heat source in the measurements, and the measurement signal is typically a delayed thermal wave. Figure 3 shows the typical signals of skin pigment measurements [10]. The hump in the signal, immediately after the initial decay, is due to the heat diffusion from deep inside the skin to skin surface.
Figure 3a shows the signals from different types of skin; changes in signals are due to melanin differences. Figure 3b shows the signals from different positions of the volar forearm, changes in signals are due to epidermis thicknesses changes. Figure 3c shows the signals before and after forearm was washed by hot water, changes in signals are due to haemoglogbin changes, i.e., blood flows to surface. Figure 3d shows the signals of normal skin and bruised skin (sport injury, caused by a bump, where blood leaks into tissues under the skin and causes the black-and-blue colour), again, changes in signals are due to blood flowing to skin surface. By fitting the Figure 3 signals using Equation (5), we can get information about the mean melanin and haemoglobin concentration and mean epidermis thickness. By applying to the inverse analysis techniques, such as singular value decomposition (SVD), Conjugate Gradient (CG), Maximum Entropy Method (MEM), etc., we can get more information about the skin pigments’ (melanin and haemoglobin) depth profiles [12,13]. By using different wavelengths with the OPO laser, we can also differentiate melanin from haemoglobin [14,15].
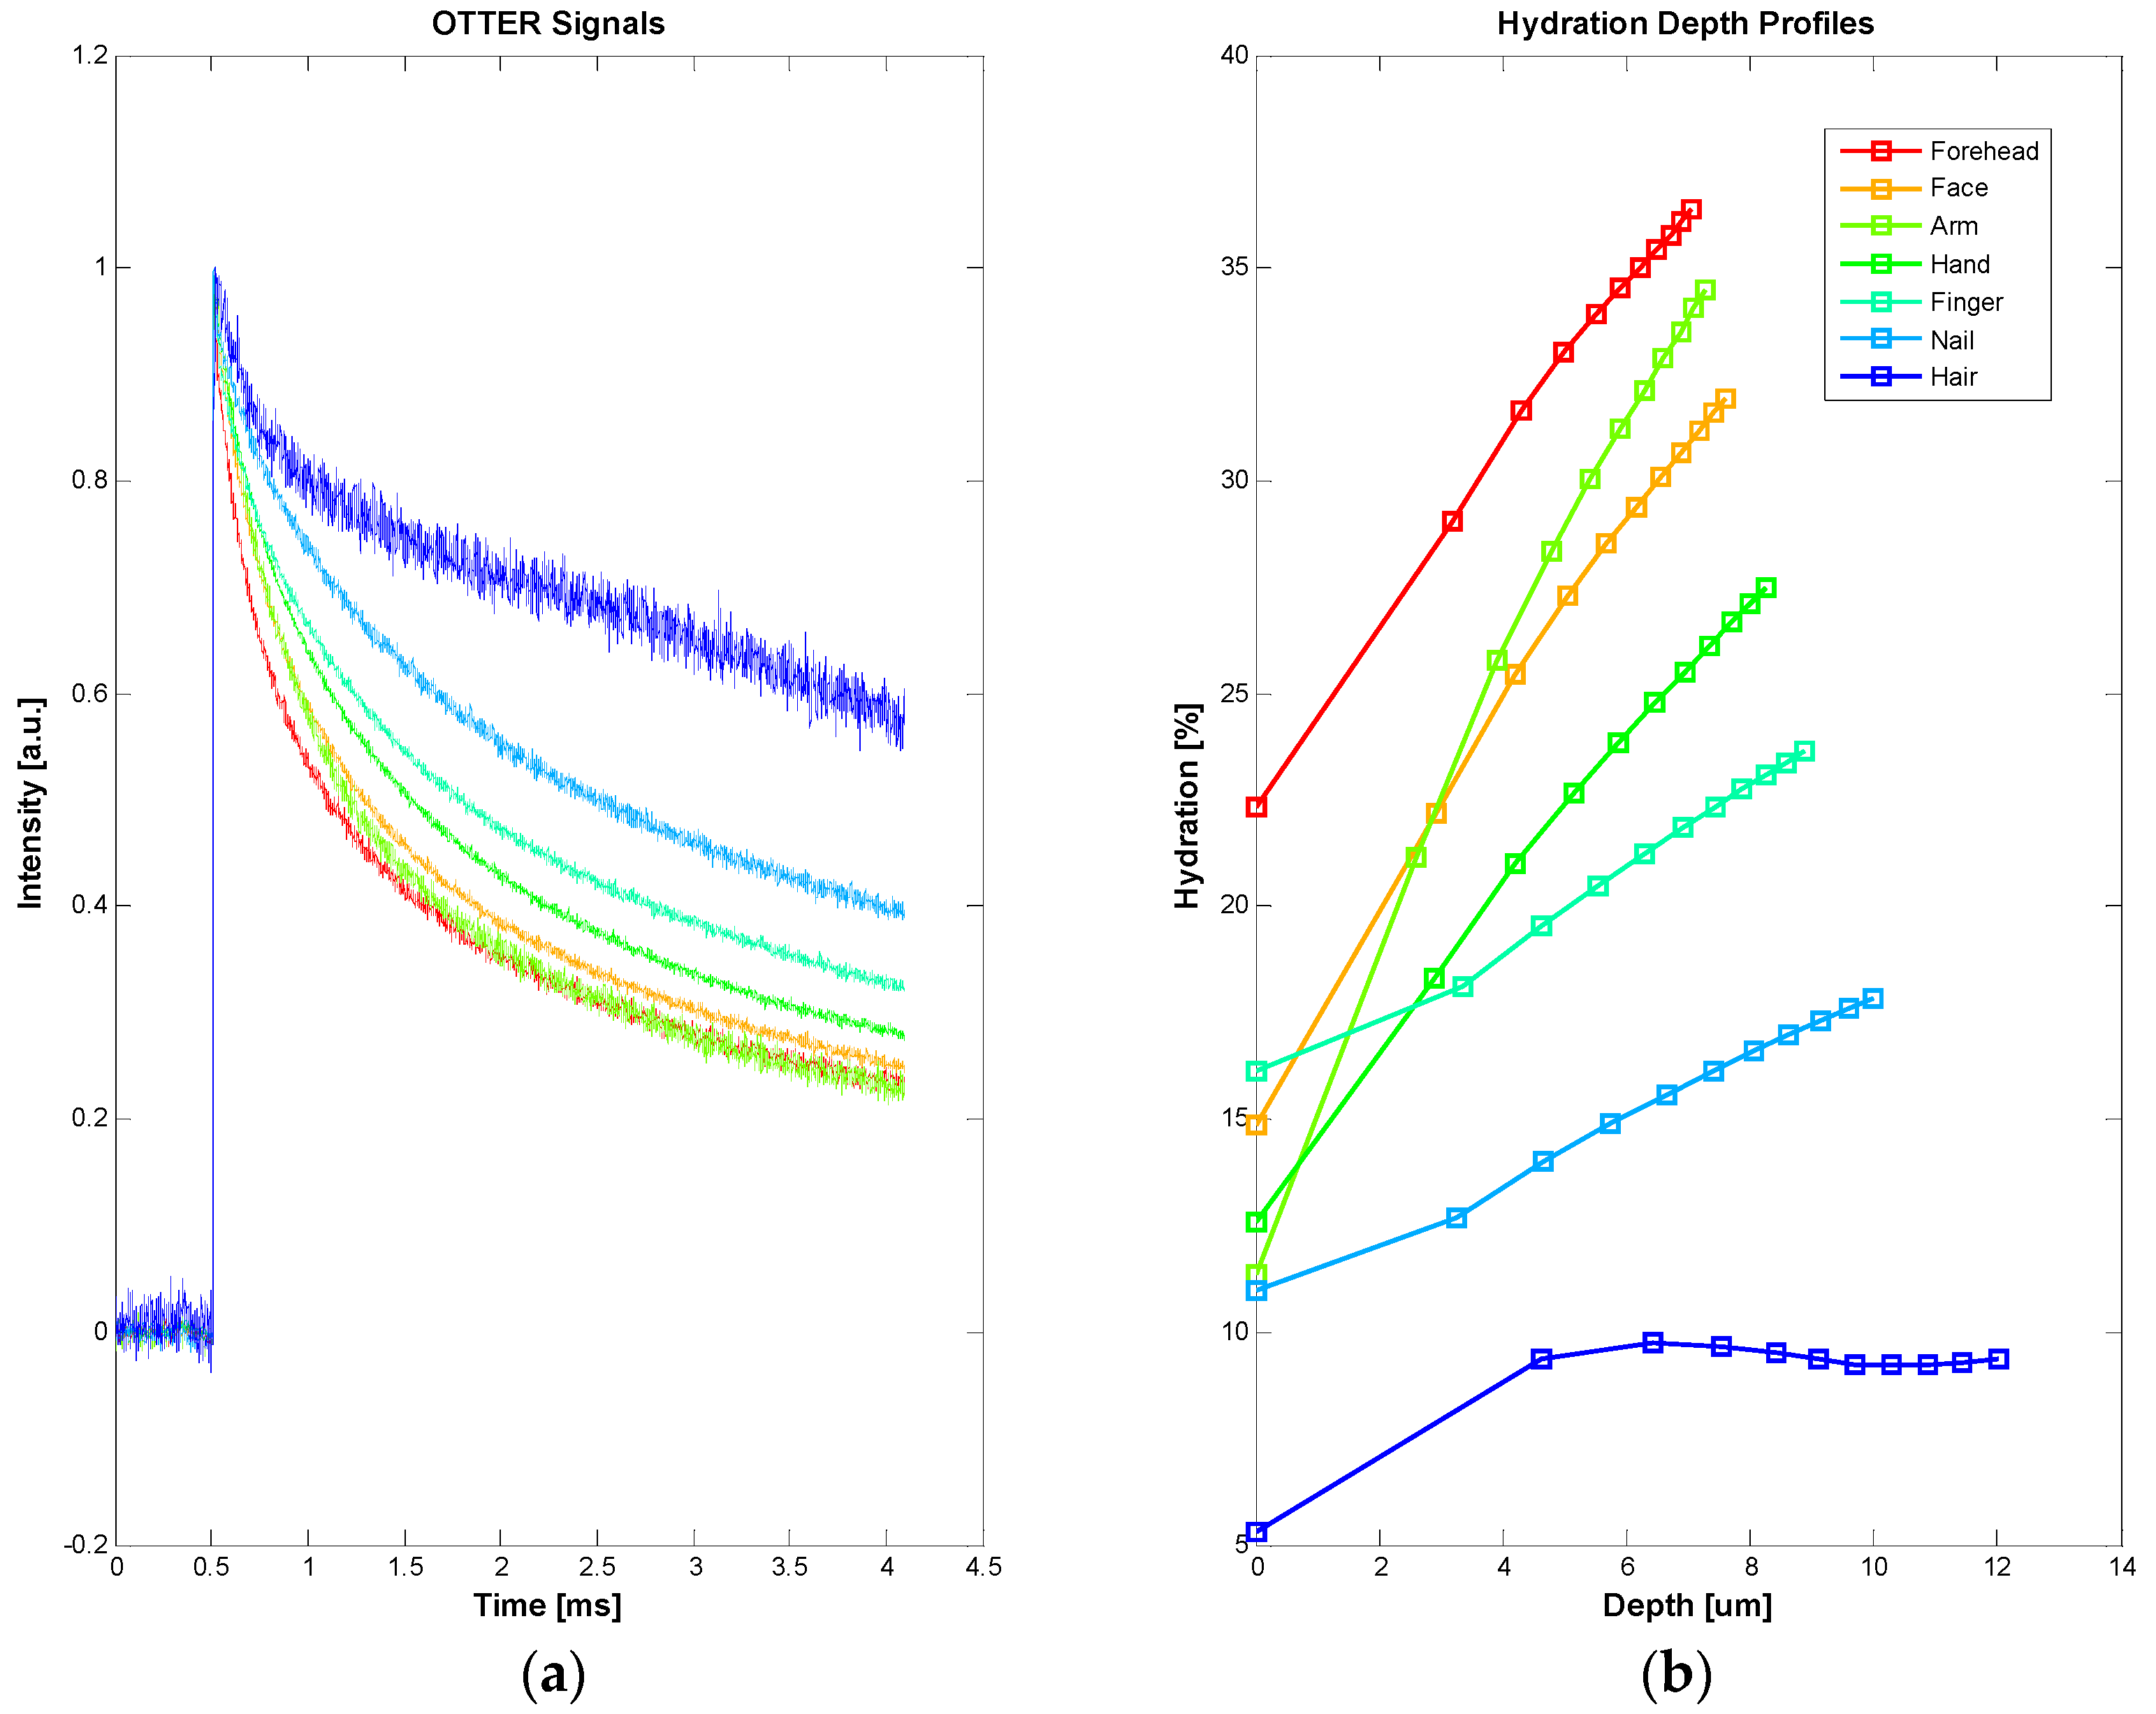
3.2. Skin Water Content Measurements
In this case, an Er:YAG laser (2.94 µm) is used as the heat source in the measurements, and the detection wavelength is 13.1 µm. The measurement signal is typically a decay curve. Figure 4 shows the typical signals of different skin site (a) and corresponding water concentration depth profiles within skin using SLS fitting technique (b). The results show that forehead, face, and forearm have the highest water content and high gradient. Nail and hair have the lowest water content and low gradient. The curved feature of hair hydration depth profile is likely due to the layered hair structure.
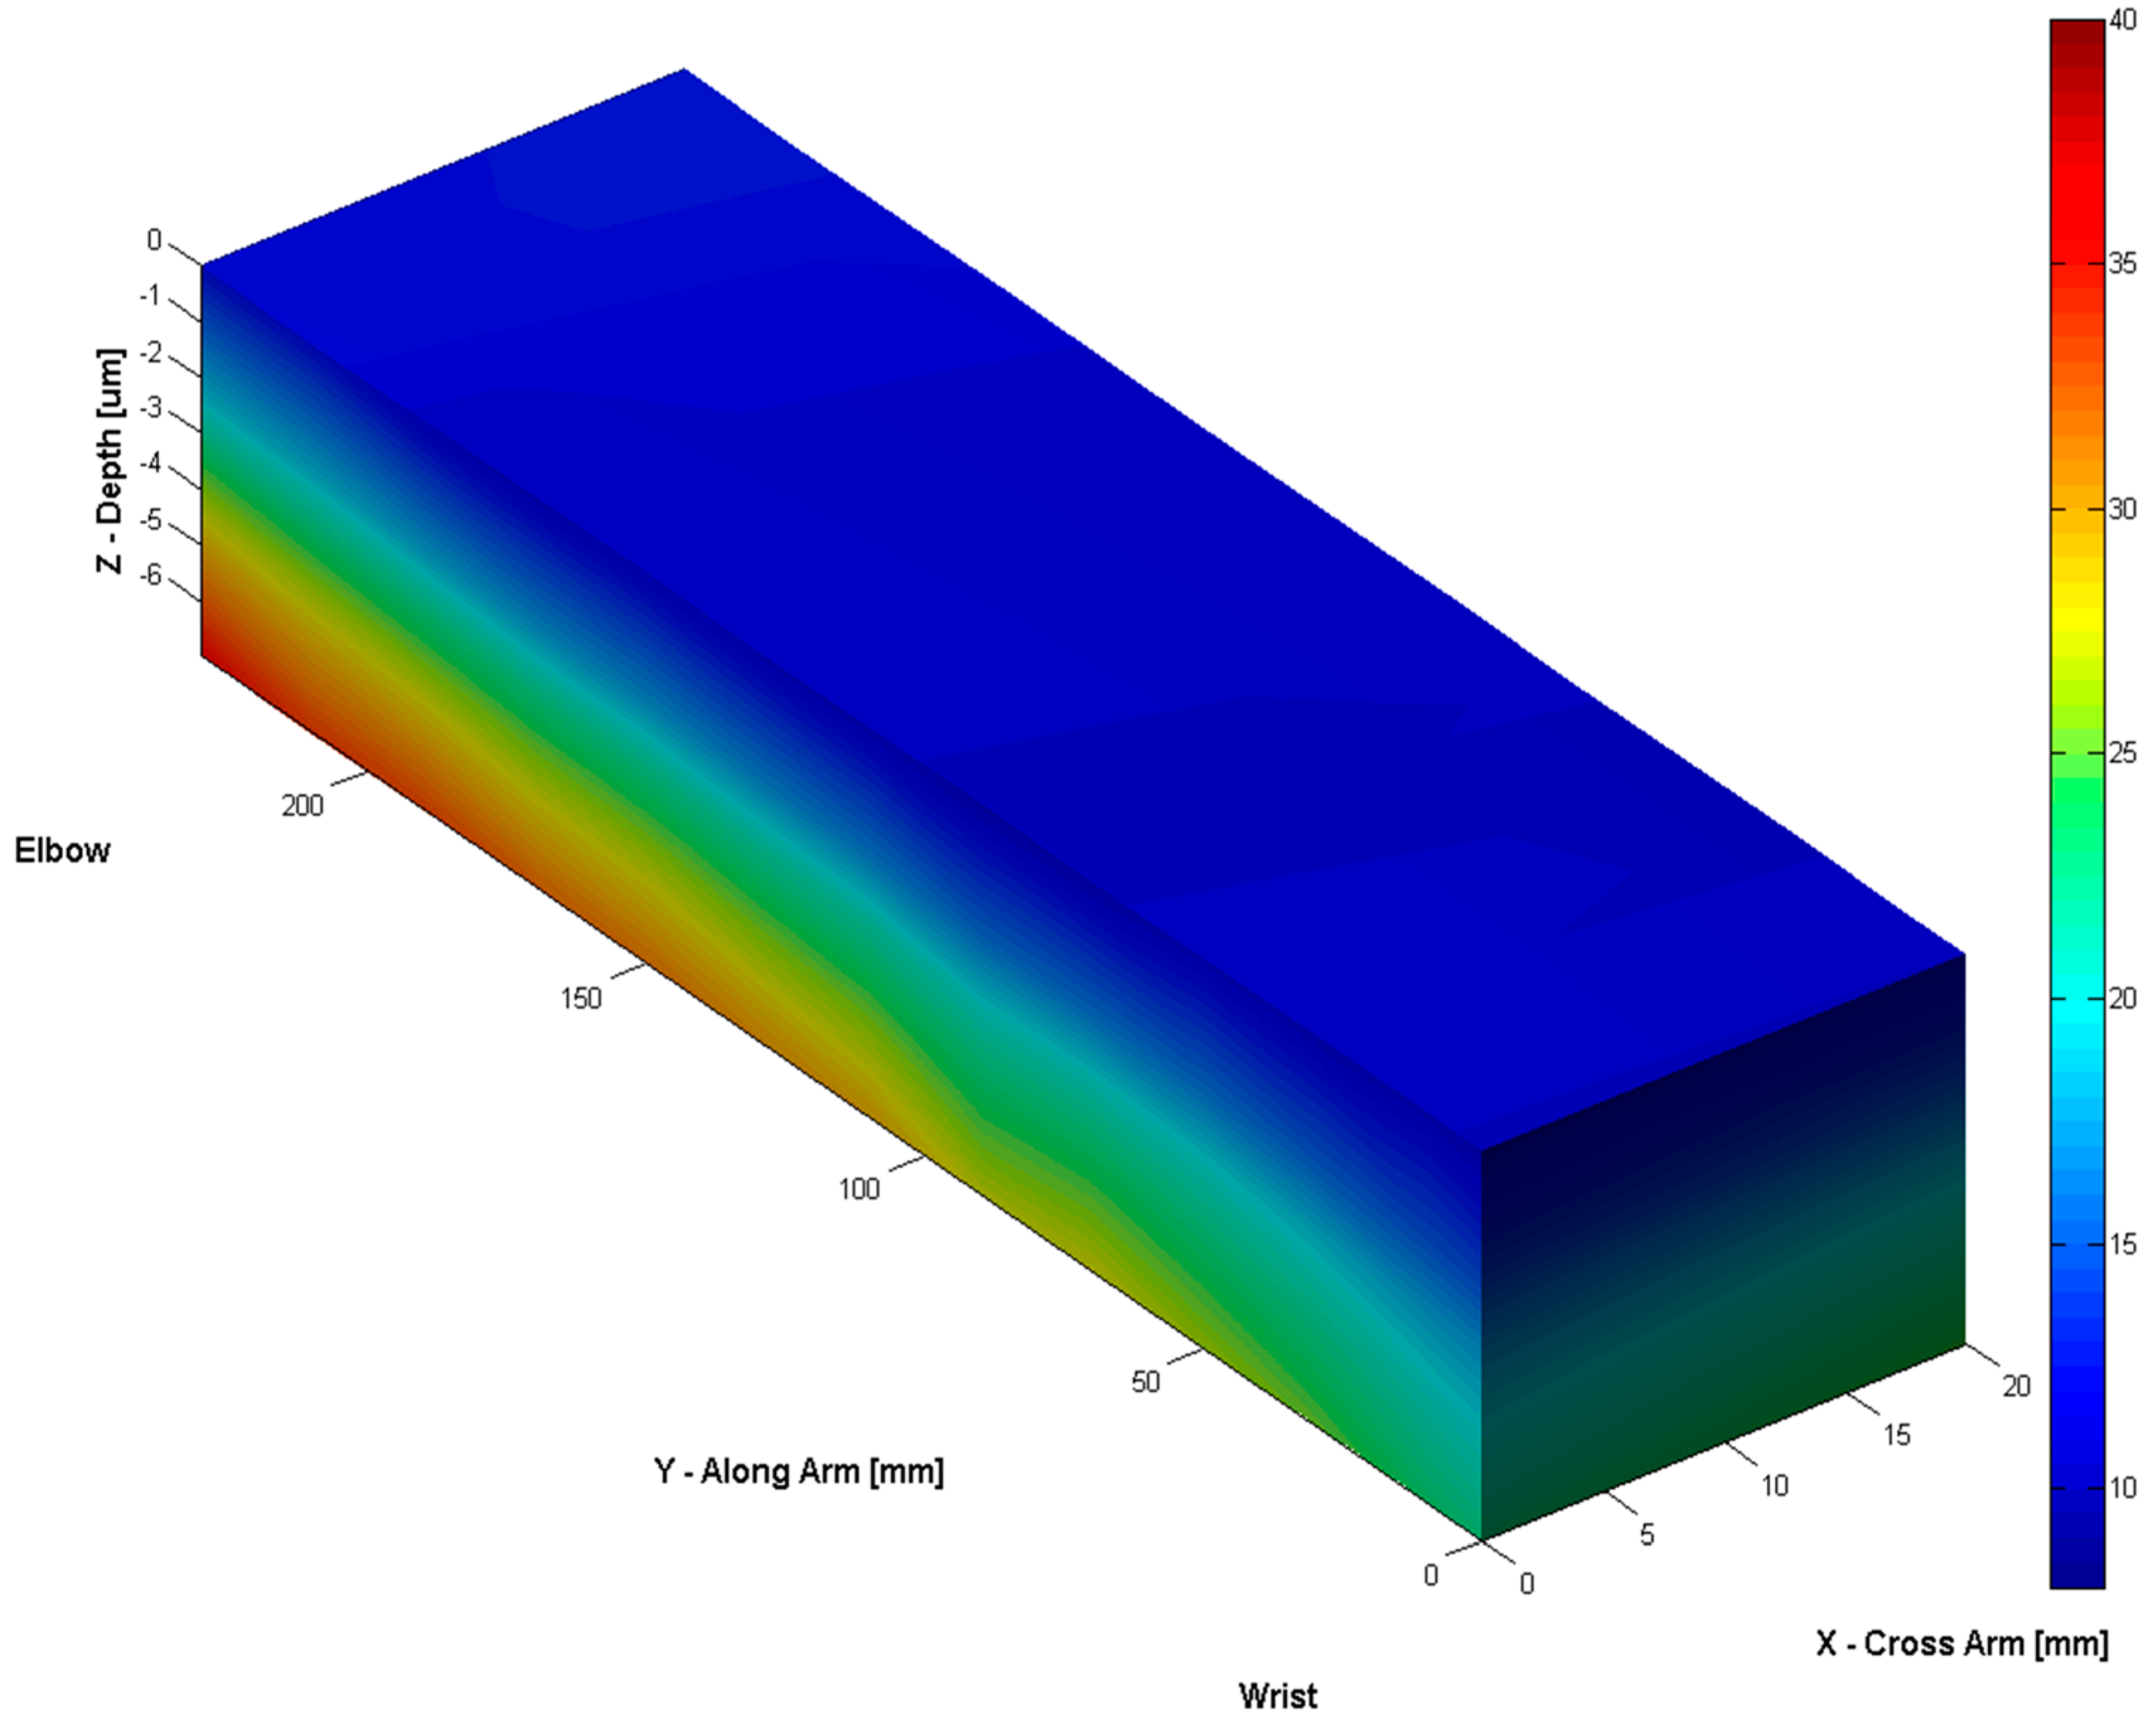
By scanning along the surface of volar forearm, we can also produce a 3D water concentration depth profile within skin, see Figure 5. The result shows that water distribution on the surface is relatively uniform, but the depth profiles are quite different along the arm from wrist to elbow. Across the arm, near the wrist, water distributions are also different from one side to another. This is likely to reflect the stratum corneum thickness changes at different positions of the arm.
3.3. Solvent Penetration Measurements
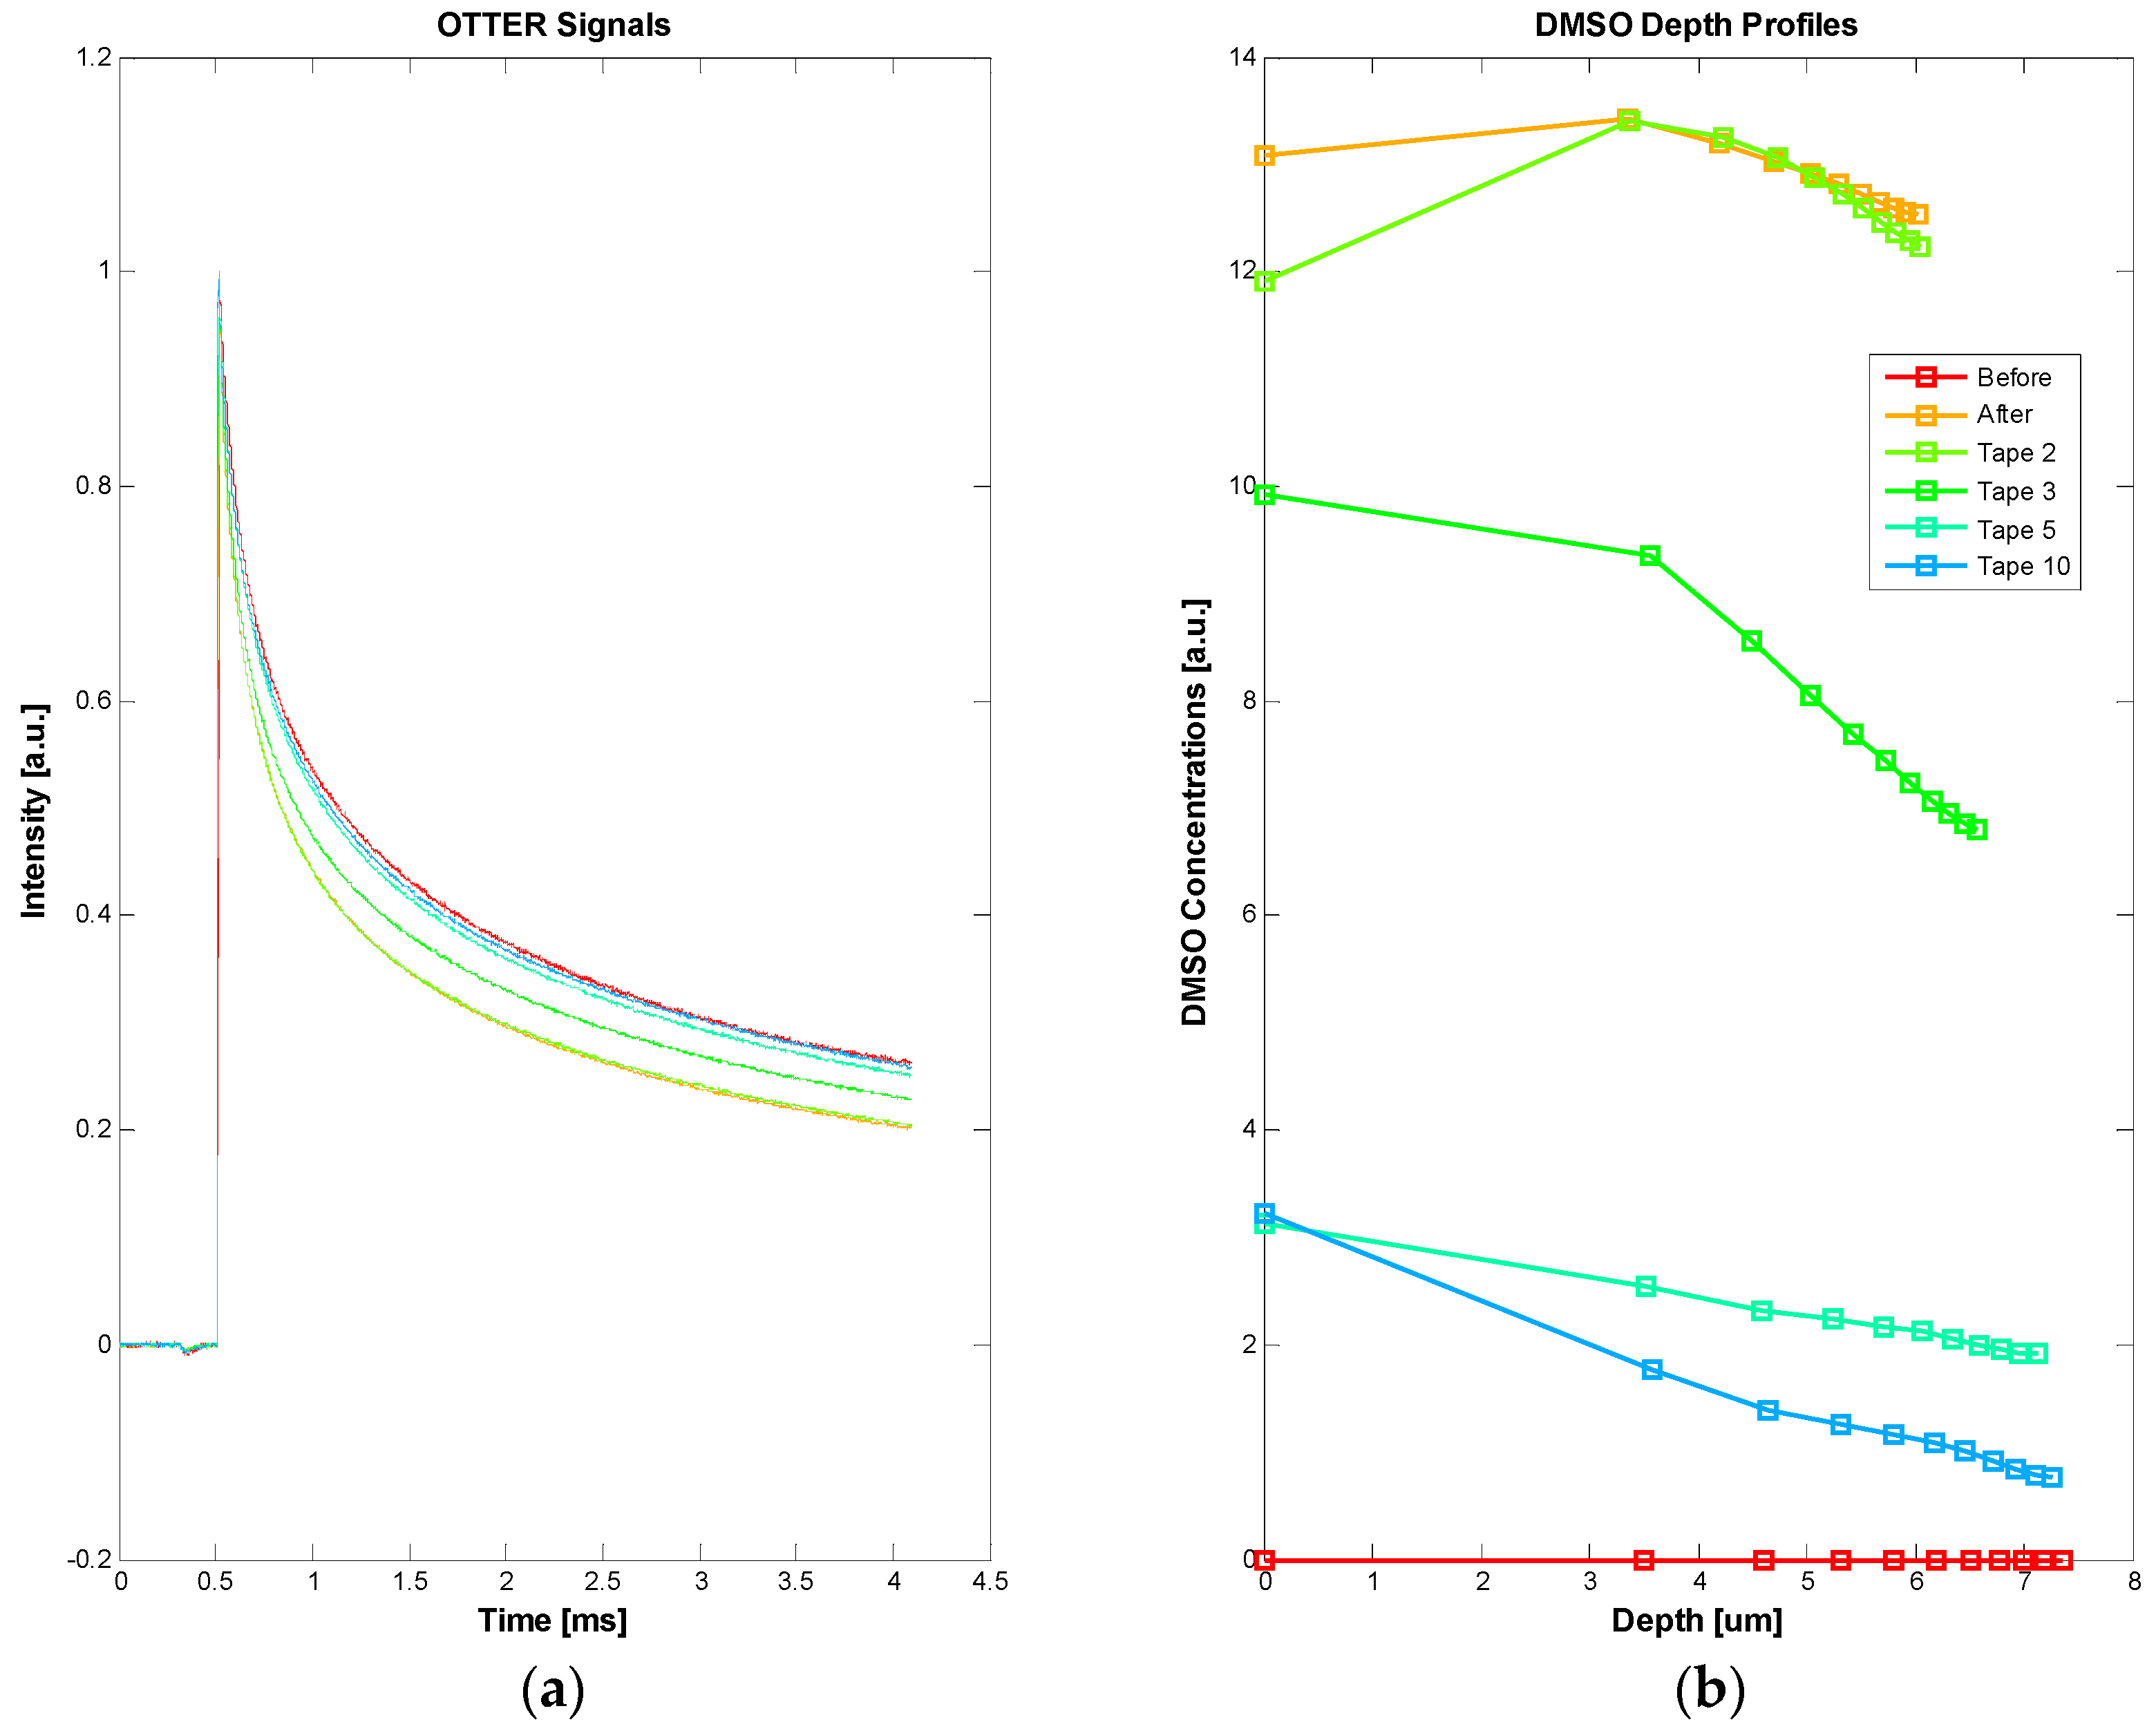
By selecting detection wavelength at 9.5 µm, where water has relatively low absorption and chemical solvents have relatively high absorption, we can also measure the solvent penetration through the skin [16,17,23,24]. Figure 6 shows the OTTER results of Dimethyl sulfoxide (DMSO) penetration through skin. In this measurement, a small amount of undiluted DMSO solvent (~0.1 mL) is applied on a test skin site for 5 min. After the skin surface is wiped dry, tape stripping is performed, in order to see how much and how deep the DMSO penetrates. OTTER measurements are performed, both before and after the DMSO solvent application, and after each tape stripping, with a total of 10 tape strips applied. Figure 6 shows the OTTER signals (a), and the corresponding DMSO concentration depth profiles using SLS fitting technique at different tape stripping (b). The results show a high DMSO concentration immediately after its application, and then as tape stripping continued, deep into the skin, DMSO concentration gradually reduced. Other solvents that have been studied include propylene glycol, ethylene glycol, glycerol, alcohol, decanol, butyl acetate, etc. [23,24]. OTTER can work well on both in vivo and in vitro skin samples.
3.4. Nail Measurements
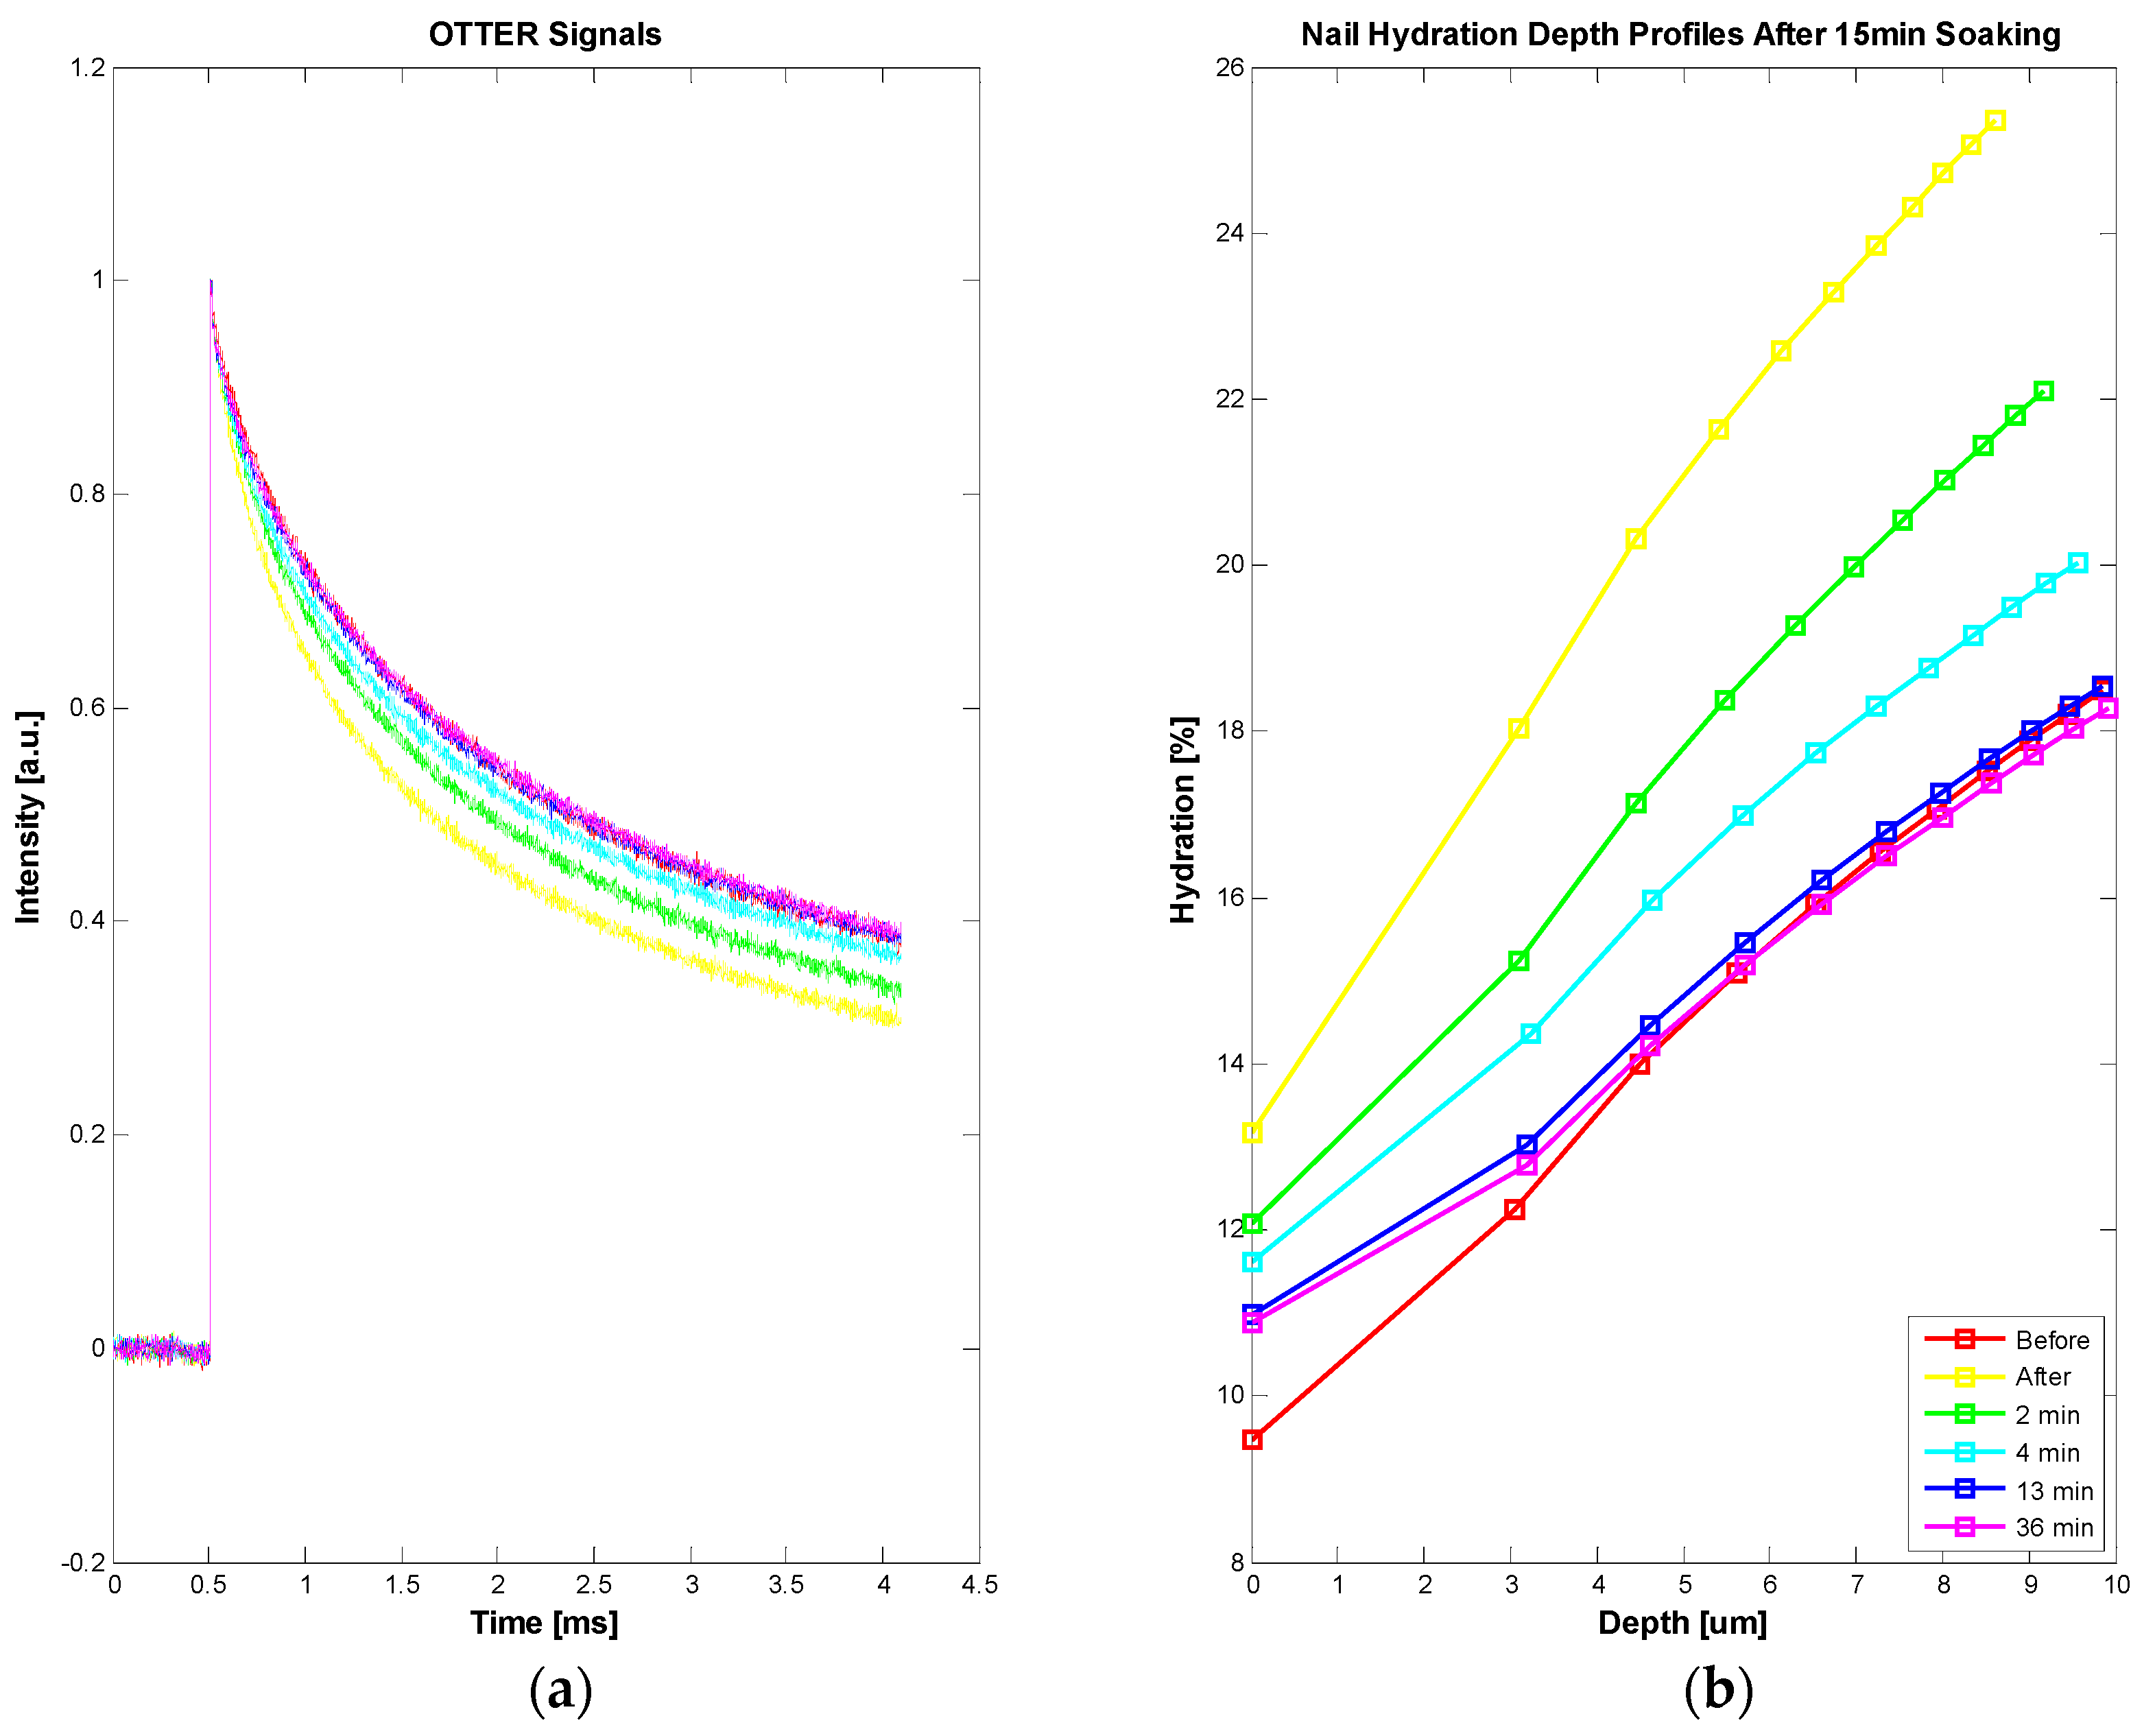
Apart from in vivo and in vitro skin samples, OTTER can also work on nails, for both water content measurements and solvent penetration measurements [24,25]. Figure 7 shows the OTTER signals of human fingernail (a) and corresponding water concentration depth profiles before and after a 15 min soaking in water (b). In this experiment, a left hand nail was soaked in room temperature water for 15 min, then carefully patted dry. The OTTER measurements were performed both before and after soaking. The nail water concentration has increased after the soaking, indicating absorbing of water through soaking, and then as nail recovered in ambient condition, the nail water concentration gradually reduced to the normal level.
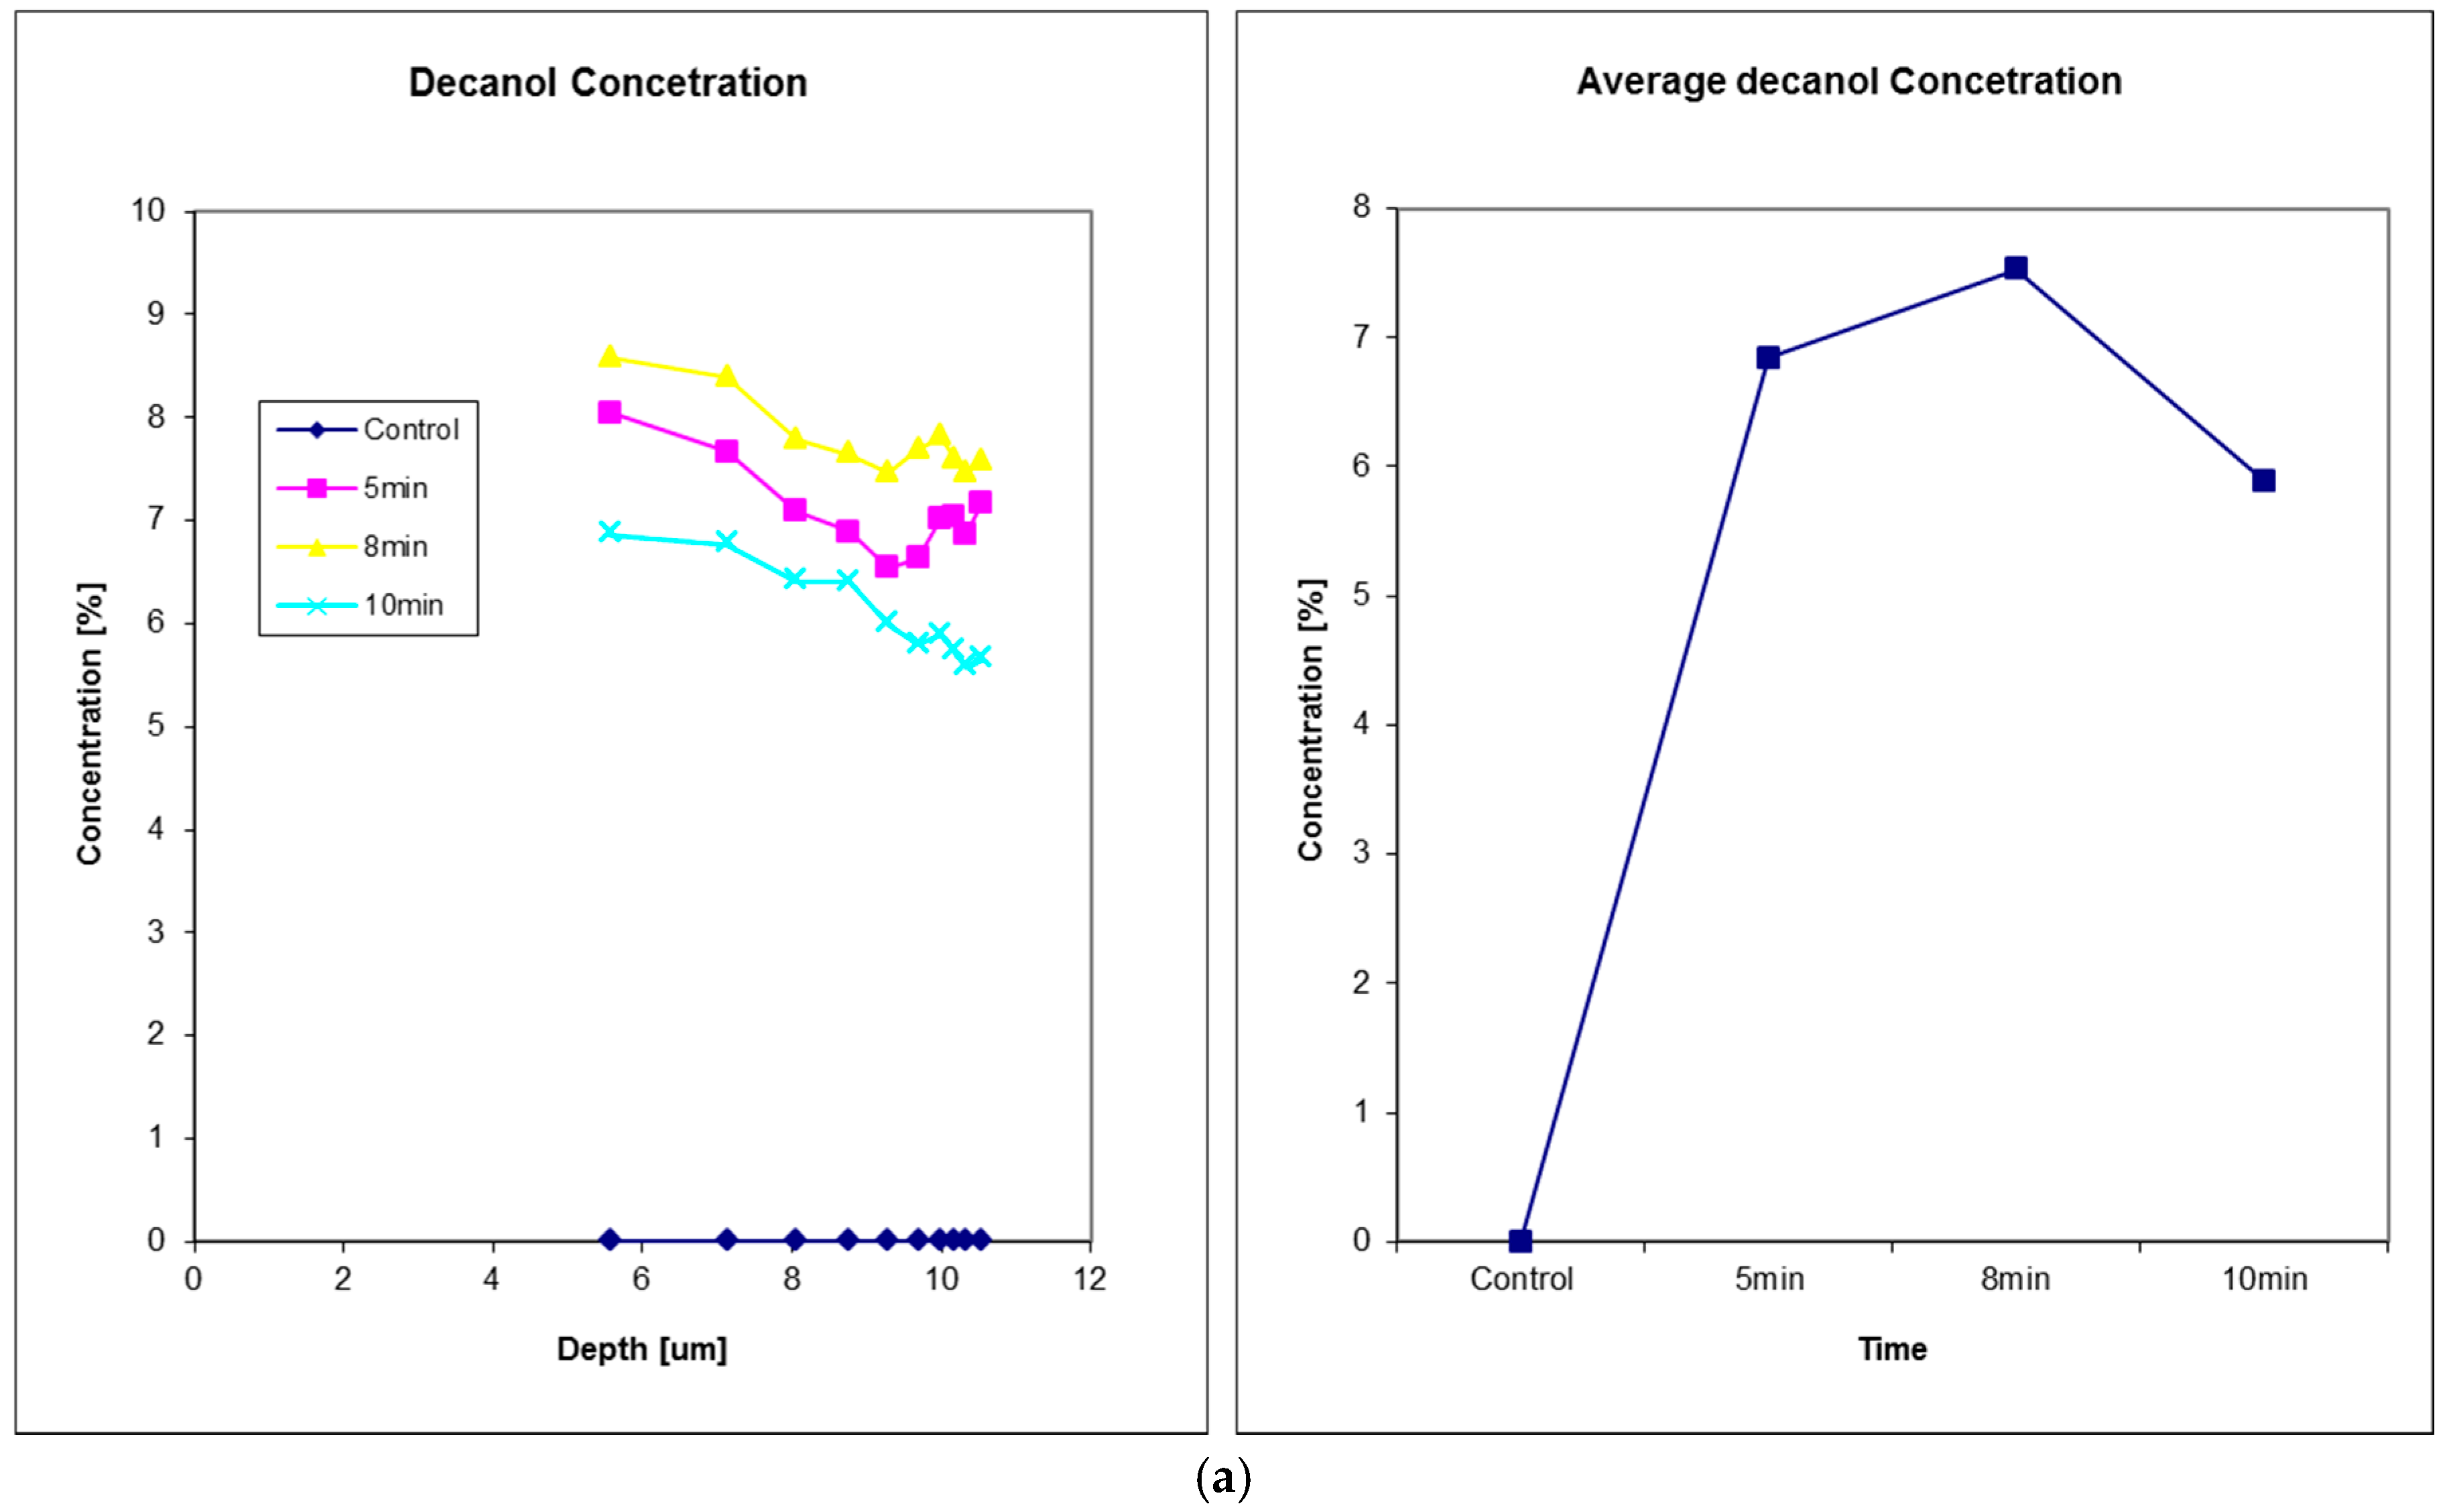
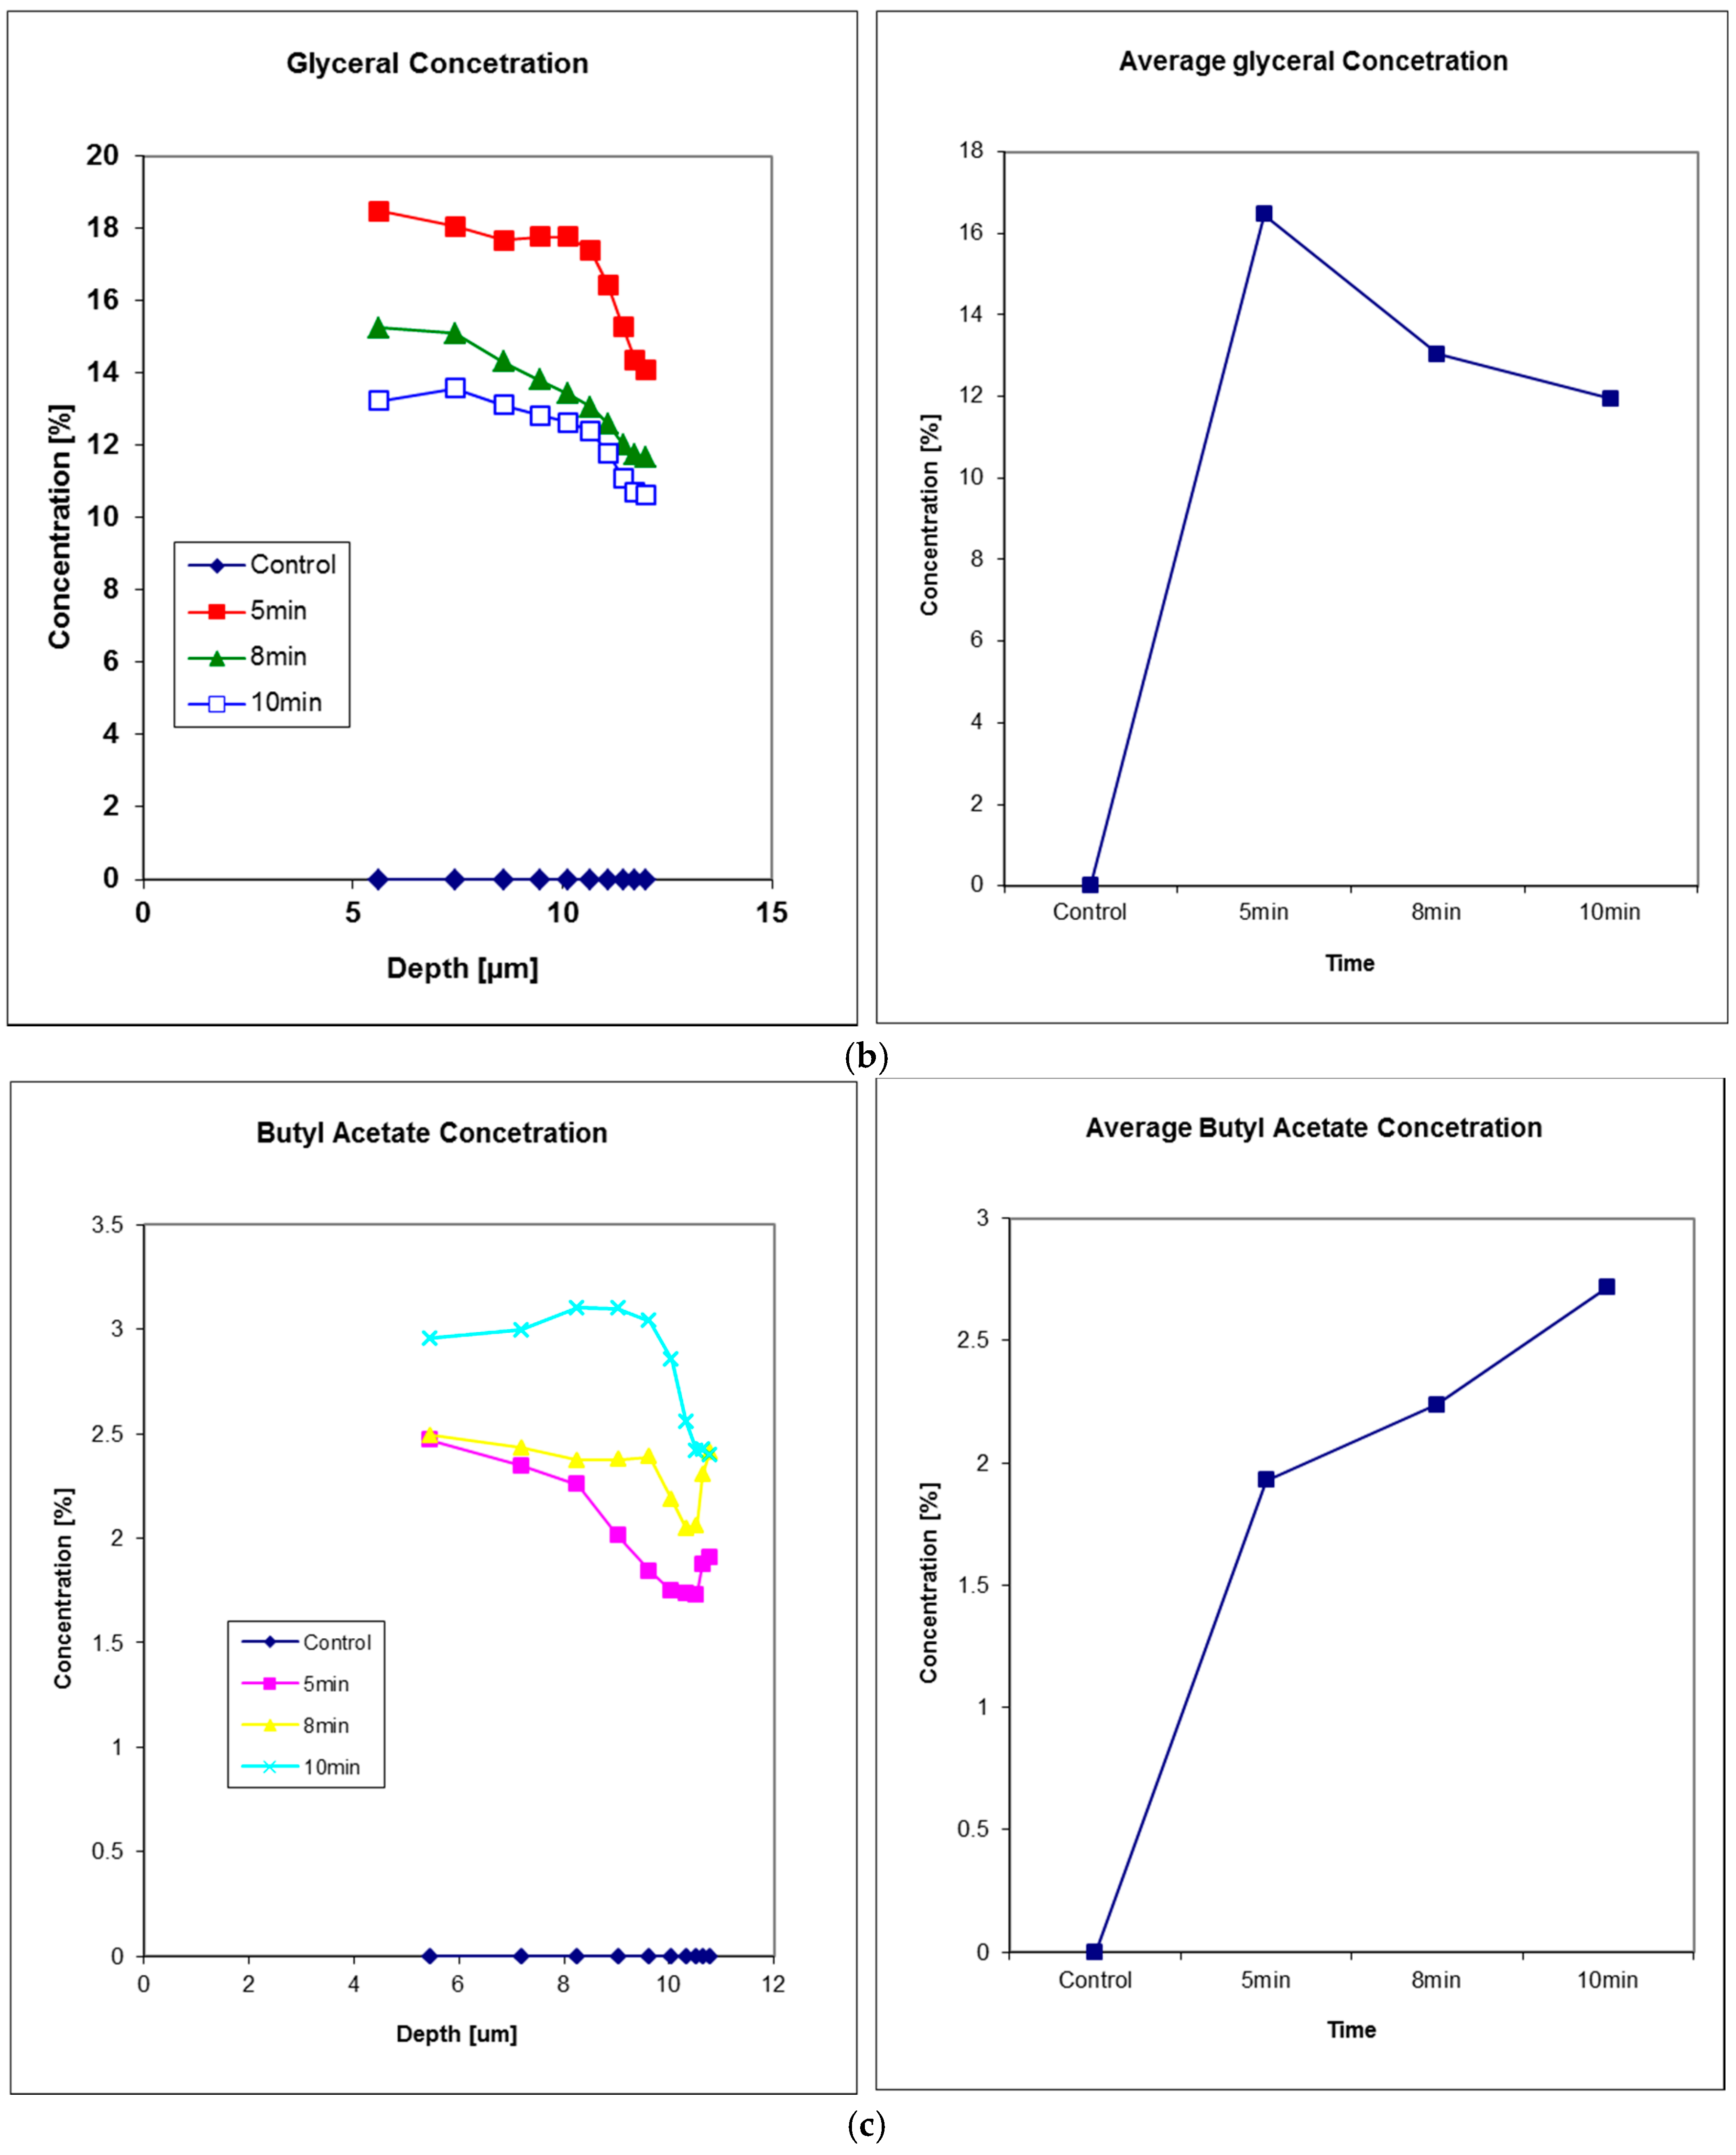
Figure 8 shows the solvent penetration through nail measurements, data from Reference [24]. In this experiment, three solvents were studied, glycerol, decanol, and butyl acetate. Solvents were applied to the fingernail of a volunteer using a filter pad (Cat. No. 1001 110, Whatman, Kent, UK) for a period of 5 min. The pad was then removed, the nail wiped ,and the solvent decay measured on removal and then at 8 and 10 min after the initial application. Glycerol exhibits the fastest diffusion through nail tissue of the three solvents tested, as after 5 min the concentration profile immediately starts to decrease.
3.5. Hair Measurements
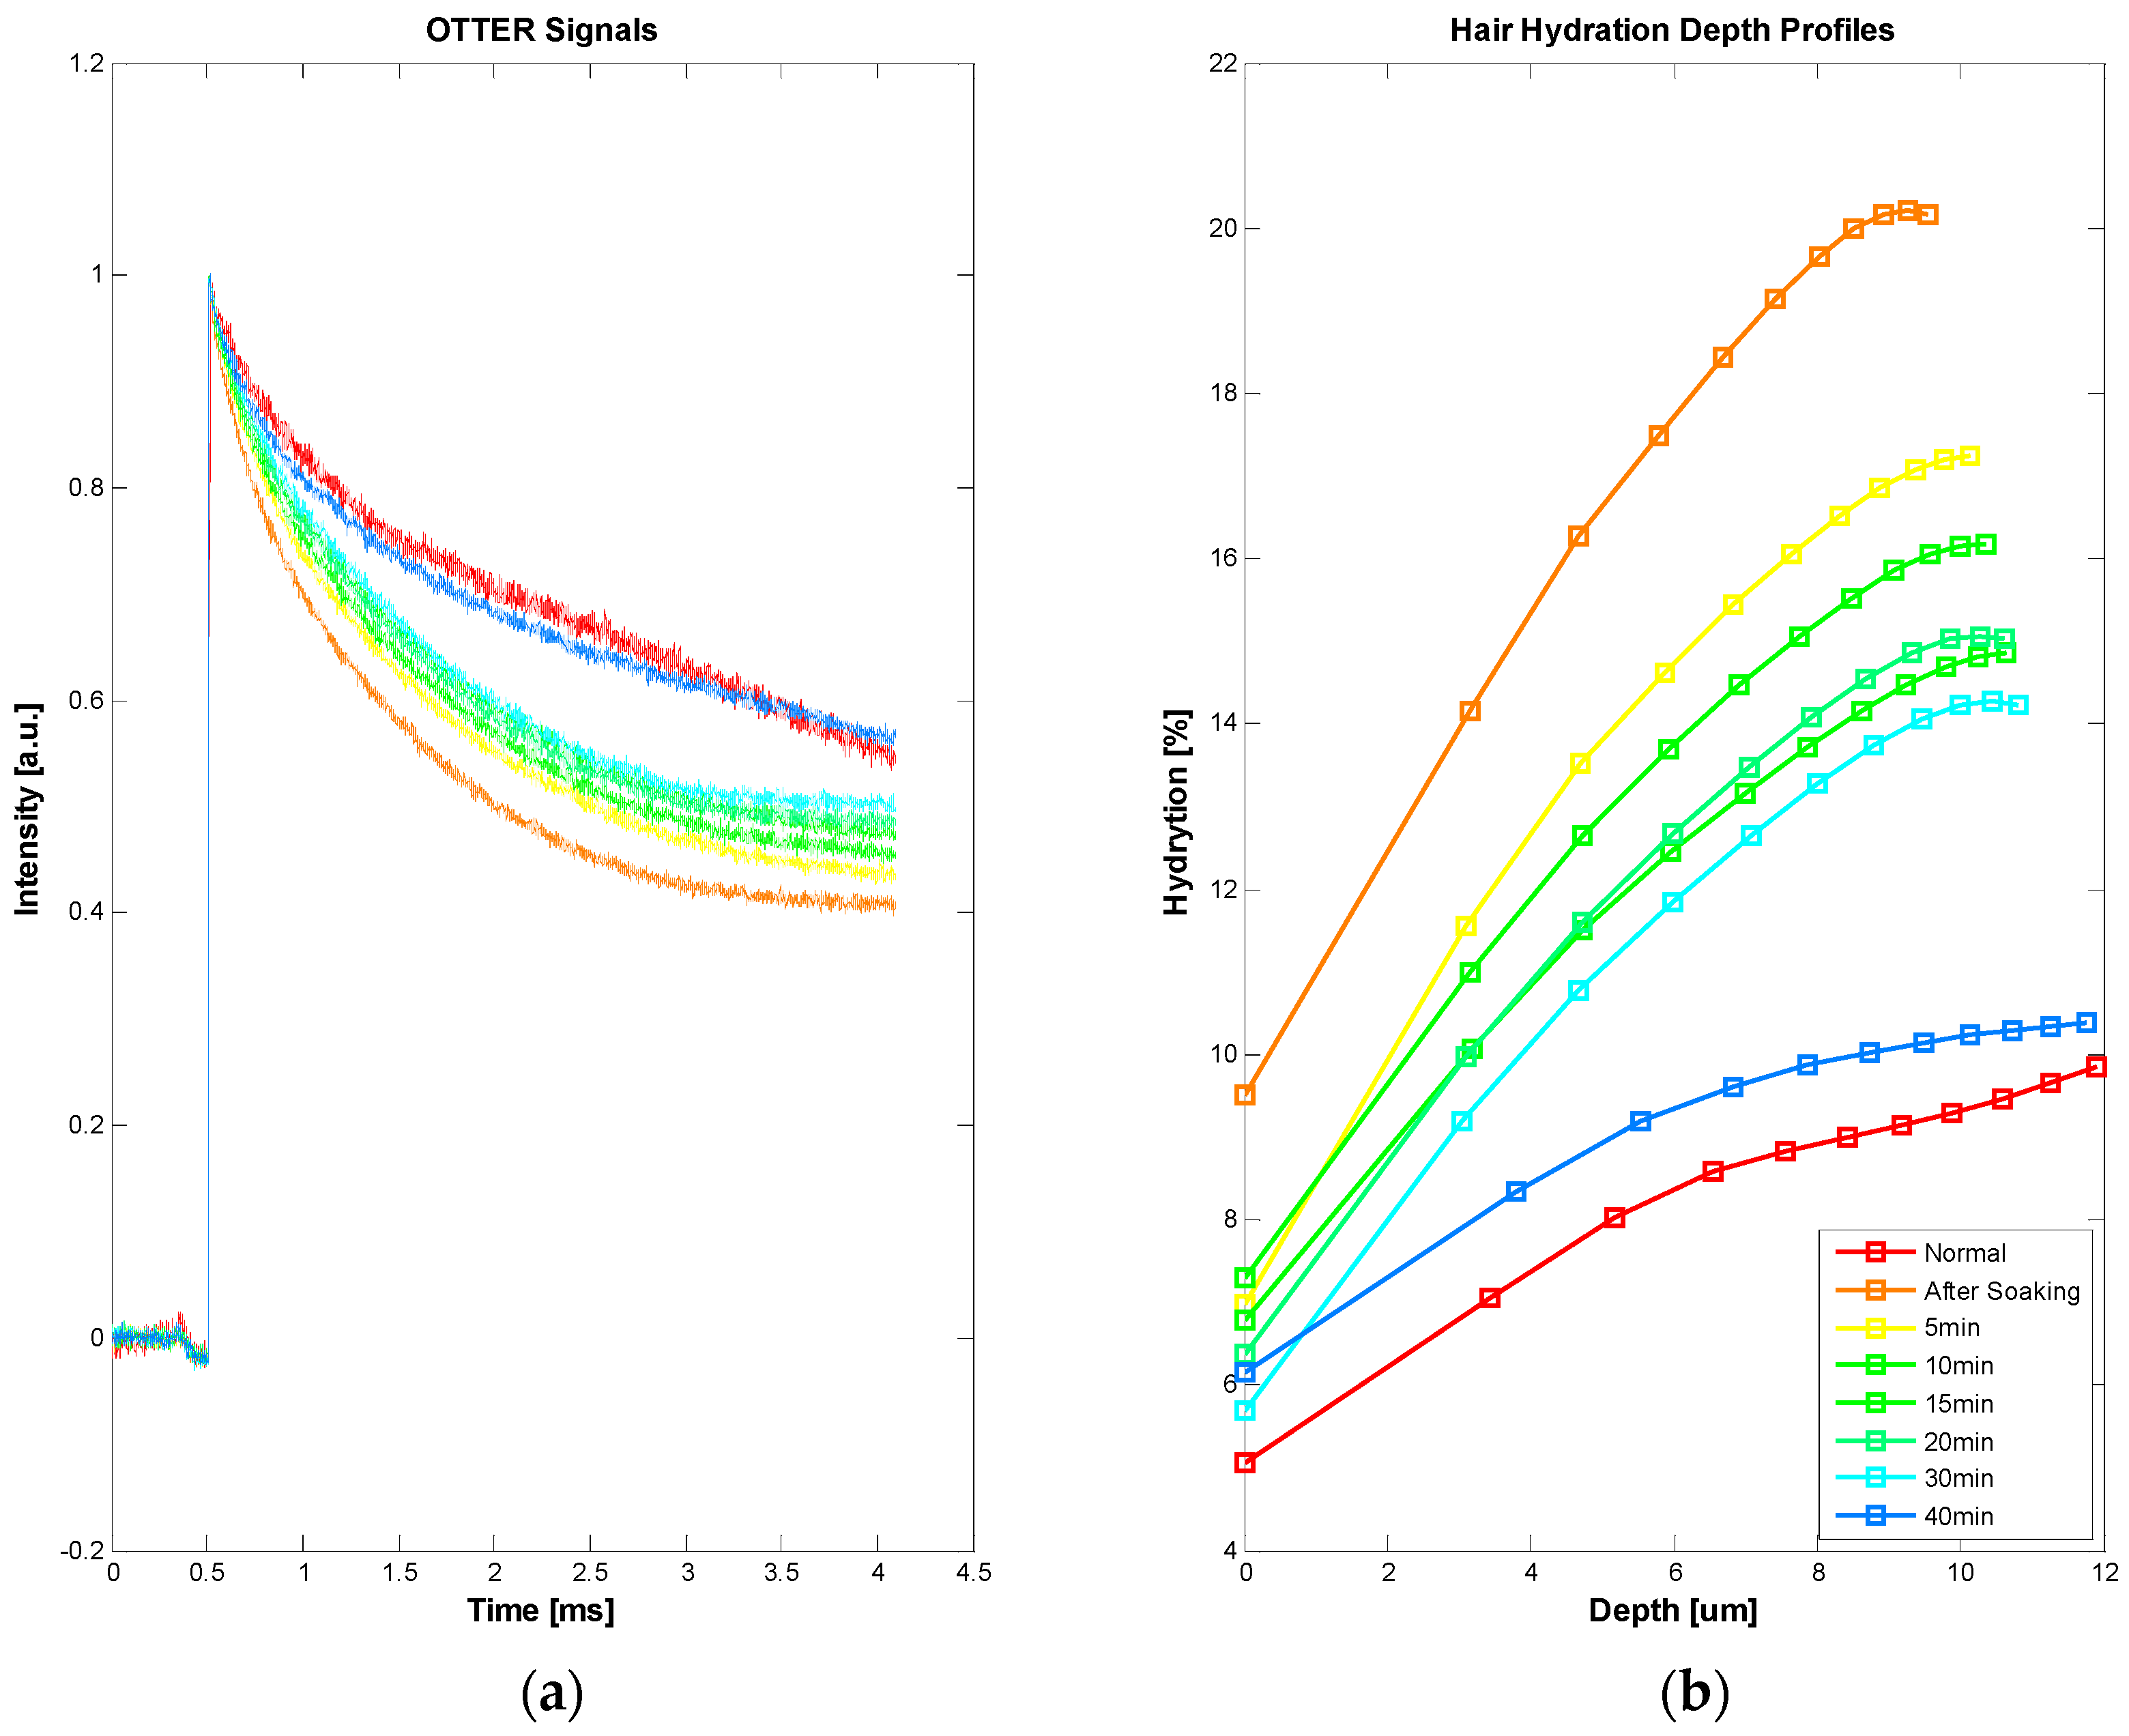
Our latest study shows that OTTER can also be used for hair measurements, despite of low water content in the hair. Figure 9 shows the hair water content measurements. In this experiment, an ex vivo hair sample, freshly cut from a healthy volunteer, was hydrated by soaking in room temperature water for 15 min, then patted dry afterwards. The OTTER measurements were performed both before and periodically after the soaking. As explained earlier, in Figure 4, the curved feature of hair hydration depth profile is likely due to the layered hair structure. It is interesting to point out that, immediately after soaking, this curved feature seems to disappear, which might suggest excess water absorbed during soaking has gone into different layers in hair. It is also interesting to point out that it takes more than 40 min for hair to recover to its normal hydration level, this is slower than the skin and the nail in our previous studies [10,26]. Additionally, as hair gradually loses its excess water to the ambient environment, the curved feature of the hair hydration depth profile started to re-appear.
3.6. Future Developments
By combining photothermal radiometry and Fourier Transform InfraRed spectroscopy (FTIR) [9,26,27] or diffraction grating [28], it is possible to achieve photothermal spectroscopy. Different from traditional FTIR, photothermal spectroscopy is depth-resolved, which means we can get the spectra information from both the skin surface and at different depth underneath the skin surface. This could be very useful for the study of skin properties, trans-dermal drug delivery, and skin active ingredients. By using 2D matrix mercury cadmium telluride (MCT) detector, or the X–Y scanning stage, it is also possible to achieve photothermal microscopy. The combination of depth-resolved photothermal spectroscopy and photothermal microscopy will create a whole new measurement technology—Photothermal Hyperspectral Imaging, which is imaging based, non-contact, non-invasive, depth-resolved, and spectroscopic.
4. Conclusions and Future Works
This paper presents a review of the photothermal radiometry technology and its latest developments for skin and skin appendages research and reports its latest developments. Our studies show that photothermal radiometry can be used for a range of skin measurements, including skin pigments, skin water content, solvent penetrations, etc. It can work on skin, nail, and hair, both in vivo and in vitro. Compared with other technologies, photothermal radiometry is non-contact, non-destructive, and spectroscopic in nature. Additionally, it is quick to make a measurement (a few seconds). It is colour blind, and can work on any arbitrary sample surface. Photothermal radiometry also has a unique depth profiling capability, around the top 20 µm of skin surface. For future works, our studies show that is possible to create depth-resolved Photothermal Hyperspectral Imaging, which is capable of generating skin images at different infrared wavelengths and at different skin depths. This opens more potential opportunities, such as skin disease detection, skin cancer diagnosis, etc.
Acknowledgments
We thank London South Bank University for the finance support of this project. We also like to thank the Engineering and Physical Sciences Research Council (EPSRC), Biotechnology and Biological Sciences Research Council (BBSRC), Royal Society, and Unilever Port Sunlight Research for the previous support.
Conflicts of Interest
The author declares no conflict of interest.
References
- Tam, A.C.; Sullivan, B. Remote sensing applications of pulsed photothermal radiometry. Appl. Phys. Lett. 1983, 43, 333–335. [Google Scholar] [CrossRef]
- Imhof, R.E.; Birch, D.J.S.; Thornley, F.R.; Gilchrist, J.R.; Strivens, T.A. Opto-thermal transient emission radiometry. J. Phys. E Sci. Instrum. 1984, 17, 521–525. [Google Scholar] [CrossRef]
- Long, F.H.; Anderson, R.R.; Deutsch, T.F. Pulsed photothermal radiometry for depth profiling of layered media. Appl. Phys. Lett. 1987, 51, 2076–2078. [Google Scholar] [CrossRef]
- Jacques, S.L.; Nelson, J.S.; Wright, W.H.; Milner, T.E. Pulsed photothermal radiometry of port-wine-stain lesions. Appl. Opt. 1993, 32, 2439–2446. [Google Scholar] [CrossRef] [PubMed]
- Vitkin, I.A.; Wilson, B.C.; Anderson, R.R.; Prahl, S.A. Pulsed photothermal radiometry in optically transparent media containing discrete optical absorbers. Phys. Med. Biol. 1994, 39, 1721–1744. [Google Scholar] [CrossRef] [PubMed]
- Almond, D.P.; Patel, P.M. Photothermal Science and Techniques; ASIN: B017PNMQS8; Chapman and Hall: London, UK, 1996. [Google Scholar]
- Vavilov, V.P.; Burleigh, D.D. Review of pulsed thermal NDT: Physical principles, theory and data processing. NDT & E Int. 2015, 73, 28–52. [Google Scholar]
- Imhof, R.E.; Zhang, B.; Birch, D.J.S. Photothermal Radiometry for NDE. In Progress in Photothermal and Photoacoustic Science and Technology; Mandelis, A., Ed.; PTR Prentice Hall: Englewood Cliffs, NJ, USA, 1994; Volume II, pp. 185–236. [Google Scholar]
- Imhof, R.E.; McKendrick, A.D.; Xiao, P. Thermal emission decay Fourier transform infrared spectroscopy. Rev. Sci. Instrum. 1995, 66, 5203–5213. [Google Scholar] [CrossRef]
- Xiao, P. Opto-Thermal Mathematical Modeling and Data Analysis in Skin Measurements. Ph.D. Thesis, London South Bank University, London, UK, 1997. [Google Scholar]
- Xiao, P.; Imhof, R.E. Inverse Method Analysis in Opto-Thermal Skin Measurements. SPIE Proc. 1999, 3601, 340–347. [Google Scholar]
- Xiao, P.; Gull, S.F.; Imhof, R.E. Opto-Thermal Inverse Modelling Using a Maximum Entropy Approach. Anal. Sci. 2001, 17, s394–s397. [Google Scholar]
- Xiao, P.; Guo, X.; Notingher, I.; Cowen, J.A.; O’Driscoll, D.; Imhof, R.E. Optothermal Skin Pigment Spectral Depth Profiling using an OPO Laser. SPIE Proc. 1999, 3601, 348–354. [Google Scholar]
- Xiao, P.; Cowen, J.A.; Guo, X.; O’Driscoll, D.; Imhof, R.E. Photothermal In-vivo Characterization of Human Skin using Tuneable OPO laser Excitation. In Photoacoustic and Photothermal Phenomena: 10th International Conference, Rome, Italy, 23–27 August 1998; Scudieri, F., Bertolotti, M., Eds.; American Institute of Physics: College Park, MD, USA, 1999; pp. 621–623. [Google Scholar]
- Xiao, P.; Imhof, R.E. Opto-thermal measurement of water distribution within the stratum corneum. In Skin Bioengineering Techniques and Applications in Dermatology and Cosmetology; Karger: Basel, Switzerland, 1998; Volume 26, pp. 48–60. [Google Scholar]
- Xiao, P.; Cowen, J.A.; Imhof, R.E. In-Vivo Transdermal Drug Diffusion Depth Profiling—A New Approach to Opto-Thermal Signal Analysis. Anal. Sci. 2001, 17, s349–s352. [Google Scholar]
- Xiao, P.; Ou, X.; Ciortea, L.I.; Berg, E.P.; Imhof, R.E. In Vivo Skin Solvent Penetration Measurements Using Opto-thermal Radiometry and Fingerprint Sensor. Int. J. Thermophys. 2012, 33, 1787–1794. [Google Scholar] [CrossRef]
- Xiao, P.; Imhof, R.E. Data Analysis Technique for Pulsed Opto-Thermal Measurements. UK Patent Application 0004374.5, 25 February 2000. [Google Scholar]
- Xiao, P.; Imhof, R.E. Apparatus for in vivo Skin Characterization. UK Patent Application GB1014212.3, 26 August 2010. [Google Scholar]
- Scheuplein, R.J. A survey of some fundamental aspects of the absorption and reflection of light by tissue. J. Soc. Cosmet. Chem. 1964, 15, 111–122. [Google Scholar]
- Jacques, S.L. Laser Tissue Interactions. Las. Gener. Surg. 1992, 72, 531–557. [Google Scholar]
- Yoon, G.; Welch, A.J.; Motamedi, M.; van Gement, M.C.J. Development and application of Three-Dimentional Light Distribution Model for Laser Irradiated Tissue. IEEE J. Quan. Elec. 1987, 23, 1721–1733. [Google Scholar] [CrossRef]
- Cowen, J.A. In-vivo Opto-thermal Transdermal Diffusion Measurement. Ph.D. Thesis, London South Bank University, London, UK, 1999. [Google Scholar]
- Xiao, P.; Zheng, X.; Imhof, R.E.; Hirata, K.; McAuley, W.J.; Mateus, R.; Hadgraft, J.; Lane, M.E. Opto-Thermal Transient Emission Radiometry (OTTER) to image diffusion in nails in vivo. Int. J. Pharm. 2011, 406, 111–113. [Google Scholar] [CrossRef] [PubMed]
- Xiao, P.; Ciortea, L.I.; Singh, H.; Berg, E.P.; Imhof, R.E. Opto-thermal Radiometry for In-Vivo Nail Measurements. J. Phys. Conf. Ser. 2009, 214, 012008. [Google Scholar] [CrossRef]
- Notingher, I.; Imhof, R.E.; Xiao, P.; Pascut, F.C. Spectral Depth Profiling of Arbitrary Surfaces by Thermal Emission Decay-Fourier Transform Infrared Spectroscopy. Appl. Spectrosc. 2003, 57, 1494–1501. [Google Scholar] [CrossRef] [PubMed]
- Notingher, I.; Imhof, R.E.; Xiao, P.; Pascut, F.C. Near-surface depth-resolved midinfrared emission spectroscopy. Rev. Sci. Instrum. 2003, 74, 346–348. [Google Scholar] [CrossRef]
- Pascut, F.C. Fiber-Optic Optothermal Emission Radiometry for In-vivo Skin Measurements. Ph.D. Thesis, London South Bank University, London, UK, 2004. [Google Scholar]
Figure 1.
The schematic diagram for OTTER hydration measurements (a) and skin pigments measurements (b).
Figure 1.
The schematic diagram for OTTER hydration measurements (a) and skin pigments measurements (b).

Figure 2.
The OTTER signal and its average radiation depth, left Y axis is the normalized signal intensity, right Y axis is the mean detection depth, and X axis is normalized time [10].
Figure 2.
The OTTER signal and its average radiation depth, left Y axis is the normalized signal intensity, right Y axis is the mean detection depth, and X axis is normalized time [10].

Figure 3.
The OTTER signals of different types of skin (a); different position on forearm (b); hot water effect (c); and bruised skin (d) [10].
Figure 3.
The OTTER signals of different types of skin (a); different position on forearm (b); hot water effect (c); and bruised skin (d) [10].

Figure 4.
The typical OTTER signals of different skin sites, including hair and nail (a), and the corresponding water concentration depth profiles using SLS fitting technique (b).
Figure 4.
The typical OTTER signals of different skin sites, including hair and nail (a), and the corresponding water concentration depth profiles using SLS fitting technique (b).

Figure 5.
The 3D water concentration depth profiles along the volar forearm.

Figure 6.
The OTTER signals of DMSO penetrating through skin (a) and the corresponding DMSO concentration depth profiles using SLS fitting technique after different tape stripping (b).
Figure 6.
The OTTER signals of DMSO penetrating through skin (a) and the corresponding DMSO concentration depth profiles using SLS fitting technique after different tape stripping (b).

Figure 7.
The OTTER signals of in vivo human fingernail (a) and corresponding water concentration depth profiles using SLS fitting technique before and after a 15-min soaking (b).
Figure 7.
The OTTER signals of in vivo human fingernail (a) and corresponding water concentration depth profiles using SLS fitting technique before and after a 15-min soaking (b).

Figure 8.
Solvents penetration through in vivo human fingernail, (a) decanol, (b) glyceral, and (c) butyl acetate. For each solvent, the left plot shows the solvent concentration depth profiles and the right plot shows the corresponding solvent concentration in nail at 5 min, 8 min and 10 min after the time of solvent application. Reproduced with permission from [24], published by Elsevier B.V., 2011.


Figure 9.
OTTER signals of ex vivo human hair (a), and corresponding water concentration depth profiles in hair before and after soaking (b).
Figure 9.
OTTER signals of ex vivo human hair (a), and corresponding water concentration depth profiles in hair before and after soaking (b).
© 2016 by the author; licensee MDPI, Basel, Switzerland. This article is an open access article distributed under the terms and conditions of the Creative Commons by Attribution (CC-BY) license (http://creativecommons.org/licenses/by/4.0/).
Share and Cite
MDPI and ACS Style
Xiao, P. Photothermal Radiometry for Skin Research. Cosmetics 2016, 3, 10. https://doi.org/10.3390/cosmetics3010010
AMA Style
Xiao P. Photothermal Radiometry for Skin Research. Cosmetics. 2016; 3(1):10. https://doi.org/10.3390/cosmetics3010010
Chicago/Turabian StyleXiao, Perry. 2016. "Photothermal Radiometry for Skin Research" Cosmetics 3, no. 1: 10. https://doi.org/10.3390/cosmetics3010010
Note that from the first issue of 2016, this journal uses article numbers instead of page numbers. See further details here.