Article

Application of Ecological Footprint Accounting as a Part of an Integrated Assessment of Environmental Carrying Capacity: A Case Study of the Footprint of Food of a Large City

1
Department of Spatial Economy, Faculty of Environmental Engineering and Geodesy, Wrocław University of Environmental and Life Sciences, ul. Grunwaldzka 55, 50-357 Wrocław, Poland
2
Faculty of Social Work & Education, The Hague University of Applied Sciences, Johanna Westerdijkplein 75, 2521 EN Den Haag, The Netherlands
3
Global Footprint Network, 426 17th Street, Suite 700, Oakland, CA 94612, USA
4
Department of Social, Political and Territorial Sciences, Campus Universitário de Santiago, University of Aveiro, 3810-193 Aveiro, Portugal
*
Author to whom correspondence should be addressed.
Resources 2018, 7(3), 52; https://doi.org/10.3390/resources7030052
Submission received: 2 July 2018 / Revised: 29 July 2018 / Accepted: 9 August 2018 / Published: 13 August 2018
(This article belongs to the Special Issue Ecological Footprint Assessment for Resources Management)

Abstract

:
The increasing rate of urbanization along with its socio-environmental impact are major global challenges. Therefore, there is a need to assess the boundaries to growth for the future development of cities by the inclusion of the assessment of the environmental carrying capacity (ECC) into spatial management. The purpose is to assess the resource dependence of a given entity. ECC is usually assessed based on indicators such as the ecological footprint (EF) and biocapacity (BC). EF is a measure of the biologically productive areas demanded by human consumption and waste production. Such areas include the space needed for regenerating food and fibers as well as sequestering the generated pollution, particularly CO2 from the combustion of fossil fuels. BC reflects the biological regeneration potential of a given area to regenerate resources as well to absorb waste. The city level EF assessment has been applied to urban zones across the world, however, there is a noticeable lack of urban EF assessments in Central Eastern Europe. Therefore, the current research is a first estimate of the EF and BC for the city of Wrocław, Poland. This study estimates the Ecological Footprint of Food (EFF) through both a top-down assessment and a hybrid top-down/bottom-up assessment. Thus, this research verifies also if results from hybrid method could be comparable with top-down approach. The bottom-up component of the hybrid analysis calculated the carbon footprint of food using the life cycle assessment (LCA) method. The top-down result of Wrocław’s EFF were 1% greater than the hybrid EFF result, 0.974 and 0.963 gha per person respectively. The result indicated that the EFF exceeded the BC of the city of Wrocław 10-fold. Such assessment support efforts to increase resource efficiency and decrease the risk associated with resources—including food security. Therefore, there is a need to verify if a city is able to satisfy the resource needs of its inhabitants while maintaining the natural capital on which they depend intact.

1. Introduction

The increasing rate of urbanization along with its socio-environmental impact are major global challenges [1,2]. The rising levels of urbanization are connected with the reduction of natural resources, the loss of biodiversity, soil degradation, and the pollution of the air, water, and land [3]. Moreover, the deterioration of the environment is expected to increase in the future due to the growth of human population, especially in urban areas [4]. The United Nations indicated that currently over 55% of the world’s population lives in urbanized areas, and this percentage is expected to increase to 68% by the year 2050 [5]. This means that the world’s urban population might well rise from 4.2 billion people (2018) to 6.7 billion people in 2050 [5]. Over half of the world’s countries already run ecological deficits, consuming more biocapacity than is available within their borders [6]. The current rate of urban growth underscores the importance of urban areas as the focus of sustainability assessments [7]. Therefore, there is a need to assess the state of balance and the boundaries to growth for future development of human settlements [8]. The inclusion of the assessment of environmental carrying capacity (ECC) into the spatial management and planning of cities can be a useful tool for the development of sustainable human settlements [9].
The ECC is a concept and tool used to assess the sustainable development level of a given area [10]. The ECC verifies if the current spatial management is consistent or inconsistent with certain environmental restrictions and limitations, and it is poses limits to the ability of current and future populations to meet their needs. The ECC is most often assessed based on environmental indicators such as the ecological footprint (EF) and biocapacity (BC) [11,12,13,14]. EF represents the human demand on nature (such as consumed resources, occupied space, and emitted pollutants) that compete for biologically productive space [15,16,17]. Therefore, EF also indicates the biologically productive area needed to provide for all the competing demands on nature, from food production, fiber regeneration, infrastructure accommodation to sequestration of emissions [18]. The BC represents the actual annual bioproductive ability of an area (an ecological benchmark) to provide the human needs [19]. Thus, the BC assesses an actual annual ecosystem service budget available [19]. This is a key ingredient for all of humanity’s goods and services. Despite that the ecological footprint accounting (EFA) can be applied to any scale. The national footprint accounts (NFA) are the most comprehensive attempt to assess countries’ footprint and biocapacity are based nearly exclusively on United Nations’ data [18,20]. The NFA presents all steps of a national ecological footprint and BC assessment, from raw data to aggregated values of ecological footprint and BC. The NFA assessed the ecological footprint and BC for 242 countries and territories and the world as a whole [20]. The results of the analyses are available for the period 1961–2014 [6,20] and are provided by the Global Footprint Network. These accounts include the following land use types: croplands, grazing lands, fishing grounds, forest lands, carbon uptake land, and built-up lands [20]. Cropland consists of the area required to grow all crop products, including livestock feeds, fish meals, oil crops, and rubber. The grazing land represents the crop feeds to support livestock. The grazing land comprises all grasslands used to provide feed for animals, wild grasslands, and prairies. The fishing grounds are represented the annual primary production required to sustain a harvested aquatic species. The forest land reflects the annual harvests of fuelwood and timber needed to supply forest products. The uptake land shows the contamination of a waste product, namely carbon dioxide. The CO2 is released into the atmosphere from a variety of sources, including human activities such as burning fossil fuels and certain land use practices; as well as natural events such as forest fires, volcanoes, and respiration by animals and microbes. The built-up area represents the land covered by human infrastructure: housing, industrial structures, transportation, and reservoirs for hydroelectric power generation [21].
Note that EFA only accounts for the human requirement for bioproductive areas, and does not include productive areas required to maintain other species. Both EF and BC are expressed in the same units, global hectares (gha), which means that both indicators can be compared. This unit, global hectares, is the result of the conversion of the total physical area of a given land use type of a given country into its equivalent global productivity (gha). The conversion is based on the ratio of its productivity to the global average biological productivity [22]. A minimum and conservative environmental condition, on average, is to reach a quotient of EF and BC smaller than one; the goal is minimum and conservative because it does not include the reservation of productive ecosystems for the maintenance of biodiversity, which has been estimated to be between 11% and 75% [16,23,24]. In case the EF exceeds the BC (or the available portion thereof), that population is running an ecological deficit. In a closed system such as the Earth, an ecological deficit at the global level is an indication of global ecological overshoot. It manifests as ecosystem degradation, loss of natural capital, or the accumulation of waste. However, at the city or country level, the excess biocapacity demand can be met through the import of external goods. When BC is greater than EF, that entity corresponding to an ecological reserve [16].
Currently, the assessment of BC and EF is well-developed on the global [22,25] as well as on the national level [15,17]. However standardized calculations [26] and comprehensive assessment on regional [12] and city level are limited [18,27,
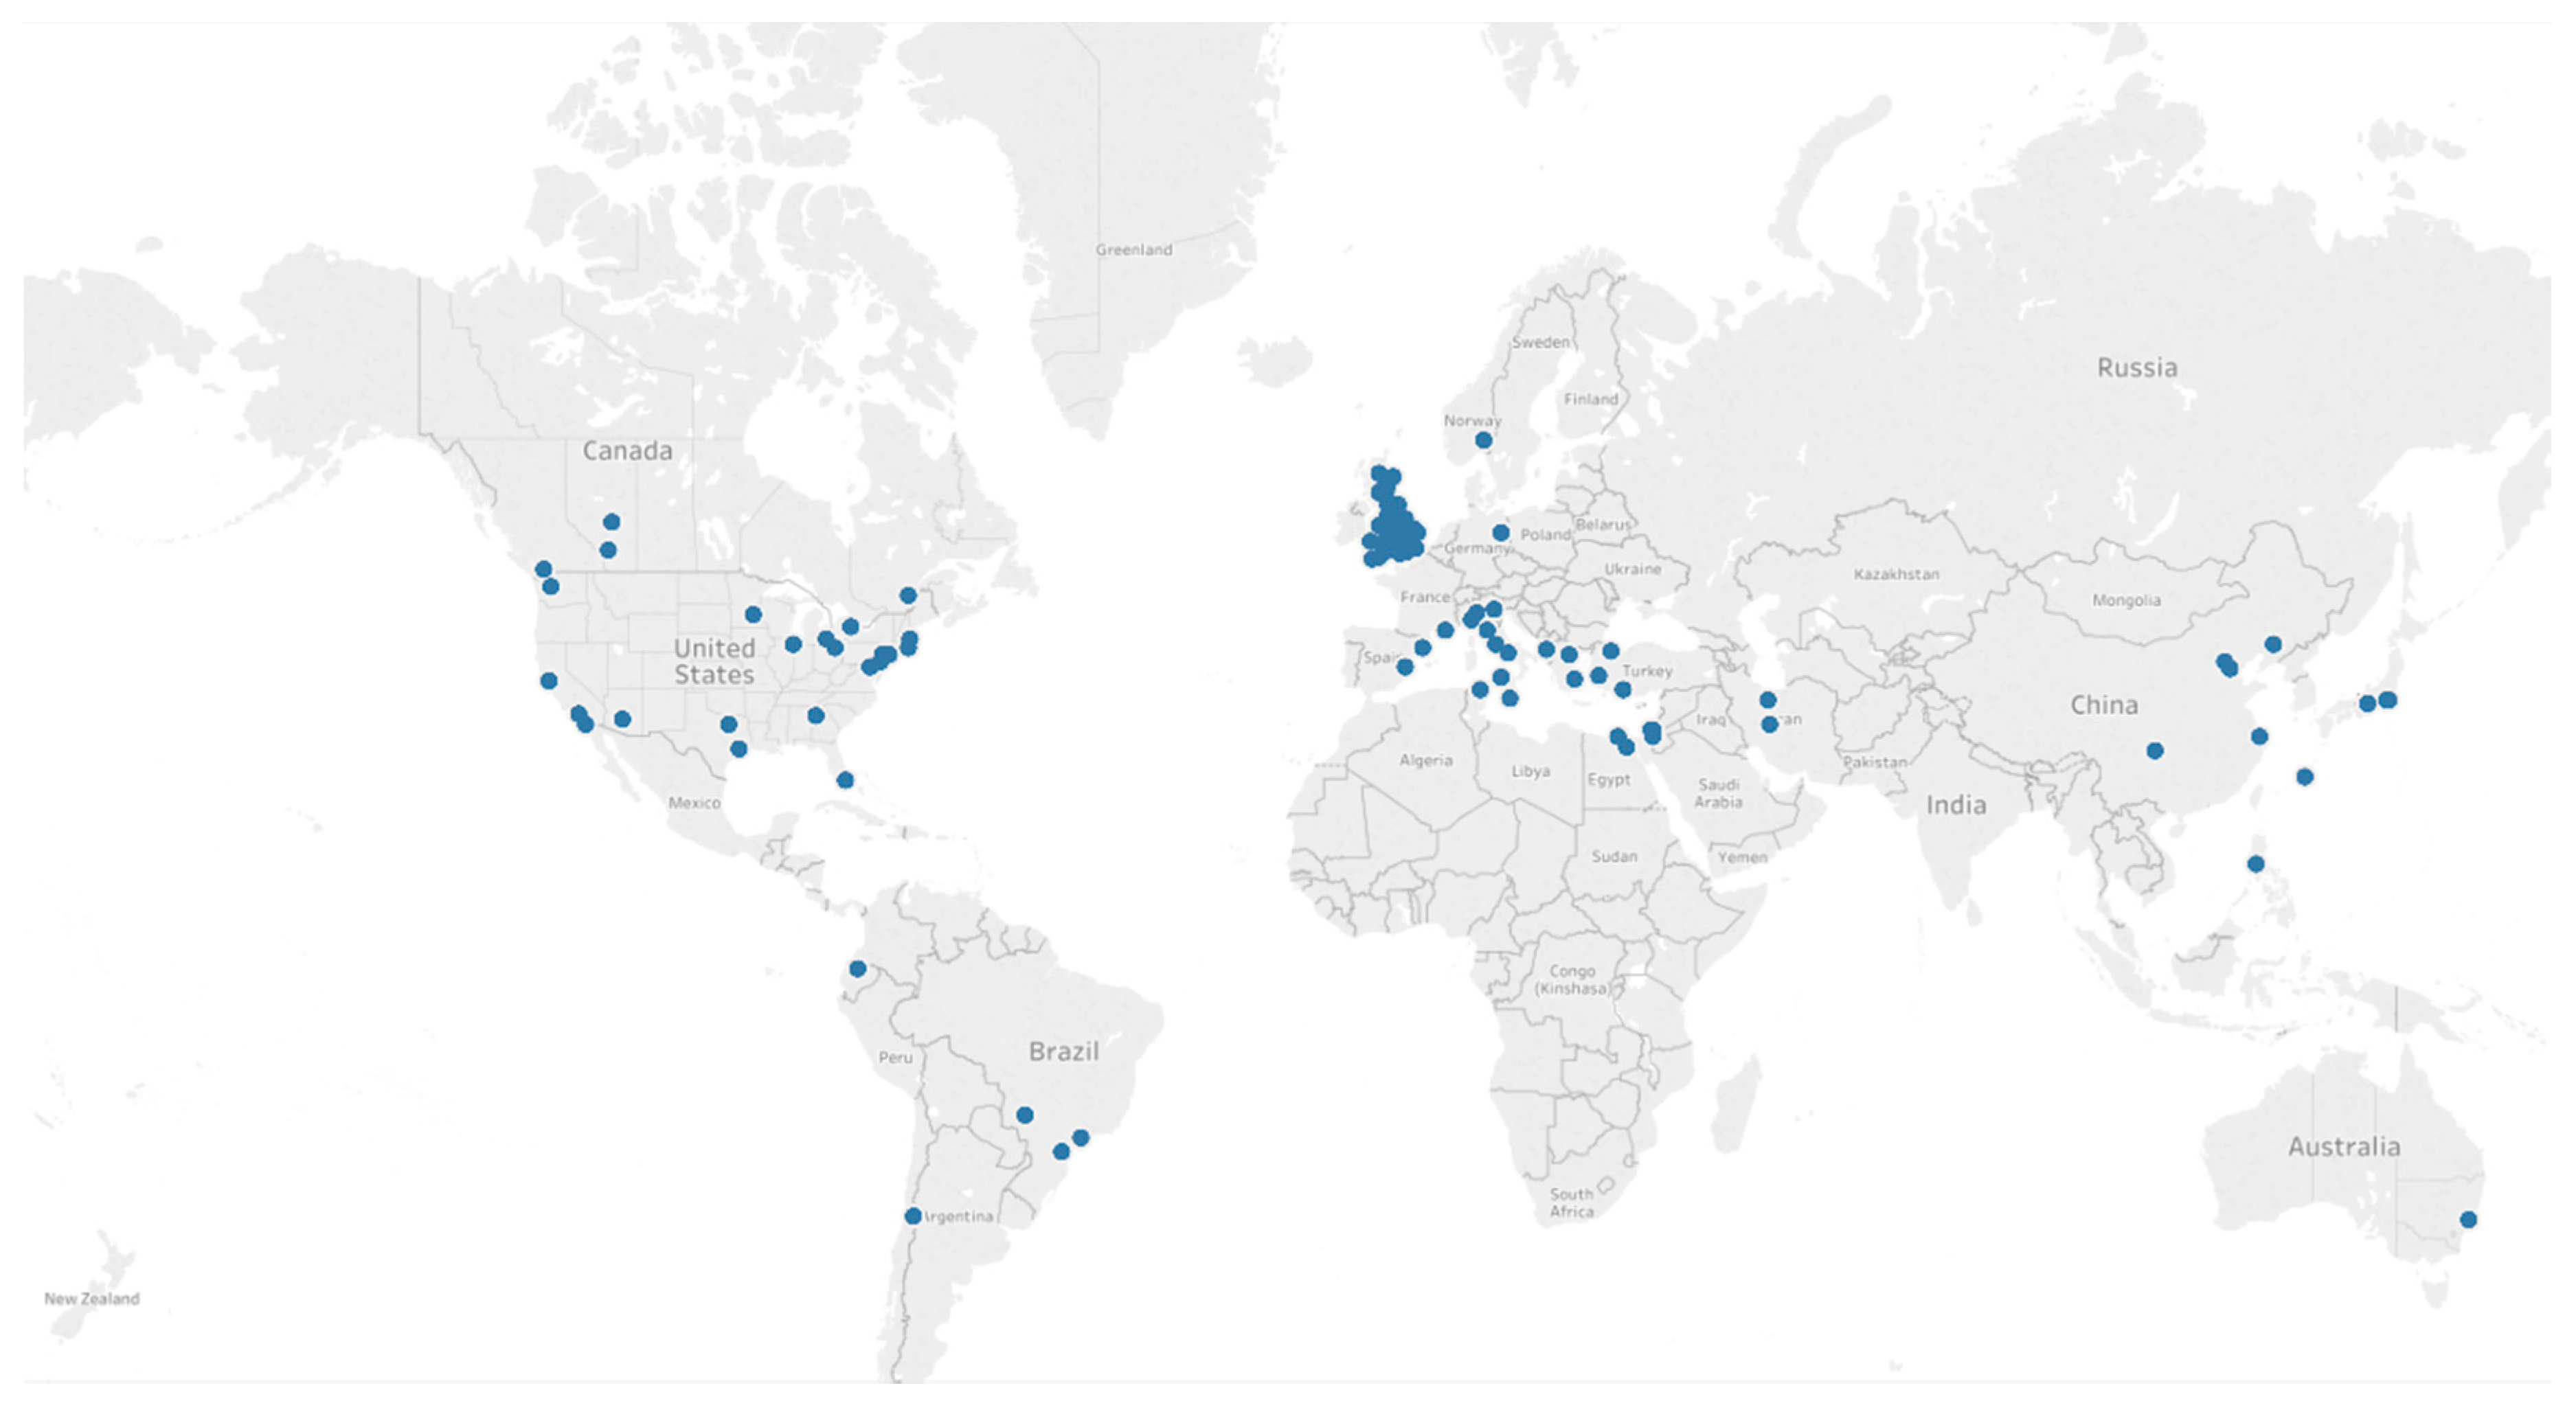
28]. In Central Eastern Europe (Figure 1), there is an apparent lack of EF assessments on the city level. This phenomenon could be attributed to a scarcity of data sources and limited comparability, i.e., a use of different data sources and assumptions within the calculations [18]. However, in other regions, EF assessments have been applied for individual cities across various countries [19].
Understanding and monitoring the resource metabolism of cities is critical in order to inform municipal actions and decision-making as part of the larger goal of global sustainability [36]. The analysis of current state of the environment could allowed to understand the connection between the local consumption and exploitation of resources and its global environmental impact [34]. Such assessment allows for increase of resources exploitation responsibility, as well as for evaluation of resource-related risk [37]. Moreover, it increases resource efficiency and decreases the risk associated with natural resources [37]—including food security [38,39,40]. Food is a basic need of households, thus the assurance of the food security is widely recognized as the greatest challenge to sustain humanity in the 21st century [41]. World population is expected to reach 9 billion by 2050 [4] and population living in cities is also estimated to increase, intensifying the demand for resources [4]. The increasing demand for natural resources, which provide fundamental ecosystem services to city dwellers, such as food production, is directly related to urban growth [36]. On one hand, the ongoing urbanization process is leading to significant land use changes in the territory due to the expansion of artificial areas, causing loss of habitats, cropland, and grazing areas. On the other hand, the increasing number of inhabitants would require more cropland areas to produce food, which could be already lost [42,43]. The Food and Agriculture Organization of the United Nations (FAO) expects an increase of food production by at least 60% from 2006 to 2050 [40] and an increase in the demand for energy due to the intensification of agriculture, as well as an increase of pollution emitted to the environment [18]. Therefore, this study deals with the application of EF at the city level as a measure of ECC. The paper focuses on ecological footprint of food (EFF) and comparing hybrid EFF assessment (combining a bottom-up carbon footprint of food (CFF) with remaining top-down EFF’s components) with full top-down assessment for food EF. Thus, the research would verify if the use of a hybrid method allows for a comparison with a top-down approach. Especially, that other researchers indicated the need for the development of international urban ecological footprint standards towards a hybridization of top-down and bottom-up approaches [18].
The study compares the obtained values of EFF using both methods, as well as compares EFF’s with biocapacity benchmark as an indicator of sustainability. The difference of EFF’s and BC would indicate if ECC of analyzed city is exceeded or not. The rationale for this study is the assumption that the implementation of the ECC into spatial management is relevant to increase the efficient of long-term planning [44], the use of natural resources [45], as well as for the assurance of the food security [41] in the context of sustainable development.

2. Materials and Methods

2.1. Study Area

The analysis of the EFF was conducted for the city of Wrocław, which is located in Central Eastern Europe. The city of Wrocław (dark blue on the map) is located in the south-west part of Poland (Figure 2) and has an area of 293 km2. The city is fast developing and has strongly spreading suburban zones (light blue on the map). The suburban zone of Wrocław consist of 10 municipalities and has a total surface area of 1416.4 km2 [46]. Wrocław is one of the largest cities in Poland with approximately 638,000 inhabitants (according to data of Central Statistical Office of Poland, state as at 31 December 2016). Wroclaw’s greenhouse gas emissions are significant [47]. As Sówka and Bezyk (2018) indicated, the implementation of action plans by the Municipality of Wrocław requires an accurate understanding of the city residents’ lifestyle and consumption [47]. The location and lifestyle are known to contribute to the footprint [48].

2.2. Materials

The baseline year for which the analysis was conducted was 2016. Data used for the analysis was obtained from multiple data sources. Population data was obtained from the Local Data Bank (originally “Bank Danych Lokalnych”) [49]. The average monthly consumption of selected foodstuffs per capita in households for the voivodeship (a voivodeship is the area administered by a voivode (Governor). This term is used in several countries of Central and Eastern Europe, including Poland, Hungary, Lithuania, Latvia, Ukraine, Russia, and Serbia) and according to class of locality in 2016, i.e., as in this case for town by size of 500 thousands or more inhabitants—large cities, and the region Dolnośląskie were obtained from publication of Statistics Poland (originally “Główny Urząd Statystyczny”) [50]. The data, which was not collected for city level, was obtained from the report on the national annual amount of consumption of a given product published also by Statistics Poland [51]. The information about CO2 emissions in kg generated per 1 kg of a given food at all levels of production and consumption (from agriculture by industrial processing, logistics, packaging, and use, to the end of life—the final disposal of food waste and wastewater treatment) was retrieved from the report of energy use in the EU food sector prepared for the European Commission [52]. The information of global sequestration in hectares per 1 ton of CO2 was assumed according to the factors in the National Footprint Accounts (NFA, 2018 Edition) as 0.338 gha tCO2−1. The national Yield Factors (YF) and Equivalence Factors (EQF), evaluated for the year 2014, were obtained also from the NFA [6]. The top-down components of this study used the consumption land use matrix of Poland [53] as a baseline dataset for scaling. The spatial data of Wrocław and other local and regional boundaries were obtained from Head Office of Geodesy and Cartography (originally “Główny Urząd Geodezji I Kartografii—GUGiK” (http://www.gugik.gov.pl/geodezja-i-kartografia/pzgik/dane-bez-oplat/dane-z-panstwowego-rejestru-granic-i-powierzchni-jednostek-podzialow-terytorialnych-kraju-prg)). Information about land uses in Wrocław was obtained from the Wrocław Development Office (originally “Biuro Rozwoju Wrocławia”) [54]. The areas of water bodies, which were not defined in spatial data obtained from Wrocław Development Office, were obtained from Wrocław Spatial Information System (https://geoportal.wroclaw.pl/en/resources/). The base maps with reference information of countries and regions boundaries were available within Tableau or ArcGIS software.

2.3. Methods

This paper focuses on the assessment of one of the components of the EF—the ecological footprint of food (EFF) which is expressed in terms of global hectares (gha). The EFF was calculated using two distinct methods and the results were compared. The two methods used were: (i) top-down approach; and (ii) hybrid approach, that results by merging the bottom-up approach with top-down approach.
The top-down approach used the aggregated data from a national level, which are scaled to a sub-national population. Such assumption allows for the comparison of the obtained results for a given nation with others [55]. The bottom-up approach based on local data—both municipal and regional reports, allowed for the assessment of the environmental impact based on specific circumstances and characteristics. The hybrid approach combined the top-down with bottom-up approach, which joined the macro and micro aspects [56].

2.3.1. Data Preparation

In the absence of a specific dataset regarding the consumption of food products by the city of Wroclaw, two datasets were used to calculate the weighted average of consumption of food products (in kilograms or liters) per capita. The datasets used were: (i) statistical information regarding polish cities larger than 500,000 in population (Wroclaw falls within this category) and (ii) statistical data from the Dolnośląskie region, which Wroclaw belongs to. The weighted average was calculated as
AFn = WLC × AFnLC + WV × AFnV
where:
  • AFn—the annual weighted average amount of given consumed food in kg (or L) per inhabitant [kg];
  • WLC—the weight according to population of large cities;
  • AFnLC—the annual average amount of given consumed food in kg per inhabitants of large cities;
  • WV—the weight according to population of region—voivodeship;
    AFnV—the annual average amount of given consumed food in kg per inhabitants of voivodeship.
The WLC and WV was estimated as
WLC = (IW/ILC)/(IW/ILC + IW/IV)
WV = (IW/IV)/(IW/ILC + IW/IV)
where:
  • IW—the number of inhabitants of Wrocław city;
  • ILC—the number of inhabitants of all large cities;
  • IV—the number of inhabitants of region—voivodeship.

2.3.2. Top-Down EFF Approach

The top-down approach calculations were based on the consumption land-use matrix (CLUM) of Poland [53], a dataset provided by Global Footprint Network which includes national average EF per-capita by land-use category, further broken down according to COICOP (classification of individual consumption by purpose (COICOP) by the United Nations Statistics Division (UNSD)) categories [57]. Starting from the CLUM dataset, we focused on the ecological footprint of 11 subcategories of the food and non-alcoholic beverages as the basis for the top-down scaling. These detailed COICOP food categories included the following: bread and cereals; meat; fish and seafood; milk, cheese, and eggs; oils and fats; fruit; vegetables; sugar, jam, honey, chocolate, confectionery; food products not elsewhere classified (n.e.c.); non-alcoholic beverages; and alcoholic beverages (Table 1). We then assigned each food consumption category to a corresponding COICOP category and calculated a scaling factor by comparing the total consumption (kg) of each COICOP category between Wroclaw and Poland. Here we assume that each food consumption category going in a corresponding COICOP category has the same ecological footprint per kilogram. Using these scaling factors, we then calculate the subnational EF from the national EF for each COICOP category. For example, the national average monthly consumption of items that we categorized as ‘bread and cereals’ for Poland was 5.88 kg, whereas for Wroclaw, it was 5.12 kg, or 87% of Polish national average (Table 1). Assuming a similar EF/kg of ‘breads and cereals’ between Poland average and Wroclaw, we can assume that the EF of ‘breads and cereals’ for Wroclaw is also 87% of the national average. This top-down methodology for calculating sub-national ecological footprints based on national footprint data and scaled with supplementary data has been applied widely, most recently in a studies focusing on Mediterranean cities and Canadian cities [18,28].
The top-down approach allows for a “rapid evaluation of the upstream environmental impacts associated with downstream economic consumption” [18], and ensures the comparability across cities, which would be impossible through bottom-up approaches [18]. However, the top-down approach could not reflect the local conditions adequately [55].

2.3.3. Hybrid EFF Approach

The hybrid approach included a detailed bottom-up carbon footprint by food type (Figure 3) and combined this with the top-down results for the remaining components (cropland, grazing land, forest products, fishing grounds, forest land, built-up land) to derive results of EFF for Wroclaw. This area represents the EF of given a component, which was adopted for the calculation of food product-level carbon footprints.
The bottom-up approach calculated CFF based on the consumption of food products. The food products were retrieved from the literature and highlighted the seventeen representative types of products within the European food basket. The representative products types are understood as the most often consumed food products in Europe [52,58], which allow for a comparison between European cities. These products represent the very noticeable mass share of 61% of the consumed food products in 2013 [52]. Products were assigned to the following product groups: meat and seafood; dairy products; crop-based products; cereal-based products; vegetables; fruits; beverages; and prepared meals (Table 2).
The analysis was conducted using the lifecycle assessment (LCA) [59]. The LCA estimates the total equivalent of CO2 (CO2eq) emissions during the entire life cycle of a product, from all levels of production, consumption, to final disposal. The CO2eq emissions are expressed in kilograms of CO2eq per 1 kg or 1 L of a given food (kgCO2eq/kg or L of product) [52]. In this study, the LCA assessment evaluated the CO2eq emissions of food of the city of Wrocław. Next, using the global carbon dioxide sequestration index, the results from the LCA were converted to the equivalent area needed to sequestrate the CO2eq [59,60]. The global carbon dioxide sequestration index represents the global average land to sequestrate one ton of CO2. Therefore, the CFF could be expressed by the following equation
CFF = ∑(IN × AFn × ICO2eq)/1000 × IsCO2,
where:
  • CFF—the Carbon Footprint of food (gha);
  • IN—the total number of inhabitants;
  • AFn—the annual weighted average amount of given consumed food in kg per inhabitant (kg);
  • ICO2eq—the amount of CO2eq emitted during whole life duration of given n-product (at all levels from production by consumption to final disposal) (kgCO2eq/kg or L of product);
  • IsCO2—the global carbon dioxide sequestration rate (gha/tCO2).

2.3.4. BC Assessment

The BC was calculated based on methodology and factors derived from the National Footprint Accounts (NFA), which includes equivalence factors (EQF) and yield factors (YF) for each land use types (infrastructure land, forest land, cropland, grazing land, inland fishing ground, and marine fishing grounds) [16,18,61]. The YF represents the annual productivity of a given land use type for a given country. The YF varies according to country-specific characteristics, year, land use type, soil quality, and management practices. The EQF is used to convert a country’s productivity of a given land use type into its global equivalent [20]. This research applied YFs and EQFs calculated at the national level. Therefore, BC is represented as
BC = ∑ (An × YFn × EQFn),
where:
  • BC—the biocapacity (gha);
  • An—the area of given land use type (ha);
  • YFn—the yield factor for given land use type (ha);
  • EQFn—the equivalence factor for given land type (ha).
To calculate the BC of the city of Wrocław, spatial data regarding land use cover was used. The study of conditions and directions of spatial development in Wrocław initials land use categories as follows: residential areas; areas of economic activity; residential and service areas; areas of communication; cemetery areas; forest areas; crop areas; undeveloped agricultural areas; water bodies; and green areas [47]. Therefore, the land use categories were classified into new categories according to the land use types used in the NFA [7]. Thus, residential areas, areas of economic activity, residential and service areas, cemetery areas, and areas of communication, were assigned to the infrastructure land use type. The forest area was assigned to forest land use type; crop areas were assigned to croplands. The undeveloped agricultural areas and green areas were allotted to grazing lands. The water bodies were assigned to inland fishing grounds.
Subsequently, we compared the values of EFF to the BC of Wroclaw. These comparisons allowed for the quantification of the Wrocław’s consumption of biocapacity against the current biocapacity and determine if Wrocław is an ecological debtor or creditor. At last, using ArcGIS, the circular-size of EFF and BC was mapped. The radius for EFF and BC was calculated based on circle area equation.

3. Results

The analysis conducted by this study produced results regarding: top-down EFF approach; hybrid EFF approach; and to determine the differences between the two approaches. Moreover, the comparisons of EFF and BC allowed for defining if Wrocław is an ecological debtor or creditor. Obtained results allowed also for mapping circular size of BC and EFF based on calculated radius.

3.1. Top-Down Results

Using the EFF top-down method (Table 3), the results show that the categories of meat; milk, cheese, and eggs; and bread and cereals, are the main contributors to the total EFF. The results for each COICOP category are disaggregated and represented in the six components of the EFF.
The cropland component represents 58% of total EFF, the highest value, followed by the carbon Footprint, accounting to 25% of total EFF. Forest land represents 8%; fishing grounds 5%; grazing land 3%; built-up land 1%. The total EFF per capita is 0.974 gha per capita per year.

3.2. Bottom-Up Results

Results show that the meat and seafood group products represent 41% of total emission of CO2eq, corresponding to the highest share. According to the results, pork has the highest influence on the group. The second products group with higher influence on CO2eq is the ‘beverages’ group, representing 26% of the total CFF. In this group, beer has the highest influence. The third highest influence corresponds to ‘dairy products’ (19%), with cheese consumption being the main contributor. The ‘crop-based products’ and ‘cereal-based products’ corresponds to 5% and 4%, respectively. ‘Fruits’ and ‘vegetables’ groups have the lowest influence in CO2eq (2%). The total emission of CO2eq from food consumption and production was estimated at circa 441,579 tonnes of CO2eq (Table 4). To sequester that amount of emissions, this study estimates that 149,254 gha are required, which corresponds to 0.234 gha per capita per year.

3.3. Hybrid Results

The result of the Hybrid EFF, which derives from joining the bottom-up carbon footprint of food categories to the top-down approach of EFF, was estimated at 0.963 gha per capita. The carbon footprint corresponds to 0.234 gha per capita per year while the combination of the remaining components of the EFF corresponds to 0.729 gha per capita per year. Thus, the bottom-up CFF represented 24% of the EFF.

3.4. Top Down vs. Hybrid Results

The results showed that the value of top-down EFF approach was estimated as 0.974 gha per capita per year. The hybrid approach estimated it as 0.963 gha per capita per year, which was connected with the use of different approach of CFF assessment. Therefore, the difference between the top-down and the hybrid method of EFF assessment was 1.2% or 0.011 gha. The total results were quite similar but looking at the carbon footprint from bottom-up approach, some differences could be noticed. The largest differences between these two assessments were observed for the fruits, beverages, vegetables, and crop-based products groups (Table 5).
The difference between top-down CFF and bottom-up CFF values for ‘fruits’ group was 72% higher than the value obtained using top-down CFF approach. Such a difference could be a result of used data, which for bottom-up CFF approach included only citrus fruits and bananas and apples. Second highest difference in values was seen for beverage, at level −71%. Another significant differences could be seen for vegetables at level of 59%. This result could be connected with used data. The bottom-up CFF assessment used only the consumption of potatoes for this group of products, which could underestimate obtained value. The next products group with the highest difference was verified for crop-based products with the difference of 54%. The difference could be also connected with the data, which for bottom-up CFF approach used only vegetables fats and sugar. The total difference of CFFs was 0.012, which reflected 4.7% in relation to value of top-down CFF.

3.5. EFF vs. BC Results

The first step of BC assessment required the assignment of Wrocław’s land uses, defined in the city’s official document of development conditions, into the NFA’s classification (Figure 4).
The city of Wrocław’s land use types were characterized mostly by the ‘infrastructure’ land use type with 100.49 km2 and ‘grazing lands’ with 94.67 km2 (Table 6). The following areas were represented by ‘croplands’ with 64.97 km2, ‘forest lands’ with 24.70 km2, and ‘inland fishing grounds’ with 7.90 km2. Thus, the total BC of the city of Wrocław represented an area of 61,351 gha, which per capita per year represented the area of about 0.10 gha.
The top-down EFF had value of 0.974 gha per capita per year. The EFF using hybrid method was 0.963 gha per capita per year. Thus, the ratio of EFF to BC is about 10.1 gha for top-down assessment and 9.9 gha for hybrid assessment. This means that EFF exceeded the current BC by 9.9–10.1 times. Moreover, the mapping of EFF and the BC, required the radius of 44.2 km, according to hybrid EFF, and 44.5 km for top-down EFF respectively. The BC could be mapped using a radius of 14.0 km (Figure 5).
The EFF exceeded the boundary of the city, as well as the boundary of the suburban zone. The obtained results of EFF and BC per capita, as well as the calculated radius, showed that Wrocław exceeded its environmental carrying capacity. Thus, the Wrocław could be defined as ecological debtor. There could be noted that even one aspect of city’s inhabitants living, as food consumption, could have a significant impact on the environment.

4. Discussion and Conclusions

The results of this study indicated, that the EFF exceeded the current biological potential of the city of Wrocław, which could be categorized as ecological debtor. However, there should be underlined that cities are centers of population, and by extension, centers of resource aggregation, and consumption. Therefore, it generally should be expected that all major cities are ecological debtors. The latest research of EF and BC at national level showed, that Poland’s BC per capita was 2.08 gha [62]. This means, that EFF of Wrocław is 46–47% of Poland’s biocapacity.
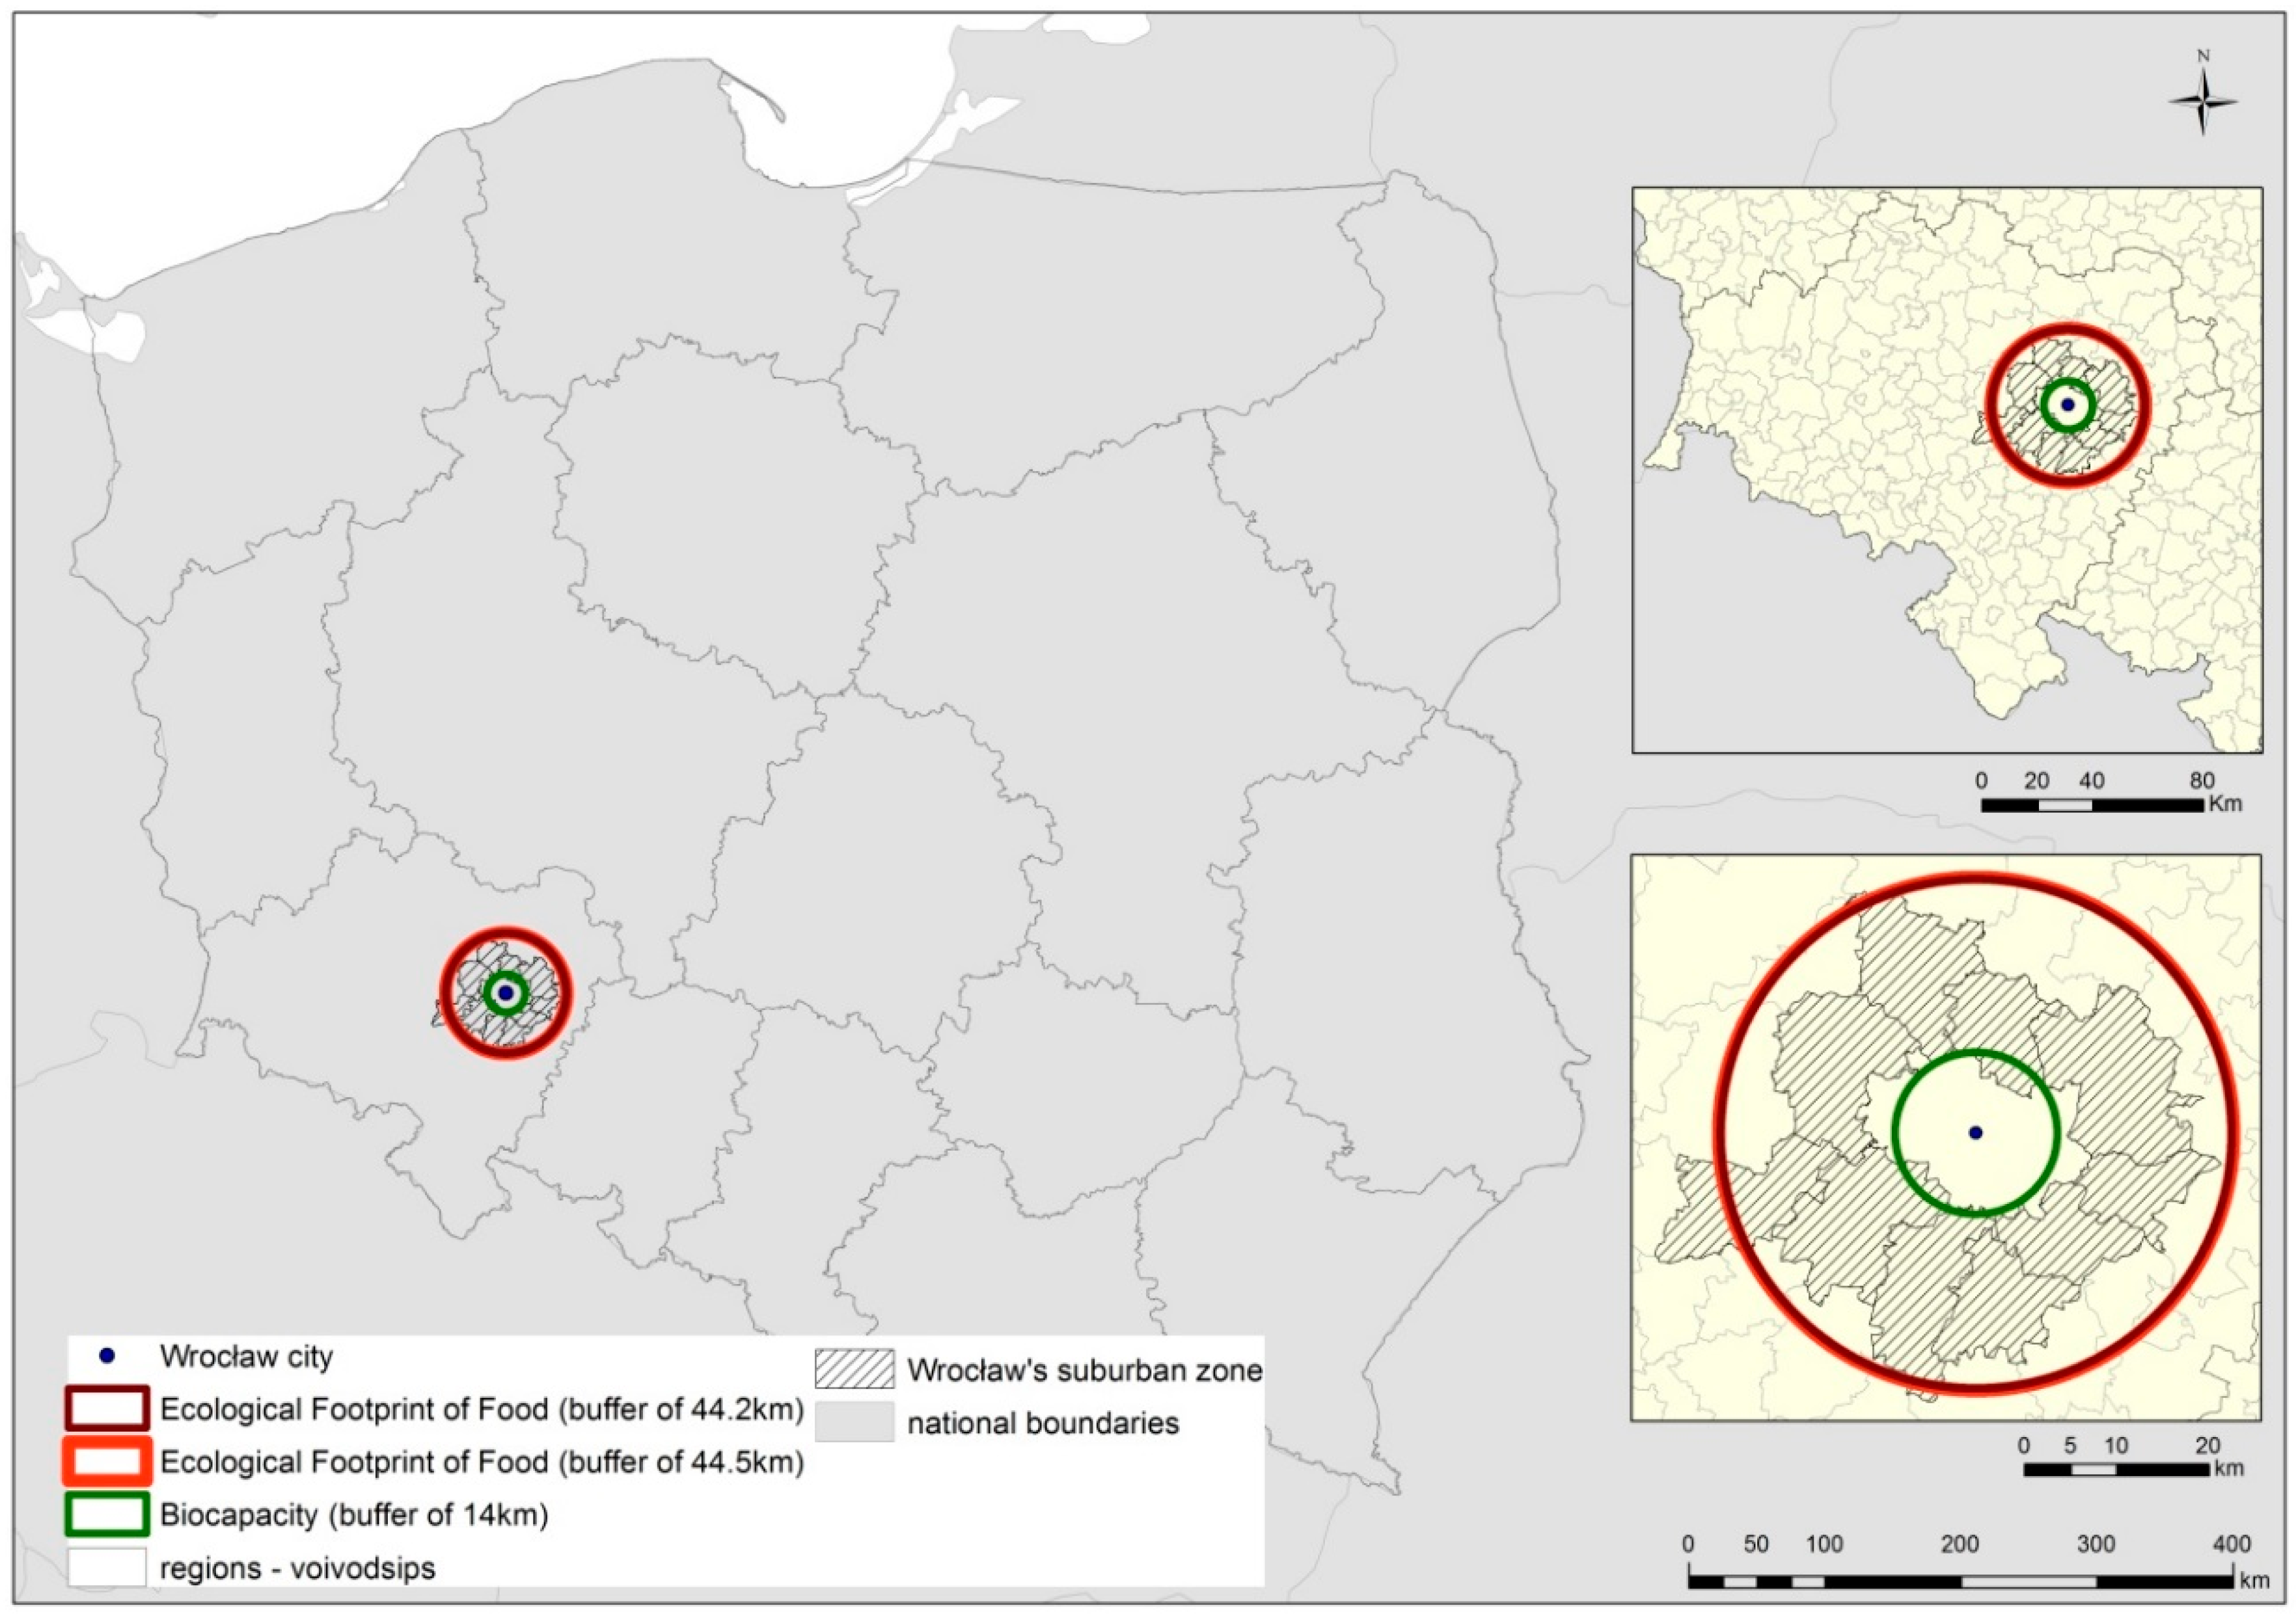
The Wrocław’s EFF exceeded its BC by about 10 times, which means also the exceeding of the environmental carrying capacity of Wrocław. Considering that Poland’s ecological footprint of food is about a quarter of the total EF (1.0 gha per capita per year vs. 4.4 gha per capita per year, respectively) [62], the total EF for Wrocław, which includes transportation, housing, goods, and services could be higher than the EFF calculated here. The EFF per capita was assessed as 0.963–0.974 gha per capita per year. The Wrocław’s EFF may be compared with values calculated for Mediterranean countries, where an average EF was 0.9 gha per capita per year [63]. The highest value of EF had Portugal with an EF reaching 1.5 gha per capita per year. The lowest value had Slovenia with 0.63 gha per capita per year [63]. The obtained differences could be connected with number of components taking into consideration in each research. Wrocław’s EF included only one of the total EF categories—food footprint. The research conducted by Galli et al. [63] take into consideration also others sources and goods consumed by households, such as clothing and footwear; housing, water, electricity, gas and other fuels; furnishings, household equipment; transportation, etc. Therefore, future research should implement further categories. Moreover, the obtained differences would be connected to the nutrition habits of the Polish people. Meat and its products dominate in the everyday diet [64].
One of the major challenges of sub-national ecological footprint assessments is data availability. This limitation applies to both top-down and bottom-up calculations, and to overcome this limitation requires significant effort, either in developing and implementing surveys or time-intensive LCA for both CO2 and additional ecological footprint components. Without sufficient data, bottom-up calculations are severely limited and inaccurate simply because of lack of completeness. LCA approaches are generally advantageous for calculating the carbon footprint because they include full upstream supply chain emissions, and are very location specific, however they tend to be very time intensive and more difficult to apply for tracking non-CO2 footprint components. Thus, applying a hybrid top-down approach allows for missing categories to be supplemented with scaled estimates. Here we show that the difference between these approaches is relatively minor.
Although the research was based on universal data, as representative European food basket products, and indices for CO2eq emission of food consumption in Europe, some data were still unavailable or classified in another manner in the available reports. Therefore, bottom-up CFF assessment, based on the LCA method, also has some limitations:
  • The report, on average monthly consumption of selected foodstuffs per capita in households by class of locality or regions/voivodeships, did not have information on consumed products as beef, pork, and beer. Thus, these data had to be assumed from report on the national annual amount of consumption of a given product.
  • There was no information about meat-based meals on the level of the city’s and region’s accuracy, as well as national level.
  • The report did not include some food products—i.e., olive oil and sunflower oil—but contained the integrated information about the consumption of vegetables fats. Therefore, the CO2eq factor for this group was assumed as an average value from these two products. Thus, the value for this product group could be undervalued.
  • The European food basket includes two products from the ‘fruits’ group, namely oranges and apples. However, the information about the consumption of oranges was unavailable in Polish reports. Despite this, there was available information on the consumption of citrus fruit and bananas. Therefore, we decided to assume the value of oranges’ CO2eq to this product type. The information of the consumption of apples was available, thus no additional assumption for this product type was required.
  • The research showed that the highest impact on the CFF had the product groups ‘meat and seafood’, ‘beverages’, and ‘dairy products’. Usually, the highest impact of food consumption have the meat and dairy products [58]. The obtained results fit partially into the literature-based model. Therefore, the use of representative food products could be considered as a limitation in this context.
  • The analysis used food data from different levels, which was connected with lack of some data at the city level. Despite this, the hybridization of top-down and bottom-up approaches allowed for a comparison of the obtained results from a top-down approach.
  • It should be noted that the baseline for calculation was the year 2016. However, we used data from 2016 (food consumption, land use), 2014 (YF, EQF, carbon dioxide sequestration index) and 2013 (CO2eq for each food product). Therefore, the analysis requires recalculation based on data for the year 2016 when these data become available.
The analysis based on European universal data of CO2eq, which presents the amount of CO2eq emitted during whole life cycle of given product. Note that there may be differences in the cultivation of the same products in the same area, but in different ways—organic or intensive farming [65], which could have an impact on the assessed CFF. Moreover, our analysis did not include food waste and—connected with this phenomenon—the recycling technologies. The use of various types of food waste recycling allows for the minimization of contamination and increasing of recycling rates [66]. Food waste is one of the major problems in modern society [67]. Therefore, such assumptions should be verified in future analyses and studies.
The presented bottom-up, as well as the top-down approach showed some limitations. First one characterizes the incomparability of results with top-down approach. This means that the bottom-up approach better described local condition, without comparison to sub-national results. On the other hand, the top-down approach not adequately reflect local situations [55]. Therefore, the verification of hybridization of top-down and bottom-up approaches [18] and its comparability to top-down approach is desirable.
The proposed bottom-up CFF assessment could increases the comparability of results between European cities. Especially that finally the difference of top-down EFF and hybrid EFF was 1.2%. Thus, the research verified that the use of hybrid method allows for comparability with top-down approach. This, in turn, could also increase the comparability of the ECC of cities. Thus, future research directions should be connected with development of ecological footprint at city level defined by more categories than food. The EFF might be used for the assessment of ECC within other administrative units, such as municipalities, regions, or even at the national level. The implementation of EFF into ECC would allow for understanding the city residents’ lifestyle and consumption, which should be a base for creating future long-term spatial policy, other action plans connected with adaptation to climate change and reduction of greenhouse gas emissions or food security policy.
The analysis of food consumption allows for an evaluation of resource bases to ensure food security, as well as for estimating the food consumption pressure [48]. Moreover, the proposed assessment might be used for other research aspects, such as for ecosystem services assessment or foodshed analysis. The approach of EFF as a part of ECC presented in this research allowed for the assessment of the human impact based on environmental resources consumption and the related emission at a local or city level. The obtained results pointed, that even one component of EF assessment could verify if current development, and connected with it resources exploitation, might surpass the ECC of given city.

Author Contributions

Conceptualization, M.Ś. and D.L.; Methodology, M.Ś. and D.L.; Software, M.Ś., A.A., and S.S.; Validation, M.Ś. and A.A.; Resources, M.Ś., A.A., and J.K.K.; Writing—Original Draft Preparation, M.Ś.; Writing—Review & Editing, M.Ś., J.v.H., J.K.K., D.L., A.A., and M.W.; Visualization, M.Ś. and S.S.; Supervision, D.L. and M.W.

Funding

This research received no external funding.

Conflicts of Interest

The authors declare no conflict of interest.

References

  1. Izakovičová, Z.; Mederly, P.; Petrovič, F. Long-Term Land Use Changes Driven by Urbanisation and Their Environmental Effects (Example of Trnava City, Slovakia). Sustainability 2017, 9, 1553. [Google Scholar] [CrossRef]
  2. Hełdak, M.; Płuciennik, M. Costs of Urbanisation in Poland, Based on the Example of Wrocław. In Proceedings of the IOP Conference Series: Materials Science and Engineering, Prague, Czech Republic, 12–16 June 2017; Volume 245, p. 072003. [Google Scholar] [CrossRef]
  3. United Nations Environment Programme. Global Environment Outlook 5; United Nations Environment Programme: Nairobi, Kenya, 2014. [Google Scholar]
  4. Solecka, I.; Sylla, M.; Świąder, M. Urban Sprawl Impact on Farmland Conversion in Suburban Area of Wroclaw, Poland. In Proceedings of the IOP Conference Series: Materials Science and Engineering, Prague, Czech Republic, 12–16 June 2017; Volume 245. [Google Scholar] [CrossRef]
  5. United Nations. World Urbanization Prospects: The 2018 Revision [Key Facts]; United Nations: San Francisco, CA, USA, 2018. [Google Scholar]
  6. Global Footprint Network. National Footprint Accounts, 2018th ed.; Global Footprint Network: Oakland, CA, USA, 2018. [Google Scholar]
  7. Świąder, M.; Szewrański, S.; Kazak, J. Poverty Risk Index as A New Methodology for Social Inequality Distribution Assessment. In Proceedings of the IOP Conference Series: Materials Science and Engineering, Prague, Czech Republic, 12–16 June 2017; Volume 245. [Google Scholar] [CrossRef]
  8. Kazak, J.K. The Use of a Decision Support System for Sustainable Urbanization and Thermal Comfort in Adaptation to Climate Change Actions—The Case of the Wrocław Larger Urban Zone (Poland). Sustainability 2018, 10, 1083. [Google Scholar] [CrossRef]
  9. Edelman, D. Carrying Capacity Based Regional Planning by National Institute of Urban Affairs, New Delhi; Institute for Housing and Urban Development Studies: Rotterdam, The Netherlands, 1997. [Google Scholar]
  10. Jung, C.; Kim, C.; Kim, S.; Suh, K. Analysis of Environmental Carrying Capacity with Emergy Perspective of Jeju Island. Sustainability 2018, 10, 1681. [Google Scholar] [CrossRef]
  11. Rees, W.E. Ecological footprints and appropriated carrying capacity: What urban economics leaves out. Environ. Urban. 1992, 4, 121–130. [Google Scholar] [CrossRef]
  12. Budihardjo, S.; Hadi, S.P.; Sutikno, S.; Purwanto, P. The Ecological Footprint Analysis for Assessing Carrying Capacity of Industrial Zone in Semarang. J. Hum. Resour. Sustain. Stud. 2013, 1, 14–20. [Google Scholar] [CrossRef]
  13. Mohapatra, S.P. An Ecological Analysis of Carrying Capacity and Sustainability. Int. J. Sci. Res. 2012, 2, 335–338. [Google Scholar]
  14. Santoso, E.B.; Erli, H.K.D.M.; Aulia, B.U.; Ghozali, A. Concept of Carrying Capacity: Challenges in Spatial Planning (Case Study of East Java Province, Indonesia). Procedia Soc. Behav. Sci. 2014, 135, 130–135. [Google Scholar] [CrossRef]
  15. Monfreda, C.; Wackernagel, M.; Deumling, D. Establishing national natural capital accounts based on detailed Ecological Footprint and biological capacity assessments. Land Use Policy 2004, 21, 231–246. [Google Scholar] [CrossRef]
  16. Moran, D.D.; Wackernagel, M.; Kitzes, J.A.; Goldfinger, S.H.; Boutaud, A. Measuring sustainable development—Nation by nation. Ecol. Econ. 2008, 64, 470–474. [Google Scholar] [CrossRef]
  17. Galli, A.; Halle, M.; Grunewald, N. Physical limits to resource access and utilisation and their economic implications in Mediterranean economies. Environ. Sci. Policy 2015, 51, 125–136. [Google Scholar] [CrossRef]
  18. Baabou, W.; Grunewald, N.; Ouellet-Plamondon, C.; Gressot, M.; Galli, A. The Ecological Footprint of Mediterranean cities: Awareness creation and policy implications. Environ. Sci. Policy 2017, 69, 94–104. [Google Scholar] [CrossRef]
  19. Mancini, M.S.; Galli, A.; Coscieme, L.; Niccolucci, V.; Lin, D.; Pulselli, F.M.; Bastianoni, S.; Marchettini, N. Exploring ecosystem services assessment through Ecological Footprint accounting. Ecosyst. Serv. 2018, 30, 228–235. [Google Scholar] [CrossRef]
  20. Lin, D.; Hanscom, L.; Martindill, J.; Borucke, M.; Cohen, L.; Galli, A.; Lazarus, E.; Zokai, G.; Iha, K.; Eaton, D.; et al. Working Guidebook to the National Footprint Accounts, 2016th ed.; Global Footprint Network: Oakland, CA, USA, 2016. [Google Scholar]
  21. Ewing, B.; Reed, A.; Galli, A.; Kitzes, J.; Wackernagel, M. Calculation Methodology for the National Footprint Accounts, 2010th ed.; Global Footprint Network: Oakland, CA, USA, 2010. [Google Scholar]
  22. Galli, A. On the rationale and policy usefulness of Ecological Footprint Accounting: The case of Morocco. Environ. Sci. Policy 2015, 48, 210–224. [Google Scholar] [CrossRef]
  23. Ohl, B.; Wolf, S.; Anderson, W. A modest proposal: Global rationalization of ecological footprint to eliminate ecological debt. Sustain. Sci. Pract. Policy 2008, 4, 5–16. [Google Scholar] [CrossRef]
  24. Hoekstra, A.Y. Human Appropriation of Natural Capital: Comparing Ecological Footprint and Water Footprint Analysis; Value of Water Research Report Series No. 23; University of Twente: Enschede, The Netherlands, 2007. [Google Scholar]
  25. Weinzettel, J.; Steen-Olsen, K.; Hertwich, E.G.; Borucke, M.; Galli, A. Ecological footprint of nations: Comparison of process analysis, and standard and hybrid multiregional input–output analysis. Ecol. Econ. 2014, 101, 115–126. [Google Scholar] [CrossRef]
  26. Global Footprint Network. Ecological Footprint Standards 2009; Kitzes, J., Ewing, B., Wermer, P., Eds.; Global Footprint Network: Oakland, CA, USA, 2009. [Google Scholar]
  27. Belčáková, I.; Diviaková, A.; Belaňová, E. Ecological Footprint in relation to Climate Change Strategy in Cities. In Proceedings of the IOP Conference Series: Materials Science and Engineering, Prague, Czech Republic, 12–16 June 2017; Volume 245. [Google Scholar] [CrossRef]
  28. Isman, M.; Archambault, M.; Racette, P.; Konga, C.N.; Llaque, R.M.; Lin, D.; Iha, K.; Ouellet-Plamondon, C.M. Ecological Footprint assessment for targeting climate change mitigation in cities: A case study of 15 Canadian cities according to census metropolitan areas. J. Clean. Prod. 2018, 174, 1032–1043. [Google Scholar] [CrossRef]
  29. WWF. Japan Ecological Footprint Report; WWF: Gland, Switzerland, 2012. [Google Scholar]
  30. Moore, D. Ecological Footprint Analysis San Francisco-Oakland-Fremont, CA; Global Footprint Network: Oakland, CA, USA, 2011. [Google Scholar]
  31. Amend, T.; Barbeau, B.; Beyers, B.; Burns, S.; Eissing, S.; Fleischhauer, A.; Kus, B.; Poblete, P. A Big Foot on a Small Planet? Accounting with the Ecological Footprint Succeeding in a World with Growing Resource Constraints; A Brochure Series with Accompanying Materials on Development Cooperation for the UN Decade of Education for Sustainable Development; Global Footprint Network: Oakland, CA, USA, 2010. [Google Scholar]
  32. Gong, W.H.; Guangyao, Z.; Guofang, S.; Hanson, A.; Leape, J.P.; Louis, I.; O’ Gorman, D.; Lin, L.; Gaodi, X.; Shuyan, C.; et al. China Ecological Footprint Biocapacity, Cities and Development; WWF, CCICED: Beijing, China, 2010. [Google Scholar]
  33. Calcott, A.; Carbonplan, J.B. Ecological Footprint of British City Residents What We Can Do to Reduce Ours. 2007, pp. 24–30. Available online: https://www.elgaronline.com/view/9780857936950.xml (accessed on 10 August 2018).
  34. Collins, A.; Flynn, A. The Ecological Footprint: New Developments in Policy and Practice; Edward Elgar Publishing: Cheltenham, UK; Northampton, MA, USA, 2015; ISBN 9780857936950. [Google Scholar]
  35. Barrett, J.; Cherret, N.; Birch, R. Exploring the Application of the Ecological Footprint to Sustainable Consumption Policy. J. Environ. Policy Plan. 2005, 7, 303–316. [Google Scholar] [CrossRef]
  36. Dubbeling, M.; Carey, J.; Hochberg, K. The Role of Private Sector in City Region Food Systems; Analysis Report; RUAF Foundation: Leusden, The Netherlands, 2016. [Google Scholar]
  37. Kuznecova, T.; Romagnoli, F.; Rochas, C. Energy metabolism for resilient urban environment: A methodological approach. Procedia Econ. Financ. 2014, 18, 780–788. [Google Scholar] [CrossRef]
  38. Karg, H.; Drechsel, P.; Akoto-Danso, E.; Glaser, R.; Nyarko, G.; Buerkert, A. Foodsheds and City Region Food Systems in Two West African Cities. Sustainability 2016, 8, 1175. [Google Scholar] [CrossRef]
  39. Świader, M.; Szewrański, S.; Kazak, J.K. Foodshed as an example of preliminary research for conducting environmental carrying capacity analysis. Sustainability 2018, 10, 882. [Google Scholar] [CrossRef]
  40. Song, G.; Li, M.; Semakula, H.M.; Zhang, S. Food consumption and waste and the embedded carbon, water and ecological footprints of households in China. Sci. Total Environ. 2015, 529, 191–197. [Google Scholar] [CrossRef] [PubMed]
  41. Hill, J.; Mustafa, S. Natural Resources Management and Food Security in the Context of Sustainable Development. Sains Malays. 2011, 40, 1331–1340. [Google Scholar]
  42. Lai, S.; Leone, F.; Zoppi, C. Anthropization Processes and Protection of the Environment: An Assessment of Land Cover Changes in Sardinia, Italy. Sustainability 2017, 9, 2174. [Google Scholar] [CrossRef]
  43. Statuto, D.; Cillis, G.; Picuno, P. Analysis of the effects of agricultural land use change on rural environment and landscape through historical cartography and GIS tools. J. Agric. Eng. 2016, 47, 28–39. [Google Scholar] [CrossRef]
  44. Wiedmann, T.; Barrett, J. A review of the ecological footprint indicator-perceptions and methods. Sustainability 2010, 2, 1645–1693. [Google Scholar] [CrossRef]
  45. United Nations. Draft Outcome Document of the United Nations Summit for the Adoption of the Post-2015 Development Agenda; United Nations: New York, NY, USA, 2015. [Google Scholar]
  46. Szewrański, S.; Kazak, J.; Żmuda, R.; Wawer, R. Indicator-Based Assessment for Soil Resource Management in the Wrocław Larger Urban Zone of Poland. Pol. J. Environ. Stud. 2017, 26, 2239–2248. [Google Scholar] [CrossRef] [Green Version]
  47. Sówka, I.; Bezyk, Y. Greenhouse gas emission accounting at urban level: A case study of the city of Wroclaw (Poland). Atmos. Pollut. Res. 2018, 9, 289–298. [Google Scholar] [CrossRef]
  48. Bhoyar, S.P.; Dusad, S.; Shrivastava, R.; Mishra, S.; Gupta, N.; Rao, A.B. Understanding the Impact of Lifestyle on Individual Carbon-footprint. Procedia Soc. Behav. Sci. 2014, 133, 47–60. [Google Scholar] [CrossRef]
  49. Bank Danych Lokalnych [Local Data Bank] Ludność [Population]. Available online: https://bdl.stat.gov.pl/BDL/metadane/grupy/3?back=True# (accessed on 24 May 2018).
  50. Główny Urząd Statystyczny [Statistics Poland]. Budżety Gospodarstw Domowych w 2016 r. [Household Budgets in 2016.]; Główny Urząd Statystyczny [Statistics Poland]: Warsaw, Poland, 2017.
  51. Główny Urząd Statystyczny [Statistics Poland]. Dostawy na Rynek Krajowy Oraz Spożycie Niektórych Artykułów Konsumpcyjnych na 1 Mieszkańca w 2016 Roku [Deliveries to the Domestic Market and Consumption of Some Consumer Goods per Capita in 2016]; Główny Urząd Statystyczny [Statistics Poland]: Warsaw, Poland, 2017.
  52. Monforti-Ferrario, F.; Dallemand, J.-F.; Pascua, I.P.; Motola, V.; Banja, M.; Scarlat, N.; Medarac, H.; Castellazzi, L.; Labanca, N.; Bertoldi, P.; et al. Energy Use in the EU Food Sector: State of Play and Opportunities for Improvement; Monforti-Ferrario, F., Pinedo Pascua, I., Eds.; Publications Office of the European Union: Luxembourg, 2015. [Google Scholar]
  53. Global Footprint Network. Poland Consumption Land Use Matrix 2014; Global Footprint Network: Oakland, CA, USA, 2018. [Google Scholar]
  54. Biuro Rozwoju Wrocławia [Wroclaw Development Office]. Studium Uwarunkowań i Kierunków Zagospodarowania Przestrzennego Wrocławia, 2018 [Study of Conditions and Directions of Spatial Development in Wrocław, 2018]; Biuro Rozwoju Wrocławia [Wroclaw Development Office]: Wrocław, Poland, 2018.
  55. Moore, J.; Kissinger, M.; Rees, W.E. An urban metabolism and ecological footprint assessment of Metro Vancouver. J. Environ. Manag. 2013, 124, 51–61. [Google Scholar] [CrossRef] [PubMed]
  56. Wright, L.A.; Kemp, S.; Williams, I. ‘Carbon footprinting’: Towards a universally accepted definition. Carbon Manag. 2011, 2, 61–72. [Google Scholar] [CrossRef]
  57. United Nations. Classifications of Expenditure According to Purpose: Classification of the Functions of Government (COFOG); Classification of Individual Consumption According to Purpose (COICOP); Classification of the Purposes of Non-Profit Institutions Serving Households (COPNI); Classification of the Outlays of Producers According to Purpose (COPP); Statistical Papers Series M, No.84; United Nations: New York, NY, USA, 2000. [Google Scholar]
  58. Notarnicola, B.; Tassielli, G.; Renzulli, P.A.; Castellani, V.; Sala, S. Environmental impacts of food consumption in Europe. J. Clean. Prod. 2017, 140, 753–765. [Google Scholar] [CrossRef]
  59. Acosta, K.; Moore, J. Creating an Ecological Footprint Assessment: Using Component and Compound Economic Input Output Methods-Natural Step and Life Cycle Assessments; British Columbia Institute of Technology: Burnaby, BC, Canada, 2009. [Google Scholar]
  60. Mancini, M.S.; Galli, A.; Niccolucci, V.; Lin, D.; Bastianoni, S.; Wackernagel, M.; Marchettini, N. Ecological Footprint: Refining the carbon Footprint calculation. Ecol. Indic. 2016, 61, 390–403. [Google Scholar] [CrossRef]
  61. Galli, A.; Wackernagel, M.; Iha, K.; Lazarus, E. Ecological Footprint: Implications for biodiversity. Biol. Conserv. 2014, 173, 121–132. [Google Scholar] [CrossRef]
  62. Global Footprint Network Open Data Platform. Available online: http://data.footprintnetwork.org/#/countryTrends?cn=173&type=BCpc,EFCpc (accessed on 26 June 2018).
  63. Galli, A.; Iha, K.; Halle, M.; El Bilali, H.; Grunewald, N.; Eaton, D.; Capone, R.; Debs, P.; Bottalico, F. Mediterranean countries’ food consumption and sourcing patterns: An Ecological Footprint viewpoint. Sci. Total Environ. 2017, 578, 383–391. [Google Scholar] [CrossRef] [PubMed]
  64. Szczepaniak, B.; Górecka, D.; Flaczyk, E. Nutritional habits relating to meat and meat products consumption among young people from selected regions of poland. Pol. J. Food Nutr. Sci. 2004, 13, 421–426. [Google Scholar]
  65. Huijbregts, M.A.; Hellweg, S.; Frischknecht, R.; Hungerbühler, K.; Jan Hendriks, A. Ecological footprint accounting in the life cycle assessment of products. Ecol. Econ. 2007, 64, 798–807. [Google Scholar] [CrossRef]
  66. National Zero Waste Council. Reducing Food Waste & Cutting Canada’s Carbon Emissions: Policies for Reaping the Environmental, Economic and Social Benefits; Comments Provided by the National Zero Waste Council; National Zero Waste Council: Vancouver, BC, Cananda, 2016. [Google Scholar]
  67. Scholz, K.; Eriksson, M.; Strid, I. Carbon footprint of supermarket food waste. Resour. Conserv. Recycl. 2015, 94, 56–65. [Google Scholar] [CrossRef]
Figure 1. The location of EF assessment for cities across countries within the period 1998–2017. Source: own elaboration using Tableau Software, based on [18,29,30,31,32,33,34,35].
Resources 07 00052 g001
Figure 2. The location of study area—the city of Wrocław (dark blue on the map) with its suburban zone (light blue on the map).
Resources 07 00052 g002
Figure 3. The simplified scheme of CFF assessment.
Resources 07 00052 g003
Figure 4. The land use of the city of Wrocław.
Resources 07 00052 g004
Figure 5. The circular extent of EFF and BC of the city of Wrocław.
Resources 07 00052 g005
Table 1. Scaling factor for COICOP categories.
COICOP CodeCOICOP CategoryConsumption (Kg)Scaling Factor
WroclawPoland
011.1Bread and cereals5.125.880.87
011.2Meat4.565.320.86
011.3Fish and seafood0.340.321.05
011.4Milk, cheese, and eggs5.265.440.97
011.5Oils and fats1.021.130.90
011.6Fruit8.427.321.15
011.7Vegetables15.5117.180.90
011.8Sugar, jam, honey, chocolate, confectionery1.551.780.87
011.9Food products n.e.c. 1.00
01.2Non-alcoholic beverages7.436.131.21
02.1Alcoholic beverages 1.00
Table 2. Types of products taken into consideration for CFF assessment.
Product Group 1Type of Product 1
Meat and seafoodBeef
Pork
Poultry
Dairy productsMilk
Cheese
Butter
Crop-based productsOlive oil
Sunflower oil
Sugar
Cereal-based productsBread
VegetablesPotatoes
FruitsOranges
Apples
BeveragesCoffee
Mineral water
Beer
Prepared mealsMeat-based meals
Note: 1 The CO2 (CO2eq) was retrieved from EC Report “Energy use in the EU food sector: State of play and opportunities for improvement” [52].
Table 3. Results of EFF of each COICOP category per capita.
COICOP CodeCOICOP CategoryComponents of EFFTOTAL EFF
CroplandGrazing LandForest ProductsFishing GroundsBuilt-Up LandCarbon Footprint
011.1Bread and cereals0.1260.0000.0020.0010.0000.0120.142
011.2Meat0.1540.0130.0170.0110.0030.0540.252
011.3Fish and seafood0.0060.0000.0020.0120.0000.0050.025
011.4Milk, cheese, and eggs0.0680.0080.0150.0070.0020.0500.151
011.5Oils and fats0.0730.0050.0140.0070.0020.0460.147
011.6Fruit0.0500.0000.0040.0010.0010.0160.072
011.7Vegetables0.0420.0000.0030.0010.0000.0140.060
011.8Sugar, jam, honey, chocolate, confectionery0.0170.0000.0030.0020.0010.0100.032
011.9Food products n.e.c.0.0070.0000.0010.0010.0000.0040.013
01.2Non-alcoholic beverages0.0090.0000.0050.0010.0010.0130.029
02.1Alcoholic beverages0.0150.0000.0090.0020.0010.0230.050
Total0.5680.0280.0760.0450.0120.2460.974
Table 4. Results of CFF assessment.
Product GroupType of ProductUnitAnnual Weighted Average Consumption per Capita (kg)Annual Consumption per All Inhabitants (kg)CO2eq Emission per Unit of Product (kgCO2eq/Unit of Product)Total Emission of CO2eq per Year (tCO2eq)Total CFF per Year (gha)CFF per Capita per Year (gha)
Meat and seafoodBeefkg2.11,339,1346.102817127620.004
Porkkg40.826,017,4664.227109,98237,1740.058
Poultrykg17.6211,233,4245.53662,19421,0220.033
Dairy productsMilkL34.2521,839,3670.70015,28451660.008
Cheesekg11.907,590,9786.32848,03716,2360.025
Butterkg3.412,173,2249.12019,81966990.011
Crop-based productsVegetable fatsL8.955,708,5383.54120,21468320.011
Sugarkg9.726,198,2790.590365812360.002
Cereal-based productsBreadkg34.7822,176,0640.84218,67863130.010
VegetablesPotatoeskg33.0021,043,5390.49310,37435060.005
FruitsCitrus fruit and bananaskg17.9011,417,0760.482549818580.003
Appleskg12.8281,72,5450.385315010650.002
BeveragesCoffeekg2.141,362,0919.69613,20744640.007
Mineral and spring watersL71.2645,438,7400.24511,13937650.006
BeerL99.563,449,4591.45392,17231,1540.049
Total441,579149,2540.234
Table 5. Difference between values of top-down CFF and bottom-up CFF to value of top-down CFF.
Hybrid CategoriesBottom-Up CFFTop-Down CFFDifference
Meat and seafood0.0960.090−6%
Dairy products0.0440.05011%
Crop-based products0.0130.02854%
Cereal-based products0.0100.01219%
Vegetables0.0060.01459%
Fruits0.0050.01672%
Beverages0.0620.036−71%
Total0.2340.2464.7%
Table 6. Results of BC assessment of the city of Wrocław.
Land Use Type (NFA)Area (km2)Area (ha)YFEQFBC per Year (gha)BC per Capita per Year (gha)
Infrastructure100.4910,0491.081292.5227,403.770.0430
Forest lands24.7024702.285461.297262.050.0114
Croplands64.9764971.081292.5217,718.590.0278
Grazing lands94.6794672.108240.469123.550.0143
Inland fishing grounds7.9079010.37290.300.0005
Total61,350.910.0970

