Article

An Assessment of Airport Sustainability, Part 2—Energy Management at Copenhagen Airport

1
School of Tourism and Hospitality Management, Suan Dusit University, Hua Hin, Prachaup Khiri Khan 77110, Thailand
2
School of Engineering, RMIT University, Melbourne, VIC 3000, Australia
*
Author to whom correspondence should be addressed.
Resources 2018, 7(2), 32; https://doi.org/10.3390/resources7020032
Submission received: 21 March 2018 / Revised: 15 May 2018 / Accepted: 16 May 2018 / Published: 24 May 2018

Abstract

:
Airports play a critical role in the air transport value chain. Each air transport value chain stakeholder requires energy to conduct their operations. Airports are extremely energy intensive. Greenhouse gases are a by-product from energy generation and usage. Consequently, airports are increasingly trying to sustainably manage their energy requirements as part of their environmental policies and strategies. This study used an exploratory qualitative and quantitative case study research approach to empirically examine Copenhagen Airport, Scandinavia’s major air traffic hub, sustainable airport energy management practices and energy-saving initiatives. For Copenhagen Airport, the most significant environmental impact factors occurring from energy usage are the CO2 emissions arising from both the air side and land side operations. Considering this, the airport has identified many ways to manage and mitigate the environmental impact from energy consumption on both the air and land side operations. Importantly, the application of technological solutions, systems and process enhancements and collaboration with key stakeholders has contributed to the airport’s success in mitigating the environmental impact from energy usage at the airport whilst at the same time achieving energy savings.

1. Introduction

Airports play a vital role in the global air transport value chain, acting as the critical interface point between the surface-based and air transport modes. In facilitating the provision of air transport services for passengers and/or air cargo shippers, the key stakeholders in the air transport value chain—for example, airlines, airports, ground handling agents, air traffic control (ATC), aircraft maintenance organizations, and flight catering firms—require reliable, secure, and cost-efficient energy. However, a by-product arising from energy usage at airports is the production of CO2 gases, and the potential flow on effect that these may have on the environment and their local communities. In recent years, the global air transport industry has initiated new sustainability efforts as a response to society’s greater requirement for living in healthier and more sustainable environments [1]. Thus, the airport industry, like many other industries, is confronting the effects of increasing environmental pressure [2]. Consequently, airports are working to make themselves more environmentally friendly [3] whilst also reducing their carbon footprint [4]. The airport’s location, current situation, and available opportunities also play a key role in this situation [3]. Environmental management plans and eco-friendly policies and strategies are therefore increasingly being adopted by airports all around the world [5].
The aim of this study is to examine how Copenhagen Airport, Denmark’s busiest airport and Scandinavia’s major air traffic hub, manages their energy consumption, energy sources, and stakeholder requirements whilst at the same time ensuring a sustainable approach to their operations. The first aim is to identify the various impacts that arise from the consumption of energy at Copenhagen Airport and their influence on the natural environment and local communities. The second aim is to identify the greenhouse gas emissions produced from the energy sources used at the airport. A further aim is to examine how the emergent technologies and system and process enhancements implemented by Copenhagen Airport as part of their environmental policy have helped to improve the sustainability of a modern, and large, airport’s energy requirements. This study is a continuation of previous preliminary work investigating the sustainable energy practices in airport design and operations [6].
Two major delimitations of the study need to be stated at the outset. The first of these is that the study only utilizes data aggregated at the airport level, and no breakdown of individual aspects is investigated, that is, data is not available for the airside and landside precincts. Therefore, although initially of interest, the energy breakdown and comparison between the airside and landside areas was not possible. Similarly, an economic facet of sustainability assessment is not within the scope of this study, primarily because the data required to undertake this assessment is not publicly available. As with most sustainability initiatives, there will clearly be an economic benefit associated with Copenhagen Airport’s sustainable energy management, which they would be fully cognizant of.
The remainder of the paper is organized as follows: Section 2 presents a review of the literature on airport energy management. Section 3 describes the study’s research methodology. Section 4 presents the case study based on Copenhagen Airport sustainable airport energy management. Section 5 presents the study’s findings.

2. Background

2.1. Airport Energy Management

An airport is essentially one or more runways for aircraft operations together with associated buildings or terminals where passengers or air cargo transported by aircraft are processed [7]. Airports are an integral component of the world air transport system—the places where airlines and the customers converge [8]. For historical, legal, and commercial reasons the actual activities performed at an airport for which the airport manager or owner is responsible vary significantly between countries and often between airports operating in the same country. Hence, the airport business can, in some instances, cover almost all activities performed at an airport, while elsewhere it may only encompass a relatively small part of the total airport activity [7]. The basic infrastructure and facilities provided by airports is comprised of runways, taxiways, apron space (ramp), passenger terminals, air cargo terminals, and ground transport interchange facilities [9,10].
Airports are extremely energy-intensive areas [11]. This is due to the large buildings (both passenger terminals and non-passengers’ areas) equipped with heating and air-conditioning systems, and the high-power demand for lighting and electric equipment and the energy requirements from the many facilities located within the airport precinct [12]. In addition to the provision of electrical energy required for the aids to air transport operations—for example, lighting and meteorological systems—electrical energy also needs to be provided for airport buildings, aircraft hangers, and other airport facilities [13]. Thus, energy management—which includes heating, ventilation, air conditioning (HVAC), and lighting—is extremely important for airports [2]. According to Akyüz et al. [14] (p. 1849), around “70% of the energy consumed in airport terminal buildings is used for heating, cooling and air conditioning purposes”. This energy consumption for HVAC is higher in countries that have cold climates [14].
Airports require a guaranteed, appropriately priced, and secure energy supply to meet peak demand from their service partners and passengers and therefore optimize their operational capacity. The maintenance of an ambient temperature and air quality within airport passenger terminals to ensure passenger comfort typically represents the single most significant contribution to energy usage and management at most airports [15].

2.2. Key Airport Stakeholder Energy Requirements

Energy consumed by airports can be broadly split into the energy consumed by the airside activities undertaken at the airport as well as the energy consumed in the provision of the airport’s landside area activities [16]. The airside means the movement area at an airport, adjacent terrain, and buildings/infrastructure, or portions thereof, the access to which is restricted. Landside means those parts of an airport, as well as the adjacent terrain and buildings or portions thereof, that are not in the airside precinct [17]. In the airport’s airside area, energy requirements include the fuel that is consumed by aircraft during the landing and take-off (LTO) cycles. Also, ground vehicles serving aircraft at the apron/gate complex consume energy. In the airport landside area, the primary consumers of energy are the airport ground access systems/modes and passenger and air cargo terminals as well as other administrative buildings serving the airport. In all cases, the primary energy sources are from non-renewable fossil fuels and to a moderate degree from renewable wind, water, and solar sources [16].
Central to the provision of services by airport stakeholders is a requirement for power to run their systems, equipment, air conditioning, and lighting. Airports also need to provide lighting for car parks, railway stations (where located at the airport), and ground transfer mode access/egress points. Table 1 shows the various stakeholders involved in the facilitation and handling of passengers and, where applicable, air cargo, handled on the landside of an airport and their typical energy usage requirements.
The key stakeholders that are typically involved in the facilitation and handling of aircraft (passenger and freighter aircraft), passenger and air cargo movements, aircraft maintenance, and air traffic control (ATC) on the air side of an airport are presented in Table 2. Like the landside, airside stakeholders require the provision of power to operate their systems, equipment, air conditioning, and lighting. Airports also need to provide lighting for airside aprons, facilities located on the airside, for example, air cargo terminals and aircraft maintenance centers, as well as for car parks for the vehicles operated in the airside precinct. In addition, airports also often have concessionaires located in the airside section of the terminal, for example, duty free shops and restaurants [2,19,20,21]. The airport authority will typically provide power for the air field’s lighting—runway, taxiway, and apron lighting.

2.3. Airport Energy Sources

To be able to undertake the landside and airside activities, a certain amount of energy is required. The two key energy sources are electricity and fuel, such as, diesel, natural gas, and propane [21]. Electrical energy is normally sourced from various sources and is supplied directly to the airport through dedicated sub-stations [16]. Typically, airport electricity supplies are sourced from the commercial grid and are supplied by a power company [22] (p. 349). This energy is principally consumed for heating, cooling, lighting, and operating the airport’s facilities, equipment, and other devices in the processes of servicing passengers and their baggage and air cargo consignments in passenger and cargo terminals, respectively. Electrical energy is also consumed in the provision of heating, cooling (air conditioning), and lighting other administrative buildings at airports. Crude oil is typically used for producing the gasoline that is used to power the ground vehicles used in an airport’s airside and landside areas [16]. Fuel is also used for heating boiler systems, emergency generators, or vehicles [22].
To reduce their long-term operating costs and to ensure that energy demand can be satisfied when the needs arises, airports are placing a higher focus on energy-conservation measures in the design (and operations) of terminal buildings and infrastructure [15]. Some airports have also developed and operate new power-generation systems that provide reliable and affordable sustainable energy whilst also lowering their energy costs [22,23]. Furthermore, airports often work closely with tenants, concessionaires, and service partners to reduce energy consumption through the introduction of low-energy equipment and systems [23]. There are several energy technologies that are currently being developed as energy sources for airports, including solar photovoltaic, concentrating solar power, wind power, oil and natural gas extraction, steam-generated power production, and electricity transmission [24].

2.4. Airport Energy Emissions

The overall energy consumption from air transport operations generates emissions of greenhouse gases, including CO2 (carbon dioxide), NOx (nitrogen oxides), SO2 (sulphur dioxide), H2O (water vapor), as well as others. The total quantities of greenhouse gases generated at airports correspond to, and can be determined separately for, the traffic-related activities taking place in the airside area, in the airport’s landside area, and for the traffic-supporting activities. In the airport’s landside area, greenhouse gases usually take the form of emissions from servicing passengers and air cargo in the corresponding terminals. There are also greenhouse gas emissions from the provision of heating, cooling, and lighting these and other airport buildings [16]. For electrical energy consumption, the emissions are deemed as being indirect from sources of production. Some measurements have indicated that, in relative terms, electricity consumption in airport buildings accounts for around 5% of an airport’s emissions [25].

3. Research Method

The research undertaken in this study was exploratory in nature [26,27] and follows an inductive approach using a qualitative longitudinal research design [28,29]. The goal of such an approach is to expand and build theories rather than perform statistical analysis to test a certain hypothesis [30]. As Yin [31] (p. 21) notes, a case study, whilst like an experiment, does not represent a sample, and the researcher’s role is to expand and generalize theories (analytical generalization) and not to enumerate frequencies (statistical generalization). To alleviate potential biases and to support measurement validity careful attention has been paid to the selection of sources used in the study [32]. Accordingly, data for the study was obtained from a range of documents, company materials available on the internet, and records as sources of case evidence. Documents included the Copenhagen Airports A/S annual reports, annual environmental reports, Copenhagen Airports A/S (CPH) and Society annual reports, press releases, and the airport’s websites. The study therefore used secondary data. The three principles of data collection as suggested by Yin [26,30] were followed: the use of multiple sources of case evidence, creation of a database on the subject, and the establishment of a chain of evidence.
The empirical data collected for the case studies was examined using document analysis. Document analysis is often used in case studies and focuses on the information and data from formal documents and company records [31,33]. The documents collected for the study were examined according to four criteria: authenticity, credibility, representativeness, and meaning [34,35]. Prior to conducting the formal analysis of the documents gathered in the study, the context in which the documents were created was determined and the authenticity of the documents was assessed [36]. Authenticity involves an assessment of the collected documents for their soundness and authorship. Scott and Marshall [36] (p. 188) note that “soundness’ refers to whether the document is complete and whether it is an original and sound copy”. Authorship relates to such issues as collective or institutional authorship. In this study, the source of the case study documents was Copenhagen Airport. The documents were available in the public domain. The credibility criterion concerns the accuracy and sincerity of a document [34]. In the current study, the evidence for the case study was corroborated using various kinds of documents. To alleviate potential bias, documents sourced from various sources were analyzed [37]. The representativeness criterion involved an assessment of the availability and survival of the documents gathered [34,36]. No major difficulties in obtaining documents was experienced in the current study as all the relevant documents were available in the public domain (from Copenhagen Airports A/S website). The fourth criterion, meaning, is a most important matter and occurs at two levels. The first is the literal understanding of a document, by which is meant its physical readability, the language used and whether it can be read, as well as the date of the document [36]. When conducting document analysis in a study, it is important to interpret the understanding and the context within which the document was produced. This enables the researcher to interpret the meaning of the document. The evidence found in the documents collected for the study was clear and comprehensible [38].
The study’s document analysis process was undertaken in six discrete phases as follows:
  • Phase 1: This phase involved planning the types and required documentation and their availability;
  • Phase 2: The data collection involved gathering the documents and developing and implementing a scheme for the document management;
  • Phase 3: Documents were reviewed to assess their authenticity and credibility and to identify any potential bias;
  • Phase 4: The content of the collected documents was interrogated, and the key themes, data, and issues were identified;
  • Phase 5: This phase involved the reflection and refinement to identify and difficulties associated with the documents, reviewing sources, as well as exploring the documents content; and
  • Phase 6: The analysis of the data was completed in this final phase of the study [39] (p. 179).

4. Case Study

4.1. A Brief Overview of Copenhagen Airport

Copenhagen Airport is in Kastrup, around 11 km southwest of downtown Copenhagen. The airport is the hub for Scandinavian Airlines (often referred as SAS) and is therefore one of the Star Alliance hubs [40]. Star Alliance is a network of 28 international airlines that provide services to a total of 1317 airports in 193 countries [41]. Copenhagen Airport is also the Scandinavian hub for DHL Express, one of the world’s major global express freight companies. Copenhagen Airports A/S (CPH) is the listed company which operates both Copenhagen and Roskilde Airports. There are more than 700 companies located at Copenhagen Airport, with a total work force of around 23,000 employees [42]. Around 80 airlines operate 726 arrival and departures flights per day. Direct flights are operated from Copenhagen Airport to 165 destinations, including 36 long-haul destinations [43].
The airport area, which occupies an area of around 11.8 km2, has four discrete geographical sections: in the north area, are the airport’s three passenger terminals, a railway station, a car park, a police station, and other administrative functions. The Gate Gourmet catering facilities, the SAS Cargo Center, and SAS’s technical area (which includes four large aircraft maintenance hangars) are also located in the north area. Cargo terminals for DHL Express and SAS, the Veterinary and Customs Center, air freight forwarding firms, and the LSG Sky Chefs catering facilities are in the airport’s East Area. The technical bases for My Travel, Sterling, Danish Air Transport, and North Star are based in the airport’s south area precinct. The west area of the airport contains Naviair (air traffic management) as well as Copenhagen Airport’s technical maintenance facilities. Copenhagen Airport’s runway system comprises a main system (direction 22/04) with two parallel runways for aircraft take-offs and landings (3500 and 3300 m long) as well as a 2800-m cross-runway (direction 12/30). The airport has a total of 108 stands: 9 domestic stands, 43 international stands with passenger loading bridges, 54 remote stands, and 2 helicopter stands [40].
Figure 1 shows the total annual passenger traffic (domestic and international) and aircraft operations at Copenhagen Airport from 2006 to 2016. In 2009, the total annual passenger volumes declined by around 8.4%. However, during 2009, the airport recovered the traffic lost following the Sterling Airlines bankruptcy in 2008. This growth came from services operated by Norwegian Air Shuttle, Transavia, easyJet, and Cimber Sterling (Figure 1) [44]. In 2014, Copenhagen Airport handled 25,627,093 passengers (Figure 1), which was the first time in the airport’s 90-year history that the total annual enplaned passengers surpassed 25 million passengers travelling through the airport [45]. More than 29 million passengers passed through Copenhagen Airport in 2016. This represented a 9.1% increase on 2015 passenger volumes (Figure 1). The growth recorded in 2016 was driven by an additional 2.3 international travellers using the airport [46].

4.2. Copenhagen Airport Enironmental and Energy Policy and Regulatory Framework

The location of Copenhagen Airport was prescribed in the Copenhagen Airport Expansion Act adopted by the Danish Parliament in 1980. The Copenhagen Airport Expansion Act was subsequently amended in 1992. This revision was passed due to the fixed connection across Øresund as well as the airport’s status as a public limited company. The revised act maintained the overall guidelines. In accordance with the Act, any expansion at the airport must consider the environment, such as initiatives to reduce noise or energy. Other important elements of Danish legislation are the Planning Act and the Environmental Protection Act [50].
The environmental impact of Copenhagen Airport is regulated by several authorities through several environmental approvals that have been provided under the Danish Environmental Protection Act. The Danish Environmental Protection Agency (DEPA), which is part of the Ministry of Environment and Food, is the agency responsible for national environmental legislation. The second authority is the local Municipality of Tårnby. The municipality is responsible for local planning issues, including granting land use permits, and for taking into consideration other related environmental impacts, that are subject to environmental regulation. The municipality is also the primary contact point for the public on all matters relating to the environment [51], except for noise from air traffic and air quality.
Copenhagen Airport is a full member of the Nordic Initiative for Sustainable Aviation (NISA). The airport also has an Environmental Management System (EMS). The EMS is aligned with world best practice [52]. In 2014, Copenhagen Airport received Airport Carbon Accreditation (ACA) through the peak international airport body Airports Council International (ACI). Being accredited is part of the airport’s corporate social responsibility (CSR) strategy, responsible growth, the objective of which is to control the airport’s climate impact [51]. Copenhagen Airport was the first airport in the ACA program’s history to directly enter at level 3 out of 4. The airport was also the first Danish airport to be awarded this climate certification [52].
In 2014, the airport adopted and implemented an updated environmental and climate policy which entered effect on 1 January 2015 [52]. The updated policy included guidelines for airport’s work with the environment, climate, and energy. The basic environment management and the environmental principles from the United Nations (UN) Global Compact were more clearly integrated into the policy [52] (p. 40).

5. Energy Consumption and Gas Emissions

5.1. Copenhagen Airport Energy Sources and Consumption

Energy consumption at Copenhagen Airport comes from lighting in buildings, at aprons, aircraft stands, taxiways and runways, and from the heating of buildings. Heating is primarily based on district heating and natural gas. Copenhagen Airport purchases energy on behalf of the entire airport and distributes it to other the firms within the airport area. The airport’s energy consumption is calculated as the volume purchased minus the volume of energy distributed to other firms/users. Each category of energy consumption, including both power and district heating, is calculated based on the airport’s records which are checked against invoices received [43].
Copenhagen Airports A/S (CPH) is responsible for the distribution of electricity, water, and heat to the lessees at the airport. The company also owns, operates, and maintains all the supply networks for this purpose. The careful documentation of energy consumption and the continual assessment of energy consumption trends has contributed to the optimal exploitation of the energy resources by both Copenhagen Airports A/S and the lessees to whom the airport supplies energy.
Figure 2 presents the total annual direct energy consumption at Copenhagen Airport for the period 2006 to 2016. The sources of direct energy are gasoline, diesel, heating oil, and natural gas. Natural gas is used for local production of central heating and power for Copenhagen Airport’s power grid. The generation of power using natural gas was discontinued at the airport in mid-2012 [49]. As can be observed from Figure 2, throughout this period the total annual direct energy consumption peaked in 2010 and has since declined from 2011 to 2013. Factoring in the growth in passenger numbers for the airport, there is a significant reduction in the energy consumption per passenger since 2010.
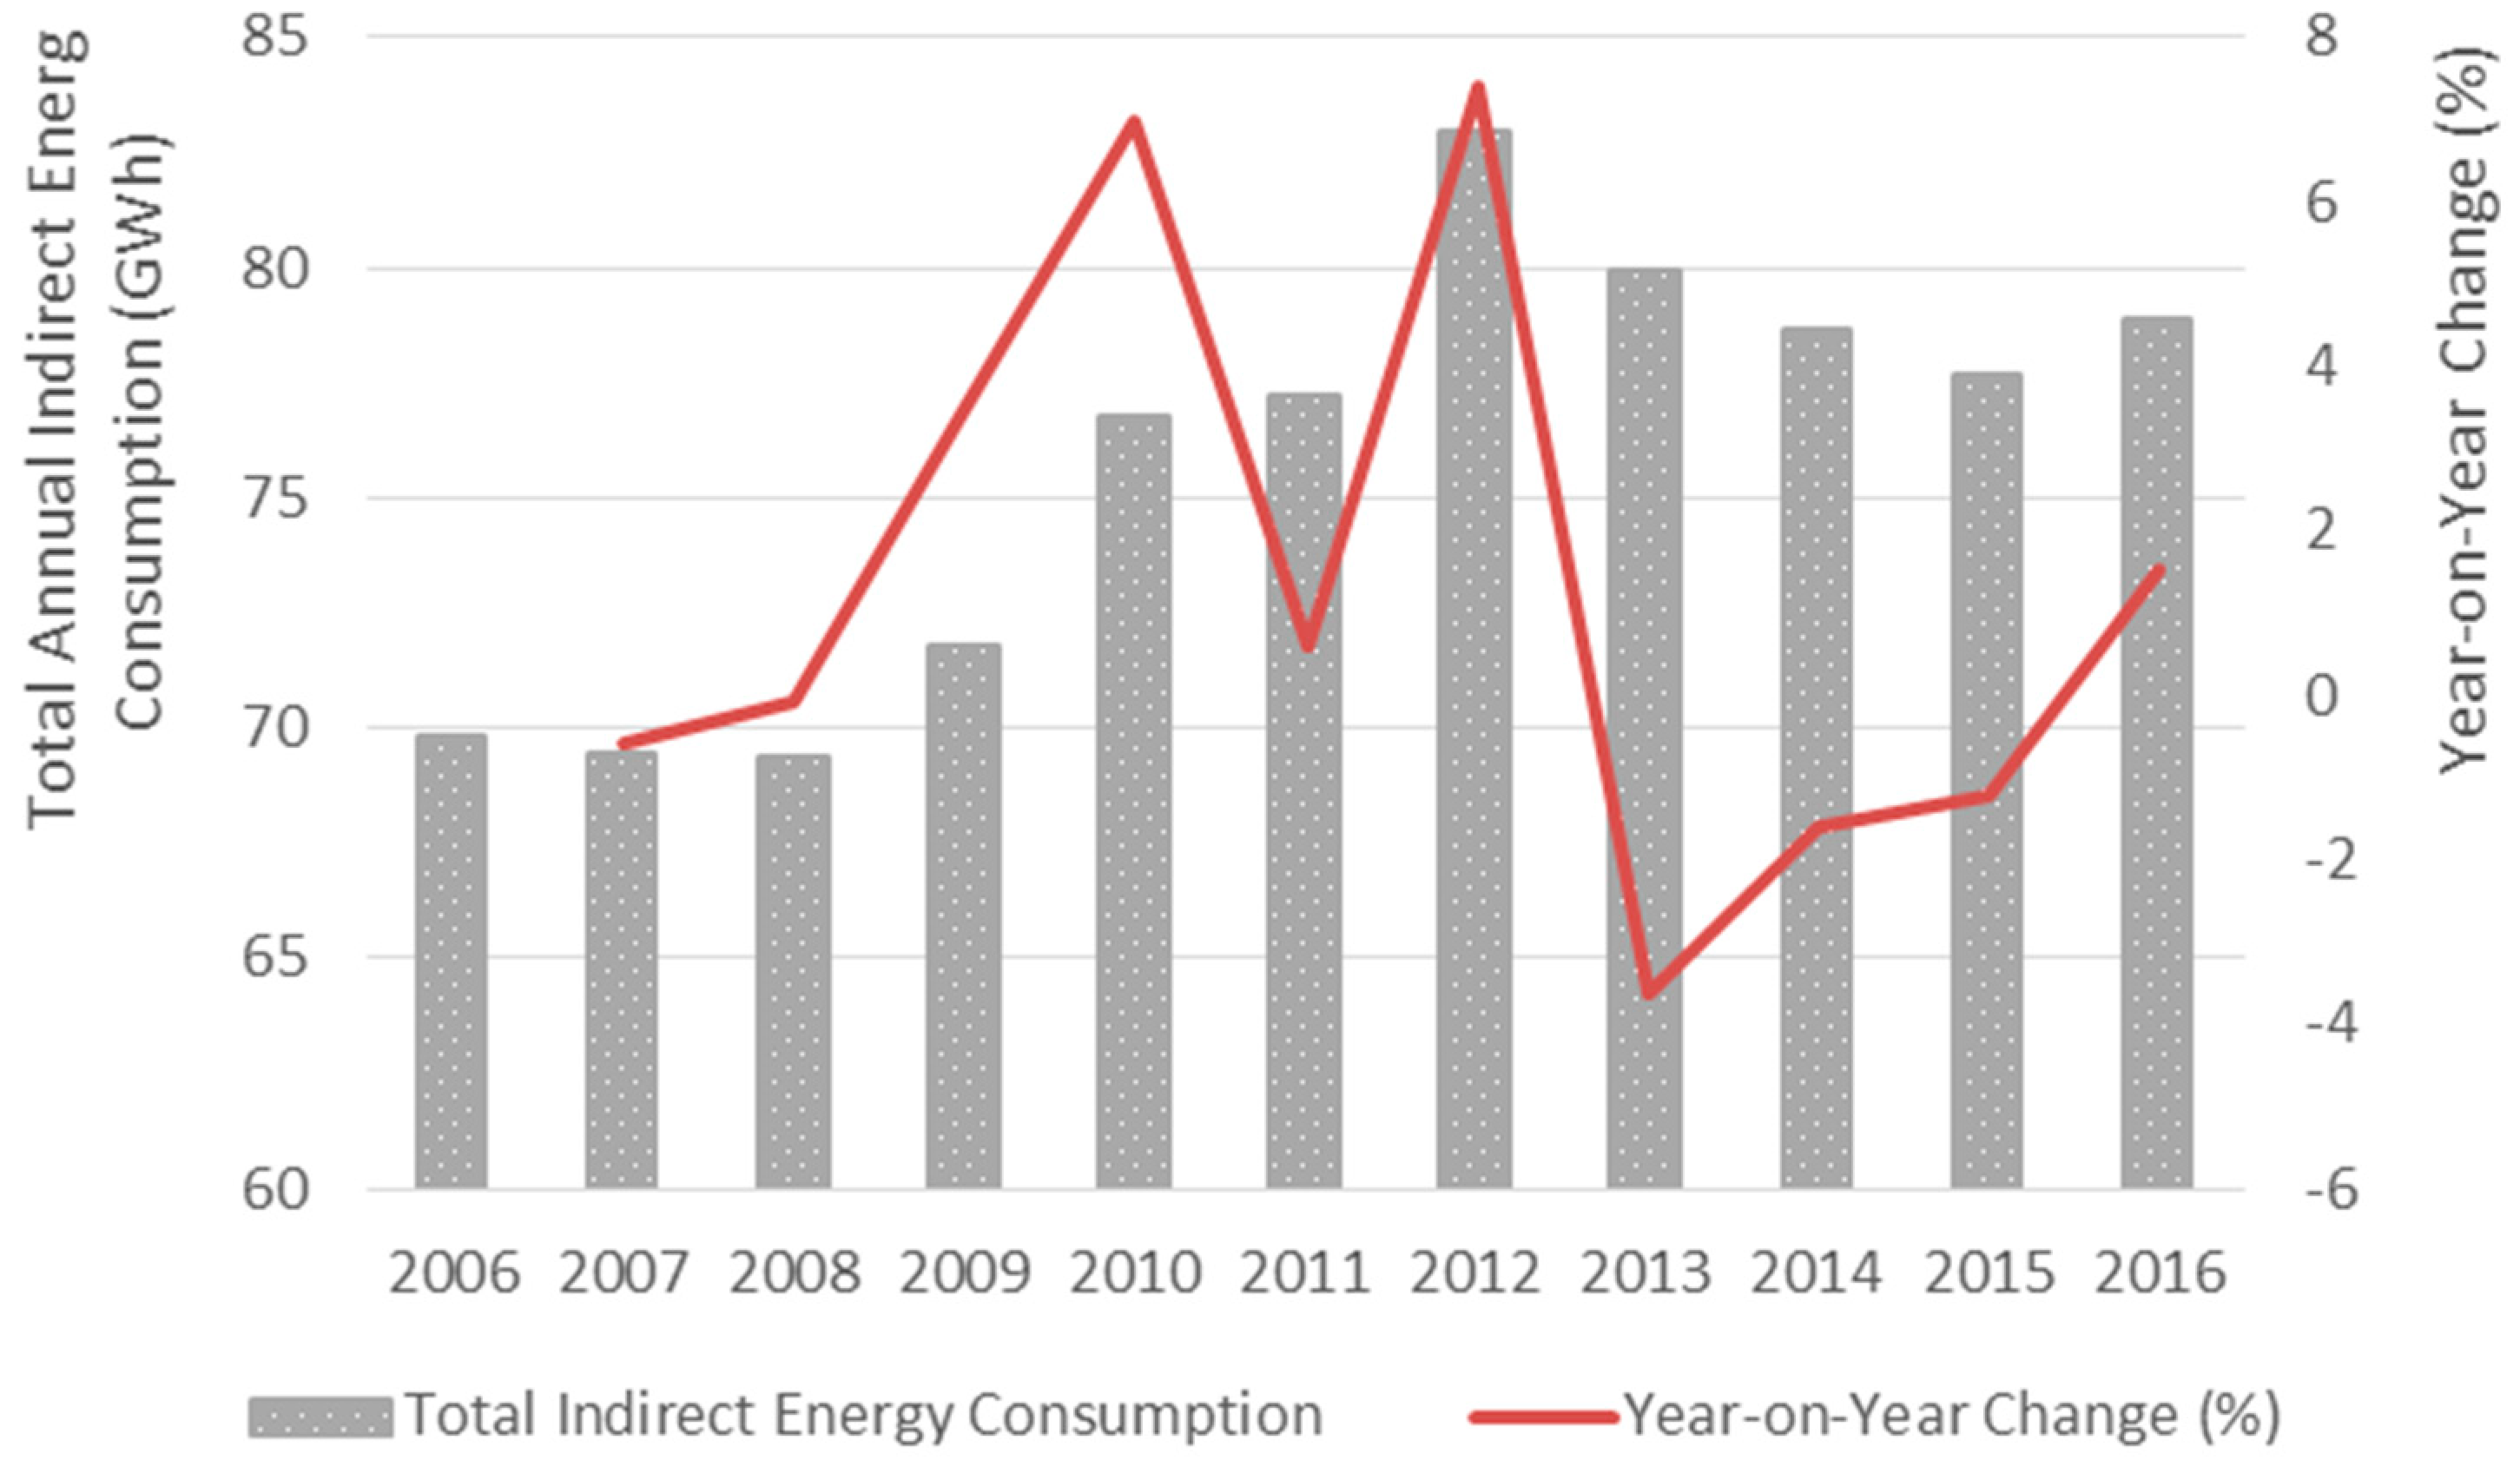
Copenhagen Airport also purchases indirect energy—this comprises purchased power and purchased direct heating. Figure 3 shows the total annual indirect energy consumption at Copenhagen Airport for the period 2006 to 2016. It is important to note that the combined direct and indirect energy needs to be considered here. The indirect electricity has remained fairly constant since 2011 in contrast to the reduction seen in Figure 2, but the overall total energy consumption has decreased. Once again, when the increasing number of passengers is also factored in, there is a significant reduction in indirect energy per enplaned passenger.
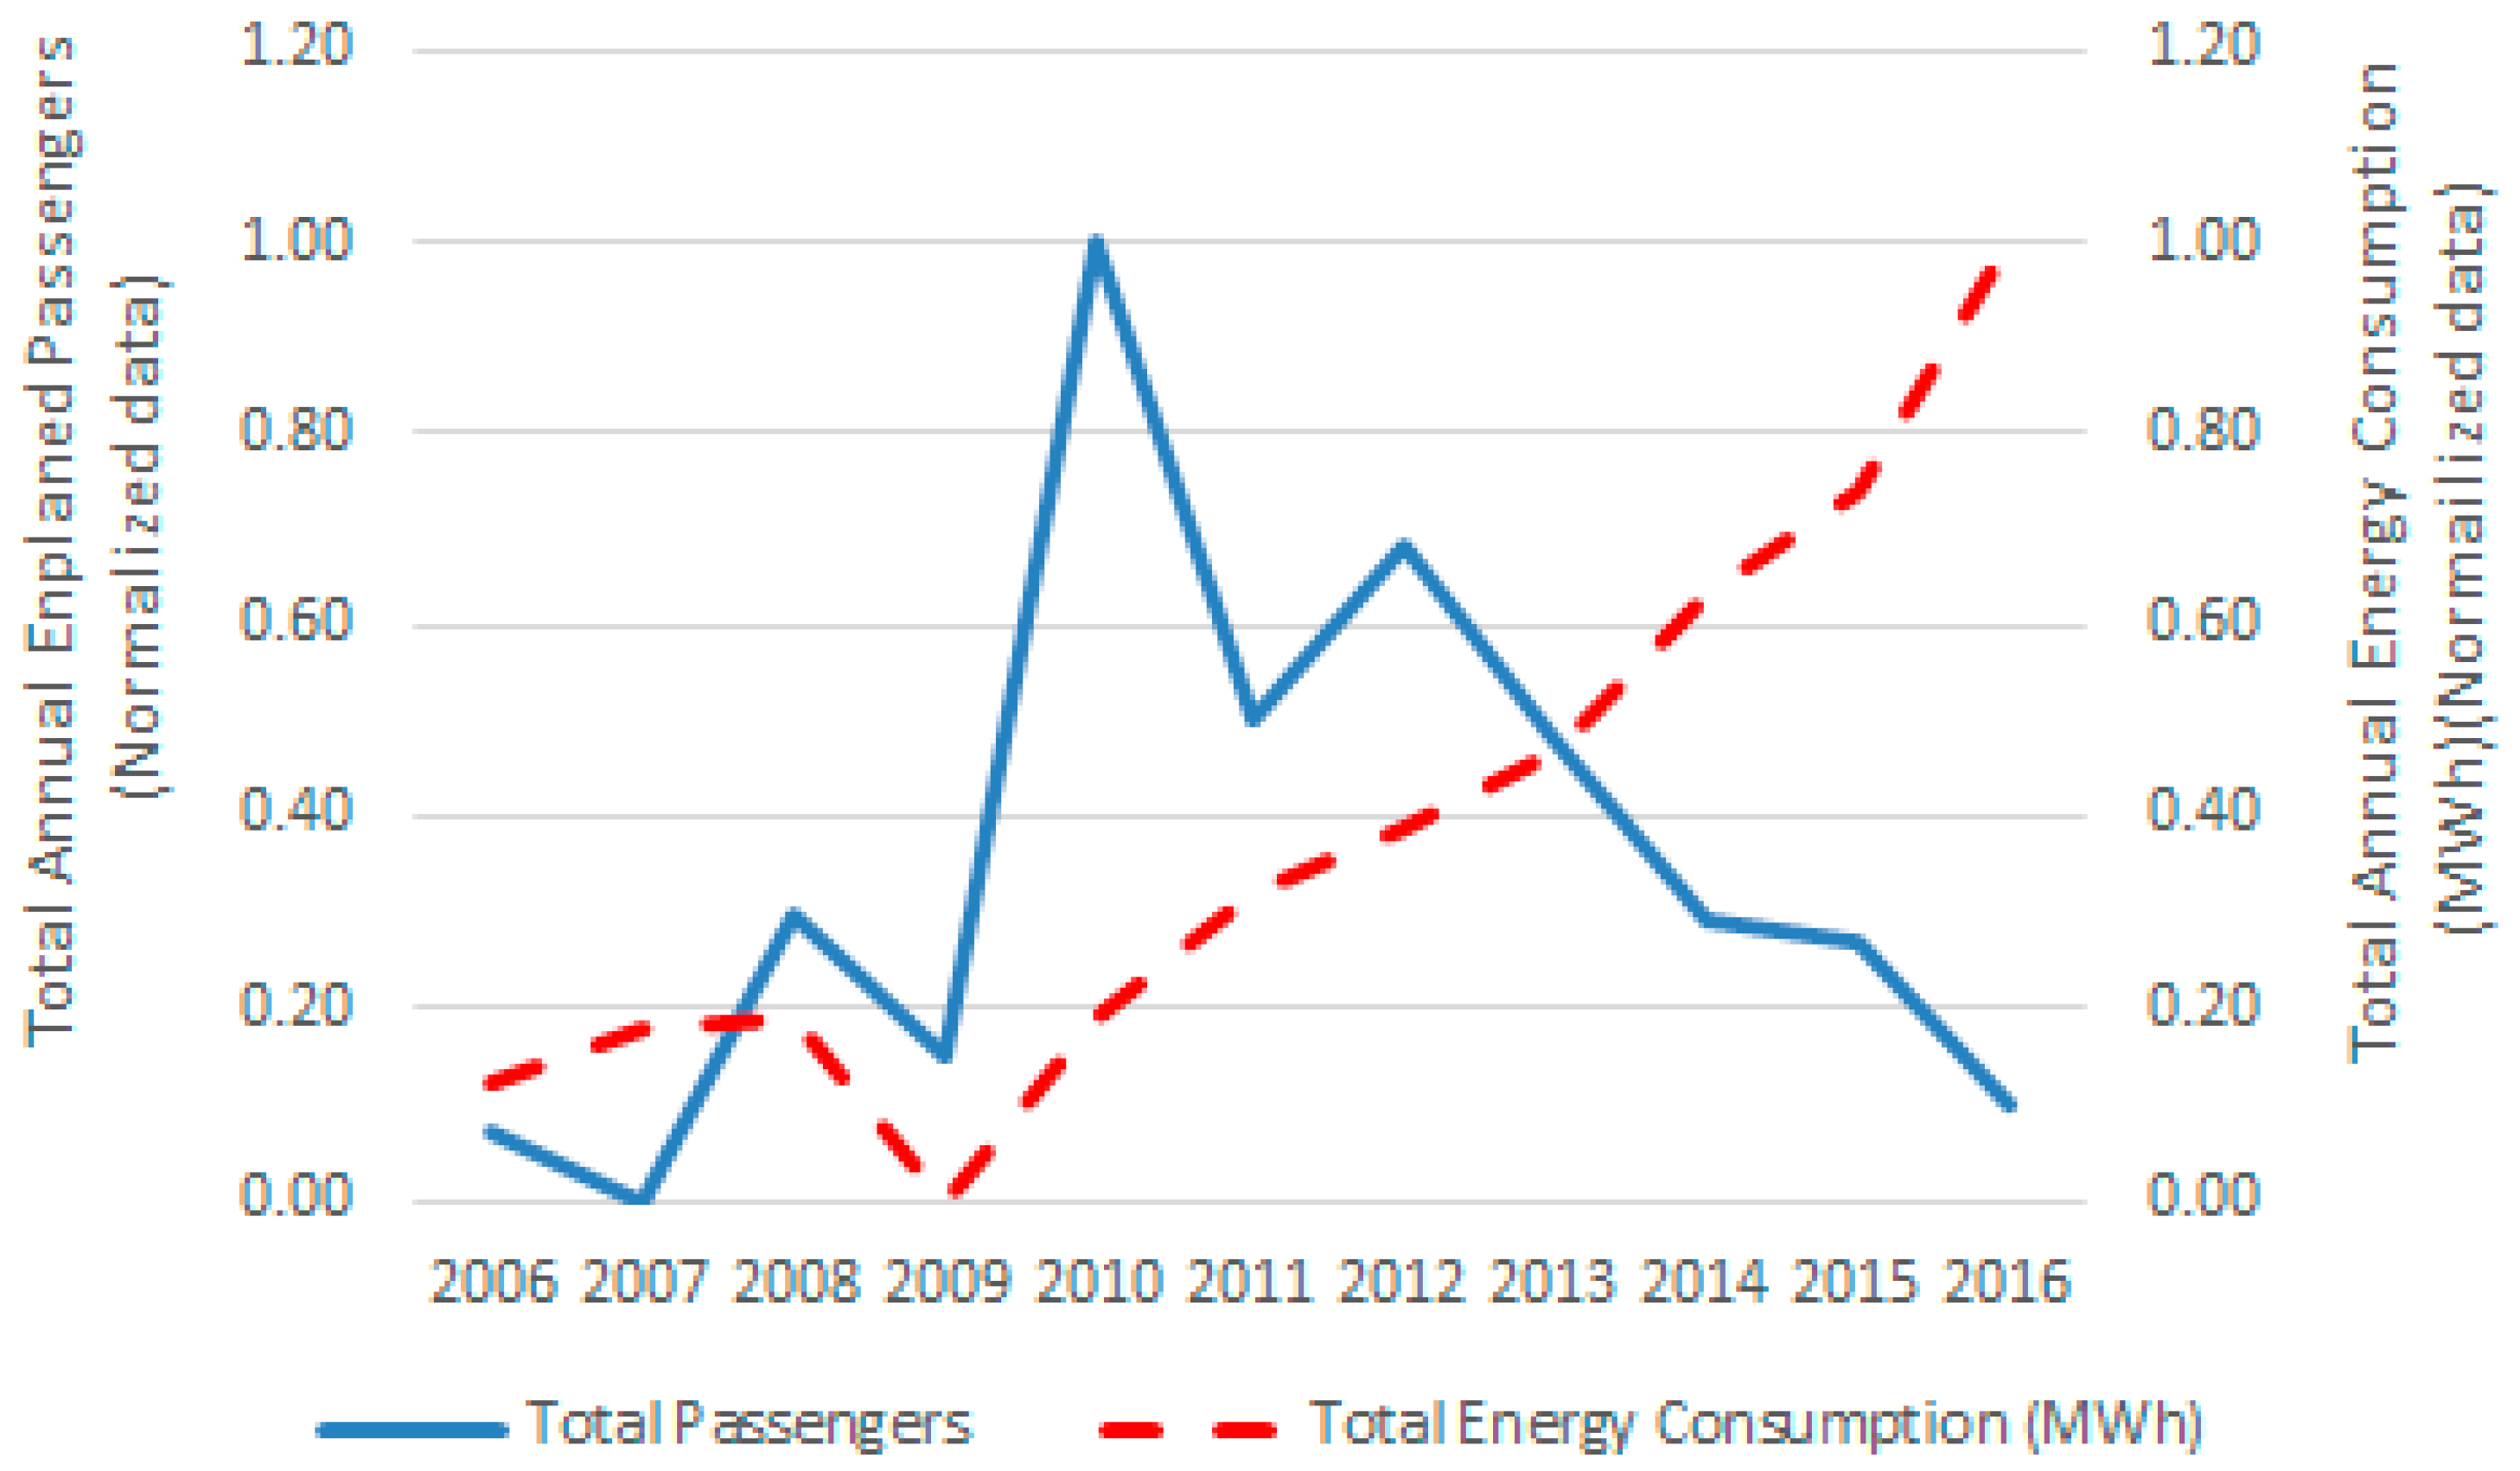
Figure 4 presents the total annual energy consumption and total passengers at Copenhagen Airport for the period 2006 to 2016. This comparison, as suggested in the literature [26], enables a direct visualization of the qualitative analysis above. That is, a clear increase in passenger numbers can be seen, while over the total time frame (2006 to 2016) the energy consumption at Copenhagen Airport increased in 2008 and 2009/2010, before declining in 2011 and once again rose slightly in 2012. However, over the last six years the airport’s annual energy consumption has displayed a downward trend. If an airport was maintaining its energy consumption per passenger, we would expect to see both curves grow. As such, crossing curves with passengers’ growth indicates an improvement in energy efficiency at the airport.
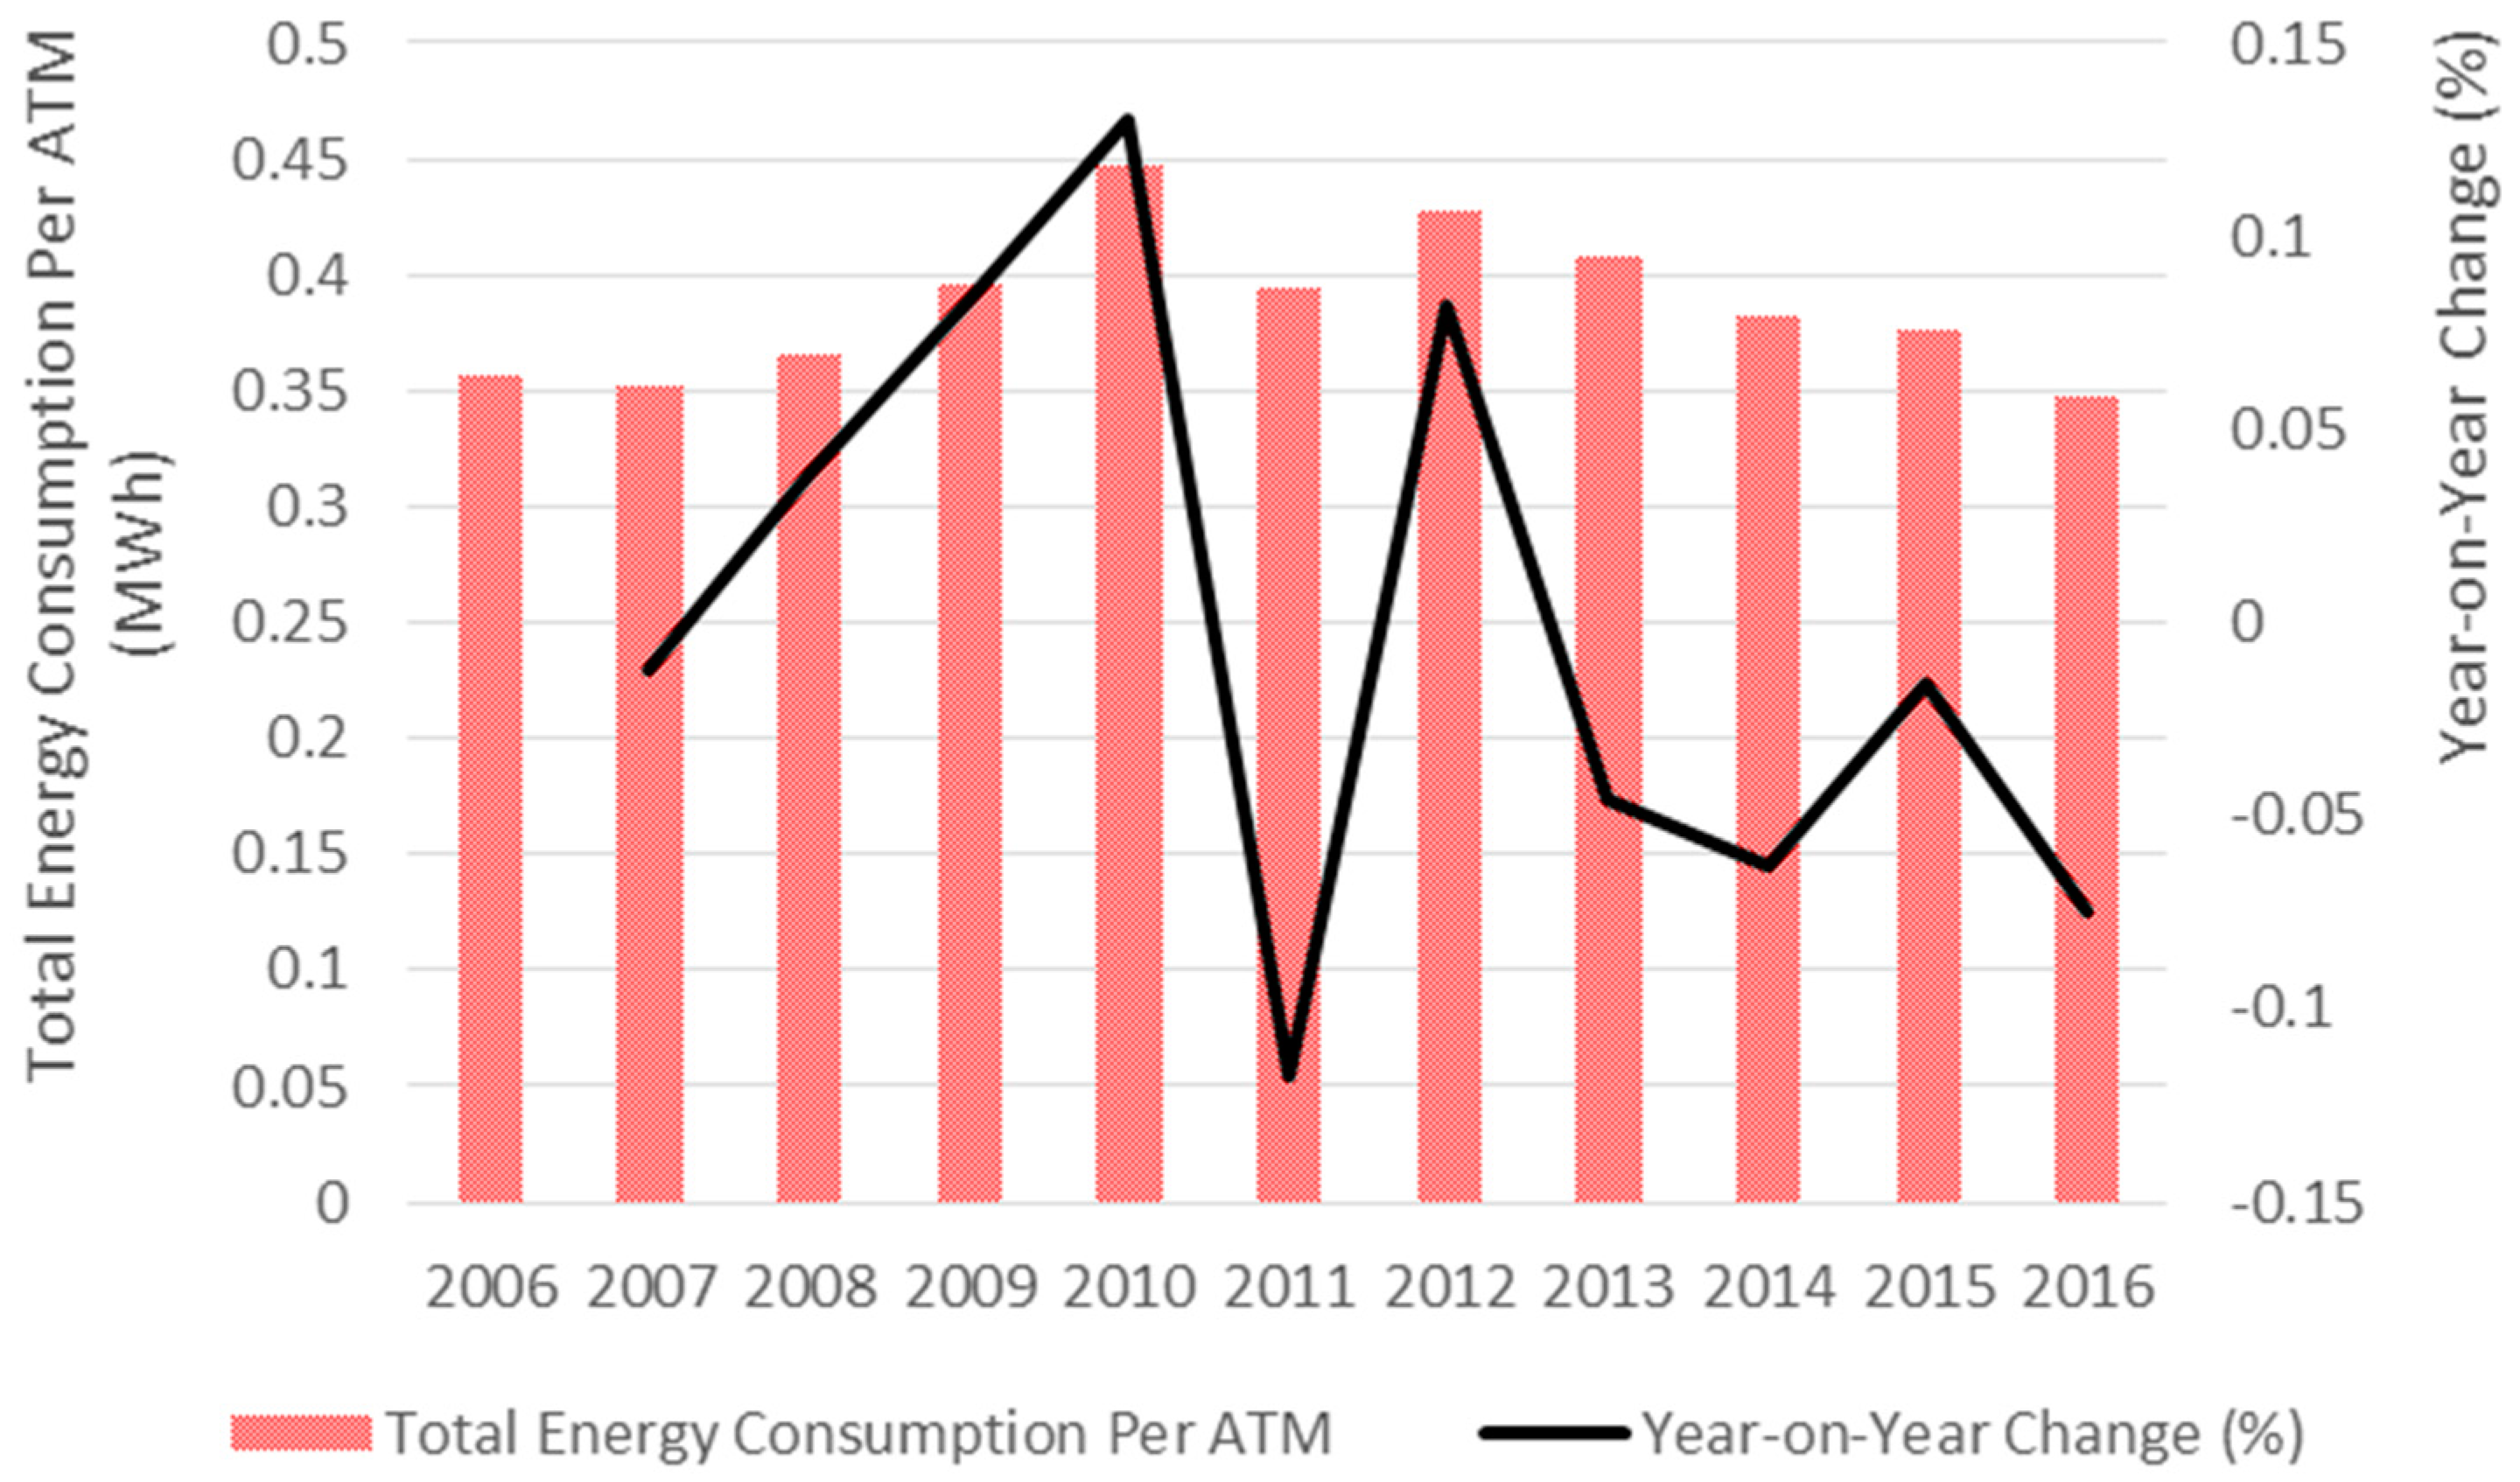
Figure 5 presents the total annual energy consumption per aircraft movement (ATM) at Copenhagen Airport for the period 2006 to 2016. An examination of the energy consumption per aircraft movement at the airport shows that although there is an underlying downward trend with a high degree of scatter, so statistically speaking, the value is constant from 2006 to 2016. In recent times, the major airlines providing services from Copenhagen Airport have updated their fleets with larger, more fuel-efficient aircraft. For example, Scandinavian Airlines (SAS) has replaced its fleet of Boeing B767 aircraft with Airbus A330 and A340 aircraft. On 9 April 2015, Emirates Airline upgraded its daily Dubai to Copenhagen from a Boeing B777 to the Airbus A380, the world’s largest passenger aircraft [54]. In addition to the operation of larger aircraft types, there has also has been significant expansion in the number of new air routes from Copenhagen Airport in recent times. For example, in 2016, Scandinavian Airlines (SAS) opened new routes from Copenhagen to Boston and Copenhagen to Miami. Also, in 2016, Norwegian Air Shuttle commenced new services from Copenhagen Airport to Boston, Las Vegas, and Oakland. Other new services in 2016 include the easyJet service from Copenhagen to Lyon, Sofia, and Skopje (Wizz Air); Porto (Ryanair); and Groningen (Nordica) [43]. Thus, the type and size of aircraft utilizing the airport have in many cases increased to enable airlines to satisfy passenger demand. Also, the aircraft manufacturers are developing more fuel-efficient aircraft [23]. Figure 5 shows that since 2012, the annual energy per aircraft have generally declined. Over the same period, there has been a growth in the annual number of aircraft movements reflecting the airline’s fleet deployment strategies and their ability to meet the increased passenger demand.
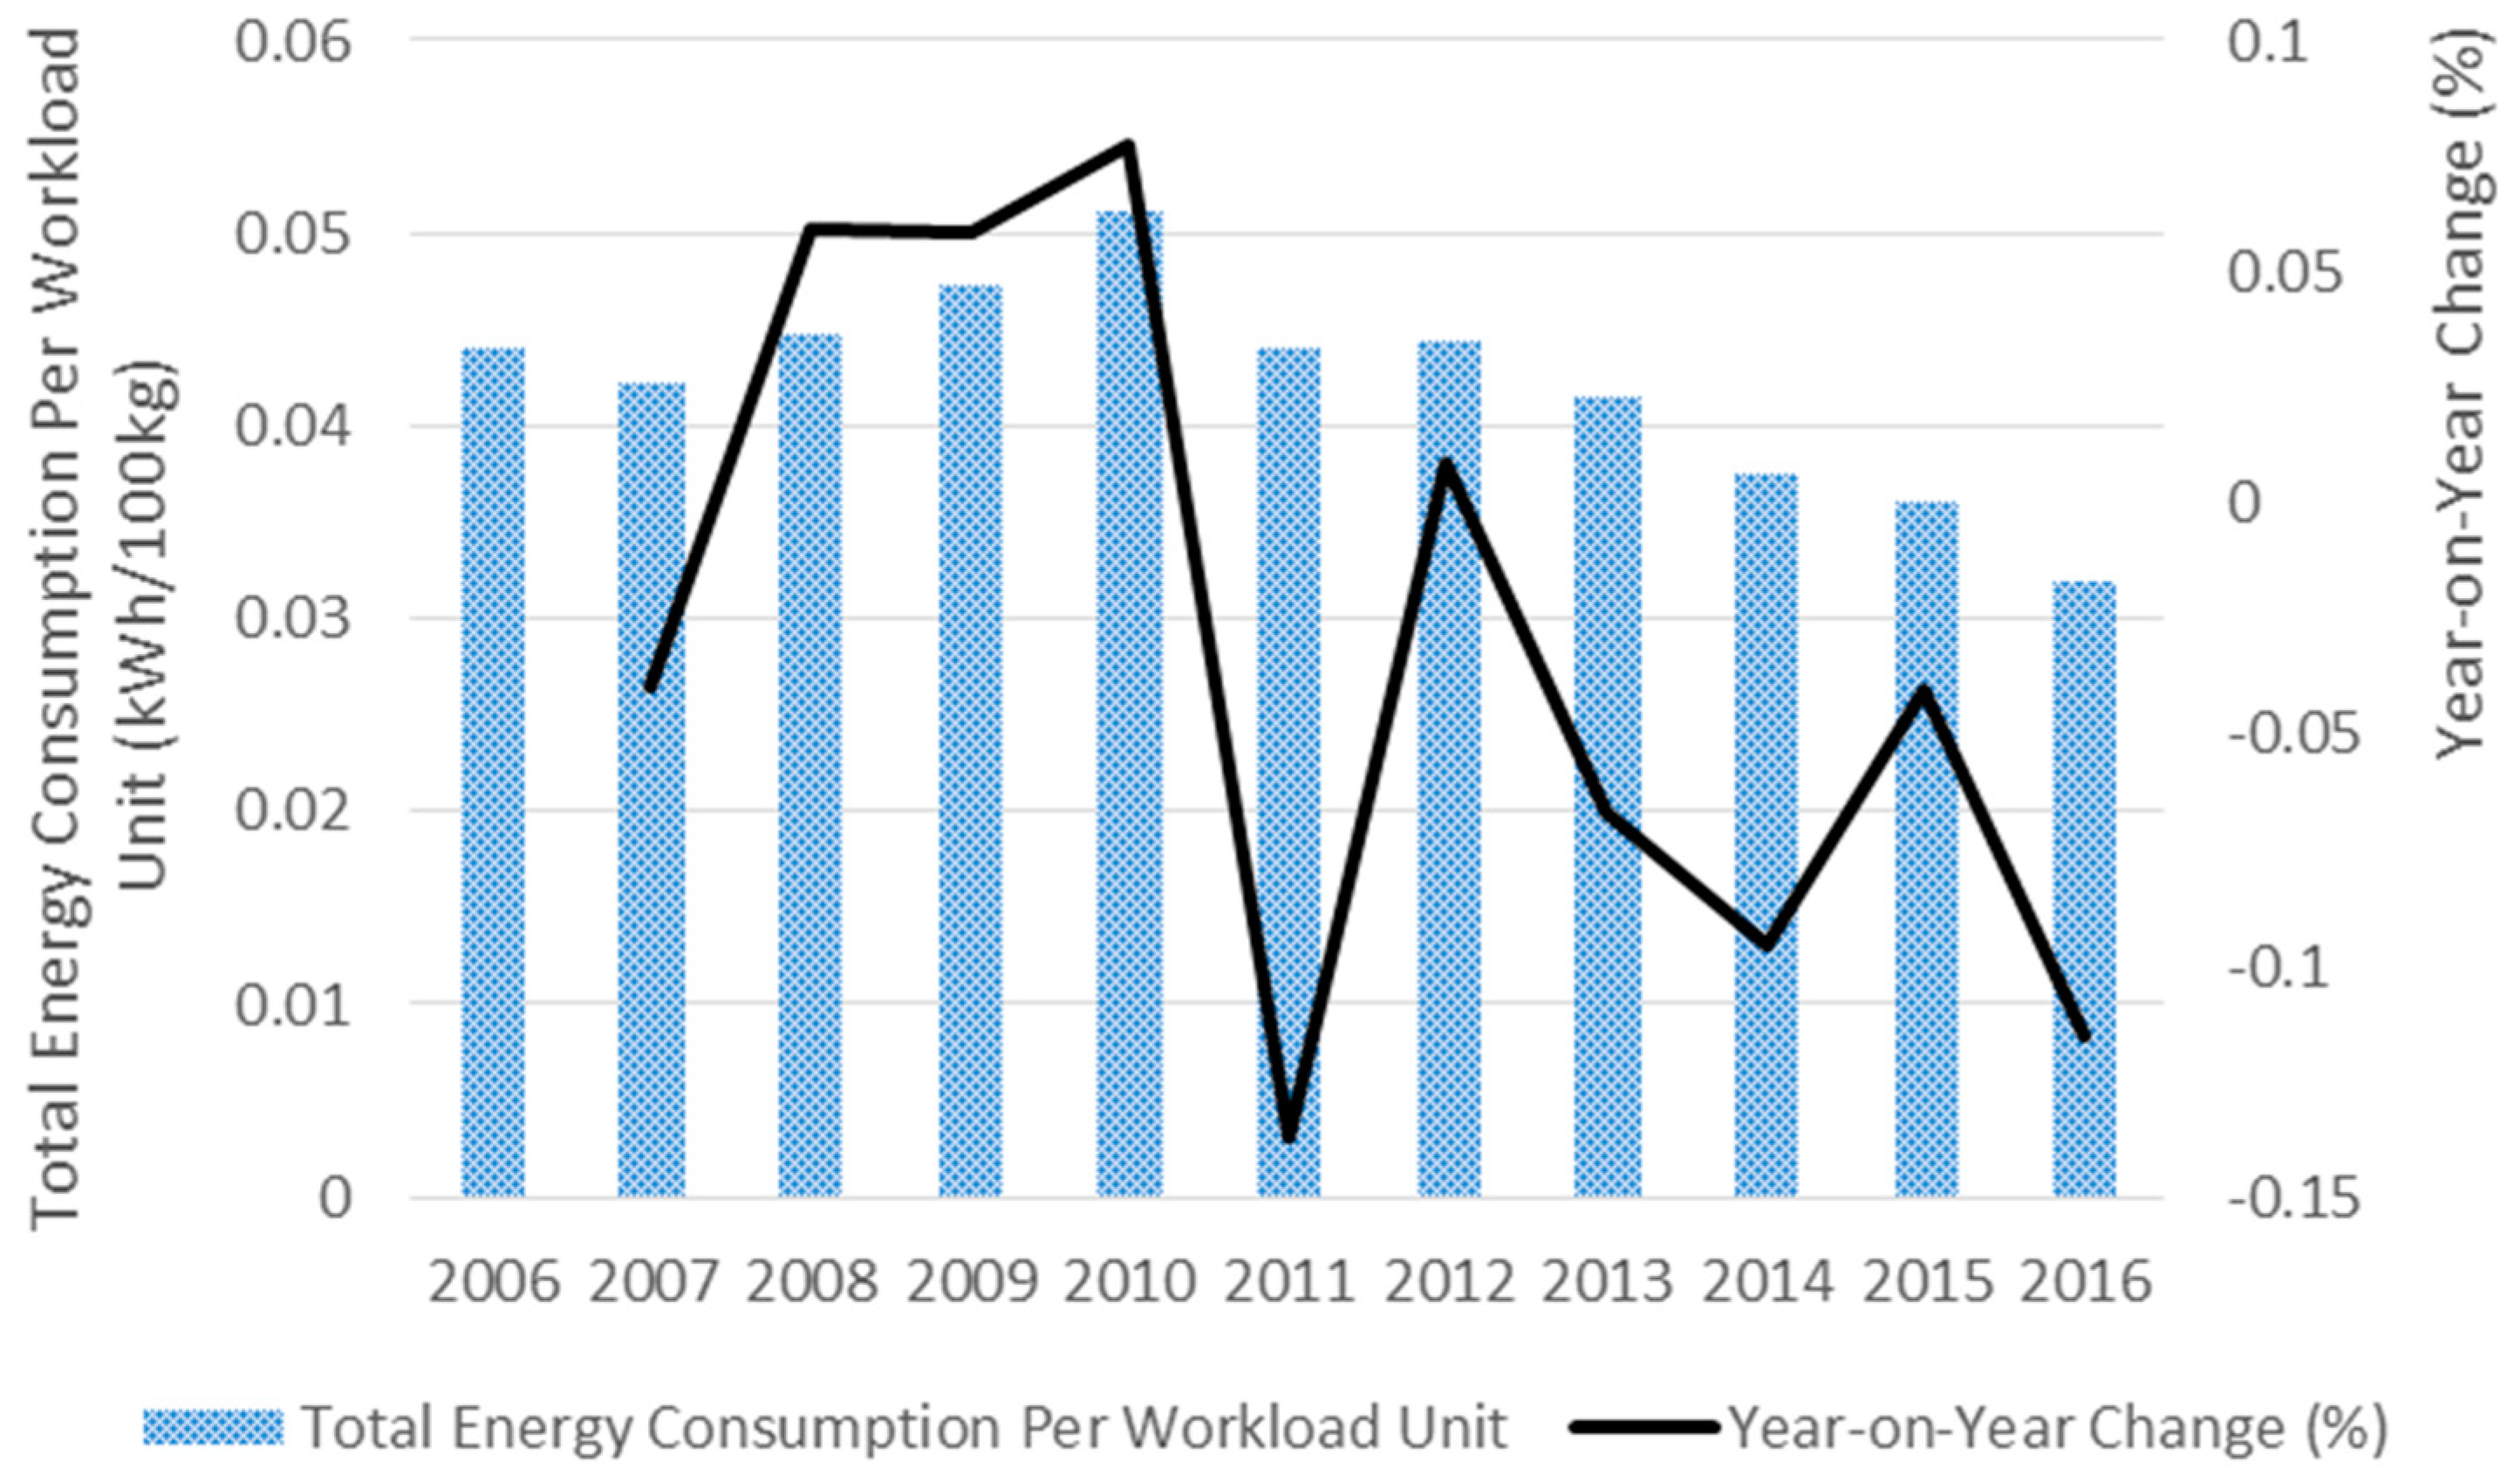
Figure 6 presents the total annual energy consumption per passenger unit of traffic WLU at Copenhagen Airport for the period 2006 to 2016. As noted earlier, one work load unit (WLU) is equal to one terminal passenger and their baggage or 100 kg of air cargo [7,25]. As can be observed in Figure 6, the total annual energy per passenger traffic workload unit (WLU) increased over the period 2007 to 2011. Most importantly, the total energy per passenger traffic work load unit (WLU) has declined from 2011 to 2016, this is despite a substantial increase in the number of passengers using the airport over this period.

5.2. CO2 Emissions Arising from Energy Consumption at Copenhagen Airport

As previously noted, in June 2014, Copenhagen Airport was awarded an airport carbon accreditation at the ‘optimization’ level by the Airports Council International (ACI). ‘Optimization’ is the highest level achievable without the purchase of CO2 quotas or the like. There is also a requirement for an airport to calculate its CO2 emissions and have specified carbon reduction targets. In accordance with this accreditation, airports are required to engage with third parties, such as airlines and various service providers, including independent ground handling firms, air traffic control, or others operating within the airport precinct, to reduce the wider carbon footprint. This accreditation also requires the involvement of the relevant authorities as well as passengers in matters relating to the airport’s surface access modes (road, rail, metro) [53].
It is important to note that despite air quality regulations varying between countries, airport operators are increasingly recording and publishing their Scope 1, 2, or 3 emissions [54]. Scope 1 emissions come from sources that are owned and directly controlled by the airport. The Scope 1 emissions at an airport are produced by fuel-powered vehicles owned and operated by the airport, together with stationery sources, for example, heating systems or generators that burn fuel to service the airport. Scope 2 indirect emissions are those generated from the purchase of electricity to power airport facilities. Scope 3 emissions are a consequence of the activities that are performed at an airport. The emissions come from sources that are owned and operated by another party [55,56].
Table 3 presents a summary of the Scope 1 direct CO2 emissions produced by the various fuel sources used by Copenhagen Airport for the period 2012 to 2016. An examination of petrol consumption at the airport shows that the overall trend is constant with an average of (24 ± 3) tonnes of CO2 emitted. Given that the volume of traffic has increased over the same period, it can be concluded that there has been a reduction in CO2 from petrol per passenger. A similar trend is evident for the CO2 emissions from the diesel consumption at Copenhagen Airport, which is significantly greater, with an average of (1870 ± 60) tonnes of CO2 per year. The CO2 from natural gas reduced significantly between 2013 and 2014, which is likely due to energy requirements within the airport, with initiatives such as the aquifer thermal energy storage system (ATES) contributing to the provision of energy for heating and cooling.
At Copenhagen Airport, the volume of CO2 emissions (Scopes 1 and 2) are calculated based on the consumption of power, natural gas, district heating, and fuel for ground vehicles and diesel generators, as well as for the emission factors for the individual sources of CO2 at the airport. The emission factors are provided to the airport by VEKS (Vestegnens Kraftvarme Selskab) for district heating and by Energinet.dk for the airport’s power. The other sources of CO2 emissions factors are provided by the Danish Energy Authority. The determination of other relevant indirect CO2 emissions (Scope 3) at Copenhagen Airport is based on measurements, traffic counts, questionnaire surveys, key figures, and assumptions (principally used for the smallest sources) [43] (pp. 129–130).
The Scope 2 indirect CO2 emissions at Copenhagen Airport from 2012 to 2016 are presented in Table 4. Carbon dioxide (CO2) emissions from direct power consumption is by far the most significant source. While there has been a reduction from 2012 to 2013, the overall number is fairly constant, with an average value of (24,000 ± 1000) tonnes of CO2. Again, if the growth in passenger traffic is factored in over the same period, there would be a significant decrease in the emissions per passenger. The same is true for the CO2 emissions from district heating, with an average of (2700 ± 300) tonnes of CO2 per annum, decreasing over time with increasing passenger numbers.
Table 5 presents a summary of the Scope CO2 emissions per unit of output [25]. Output is measured by a common unit—work load unit (WLU)—which is equivalent to one passenger plus his/her baggage or 100 kg of air cargo [9,16]. As can be observed in Table 5 both power and district heating per passenger traffic WLU have decreased over the period 2012 to 2016, this is despite the increased number of passengers using Copenhagen Airport over this period.
Table 6 presents a summary of the Scope 3 indirect (and optional) CO2 emissions at Copenhagen Airport from 2012 to 2016. The total indirect CO2 emissions per annum, as expected, are also constant, dominated by the CO2 from electricity (power) for the airport.
Copenhagen Airport maintained its Airports Council International accreditation in 2015 and 2016 [43].

6. Copenhagen Airport Sustainable Energy Initiatives

Prior to examining the sustainable energy management initiatives implemented by Copenhagen Airport in recent years, it is important to note that there are a variety of practices and methods that can be used by airports to enhance energy efficiency. These represent some of the most encouraging proactive environmental stewardship practices as they can provide cost saving opportunities, due to the increasingly high and fluctuating energy costs. Energy efficiency practices also provide other important benefits, which include enhanced air quality and reduced greenhouse (GHG) emissions. Examples of energy efficiency practices include installing escalator sleep-mode settings, monitoring energy use, or upgrading indoor lighting in airport facilities to more efficient lighting. The aim of energy efficiency practices is to optimize airport building systems by replacing less efficient building components and ensuring mechanical systems are in optimal working condition. In addition, energy efficiency practices can also address airfield energy uses, for instance, runway and taxiway lighting [57] (p. 107).
In recent years, Copenhagen Airport has introduced a wide range of initiatives aimed at reducing the airport’s environmental impact. These initiatives are discussed in the following subsections.

6.1. Aircraft Efficiency Stands

During the time that an aircraft is on the ground, whether it be in transit or a full turnaround, a range of passenger and aircraft ground handling activities, such as passenger deplaning and boarding, as well as the unloading and loading of baggage of passengers’ baggage and air cargo on the aircraft, need to be undertaken [58,59]. These activities are normally performed by some mix of the airport authority, the airlines, and firms specializing in aircraft and passenger ground handling, depending upon size of the airport and the operational philosophy adopted by the airport authority [19,60]. Speed, efficiency, and accuracy are regarded as the three critical characteristics of a proficient aircraft turnaround [61]. The airport apron comprises individual aircraft stands that interface with the passenger terminal and are the location where aircraft are handled in between flights [9,62]. To enable airlines to achieve their objective to operate as efficiently as possible, whilst also optimizing asset utilization, Copenhagen Airports A/S, has established “efficiency stands”. The “efficiency stands” are a common user product whereby airlines and their appointed ground handling agents can benefit from specific airport supplied equipment that promotes and facilitates the optimization of aircraft turnaround times [63].
In 2013, Copenhagen Airport established a further six efficiency stands that are located on Piers A and B. These “efficiency stands” facilitate the faster boarding and de-boarding of passengers and accordingly reduce aircraft turnaround times. Historically, the stairs used to be operated with diesel engines, but the stairs at the airport’s efficiency stands are electrical. The use of electrical power has resulted in an improvement in the local air quality, which benefits all staff working in the apron area, as well as lower CO2 emissions. The stairs also require less ground handling staff to operate them. This means that the airport’s “efficiency stands” benefit airlines, ground handling agents and the airport, while also providing clear environmental and working environment advantages. The airport envisaged establishing an additional four efficiency stands in 2014 [49].

6.2. Airport Ventilation Systems

An additional area of the airport’s operations and infrastructure that has provided an opportunity to reduce power consumption is in the use of the ventilation systems. The airport has a system that provides an optimal indoor climate throughout each day but is turned off during times when ventilation is not needed.
In 2013, the many ventilation systems at Copenhagen Airport began to assume a role in the airport’s power-saving efforts. Several power-saving measures were implemented in conjunction with the renovation of Terminal 2. These measures included the replacement of the ventilation systems in basements and ceilings as well as halving the use of basic ventilation as such (this was achieved through boosters). The new ventilation changes have resulted in the airport achieving savings in both heating and power consumption which account for around 60% of the airport’s total energy savings [49].
Copenhagen Airport focused on changing much of the airport’s old ventilation equipment located in Terminal 2 and in Pier C during 2014. The old equipment, which did not have a heat recovery ability, was replaced with a new ventilation system which provided a highly efficient heat recovery capability. This new HVAC system provides large heating savings for the airport, whilst also providing an improved indoor climate. In 2015, the airport also expanded the landside area of Terminal 2. As part of the project, the HVAC systems and controls were replaced. This energy-saving initiative resulted in annual savings of more than two million kWh [64].

6.3. Energy Initiatives Targeted at Copenhagen Airport’s Tenants

The airport’s refurbished Tax Free main store opened in 2013. The lighting for the store was planned in collaboration with Copenhagen Airports A/S, and the new lighting resulted in the store achieving a reduction of 50% in direct power consumption. The airport’s duty and tax-free store received financial support for the initiative through the airport’s energy-saving agreement with the utility company, Taarnby Forsyning (Kastrup, Denmark). Other shared value projects in 2013 also included significant savings on the cooling system and an improvement of the tax free main store’s indoor climate. There were also other concessionaires conducting business at the airport—WH Smith, Eton, Sun Shop, Plaza, Accessorize, and Fine Food who also received assistance during 2013 with the aim of identifying energy-friendly lighting and cooling solutions to improve their indoor climate and reduce their power consumption [49].

6.4. Installation of Solar Panel Systems

Renewable energy has become an increasingly cost-effective business option for airports because of technological advancement, market maturity, and public-sector investment. Airports have some favorable characteristics that enhance the financial viability of on-site renewable energy, particularly for solar photovoltaics (PV). Airport land and buildings can provide suitable sites for solar facilities that otherwise do not generate financial benefit. The open landscape and geographic position of airports necessary for safe airport management also facilitates the capture of natural resources that fuel renewable energy. In addition, renewable energy can directly supply an airport’s on-site energy consumption needs, defraying costs in the future as off-site energy purchasing is curtailed [65]. An airport’s carbon footprint (CO2 emissions) can also be reduced through the substitution of solar PV based power generation [66,67].
Copenhagen Airport was the first Danish airport to complete the safety approval process for the use of solar cells for energy generation in conjunction with the Danish Transport Authority. Based on software that was developed by the United States Federal Aviation Administration (FAA), Copenhagen Airport has developed a method for ensuring that reflection from solar panels does not represent a flight safety hazard. The airport commenced a pilot project in 2013 to install a solar panel area of around 750 m2 to explore the potential of installing solar panels at Copenhagen Airport whilst also investigating the related requirements of the airport power infrastructure. The airport’s solar power system is located on the roof of Teknikergården at Copenhagen Airport’s restricted area located in the town of Maglebylille and has the capacity to generate 125 kWp. The anticipated output of the system is 105,000 kWh per year [68]—this is equivalent to 0.2% of Copenhagen Airport current power consumption of 52 million kWh (52,000 MWh) [49].
Because Copenhagen Airport acts as a distributor of power to the concessionaires (shops and tenants) at the airport, the renewable energy generated from the solar panels will not only be used by the airport, but also by the airport shops and tenants. Based on the present split of consumption the airport and its tenants, it has been estimated that around 0.1% of the tenants’ power consumption will come from the solar panels [49].

6.5. Light-Emitting Diodes (LEDs)

Lighting is a major component of Copenhagen Airport’s power consumption. Copenhagen Airport has focused on achieving energy consumption by better controlling, optimizing, and reducing power consumption in the airport’s terminals. The airport has optimized its automatic terminal lighting controls in the terminals to ensure that lights are not left on at night in areas where it is not necessary. Accordingly, lighting controls have been installed in most terminal areas so that light was automatically switched off during periods where there is plenty of daylight. This practice has resulted in an annual power consumption savings of between 20 and 25% for the installations involved in the terminal areas. Furthermore, the replacement intervals of the light sources are also longer. In certain parts of the airport, light dimmers were also installed which gradually reduced the level of electric light based on the level of daylight. Consequently, this system enhancement saves even more power than the pure on/off functions [69].
Light-emitting diodes (LEDs) are a practical option for the air transport industry due to the requirement for colored light as well as low light output requirements. LEDs are “very small electrical device[s] that generate light through the semi-conducting properties of its metal alloys” [70] (p. 134), using an electroluminescent process which is much more energy efficient than legacy incandescent technologies. Accordingly, airports are increasingly transitioning to the use of LED systems [71]. Copenhagen Airport is one such airport that has introduced LED lighting. In 2009, LED (light emitting diodes) lights were installed in toilets, by elevators, as well as the flight operations area. In addition, a number of the airport’s systems with daylight control were adjusted. Because of the energy saving measures, Copenhagen Airport was able to reduce its power consumption for lighting purposes by a total of 400 MWh annually [72].
In 2011, Copenhagen Airport continued its program of installing several types of LEDs. The major lighting systems in Terminal 3 were retrofitted with LED lighting. This initiative resulted in a 50% less power consumption. In addition, during 2011, many airport guide signs, in the yellow/blue Copenhagen Airports A/S colors, were converted into LED light sources. Also, advertising signs that are used to promote various products/companies operating at the airport were converted into LED light sources. This also resulted in a reduction of 50% in power consumption [47].
In 2012, the airport continued its program of installing LED Lighting with several types of LED (light-emitting diode) lighting being installed throughout the airport precinct. Since its remodeling, Pier C has had LED lighting installed, as did the airport’s three renovated multi-storey car parks. In addition, LED edge and center lights were installed on runway 04L/22R [48]. Importantly, LED light sources have significantly lower maintenance costs due to their lower power requirements and long life [73]. Copenhagen Airport estimates that the LED lighting installed at the airport will have a minimum of 50 thousand hours rather than the previous 10–15 thousand hours of operation, depending on the type. Copenhagen Airport was one of the first airports in Europe to use LEDs airside. This lighting initiative has halved power consumption and maintenance costs [49].
In 2013, the airport completed the installation of LED technology in several of the airport’s multi-storey carparks. The project has resulted in uniform lighting and has provided savings in both maintenance costs and power consumption. The airport also installed motion-detector-controlled lighting in several carparks to provide a safer and more secure environment for users [49]. Copenhagen Airport implemented a number of LED-lighting-based projects in 2014, with the biggest projects being undertaken in the baggage handling facility and in the airport’s multi-story car parks. The lighting controls in these areas were optimized to ensure maximum efficiency as well as energy savings [52].
Copenhagen Airport installed LED lighting in the baggage reclaim area and parts of Pier D, as well as in the departure hall in Terminal 2 during 2015. This initiative resulted in energy savings and the provision of markedly better light. Another energy-saving initiative project undertaken in 2015 involved the replacement of more than 1000 fluorescent lamps, located in the car park P7, with LED lamps. Upon the conclusion of this project, all indoor parking at the airport was fitted with low energy lighting. During 2015, Copenhagen Airport renovated and expanded runway 22L/04R at which time they replaced 405 runway lights with LED lights. These energy-saving resulted in an annual saving of savings of 1073.5 MWh [64].
One of Copenhagen Airport’s major projects in 2016 involved implementing LED lighting on the second floor of Pier D. The installation of the new LED lighting enabled the airport to achieve significant cost and energy savings, as LED lights last around five times longer than conventional lighting systems [43].
The airport has also moved from the use of incandescent lighting to LEDs for obstruction lighting, which are the red lights warning air traffic about tall buildings and masts at the airport. The traditional incandescent light sources for obstruction lights are 80 Watt. In contrast, the new LEDs used by the airport are only 9.6-watt. This has translated into annual savings of 92 MWh, which is equal to 52 tonnes of CO2. There is a further benefit to the airport of using LED obstruction lighting as this type of lighting has a useful life of between 50,000 and 100,000 hours, compared with a useful life of the traditional incandescent light fittings of around 2000 h [74].

6.6. Monitoring of Energy Consumption

Copenhagen Airport considers potential energy saving measures and resources in the planning of any new buildings. Any new building is based on the airport’s Manual on Environmentally Sound Design, which sets strict targets for the environmental impact of new buildings. The standards cover the construction phase and when the building commences operation. In addition to the airport’s efforts to conserve energy in new buildings, the airport has installed electricity, heat and water meters in all airport buildings. These monitors are all connected to a central monitoring system, which continuously monitors each meter. If certain buildings are found to have above normal consumption, then the airport may impose energy saving measures [75].

6.7. Sensor Controls on Travelators and Escalators

The International Air Transport Association (IATA) recommends that the maximum walking distances for passengers at airports should be from 300 to 330 m unaided and up to 650 m with moving walkways [76]. Thus, like many other airports around the world, Copenhagen Airport has installed travelators to facilitate passenger movements through the passenger terminal buildings. Travelators (also referred to as passenger conveyors) are like escalators and they provide a mechanical means for transporting passengers vertically. These systems have flat floors rather than steps, and they are arranged at a shallower pitch and are longer than escalators [77] (p. 360). The travelators and escalators within Copenhagen Airport’s terminal buildings were fitted with sensor controls in 2009. These sensors stop the movement of the travelators and escalators during periods where there is no traffic using them. In the far distant ends of the airport terminals this energy-saving initiative has resulted in significant power savings, totaling 150,000 kWh annually [72].

6.8. Use of Groundwater for Cooling at Copenhagen Airport

In 2009, Copenhagen Airport commenced the planning of the future cooling technology at the airport. The airport adopted the Aquifer Thermal Energy Storage (ATES) (groundwater cooling) system (Figure 7) as the future cooling concept. The project involved the planned expansion over a three to four-year period. The system will provide a reduction in the airport’s power consumption for cooling [72]. The ATES system represented an important future investment for the airport as the new cooling system combines high-efficiency cooling. In addition, the new system will enable the airport to complete its objective of phasing out greenhouse gases used for comfort cooling when the system is fully installed and operational. Following the approval to build the ATES system in 2010, the airport commenced the installation of the new groundwater cooling system in 2010. Once completed, it will be the largest of its kind in northern Europe. The principal function of the ATES system is to provide comfort cooling at the airport, with heating as a secondary function. The fully developed system will have five dipoles, each consisting of two wells: one a so-called “warm well” and the other a “cold well” [78] (p. 1). For groundwater cooling/heating system, a dipole denotes a drilling pair, consisting of an extraction drilling and a return cable drilling [53] (p. 67).
The first phase of this project involved the installation of the cooling system at the airport’s low-cost carrier (LCC) CPH Go pier. The first of five possible dipoles were installed, together with a cooling distribution pipeline that cuts across the airport from areas at the eastern end and which runs underneath the airport’s runways and aircraft stands to the terminal area, where the cooling effect is required [78]. Despite being still under development in 2011, the groundwater cooling system provided its first cooling calories to CPH Go pier, Pier D, and the baggage handling area. The system produces cooling with a coefficient of performance (COP) of 60 [78] (p. 2). This means that for each kWh consumed, the system delivers 60 kWh units of cooling. In contrast, the airport’s other conventional cooling installations operate at a COP of approximately 3. This comparison shows that the new cooling technology is 20 to 30 times more efficient than conventional technology [48]. A further benefit is that the system does not make use of conventional coolants, which are very costly and have an adverse impact on the climate. In addition, a large-scale program was established in 2011 to monitor drinking water wells along the periphery of the ATES plant. The aim of this program was to ensure that plant operations do not have any undesirable impact on the airport’s drinking water supplies. The production wells are located outside groundwater extraction areas and only draw saline groundwater [47] (p. 44).
Copenhagen Airport saw the real power-saving effects of the ground water cooling system in 2012. In 2012, the airport expanded the system and had 4 out of 10 cooling wells in operation. The airport also shut down five decentralized cooling units, all of which used Freon gas, a costly cooling agent, which is also a greenhouse gas that has an adverse impact on the environment. At the end of 2012, the airport supplied cooling using a single connected system to CPH Go, Pier D, and the baggage handling areas, as well as the airport’s recently extended Pier C [49].
In 2013, the airport’s ATES groundwater cooling system was expanded further in synergy with the large-scale improvements being undertaken in in Terminal 2. Eight out of ten cooling wells were in operation, and the power-saving effect of the system reduced the airport’s annual power consumption for comfort cooling by 2.2 GWh. This was equivalent to approximately 4% of the airport’s total power consumption in 2013 [49].
The penultimate stage of the ATES systems was completed in 2014 at which time the entire Pier B and C and parts of Terminal 2 were being cooled by the system. The completion of this phase of the ATES project resulted in a 30% increase in the system’s cooling capacity [52].
By 2015, eight wells had been established (four dipoles) and these were being used by the airport to supply heating and cooling to the CPH Go terminal, Pier D and the baggage area, along with the airport’s newly renovated and expanded Pier C. Each of the wells are around 110 m deep to reach the saline groundwater aquifer. At a depth of 110 m, the groundwater flow through the porous limestone layer is optimal for storing and recovering heat. In addition, circulation at that depth especially also prevents any impact on fresh groundwater. The saline groundwater circulates in a closed loop underground, thereby acting as a closed-system heat exchanger providing heat and cooling in a closed-loop system to the previously mentioned terminal buildings. During summer periods, when the terminal buildings require cooling, the dipoles circulate the water, carrying cold water from the cold well into the terminal buildings. Once in the terminals, the cold-water acts as a heat exchanger as absorbs the heat of the warmer terminal air and subsequently lowers the terminal buildings temperature. Once the water has become warm, it is then injected into the warm well. As the warm water flows towards the cold well, it is then cooled by the lower ambient temperature in the aquifer. During the winter period, when the terminal buildings require heating, the system is reversed. This circulation and heat exchange therefore makes it possible for the airport to store and recover a large amount of heat in the underground limestone layer. Copenhagen Airport’s ATES system is anticipated to cost around Danish Krone (DKK) 60 million. The system will provide an estimated DKK 7 million in annual energy savings for the airport [78] (p. 2).
During 2015, the airport completed the final phase of the production side of the groundwater cooling system (ATES). Upon completion of the production phase in 2015, the ATES system could supply approximately 4 million kWh of cooling annually. This was 20% higher than 2014 levels [64].
In 2016, the first stage of a major heat pump project associated with the groundwater cooling system (ATES) was completed at the airport. As a result, the cold water used for cooling in the summer is now able to be used to generate district heating for the remainder of the year by leading it through a heat pump. The first stage of the project has enabled Copenhagen Airport to achieve an annual energy saving of 2978.3 MWh. This annual energy saving measure achieved in 2016 meant that the airport was already close to achieving the 2020 energy savings target. It is envisaged that the second and final stage will be executed at the start of 2017 and was anticipated to generate almost double the energy savings of Stage 1 [43].
The investment in the heat pump project, which as mentioned runs from 2016 to 2017, is part of a closer collaboration with the airport’s energy supplier, Tårnby Forsyning. In addition to the heat pump project, the airport is also working with Tårnby Forsyning to construct a joint district heating facility. This facility will also help to improve utilization of the district heating system, thereby benefiting the airport, Tårnby Forsyning, local residents, and the climate [43].

6.9. Use of Groundwater for Cooling Main Server Room at Copenhagen Airport

In 2016, Copenhagen Airport increased its use of second-quality water. Whilst the airport already uses this for washing vehicles, for flushing toilets in Terminal 2, and for cooling in selected stores, in 2016 the entire system for second-quality water was mapped to identify further potential benefits. Accordingly, this mapping led to the optimization of the ventilation in one of the airport’s primary server rooms. The room is now exclusively cooled using second-quality water. This measure enabled the airport to avoid the high costs of conventional cooling for the server room. Overall, this initiative provides an annual saving of 145 MWh [43].

6.10. Voltage Regulation Optimization

A further energy-saving initiative adopted by Copenhagen Airport was the introduction of an operating program to change the voltage at the individual transformer stations. To achieve this aim, during planned service visits, the voltage levels were lowered from approximately 235 V to 220 V. This change in voltage was well within the standards for the supply of power. The reduction in voltage of the transformer stations not only reduced power consumption but also the ‘wear and tear’ on all installations powered by these transformers. Moreover, the airport also identified that by far most of these installations were designed for a voltage level of 220 V. In 2010, this initiative resulted in energy savings equivalent to 3586 MWh thereby benefiting both the airport’s customers as well as the airport company itself [53]. It is, however, worth noting that if most of the installations are not optimized for the reduced voltage, there can be more complex results than simply reducing power consumption. As such this action should be well considered before it is implemented.
In 2010, the airport also invested in a new data system that was designed to provide customers with direct web access to their power consumption data as a supplement to the information provided in their quarterly energy bills [53]. The system subsequently commenced operations in January 2013.
During 2011, 30 of Copenhagen Airport’s 50 transformer stations were checked with the aim to optimize the voltage level in the area. As previously noted, the transformers used at the airport are of a type that enables adjustment of the voltage level on the output side. Thus, it was possible for the airport to maintain a voltage of approximately 220 V as opposed to the previous voltage being closer to 235 V in large areas of the airport. This resulted in unnecessary power consumption as well as a strain on equipment [47].
This energy sustainability measure continued at Copenhagen Airport in 2012. Like 2011, 30 out of 50 transformer stations were reviewed, and the voltage reduced from approximately 235 volts to 220 volts. This means that older lighting systems, that were based on sources such as metal halogen or fluorescent tubes of conventional design, will emit slightly less light, but at the same time use much less energy and have a longer life. The voltage is regulated centrally by the 50 transformer stations at Copenhagen Airport. Consequently, all users at the airport benefit from this energy-saving initiative [47].

6.11. Copenhagen Airport Annual Energy Savings

Some important one-off significant energy saving initiatives implemented by Copenhagen Airport include the solar power system (providing 105 MWh of electricity, and hence an equivalent annual energy saving), the extensive installation of LED lighting (resulting in a reduction of 1565.5 MWh), and the installation of sensor controls on travelators and escalators (saving 150 MWh of electricity). Clearly, these initiatives are permanent, and hence, these energy savings are in effect applicable annually (as approximate values). Other initiatives that have not been quantified, but still implemented at Copenhagen Airport include aircraft efficiency stands, airport tenant energy saving initiatives, energy consumption monitoring, and voltage regulation optimization.
Furthermore, Copenhagen Airport assesses the annual impact of its energy efficiency initiatives. The annual energy savings are calculated in kWh and then divided between electricity and heat savings (natural gas and district heating). The airport’s energy savings are calculated/certified by an external company that operates under the Danish Energy Association’s code of conduct [43] (p. 131).
Table 7 shows that since 2009 to 2016, Copenhagen Airport has achieved considerable energy savings with the most energy savings being achieved in 2016. During the period 2009 to 2012, Copenhagen Airport intensified its efforts to reduce its indirect power consumption through various means. Over this period, 3877 MWh (38.5% of energy saved over the period) was saved from more efficient voltage control, and 1470.1 MWh (14.6% of energy saved over the period) was saved from cooling [49].
The major energy saving measure implemented in 2012 at Copenhagen Airport was voltage control which resulted in a saving of 3827 MWh (45.2% of energy savings). The second most significant energy saving measure in 2012 came from cooling (1470 MWh) (17.3% of energy savings). General lighting (774.4 MWh) (9.1% of energy savings), guide signs (502.4 MWh) (5.9% of energy savings), outdoor signs (477.2 MWh) (5.6% of energy savings), advertising signs (246.1 MWh) (2.9% of energy savings), and runway lighting (141.4 MWh) (1.6% of energy savings) were other important energy savings measures that were implemented in 2012 [48].
In 2013, Copenhagen Airport achieved energy savings equivalent to 3607.5 MWh. The largest savings came from the airport’s ventilation system (2089 MWh) (57.9% of energy savings) and the cooling system which included the ATES system (742.2 MWh) (20.5% of energy savings). General lighting (284.6 MWh) (7.8% of energy savings), advertising signs (49.1 MWh) (1.3% of energy savings), and guide signs (10 MWh) (0.2% of energy savings) were other areas where the airport was able to achieve energy savings during 2013 [49].
The focus on reducing energy consumption continued in 2014 and because of these measures a total of 3,273 MWh was saved. The more efficient airport ventilation, cooling (including the ATES system) and heating provided savings of 802.2 MWh (24.5% of energy savings), 725 MWh (22.1% of energy savings), and 294.7 MWh (9.0% of energy savings), respectively. The airport was also able to save energy once again from the more energy efficient lighting—general lighting (541.5 MWh) (16.5% of energy savings), outdoor lighting (462 MWh) (14.1% of energy savings), and runway lighting (12.4 MWh) (0.3% of energy savings) during 2014 [52].
The greatest energy savings by Copenhagen Airport over the period 2009 to 2016 were recorded in 2015, when the airport achieved 5275 MWh in annual energy savings. The largest saving came from the airport’s ventilation system (3038 MWh) (57.5% of energy savings) followed by savings of from more energy efficient general lighting (787.4 MWh) (14.9% of energy savings). The more efficient voltage control delivered energy savings equivalent to 449.7 MWh (8.5% of energy savings). Other energy savings came from cooling (including the ATES system) 378.8 MWh (7.1% of energy savings), outdoor lighting (286 MWh) (5.4% of energy savings), and the re-insulation of building components (267.5 MWh) (5.0% of energy savings) [64].
In 2016, Copenhagen Airport achieved annual energy savings equivalent to 4587.8 MWh. The most significant energy saving came from the use of heat pumps which delivered energy savings of 2978.3 MWh (64.9% of energy savings). The second most significant source of energy savings in 2016 came from cooling (including the ATES system) (969.4 MWh) (21.1% of energy savings). Other energy savings came from the ventilation system (144.9 MWh) (3.1 % of energy savings) and general (69.5 MWh) (1.5% of energy savings) and outdoor lighting (56.8 MWh) (1.2% of energy savings) [43].
The rapid growth in the airport’s energy savings over the last three years is very significant, with the overall average annual change at 90%. The overall reduction in associated CO2 emissions means the airport is reducing its environmental impact. This in turn improves the sustainability of the airport, in terms of the economic sustainability (low cost associated with energy), the environmental sustainability (reduced CO2 emissions), and social sustainability (airport users and the public perception).

6.12. Opportunities for Additional Energy Savings at Copenhagen Airport

Airports all around the world are confronting unique challenges related to air and water quality, noise pollution, energy efficiency, as well as safety and security. Moreover, airports are also confronted with the challenge of operating in an economically viable way. In addition, pollution, security, and flight delays are also providing many challenges to airports [79]. The air pollution at an airport is not just produced from aircraft during landing and take-off cycles but is also generated by the ground support equipment (GSE) during the aircraft handling process. Hydrogen and hydrogen technologies offer the potential to mitigate these problems [80]. Most importantly, hydrogen fuel cells could allow airports to almost reduce their ground emissions to zero [81]. However, it is important to note that hydrogen can be produced from either renewable and non-renewable sources of energy [82,83]. Renewable energy sources are environmentally friendly whilst nonrenewable able energy sources have either carbon dioxide (CO2) or some other form of carbon residue in the end-product being other than hydrogen [84] (p. 9). There are firms producing hydrogen from conventional sources—for instance, coal, oil and natural gas, all of which produce greenhouse gas emissions [84]. The production of hydrogen principally involves both thermal and electrical energy as the input energy source. Different renewable and sustainable energy sources such as solar, wind, and thermal power can be utilized as the input energy [84] as such sources are more environmentally friendly and normally have near zero emissions.
Notwithstanding, hydrogen has been adopted as an energy source at a number of airports around the world. For example, Berlin Brandenburg Airport has introduced the “Green Hydrogen Hub” [84], Montréal’s Pierre Elliott Trudeau International Airport has hydrogen fuel cell powered buses and ground services equipment (GSE) [85], and Osaka’s Kansai International Airport is introducing environmentally-friendly clean energy as well as deploying advanced information technologies aimed at increasing energy efficiency, with the airport’s “hydrogen grid” project forming a key part of these strategies [86].
Over the past decade, aviation biofuels have moved from relative obscurity to a point where certain types of fuel have become fully certified for commercial use. These fuels have a 50% blend with standard jet fuel. Furthermore, commercial partnerships between airlines and biofuel producers are growing [87], for example AltAir Fuels and United Airlines [88]. Airports are also focusing on bio-fuels. For example, Avinor, Norway’s state-run airport operator, is focusing its efforts on promoting the mixing of biofuels with jet fuel. At Oslo Airport Gardermoen and Bergen Airport, a special blend of jet fuel blended with biofuels is made available to aircraft. In 2016, Oslo Airport Gardermoen was the first airport in the world to offer biofuels to all airlines [89]. As previously noted, Copenhagen Airports A/S is a member of the Nordic Initiative for Sustainable Aviation. This association aims for the aviation industry to obtain a share of the limited biofuel resources that is available for use by the aviation sector [90].
Electrical power is required on the airport apron for the servicing and ground handling of the aircraft prior to engine start-up in preparation for the aircraft’s next flight. External electrical power is also often used for aircraft engine start-up. The power requirements, however, varies widely for the different aircraft types. During the ground handling operations, power can be supplied to the aircraft from various sources—mobile ground power units or from fixed installations in the airport pavement. The latter is considered the most preferable as it eradicates the requirement for a vehicle and to some degree reduces noise emanating from a motor generator set [91]. Airports and airline operators are increasingly moving towards lower noise, lower emissions, lower fuel consumption, smart power conversion technology, and alternative power such as fixed electrical ground power (FEGP) systems [92]. At Copenhagen Airport, airlines are only permitted to use an aircraft’s auxiliary power unit (APU) 5 min after the aircraft is ‘on blocks’ at the gate or 5 min before the estimated time of the departure (ETD) [93]. Thus, like many other airports around the world, for example, Copenhagen Airport provides FEGP systems to power aircraft during the turnaround period that the aircraft is at the gate. Whilst not quantified, this system saves the airlines the cost of operating their aircraft APU units.
Thus, another important sustainable environment strategy implemented by some has been the use of low emissions, electric-powered cars (‘eco-cars’) at the airport. Electric-powered cars have several important environmental benefits: a reduction in noise and pollution, and they also help to reduce the reliance of transport modes on oil—providing, of course, that the power is produced from fuels other than oil. Importantly, electric-powered vehicles can also be used to reduce carbon emissions. Considerable energy savings can be achieved from replacing traditional internal combustion powered vehicles with electric-powered vehicles [94]. Kansai International Airport Japan, for example, has implemented a policy of using ‘eco-cars’ whenever possible. Thus, the use of electric powered cars can help reduce an airport’s energy costs whilst at the same reducing vehicle emissions.

7. Conclusions

In conclusion, this study has investigated what aspects of airport design and operation in a major airport are critical to the sustainability and optimization of its energy management and how the contribution of energy-related emissions to climate change can be mitigated. To achieve this objective, Copenhagen Airport was selected as the case airport. The research was undertaken using an in-depth exploratory case study. The case study data was analyzed using document analysis. We identified that from an airport design and operations perspective, terminal(s) lighting and cooling/heating, car park lighting, as well as airport runway lighting are key areas where sustainable energy management and systems can be applied and, when sustainably and strategically managed, appear to offer excellent potential for airports to reduce their CO2 emissions due to the more efficient energy usage.
The study also found that energy usage and energy efficiency can be optimized through the application of emergent technologies, which include:
  • Aircraft efficiency stands;
  • Optimization of the energy consumption for the airport’s ventilation systems;
  • Energy saving initiatives targeted at the airport’s tenants and concessionaires;
  • Installation of a solar photovoltaic (PV) system;
  • Widespread deployment of light emitting diode (LED) in both the landside and airside precincts;
  • Careful and continuous monitoring of airport energy consumption;
  • Sensor controls on travelators and escalators in the airport terminal buildings;
  • Use of the state of the art cooling and heating systems, such as the Aquifer Thermal Energy Storage (ATES) (groundwater cooling);
  • Use of groundwater for cooling the airport’s main server room; and
  • Voltage regulation optimization.
During the period 2009 to 2016, the various energy saving initiatives implemented by Copenhagen Airport have produced savings of 26.80 GWh. The most significant savings came from the airport ventilation, cooling (including the ATES system), and more efficient lighting (general, signage, and out-door lighting). Furthermore, despite the significant increase in passenger volumes and aircraft movements recorded at Copenhagen Airport in recent years, the total annual energy per passenger, energy per aircraft movement (ATM) and annual energy per passenger traffic work load unit (WLU) have all exhibited downward trends.
A by-product arising from energy usage at airports is the production of CO2 gases, and the potential flow on effect that these may have on the environment and their local communities. Airport operators are increasingly recording and publishing their Scope 1, 2, or 3 emissions. From 2012 to 2016, Copenhagen Airport’s largest source of Scope 1 CO2 emissions was diesel (1870 ± 60). The Scope 1 CO2 emissions from natural gas have declined from a high of 2441 tonnes in 2012 to 1038 tonnes in 2016. The overall trend in petrol consumption over the period 2012 to 2016 was constant (24 ± 3). The emissions from direct power consumption is by far the greatest source of Scope 2 CO2 emissions (24,000 ± 1000) tonnes of CO2. A similar trend was found for the Scope 2 CO2 emissions from district heating, with an average of (2700 ± 300) tonnes of CO2 per annum over the period 2012 to 2016. The Scope 3 CO2 emissions have been constant from 2012 to 2016 with the principal source of these emissions coming from district heating, electricity, and natural gas.
As previously noted, in recent years, Copenhagen Airport has identified and implemented a wide range of energy-saving measures that have enabled the airport to mitigate its environmental impact. Indeed, the application of technological solutions, systems and process enhancements and collaboration with key stakeholders has contributed to the airport’s success in mitigating the environmental impact from energy usage at the airport. Copenhagen Airport has set a goal of achieving CO2-neutral growth in handling its projected 40 million passengers per year. The airport has defined a corporate sustainability strategy and policy as part of its overall business strategy to ensure that not only does the airport contribute to international accessibility, thereby enhancing growth opportunities and jobs in the region, but also to ensure that growth is accommodated and managed in terms of the environment, society, and the airports financial performance. From an energy-management perspective, the study found that the airport not only satisfies its statutory environmental obligations but also constantly seeks ways and measures to surpass these as part of its commitment to environmentally sustainable airport operations.

Author Contributions

G.B. conceived the paper, writing the first draft paper. All authors contributed equally to the data analysis and editing of the manuscript.

Acknowledgments

The authors would like to express their sincere gratitude to Copenhagen Airports A/S for the permission to the use the airport’s annual environmental performance data.

Conflicts of Interest

The authors declare no conflict of interest.

References

  1. Monsalud, A.; Ho, D.; Rakas, J. Greenhouse gas emissions mitigation strategies within the airport sustainability evaluation process. Sustain. Cities Soc. 2014, 14, 414–424. [Google Scholar] [CrossRef]
  2. Graham, A. Managing Airports: An International Perspective, 4th ed.; Routledge: Abingdon, UK, 2014. [Google Scholar]
  3. Vanker, S.; Enneveer, M.; Mäsak, M. Implementation of environmentally friendly measures at Tallinn Airport. Aviation 2013, 17, 14–21. [Google Scholar] [CrossRef]
  4. Sukumaran, S.; Sudhakar, K. Fully solar powered Raja Bhoj International Airport: A feasibility study. Resour.-Effic. Technol. 2017, 3, 309–316. [Google Scholar] [CrossRef]
  5. Giustozzi, F.; Toraldo, E.; Crispino, M. Recycled airport pavements for achieving environmental sustainability: An Italian case study. Resour. Conserv. Recycl. 2012, 68, 67–75. [Google Scholar] [CrossRef]
  6. Baxter, G.; Sabatini, R.; Wild, G. Sustainable airport energy management: A case study of Copenhagen Airport. In Proceedings of the International Symposium on Sustainable Aviation, Istanbul, Turkey, 31 May–3 June 2015. [Google Scholar]
  7. Doganis, R. The Airport Business; Routledge: London, UK, 1992. [Google Scholar]
  8. Dempsey, P.S. Airport Planning and Development Handbook: A Global Survey; McGraw-Hill: New York, NY, USA, 2000. [Google Scholar]
  9. Ashford, N.J.; Mumayiz, S.A.; Wright, P.H. Airport Engineering: Planning, Design, and Development of 21st Century Airports, 4th ed.; John Wiley & Sons: Hoboken, NJ, USA, 2011. [Google Scholar]
  10. Seyanont, A. Passengers’ perspective toward airport service quality at Suvarnabhumi International Airport. J. Soc. Transp. Traffic Stud. 2012, 3, 32–41. [Google Scholar]
  11. Ortega, S.; Manana, M. Characterization and analysis of energy demand patterns in airports. Energies 2017, 10, 119. [Google Scholar] [CrossRef]
  12. Cardona, E.; Piacentino, A.; Cardona, F. Energy saving in airports by trigeneration. Part I: Assessing economic and technical potential. Appl. Therm. Eng. 2006, 26, 1427–1436. [Google Scholar] [CrossRef]
  13. Kazda, T.; Caves, B.; Kamenický, M. Environmental control. In Airport Design and Operation, 3rd ed.; Kazda, A., Caves, R.E., Eds.; Emerald Group Publishing: Bingley, UK, 2015; pp. 457–500. [Google Scholar]
  14. Akyüz, M.K.; Altuntaş, O.; Söğüt, M.Z. Economic and environmental optimization of an airport terminal building’s wall and roof insulation. Sustainability 2017, 9, 1849. [Google Scholar] [CrossRef]
  15. Thomas, C.; Hooper, P. Sustainable development and environmental capacity of airports. In Airport Operations, 3rd ed.; Ashford, N.J., Stanton, H.P.M., Moore, C.A., Coutu, P., Beasley, J.R., Eds.; McGraw-Hill: New York, NY, USA, 2013; pp. 553–578. [Google Scholar]
  16. Janić, M. Greening Airports: Advanced Technology and Operations; Springer: London, UK, 2011. [Google Scholar]
  17. Rossi Dal Pozzo, F. EU Legal Framework for Safeguarding Air Passenger Rights; Springer International Publishing: Cham, Switzerland, 2015. [Google Scholar]
  18. Chu, S.C.K. Goal programming model for airport ground support equipment parking. In Multiple Objective and Goal Programming: Recent Developments; Trzaskalik, T., Michnik, J., Eds.; Physica: Heidelberg, Germany, 2002; pp. 235–246. [Google Scholar]
  19. Halpern, N.; Graham, A. Airport Marketing; Routledge: Abingdon, UK, 2013. [Google Scholar]
  20. Freathy, P.; O’Connell, F. Spending time, spending money: Passenger segmentation in an international airport. Int. Rev. Retail Distrib. Consum. Res. 2012, 22, 397–416. [Google Scholar] [CrossRef]
  21. Graham, A.; Morrell, P. Airport Finance and Investment in the Global Economy; Routledge: Abingdon, UK, 2017. [Google Scholar]
  22. Ortega, S.; Manana, M. Energy research in airports: A review. Energies 2016, 9, 349. [Google Scholar] [CrossRef]
  23. Budd, L.; Budd, T. Environmental technology and the future of flight. In Sustainable Aviation Futures; Budd, L., Griggs, S., Howarth, D., Eds.; Emerald Group Publishing: Bingley, UK, 2013; pp. 87–107. [Google Scholar]
  24. Barrett, S.; Devita, P.; Ho, C.; Miller, B. Energy technologies’ compatibility with airports and airspace: Guidance for aviation and energy planners. J. Airport Manag. 2014, 8, 318–326. [Google Scholar]
  25. Janić, M. The Sustainability of Air Transportation: A Quantitative Analysis and Assessment; Ashgate Publishing: Aldershot, UK, 2007. [Google Scholar]
  26. Dawes Farquhar, J. Case Study Research for Business; SAGE Publications: London, UK, 2014. [Google Scholar]
  27. Yin, R.K. Case Study Research: Design and Methods, 6th ed.; SAGE Publications: Thousand Oaks, CA, USA, 2017. [Google Scholar]
  28. Morse, J.M.; Niehaus, L. Mixed Method Design: Principles and Procedures; Routledge: Abingdon, UK, 2009. [Google Scholar]
  29. Schutt, R.K. Investigating the Social World: The Process and Practice of Research, 7th ed.; SAGE Publications: Thousand Oaks, CA, USA, 2012. [Google Scholar]
  30. Rahim, A.R.; Baksh, M.S. Case study method for new product development in engineer-to-order organisations. Work Study 2003, 52, 25–36. [Google Scholar] [CrossRef]
  31. Yin, R.K. Case Study Research: Design and Methods, 4th ed.; SAGE Publications: Thousand Oaks, CA, USA, 2009. [Google Scholar]
  32. Fasone, V.; Maggiore, P. “Non-Aviation” activities and the introduction of new thinking and ideas in the airport business: Empirical evidence from an Italian case study. J. Airl. Airport Manag. 2012, 2, 34–50. [Google Scholar]
  33. Andrew, D.P.S.; Pedersen, P.M.; McEvoy, C.D. Research Methods and Design in Sport Management; Human Kinetics: Champaign, IL, USA, 2011. [Google Scholar]
  34. Chester, L. A rėgulationist analysis of an industry sector using mixed research methods. In Handbook of Research Methods and Applications in Heterodox Economics; Lee, F.S., Cronin, B., Eds.; Edward Elgar: Cheltenham, UK, 2016; pp. 569–590. [Google Scholar]
  35. Myers, M.D. Qualitative Research in Business and Management; SAGE Publications: London, UK, 2013. [Google Scholar]
  36. Scott, J.; Marshall, G. A Dictionary of Sociology, 3rd ed.; Oxford University Press: Oxford, UK, 2009. [Google Scholar]
  37. Love, P. Document analysis. In Research in the College Context: Approaches and Methods; Stage, F.K., Manning, K., Eds.; Brunner-Routledge: New York, NY, USA, 2003; pp. 83–96. [Google Scholar]
  38. van Schoor, B. Fighting Corruption Collectively: How Successful Are Sector-Specific Coordinated Governance Initiatives in Curbing Corruption; Springer: Wiesbaden, Germany, 2017. [Google Scholar]
  39. O’Leary, Z. The Essential Guide to Doing Research; SAGE Publications: London, UK, 2004. [Google Scholar]
  40. Airports Worldwide. Copenhagen Kastrup Int Airport. Available online: http://www.airports-worldwide.com/denmark/copenhagen_kastrup_denmark.html (accessed on 18 May 2018).
  41. Star Alliance. Fly to 1,317 Destinations Worldwide with the Star Alliance Network. Available online: https://flights.staralliance.com/en/ (accessed on 18 May 2018).
  42. Copenhagen Airports A/S. Available online: https://www.linkedin.com/company/copenhagen-airports (accessed on 18 May 2018).
  43. Copenhagen Airports A/S. Group Annual Report: Facts & Figures 2016. Available online: https://www.cph.dk/globalassets/5.-om-cph/6.-investor/cph-annual-report-2016-uk_28mb.pdf (accessed on 9 September 2017).
  44. Copenhagen Airports A/S. CPH: Strong Finish to Challenging Year, Press Release 24 February 2009; Copenhagen Airports A/S: Copenhagen, Denmark, 2009. [Google Scholar]
  45. Copenhagen Airports A/S. Passenger Record Driving Results, Press Release 26 February. Available online: https://www.cph.dk/en/about-cph/press/news/2015/2/fy2014_uk/ (accessed on 18 May 2018).
  46. Copenhagen Airports A/S. Strong Growth at Copenhagen Airport, Press Release 1 March. Available online: https://www.cph.dk/en/about-cph/press/news/2017/3/strong-growth-at-copenhagen-airport/ (accessed on 9 November 2017).
  47. Copenhagen Airports A/S. CPH and Society 2011; Copenhagen Airports A/S: Copenhagen, Denmark, 2012. [Google Scholar]
  48. Copenhagen Airports A/S. CPH and Society 2012; Copenhagen Airports A/S: Copenhagen, Denmark, 2013. [Google Scholar]
  49. Copenhagen Airports A/S. CPH and Society 2013. Available online: http://dit.cph.dk/wp-content/uploads/2015/06/CPH-and-Society-2013_UK.pdf (accessed on 18 May 2018).
  50. Copenhagen Airports A/S. Legal Framework. Available online: http://dit.cph.dk/wp-content/uploads/2015/06/UK-Faktaark-a-responsible-company-Legal-framework.pdf (accessed on 18 May 2018).
  51. European Investment Bank. Environmental and Social Data Sheet: CPH (Copenhagen) Airport Expansion TEN-T. Available online: http://www.eib.org/infocentre/register/all/69558856.pdf (accessed on 20 March 2018).
  52. Copenhagen Airports A/S. Group Annual Report: Facts & Figures 2014 Copenhagen Airports. Available online: https://www.cph.dk/globalassets/5.-om-cph/investor/koncernarsrapporter/arsraporter_uk/cph_uk_ar_report_2015_03_18_final.pdf (accessed on 24 March 2018).
  53. Copenhagen Airports A/S. CPH and Society 2010. Available online: https://cph-prod-cdn.azureedge.net/48cd3d/globalassets/8.-om-cph/6.-investor/arsrapporter/en/cph-and-society-2010.pdf (accessed on 18 May 2018).
  54. Emirates Airline. Emirates Launches Daily A380 Service to Copenhagen. Available online: https://www.emirates.com/media-centre/emirates-launches-daily-a380-service-to-copenhagen (accessed on 18 May 2018).
  55. Budd, T. Environmental impacts and mitigation. In Air Transport Management: An International Perspective; Budd, L., Ison, S., Eds.; Routledge: Abingdon, UK, 2017; pp. 283–306. [Google Scholar]
  56. Kim, B.Y.; Waitz, I.A.; Vigilante, M.; Bassarab, R. Guidebook on Preparing Airport Greenhouse Gas Emissions Inventories; ACRP Report 11; Transportation Research Board: Washington, DC, USA, 2009. [Google Scholar]
  57. McGormley, R.W. Guidebook of Practices for Improving Environmental Performance at Small Airports; ACRP Report 43; Transportation Research Board: Washington, DC, USA, 2011. [Google Scholar]
  58. Ashford, N.J.; Stanton, H.P.M.; Moore, C.A.; Coutu, P.; Beasley, J.R. Airport Operations, 3rd ed.; McGraw-Hill: New York, NY, USA, 2013. [Google Scholar]
  59. Kazda, A.; Caves, R.E. Airport Design and Operation, 3rd ed.; Emerald Group Publishing: Bingley, UK, 2015. [Google Scholar]
  60. Odoni, A.R. Airports. In The Global Airline Industry, 2nd ed.; Belobaba, P., Odoni, A., Barnhart, C., Eds.; John Wiley & Sons: Chichester, UK, 2016; pp. 361–393. [Google Scholar]
  61. Kramer, L. Airport Revenue Diversification: A Synthesis of Airport Practice; ACRP Synthesis 19; Transportation Research Board: Washington, DC, USA, 2010. [Google Scholar]
  62. Budd, L.; Ison, S. Airfield design, configuration and management. In Air Transport Management: An International Perspective; Budd, L., Ison, S., Eds.; Routledge: Abingdon, UK, 2017; pp. 41–60. [Google Scholar]
  63. Copenhagen Airports A/S. CPH Efficiency Stands Ambition. Available online: https://www.cph.dk/en/cph-business/aviation/newsletters/cph-efficiency-stands-ambition/ (accessed on 5 February 2018).
  64. Copenhagen Airports A/S. Group Annual Report: Facts & Figures 2015 Copenhagen Airports. Available online: https://cph-prod-cdn.azureedge.net/48cf35/globalassets/8.-om-cph/6.-investor/arsrapporter/en/facts--figures-2015.pdf (accessed on 18 May 2018).
  65. Barrett, S. Ownership structures and the implications for developing airport solar projects in the USA. J. Airport Manag. 2015, 9, 248–263. [Google Scholar]
  66. Sukumaran, S.; Sudhakar, K. Fully solar powered airport: A case study of Cochin International airport. J. Air Transp. Manag. 2017, 62, 176–188. [Google Scholar] [CrossRef]
  67. Wybo, J.L. Large-scale photovoltaic systems in airports areas: Safety concerns. Renew. Sustain. Energy Rev. 2013, 21, 402–410. [Google Scholar] [CrossRef]
  68. Copenhagen Airports A/S. Copenhagen Airport’s Solar Power System Inaugurated, Press Release 24 September. Available online: https://www.cph.dk/en/about-cph/press/news/2014/9/copenhagen-airports-solar-power-system-inaugurated/ (accessed on 20 March 2018).
  69. Copenhagen Airports A/S. Better Light Control Reduces Power Consumption. Press Release; Copenhagen Airports A/S: Copenhagen, Denmark, 2009. [Google Scholar]
  70. Keller, M.; Burke, B. Fundamentals of Integrated Design for Sustainable Building; John Wiley & Sons: Hoboken, NJ, USA, 2009. [Google Scholar]
  71. Freyssinier, J.P. The long-term performance of LEDs. Int. Airport Rev. 2014, 18, 38–41. [Google Scholar]
  72. Copenhagen Airports A/S. CPH Environmental Report 2009; Copenhagen Airports A/S: Copenhagen, Denmark, 2010. [Google Scholar]
  73. Stasinopoulos, P.; Smith, M.H.; Hargroves, K.C.; Desha, C. Whole System Design: An Integrated Approach to Sustainable Engineering; Earthscan Publications: London, UK, 2009. [Google Scholar]
  74. Copenhagen Airports A/S. LED Light to Save Energy at Copenhagen Airport; Copenhagen Airports A/S: Copenhagen, Denmark, 2014. [Google Scholar]
  75. Copenhagen Airports A/S. Copenhagen Airports A/S Environmental Report 2000; Copenhagen Airports A/S: Copenhagen, Denmark, 2001. [Google Scholar]
  76. International Air Transport Association. Passenger Terminal Design. Available online: http://www.iata.org/whatwedo/ops-infra/air-traffic-management/Documents/passenger-terminal-design.pdf (accessed on 5 February 2018).
  77. Coleman, P. Shopping Environments: Evolution, Planning and Design; Architectural Press: Burlington, MA, USA, 2006. [Google Scholar]
  78. Copenhagen Airports A/S. ATES: Groundwater Cooling. Available online: http://dit.cph.dk/wp-content/uploads/2015/06/UK-Faktaark-a-responsible-company-ATES.pdf (accessed on 20 March 2018).
  79. Thomas, M.; Sheffield, J.W.; Mohan, V. Hydrogen design case studies. In Hydrogen Energy and Vehicle Systems; Grasman, S.E., Ed.; CRC Press: Boca Raton, FL, USA, 2013; pp. 273–295. [Google Scholar]
  80. Testa, E.; Giammusso, C.; Bruno, M.; Maggiore, P. Analysis of environmental benefits resulting from use of hydrogen technology in handling operations at airports. Clean Technol. Environ. 2014, 16, 875–890. [Google Scholar] [CrossRef]
  81. Airmarrell. Hydrogen Fuel Cells Could Enable Airports to Reduce Their Ground Emissions to Almost Zero. Available online: http://www.airmarrel.com/fr/hydrogen-fuel-cells-could-enable-airports-to-reduce-their-ground-emissions-to-almost-zero-2/ (accessed on 4 February 2018).
  82. Acar, C.; Dincer, I. Hydrogen Energy. In Comprehensive Energy Systems; Dincer, I., Ed.; Elsevier: Amsterdam, The Netherlands, 2018; pp. 563–604. [Google Scholar]
  83. Dincer, I.; Joshi, A.S. Solar Based Hydrogen Production Systems; Springer: New York, NY, USA, 2013. [Google Scholar]
  84. Fuel Cells Bulletin. Green hydrogen facility opens at Berlin airport. Fuel Cells Bull. 2014, 5, 1. [Google Scholar]
  85. Fuel Cells Bulletin. Hydrogen energy project planned for two Canadian airports. Fuel Cells Bull. 2009, 6, 8. [Google Scholar]
  86. New Kansai International Airport Company Ltd. Creating the Future with Hydrogen: Smart Airport KIX; New Kansai International Airport Company Ltd.: Osaka, Japan, 2016. [Google Scholar]
  87. Gegg, P.; Budd, L.; Ison, S. The market development of aviation biofuel: Drivers and constraints. J. Air. Transp. Manag. 2014, 39, 34–40. [Google Scholar] [CrossRef] [Green Version]
  88. Harvey, C. United Airlines Is Flying on Biofuels. Here’s Why That’s a Really Big Deal. The Washington Post. 11 March 2016. Available online: https://www.washingtonpost.com/news/energy-environment/wp/2016/03/11/united-airlines-is-flying-on-biofuels-heres-why-thats-a-really-big-deal/?utm_term=.0e8f370954c9 (accessed on 4 February 2018).
  89. World Economic Forum. Norway’s Airports Refuel Aircraft with Biofuels. Available online: https://www.weforum.org/agenda/2017/11/norway-airports-biofuels-avinor/ (accessed on 4 February 2018).
  90. Copenhagen Airports A/S. Aviation Sector in the Nordic Region Together with Airbus and Boeing Join Forces for Sustainable Jet Fuel. Available online: https://www.svensktflyg.se/2013/11/aviation-sector-in-the-nordic-region-together-with-airbus-and-boeing-join-forces-for-sustainable-jet-fuel/ (accessed on 18 May 2018).
  91. Horonjeff, R.; McKelvey, F.X.; Sproule, W.J.; Young, S. Planning & Design of Airports, 5th ed.; McGraw-Hill: New York, NY, USA, 2010. [Google Scholar]
  92. Airside International. Getting it right: Aircraft power on the stand. Airside Int. 2012, 19, 23–25. [Google Scholar]
  93. Copenhagen Airports A/S. Use of APU. Available online: http://dit.cph.dk/wp-content/uploads/2015/07/EN-4-Noise-Use-of-APUs.pdf (accessed on 18 May 2018).
  94. Larminie, J.; Lowry, J. Electric Vehicle Technology Explained, 2nd ed.; John Wiley & Sons: Chichester, UK, 2012. [Google Scholar]
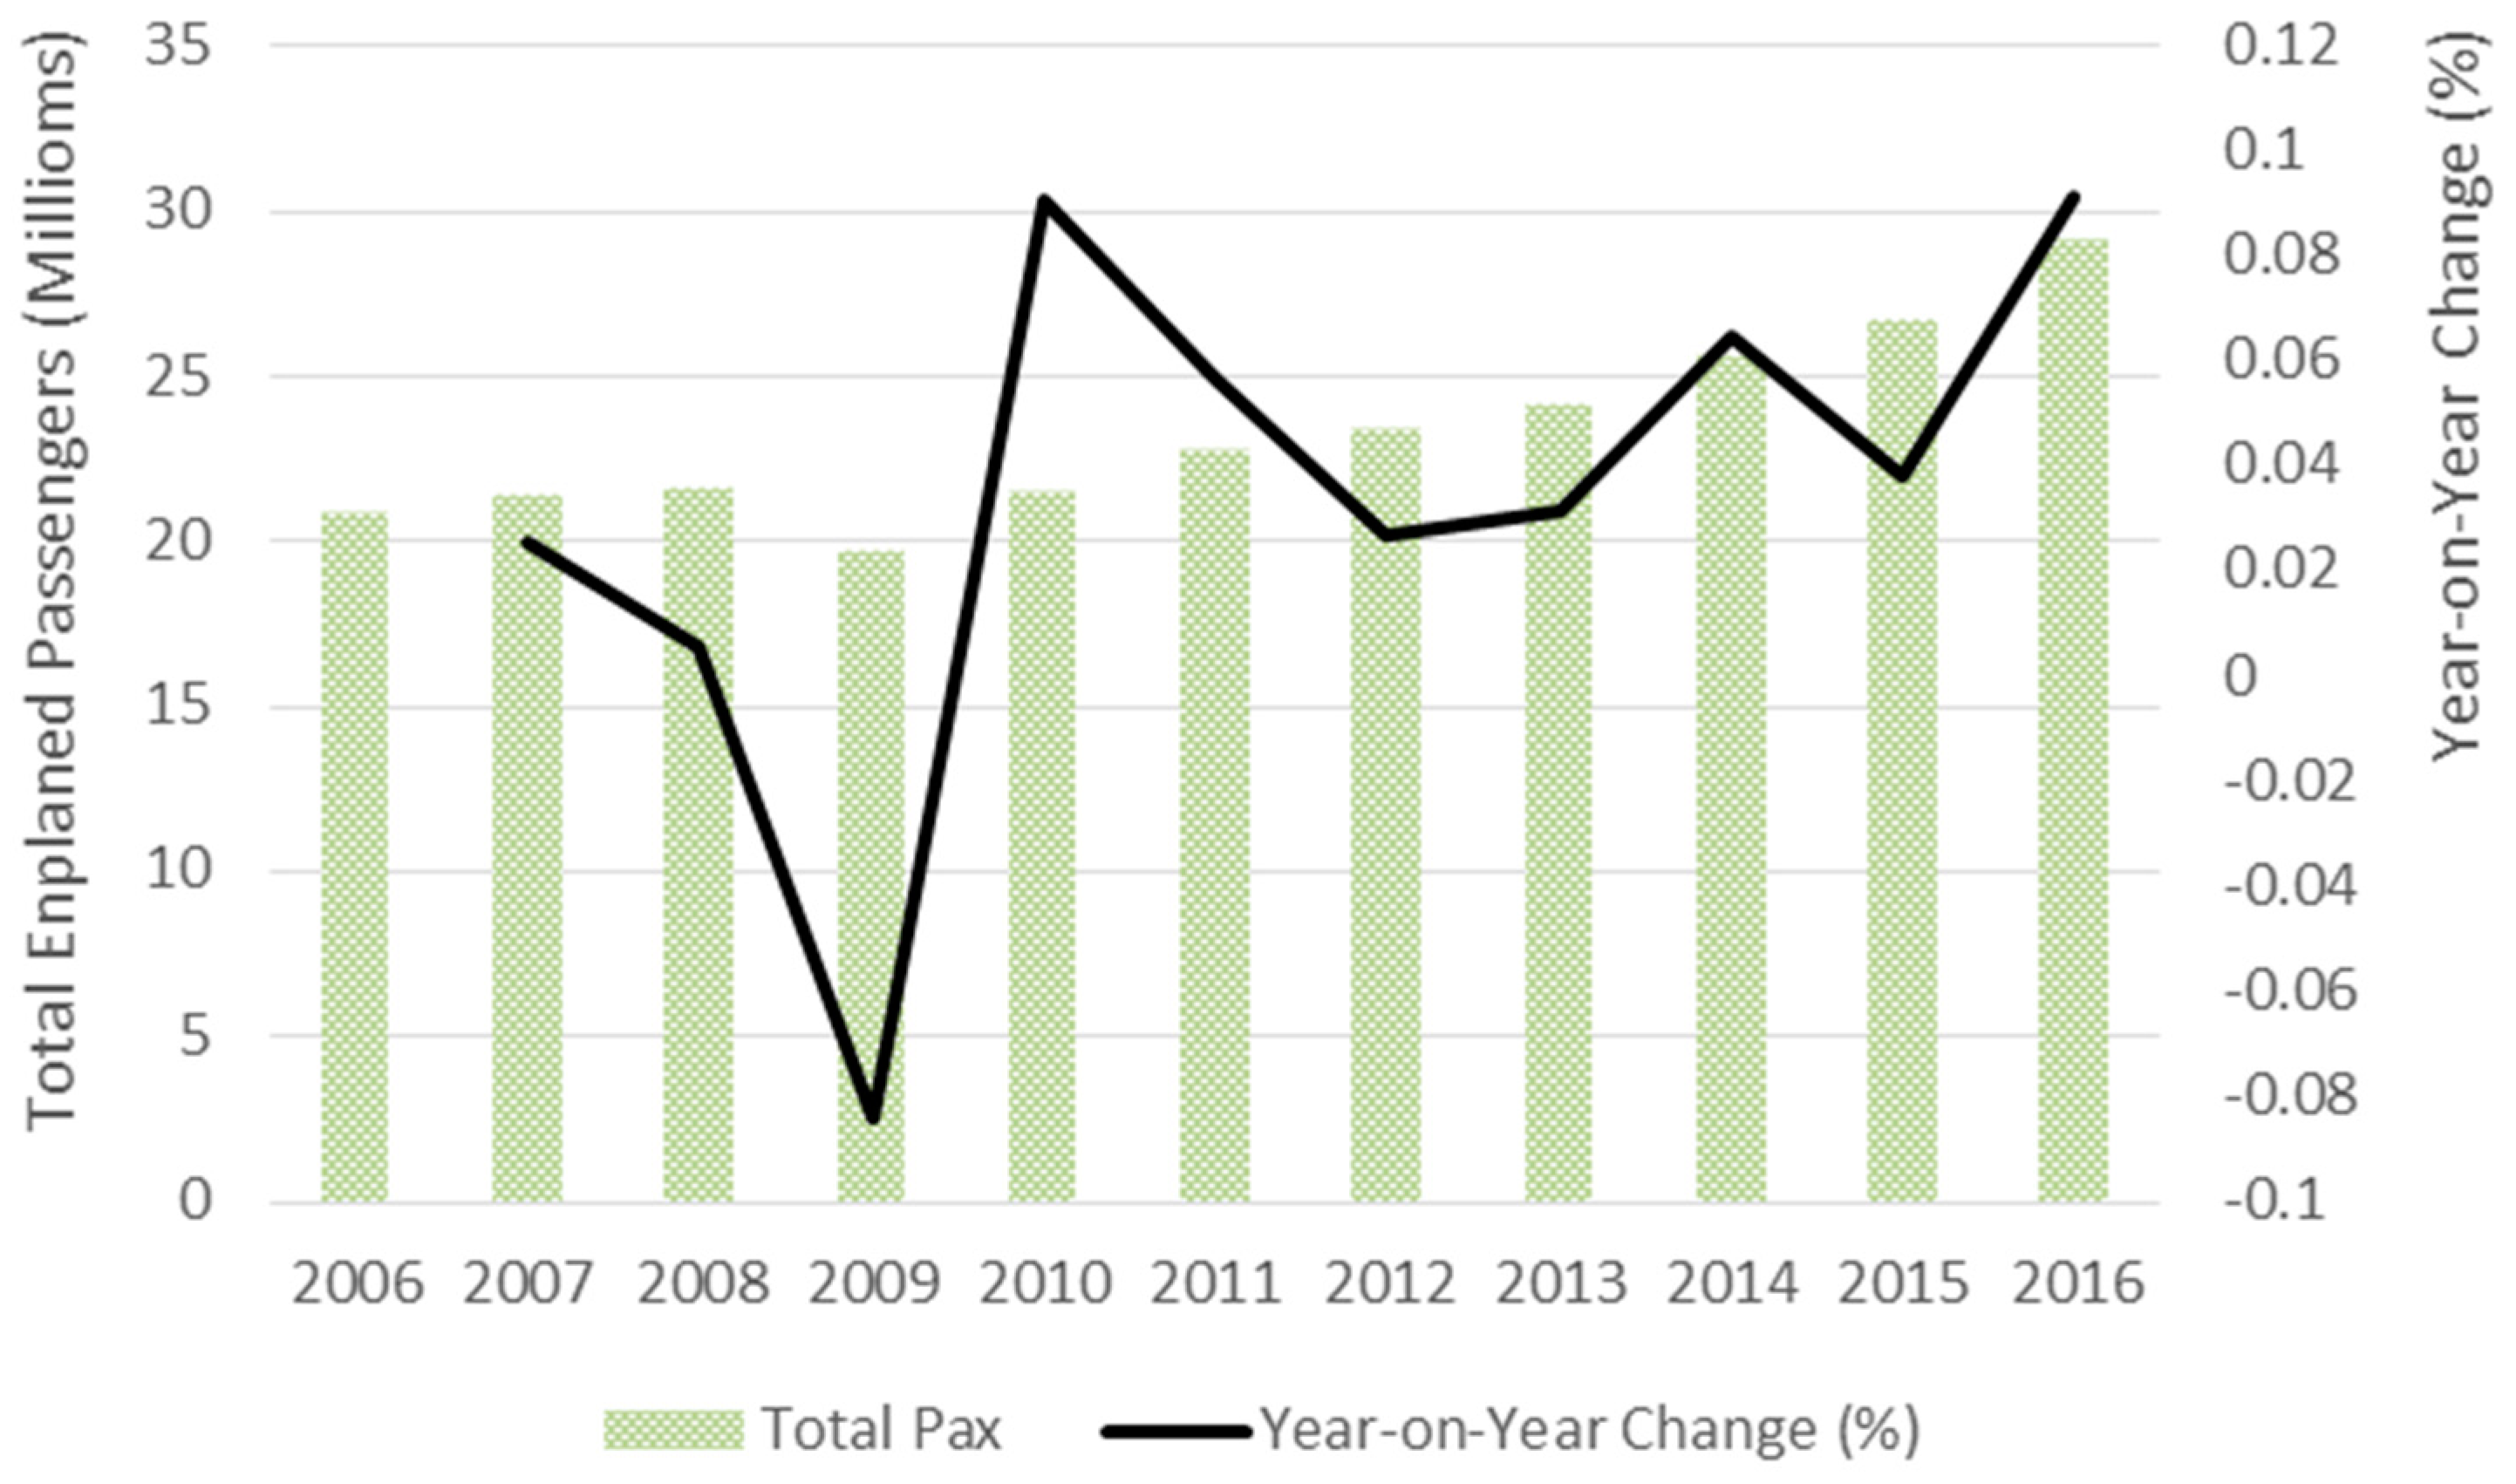
Figure 1. Total annual passengers (Domestic and International) passengers and the year-on-year change (%) at Copenhagen Airport: 2006–2016. Source: data derived from [43,47,48,49].
Resources 07 00032 g001
Figure 2. Copenhagen Airport’s total direct energy consumption and year-on-year change (%): 2006–2016. Source: data derived from [43,47,52,53].
Resources 07 00032 g002
Figure 3. Copenhagen Airport’s total indirect energy consumption and year-on-year change (%): 2006–2016. Source: data derived from [43,45,52,53].
Resources 07 00032 g003
Figure 4. Copenhagen Airport’s total energy consumption and total annual passengers: 2006–2016. Source: data derived from [43,45,52,53].
Resources 07 00032 g004
Figure 5. Copenhagen Airport’s total energy consumption per aircraft movement (ATM): 2006–2016. Source: data derived from [43,45,52,53].
Resources 07 00032 g005
Figure 6. Copenhagen Airport’s total energy consumption per passenger traffic work load unit (WLU): 2006–2016. Source: data derived from [43,45,52,53].
Resources 07 00032 g006
Figure 7. Aquifer thermal energy storage (ATES) showing heating of an airport in winter by pumping water in from the warmer half of the dipole (left) and cooling in summer by pumping water in from the cooler half of the dipole (right). Source: adapted from [78] (p. 2).
Resources 07 00032 g007
Table 1. Key stakeholders involved in the provision of an airport’s landside operations/services and their energy requirements.
StakeholderEnergy Requirements
Airport AuthorityProvision of terminal(s) power, terminal and facilities lighting, air conditioning (cooling and heating), car park lighting, power for baggage systems
AirlinesPower for office air conditioning, IT systems, and lighting
Airport Tenants and ConcessionairesPower for office air conditioning, IT systems, and office/terminal lighting
Car Rental FirmsPower for office cooling and heating, IT systems, and vehicle washing facilities
Cargo Terminal Operator 1Power for office air conditioning, cargo handling and IT systems, and office/terminal lighting
Eating and Dining EstablishmentsPower for office and cooking/refrigeration systems, lighting, and air conditioning
Freight ForwardersPower for office air conditioning, IT systems, and office/terminal lighting
Government AgenciesPower for office air conditioning, IT systems, and lighting
Ground Handling AgentsPower for office air conditioning, IT systems, office/terminal lighting, and electric powered ground service equipment (GSE 2)
Ground Transportation (buses, etc.)Power for office air conditioning and lighting
HotelsPower for office, guest, and function rooms; air conditioning; lighting; catering and cleaning; and IT systems
Security ServicesPower for office air conditioning, lighting, IT systems, and security screening equipment
Taxi Cab Holding BaysPower for office air conditioning, lighting, signage, catering facilities, and IT systems
Notes: 1 Cargo terminals are facilities in which individual air cargo consignments are built up into cargo loads ready for loading onto an airline’s aircraft and, following transport to their destination, are unloaded into individual shipments for delivery to the final customer or their nominated agent. Cargo terminals typically provide office space for their client airlines. 2 Ground service equipment (GSE) refers to the pre-specified set of vehicular equipment (such as aircraft lower deck belly-hold loaders, push back tractors) that are required to service an arrival or a departure of a specific type of aircraft (for example, Airbus A380 or Boeing B777-300ER) [18] (p. 235).
Table 2. Key stakeholders involved in the provision of an airport’s airside operations/services and their energy requirements.
StakeholderEnergy Requirements
Airport AuthorityProvision of terminal(s), apron, taxiway, and runway lighting, air conditioning, electrical
Power and air to aircraft gates, power to facilities, ground equipment, maintenance facilities, and baggage systems
Air Traffic ControlPower for office air conditioning, lighting, and ATC systems
Aircraft Maintenance FirmsPower for office air conditioning, IT systems, and lighting
AirlinesPower for office air conditioning, IT systems, lighting, and fuel handling systems
Airport Fuel Farm and SuppliersPower for office air conditioning, IT systems, and lighting
Airport Tenants & ConcessionairesPower for office air conditioning, cargo handling and IT systems, and office/terminal lighting
Cargo Terminal OperatorPower for office air conditioning, cargo handling and IT systems, and office/terminal lighting
Fixed Base Operator (FBO)Power for office and cooking/refrigeration systems, lighting, and air conditioning
Flight Catering CentersPower for office air conditioning, IT systems, and lighting
General Aviation/Business Jet CenterPower for office air conditioning, IT systems, and lighting
Government AgenciesPower for office air conditioning, IT systems, GSE, and lighting
Ground Sservice Equipment (GSE) Maintenance FirmsPower for office air conditioning, IT systems, and lighting
Ground Handling AgentsPower for office air conditioning, aircraft handling and IT systems, and office/terminal lighting
Table 3. Scope 1 CO2 emissions produced from the fuels used at Copenhagen Airport: 2012–2016.
Scope 1Unit20122013201420152016
Petroltonnes2723.5192427
Dieseltonnes18091809185219461939
Fuel oiltonnes0000283
Natural gas for vehiclestonnes000810
Natural gas tonnes2441228210859591038
Source: Data derived from [43,52].
Table 4. Scope 2 CO2 emissions at Copenhagen Airport: 2012–2016.
Scope 2Unit20122013201420152016
Powertonnes26,27823,47624,52423,68623,961
District heatingtonnes30163027256424592380
Source: Data derived from [43,52].
Table 5. Scope 2 CO2 emissions per passenger traffic workload unit (WLU) at Copenhagen Airport: 2012–2016.
Scope 2Unit20122013201420152016
Powerpassenger traffic WLU (g)11101098
District heatingpassenger traffic WLU (g)13131098
Source: Data derived from [43,52].
Table 6. Scope 3 CO2 emissions at Copenhagen Airport: 2012–2016.
Scope 3Unit20122013201420152016
District heating/electricity/natural gas tonnes27,70724,39824,38723,59725,096
Note: During 2016, Copenhagen Airports developed and implemented a new and improved model for calculating emissions and this is the main reason for the changes in levels. Thus, data for 2015 and 2016 are not directly comparable to historical data. Source: Source: Data derived from [43,52].
Table 7. Total annual energy savings at Copenhagen Airport and year-on-year change in energy saved (%): 2009–2016.
YearEnergy Saved (MWh)Year-on-Year Change in Energy Saved (%)
20096780
20103586428.9
20112716−24.26
2012308213.47
2013360817.06
20143273−9.28
2015567573.38
20164588−19.15
Source: data derived from [43,49,79].