Value of Clean Water Resources: Estimating the Water Quality Improvement in Metro Manila, Philippines

Institute for the Advanced Study of Sustainability, United Nations University, Tokyo 150-8925, Japan
Resources 2018, 7(1), 1; https://doi.org/10.3390/resources7010001
Submission received: 20 November 2017
/
Revised: 10 December 2017
/
Accepted: 20 December 2017
/
Published: 22 December 2017
Abstract
:While having many positive impacts, a tremendous economic performance and rapid industrial expansion over the last decades in the Philippines has had negative effects that have resulted in unfavorable hydrological and ecological changes in most urban river systems and has created environmental problems. Usually, these effects would not be part of a systematic assessment of urban water benefits. To address the issue, this study investigates the relationship between poor water quality and resident’s willingness to pay (WTP) for improved water quality in Metro Manila. By employing a contingent valuation method (CVM), this paper estimates the benefits of the provision of clean water quality (swimmable and fishable) in waterbodies of Metro Manila for its residents. Face-to-face interviews were completed with 240 randomly selected residents. Residents expressed a mean WTP of PHP102.44 (USD2.03) for a swimmable water quality (good quality) and a mean WTP of PHP102.39 (USD2.03) for fishable water quality (moderate quality). The aggregation of this mean willingness-to-pay value amounted to annual economic benefits from PHP9443 billion to PHP9447 billion (approx. USD190 million) per year for all taxpayers in Metro Manila. As expected, these estimates could inform local decision-makers about the benefits of future policy interventions aimed at improving the quality of waterbodies in Metro Manila.
1. Introduction
1.1. Water Quality Issues
The water quality in rivers, streams, lakes, and canals in many Southeast Asian countries has been deteriorating because of rapid population growth, urbanization, and industrialization, especially in densely populated urban areas [1]. The main source for water pollution in urban waterbodies is the unregulated discharge of domestic and industrial wastewater. This has a detrimental effect on human health, recreational opportunities, and environment, and translates into economic costs. According to Philippines Environment Monitor, annual costs of the adverse impact of water pollution on the economy estimated PHP67 billion (more than USD1.3 Billion) [2].
The situation is particularly alarming in Metro Manila, where waterbodies are heavily polluted. Water quality measurements conducted by monitoring stations at various locations along the rivers have indicated that most of them are biologically dead [3]. The term “biologically dead” refers to the absence mainly of dissolved oxygen (DO) in a waterbody. A waterbody is considered biologically dead when it has a zero DO level (meaning it has undergone complete “eutrophication”). The government of Metro Manila adopted measures to improve water quality in the city’s waterbodies, among them building new sewage treatment facilities, expanding sewerage infrastructure, and relocating informal settlers along the riverbanks. Recently, the government started to use such economic instruments as pollution fines and environmental taxes [1]. While the city’s water managers are aware of the costs of such interventions that are needed to restore good water quality, in many cases they lack information about the monetary value of water quality improvement in the city’s waterbodies. Such information could be important in urban planning and cost-benefit analysis of future water-related infrastructural projects.
The information is obtained through quantitative assessment of urban water benefits and is a necessary component for sustainable urban planning and development. The most widely used economic methods for the monetary estimation of these benefits are the contingent valuation method (CVM) and the hedonic pricing method (HPM). Assessments of recreation benefits are widely done through the use of the travel cost method (TCM); however, it would be challenging to apply this method in an urban context due to the fact that there are often limited travel expenses involved in assessing those areas.
1.2. Study Area and the Issue
The river system in Metro Manila is vast and extends to 27 km of the Pasig River, which traverses from Manila Bay in the west to Laguna Lake in the east, its four main tributaries (the San Juan River, the Marikina River, the Napindan River, and the Pateros-Taguig River), as well as 43 minor tributaries [3] (Figure 1). Across the National Capital Region (NCR), household waste, effluents, and industrial waste are routinely dumped into waterbodies and pollute aquatic habitats [4]. About 65–70% of pollution is caused by residential sewage, with the rest originating from industry, such as tanneries, textile mills, food processing plants, distilleries, and chemical and metal plants, as well as from solid waste dumped directly into the rivers [4]. In addition to the industries that contaminate waterbodies through toxic industrial chemicals, the lack of household sewerage systems has also contributed to the low quality of water in many parts of Metro Manila. Increasing urban populations are amplifying the problem, forcing governments to more effectively manage the ever-increasing sources of wastewater and to search for ways to solve the issue. The annual economic losses from water pollution are high and include losses in health, fisheries production, and tourism. The annual economic impact of poor sanitation in the Philippines, which is one of main sources of pollution in urban waterbodies, is approximately USD1.4 billion according to the World Bank report [5].
Large parts of Metro Manila’s population have inadequate access to fresh water due to a combination of factors such as degraded water quality because of a lack of regulation, depleted water resources due to overuse, and inefficient infrastructure as a result of poor governance. While drinking water is supplied to 90% of the Metro Manila population, only about 15% of households are connected to a sewerage system, with only one half of these connections provided with sewage treatment. About 85% have septic tanks, which are often poorly constructed. For sewage, most residents rely on open drains to convey sewage from their septic tanks. Lack of sanitation facilities, coupled with potential human contact with raw sewage by the population, pose an increased health risk. There is a high incidence of waterborne diseases such as diarrhea, typhoid, viral hepatitis, and cholera in the urban areas of Metro Manila [3]. Eventually, all sewage discharge from the city waterways ends up in either Manila Bay or Laguna Lake.
1.3. Objective
The low appreciation for clean waterways in urban areas by planners is often based on narrowly defined economic reasons. One basic problem is that land-use planning procedures do not include the systematic assessment of urban water benefits. The costs of supplying clean water can be determined in a relatively straightforward way, but the benefits are more difficult to estimate. This paper provides a method of estimation of use value of improving surface water quality in Metro Manila waterbodies. In doing so, this study adds to the developing literature on the benefits of water quality improvement in the following ways: First, our contingent valuation scenario was designed to connect with the natural state of future water quality, i.e., expected future water quality outcomes were that it would be swimmable and fishable. Second, we used a Computer-Assisted Personal Interviewing (CAPI) technique in the CVM survey (described in Section 2.3. survey administration technique and data collection). The resident’s average willingness to pay (WTP) and total economic value for each water quality are estimated and reported.
2. Materials and Methods
2.1. Contingent Valuation Method
The contingent valuation method (CVM) is the most frequently applied method in the valuation of environmental assets [7,8,9]. The CVM represents one of the stated preference techniques that are used by economists to assess a monetary value of nonmarket goods such as water quality. CVM or conjoint analysis has an advantage over other stated preference techniques, because it allows for the measurement of both the use values and nonuse values of environmental good. The method bypasses the need to refer to market prices by explicitly asking individuals to place monetary values upon environmental goods. The CVM provides a broader way of assessing large numbers of amenities than other methods do, e.g., estimating the willingness to pay for improved water quality that might be planned but has not yet been provided. CVM involves creating a hypothetical market for a sample of respondents and asking their opinion on the values of public environmental goods or services (e.g., WTP for a change in the supply of an environmental resource) under specified contingencies [10,11].
Mail surveys and phone or face-to-face interviews are usually used in survey administration. The respondents are asked what the maximum amount is that they are willing to pay (WTP) towards the preservation or improvement of an environmental good/asset. The researcher then estimates the monetary value of the asset by calculating the average WTP of respondents and multiplying this by the total number of users of the environmental good. As the questionnaire is the principal tool in CVM, designing a good questionnaire is critically important.
Generally, CVM survey consists of three parts: (1) explanation of the good being valued and the hypothetical situation that the respondent has to confront/imagine; (2) question of willingness to pay for the environmental good; and (3) follow-up questions related to general attitudes towards the good under consideration and the socio-economic characteristics of the respondent. The recent cases of CVM application in estimating water quality improvements were well discussed and described in the literature, (e.g., [12,13,14,15]).
2.2. Survey Design
A survey-based methodology built on eliciting willingness to pay for the good water quality of Metro Manila waterbodies was created. As no actual market exists for such an environmental good, researchers needed to create a hypothetical market, and respondents were requested to reveal the value they place on the proposed change in the environmental service. After the several workshops with stakeholders in Metro Manila and meetings with government agencies in charge of the water quality issues in the city, the hypothetical scenario of water quality improvement was identified. The study examined valuation of respondents to a proposed Surface Water Quality Improvement Program in Metro Manila. The Program consists of two components: (1) building a new wastewater treatment plants; and (2) expansion of Metro Manila’s existing sewerage system. The employed scenario is presented in Appendix A. Full questionnaire is available from the author upon request. The questionnaire was translated into Tagalog language, the most commonly spoken language in the megacity.
The future expected water quality standards in the framework used a reference based on Environmental Management Bureau (EMB) established thresholds for inland surface waterbodies in the Philippines (Table 1). According to the assumption made in our survey and based on observation of the actual quality of the city’s waterbodies, the current quality of NCR waterbodies was described as Class D. Certainly, it will take some time until the current water quality in waterbodies of Metro Manila reaches Class C (“acceptable for fishery and boating”) and then Class B (“acceptable for bathing and swimming”); therefore, the respondents were informed that changes will occur gradually depending on building wastewater treatment plants and, most importantly, expansion of the existing sewerage system (which currently covers 15% of the city).
It is difficult to find a clear way of conveying complex scientific information to those without a scientific background. In addition to verbal explanation during the conversation, surveyors used pictures and key attributes that would communicate the consequences of the levels of water quality in a way that would be understandable to general public. The selected pictures and attributes represent the ecosystem goods and services, the end point from which people derive relevant value and wellbeing.
The survey questionnaire is designed in three separate parts. The first part consists of awareness and behavioral questions on the current quality of waterbodies, causes of water pollution, visits to waterbodies, purpose of the visits, and effects of current water quality on people’s health and livelihood. The second part presents the CVM scenario and the WTP question. The following open-ended WTP question was chosen—How much would you be willing to pay as a monthly fee per household in addition to the monthly utility bill to have water quality acceptable for swimming/fishing? (Keep in mind that existing water quality is defined as bad water quality). The final part reveals the socio-economic data of the respondent and their household.
2.3. Survey Administration Technique and Data Collection
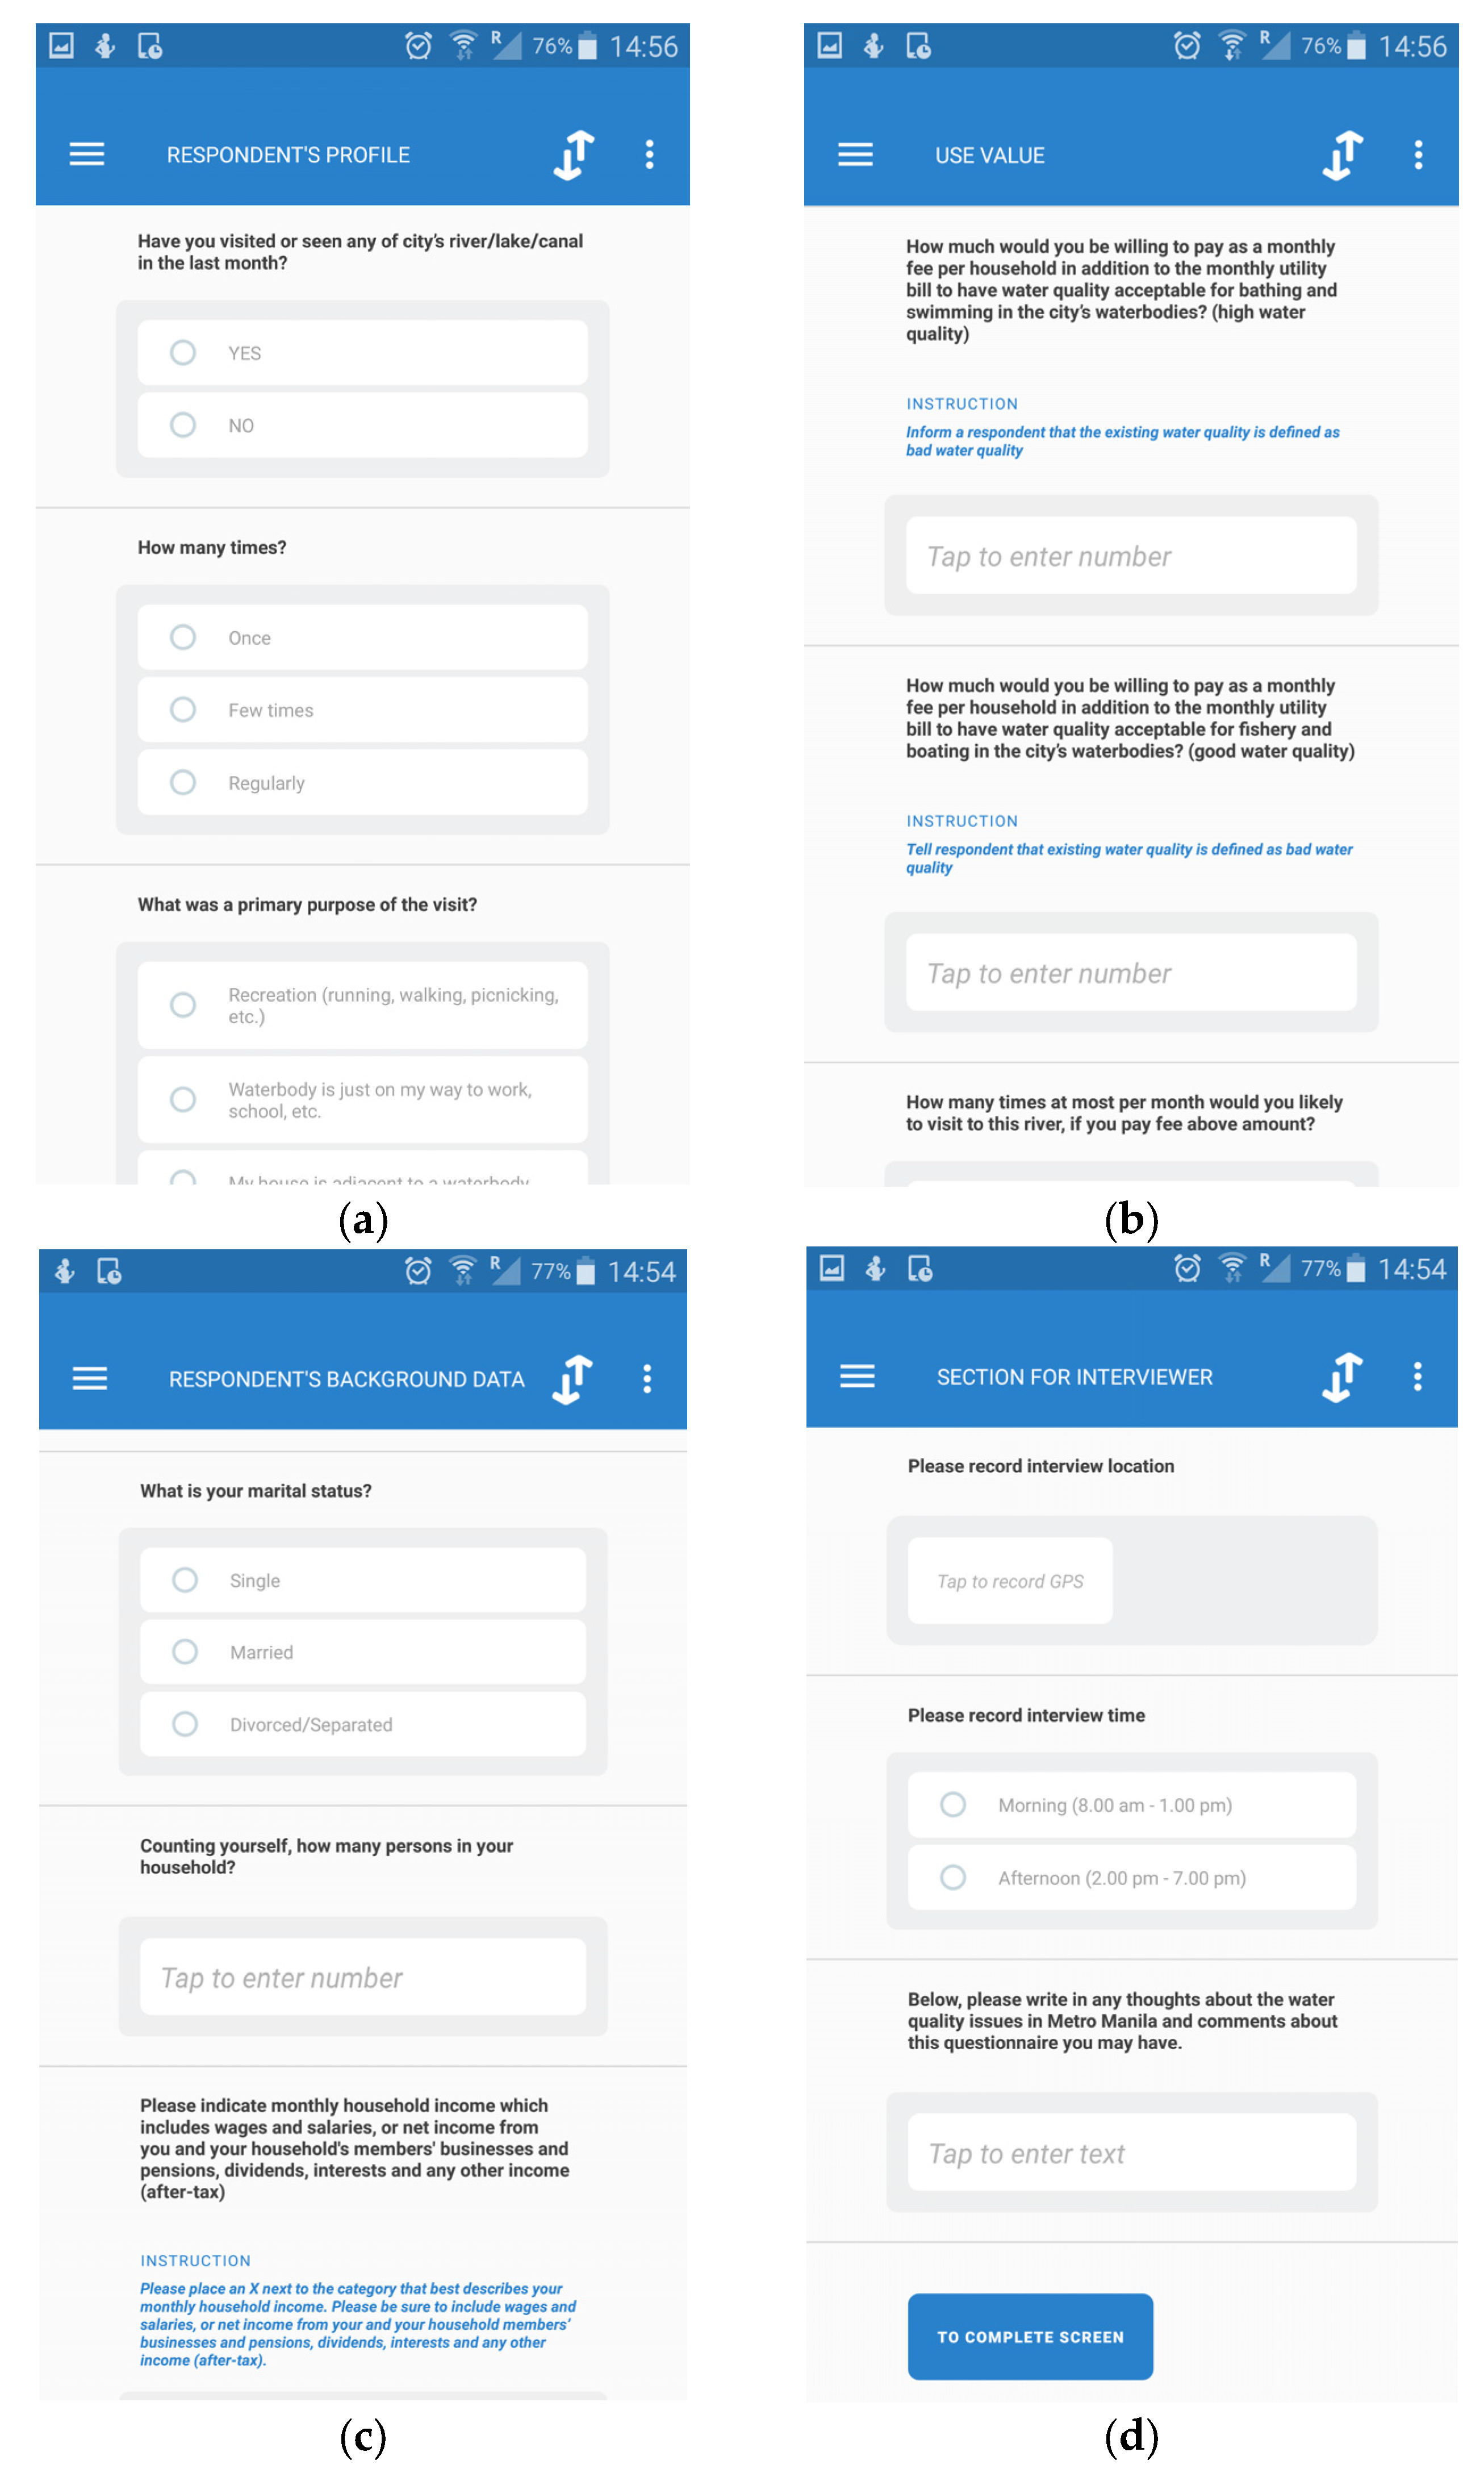
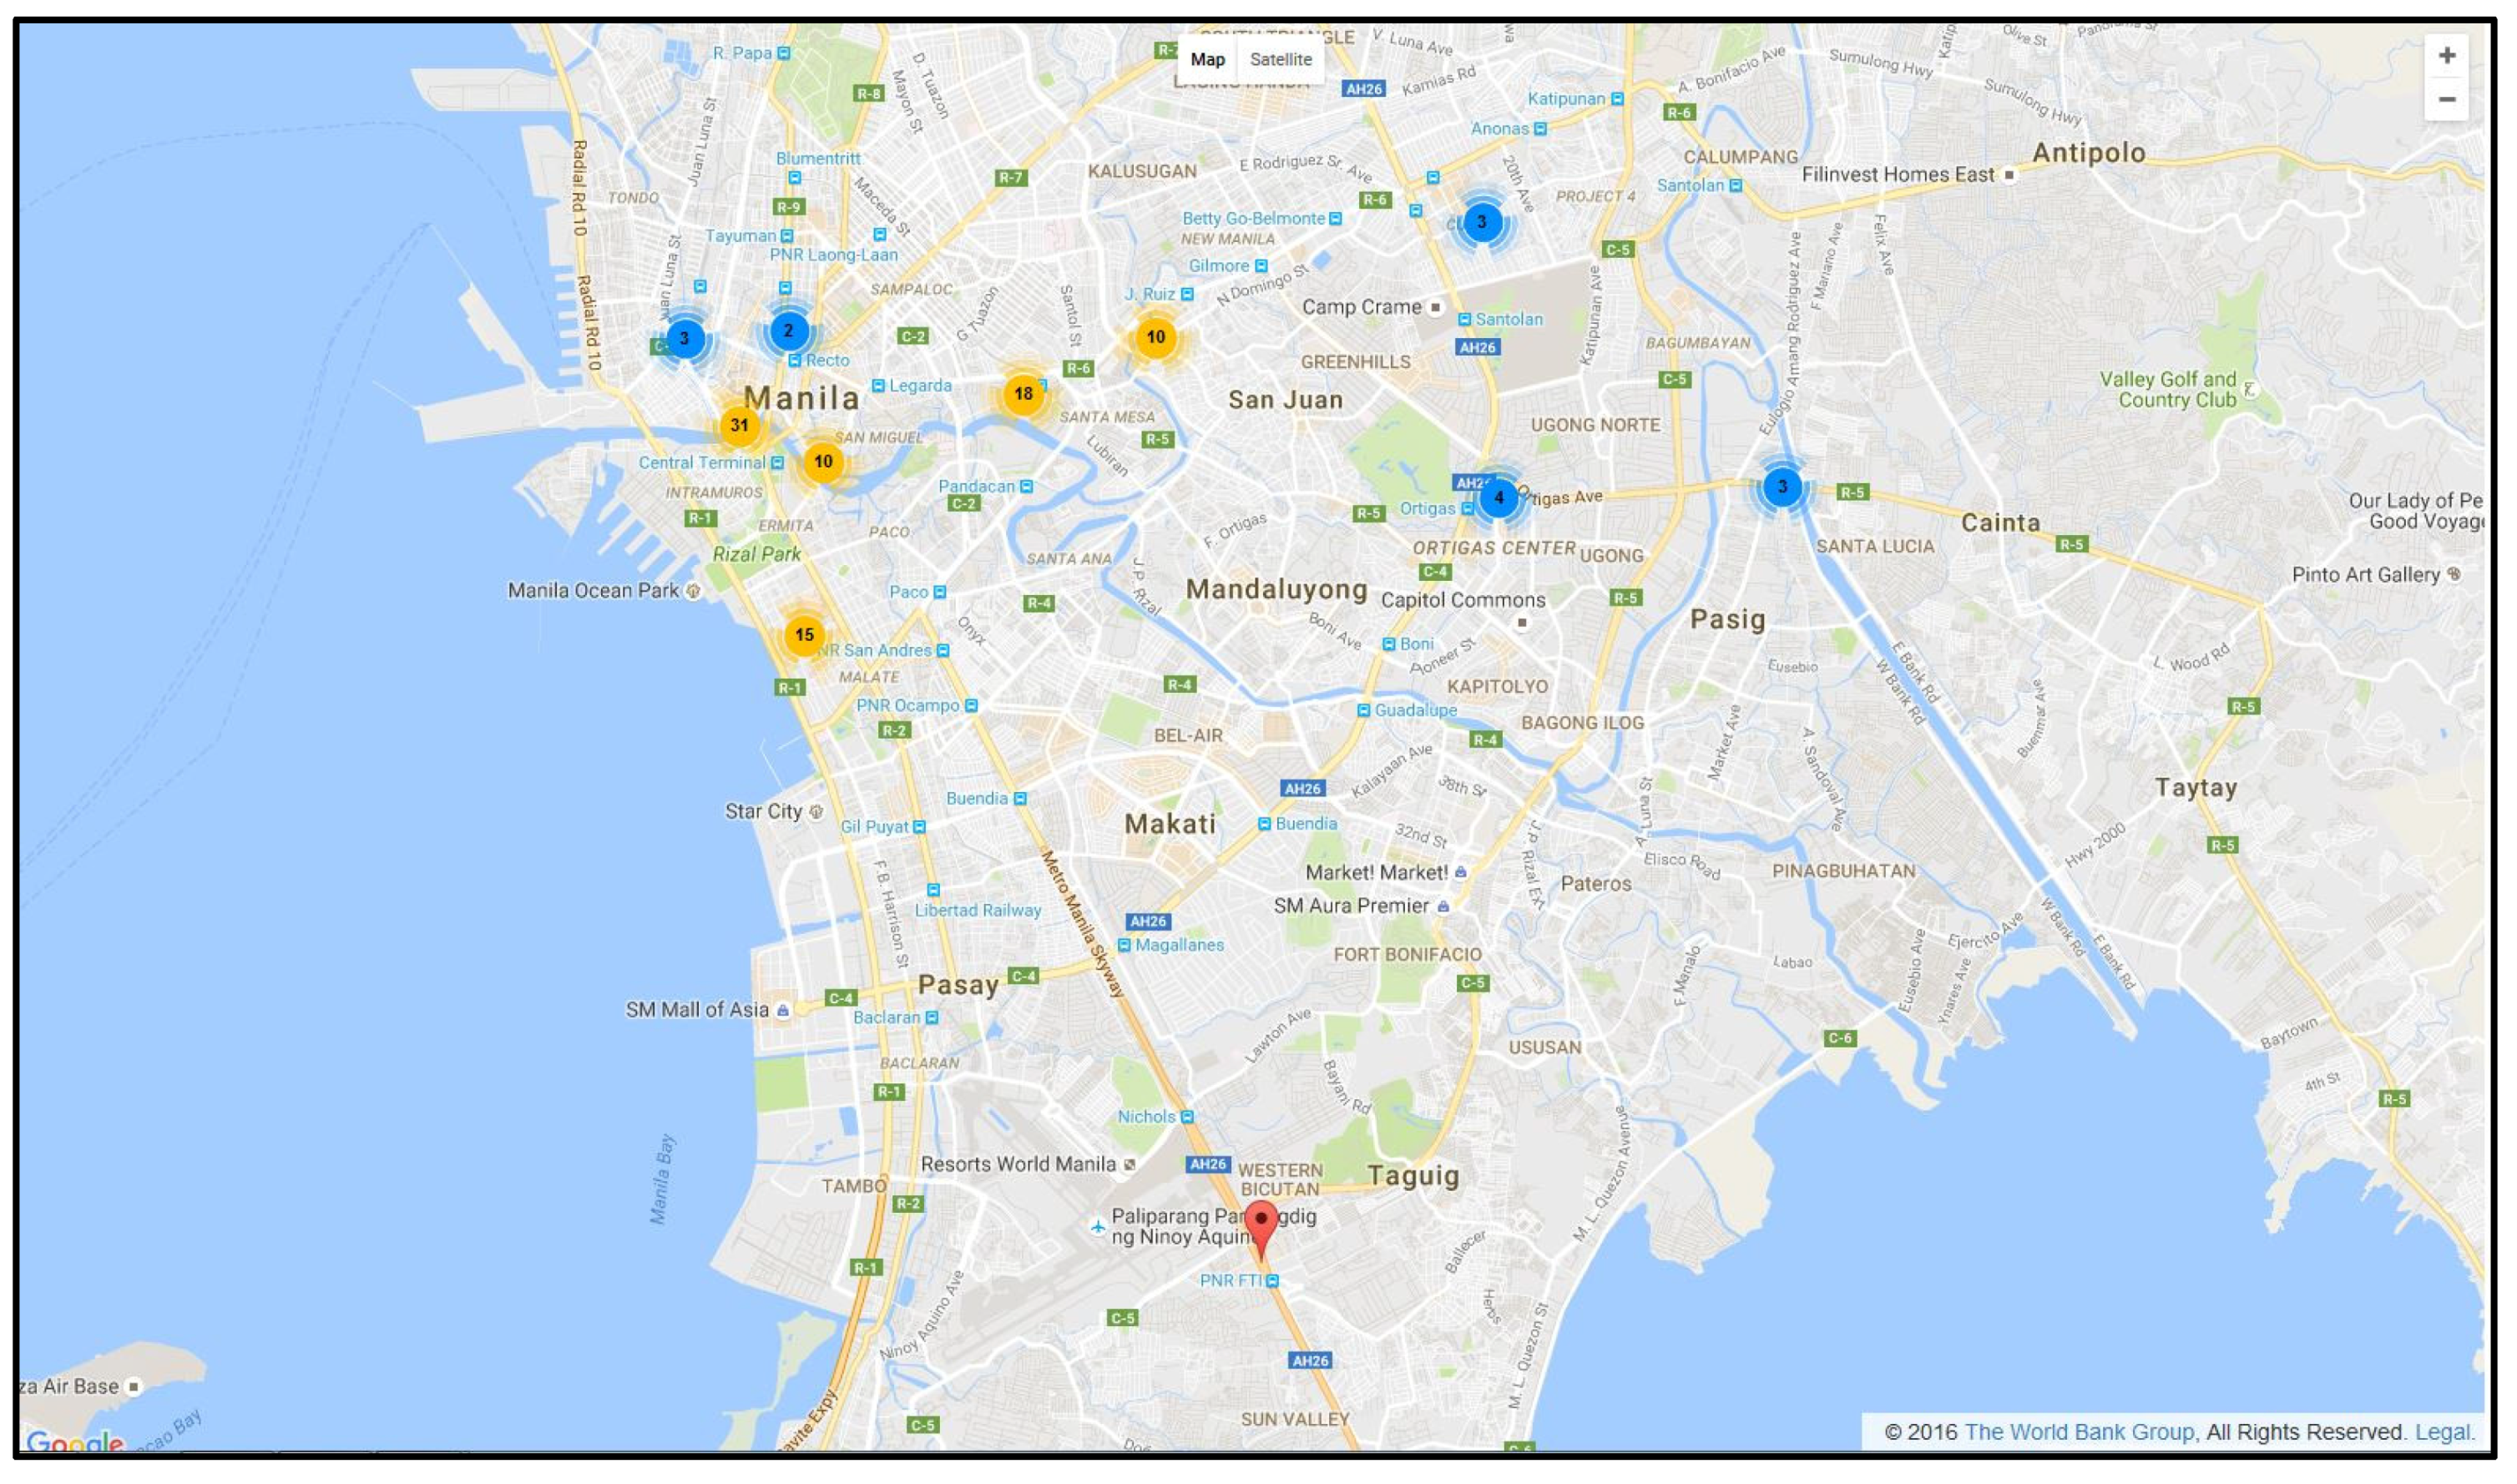
As it was mentioned earlier, traditionally mail surveys and phone or face-to-face interviews are used in survey administration. Each of these survey techniques has its positive and negative sides. In the context of a developing country, the first two methods are difficult to implement in terms of coverage (mail and landline phone) and speed of the service (mail). Among the third technique of face-to-face interviewing up until recent times, majority of surveys were done by using traditional paper-and-pencil interview (PAPI) technique. However, with the rapid development of computer, data collection, and processing technologies, the internet coverage new survey method has been gaining popularity. This is computer-assisted personal interviewing (CAPI) technique, which is based on use of smartphones and tablets to collect the data and send them directly to the central server (Figure 2). There are number of advantages that CAPI has over PAPI. First, CAPI greatly reduces timing of data collection—there is no need to print, distribute, and handle large amount of paper-based questionnaires. Second, CAPI improves data quality by possibility of check and review of each interview (GPS location as well, Figure 3) in real-time mode. Third, it reduces data entry costs. The free CAPI software “Survey Solutions” developed by the World Bank has been used in this study [17].
During the two pretest surveys, both PAPI and CAPI methods of questionnaire administration were used. Those pretest surveys proved our assumption that CAPI method allows faster and more reliable data collection and administration. Special training session on CAPI protocol was held for surveyors where they were trained in techniques of using smartphones and tablets for the survey purposes. During the interview process, the administrator could check on real-time mode the location (GPS) of ongoing surveys and how it was going in terms of respondents answers, and could produce basic daily statistics. This greatly improved whole survey process and accelerated data processing. Local surveyors were impressed by the capabilities of such an approach and expressed willingness to employ CAPI in their future social surveys.
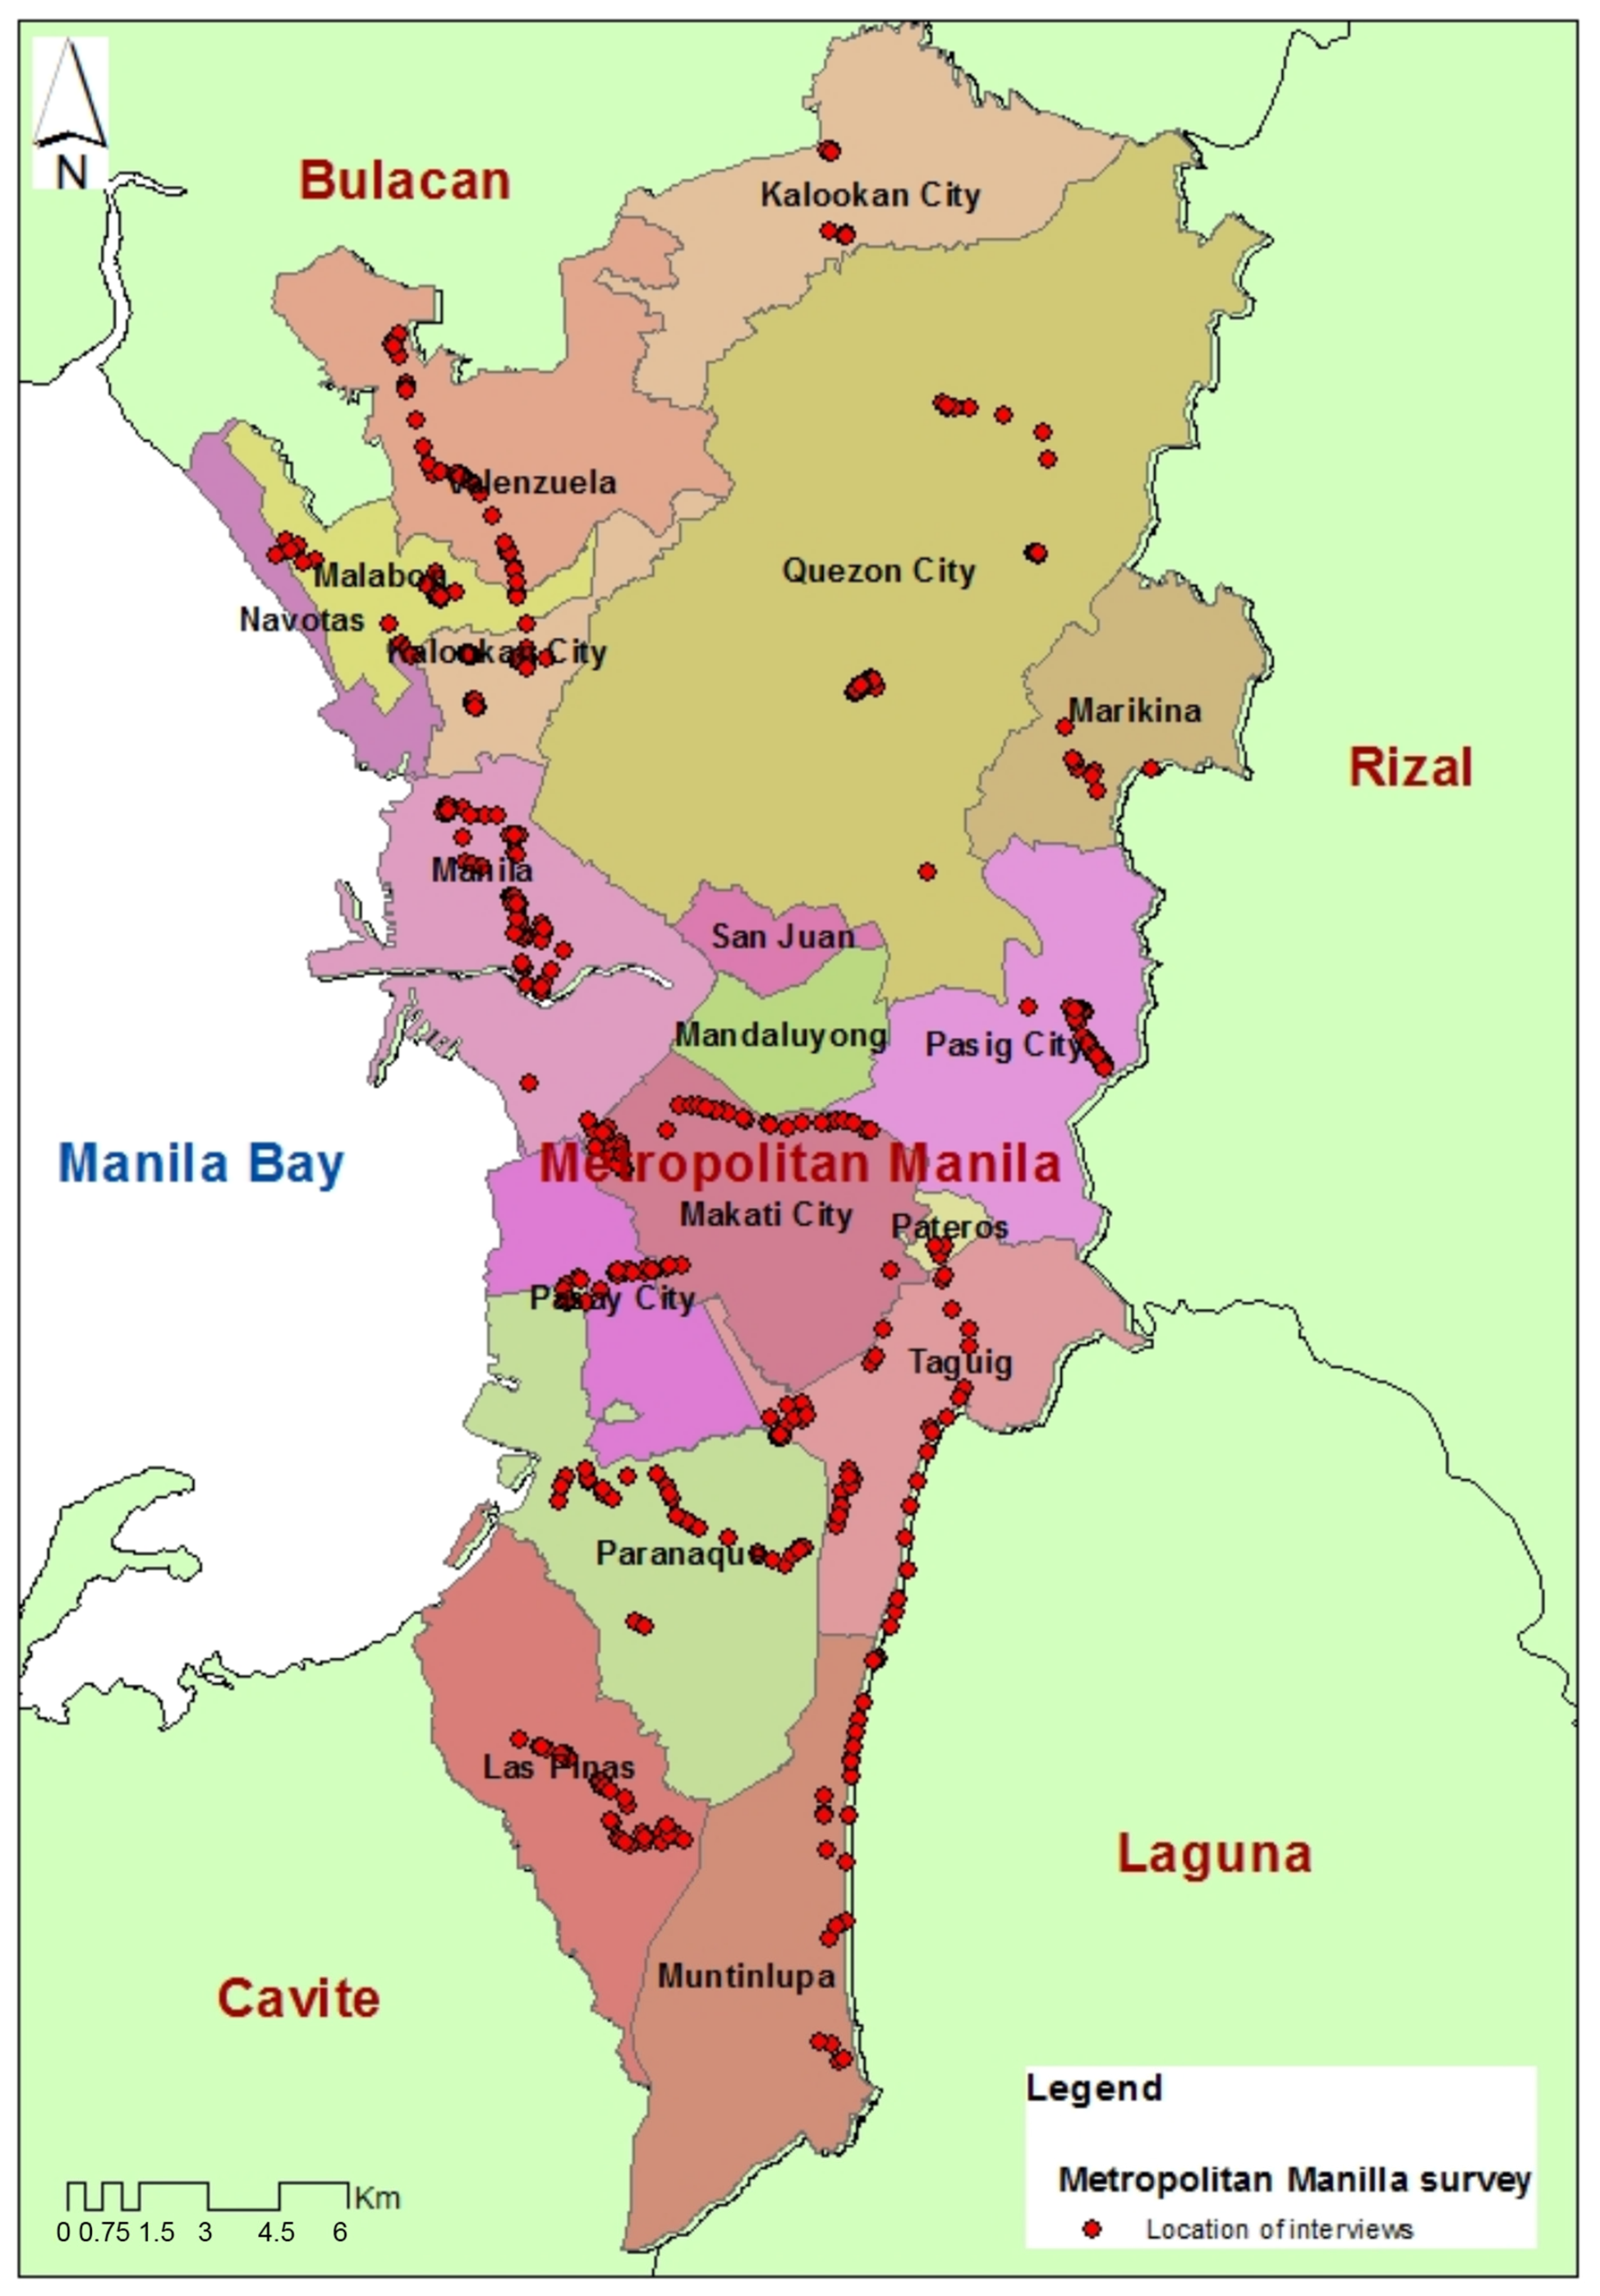
The developed questionnaire was pretested before starting the main survey; 40 respondents in two cities, Quezon and Manila, were chosen for this exercise. The objective of the task was to check whether the questionnaire was logical and consistent, and if the WTP questions were understood correctly. The main survey involved a total of 240 personal interviews that were conducted in the month of June 2016 in Metro Manila. We could not secure voters’ list from the local government and did not want to use telephone book to compile sampling for the survey, as it does not cover the entire area of the megacity. Facing this challenge, the random sampling based on the distance of household location to the nearest waterbody was chosen. There are two classifications: (1) walking distance to the river, which assumes that within 30 min one can reach the Pasig River, and (2) need to drive or take public transportation to enjoy the river. Figure 3 and Figure 4 show interview locations in some target areas in Metro Manila.
SAS statistical package was used for the analysis. The possible effect of socio-economic variables on WTP was analysed by linear regression and tobit models. Theoretically, the tobit (censored regression) model was better to use to analyze the data, as the OLS estimates could be biased (because the range of dependent variable is limited, WTP ≥ 0). The estimation of the model is usually undertaken by maximum likelihood techniques [18,19].
3. Results
3.1. Overview
There is clear interest in the improvements of the surface water quality in Manila waterbodies by those who placed monetary value on the improvement—71% of the respondents (n = 170) indicated a willingness to support the proposed Surface Water Quality Improvement Program in Metro Manila. Among the 29% of the participants (n = 70) who voted against the proposed action plan, the most common answers were “Do not want to place monetary value” and “Objected to way question was presented”. These were considered as protest (zero) answers in addition to true WTP = 0 and excluded from further analysis. The maximum threshold of 5% of the income level was selected to accept stated WTP. The GPS location of each survey has also been transferred into ArcGIS software (Figure 4). Due to proximity of surveys’ location and geographic scale, a number of surveys could have been looked on as combined.
The vast majority of the survey participants (84%) have visited or seen the city’s river/lake/canal in the last month. Among them 45% went regularly, 34% went a few times, 6% went once, and 15% preferred not to answer this question. The majority of respondents (86%) answered that the water quality of the city’s waterbodies is not sufficiently acceptable for recreational activities, 12% stated otherwise (that water quality is sufficient), and 2% did not know whether or not the water quality was sufficient.
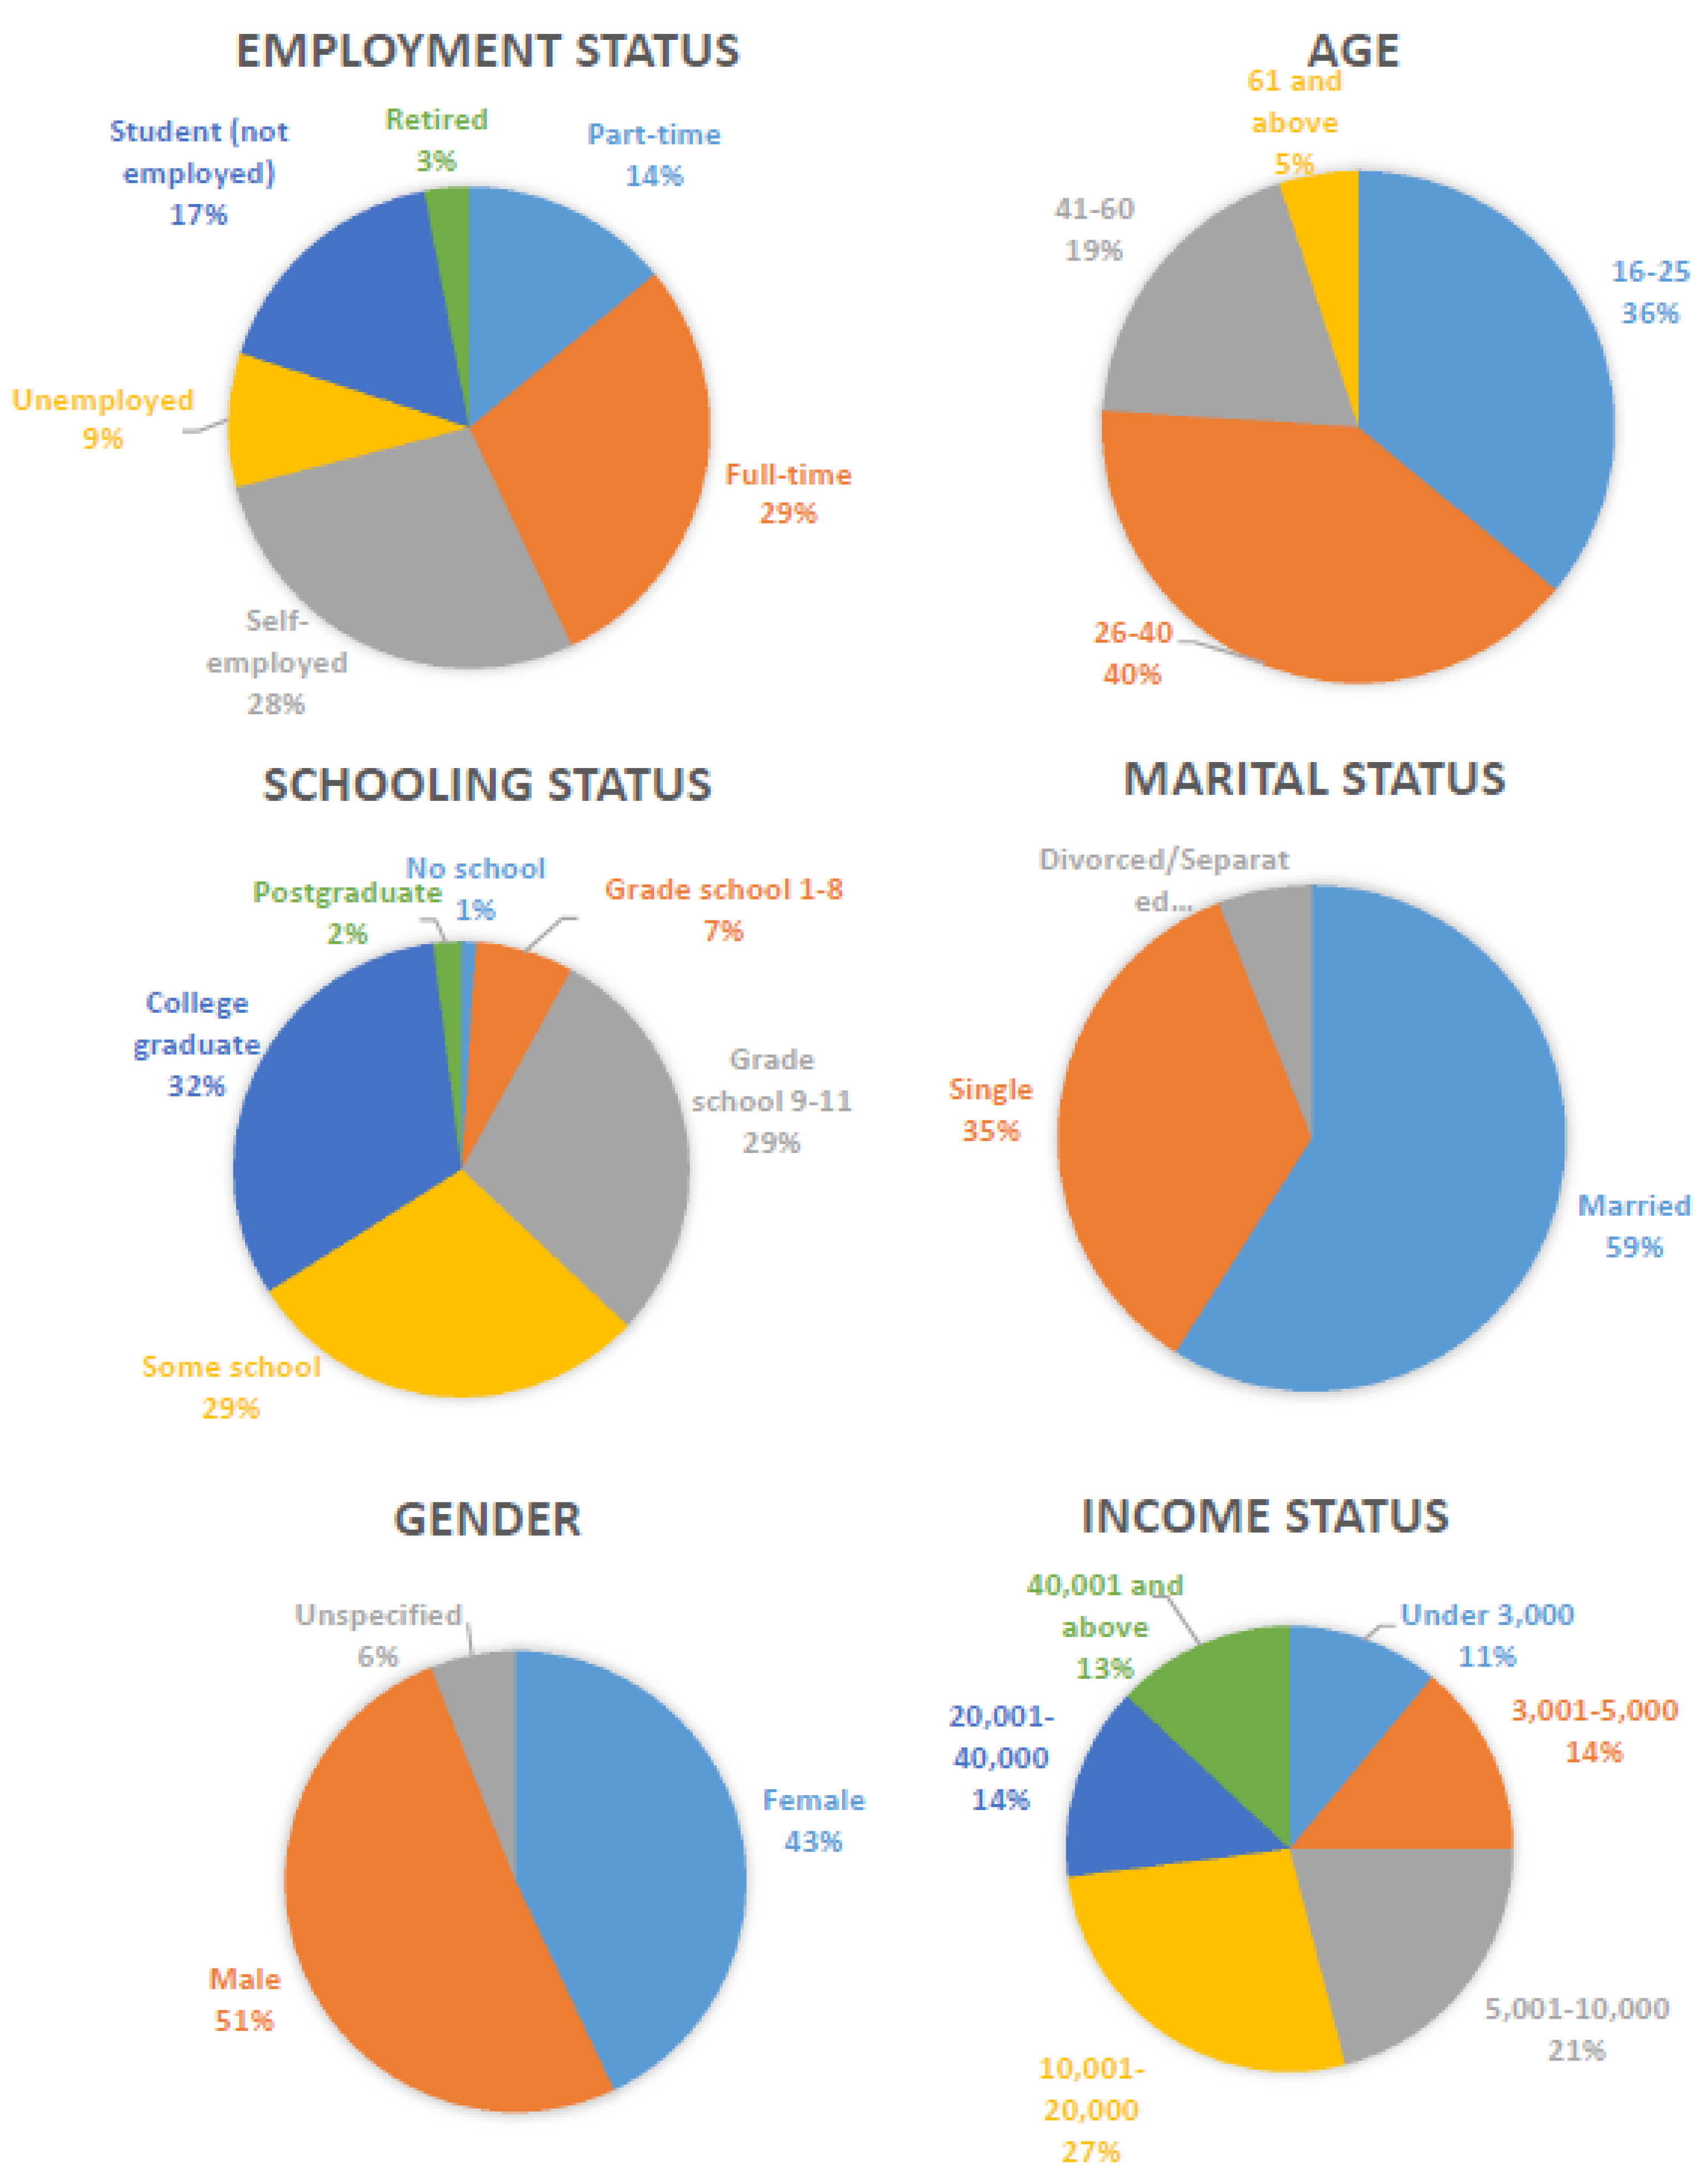
Socio-economic data of respondents are given in Figure 5. As seen from the figure, socio-economic backgrounds of the respondents are representative. The employment status shows that most of the survey participants are occupied with a full-time job (29%) or self-employed (28%). Only 9% of them are unemployed, and 17% are non-working students. Most of the interviewed individuals are educated people—only 1% of respondents had not attended any form of school.
Male respondents form the majority in our survey (51%), followed by female (43%) and unspecified (6%). Middle-aged people dominate the survey (40%), while 36% were represented by the younger generation (below 25 years old), and only 5% were elderly people (61 and over). More than a half of all respondents were married, one-third were single, and only 6% were divorced or separated.
Income levels vary widely among survey participants. In fact, the Philippines has the highest Gini coefficient (inequality ratio) among region countries, which means a greater rate of inequality compared to other Southeast Asian countries. While 11% of respondents belong to the poorest part who live for USD2 a day (USD1 = PHP47.03), 14% receive a monthly income of USD850 or higher.
3.2. Data Validation
The data was tested and found to be statistically representative of the country’s population. As the data was based on random sampling there is need to validate obtained demographic data against available demographic data on the Philippines’ population. This was done by comparing five demographic parameters—gender, age distribution, household size, income, and education (Table 2). Comparison of demographic data given by the 2011 Philippine Demographic Yearbook [20] indicated some differences: (1) household size—our is higher that the country average 5.3 against 4.6; (2) gender ratio—our 46% females and 54% males against 49% and 51% accordingly; (3) population structure—Philippines has relatively young population and the median age of the country’s population is 23.4 years, which means that half of the household population was younger than 23.4 years; age of majority of our respondents was in the interval of 26–40; (4) Data on the level of education and poverty show some discrepancies. It should be noted that it is quite challenging to match official demographic parameters in a small sample, especially when the study cannot secure voters’ list or any other data source. While these minor precision errors hardly could have changed or have impacted the final WTP estimates, only age structure discrepancy could have had some effect, which will be discussed in subsequent section.
3.3. WTP and Economic Value of Water Quality Improvement
Again, majority of the respondents were willing to pay for water quality improvement in the city’s waterbodies. The number of positive bids reached 71%, which is a rather high number. A small share of the respondents (7%) stated their true value as zero. The amount of protest responses was close to 20%. The main motives for true zero WTP were either living far from the closest waterbody or economic reasons.
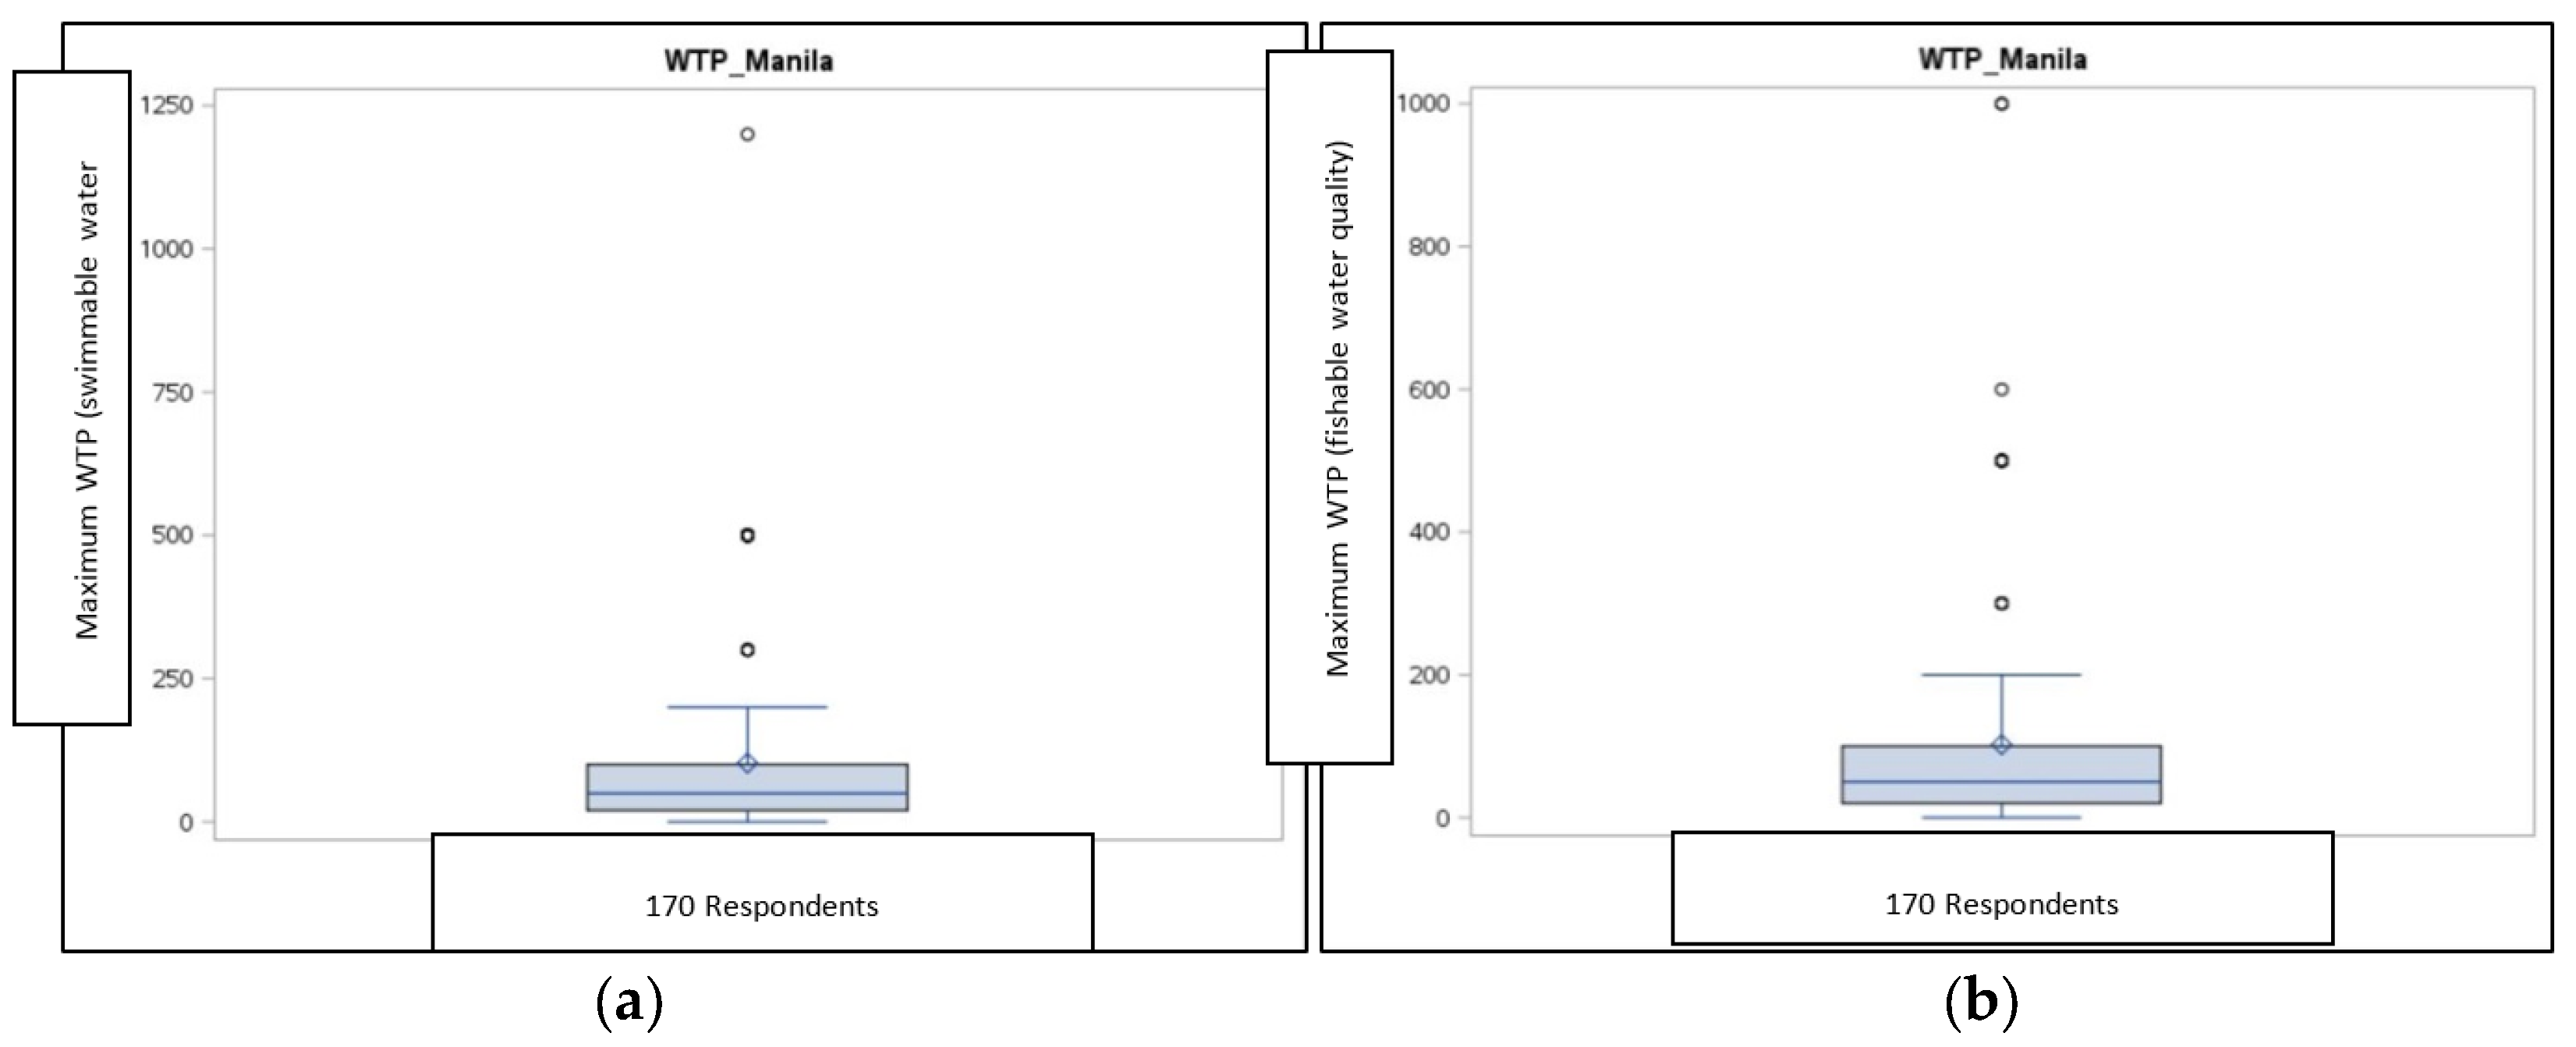
The willingness to pay for swimmable water quality (which is a higher water quality) ranged between zero and PHP1200 (USD25.52) per person per month, with the average rate for implementing the proposed program being equal to PHP102.44 (USD2.17). The WTP for fishable water quality was between zero and PHP1000 (USD21.27) per month, with an average of PHP102.39 (USD2.17). Summary statistics for both WTP values are presented in Table 3.
Indeed, they are very close estimates and there is almost no difference between these two WTP values. We see two reasons that might explain this phenomenon. Firstly, the city’s residents do not see any difference between these water qualities because current water quality in urban waterbodies is very bad. People simply do not believe that water quality could be significantly improved and pollution prevented. Secondly, people see more benefits from fishing than from swimming for exercise. Swimming is prohibited in the city’s waterbodies, but people are still enjoying open waters. It seems that residents simply prioritize their source of income (to catch and sell fish) over the condition of their health, which could significantly have been altered due to swimming in polluted waters.
It would be interesting to see change in WTP if the survey had included a section on a person’s willingness to pay for improved water quality as a function of reducing their neighbors (or their community’s) risk of waterborne epidemics (e.g., “even if my neighbor does not want to pay for improved water quality, I am willing to pay more so that they don’t contract an infectious disease thereby protecting our community”). However, based on the workshop that preceded the actual survey, it could be speculated that there hardly could be a significant change. The reason is that workshop attendants who live far from waterbodies resisted paying for water quality improvement, saying that their houses are located far away and they do not pollute the particular waterbody in question. They insisted that households that live on water banks and pollute them are responsible for cleaning them and consequently should pay for that.
The box plots shown in Figure 6a,b further illustrate the above-mentioned results and identify outliers (PHP300 and PHP500 for swimmable; PHP300, PHP500, PHP600 for fishable) and “extreme values” (PHP1200 for swimmable; PHP1000 for fishable) within the data.
Within the over-arching question of how much people are willing to pay for improved water quality in their city, it has been explored whether willingness to pay varies with characteristics such as employment, schooling, gender, age, marital status, household size and income, perceptions of water quality impact on peoples’ health, and peoples’ concerns over water quality in city’s waterbodies. Two major factors were influencing use- and non-use of WTP for both water quality scenarios (these are income and marital status (Table 4)). As expected, residents’ WTP increases with increase of their income, and married people were willing pay more than single or divorced/separated people. This is because married couples usually are more concerned about the health of their relatives (e.g., current/future children/grandchildren) than single persons. Further, married couples often bring two incomes into a household, providing married households with more money than single households. This was obvious from the workshops that preceded the actual survey—married people were more active in discussions and debates and expressed concern regarding water pollution directly or indirectly affecting their families. Additionally, many people whose houses were located relatively far from the nearest waterbody seemed skeptical about paying for a WTP system (“why I should pay if I live far and don’t pollute water”), and results did not show any significant effect of the variable “distance to waterbody”. Table 4 shows only variables that had significant effects on two WTP estimates.
While age structure did not have significant effect on WTP estimates, there is a belief that if the age in the obtained sample would have replicated official demographic data the WTP estimates could have been higher. As can be seen in Table 2, the study’s sample age is higher than official data. Thus, there is reason to believe that if the study’s sample age could be lower, the WTP could have been higher. The reason that the overall population would be willing to pay more for wastewater treatment is that environmental awareness among younger people is more elevated as compared to older people. This happens due to educational programs conducted at schools and universities. This recommendation is consistent with United National University’s policy brief for local decision-makers in 2016 “Young generations should be engaged as agents for change—local education authorities in each country should introduce school curriculums focusing on health, hygiene, and environmental resources. This may be a slow process, but if older generations do not take the initiative by teaching the importance of protecting natural resources, school systems should make this a priority” [21] (p. 4).
The total benefits for Metro Manila can be estimated from the average WTPs for two categories of water quality (PHP102.44 and PHP102.39). The total population of Metro Manila aged 15–60 in 2011 is 7.685 million (PSA, 2011), which implies that the value of the potential total benefits received from improved water quality implied by a given scenario may be within the limits of PHP9443 billion to PHP9447 billion (USD190 million) per year.
4. Discussion and Policy Implications
Every research is valuable if it sheds light, brings new insights to an existing problem, and, finally, contributes to a policy debate. It is extremely valuable if the research can help find a solution to the problem by offering clear and feasible policy recommendations. That was a preliminary idea for this empirical study as well.
There are three ways of using the CVM surveys’ results in policy-making: they could be used to contribute and simulate public awareness of potential monetary benefits of the surface water quality improvement, to influence and help to develop new policies through cost-benefit analysis, and to justify existing decisions in urban water management and decision-making. However, the extent, coverage, and goal of the use of CVM results in urban water management planning and policy-making varies across countries. For instance, monetary valuation is widely used to assess possible ex-ante and ex-post outcomes of environment-related policies in USA, Australia, UK, while this is not the case in many developing countries.
The key factor determining financial feasibility of a water infrastructure is a consumer’s willingness to pay sufficiently higher than user charges to cover infrastructure costs. Therefore, next there is a need to conduct cost analysis of proposed water infrastructure developments (i.e., building new wastewater treatment plants and expansion of sewerage system) that were presented in CVM scenario. Putting both these estimates together will allow us to answer the following question: Will estimated benefits of water quality improvement be enough to cover costs of those infrastructures? Therefore, we did a quick comparison between costs that needed to upgrade and improve wastewater facilities and sewerage connection in Metro Manila with the obtained WTP and calculated total economic benefits. Of course, this is not a full-scale benefit-cost analysis, but even a quick look can reveal some differences between costs and benefits that are described in below paragraph.
Philippines is to achieve its universal access to safe and adequate sanitary facilities by 2025 (100% urban sanitation coverage) [22]. The World Bank estimated that USD514 million per year in capital expenditure is required for the country to meet its targets by 2025 [22]. The World Bank expects anticipated investments to come from households (USD194 million per year) and other domestic stakeholders (USD302 million per year) [22]. The Section 2 of the same report indicates that there is a need for another USD100 million per year to cover operations and maintenance expenditures [22]. However, it should be noted that these numbers imply expenditures required to upgrade sanitation facilities in urban area all over the Philippines. As far as Metro Manila is concerned, the report acknowledged that “…the bulk of the investment will be in Metro Manila and nearby urban areas: nearly USD288 million (95%) of the USD302 million per year that is contributed by (other) domestic stakeholders are from the projected expenditures of Manila Water and Maynilad” [22] (p. 23).
Thus, based on World Bank’s estimate (USD288 million per year) and obtained total economic benefits of USD190 million per year, we can conclude that benefits could cover approximately 66% of capital expenditures needed to build new and to upgrade existing wastewater infrastructures in Metro Manila. However, this result should be interpreted with caution. Firstly, there is no assurance that households are going to spend USD190 million per year. Hence, the estimated surplus in the sector could easily become a deficit. Secondly, the charges set must take into account both willingness and ability to pay. Moreover, in almost no cases in either the developed or developing countries have direct user charges actually been high enough to cover all capital and operating costs of wastewater infrastructure. Most countries provide subsidies from the national and local government budgets.
5. Conclusions and Future Plans
Recent years have been marked by growing concerns about water pollution in urban waterbodies of fast growing Southeastern Asian countries. Many countries have adopted water quality standards for surface waterbodies and have strengthened pollution control and upgraded enforcement mechanisms. However, the implementation of these measures imposes a real cost on society and government in terms of cost of treatment, mitigation, and compensation. This paper focused on exploring the economics of improved water quality, specifically in Metro Manila, Philippines.
To evaluate the benefits of water quality improvement, this paper has focused on presenting findings concerning individual preferences of Metro Manila residents, expressed in terms of willingness to pay to achieve two different water quality standards. Results from the contingent valuation study show positive financial support for an action plan that would help to improve water quality in the city’s waterbodies.
The evidence presented suggests that WTP for swimmable water quality is PHP102.44 and WTP for fishable water quality is PHP102.39. Based on these values, Metro Manila has potential total benefits of improved water quality between PHP9443 billion to PHP9447 billion per year, which translate into USD190 million per year. This estimation could help policy-makers in planning and promoting new and/or upgrading existing wastewater treatment plants in the megacity. To prevent further deterioration of Metro Manila’s waterbodies and improve the overall environmental situation in the city, policy-makers should improve people’s understanding and awareness of the environmental issues facing the area through school programs and public information campaigns.
While this study is informative about the potential for raising funds from the megacity’s residents, the results are merely indicative. For policy planning purposes, it would be desirable and advisable to replicate the study with larger samples in multiple destinations to better understand the drivers of demand for surface water quality improvement in Metro Manila waterbodies and the feasibility of raising utility fees to achieve the goal of clean water environment in the megacity.
Acknowledgments
The author extends his gratitude to the Japan Society for the Promotion of Science (JSPS) (Fellowship #P15764) and Low Carbon Urban Water Environment Project of UNU-IAS for the provision of funding for this research.
Conflicts of Interest
The author declares no conflict of interest.
Appendix A
Scenario Presented in the Survey on Water Quality Improvement in Metro Manila, Philippines
The Metro Manila cities are considering a new program that will further improve the quality of water of the city’s waterbodies. However, the cities do not have sufficient funds to undertake the planned programs. Therefore, it is seeking private investments to collect necessary funds to implement the program. The only way the water quality is improved in the cities is if you and others will pay. This will allow you (and members of your family) to enjoy better quality water in the city’s waterbodies. If a majority of people favor the new programs it will be paid for by increasing the amount each household, and business will pay for their monthly water and sewer bill. If you do not currently receive a water and sewer bill (e.g., you rent your home or your house is on a septic system), you will receive a separate monthly bill for this program. All of the funds collected will be used to implement and enforce the Surface Water Quality Improvement Program in Metro Manila. The Program will consist of:
- Building new wastewater treatment plant
- Expansion of existing city’s sewerage system
Implementation of the Water Quality Improvement Program in Metro Manila would start next year and be phased in over 10 years. By 2030 the city’s sewerage system will cover 80% of the city’s area, and planned wastewater treatment plants will treat collected wastewater. This will allow not only the avoidance of pollution of the waterbodies, but it will also keep good water quality in Manila Bay and Laguna Lake. The costs of the program will be shared between households, businesses, and industry in proportion to their share of total sewerage discharge. We now want to ask you a few questions about how much an improvement in water quality is worth to you. To help you answer these questions, see the photo and descriptions associated with that particular water quality, which are shown below.
References
- WEPA (Water Environment Partnership in Asia). 2017. Available online: http://wepa-db.net/3rd/en/index.html (accessed on 14 June 2017).
- World Bank. Philippines Environmental Monitor. 2003. Available online: http://documents.worldbank.org/curated/en/144581468776089600/pdf/282970PH0Environment0monitor.pdf (accessed on 14 June 2017).
- Palanca-Tan, R. Knowledge, attitudes, and willingness to pay for domestic sewerage and sanitation services: A contingent valuation survey in Metro Manila. In Proceedings of the International Symposium on Southeast Asian Water Environment, Hanoi, Vietnam, 8–10 November 2012; Volume 10. Part I. [Google Scholar]
- Rappler News. Metro Creeks: Less Trash, but Water Quality Not Improving. Available online: http://www.rappler.com/science-nature/environment/70065-metro-manila-creeks-rivers-water-pollution (accessed on 23 February 2016).
- World Bank. Economic Impacts of Sanitation in Southeast Asia: A Four-Country Study Conducted in Cambodia, Indonesai, the Philippines and Vietnam under the Economics of Sanitation Initiative (ESI); Research Report; World Bank: Washington, DC, USA, 2008; p. 149. [Google Scholar]
- UNU-IAS. Low Carbon Urban Water Environment Project—Case Study in the Philippines; Draft Final Report; UNU: Shibuya, Tokyo, 2015. [Google Scholar]
- Venkatachalam, L. The contingent valuation method: A review. Environ. Impact Assess. Rev. 2004, 24, 89–124. [Google Scholar] [CrossRef]
- Hanemann, W.M. Valuing the environment through contingent valuation. J. Econ. Perspect. 1994, 8, 19–43. [Google Scholar] [CrossRef]
- Loomis, J.B. Expanding contingent value sample estimates to aggregate benefit estimates: Current practices and proposed solutions. Land Econ. 1987, 63, 396–402. [Google Scholar] [CrossRef]
- Bateman, I.J.; Carson, R.T.; Day, B.; Hanemann, M.W.; Hanley, N.; Hett, T. Economic Valuation with Stated Preference Techniques: A Manual; Edward Elgar: Cheltenham, UK, 2002. [Google Scholar]
- Mitchell, R.C.; Carson, R.T. Using Surveys to Value Public Goods: The Contingent Valuation Method; Resources for the Future: Washington, DC, USA, 1993; p. 453. [Google Scholar]
- Nelson, M.N.; Loomis, J.B.; Jakus, P.M.; Kealy, M.J.; von Stackelburg, N.; Ostermiller, J. Linking ecological data and economics to estimate the total economic value of improving water quality by reducing nutrients. Ecol. Econ. 2015, 118, 1–9. [Google Scholar] [CrossRef]
- Van Houtven, G.; Mansfield, C.; Phaneuf, D.J.; von Haefen, R.; Milstead, B.; Kenney, M.A.; Reckhow, K.H. Combining expert elicitation and stated preference methods to value ecosystem services from improved lake water quality. Ecol. Econ. 2014, 99, 40–52. [Google Scholar] [CrossRef]
- Atkins, J.P.; Burdon, D. An initial economic evaluation of water quality improvements in the Randers Fjord, Denmark. Mar. Pollut. Bull. 2006, 53, 195–204. [Google Scholar] [CrossRef] [PubMed]
- Kramer, R.A.; Eisen-Hecht, J.I. Estimating the economic value of water quality protection in the Catawba River basin. Water Resour. Res. 2002, 38, 1–10. [Google Scholar] [CrossRef]
- Environmental Management Bureau. National Water Quality Status Report 2006–2013; Visayas Avenue, Quezon City; Department of Environment and Natural Resources—Environmental Management Bureau: Metro Manila, Philippines, 2014; p. 76.
- World Bank. Computer-Assisted Personal Interviewing. Available online: http://web.worldbank.org/WBSITE/EXTERNAL/EXTDEC/EXTRESEARCH/EXTPROGRAMS/EXTCOMPTOOLS/0,,contentMDK:23426734~pagePK:64168182~piPK:64168060~theSitePK:8213597,00.html (accessed on 15 May 2016).
- Maddala, G.S. Limited-Dependent and Qualitative Variables in Econometrics; Cambridge University Press: Cambridge, UK, 1983; p. 401. [Google Scholar]
- Kennedy, P. A Guide to Econometrics, 3rd ed.; The MIT Press: Cambridge, MA, USA, 1992; p. 409. [Google Scholar]
- PSA (Philippine Statistics Authority). Philippine Yearbook; Demography; PSA: Quezon City, Philippines, 2011; p. 77. Available online: https://psa.gov.ph/ (accessed on 5 June 2017).
- Jalilov, S.-M. Sustainable Urban Water Environments in Southeast Asia: Addressing the Pollution of Urban Waterbodies in Indonesia, the Philippines, and Viet Nam, United Nations University Institute for the Advanced Study of Sustainability. 2016. Available online: http://collections.unu.edu/view/UNU:5796#viewAttachments (accessed on 12 November 2017).
- Water Supply and Sanitation in the Philippines: Turning Finance into Services for the Future; Service Delivery Assessment, Water and Sanitation Program; World Bank: Washington, DC, USA, 2015; p. 90.
Figure 1.
Metro Manila waterbodies. Source: [6].
Figure 1.
Metro Manila waterbodies. Source: [6].
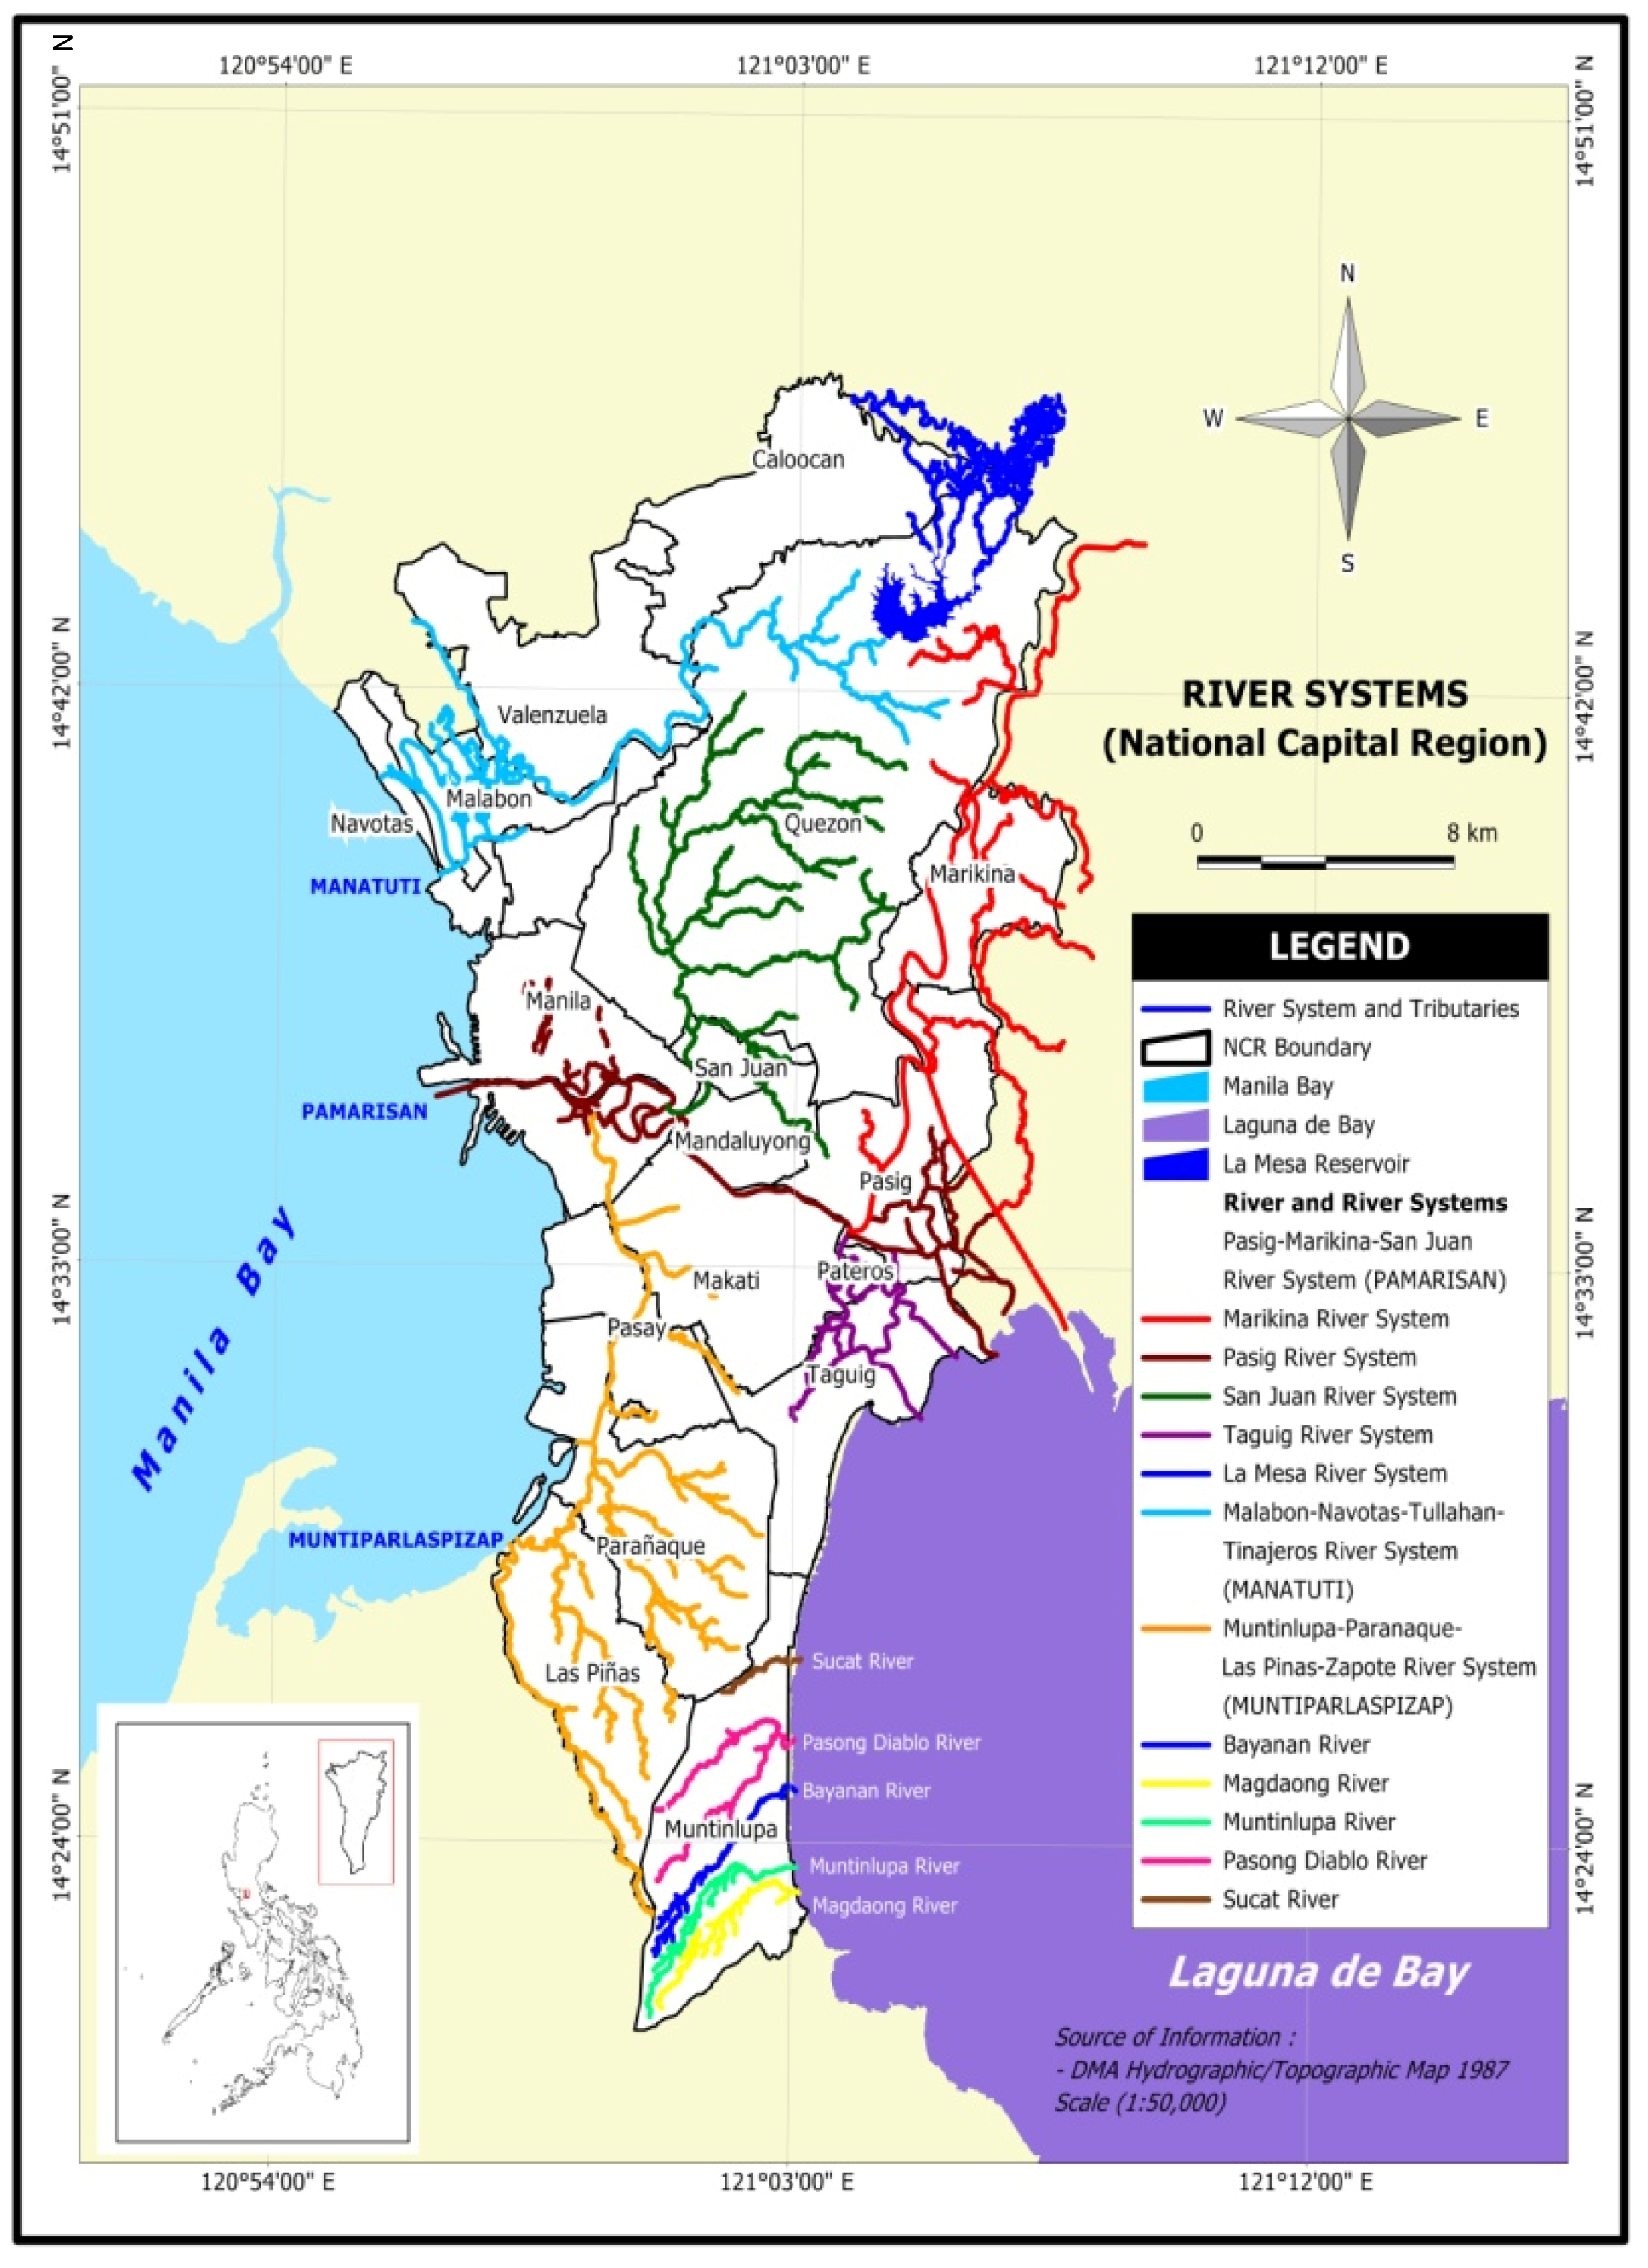
Figure 2.
Survey Solutions interface on smartphone view. There are four sections: (a) respondent’s profile (awareness and behavioral questions); (b) WTP section; (c) respondent’s background data; and (d) location, time, and comments from a respondent.
Figure 2.
Survey Solutions interface on smartphone view. There are four sections: (a) respondent’s profile (awareness and behavioral questions); (b) WTP section; (c) respondent’s background data; and (d) location, time, and comments from a respondent.

Figure 3.
Interview GPS locations in Metro Manila. Map does not represents all points due to the technical issues (device battery discharge, low GPS signal in some areas) (“Survey Solutions” interface).
Figure 3.
Interview GPS locations in Metro Manila. Map does not represents all points due to the technical issues (device battery discharge, low GPS signal in some areas) (“Survey Solutions” interface).

Figure 4.
Interview locations in Metro Manila.

Figure 5.
Socio-economic data of the sample.

Figure 6.
Box plot: (a) WTP “swimmable” quality; (b) WTP “fishable” quality.


Table 1.
Water quality classification of inland surface waterbodies in the Philippines.
| Classification | Description |
|---|---|
| Class AA | Public Water Supply Class I. Intended primarily for waters having watersheds, which are uninhabited and otherwise protected, and which require only approved disinfection to meet the Philippine National Standards for Drinking Water (PNSDW) |
| Class A | Public Water Supply Class II. For sources of water supply that will require complete treatment (coagulation, sedimentation, filtration, and disinfection) to meet the PNSDW |
| Class B | Recreational Water Class I. For primary contact recreation such as bathing, swimming, skin diving, etc. (particularly those designated for tourism purposes) |
| Class C | (1) Fishery Water for the propagation and growth of fish and other aquatic resources (2) Recreational Water Class II (boating, etc.) (3) Industrial Water Supply Class I (for manufacturing processes after treatment) |
| Class D | (1) For agriculture, irrigation, livestock watering, etc. (2) Industrial Water Supply Class II (e.g., cooling, etc.) (3) Other inland waters, by their quality, belong to this classification |
Source: [16].
Table 2.
Comparison of survey data with overall available statistics.
| Description | Survey Statistics | Philippines’ Statistics * |
|---|---|---|
| Household size | 5.3 | 4.6 |
| Gender | Females—46% | Females—49% |
| Males—54% | Males—51% | |
| Population structure | Median in interval 26–40 | Median—23.4 |
| Education | No school—1% | No school—2% |
| Grade school 1–8—7% | Grade school 1–8—11.7% | |
| Grade school 9–11—29% | Grade school 9–11—19.1% | |
| Some school—29% | Some school—54.4% | |
| College graduate—32% | College graduate—10.1% | |
| Postgraduate—2% | Postgraduate—2.7% | |
| Income | Extreme poverty—11% | Extreme poverty—5.7% |
| Poverty level—14% | Poverty level—16.5% |
* Source: [20].
Table 3.
Summary statistics of WTP values.
| Variable | N | Min | Max | Mean | StDev | Pr > |t| | Lower 95% CL for Mean | Upper 95% CL for Mean |
|---|---|---|---|---|---|---|---|---|
| WTP_Swim | 170 | 0 | 1200 | 102.44 | 156.39 | <0.0001 | 78.76 | 126.12 |
| WTP_Fish | 170 | 0 | 1000 | 102.39 | 156.35 | <0.0001 | 78.72 | 126.07 |
Table 4.
Estimated regression coefficients for four WTP estimates.
| Variable | WTP Swimmable | WTP Fishable |
|---|---|---|
| Intercept | 14.58 * | 15.12 * |
| Marital status | 7.91 * | 8.03 * |
| Income | 23.68 ** | 23.91 ** |
| R2 | 0.18 | 0.19 |
* and ** denote statistical significance at the 5% and 1% levels.
© 2017 by the author. Licensee MDPI, Basel, Switzerland. This article is an open access article distributed under the terms and conditions of the Creative Commons Attribution (CC BY) license (http://creativecommons.org/licenses/by/4.0/).
Share and Cite
MDPI and ACS Style
Jalilov, S.-M. Value of Clean Water Resources: Estimating the Water Quality Improvement in Metro Manila, Philippines. Resources 2018, 7, 1. https://doi.org/10.3390/resources7010001
AMA Style
Jalilov S-M. Value of Clean Water Resources: Estimating the Water Quality Improvement in Metro Manila, Philippines. Resources. 2018; 7(1):1. https://doi.org/10.3390/resources7010001
Chicago/Turabian StyleJalilov, Shokhrukh-Mirzo. 2018. "Value of Clean Water Resources: Estimating the Water Quality Improvement in Metro Manila, Philippines" Resources 7, no. 1: 1. https://doi.org/10.3390/resources7010001
Note that from the first issue of 2016, this journal uses article numbers instead of page numbers. See further details here.