Proposal of a Sustainable Circular Index for Manufacturing Companies


1
CEFAGE (Center for Advanced Studies in Management and Economics)—Department of Management and Economics, University of Beira Interior, 6201-001 Covilhã, Portugal
2
C-MAST (Centre for Aerospace Science and Technologies) and GOVCOPP (Governance, Competitiveness and Public Policies)—Department of Electromechanical Engineering, University of Beira Interior, 6201-001 Covilhã, Portugal
3
C-MAST (Centre for Aerospace Science and Technologies) and Department of Economics, Management, Industrial Engineering and Tourism, University of Aveiro, 3810-193 Aveiro, Portugal
*
Author to whom correspondence should be addressed.
Resources 2017, 6(4), 63; https://doi.org/10.3390/resources6040063
Submission received: 12 September 2017
/
Revised: 1 November 2017
/
Accepted: 8 November 2017
/
Published: 10 November 2017
(This article belongs to the Special Issue Sustainability Indicators for Environment Management)
Abstract
:Recently the circular economy has increasingly received attention worldwide due to the recognition that the security of the supply of resources and environmental sustainability are crucial for the prosperity of all the countries and businesses. G20 countries are stimulating the development of frameworks that enhance the circular economy and generally more sustainable production and consumption modes. In this context, this paper aims to suggest an index to assess the sustainability and the circularity of manufacturing companies. With this tenet, a Sustainable Circular Index (SCI) is proposed based on a five-phase framework. This index could support managers in assessing their level of sustainability and circularity and in implementing some practices that could improve the performances of their companies regarding these two topics. This index represents an important benchmarking tool for manufacturing companies to assess their sustainable and circular behavior and represents a guideline for managers.
1. Introduction
The current model of economic development known as ‘take, make and dispose’ [1] is based on the exploitation of virgin raw materials and energy, which are fundamental for the development of world economies. However, this linear approach to production and consumption, where natural resources give rise to manufactured goods, is reaching its limits. In this model of unidirectional development, all attention is focused on the economic value of the products, while factors such as the scarcity of natural resources and excess waste and environmental pollution are neglected. The increasing pace of climate change, caused mainly by rising greenhouse gas emissions, has also contributed to the complex relationship between economic growth and environmental degradation [2].
A set of factors is forcing companies to develop strategies that integrate economic growth and sustainability by promoting new practices and awareness at both individual and institutional levels to ensure that societies and nations commitment to a more sustainable world. These factors are: addressing the increasing challenges of climate change, population growth, resource scarcity, dependence on fossil fuels, insecurity in government regulations, high competitiveness, and global markets expansion.
In this context, a sustainable development approach has been growing in recent years, mainly due to the positive experience of countries such as Germany [3], Japan, and China [4]. The Circular Economy (EC) focuses on value maximization through the reduction or even mitigation of waste and on operating in cycles instead of chains. This development model enables the reintegration of materials into production processes through their reuse, recycling, and recovery. The growth of the CE is a consequence of the actual policy of economic development, where only a small percentage of the products’ value is used. Thus, accelerating the transition to a CE, where products, materials, and resources are kept in the economy for as long as possible, contributes to minimizing the generation of waste and represents an opportunity to transform the economy by creating new and more sustainable competitive advantages for companies [5]. There are many signs that this is the beginning of a new era in which scraps and wastes are considered opportunities for the start of new business models and for the greater sustainability of the planet and the well being of its population.
Several initiatives have been proposed to measure sustainability such as: (i) the Indicators of Sustainable Development of the Commission on Sustainable Development (CSD), which was developed by the United Nations in 1995 with the main objective of making indicators of sustainable development accessible to decision-makers at the national level; (ii) the Dashboard of Sustainability, developed by the Consultative Group for Sustainable Development Indicators, is an index of sustainability that uses a ‘car dashboard’ as a graphic interface to inform on a country’s performance towards sustainable development [6,7]; (iii) the Barometer of Sustainability developed by The World Conservation Institute (IUCN), which measures sustainability at local, regional, or national levels via a performance scale of human and environmental well being [8]; (iv) the Global Reporting Initiative (GRI) for reporting the economic, environmental, and social performance [9] of organizations launched by the Coalition for Environmentally Responsible Economies (CERES) and the United Nation Environment Program (UNEP); (v) the Sustainability Metrics of the Institution of Chemical Engineers (IChemE), which represents a set of proposed indicators to measure the sustainability of the process industries covering environmental responsibility, economic return (wealth creation), and social development [10]; and (vi) the Dow Jones Sustainability Index (DJSI), which intends to track the performance of the top 10 percent of companies in the Dow Jones Global Index that represent a reference in terms of corporate sustainability [11,12]. Attending to the importance of assessing the sustainability and circularity of companies, the following research question is proposed in this study: How to assess the level of sustainability and circularity of companies?
Recently, composite indicators (CIs) have been widely advocated and increasingly accepted as a useful tool for performance comparisons, publication communication, public communication, and decision support in a wide spectrum of fields, e.g., the economy, environment, and knowledge/information/innovation [13,14]. According to OECD (Organisation for Economic Co-operation and Development), Glossary of Statistical Terms, a CI is formed when individual indicators are compiled into a single index by an underlying model of the multi-dimensional concept that is being measured. Examples of well-known CIs include the Technology Achievement Index and the Human Development Index initiated by the United Nations [15], and the Environmental Sustainability Index jointly developed by Yale, Columbia, the World Economic Forum, and the Joint Research Center of the European Commission [16].
Approaches such as corporate environmental management, corporate social responsibility (CSR), and sustainability reporting have all been developed to help corporations manage various aspects of sustainability. Other examples are the integration of sustainability issues into cost accounting [17], the discussion of change management processes for corporate sustainability [18], integrated management systems to support corporate sustainability [19], differences in institutional settings that influence corporate sustainability practices [20], or frameworks based on the EFQM (European Foundation for Quality Management) model [21]. However, the impacts of these approaches seem to be rather limited [22,23,24] because of the lack of strategic orientation with respect to the introduction and implementation of sustainability-related practices and goals [25].
Despite the several sustainability measurement initiatives, only a few have an integrative focus, measuring at the same time the environmental, economic, and social dimensions [26,27,28]. One reference study focusing on the three dimensions of sustainability in the same work is [29]. In that work, a framework to determine a sustainability index under the triple bottom line approach is proposed. This work represents an important milestone to the sustainability field since it not only proposes a set of steps to construct a sustainability index but also suggests a set of social, economic, and environmental indicators that could be aggregated into a sustainability index to assess the sustainability of individual companies.
Moreover, an issue challenging sustainability measurement is the lack of consensus on sustainability indicators [30,31] which represents a significant barrier for the implementation of sustainability strategies [28].
Considering that, there are still gaps in the frameworks for the assessment of sustainability from the perspective of the Circular Economy. This research intends to fill this gap by proposing an index aiming to assess corporate sustainability under a circular economy context as an important contribution to evaluate the companies’ state of the art innovation in these two important areas of sustainable development.
2. Sustainability
Sustainability and sustainable development are terms widely employed but seldom defined unequivocally. Although there has been a debate about the definition of sustainability [32], the most used definition of it belongs to the Brundtland Commission: ‘development that meets the needs of the present without compromising the ability of future generations to meet their needs’ [33]. According to [34], sustainability is the balance between financial growth, ecological improvement, and ethical equity. More, Dyllick and Hockerts [35] draw on the Brundtland Commission to consider that corporate sustainability consists of meeting the needs of a corporation’s stakeholders without compromising its ability to meet the needs of future stakeholders. In this line, Schaltegger, Burritt, and Petersen [36] define it as a business approach that influences the environmental, social, and economic effects of a company in its sustainable development and toward the sustainable development of the economy and society.
As can be seen by the definitions above, the concept of sustainability is aligned with the idea of the TBL (Triple Bottom Line), developed by Elkington [37]. The TBL considers sustainable development as a three-dimensional concept involving economic growth and social well-being in harmony with the environment.
From the corporate point of view, the synergies resulting from the focus on these three dimensions are the starting point for the implementation of sustainability initiatives. In this sense, companies have faced enormous challenges in trying to operationalize the concept of sustainable development so that it can be used as a tool in the evolution from a purely economic business perspective to a more sustainable one. From this new point of view, the inclusion of environmental and social concerns enables companies and their supply chains to continue developing in the long term [38], while still preserving the environment and its communities.
Elkington argues in [39] that the real challenge of sustainable development is to find new strategies for companies to collaborate with suppliers, customers, and other stakeholders to comply not only with their economic, social and environmental responsibilities but also to benefit from competitive advantages.
This evidence has alerted industry leaders and policy makers to the need for implementing measures that can promote new patterns of consumption and production to drive sustainable development. As an example, the EU 2020 growth strategy aims to make the EU countries and their member states a smarter, more sustainable, and inclusive economy [40]. The Europe 2020 Strategy sets out some environmental objectives designed to ensure, within this period, a change to the current models of the impact on natural capital. The objectives of the 2020 Strategy are to reduce greenhouse gas emissions, increase renewable energy, and increase energy efficiency [41]. It is estimated that improving resource efficiency along value chains could reduce material input requirements by 17% to 24% by 2030 [42], and a better use of resources could represent a potential global savings of 630 billion per year for European industry [43].
Initiatives like these help to ensure the necessary change processes in the implementation of more sustainable practices. However, improving efficiency will only delay the time when resources will run out. To meet the challenges of climate change, increasing energy demand, scarcity of natural resources, and the volatility of government regulations, the need for a new development paradigm is evident.
3. Circular Economy
The evolution of world economies was marked by a high level of productivity due to a production method based on the intensive consumption of natural resources and energy. However, the severe environmental impacts, disregard for the limited nature of these resources, rapid world population growth, and climate change are threatening not only the stability of these economies but also the integrity of their ecosystems. With the explosion of these elements, industrial nations began to pay attention to environmental issues and to reflect on the sustainability of this growth model. Thus, since the publication of the 1972 Growth Limits [44], the international community has sought an alternative development model containing a sustainable development pathway for global economic development, social progress, and environmental protection [45].
The increasing use of the concept of a circular economy, which has been popularized in recent years by the Cradle-to-Cradle movement, is a direct response to growing concerns about the scarcity of resources and the awareness that business is unsustainable. The world’s population is expected to reach 8.5 billion by 2030, leading to an increase of about 70% in waste production. In this scenario, it is impossible to continue to extract resources and throw them somewhere without thinking of their cumulative effects [46].
The Circular Economy (CE) aims to keep products, components, and materials at their highest utility and value throughout their entire lifecycle, seeking to decouple the creation of value from the consumption of finite resources. The CE represents a model of sustainable development, based on ‘closing loops’, enabling the reintegration of materials into the productive processes through different types and levels of recovery [47,48,49], where the economic growth is decoupled from resource consumption and pollutant emissions as end-of-life materials and products are conceived as resources rather than waste. This means closing the loops of materials, reducing the need for raw materials and waste disposal.
As well as the implications of the fact that most materials extracted from the earth and utilized for economic purposes are not literally ‘consumed’ but become waste residuals that do not disappear and may cause environmental damage and result in unpaid social costs [50], experts have calculated that, without a rethink of how materials are used in the current linear ‘take-make-dispose’ economy, the virgin stocks of several key materials appear insufficient to sustain the modern ‘developed world’ quality of life for the global population under contemporary technology [51].
In linear economy, an industrial process is characterized by a unidirectional material flow, with raw materials that are transformed into a final product and finally disposable waste. In the new concept of CE, the recovery and valorization of waste allows the reuse of materials and the reintegration back into the supply chain, decoupling economic growth from environmental losses [52]. It is therefore necessary to move towards an industrial model that decouples economic growth from material input by using waste and bio-feedstock as inputs for industry: the circular economy. Circular Economy models maintain added value in products for as long as possible and minimize waste. They keep resources within the economy when products no longer serve their functions so that materials can be used again and therefore generate more value [53].
Hence, accelerating the transition to a CE has become an imperative. Through the transformation of waste into resources, this new model can bring benefits not only economically, with the creation of new jobs and the greater well-being of families, but also at the environmental and business levels, improving sustainability in the medium and long term. This reflects the holistic approach associated with the well-being economy, which takes account of the external impacts (both positive and negative) of economic activity. It also values ‘goods’ (such as those related to the biosphere), which, while not owned by anyone in particular, make a significant contribution to human and environmental well-being [54]. In this line and according to [55], a sustainable well-being society is built on infrastructures and operating models that stimulate sustainable well-being by promoting the empowerment of individuals and communities, moving to a regenerative and collaborative economy, building competencies for a complex world, and in developing inclusive and adaptive governance.
Also, Smol et al. [56] consider that the most important benefit in moving to a more CE-based approach is the possibility of retaining the added value in products for as long as possible, extracting their maximum value and eliminating waste. CE-based systems keep resources within the economy [57], and, when a product has reached the end of its life, products can be efficiently reused again and again and create further value [58,59].
The Ellen Macarthur Foundation highlights four ways of accelerating into the CE: (i) the recovery of products and materials through product design; (ii) add value to the products through their return to the productive cycle; (iii) new business models producing services rather than goods; (iv) every process of change goes through education, the transition to the CE requires a greater awareness of individuals [60].
In this regard, governments play an important role in creating regulations and policies for supporting CE objectives. Examples of sustainable solutions that stimulate the ‘closed loop’ of product’s lifecycles are: tax incentives for companies that have low use of natural resources and develop products with longer duration and easy recycling, as well as the creation of collaborative platforms between value chains and industrial symbiosis. Moreover, some examples of the implementation of a CE approach at a legislative level already exist (China, Japan, Germany, the UK, and the EU), but there are still some tensions and limitations inherent in its adoption and application at different levels. These tensions are associated with an increase in a global-scale environmental risks such as ozone depletion, climate change, biodiversity loss, and the alteration of the nitrogen cycle and include, for example, the limited store of resources, its uneven geographical distribution and appropriation [61], and the implications of the assimilative capacities of ecosystems over economic growth [62].
The existing CE approaches are valuable, tend to develop further, and are strongly focused on resource efficient production. This can be proved by the three principles of the concept presented in the report ‘Towards a Circular Economy: Business Rationale for an Accelerated Transition’ [63]: (i) preserve and enhance natural capital by controlling finite stocks and balancing renewable resource flows; (ii) optimize resource yields by circulating products, components, and materials at the highest utility at all times in both technical and biological cycles; and (iii) foster system effectiveness by revealing and designing out negative externalities.
However, in some cases, the verification of the environmental benefits of CE business models is not straightforward since moving to a circular economy involves barriers such as (1) resources not being correctly priced (i.e., the price does not account for both the price of the resource itself and cost recovery), hence these do not induce resource efficiency and pollution reduction, and (2) there are not enough incentives to internalize the externalities inherent to the policy-making process and to creating effective measures [64].
The analysis of the Circular Economy has another side as well. It is important to analyze the real costs associated with some options since, in some cases, they are superior to the benefits. One example is the recycling process. A series of studies have considered that recycling costs are higher than landfilling costs [65]. According to [66] recycling collection costs are twice as much as the disposal costs. Also, the efficiency of the processes associated with the circular economy under the 3R principles (Reduce, Reuse, Recycling) should be a concern. It is known that waste prevention and recycling play a primordial role in the European strategy towards a more resource efficient future [67,68,69]. Several laws and directives such as the European Waste Electrical and Electronic Equipment (WEEE) Directive regulate the End of Life (EoL) treatment of products and set minimum targets for collection and recycling. Recycling has the potential to reduce the Environmental Impact (EI) of mining and primary material production. However some problems of efficiency can arise. However, it is important to note that energy savings strongly depend on the material, the end of life source utilized, and the applied recycling processes [70,71,72].
Summing up, the CE emerges as a solution to the depletion of global resources and the accumulation of waste, which will help boost competitiveness through new business opportunities and innovative and more efficient forms of production and consumption [73]. The CE will also allow the development of countries and organizations to be improved through the creation of jobs at all levels of skill, controlling the externalities and the negative impacts on the environment. From this perspective, the CE becomes an attractive and viable alternative towards sustainable development.
4. Sustainability and Circularity Assessment
The level of sustainability can be assessed using an index or a set of indicators. In the literature, several tools and indices are suggested for sustainability measurement. The most commonly used, either in corporate reports or in scientific works, are the following: (i) the Global Reporting Initiative (GRI); (ii) the Corporate Social Responsibility Indicators published by the Instituto Ethos and designated by ETHOS indicators; (iii) Dow Jones Sustainability Index; (iv) Ecoinvent 2000; (v) Triple Bottom Line (TBL); (vi) the Environmental Management System (EMS) standard ISO 14031 indicators; and (vii) Indicators of the Commission on Sustainable Development. This last was based on Brundtland’s concept of sustainable development and focuses on four dimensions of sustainability: social, environmental, economic, and institutional [74].
Nevertheless, the initial development of sustainability indicators remained predominantly expert-driven and focused largely on the technical design of indicators [30,75,76,77]. Thus they were quite difficult to implement for practitioners.
Indicators should be applied attending to the purpose of the approach rather than making a generic set of indicators fit for all applications [78]. Indicators can be quantitative or qualitative and can fall within the categories of descriptive, performance, or efficiency indicators [79]. According to a UN report [80] indicators should be simple and informative, and approaches should be uncomplicated and without an unnecessarily large number of sub sets. They should be clear, unambiguous, and provide a basis for comparison.
Recent strategies in the European Union (EU) are the ‘Zero waste programme for Europe’ [81] and the ‘Closing the loop action plan for the Circular Economy’ [82]. In line with such strategies, the question is: how can corporate actions be managed and evaluated using measures relevant to Circular Economy principles of reduce, reuse, and recycle?
A methodology and its respective tools to assess how well a product or a company performs in the context of the CE are proposed in the Circularity Indicators Project (CIP). The methodology adopted in this project allows companies to estimate how advanced they are on their journey from a linear to a circular model [60]. In CIP, the following indicators are proposed: a main indicator, the material circularity indicator (MCI), measuring how restorative the material flows of a product or company are, and complementary indicators that allow additional impacts and risks to be considered [83]. The main indicator is represented by the company-level MCI, which is based on the hypothesis that the material circularity of a company can be built up from the MCI for all product types of that company, which are then aggregated by a suitable weighting. The restorative part of the material flow of a product is the proportion that comes from reused or recycled sources and is restored through reuse or recycling. Complementary indicators of the company’s level can either be built up in a similar way from product-level complementary indicators or from those already established at the company level, for example, using indicators from the GRI guidelines.
Considering the large number of natural resources with different characteristics, it is extremely complex to develop indicators that properly reflect resource use and its impacts on the environment, economy, and society [84]. The authors of [85] distinguish between four key categories of resource use: (i) material use; (ii) energy use and climate change; (iii) water use; and (iv) land use. For each one, they present indicators related to the scale of consumption (resource use) and to the impact of consumption on the environment. They also distinguish between indicators that reflect domestic consumption and impacts and those that relate to global demand and impacts.
A four-levels framework has also been introduced in [86] to support the measurement of CE adoption; the four outlined levels are the processes to monitor, the actions involved, the requirements to be measured, and, finally, the implementation levels of the CE [86]. These authors have performed a critical analysis of the methodologies found in the literature and their potential contribution to effectively measure the CE adoption for proposing a taxonomy of index-based methodologies. This taxonomy classifies these methodologies based on two factors: index-based method typology and the parameter(s) to be measured.
Usually, corporate sustainability is assessed by using economic, environmental, and social indicators [87]. However, some authors [88] argue that the aggregation of further indicators is needed to better assess the microeconomic contributions. This aggregation has been performed using assessment techniques that integrate environmental, economic, and social indicators by looking at the harm they create [89]. However, if current practices focus on the reduction of negative burdens and not on the comprehensive vision of material and product, then they are perhaps inadequate for guiding decisions that are at the very heart of CE. Several authors shed a light on this gap, pointing out the importance of well-designed and effective indicators in the transition from a linear to a circular economy [88,90,91,92,93,94,95].
Moriguchi [88] argues that any measure to evaluate corporate actions with respect to CE should be based on material and/or product longevity. Such a measure is important to allow practical application at a corporate, as opposed to an industry, level, so as to enable managers to visualize their contribution to a Circular Economy. In this paper, an index to assess the sustainability and circularity in manufacturing companies is proposed to close this gap. In the literature, there are several methods, techniques, and indices to assess CE strategies, considering different levels of analysis (Table 1).
Industrial ecology and related fields recognized that unused material flows can be highly wasteful and inefficient, causing both resource scarcity problems and waste problems, in comparison with a system based on closing loops along the model of food webs in nature [96,97,98]. The long history of debate around waste definition has been well documented in the case of the European Commission Waste Framework Directive [99,100], as well as in the case of the Resource Conservation and Recovery Act (RCRA) of the United States [101]. Based on the recognition that waste is a physical metabolite of production and consumption, some studies used thermodynamic indicators such as exergy to measure the potential of waste to cause environmental harm [102,103] or how much loss in material quality is accompanied by consumption [104]. However, while thermodynamic indicators provide some insights concerning the physical characteristics of waste, they cannot define a general statement about the quality of waste [100], owing both to the theoretical and practical limitations of the measurement [105].
According to the ‘resource-based paradigm’, waste is a potential resource until shown otherwise.
5. Proposal of a Sustainable Circular Index
The Sustainable Circular Index suggested in this work is inspired by the framework proposed in [29], with quite a few differences: (1) the index proposed in this work is for an individual company and not for a supply chain; (2) a set of new indicators associated with the circularity dimension is proposed; and (3) the weighing method suggested is also different. Instead of the AHP (Analytic Hierarchy Process), the Delphi method is used in this work.
The construction of the suggested Sustainable Circular Index is formed by four dimensions (economic, social, environmental, and circularity), and each of them is oriented by the following objectives: (1) within the economic dimension the economic value generated and distributed, the expenditures on research and development and the employment have to be maximized; (2) within the social dimension, the work accidents, the precarious work, the absenteeism, worker rotation, and loss of productivity have to be minimized; (3) within the environmental dimension, the hazardous wastes, the consumed water, and the used energy should be minimized; and (4) considering the circularity dimension, the inputs that come from virgin material and recycled and reused materials, the lifetime and intensity of the used products, and the efficiency of the recycling process have to be maximized.
The next five phases are followed to reach the proposed Sustainable Circular Index:
- Phase 1—Selection of sustainability and circularity indicators
- Phase 2—Weighting of indicators
- Phase 3—Normalization
- Phase 4—Aggregation method for Index construction
- Phase 5—Index construction.
5.1. Phase 1—Selection of Sustainability and Circularity Indicators
In the literature, there is concern about the type of sustainability measures usually used in scientific approaches since they are considered neither adjusted to the reality of companies nor easy to implement [116,117,118]. With this concern, the sustainability indicators suggested in this work are based on recognized and accepted methodologies/criteria used by companies in their daily routines and sustainability reports such as: (1) the TBL, which is intended to advance the goal of sustainability in business practices beyond profits to include also social and environmental concerns to measure the total cost of doing business; (2) the version G4 of the GRI, which represents the first global standards for sustainability reporting, which are also considered the global best practice for reporting on a range of economic, environmental, and social impacts; (3) ISO 14031, which gives guidance on the design and use of environmental performance evaluation within an organization. Attending to these criteria, the following sustainability indicators of sustainability dimension are suggested (Table 2).
To assess CE concerns, the Material Circularity Indicator (MCI) of the CIP (Circularity Indicators Project) is considered [60]. The circularity indicators suggested in this work are represented in Table 3.
There are other indicators that could be a part of this work. However, as they are not part of the used methodologies/criteria, they are not considered. This is the case for ‘the expenditures for material and product recovery’ which do not form part of the suggested CE’ indicators, but are present indirectly in the economic sustainability indicator ‘Direct economic value generated’ and in the rubric operating costs. The expenditures for material and product recovery can also be reflected in the CE indicator ‘Efficiency of recycling’. The rationale is as follows: the less efficient recovery process of the materials and product, the more expensive it becomes.
From the suggested indicators and depending on the sector or companies that formed the research sample, a statistical approach is suggested to decide if the indicators should be considered in the construction of the Sustainable Circular index. The exclusion criteria should be supported on the correlation coefficients between potential indicators [119]. Attending to this criterion, the indicators with the highest correlation should be excluded from the index construction process in order to minimize their redundancy [120]. To test indicators for a statistical correlation, the Pearson correlation coefficient can be used [121]. Therefore, there was almost always some positive correlation between different measures of the same aggregate. Thus, a rule of the thumb to define a threshold beyond which the correlation is a symptom of double counting is 0.70 [122]. The correlation indicates that the variation in the two indicators is similar.
5.2. Phase 2—Weighting of Indicators
For weighting both sustainability and circularity indicators, the Delphi technique is suggested. The Delphi technique is a highly formalized method of communication that is designed to extract the maximum amount of unbiased information from a panel of experts [127]. It also makes it possible to assess uncertainty in a quantitative manner. Therefore, it is appropriate to adopt the Delphi technique to obtain a series of weighted indicators to assess the level of sustainability and circularity of manufacturing companies.
The key steps in preparing a Delphi study are presented in [128]: (i) the definition of experts and their selection; (ii) the number of rounds; and (iii) the questionnaire structure in each study round. Generally, the number of rounds ranges from two to seven, and the number of participants varies between three and 15 [129].
The success of the Delphi method depends mainly on the careful selection of the panel members [127]. As the information solicited requires in-depth knowledge and sound experience about sustainability and circularity, a purposive approach is suggested to select this group of experts [127].
Interviews should be performed with academics/experts in research topics to verify the validity of the considered sustainability and circularity indicators and to rank them according to their importance to the sustainability and circularity of companies.
Each indicator rating should be measured using a score between 1 and 5, with 1 representing ‘nothing important’ and 5 representing ‘extremely important’, for companies to be considered sustainable or circular, depending on the indicators.
The weighting for each set of indicators, that is, sustainability and circularity, is computed using Equation (1) [130]:
where:
- wz represents the weighting of a particular variable z
- Mz represents the mean rating of a particular variable z
- represents the summation of the mean rating of each set of variables
In order to obtain a measure of the consistency of the responses from the panel, the Kendall’s Coefficient (W) of concordance should be applied to each round. This coefficient is used to study the degree of association among rankings of several objects by several judges [131]. This coefficient varies between ‘0’, indicating no agreement between judges, and ‘+1’, indicating complete agreement among the judges on the ranking of various attributes. The Kendall’s Coefficient of concordance could be computing using the MegaStat application for Excel.
5.3. Phase 3—Normalization
Normalization is necessary to integrate the selected indicators into a composite Sustainable Circularity index, since they are expressed in different units. It should be taken into account that sometimes there is no need to normalize the indicators; for example, if the indicators are already expressed in the same unit.
To normalize the sustainability indicators, several methods could be used: normalization based on interval scales, standardization or z-scores, the distance to a reference, and the Minimum-Maximum method [132,133]. In this work, the Minimum-Maximum method is suggested [134]. According to this method, each indicator with a positive impact on sustainability (I + i,j) is normalized using Equation (2):
where is the normalized indicator i from the dimension of sustainability j with positive impact on sustainability. The values of the normalized indicator will range between 0 and 1. represents the indicator i from the dimension of sustainability j with positive impact on sustainability; represents the lowest value of indicator i from the dimension of sustainability j with positive impact on sustainability. This is = . represents the highest value of indicator i from the dimension of sustainability j with positive impact on sustainability; this is =
The normalization of indicators with a negative impact on sustainability is computed using Equation (3):
where is the normalized indicator i from the dimension of sustainability j with negative impact on sustainability. The values of the normalized indicator will range between 0 and 1. is the indicator i from the dimension of sustainability j with negative impact on sustainability; represents the lowest value of indicator i from the dimension of sustainability j with negative impact on sustainability, identified from all the companies that make part of the sample and at a specific moment; and represents the highest value of indicator i from the dimension of sustainability j with negative impact on sustainability, identified from all the companies that make part of the sample and at a specific moment.
As regards the circularity indicators, which are expressed in quantity and percentages (Table 3), the same Minimum-Maximum method is suggested.
5.4. Phase 4—Aggregation Method for Index Construction
Attending to Arrow’s impossibility theorem [135], no perfect aggregation convention can exist. Additionally, there are various linear methods for aggregation; the most common are additive, multiplicative, and additive weighting [134,136,137,138]. Their application depends on a set of assumptions. For example, to admit a linear method, it is necessary to observe independence between variables [138,139], that is, the absence of synergy or conflict effects among the indicators, and all indicators should have the same measurement unit [137]. Multiplicative aggregation is appropriate when strictly positive indicators are expressed in different ratio-scales, and it entails partial compensability, i.e., compensability is lower when the composite indicator contains indicators with low values [137].
The right selection of the components of composite indices and their weights is also critical for the aggregation process. Despite these concerns, Singh et al. [27] suggests that composite indices should remain relatively simple in terms of their construction and interpretation. The simple additive weighting method has been widely used in practice due to its transparency and ease of understanding for non-experts [134].
Considering all the previous arguments, in this work, the Simple Additive Weighting method (SAW) is suggested as the aggregation method. Since this is a linear model, it is applicable only if there is independence between variables. Therefore, it is necessary to verify if this model is applicable in real case situations, where this assumption may not be verified. Farmer in [139] considers that, even if the assumption of independence between variables does not hold, the simple additive weighting method (SAW) would also yield extremely close approximation to the ideal value function.
5.5. Phase 5—Index Construction
Following the methodology suggested in the previous section, in a first step it is necessary to identify the set of sustainability and circularity indicators for the manufacturing companies. Using the literature review, a set of indicators was selected to assess the sustainability and circularity behaviour of companies (Table 4).
The suggested Sustainable Circularity index can be used by managers considering the following: (i) the set of sustainability and circularity indicators should be appropriated to the type of manufacturing company; (ii) the weights of the sustainability dimensions and circularity and the respective indicators should be accessed by a panel of experts through the Delphi technique; (iii) the aggregation method suggested is the Simple Additive Weighting method (SAW).
5.6. The Sustainable Circular Index
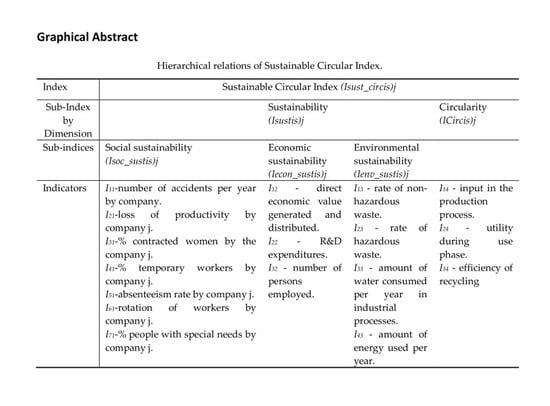
The Sustainable Circular Index for a company is formed by a set of indicators associated with social sustainability, economic sustainability, environmental sustainability, circularity, and corresponding weights (Equation (4)).
where (Isust_circis)j represents the Sustainable Circular Index for company j. This index has its values varying between 0 < (Isust_circis)j < 1. If (Isust_circis)j = 0, this means that the company j is neither sustainable nor adopts circularity principles. If (Isust_circis)j = 1, this means that company j is extremely sustainable and the circular economy concerns are highly present. Ws represents the weight associated with dimension s (s = 1—social sustainability; s = 2—economic sustainability; s = 3—environmental sustainability; s = 4—circularity). ∑Ws = 1. Wis represents the weight of indicator i for dimension s (s = 1—social sustainability; s = 2—economic sustainability; s = 3—environmental sustainability; s = 4—circularity). Also, ∑Wis = 1. (NIis)j is the normalized indicator i associated with dimension s for company j.
5.7. Discussion on the Selected Methods and Approaches Followed in this Work
Building a composite index is a delicate task and is not that easy: obstacles range from data availability and the choice of individual indicators to their treatment in order to compare (normalization) and aggregate them (weighting and aggregation).
In this work, the indicators for the construction of a Sustainable Circular Index were selected from recognized and accepted methodologies/criteria used by companies in their daily routines and sustainability reports such as: TBL; GRI; ISO 14031; and Material Circularity Indicator [29,140,141]. However, other selection criteria can be found in the literature. For example, in [142], the indicators were identified by a systematic literature review and the Delphi method, where the indicators were subjected to 184 researchers from different departments from Feevale University and UNIVATES University Centre prior to being selected. Beyond these sources, these authors used also indicators from the mining industry and GRI that present guidelines and metrics applicable to all organizations, regardless of their size. In [143], indicators were identified based on a literature review and collected using the databases Energex, IAC Database, and Wastex NIOSH. An extensive discussion with experts from a number of industrial organizations were used in [144] to identify the most adequate indicators in suggesting a Product Sustainability Index. Also, others were obtained from the following contributions: in [145], a table of indicators and a measurement method for mining industry was formulated; in [146], an orientation guide to measure the sustainability of an operational unit was developed; and, in [147], a GRI that presents guidelines and metrics applicable to all organizations was used, regardless of their size.
As the indicators are expressed in different measurement units, their normalization is mandatory. In this work, the Minimum-Maximum method is suggested. This method normalizes indicators to have an identical range between 0 and 1 by subtracting the minimum value and dividing by the range of the indicator values. However, extreme values or outliers could distort the transformed indicator [148]. If using this method, it is important to note that this normalization is not stable when data for a new time point become available. This implies an adjustment of the analysis for that period, which may, in turn, affect the minimum and the maximum for some individual indicators and hence the normalized values. To maintain comparability between the existing and the new data, the composite indicator for the existing data must be re-calculated in such cases [132]. This same method of normalization was used in other works [149].
There are other methods of normalization such as z-scores, which convert indicators to a common scale with a mean of zero and a standard deviation of one [150]. The standardization of indicators was carried out using the distance from the group leader approach. However, using this method, the indicators with extreme values could have a greater effect on the composite indicator. This effect can be corrected in the aggregation methodology by excluding the best and worst individual indicator scores from inclusion in the index. Another method of weighting can be found in [151], where the individual metrics are normalized to a single scale from 0 to 10, where 0 represents the worst case and 10 represents the best case. Generally, a score of 2 would indicate a ‘poor’ status, ‘average’ with a score of 4, ‘good’ with a score of 6, and ‘excellent’ with a score of 8.
As for the weighting, the method suggested in this work gives different weights to the four dimensions considered in the Sustainable Circular Index (social, economic, environmental, and circularity), and the respective indicator is the Delphi method. Other techniques can be found in the literature. The pairwise comparison technique or AHP, was used in [143] to determine the relative weight of each subgroup (energy efficiency, waste management, workers’ safety, and health environment) that forms part of their sustainability manufacturing index. In the AHP context, weights represent the trade-off across indicators. They measure willingness to forego a given variable in exchange for another. Hence, they are not considered importance coefficients. It could cause misunderstandings if AHP weights were to be interpreted as importance coefficients [152]. In that work, the sustainability manufacturing index is simply the weighted average of three indicators. A different approach to weighting can be found also in [142], where the weighting method used comprises the equal weighting approach, that is, all indicators have the same importance. The equal weighting approach is usually chosen due to its simplicity [153]. In addition, as suggested by the literature review, especially in [27], 40% of sub-indices and sustainability indices use this method as a weighting factor.
The need for a composite index is common amongst most researchers since it minimizes possible biases of same-set indicator indices, despite serving only as a benchmarking tool and not as a policy initiator [132].
In the present study, the aggregation of dimensions and indicators was performed by using the Simple Additive Weighting method (SAW). The additive aggregation method entails the calculation of the ranking of each company according to each individual indicator and the summation of the resulting rankings. With simple and independent of outliers, however, the absolute value of information is lost [150], and it suffers from full compensability such that poor performance in some indicators can be compensated for by sufficiently higher values in other indicators [132]. Compensability refers to the existence of trade-offs, that is, the possibility of offsetting a disadvantage in some indicator by a sufficiently large advantage in another indicator. However, the use of weights with intensity of preference originates in compensatory multi-criteria methods and gives the meaning of trade-offs to the weights [154].
This same method of aggregation used in this work, Simple Additive Weighting (SAW), was used in [149] to construct a Sustainability index for measuring the sustainability of manufacturing companies.
Other methods of aggregation have been used to construct a composite index such as the Geometric Mean [155]. The Geometric Mean represents a balanced solution, and its multi-criteria analysis eases, although it does not eliminate, the compensation of the indicator results [156].
When using an additive or a multiplicative aggregation method, and when individual indicators are expressed as intensities and not as qualities nor in rankings, the substitution rates equal the weights of the variables up to a multiplicative coefficient [157]. In this context, weights in additive aggregations unavoidably take the meaning of substitution rates and do not indicate the importance of the associated indicator. This implies a compensatory logic. For the weights to be interpreted as importance coefficients, non-compensatory aggregation procedures must be used to construct composite indicators. This can be done using a non-compensatory multi-criteria approach (MCA) [158].
6. Managerial Contribution of the Proposed Sustainable Circular Index
The proposed Sustainable Circular Index represents an important contribution for both academics and practitioners. This work gives academics insight into state-of the-art focused topics and a description of a framework that could be used to implement the proposed index.
Also, the concepts of sustainability and circularity are clarified, and the arguments for joining them are also provided and enhanced. The circular economy is presented as supporting evolution towards sustainable prosperity, becoming, in this way, an integrative endeavor at the crossroads of economic, social, and environmental dimensions. Also, a set of indicators related to the three dimensions of sustainability and the circularity are suggested from the literature review.
This makes easier a practical implementation of the suggested Sustainable Circular Index by practitioners, as well testing it in a case study by academics. It intends also to contribute to a better understanding of ‘sustainable circular economy’ configurations and to develop a scientific approach.
The proposed index also makes it possible to assess the level of sustainability and circularity of manufacturing companies with a didactic concern since it could be considered a guideline for managers to reach a defined level of sustainability or circularity.
Moreover, it makes possible a wider analyses of these two concerns (sustainability and circularity), aggregated individually or at indicator level. Hierarchically the suggested Sustainable Circular Index could be illustrated in the following way (Table 5).
7. Conclusions
Corporate sustainability has been assessed by aggregating economic, environmental, and social indicators. However this aggregation has been performed using assessment techniques that integrate environmental, economic, and social indicators by looking at the harm they create and not on the comprehensive vision of material and product. Thus they are perhaps inadequate for guiding decisions that are at the very heart of Circular Economy.
Bearing in mind this concern, in this work, a Sustainable Circular Index is suggested to assess the sustainability and circularity of manufacturing companies by using a proposed framework. This allows us to answer the research question suggested in the introduction section: How to assess the level of sustainability and circularity of companies? This Index gives companies insights into not only their sustainable behavior but also whether they are respecting Circular Economy concerns regarding the use of recycled and reused materials, the lifetime and intensity of the products, and the efficiency of recycling processes. The suggested index could be also a helpful framework in setting policy priorities and in benchmarking or monitoring the sustainability and circularity performance of companies.
This Sustainable Circular Index is very versatile and simple since it makes it possible to assess the sustainability and the circularity behavior of manufacturing companies. This is in line with the recommendations of the UN report, which defends that indicators should be simple and informative and that approaches should be uncomplicated. The weighting of each index dimension and the corresponding indicators could be adapted to each company, attending to the perspective of the members of the Delphi panel used. This index also allows a benchmarking analysis between companies from the same or different industries to be performed.
This work provides a base for the assessment of the sustainability and circularity of companies, giving timely insights on their progress towards environmental, economical, and social sustainability and towards circularity behavior. In general, this study focused on:
- Establishing a list of sustainability indicators sorted by TBL dimensions and circularity indicators.
- Generating a weight distribution for the quantitative assessment of dimensions and indicators’ importance, using diverse expert judgment by the Delphi method. This supports the decision-making process relating to sustainability improvement efforts.
- Presenting a guideline for the construction of a Sustainable Circular Index through the description of the framework and the corresponding steps.
In addition to the importance and usefulness of the suggested approach, it presents some limitations. A practical application of the suggested index could be performed to illustrate how it works and the kind of information managers can collect to support their decisions on sustainability and circularity issues. Also, for a larger scale application of our Sustainable Circular Index, experts’ selection process can be reviewed such as the number of experts and their background requirements. Moreover, several judgments should be made when constructing an aggregated index, e.g., selection of indicators, data normalization, weights, and aggregation methods; the robustness of the proposed Sustainable Circular Index should be assessed by performing a sensitivity analysis in a case study. The sensitive analysis can help gauge the robustness of the aggregated index and improve transparency.
The creation of a qualitative structure for composite indicators is not an easy goal to achieve. In reality, a composite indicator’s general value hinges on numerous characteristics, associated with both the reliability of the procedures utilized in its creation and the quality of the basic data utilized to form the indicator. Even if data are accurate, they cannot be considered to be of good quality if they are produced too late to be useful, cannot be easily accessed, or appear to be in conflict with other data.
As regards future research, and according to the limitations previously identified, it will be interesting to test the proposed Sustainable Circular Index in several case studies from different manufacturing industries to test its robustness.
Acknowledgments
The authors are pleased to acknowledge financial support from the Center for Advanced Studies in Management and Economics (CEFAGE-UBI), which has financial support from FCT, Portugal, and FEDER/COMPETE 2020, through grant UID/ECO/04007/2013 (POCI-01-0145-FEDER-007659).
Author Contributions
Susana Garrido Azevedo suggested the framework and the approach developed. Radu Godina performed the Literature Review, and João Carlos de Oliveira Matias identified the best indicators to be considered in the Sustainable Circular Index.
Conflicts of Interest
The authors declare no conflicts of interest.
References
- Ness, D. Sustainable urban infrastructure in China: Towards a Factor 10 improvement in resource productivity through integrated infrastructure systems. Int. J. Sustain. Dev. World Ecol. 2008, 15, 288–301. [Google Scholar] [CrossRef]
- Cole, M.; Rayner, A.J.; Bates, J.M. The environmental Kuznets curve: An empirical analysis. Environ. Dev. Econ. 1997, 2, 401–416. [Google Scholar] [CrossRef]
- Rennings, K.; Ludwig Brockmann, K.; Bergmann, H. Voluntary agreements in environmental protection: Experiences in Germany and future perspectives. Bus. Strategy Environ. 1997, 6, 245–263. [Google Scholar] [CrossRef]
- Yoshida, H.; Shimamura, K.; Aizawa, H. 3R strategies for the establishment of an international sound material-cycle society. J. Mater. Cycles Waste Manag. 2007, 9, 101–111. [Google Scholar] [CrossRef]
- Lazarevic, D.; Valve, H. Narrating expectations for the circular economy: Towards a common and contested European transition. Energy Res. Soc. Sci. 2017. [Google Scholar] [CrossRef]
- Scipioni, A.; Mazzi, A.; Mason, M.; Manzardo, A. The Dashboard of Sustainability to measure the local urban sustainable development: The case study of Padua Municipality. Ecol. Indic. 2009, 9, 364–380. [Google Scholar] [CrossRef]
- Sardain, A.; Tang, C.; Potvin, C. Towards a dashboard of sustainability indicators for Panama: A participatory approach. Ecol. Indic. 2016, 70, 545–556. [Google Scholar] [CrossRef]
- Prescott-Allen, R. The Wellbeing of Nations: A Country-by-Country Index of Quality of Life and the Environment; Island Press: Washington, DC, USA, 2001; ISBN 978-1-55963-831-9. [Google Scholar]
- Global Reporting Initiative Search. Available online: https://www.globalreporting.org/Search/Pages/default.aspx?k=Sustainability%20reporting%20guidelines&s=Website (accessed on 10 September 2017).
- IChemE|Sustainability Special Interest Group|Resources|Sustainability Tools. Available online: http://www.icheme.org/communities/special-interest-groups/sustainability/resources/sustainability%20tools.aspx (accessed on 10 September 2017).
- Searcy, C.; Elkhawas, D. Corporate sustainability ratings: An investigation into how corporations use the Dow Jones Sustainability Index. J. Clean. Prod. 2012, 35, 79–92. [Google Scholar] [CrossRef]
- Sariannidis, N.; Giannarakis, G.; Partalidou, X. The effect of weather on the European stock market: The case of Dow Jones Sustainability Europe Index. Int. J. Soc. Econ. 2016, 43, 943–958. [Google Scholar] [CrossRef]
- Becker, W.; Saisana, M.; Paruolo, P.; Vandecasteele, I. Weights and importance in composite indicators: Closing the gap. Ecol. Indic. 2017, 80, 12–22. [Google Scholar] [CrossRef] [PubMed]
- Abberger, K.; Graff, M.; Siliverstovs, B.; Sturm, J.-E. Using rule-based updating procedures to improve the performance of composite indicators. Econ. Model. 2017. [Google Scholar] [CrossRef]
- United Nations Development Programme. Human Development Report 2001: Making New Technologies Work for Human Development; Oxford University Press: Oxford, UK, 2001; ISBN 978-0-19-521835-0. [Google Scholar]
- Yale Center for Environmental Law and Policy. 2005 Environmental Sustainability Index: Benchmarking National Environmental Stewardship; Yale Center for Environmental Law and Policy: New Haven, CT, USA, 2005. [Google Scholar]
- Atkinson, G. Measuring Corporate Sustainability. J. Environ. Plan. Manag. 2000, 43, 235–252. [Google Scholar] [CrossRef]
- Benn, S.; Dunphy, D.; Griffiths, A. Organizational Change for Corporate Sustainability; Routledge: Oxford, UK, 2014; ISBN 978-1-317-81911-0. [Google Scholar]
- Oskarsson, K.; von Malmborg, F. Integrated management systems as a corporate response to sustainable development. Corp. Soc. Responsib. Environ. Manag. 2005, 12, 121–128. [Google Scholar] [CrossRef]
- Tschopp, D.J. Corporate social responsibility: A comparison between the United States and the European Union. Corp. Soc. Responsib. Environ. Manag. 2005, 12, 55–59. [Google Scholar] [CrossRef]
- Marrewijk, M.; van Hardjono, T.W. European Corporate Sustainability Framework for Managing Complexity and Corporate Transformation. J. Bus. Ethics 2003, 44, 121–132. [Google Scholar] [CrossRef]
- Hopwood, B.; Mellor, M.; O’Brien, G. Sustainable development: Mapping different approaches. Sustain. Dev. 2005. [Google Scholar] [CrossRef]
- Sneddon, C.; Howarth, R.B.; Norgaard, R.B. Sustainable development in a post-Brundtland world. Ecol. Econ. 2006, 57, 253–268. [Google Scholar] [CrossRef]
- Gończ, E.; Skirke, U.; Kleizen, H.; Barber, M. Increasing the rate of sustainable change: A call for a redefinition of the concept and the model for its implementation. J. Clean. Prod. 2007, 15, 525–537. [Google Scholar] [CrossRef]
- Baumgartner, R.J.; Korhonen, J. Strategic thinking for sustainable development. Sustain. Dev. 2010, 18, 71–75. [Google Scholar] [CrossRef]
- Labuschagne, C.; Brent, A.C.; Claasen, S.J. Environmental and social impact considerations for sustainable project life cycle management in the process industry. Corp. Soc. Responsib. Environ. Manag. 2005, 12, 38–54. [Google Scholar] [CrossRef]
- Singh, R.K.; Murty, H.R.; Gupta, S.K.; Dikshit, A.K. An overview of sustainability assessment methodologies. Ecol. Indic. 2009, 9, 189–212. [Google Scholar] [CrossRef]
- Veleva, V.; Ellenbecker, M. Indicators of sustainable production: A new tool for promoting business sustainability. New Solut. J. Environ. Occup. Health Policy NS 2001, 11, 41–62. [Google Scholar] [CrossRef] [PubMed]
- Salvado, M.F.; Azevedo, S.G.; Matias, J.C.O.; Ferreira, L.M. Proposal of a Sustainability Index for the Automotive Industry. Sustainability 2015, 7, 2113–2144. [Google Scholar] [CrossRef]
- Searcy, C.; Karapetrovic, S.; McCartney, D. Designing sustainable development indicators: Analysis for a case utility. Meas. Bus. Excell. 2005, 9, 33–41. [Google Scholar] [CrossRef]
- Sikdar, S.K. Sustainable development and sustainability metrics. AIChE J. 2003, 49, 1928–1932. [Google Scholar] [CrossRef]
- Johnston, P.; Everard, M.; Santillo, D.; Robèrt, K.-H. Reclaiming the definition of sustainability. Environ. Sci. Pollut. Res. Int. 2007, 14, 60–66. [Google Scholar] [PubMed]
- World Commission on Environment and Development. Our Common Future; Oxford University Press: Oxford, UK, 1990; ISBN 978-0-19-553191-6. [Google Scholar]
- Wang, L. A Methodology of Sustainability Accountability and Management for Industrial Enterprises. Master’s Thesis, The State University of New York at Buffalo, Buffalo, NY, USA, 2005. [Google Scholar]
- Dyllick, T.; Hockerts, K. Beyond the business case for corporate sustainability. Bus. Strategy Environ. 2002, 11, 130–141. [Google Scholar] [CrossRef]
- Schaltegger, S.; Burritt, R.; Petersen, H. An Introduction to Corporate Environmental Management: Striving for Sustainability. Manag. Environ. Qual. Int. J. 2003, 14, 541–542. [Google Scholar] [CrossRef]
- Elkington, J. Accounting for the triple bottom line. Meas. Bus. Excell. 1998, 2, 18–22. [Google Scholar] [CrossRef]
- Carter, C.R.; Rogers, D.S. A framework of sustainable supply chain management: Moving toward new theory. Int. J. Phys. Distrib. Logist. Manag. 2008, 38, 360–387. [Google Scholar] [CrossRef]
- Elkington, J. Towards the Sustainable Corporation: Win-Win-Win Business Strategies for Sustainable Development. Calif. Manage. Rev. 1994, 36, 90–100. [Google Scholar] [CrossRef]
- Gros, D.; Roth, F. The Europe 2020 Strategy: Can It Maintain the EU’s Competitiveness in the World? Center for European Policy Studies: Brussels, Belgium, 2014; ISBN 978-94-6138-124-8. [Google Scholar]
- European Commission. Directorate-General Communication. Europe 2020: Europe’s Growth Strategy: Growing to a Sustainable and Job-Rich Future; Publications Office of the European Union: Luxembourg, 2012; ISBN 978-92-79-23972-4. [Google Scholar]
- Poschen, P. Decent Work, Green Jobs and the Sustainable Economy: Solutions for Climate Change and Sustainable Development; Greenleaf Publishing: Oxford, UK, 2015; ISBN 978-1-78353-447-0. [Google Scholar]
- REMake Greenovate! Europe. Available online: https://www.greenovate-europe.eu/projects/completed/remake (accessed on 10 September 2017).
- Meadows, D.; Meadows, D.L.; Randers, J.; Behrens Ill, W. The Limits to Growth: A Report for the Club of Rome’s Project on the Predicament of Mankind; New American Library: New York, NY, USA, 1974. [Google Scholar]
- Pan, J. The Development Paradigm of Ecological Civilization. In China’s Environmental Governing and Ecological Civilization; China Insights; Springer: Berlin/Heidelberg, Germany, 2016; pp. 29–49. ISBN 978-3-662-47428-0. [Google Scholar]
- Elks, J. Why a Circular Economy Is Key to Sustainable Development (and Why Business Must Lead the Way) Sustainable Brands. Available online: http://www.sustainablebrands.com/news_and_views/next_economy/jennifer_elks/why_circular_economy_key_sustainable_development_why_busin (accessed on 11 September 2017).
- Lacy, P.; Rutqvist, J. The Roots of the Circular Economy. In Waste to Wealth; Palgrave Macmillan: London, UK, 2015; pp. 19–23. ISBN 978-1-349-58040-8. [Google Scholar]
- Korhonen, J.; Honkasalo, A.; Seppälä, J. Circular Economy: The Concept and its Limitations. Ecol. Econ. 2018, 143, 37–46. [Google Scholar] [CrossRef]
- Pomponi, F.; Moncaster, A. Circular economy for the built environment: A research framework. J. Clean. Prod. 2017, 143, 710–718. [Google Scholar] [CrossRef]
- Robert, U.A.; Kneese, A.V. Production, Consumption, and Externalities; Resources for the Future: Washington, DC, USA, 1969. [Google Scholar]
- Gordon, R.B.; Bertram, M.; Graedel, T.E. Metal stocks and sustainability. Proc. Natl. Acad. Sci. USA 2006, 103, 1209–1214. [Google Scholar] [CrossRef] [PubMed]
- Ghisellini, P.; Cialani, C.; Ulgiati, S. A review on circular economy: The expected transition to a balanced interplay of environmental and economic systems. J. Clean. Prod. 2016, 114, 11–32. [Google Scholar] [CrossRef]
- Pearce, D.W.; Turner, R.K. Economics of Natural Resources and the Environment; Harvester Wheatsheaf: Birmingham, UK, 1990; ISBN 978-0-7450-0202-6. [Google Scholar]
- Bandarage, A. Sustainability and Well-Being: The Middle Path to Environment, Society and the Economy; Springer: New York, NY, USA, 2013; ISBN 978-1-137-30899-3. [Google Scholar]
- Hellstrom, E.; Hamalainen, T.; Lahti, V.-M.; Cook, J.; Jousilahti, J. Towards a Sustainable Well-being Society—From Principles to Applications. Available online: https://media.sitra.fi/2017/02/23221124/Towards_a_Sustainable_Wellbeing_Society_2.pdf. (accessed on 15 September 2017).
- Smol, M.; Kulczycka, J.; Henclik, A.; Gorazda, K.; Wzorek, Z. The possible use of sewage sludge ash (SSA) in the construction industry as a way towards a circular economy. J. Clean. Prod. 2015, 95, 45–54. [Google Scholar] [CrossRef]
- Valipour, M. A comprehensive study on irrigation management in Asia and Oceania. Arch. Agron. Soil Sci. 2015, 61, 1247–1271. [Google Scholar] [CrossRef]
- Aminoff, A.; Valkokari, K.; Antikainen, M.; Kettunen, O. Exploring Disruptive Business Model Innovation for the Circular Economy. In Sustainable Design and Manufacturing 2017; Smart Innovation, Systems and Technologies; Springer: Cham, Switzerland, 2017; pp. 525–536. [Google Scholar]
- Prendeville, S.; Hartung, G.; Purvis, E.; Brass, C.; Hall, A. Makespaces: From Redistributed Manufacturing to a Circular Economy. In Sustainable Design and Manufacturing 2016; Smart Innovation, Systems and Technologies; Springer: Cham, Switzerland, 2016; pp. 577–588. ISBN 978-3-319-32096-0. [Google Scholar]
- Franconi, E.; Bridgeland, B.; Webster, K. A New Dynamic 2- Effective Systems in a Circular Economy; Ellen MacArthur Foundation Publishing: Isle of Wight, UK, 2016; ISBN 978-0-9927784-4-6. [Google Scholar]
- Georgescu-Roegen, N. Inequality, Limits and Growth from a Bioeconomic Viewpoint. Rev. Soc. Econ. 1977, 35, 361–375. [Google Scholar] [CrossRef]
- Daly, H.E.; Townsend, K.N. Valuing the Earth: Economics, Ecology, Ethics; MIT Press: Cambridge, MA, USA, 1996; ISBN 978-0-262-26056-5. [Google Scholar]
- Ellen MacArthur Foundation. Towards the Circular Economy: Economic and Business Rationale for an Accelerated Transition. Bind 1. Available online: https://www.ellenmacarthurfoundation.org/assets/downloads/TCE_Ellen-MacArthur-Foundation_9-Dec-2015.pdf (accessed on 27 September 2017).
- Vanner, R.; Hudson, C.; Bicket, M.; Sirini, W.; Patrick, B.; Paolo, R.; van Dijl, E.; Emma, W.; Mathieu, H.; Adrian, T.; et al. Scoping Study to Identify Potential Circular Economy Actions, Priority Sectors, Material Flows & Value Chains; European Commission, Directorate-General Research & Innovation: Brussels, Belgium, 2014; pp. 1–78. [Google Scholar]
- Jacobs, T.L.; Everett, J.W. Optimal Scheduling of Consecutive Landfill Operations with Recycling. J. Environ. Eng. 1992, 118, 420–429. [Google Scholar] [CrossRef]
- Tanskanen, J.-H.; Reinikainen, A.; Melanen, M. Waste streams, costs and emissions in municipal solid waste management: A case study from Finland. Waste Manag. Res. 1998, 16, 503–513. [Google Scholar] [CrossRef]
- Andreasi, B.S.; Christensen, T.H.; Damgaard, A. Environmental performance of household waste management in Europe—An example of 7 countries. Waste Manag. 2017, 69, 545–557. [Google Scholar] [CrossRef] [PubMed]
- Expósito, A.; Velasco, F. Municipal solid-waste recycling market and the European 2020 Horizon Strategy: A regional efficiency analysis in Spain. J. Clean. Prod. 2018, in press. [Google Scholar] [CrossRef]
- Patermann, C.; Aguilar, A. The origins of the bioeconomy in the European Union. New Biotechnol. 2017. [Google Scholar] [CrossRef] [PubMed]
- Powell-Turner, J.; Antill, P.D.; Fisher, R.E. The United Kingdom Ministry of Defence and the European Union’s electrical and electronic equipment directives. Resour. Policy 2016, 49, 422–432. [Google Scholar] [CrossRef]
- Bahers, J.-B.; Kim, J. Regional approach of waste electrical and electronic equipment (WEEE) management in France. Resour. Conserv. Recycl. 2018, 129, 45–55. [Google Scholar] [CrossRef]
- Parajuly, K.; Wenzel, H. Potential for circular economy in household WEEE management. J. Clean. Prod. 2017, 151, 272–285. [Google Scholar] [CrossRef]
- Welfens, P.; Bleischwitz, R.; Geng, Y. Resource efficiency, circular economy and sustainability dynamics in China and OECD countries. Int. Econ. Econ. Policy 2017, 14, 377–382. [Google Scholar] [CrossRef]
- United Nations. Report of the Commission on Sustainable Development Acting as the Preparatory Committee for the World Summit on Sustainable Development, 4th Session (27 May–7 June 2002); UN: New York, NY, USA, 2001. [Google Scholar]
- Bell, S.; Morse, S. Sustainability Indicators: Measuring the Immeasurable? Earthscan: London, UK, 2008; ISBN 978-1-84407-299-6. [Google Scholar]
- Mitchell, G. Problems and Fundamentals of Sustainable Development Indicators. Sustain. Dev. 1996, 4, 1–11. [Google Scholar] [CrossRef]
- Spangenberg, J.H. Environmental space and the prism of sustainability: Frameworks for indicators measuring sustainable development. Ecol. Indic. 2002, 2, 295–309. [Google Scholar] [CrossRef]
- Dewulf, J.; Van Langenhove, H. Integrating industrial ecology principles into a set of environmental sustainability indicators for technology assessment. Resour. Conserv. Recycl. 2005, 43, 419–432. [Google Scholar] [CrossRef]
- Hallstedt, S.I. Sustainability criteria and sustainability compliance index for decision support in product development. J. Clean. Prod. 2017, 140, 251–266. [Google Scholar] [CrossRef]
- United Nations. Indicators of Sustainable Development: Guidelines and Methodologies; United Nations Publications: New York, NY, USA, 2007; ISBN 978-92-1-104577-2. [Google Scholar]
- Kirchain, R.; Blanpain, B.; Meskers, C.; Olivetti, E.; Apelian, D.; Howarter, J.; Kvithyld, A.; Mishra, B.; Neelameggham, N.; Spangenberger, J. REWAS 2016: Towards Materials Resource Sustainability; Springer: Berlin, Germany, 2016; ISBN 978-3-319-48768-7. [Google Scholar]
- Filho, W.L.; Pociovalisteanu, D.-M.; Al-Amin, A.Q. Sustainable Economic Development: Green Economy and Green Growth; Springer: Berlin, Germany, 2016; ISBN 978-3-319-45081-0. [Google Scholar]
- Saidani, M.; Yannou, B.; Leroy, Y.; Cluzel, F. How to Assess Product Performance in the Circular Economy? Proposed Requirements for the Design of a Circularity Measurement Framework. Recycling 2017, 2, 6. [Google Scholar] [CrossRef]
- Behrens, A.; Taranic, I.; Rizos, V. Resource Efficiency Indicators for Policy-Making. CEPS Working Document No. 415/November 2015. Available online: https://www.ceps.eu/system/files/WD415.pdf. (accessed on 27 September 2017).
- Finkbeiner, M. Special Types of Life Cycle Assessment; Springer: Berlin, Germany, 2016; ISBN 978-94-017-7610-3. [Google Scholar]
- Elia, V.; Gnoni, M.G.; Tornese, F. Measuring circular economy strategies through index methods: A critical analysis. J. Clean. Prod. 2017, 142, 2741–2751. [Google Scholar] [CrossRef]
- Elkington, J. Cannibals with Forks: The Triple Bottom Line of 21st Century Business; New Society Publishers: Oxford, UK, 1997; ISBN 978-0-86571-392-5. [Google Scholar]
- Moriguchi, Y. Material flow indicators to measure progress toward a sound material-cycle society. J. Mater. Cycles Waste Manag. 2007, 9, 112–120. [Google Scholar] [CrossRef]
- Figge, F.; Hahn, T. Value-oriented impact assessment: The economics of a new approach to impact assessment. J. Environ. Plan. Manag. 2004, 47, 921–941. [Google Scholar] [CrossRef]
- Maio, F.D.; Rem, P.C. A Robust Indicator for Promoting Circular Economy through Recycling. J. Environ. Prot. 2015, 6, 1095. [Google Scholar] [CrossRef]
- Geng, Y.; Sarkis, J.; Ulgiati, S.; Zhang, P. Measuring China’s Circular Economy. Science 2013, 339, 1526–1527. [Google Scholar] [CrossRef] [PubMed]
- Genovese, A.; Acquaye, A.A.; Figueroa, A.; Koh, S.C.L. Sustainable supply chain management and the transition towards a circular economy: Evidence and some applications. Omega 2017, 66, 344–357. [Google Scholar] [CrossRef]
- Guogang, J.; Jing, C. Research on Evaluation of Circular Economy Development. In Proceedings of the 8th International Conference on Innovation & Management, Kitakyushu, Japan, 30 November–2 December 2011; pp. 153–157. [Google Scholar]
- Pintér, L. International Experience in Establishing Indicators for the Circular Economy and Considerations for China|IISD. Available online: http://www.iisd.org/library/international-experience-establishing-indicators-circular-economy-and-considerations-china (accessed on 11 September 2017).
- Zhijun, F.; Nailing, Y. Putting a circular economy into practice in China. Sustain. Sci. 2007, 2, 95–101. [Google Scholar] [CrossRef]
- Chertow, M.R. INDUSTRIAL SYMBIOSIS: Literature and Taxonomy. Annu. Rev. Energy Environ. 2000, 25, 313–337. [Google Scholar] [CrossRef]
- National Academy Engineering. Technological Trajectories and the Human Environment; National Academies Press: Washington, DC, USA, 1997; ISBN 978-0-309-05133-0. [Google Scholar]
- Graedel, T.E.; Allenby, B.R. Industrial Ecology; Prentice Hall: Upper Saddle River, NJ, USA, 2003; ISBN 978-0-13-046713-3. [Google Scholar]
- Tromans, S. EC Waste Law—A Complete Mess? J. Environ. Law 2001, 13, 133–156. [Google Scholar] [CrossRef]
- Bisson, K.; Proops, J.L.R. Waste in Ecological Economics; Edward Elgar Publishing: Cheltenham, UK, 2002; ISBN 978-1-84064-648-1. [Google Scholar]
- Gaba, J.M. Solid waste and recycled materials under RCRA: Separating chaff from wheat. Ecol. Law Q. 1989, 16, 623–666. [Google Scholar]
- Ayres, R.U.; Ayres, L.W.; Martinás, K. Exergy, waste accounting, and life-cycle analysis. Energy 1998, 23, 355–363. [Google Scholar] [CrossRef]
- Rosen, M.A.; Dincer, I. On Exergy and Environmental Impact. Int. J. Energy Res. 1997, 21, 643–654. [Google Scholar] [CrossRef]
- Connelly, L.; Koshland, C.P. Exergy and industrial ecology. Part 2: A non-dimensional analysis of means to reduce resource depletion. Exergy Int. J. 2001, 1, 234–255. [Google Scholar] [CrossRef]
- Gaudreau, K.; Fraser, R.A.; Murphy, S. The Tenuous Use of Exergy as a Measure of Resource Value or Waste Impact. Sustainability 2009, 1, 1444–1463. [Google Scholar] [CrossRef]
- Haas, W.; Krausmann, F.; Wiedenhofer, D.; Heinz, M. How Circular is the Global Economy? An Assessment of Material Flows, Waste Production, and Recycling in the European Union and the World in 2005. J. Ind. Ecol. 2015, 19, 765–777. [Google Scholar] [CrossRef]
- Geng, Y.; Fu, J.; Sarkis, J.; Xue, B. Towards a national circular economy indicator system in China: An evaluation and critical analysis. J. Clean. Prod. 2012, 23, 216–224. [Google Scholar] [CrossRef]
- Su, B.; Heshmati, A.; Geng, Y.; Yu, X. A review of the circular economy in China: Moving from rhetoric to implementation. J. Clean. Prod. 2013, 42, 215–227. [Google Scholar] [CrossRef]
- Guo-gang, J. Empirical Analysis of Regional Circular Economy Development—Study Based on Jiangsu, Heilongjiang, Qinghai Province. Energy Procedia 2011, 5, 125–129. [Google Scholar] [CrossRef]
- Qing, Y.; Qiongqiong, G.; Mingyue, C. Study and Integrative Evaluation on the development of Circular Economy of Shaanxi Province. Energy Procedia 2011, 5, 1568–1578. [Google Scholar] [CrossRef]
- Zaman, A.U.; Lehmann, S. The zero waste index: A performance measurement tool for waste management systems in a “zero waste city”. J. Clean. Prod. 2013, 50, 123–132. [Google Scholar] [CrossRef]
- Li, R.H.; Su, C.H. Evaluation of the circular economy development level of Chinese chemical enterprises. Procedia Environ. Sci. 2012, 13, 1595–1601. [Google Scholar] [CrossRef]
- Wen, Z.; Meng, X. Quantitative assessment of industrial symbiosis for the promotion of circular economy: A case study of the printed circuit boards industry in China’s Suzhou New District. J. Clean. Prod. 2015, 90, 211–219. [Google Scholar] [CrossRef]
- Scheepens, A.E.; Vogtländer, J.G.; Brezet, J.C. Two life cycle assessment (LCA) based methods to analyse and design complex (regional) circular economy systems. Case: Making water tourism more sustainable. J. Clean. Prod. 2016, 114, 257–268. [Google Scholar] [CrossRef]
- Park, J.Y.; Chertow, M.R. Establishing and testing the “reuse potential” indicator for managing wastes as resources. J. Environ. Manag. 2014, 137, 45–53. [Google Scholar] [CrossRef] [PubMed]
- Marković, A.; Rakočević, S.B. Proceedings of the xiv International Symposium Symorg 2014: New Business Models and Sustainable Competitiveness; FON: Belgrade, Serbia, 2014; ISBN 978-86-7680-295-1. [Google Scholar]
- Wang, Z.; Sarkis, J. Corporate social responsibility governance, outcomes, and financial performance. J. Clean. Prod. 2017, 162, 1607–1616. [Google Scholar] [CrossRef]
- Fet, A.M.; Knudson, H. Implementing Corporate Social Responsibility. In Encyclopedia of Sustainable Technologies; Abraham, M.A., Ed.; Elsevier: Oxford, UK, 2017; pp. 125–130. ISBN 978-0-12-804792-7. [Google Scholar]
- Salzman, J. Methodological Choices Encountered in the Construction of Composite Indices of Economic and Social Well-Being. In Proceedings of the Annual Meeting of the Canadian Economics Association, Ottawa, ON, CA, March 2003. [Google Scholar]
- Yu, L.; Liu, H. Efficient Feature Selection via Analysis of Relevance and Redundancy. J. Mach. Learn. Res. 2004, 5, 1205–1224. [Google Scholar]
- Manly, B.F.J.; Alberto, J.A.N. Multivariate Statistical Methods: A Primer, 4th ed.; CRC Press: Boca Raton, FL, USA, 2016; ISBN 978-1-4987-2899-7. [Google Scholar]
- Hair, J.; Anderson, R.; Black, B.; Babin, B. Multivariate Data Analysis; Pearson Education: London, UK, 2016; ISBN 978-0-13-379268-3. [Google Scholar]
- Keeble, J.J.; Topiol, S.; Berkeley, S. Using Indicators to Measure Sustainability Performance at a Corporate and Project Level. J. Bus. Ethics 2003, 44, 149–158. [Google Scholar] [CrossRef]
- Seuring, S.A.; Koplin, J.; Behrens, T.; Schneidewind, U. Sustainability assessment in the German detergent industry: From stakeholder involvement to sustainability indicators. Sustain. Dev. 2003, 11, 199–212. [Google Scholar] [CrossRef]
- Welford, R.J. Editorial: Corporate environmental management, technology and sustainable development: Postmodern perspectives and the need for a critical research agenda. Bus. Strategy Environ. 1998, 7, 1–12. [Google Scholar] [CrossRef]
- Székely, F.; Knirsch, M. Responsible Leadership and Corporate Social Responsibility: Metrics for Sustainable Performance. Eur. Manag. J. 2005, 23, 628–647. [Google Scholar] [CrossRef]
- Chan, A.P.C.; Yung, E.H.K.; Lam, P.T.I.; Tam, C.M.; Cheung, S.O. Application of Delphi method in selection of procurement systems for construction projects. Constr. Manag. Econ. 2001, 19, 699–718. [Google Scholar] [CrossRef]
- Linstone, H.A.; Turoff, M. The Delphi Method: Techniques and Applications; Addison-Wesley Pub. Co., Advanced Book Program: Boston, MA, USA, 1975; ISBN 978-0-201-04294-8. [Google Scholar]
- Rowe, G.; Wright, G. The Delphi technique as a forecasting tool: Issues and analysis. Int. J. Forecast. 1999, 15, 353–375. [Google Scholar] [CrossRef]
- Yeung, J.F.Y.; Chan, A.P.C.; Chan, D.W.M.; Li, L.K. Development of a partnering performance index (PPI) for construction projects in Hong Kong: A Delphi study. Constr. Manag. Econ. 2007, 25, 1219–1237. [Google Scholar] [CrossRef]
- Israel, D. Data Analysis in Business Research: A Step-By-Step Nonparametric Approach; SAGE Publications: New Delhi, India, 2009; ISBN 978-81-321-0093-5. [Google Scholar]
- Nardo, M.; Saisana, M.; Saltelli, A.; Tarantola, S.; Hoffman, A.; Giovannini, E. Handbook on Constructing Composite Indicators; Organisation for Economic Co-operation and Development: Paris, France, 2005. [Google Scholar]
- Rovan, J. Composite Indicators. In International Encyclopedia of Statistical Science; Lovric, M., Ed.; Springer: Berlin/Heidelberg, Geramny, 2011; pp. 275–276. ISBN 978-3-642-0 4897-5. [Google Scholar]
- Zhou, P.; Ang, B.W.; Poh, K.L. Comparing aggregating methods for constructing the composite environmental index: An objective measure. Ecol. Econ. 2006, 59, 305–311. [Google Scholar] [CrossRef]
- Arrow, K.J. Social Choice and Individual Values; Yale University Press: New Haven, CT, USA, 2012; ISBN 978-0-300-18698-7. [Google Scholar]
- Fetscherin, M. The determinants and measurement of a country brand: The country brand strength index. Fac. Publ. 2010. [Google Scholar] [CrossRef]
- Nardo, M.; Saisana, M.; Saltelli, A.; Tarantola, S. Tools for Composite Indicators Buildings; European Commission, Joint Research Centre, 2005. Available online: http://publications.jrc.ec.europa.eu/repository/bitstream/JRC31473/EUR%2021682%20EN.pdf (accessed on 18 September 2017).
- Curwin, J.; Slater, R. Quantitative Methods for Business Decisions; Cengage Learning EMEA: Boston, MA, USA, 2007; ISBN 978-1-84480-574-7. [Google Scholar]
- Farmer, T.A. Testing the Robustness of Multiattribute Utility Theory in an Applied Setting. Decis. Sci. 1987, 18, 178–193. [Google Scholar] [CrossRef]
- Hartman, L.; Painter-Morland, M. Exploring the Global Reporting Initiative Guidelines as a Model for Triple Bottom-Line Reporting. Available online: https://www.researchgate.net/publication/240635956_Exploring_the_Global_Reporting_Initiative_Guidelines_as_a_model_for_triple_bottom-line_reporting (accessed on 27 September 2017).
- Rainey, D.L. Sustainable Business Development: Inventing the Future through Strategy, Innovation, and Leadership; Cambridge University Press: Cambridge, UK, 2010; ISBN 978-1-139-45711-8. [Google Scholar]
- Feil, A.A.; Quevedo, D.M.; de Schreiber, D. An analysis of the sustainability index of micro- and small-sized furniture industries. Clean Technol. Environ. Policy 2017, 19, 1883–1896. [Google Scholar] [CrossRef]
- Latif, H.H.; Gopalakrishnan, B.; Nimbarte, A.; Currie, K. Sustainability index development for manufacturing industry. Sustain. Energy Technol. Assess. 2017. [Google Scholar] [CrossRef]
- Shuaib, M.; Seevers, D.; Zhang, X.; Badurdeen, F.; Rouch, K.E.; Jawahir, I.S. Product Sustainability Index (ProdSI). J. Ind. Ecol. 2014, 18, 491–507. [Google Scholar] [CrossRef]
- Azapagic, A. Developing a framework for sustainable development indicators for the mining and minerals industry. J. Clean. Prod. 2004, 12, 639–662. [Google Scholar] [CrossRef]
- Baumann, H.; Tillman, A.-M. The Hitch Hiker’s Guide to LCA: An Orientation in Life Cycle Assessment Methodology and Application; Professional Publishing House: Los Angeles, CA, USA, 2004; ISBN 978-91-44-02364-9. [Google Scholar]
- Krajnc, D.; Glavič, P. A model for integrated assessment of sustainable development. Resour. Conserv. Recycl. 2005, 43, 189–208. [Google Scholar] [CrossRef]
- Jacobs, R.; Goddard, M. How Do Performance Indicators Add Up? An Examination of Composite Indicators in Public Services; Social Science Research Network: Rochester, NY, USA, 2007. [Google Scholar]
- Harik, R.; Hachem, W.E.; Medini, K.; Bernard, A. Towards a holistic sustainability index for measuring sustainability of manufacturing companies. Int. J. Prod. Res. 2015, 53, 4117–4139. [Google Scholar] [CrossRef]
- Freudenberg, M. Composite Indicators of Country Performance; Organisation for Economic Co-operation and Development: Paris, France, 2003. [Google Scholar]
- Shuaib, N.A.; Mativenga, P.T. Energy demand in mechanical recycling of glass fibre reinforced thermoset plastic composites. J. Clean. Prod. 2016, 120, 198–206. [Google Scholar] [CrossRef]
- Ülengin, B.; Ülengin, F.; Güvenç, Ü. A multidimensional approach to urban quality of life: The case of Istanbul. Eur. J. Oper. Res. 2001, 130, 361–374. [Google Scholar] [CrossRef]
- Lee, Y.-J.; Huang, C.-M. Sustainability index for Taipei. Environ. Impact Assess. Rev. 2007, 27, 505–521. [Google Scholar] [CrossRef]
- Keeney, R.L.; Raiffa, H. Decisions with Multiple Objectives: Preferences and Value Trade-Offs; Cambridge University Press: Cambridge, UK, 1993; ISBN 978-0-521-43883-4. [Google Scholar]
- Cucchiella, F.; D’Adamo, I.; Gastaldi, M.; Koh, S.L.; Rosa, P. A comparison of environmental and energetic performance of European countries: A sustainability index. Renew. Sustain. Energy Rev. 2017, 78, 401–413. [Google Scholar] [CrossRef]
- Zhou, L.; Tokos, H.; Krajnc, D.; Yang, Y. Sustainability performance evaluation in industry by composite sustainability index. Clean Technol. Environ. Policy 2012, 14, 789–803. [Google Scholar] [CrossRef]
- Munda, G.; Nardo, M. Constructing Consistent Composite Indicators: The Issue of Weights; European Commission, 2005. Available online: http://publications.jrc.ec.europa.eu/repository/bitstream/JRC32434/EUR%2021834%20EN.pdf (accessed on 16 September 2017).
- Podinovskii, V.V. Criteria importance theory. Math. Soc. Sci. 1994, 27, 237–252. [Google Scholar] [CrossRef]

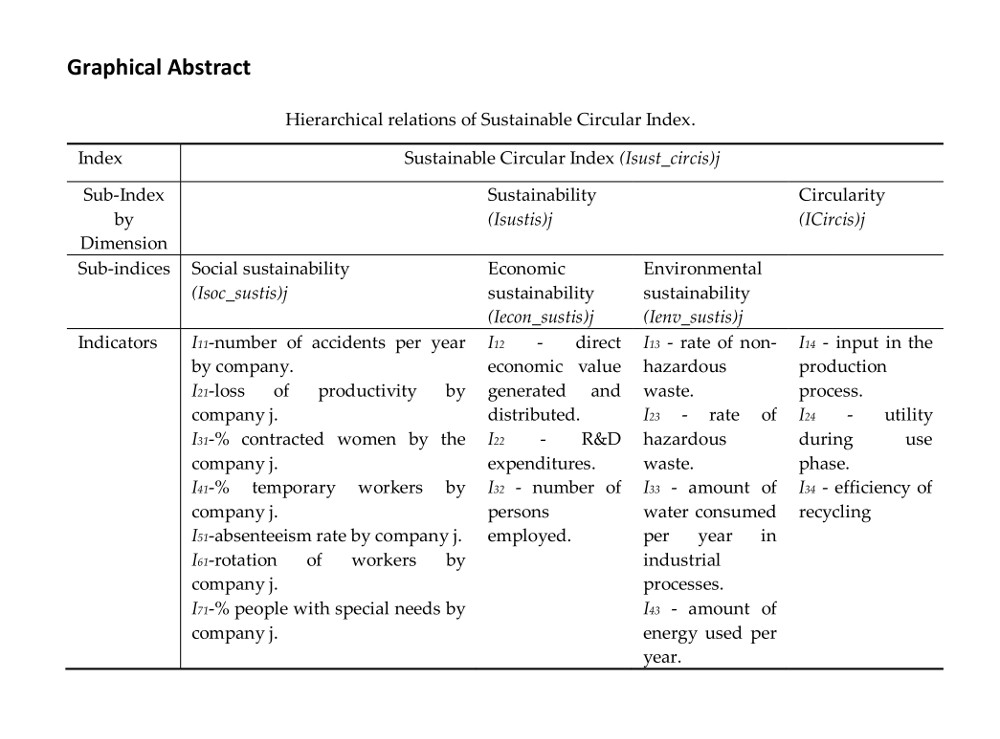
Table 1.
Method, techniques, indices to access the Circular Economy (CE).
| Level of Analysis | Reference | Description |
|---|---|---|
| National Level | [88] | Analyzed the adoption of Material flow accounting and analysis (MFA) models for measuring circular material flows. |
| [106] | Proposed a quantitative analysis based on the Economy-Wide MFA (EW-MFA) model to assess the circularity level of the European Union referred to in 2005. | |
| [107] | Discussed benefits and challenges due to the adoption of the so-called ‘Chinese national CE indicator system’, developed by the National Development and Reform Commission (NDRC). | |
| [108] | Consider four categories of indicators, as proposed by the Chinese Ministry of Environmental Protection: material reducing and recycling, economic development, pollution control and administration, and management perspectives. | |
| [60] | Pointed out four main ‘circularity areas’ to be measured at the national level: resource productivity, circular activities, waste generation and energy, and greenhouse gas GHG emissions. | |
| [107] | Discussed benefits and challenges due to the adoption of the so-called ‘Chinese national CE indicator system’, developed by the National Development and Reform Commission (NDRC). | |
| [93,109] | Proposed an index method for assessing the adoption of CE at the regional level. | |
| [110] | Discussed a similar method applied in a Chinese province by adding other categories of indicators, focusing on economic development, environment protection, and pollution reduction. | |
| [111] | Adopted the so-called ‘circular city metabolism’ measured trough a ‘zero-waste index’, based on the circularity of the waste management process in a city to compare the performance of three cities worldwide. | |
| Regional Level | [112] | Proposed a five category index method of economic development, resource exploitation, pollution reduction, ecological efficiency, and developmental potential to assess the circularity level of Chinese chemical enterprises. |
| [113] | Proposed a Resource Productivity (RP) indicator for assessing the CE paradigm level of adoption characterizing the Chinese printed circuit boards industry. | |
| [92] | Proposed a hybrid life cycle assessment (LCA) model combining traditional LCA with an environmental input-output analysis to compare the performances of circular production systems in two process industries (food and chemical). | |
| [114] | Applied the LCA Eco-cost and Value Ratio (EVR) model as a single indicator, integrating effectively the costs, eco-costs, and market value to assess the level of CE adoption in a regional water recreation park. | |
| Company Level | [60] | Proposed an index, called Material Circularity Indicator (MCI), to measure how restorative flows are maximized and linear flows are minimized, considering also the length and intensity of the product’s use. |
| [90] | Proposed the Circular Economy Index (CEI), which is defined as the ratio between the material value obtained from recycled products and the one entering the recycling facility. | |
| [115] | Proposed the Reuse Potential Indicator (RPI), which indicates how much a material is ‘resource-like’ rather than ‘waste-like’, attending to the current available technologies. |
Table 2.
Suggested sustainability indicators.
| Dimension of Sustainability | Sustainability Indicators | Source | Unit of Measure |
|---|---|---|---|
| Social G4—LA2 | Number of accidents per year by organization | G4—LA6 Accident rate (TA) | Quantity |
| Loss of productivity by organization i | G4—LA7 | % | |
| Percentage of contracted women by the organization i | G4—LA12 Composition of governance bodies and breakdown of employees per employee category according to gender, age, and other indicators of diversity | % | |
| Percentage of temporary workers by organization i | G4—LA4 | % | |
| Absenteeism rate by organization i | G4—LA6 Type of injury and injury rates, diseases, lost days, absenteeism, and work-related deaths | % | |
| Rotation of workers by organization i | G4—LA1 Total number and rate of new employee hires and employee turnover | Quantity | |
| Percentage of people with special needs by organization i | G4—LA12 | % | |
| Economic | Direct economic value generated and distributed | G4—EC1 (operating costs + salaries and employee benefits + payment to suppliers of capital) | € |
| Research and development expenditures | [123,124,125] | € | |
| Number of persons employed | [126] | Quantity | |
| Environmental | Rate of non-hazardous waste | ISO 14031 | % |
| Rate of hazardous waste | ISO 14031 | % | |
| Amount of water consumed per year in industrial processes | ISO 14031 | m3 | |
| Amount of energy used per year | G4—EN3 Power consumption within the organization ISO 14031 | kW/h |
Table 3.
Circularity Indicators.
| Indicator | Characterization | Calculation | Unit of Measure |
|---|---|---|---|
| Input in the production process | Quantity of the inputs that are coming from virgin and recycled materials and reused components. | The amount of virgin material (VM) for each sub-assembly, part, and/or material: V(x) = M(x)(1 − FR(x) − FU(x)), where M(x)—Mass of a product x FR(x)—Fraction of mass of a product’s feedstock x from recycled sources; FU(x)—Fraction of mass of a product’s feedstock x from reused sources The total amount of virgin material: Wo(x) = M(x)(1 − CR(x) − CU(x)), where: CR(x)—Fraction of mass of a product x being collected to go into a recycling process and CU(x)—Fraction of mass of a product x going into component reuse | Quantity |
| Utility during use phase | Lifetime and intensity of the product used compared to an industry average product of similar type. This considers the increased durability of products and also repair/maintenance and shared consumption business models. | Lav.—This is based on the premise that, if the lifetime of a product is doubled, the waste created and the virgin materials used per year by the linear portion of a product’s flow are halved. U/Uav—Reflects the extent to which a product is used to its full capacity. U—Number of functional units achieved during the use of a product. Uav The number of functional units achieved during the use of an industry-average product of similar type. It is expected that, in most cases, either lifetimes or functional units, but not both, will be used to calculate UtilusePhase. If lifetimes are used exclusively, this means assuming that LU/ULav = 1. If functional units are used exclusively, this means assuming U/Uav = 1. | Quantity |
| Efficiency of recycling | Quantifies how efficient are the recycling processes used to produce recycled input and to recycle material after use. | The values of efficiency of the recycling process for a specific material and recycling process will depend on a wide range of factors such as: material(s)—some materials are easier to recycle and will often have higher recycling efficiency; the quantity of material(s) involved; the recycling preparation process—higher efficiency can be expected when product disassembly takes place prior to material recovery; Values for recycling efficiency can be derived from various sources, for example: Reference Documents on Best Available Techniques from the European IPPC Bureau; U. Arena, “LCA of a Plastic Packaging Recycling System”, the International Journal of Life Cycle Assessment, March 2003, Volume 8, Issue 2, pages 92 to 98; P. Shonfield, “LCA of Management Options for Mixed Waste Plastics”, WRAP, 2008. | Percentage |
Table 4.
Index dimensions and corresponding indicators to assess the Sustainable Circular behavior of companies.
Table 4.
Index dimensions and corresponding indicators to assess the Sustainable Circular behavior of companies.
| Index Dimensions (Iis) | Indicators |
|---|---|
| Ii1 = Social Sustainability | I11—number of accidents per year by company |
| I21—loss of productivity by company j | |
| I31—percentage of contracted women employed by company j | |
| I41—percentage of temporary workers employed by company j | |
| I51—absenteeism rate by company j | |
| I61—rotation of workers by company j | |
| I71—percentage of people with special needs employed by company j | |
| Ii2 = Economic sustainability | I12—direct economic value generated and distributed |
| I22—research and development expenditures | |
| I32—number of persons employed | |
| Ii3 = Environmental sustainability | I13—rate of non-hazardous waste |
| I23—rate of hazardous waste | |
| I33—amount of water consumed per year in industrial processes | |
| I43—amount of energy used per year | |
| Ii4 = Circularity | I14—input in the production process |
| I24—utility during use phase | |
| I34—efficiency of recycling |
Table 5.
Hierarchical relations of the Sustainable Circular Index.
| Index | Sustainable Circular Index (Isust_circis)j | |||
|---|---|---|---|---|
| Sub-Index by Dimension | Sustainability (Isustis)j | Circularity (ICircis)j | ||
| Sub-indices | Social sustainability (Isoc_sustis)j | Economic sustainability (Iecon_sustis)j | Environmental sustainability (Ienv_sustis)j | |
| Indicators | I11—number of accidents per year by company. I21—loss of productivity by company j. I31—percentage of contracted women employed by company j. I41—percentage of temporary workers employed by company j. I51—absenteeism rate by company j. I61—rotation of workers by company j. I71—percentage of people with special needs employed by company j. | I12—direct economic value generated and distributed. I22—research and development expenditures. I32—number of persons employed. | I13—rate of non-hazardous waste. I23—rate of hazardous waste. I33—amount of water consumed per year in industrial processes. I43—amount of energy used per year. | I14—input in the production process. I24—utility during use phase. I34—efficiency of recycling |
© 2017 by the authors. Licensee MDPI, Basel, Switzerland. This article is an open access article distributed under the terms and conditions of the Creative Commons Attribution (CC BY) license (http://creativecommons.org/licenses/by/4.0/).
Share and Cite
MDPI and ACS Style
Azevedo, S.G.; Godina, R.; Matias, J.C.d.O. Proposal of a Sustainable Circular Index for Manufacturing Companies. Resources 2017, 6, 63. https://doi.org/10.3390/resources6040063
AMA Style
Azevedo SG, Godina R, Matias JCdO. Proposal of a Sustainable Circular Index for Manufacturing Companies. Resources. 2017; 6(4):63. https://doi.org/10.3390/resources6040063
Chicago/Turabian StyleAzevedo, Susana Garrido, Radu Godina, and João Carlos de Oliveira Matias. 2017. "Proposal of a Sustainable Circular Index for Manufacturing Companies" Resources 6, no. 4: 63. https://doi.org/10.3390/resources6040063
Note that from the first issue of 2016, this journal uses article numbers instead of page numbers. See further details here.