
A Qualitative Hydro-Geomorphic Prediction of the Destiny of the Mojana Region (Magdalena-Cauca Basin, Colombia), to Inform Large Scale Decision Making


Abstract
:1. Introduction
- The approach lacks a holistic view of the whole set of development interventions envisaged within the different planning instruments (i.e., looking at them all together).
- The likely effects of the different development projects on the future geomorphic evolution of the river system have not been considered nor assessed.
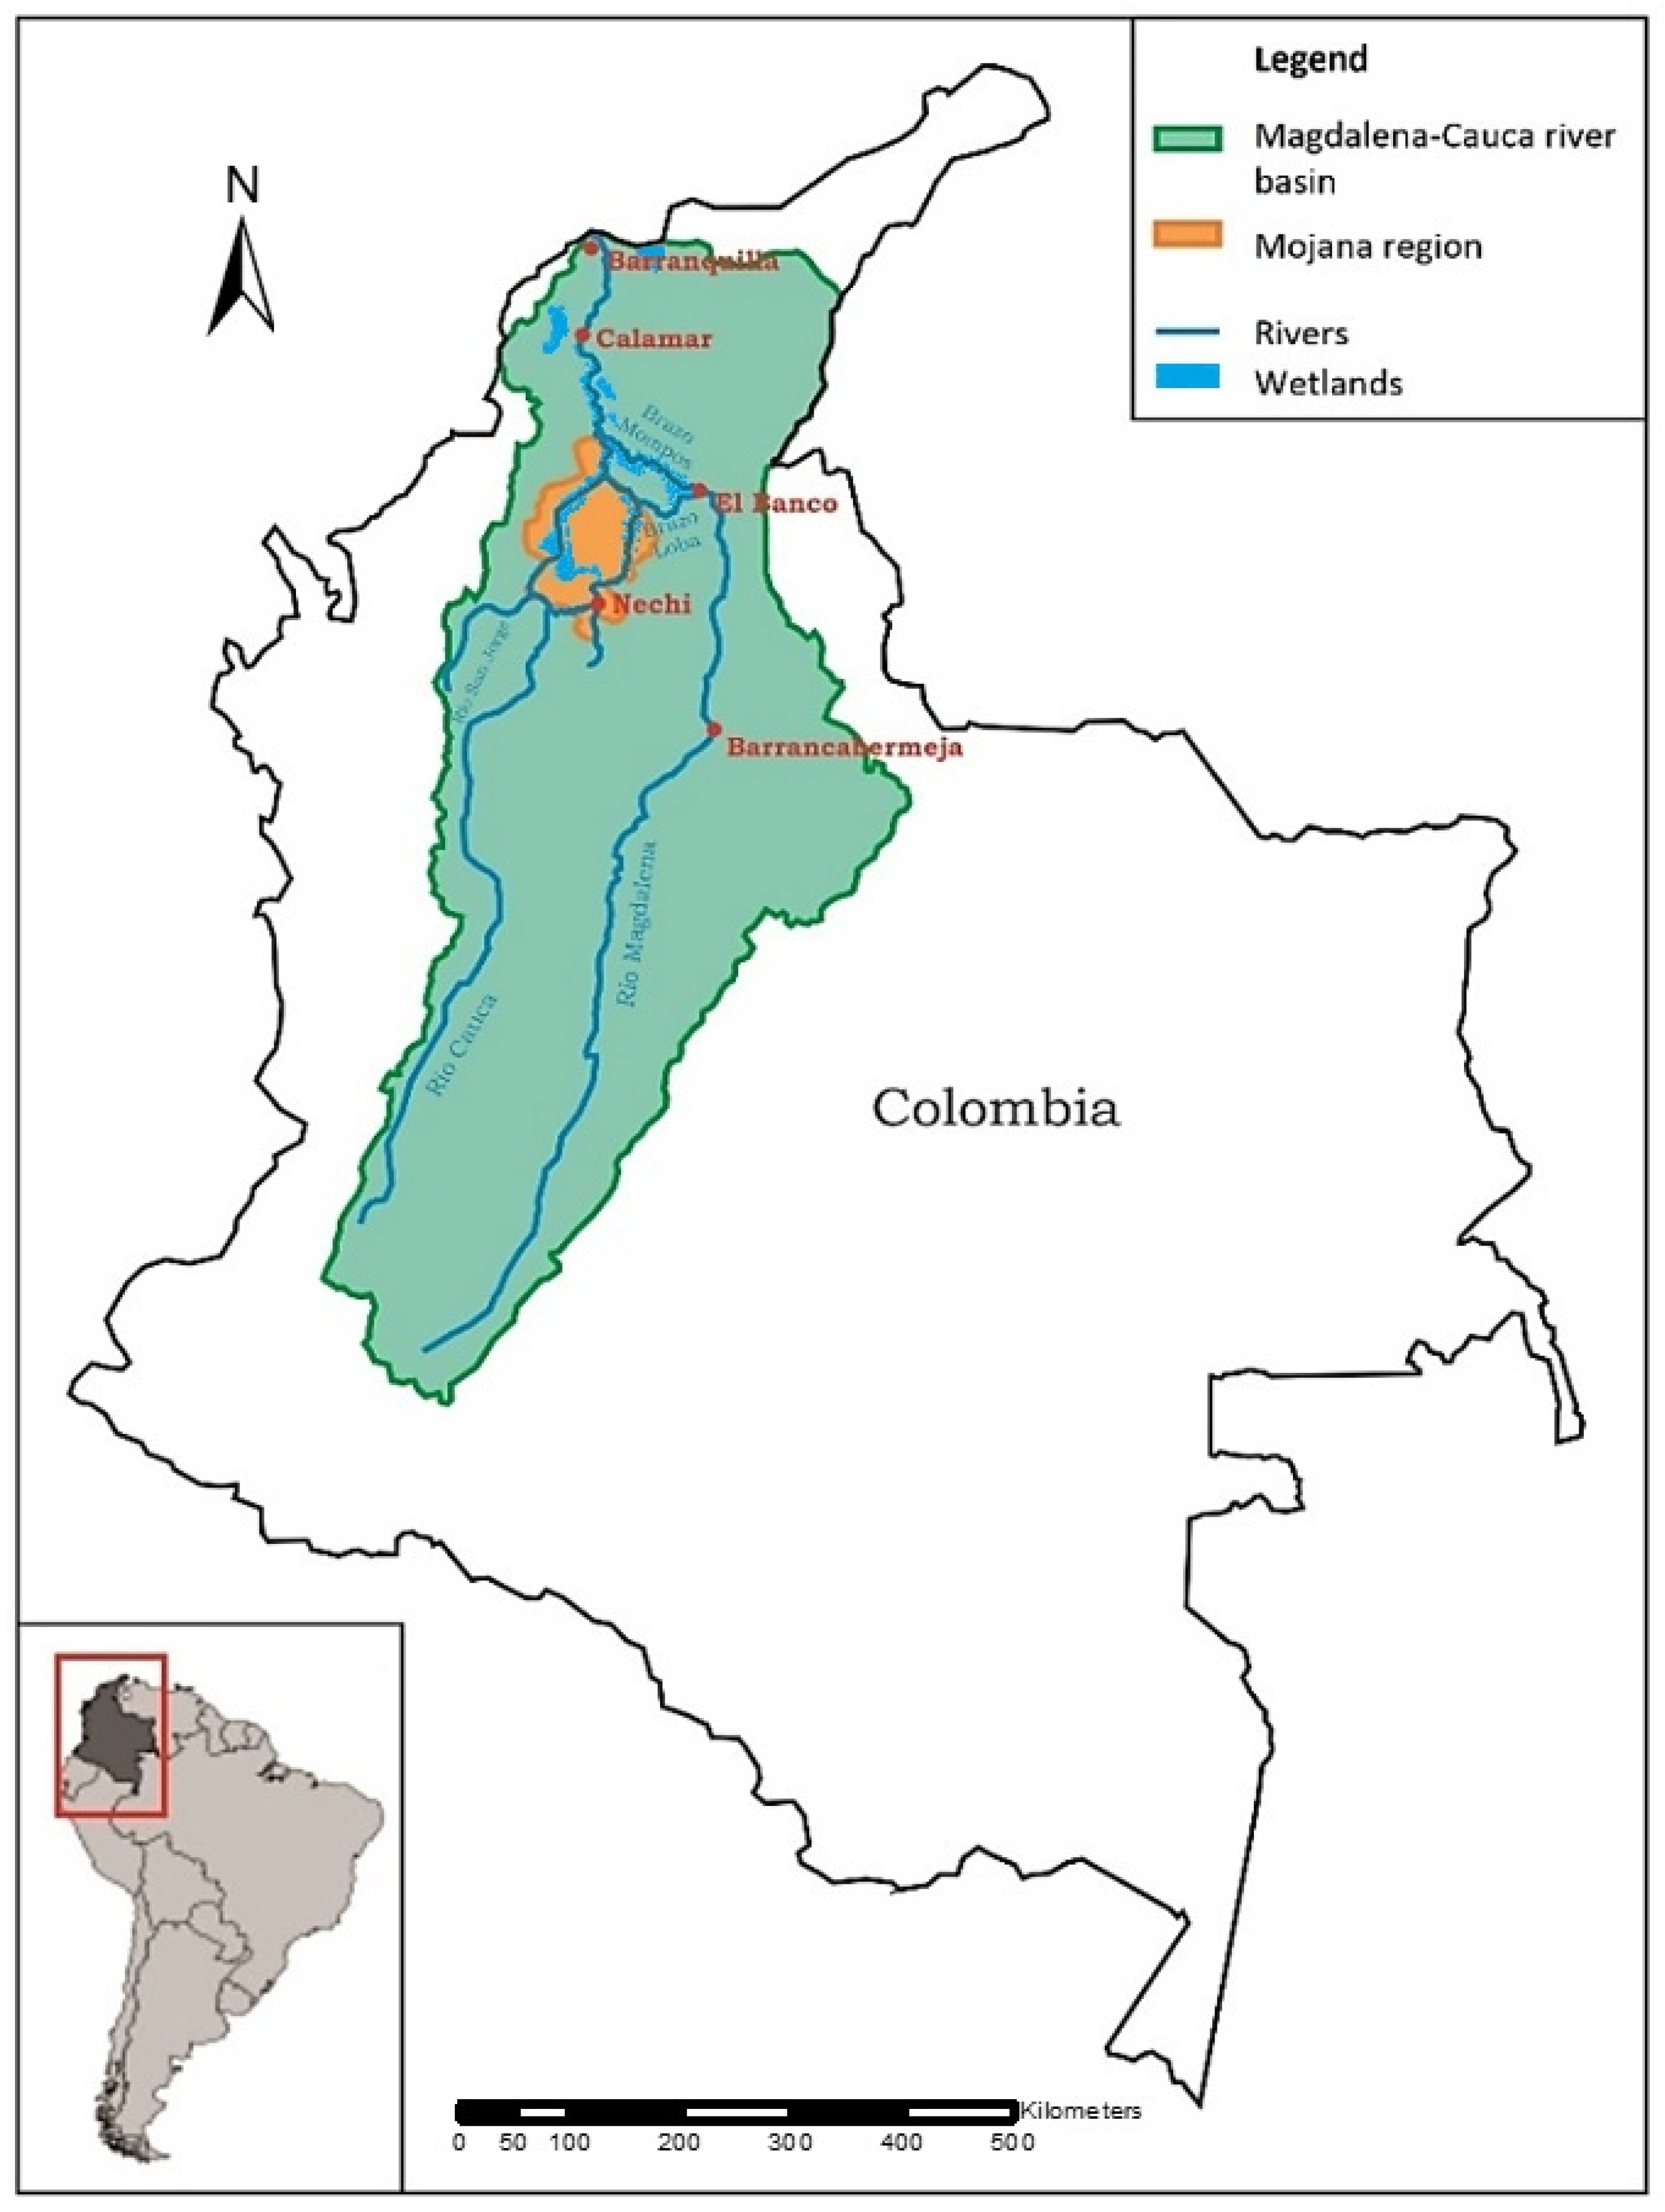
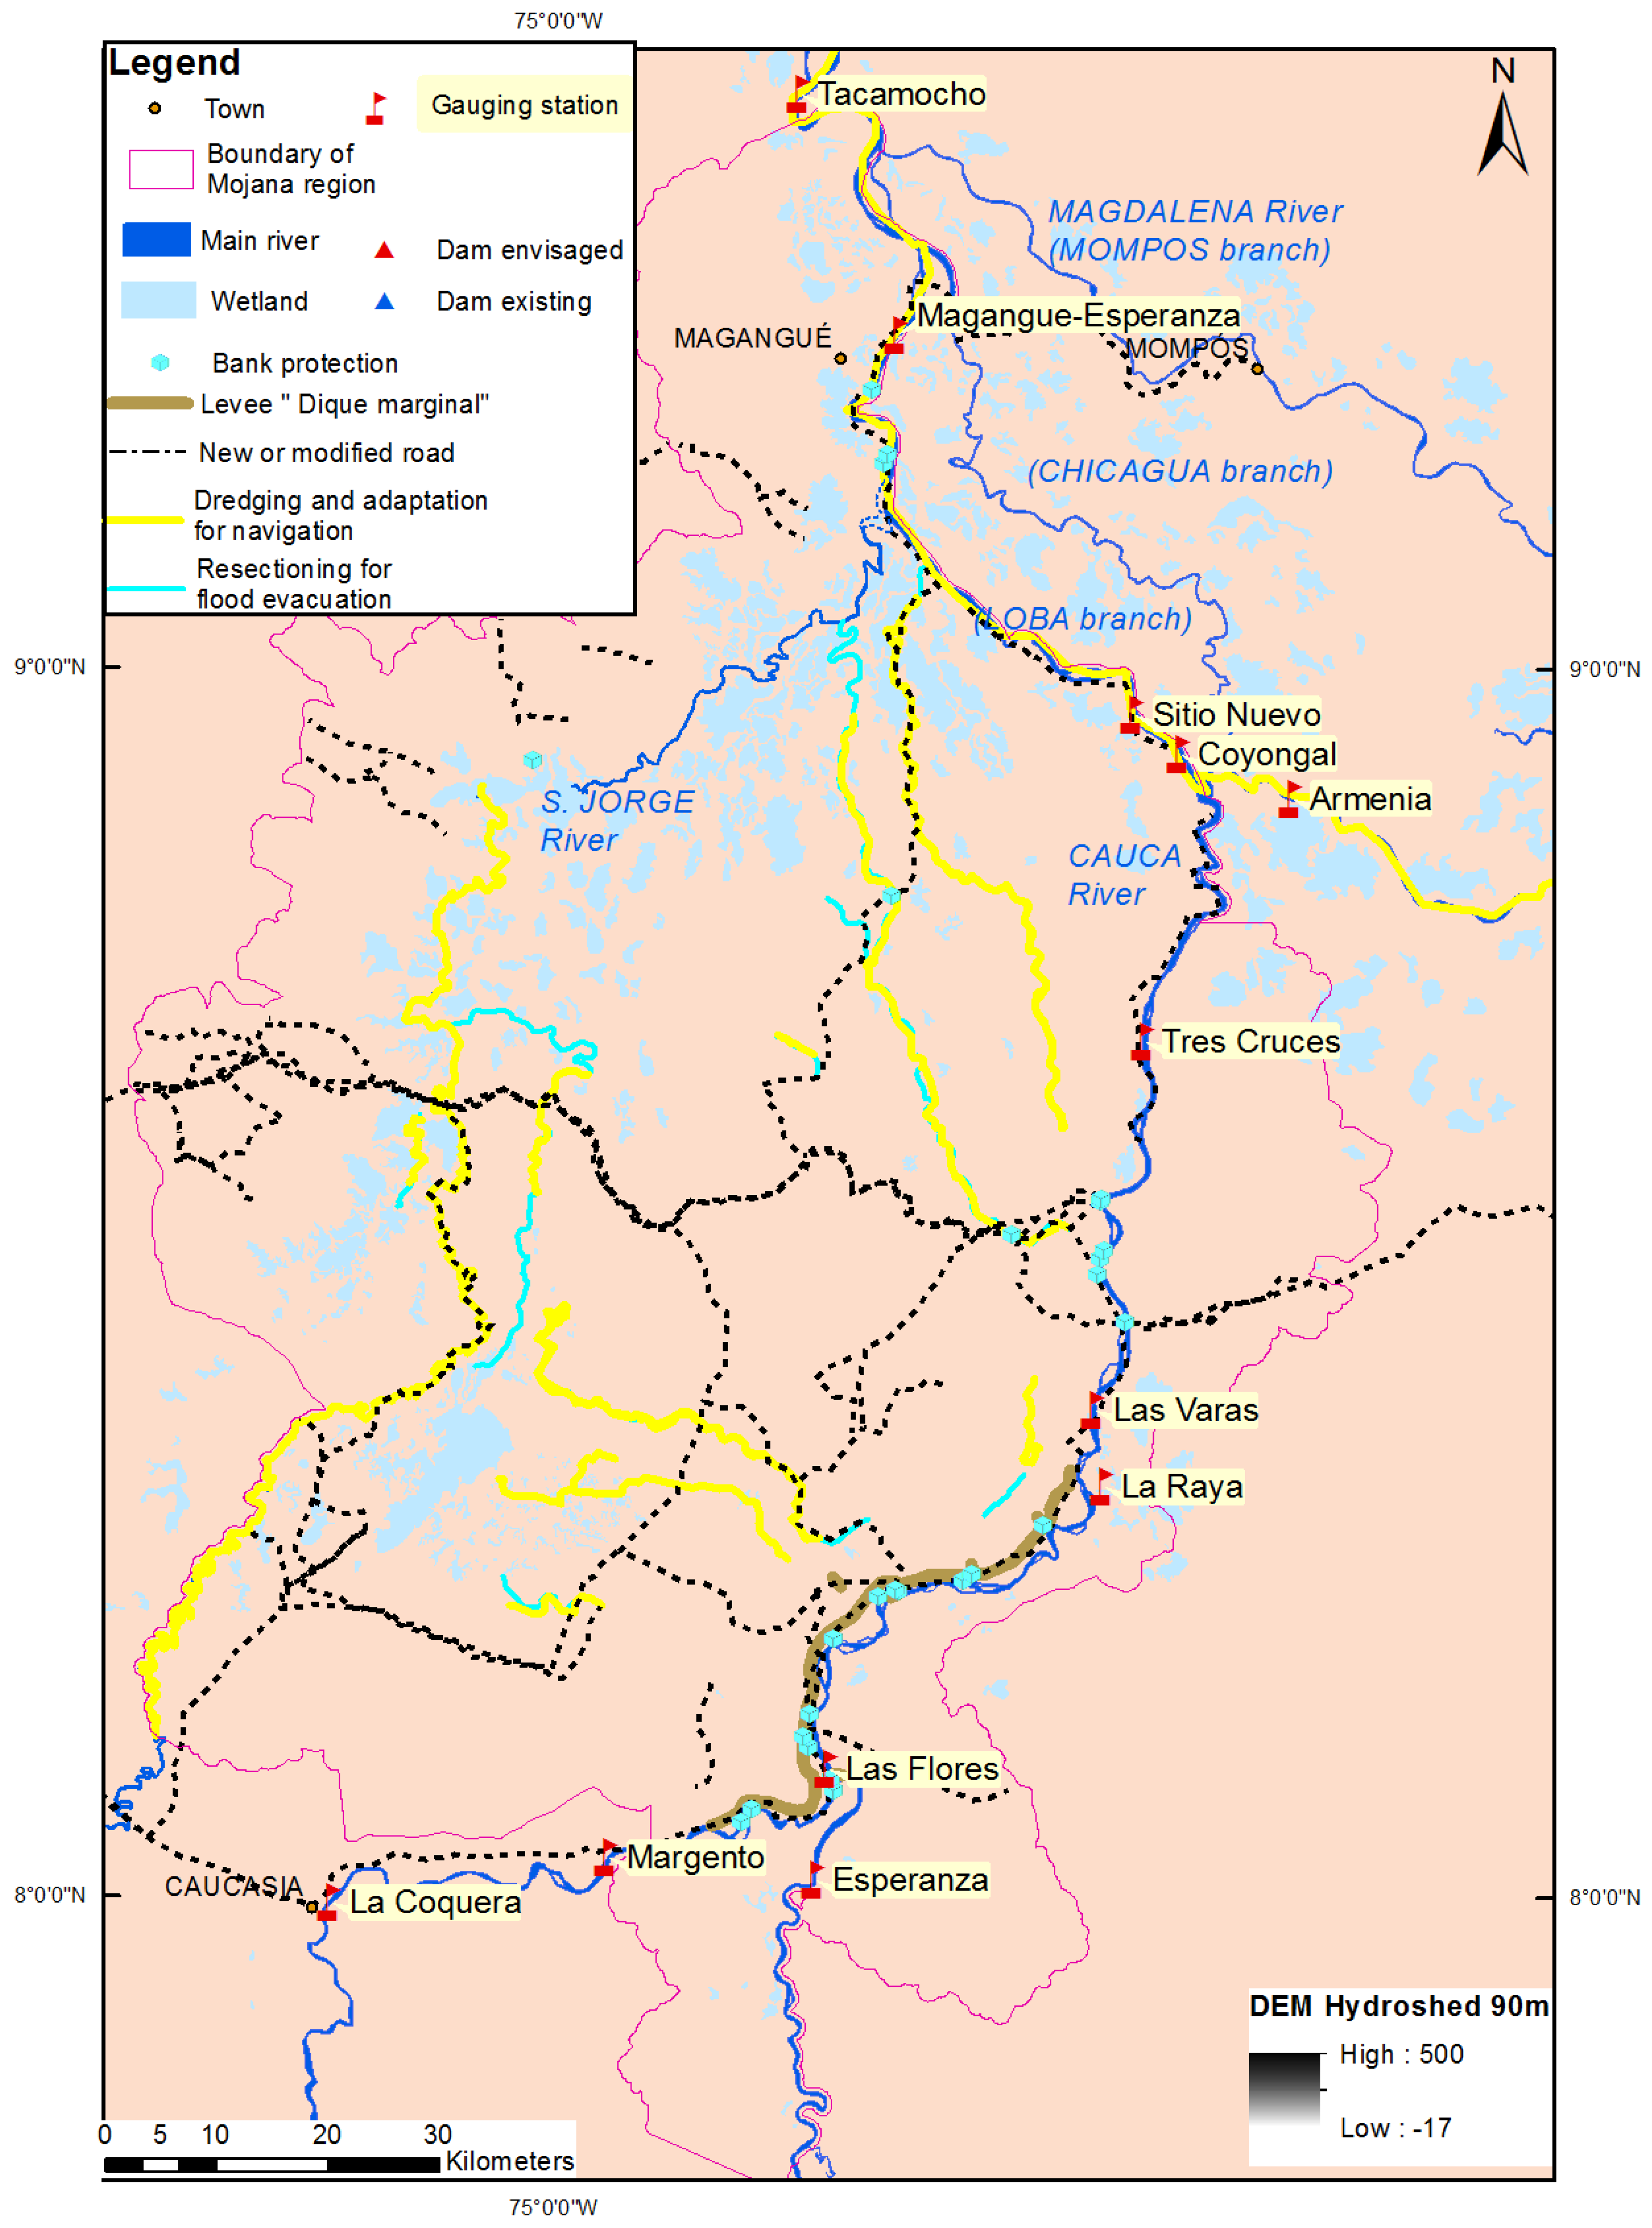
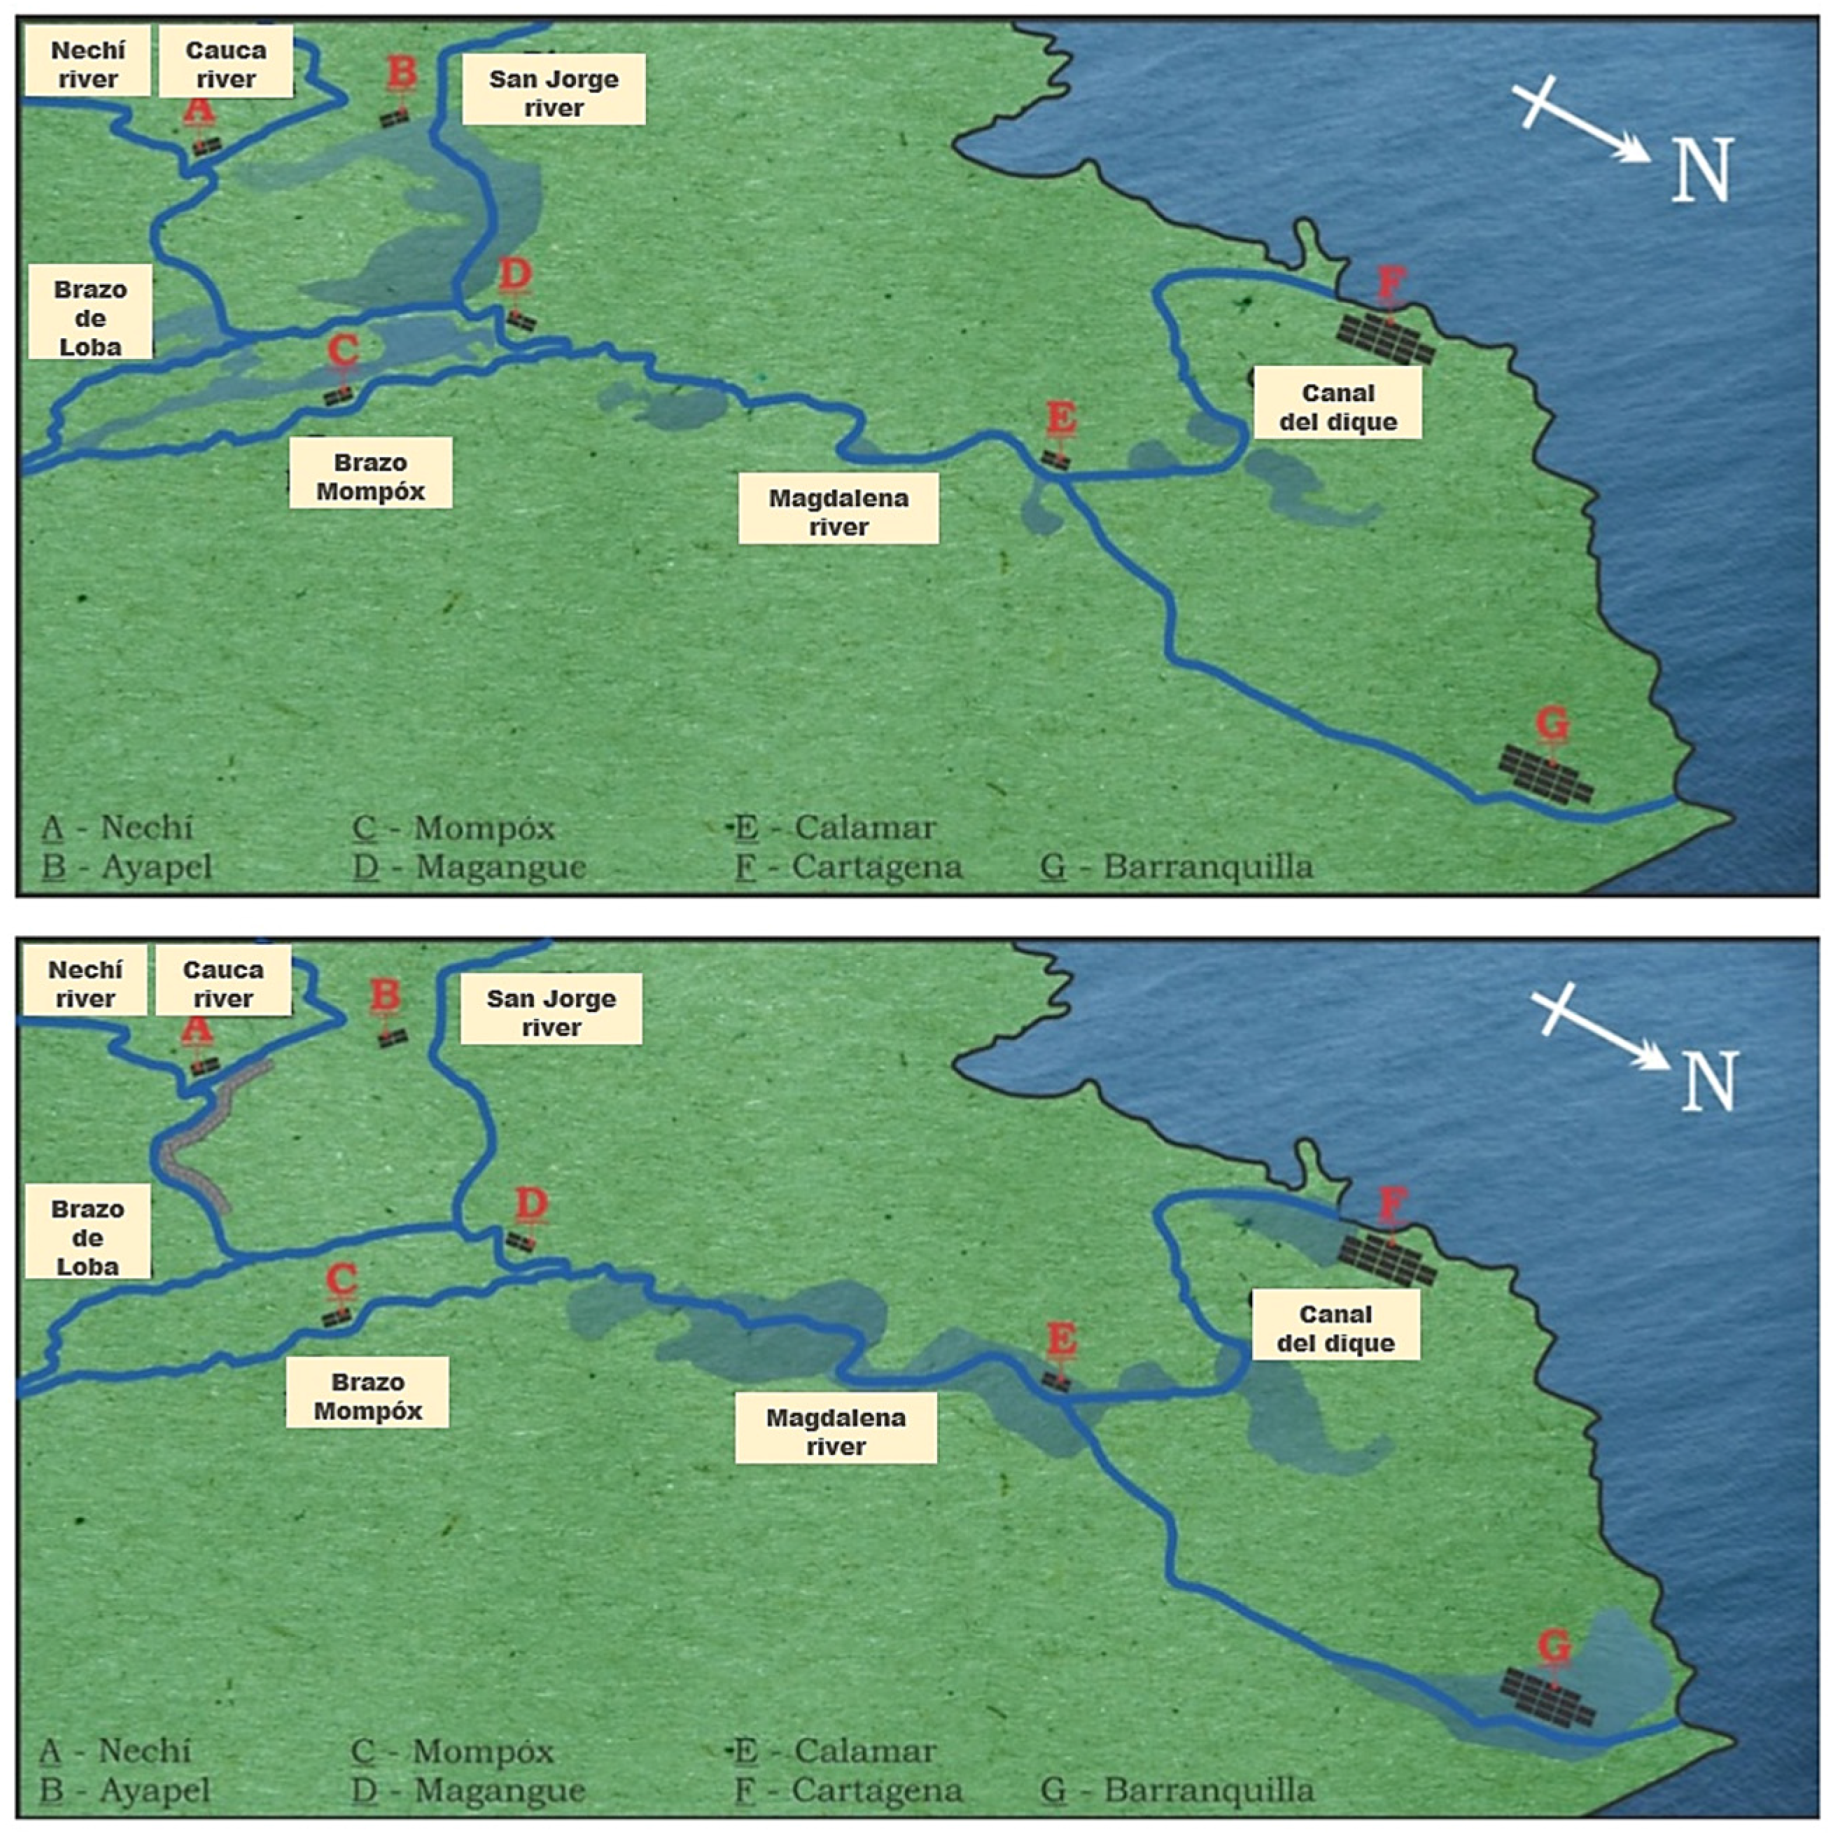
2. The Mojana Region
2.1. Physiography and Peculiarities
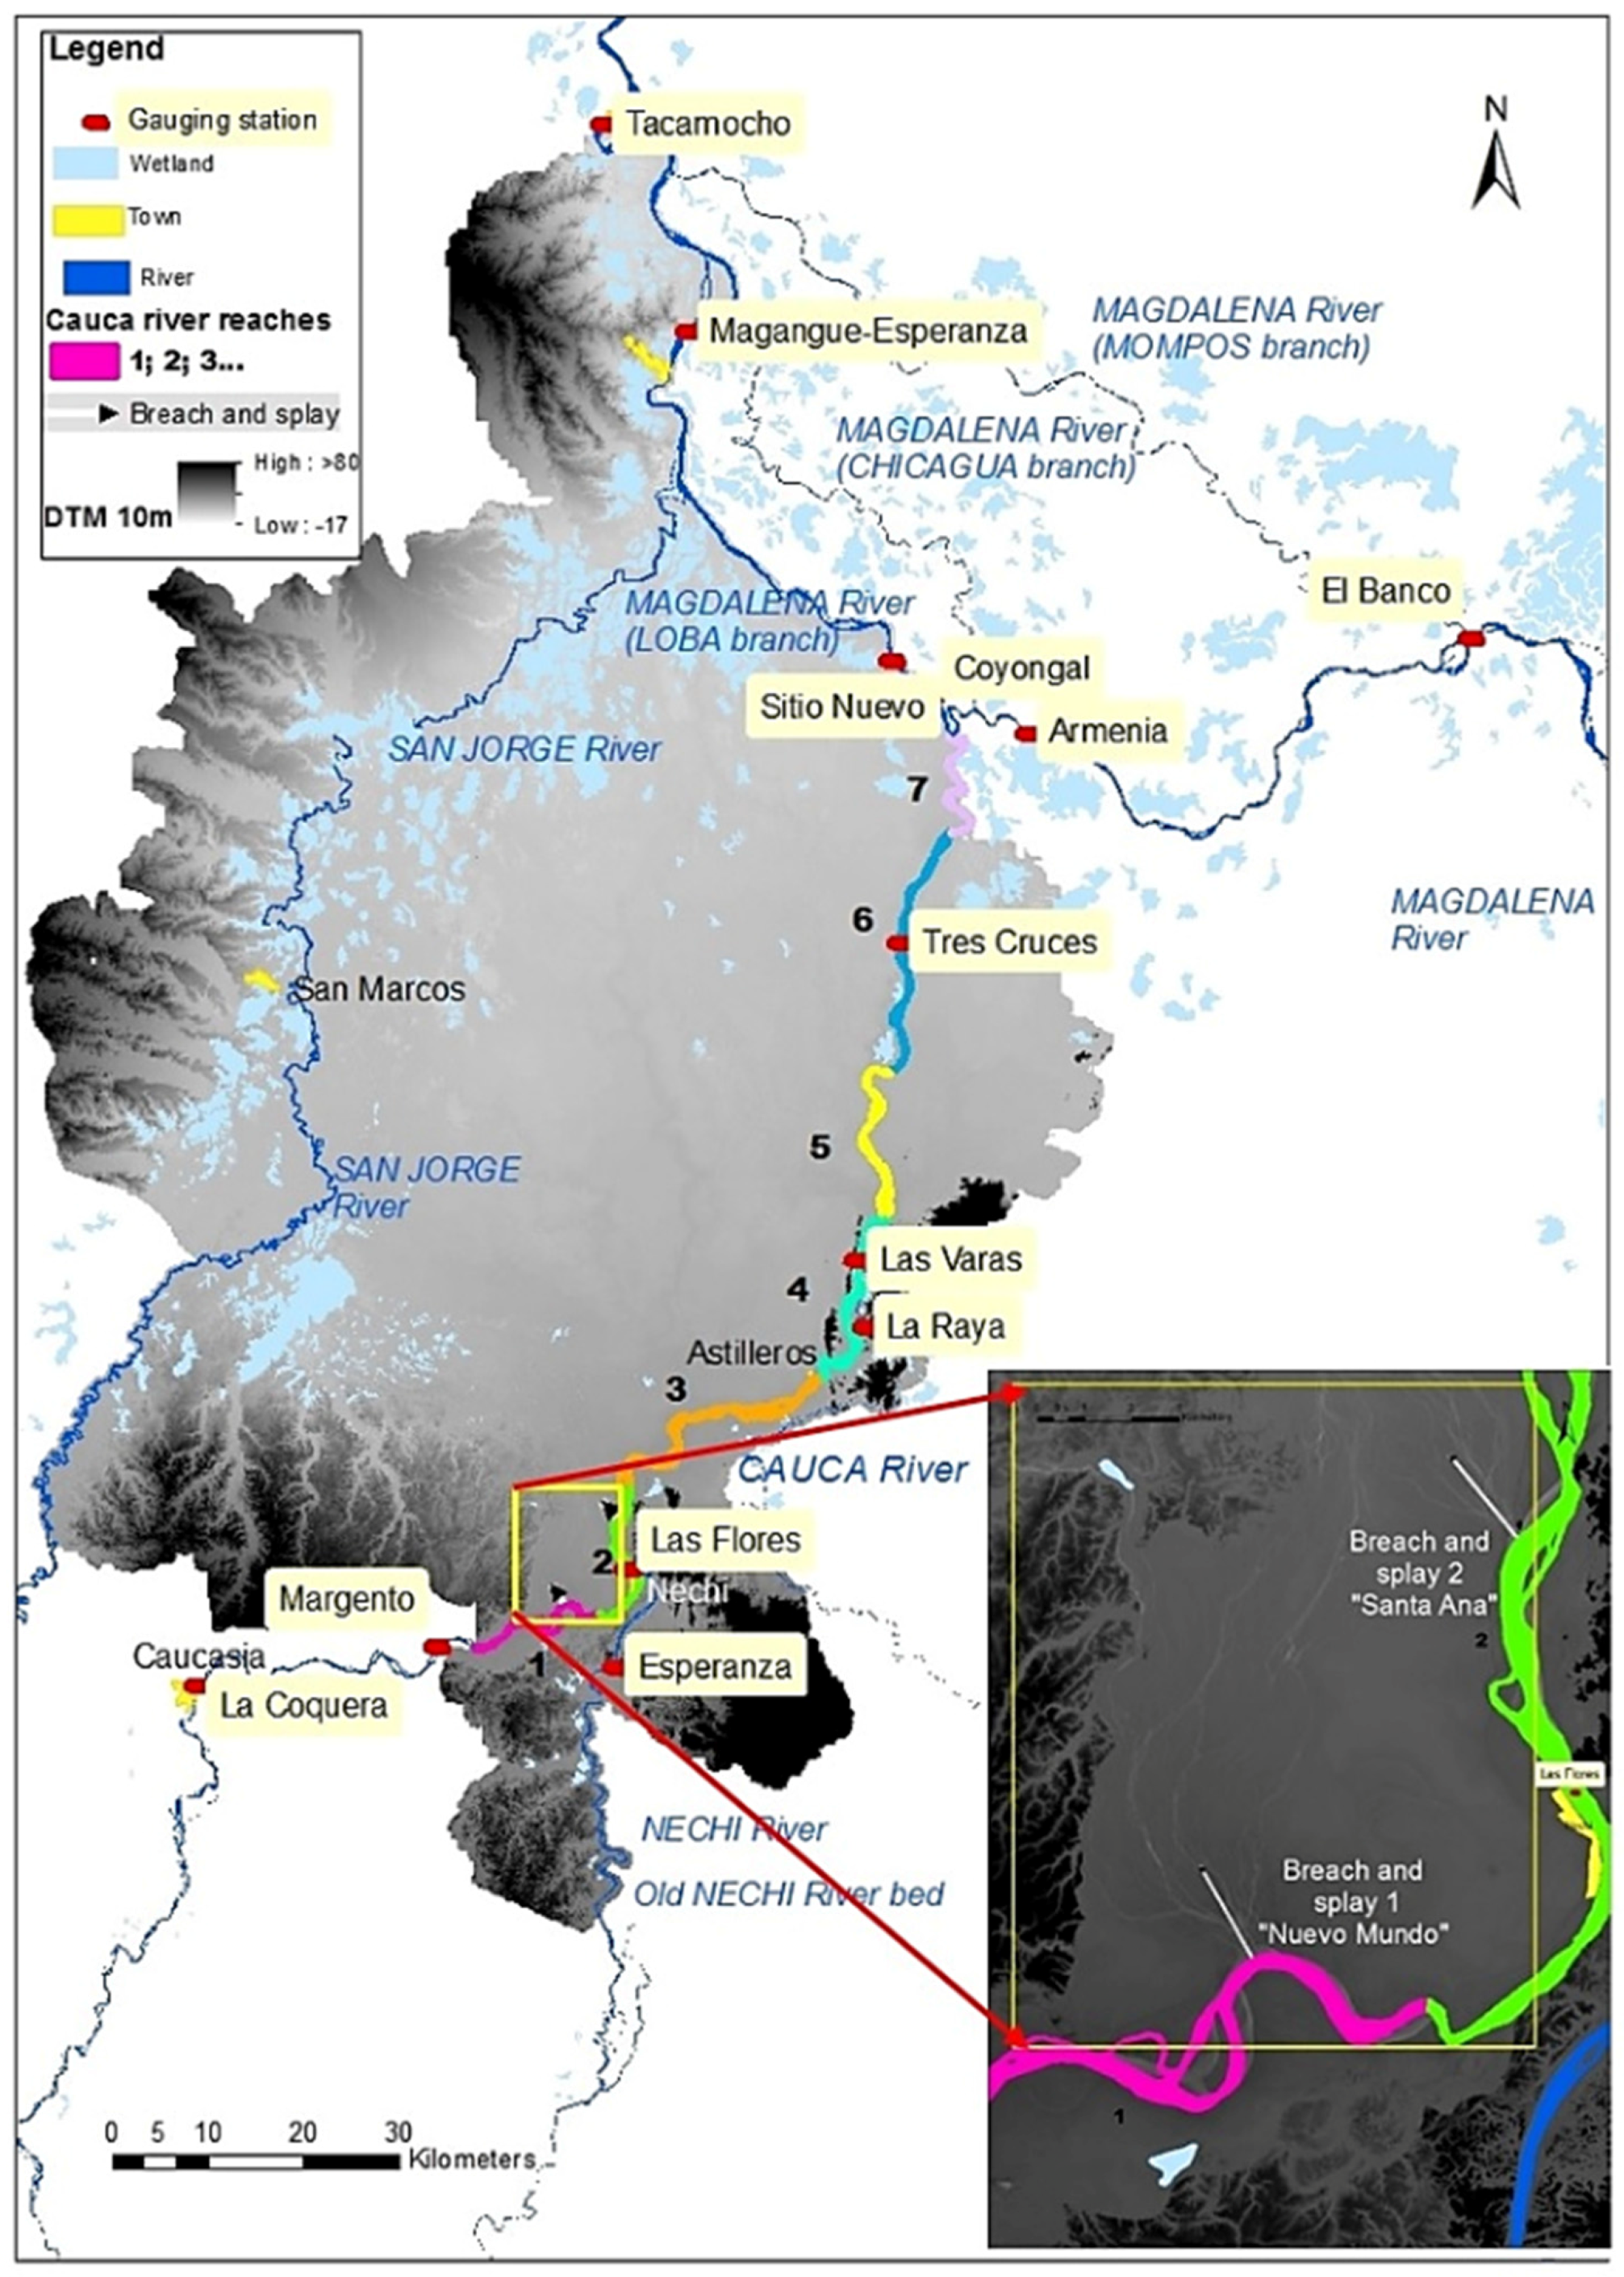
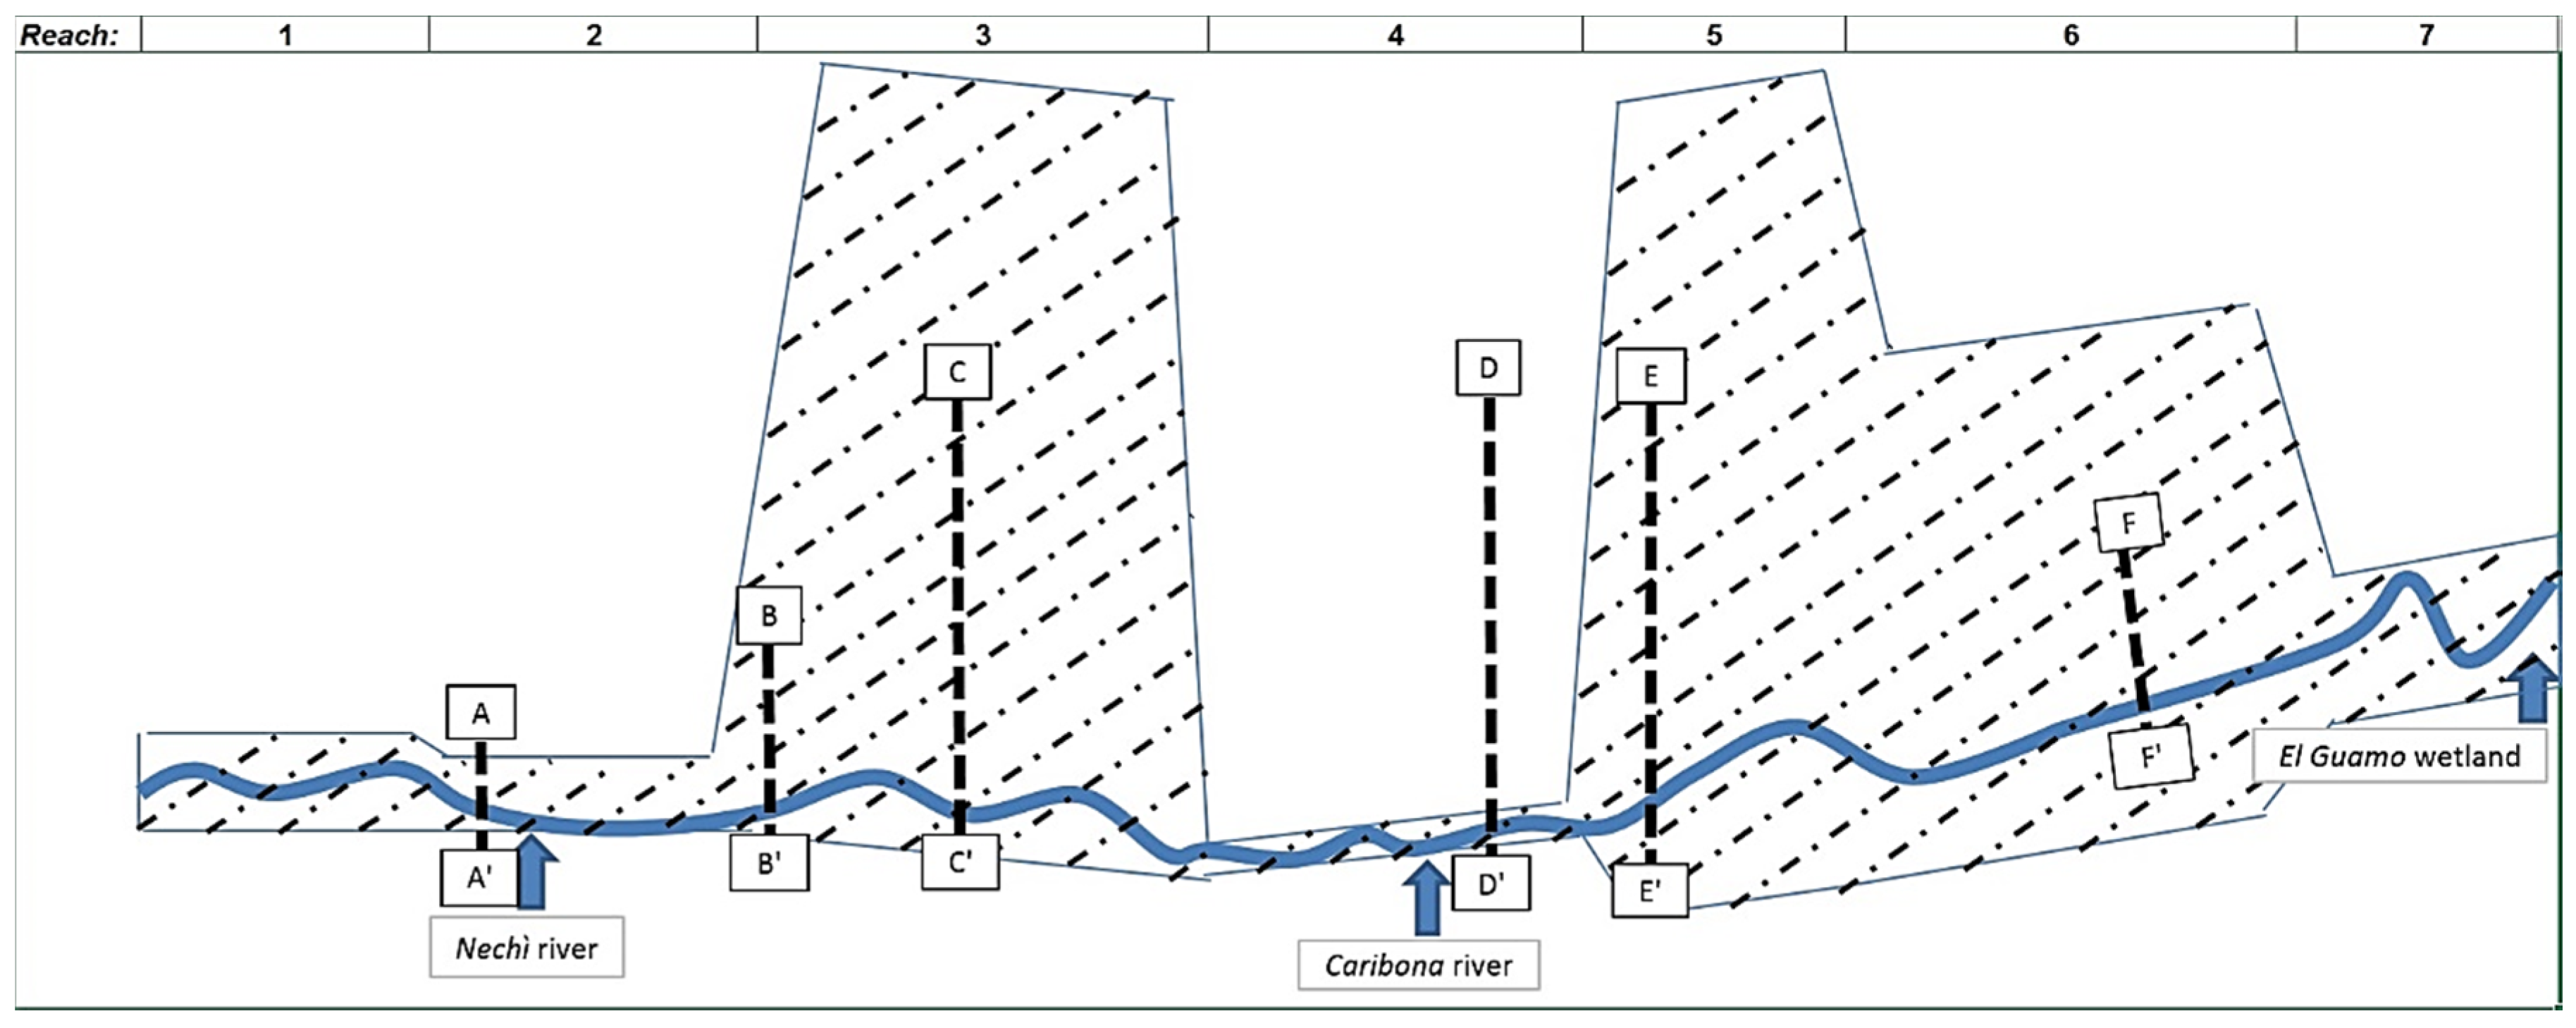
2.2. Rapid River Style Assesment
- It is this river that historically produced the harshest damage due to its geomorphic behavior.
- It greatly influences the hydrological dynamics of the humedales (wetlands) as a result of its periodic overflowing events.
- It is in its basin that most of the future dams are envisaged.
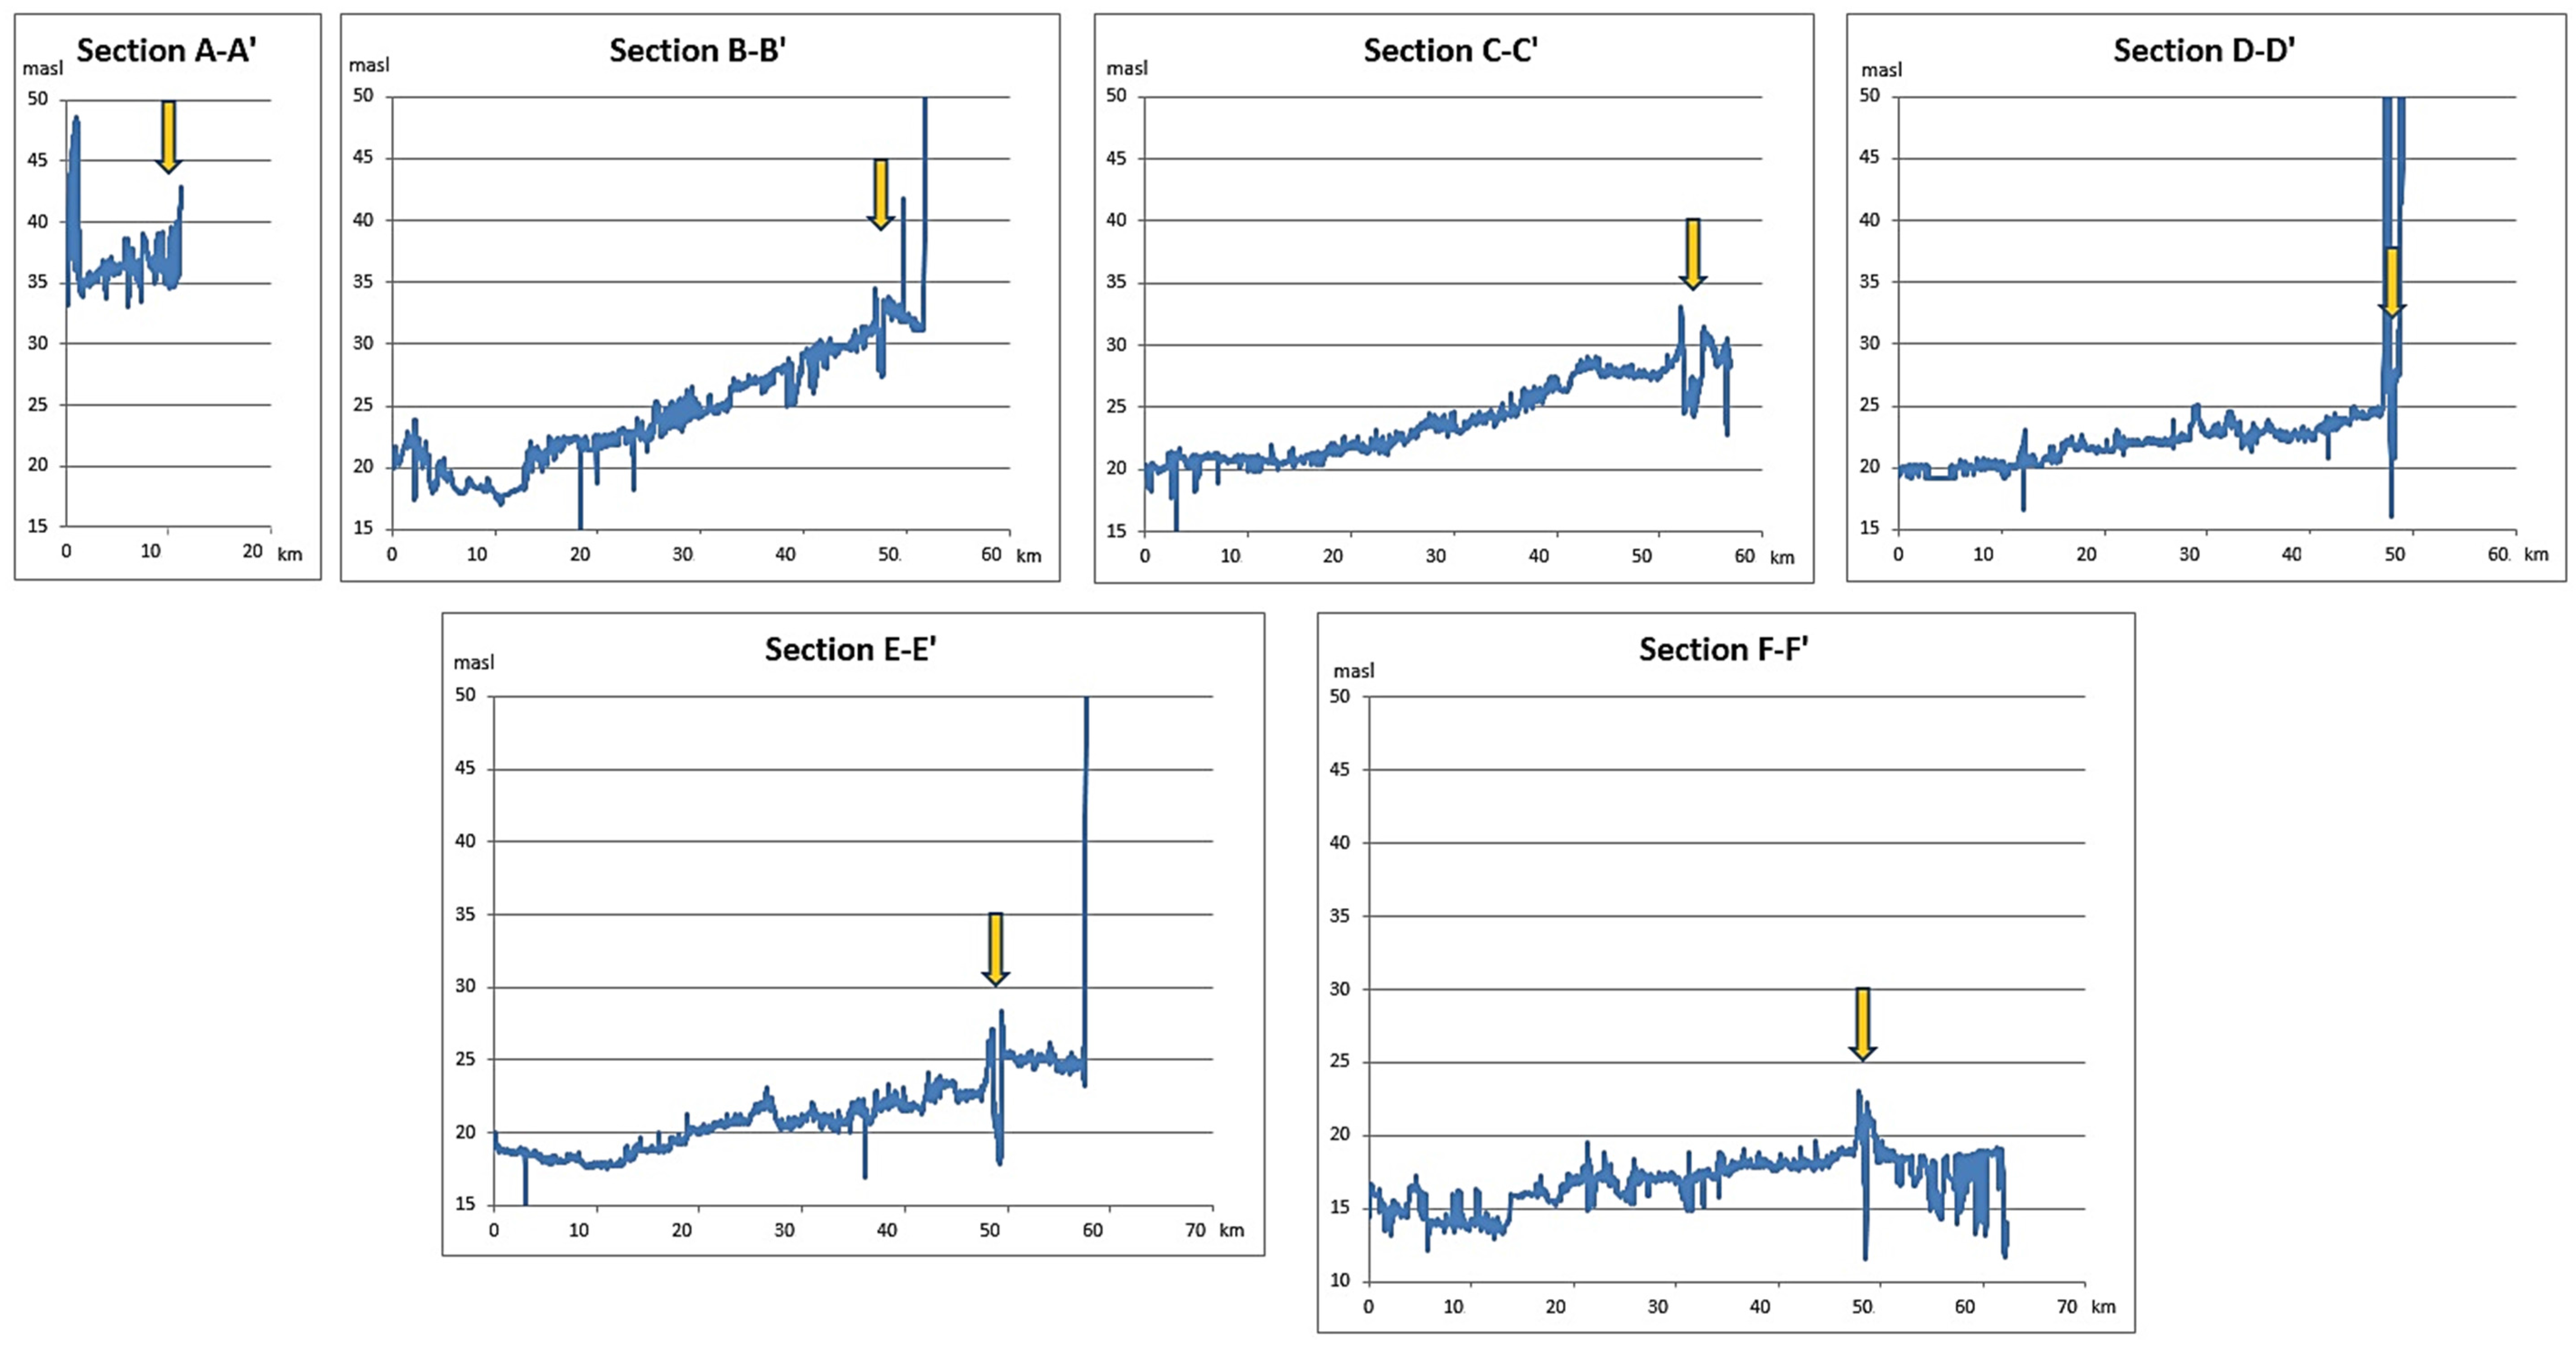
- The “start (yS) and end yE) elevations” refer to the valley altitude (extracted in an approximated fashion from the DTM 10 m) in a representative point outside the natural levees (when present), at the beginning and end of a reach
- Valley slope (i) is determined as the difference between start and end elevations, divided by its length (and expressed as ×1000), i.e., i = [(yS − yE)/Lv ] × 1000
- Bankfull flows (assumed to coincide with the 2 years recurrence time flow, calculated from IDEAM daily time series data between 1974 and 2008; the last reach value is instead taken from [1], Figures 4–7, p. 491). These are preliminary data; we assume they are sufficiently representative for this preliminary assessment
- Sinuosity: ratio between reach axis length and valley length (s = L/Lv)
- Meanders belt width (B): approximated, average width of the corridor occupied by the river (envelop of its meanders)
- River slope (iR): determined as valley slope reduced by the sinuosity ((iR = i/s); this is valid provided that river depth does not change significantly, an information currently missing (expressed in ×1000)
- Horizontal surface area (A) of the bankfull channel in a reach, calculated from GIS polygons
- Bankfull channel width (w), obtained as ratio between surface area and reach length (w = A/L)
- Bankfull depth (h): purely indicative data, inferred from [1] (Tables 6–17, p. 415) to give at least an idea of the w/h ratio
- Entrenchment: ratio (w/V) between bankfull channel width and valley width
- Pseudo-entrenchment: ratio (B/V) between meanders belt width B and valley width V; it gives a clear idea on how much the river is free to express its planform dynamics
- Specific stream power: γ QB iR /w [Watt/m2], where γ: water specific weight (approximately: 1000 kg/m3 = 9.81 × 1000 N/m3)
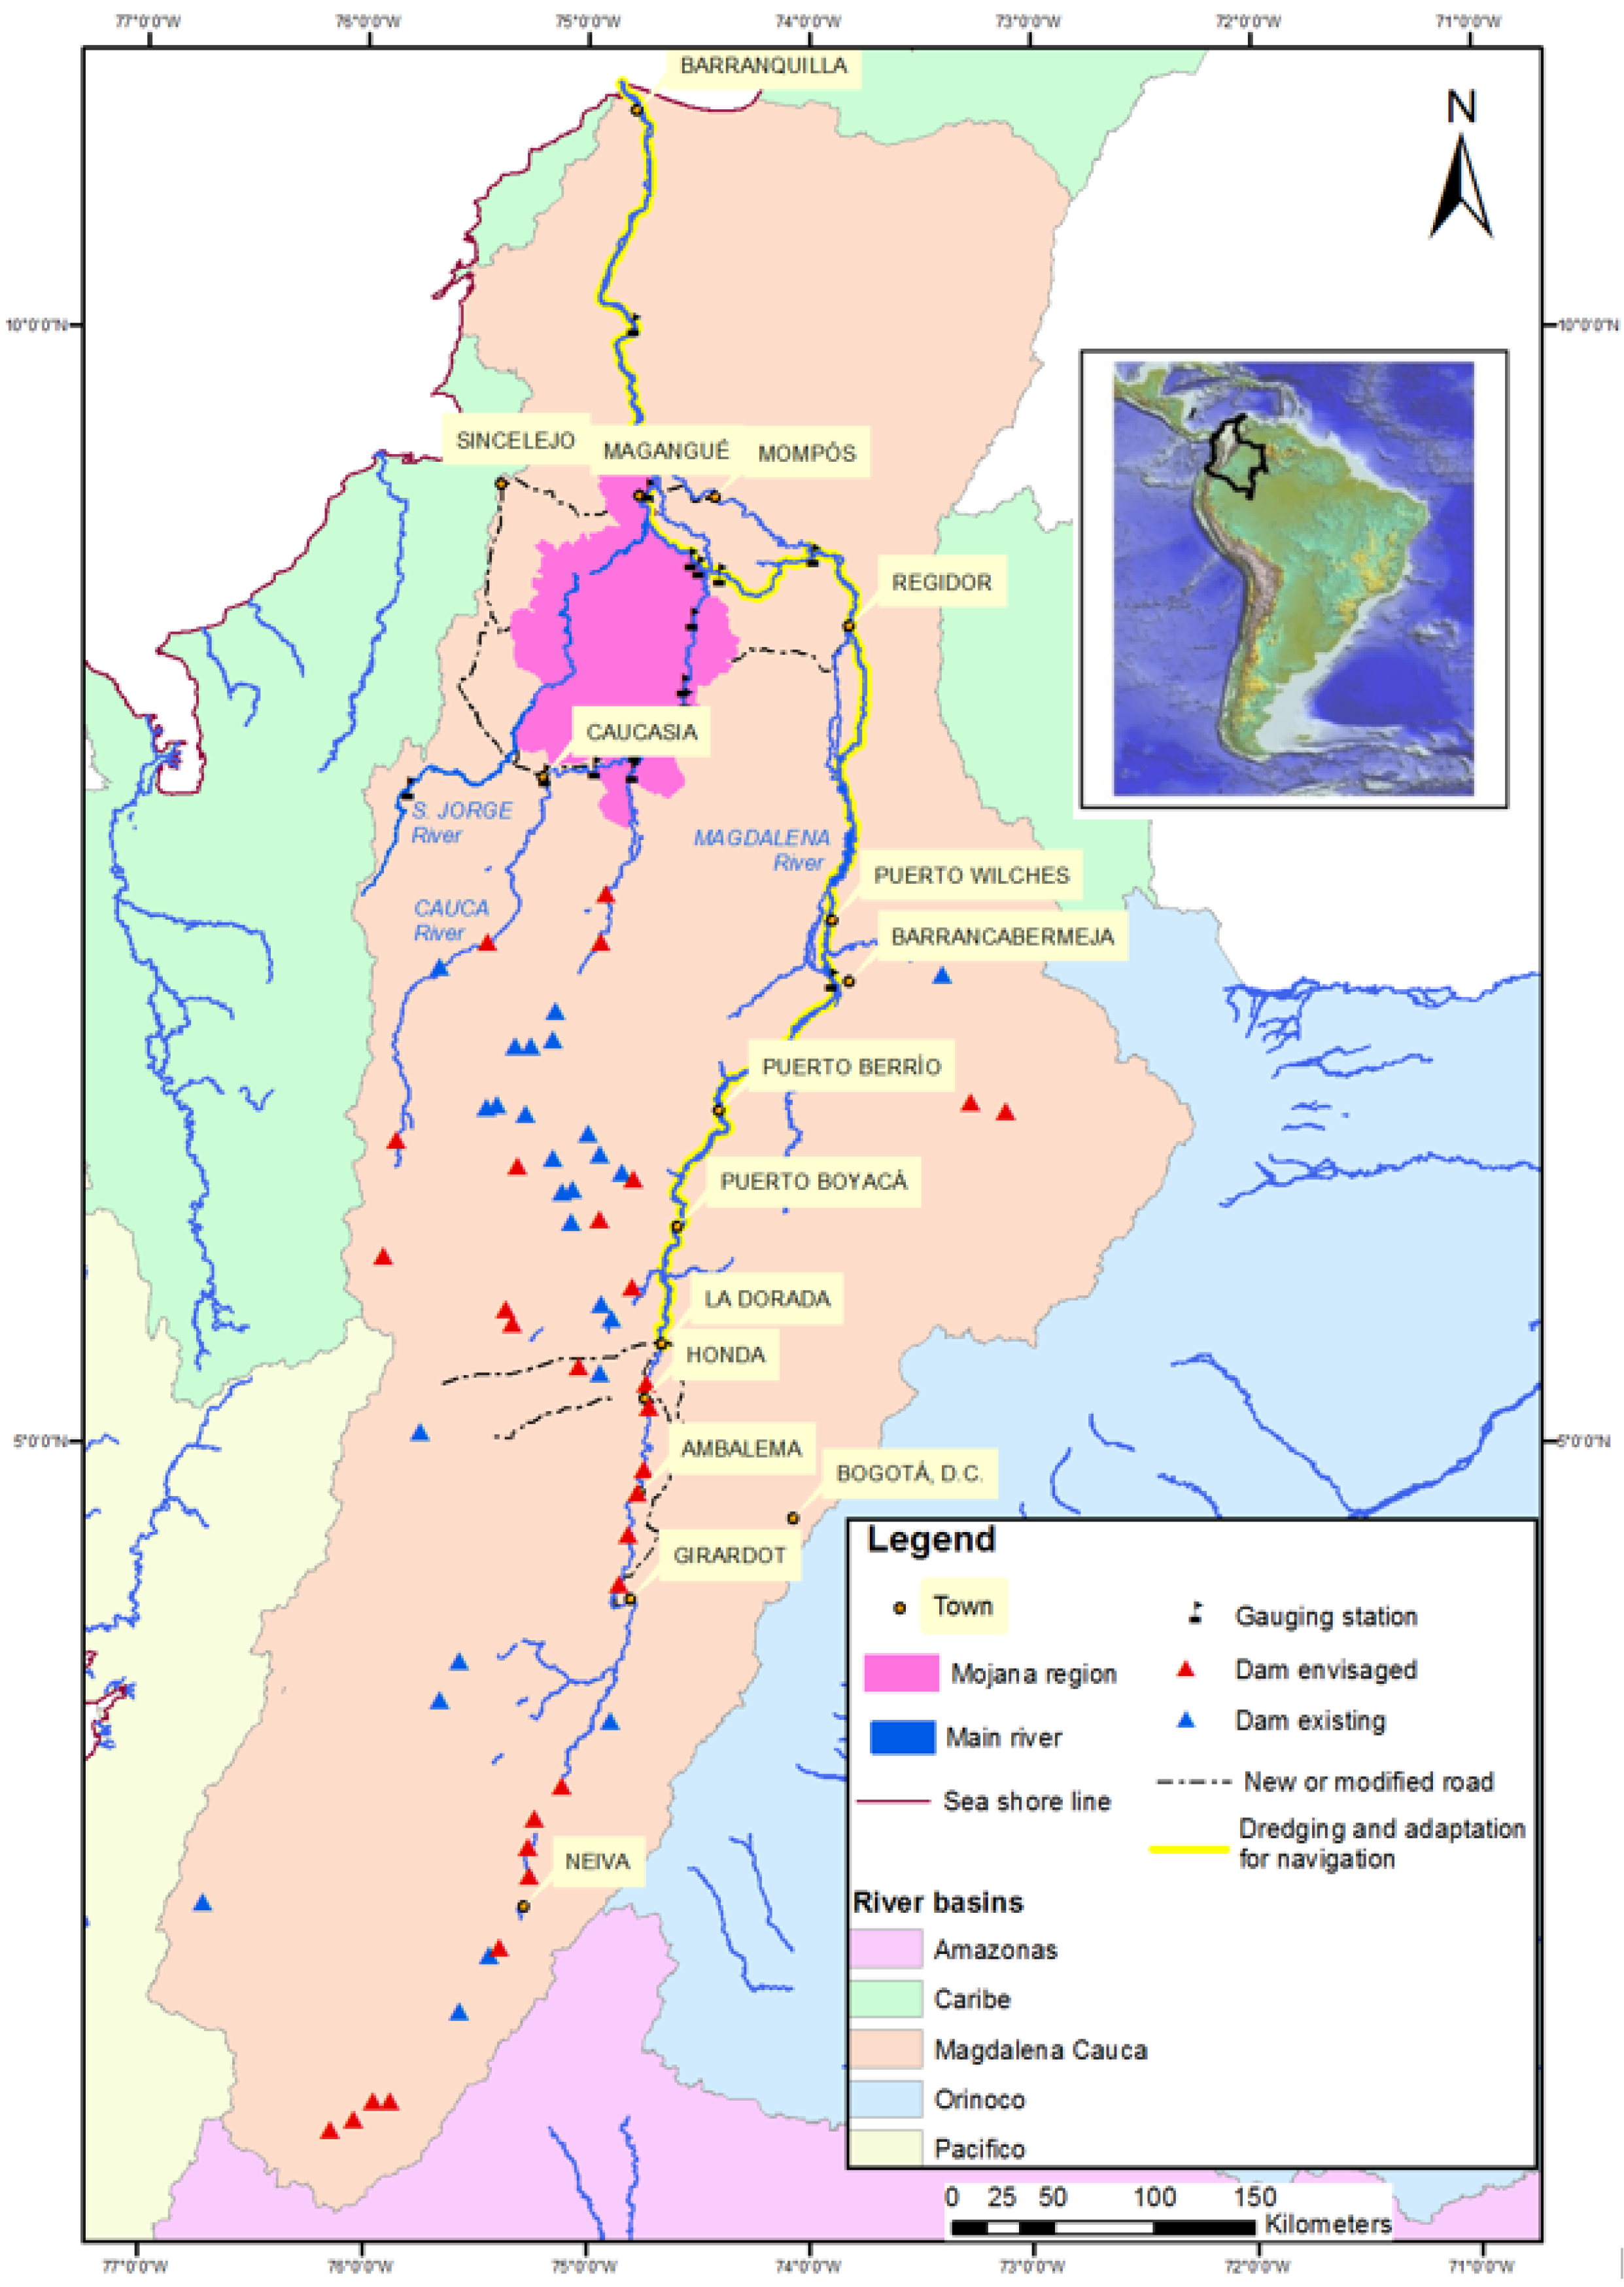
3. The Planned Future
- Climate change is expected to rise the level of the Caribbean sea—at the Magdalena’s mouth—by some 3.5 mm/year [30] (which may significantly affect the flooding probability in the lower Magdalena-Cauca Rivers basin and particularly of Barranquilla) and the progressive (or sudden?) modification of rainfall patterns including the El Niño and La Niña (ENSO) phenomena with longer and harsher droughts and more intense/frequent flood events [30];
- Land use change in the river basin: this is a process which possibly already touched its apex, but it is still going on (particularly deforestation and urbanization more or less un-controlled) and whose consequences—particularly the increment of sediment load to rivers—are on-going [31,32,33]; this is accompanied by industrial and illegal mining development and its proved toxic consequences [34,35,36,37,38,39,40,41];
- Population growth and its associated demand for goods and production of wastes.
- Several roads and many new dams (existing documents point to up to 50 new ones);
- Hydraulic works to control floods (levees) and fluvial dynamics (groynes, rip-rap protections, gabions, etc.) in several river sectors (which, as experience demonstrates—as partly shown in the Supplementary Material—very often activate a never-ending process that affects the whole river network, while implying much higher expenditures than initially planned);
- Morphological re-sectioning of several caños in the region designed to ease the evacuation of flood waters and the reduction of flooding in the exploited region;
- Mega interventions to ensure the commercial navigability along 900 km of the Magdalena River and in some caños of the Mojana; this includes very extensive and continuous dredging as well as bank defenses (rip-rap, gabions, walls, etc.).
4. The Foreseen Future: A Different Picture
- (i)
- The available official time-series of flow rates and suspended solid concentrations at different gauging stations should be verified to eliminate the likely effects of subsidence and morphological changes (particularly aggradation/incision) occurred during time so far; they should be depurated by eliminating wrong or doubtful data, and—where needed—completed by reconstructing missing data; finally—and so adjusted—they should be shared and recognized as an accepted database within the Colombian scientific community.
- (ii)
- Data on granulometry should be taken regularly at several monitoring points (un-existent today).
- (iii)
- Also topographic sections in the rivers and topography of the floodplain should be surveyed systematically to create a complete database, detect changes and verify how subsidence (and tectonics or orogeny) works.
- (iv)
- A systematic, complete and updated mapping of relevant infrastructure and its status (bridges, dams, intakes, bank protection works, levees, etc.) should be made available.
- (v)
- Identification and measurement of morphological characteristics at different scales (e.g., the river valley, the floodplain, the bankfull, the islands, the bars, etc.) should be made at different time instants with an homogeneous approach—a process that requires a wide set of good quality, whole coverage, aerial or satellite photographs (a very interesting example is given in [44]).
- (vi)
- A geomorphic classification possibly based on the River Style approach (similar, but more refined than the Rapid River Assessment of Section 2.2, Table 3) would usefully identify homogeneous geomorphic reaches.
- (vii)
- Sediment transport capacity should be assessed (and suitable formulas calibrated) and bankfull and effective flow rates should be assessed and compared.
- (viii)
- Mapping of sediment sources should cover the whole region and models estimating supply—based on empirical formulas like for instance the RUSLE [45]—should be calibrated by performing historical sediment budgets of relevant reaches and reservoirs, which would take into account morphological changes and all inputs/losses.
- (ix)
- A “story of the river” for relevant, representative river reaches would be elaborated which would describe synthetically and systematically the changes experienced so far, capturing amongst others those changes that are due to damming (the idea is introduced in [46], a very nice example is provided by [47]).
- (x)
- The historical mobility space of the rivers should be determined as a reference [48].
- (xi)
- Geomorphic dynamic equilibrium should be assessed by integrating several elements like those already included within the River Style classification, the comparison of transport capacity amongst reaches (to identify sedimentation/incision propensity), the historical sediment budgets, the “story of the river” itself, the evidence of armoring/paving, the condition of bars and riparian vegetation, and of course modeling.
- (xii)
- An “interpretative theory”, trying to find credible explanations that show relationships between causes and effects should then be conceived and described.
- (xiii)
- Suitable mathematical models should be developed (and calibrated), and then coupled, to describe all relevant processes, amongst which in particular: hydrological rainfall–runoff behavior (to capture the effects of climate change and land use changes); reservoir operation and sediment trapping; rivers hydraulic simulation coupled to sediment transport/balance and morpho-dynamics, to eventually determine the characteristics of overbank flooding as well as channel changes (more aggregated models, despite the clever ideas they incorporate (e.g., [33]), cannot provide the sought answers as they always miss part of the problem/phenomena, as for instance morphological changes of river beds).
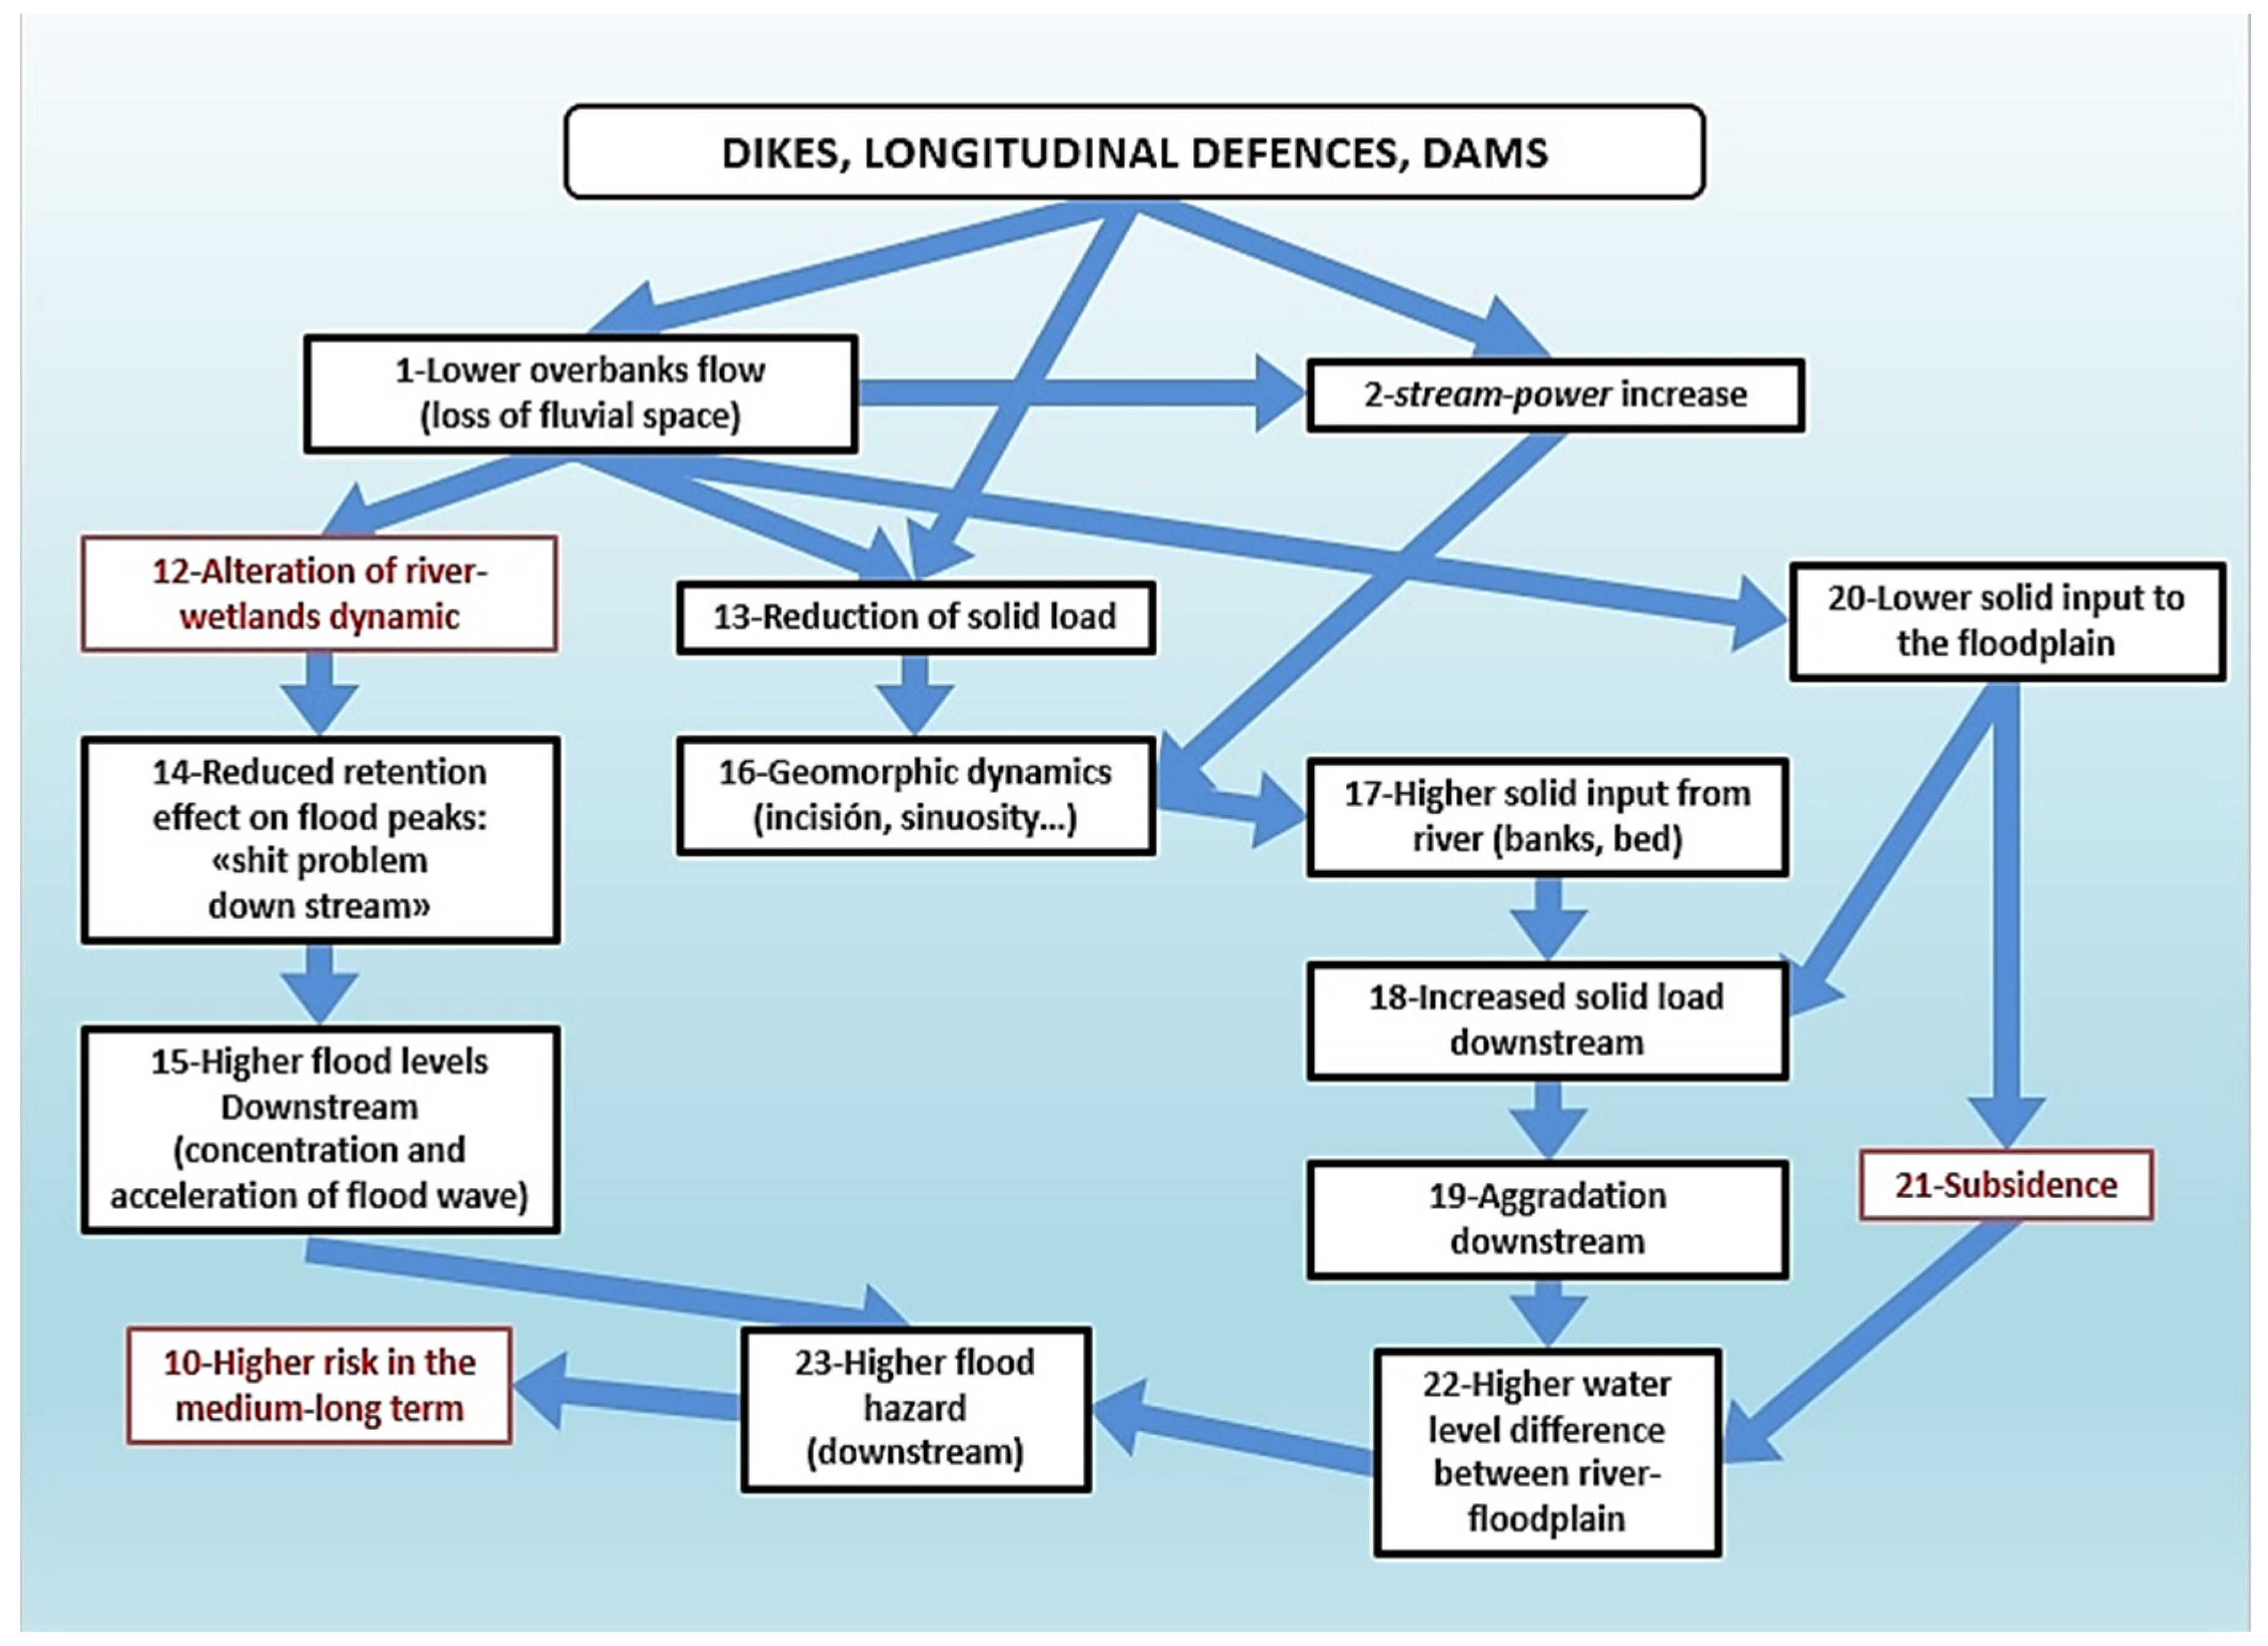
4.1. Effects at the Border of the Mojana Region: Hydro-Morphological Risk
- “From the sky” (climate change): Higher and/or more frequent flood peaks and longer and harsher droughts (deeper hydrological variability).
- “From the sea side” (climate change): Rising of sea level, which controls the level of the Magdalena River at its outlet at Barranquilla.
- “From the mountains”: Reduction of sediment load to the rivers because of dams (see following Box), of the control works and of the dredging (we ignore, however, when these factors will overcome the experienced increment of solid load due to land use change occurred during the last decades).
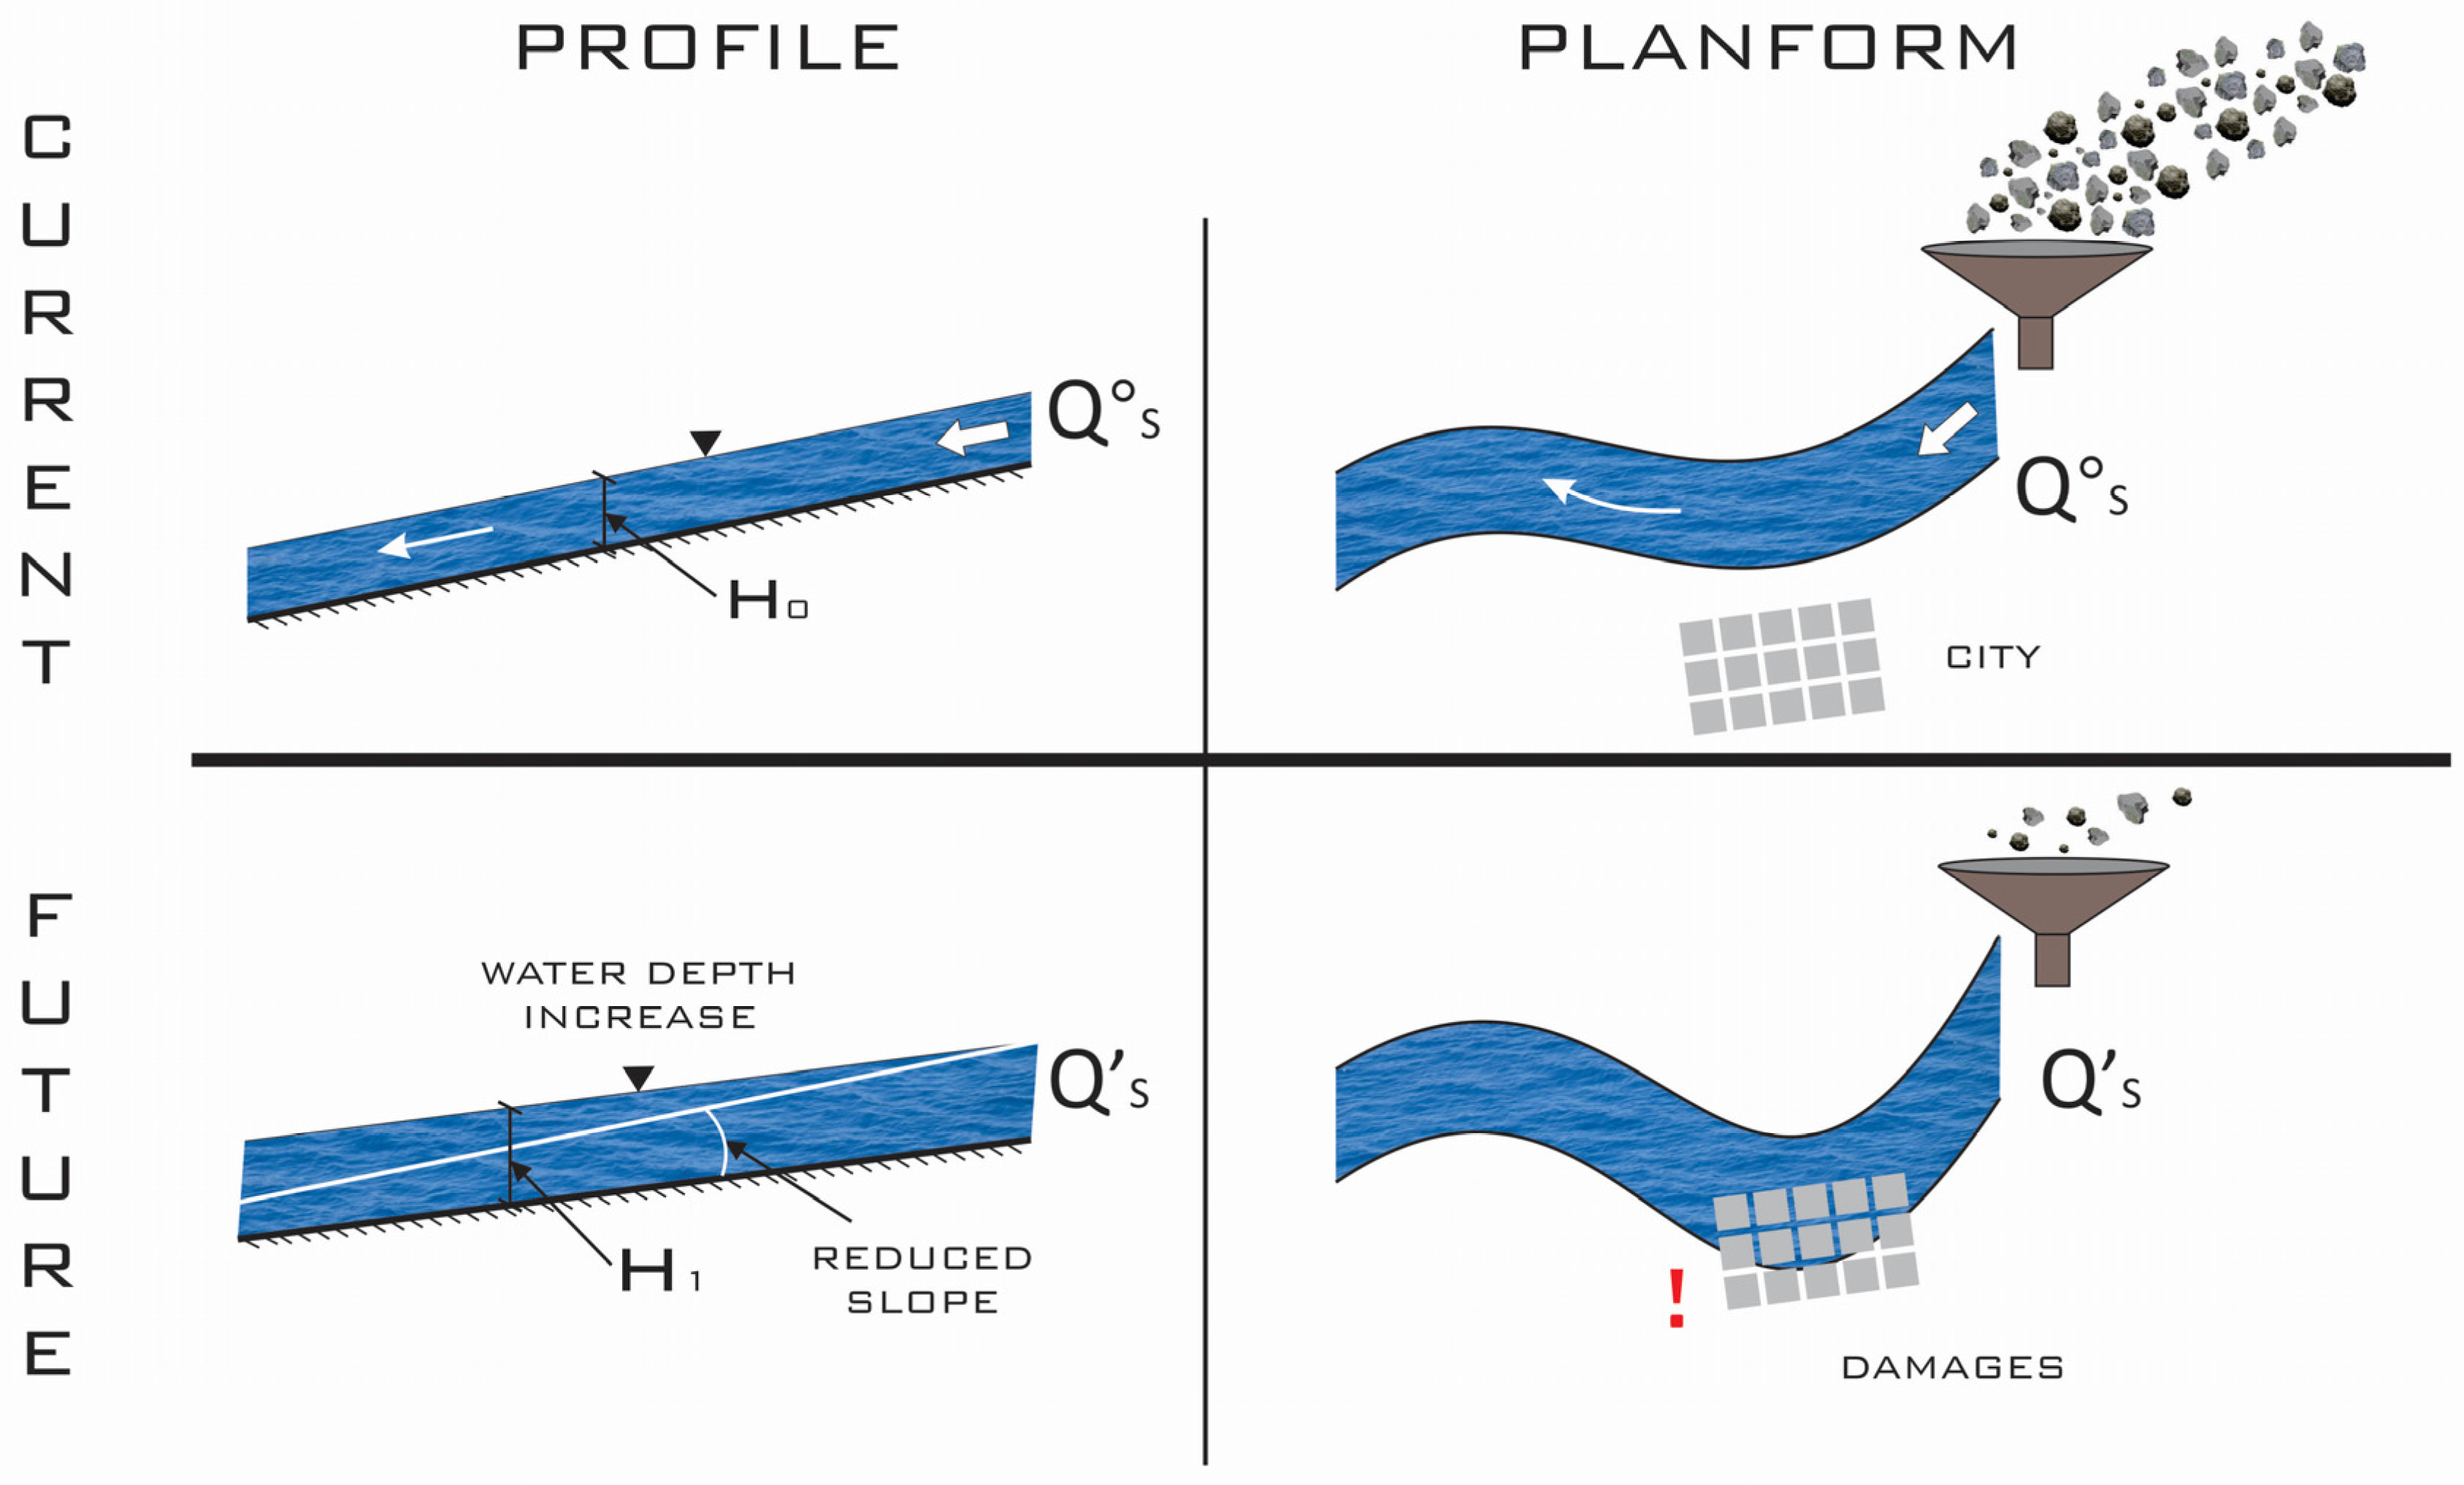
- “From the rivers”: Geomorphic adaptation reaction (change of the transport capacity of liquid and solid flows) because of anthropogenic interventions as well as the change in the hydrological regime due to climate change. This implies a change of longitudinal profile and slope (incision and aggradation); bankfull width; sinuosity; number and planform of channels; riparian vegetation, fish, fauna, etc.; and increment of instability (divagation with bank erosion, avulsion, incision/aggradation, etc.), eventually affecting river dynamics also within the Mojana region.
4.2. Evolution of Cauca River
- Qd: volume of wet solids captured yearly by reservoirs: Qd = Vd/T (106 m3/year)
- QS*: corresponding solid flow (captured) as dry weight:QS* = Qd × (1 − η) × γS / 365 [k ton/day]where η: porosity of wet sediments; γS= g × ρS, with g acceleration of gravity (m/s2) and ρS density of dry sediments (kg/m3).β = QS*/QS Magda × 100
4.3. Flooding Hazard Increases in the Lower Basin
4.4. Both Drought Hazard and Vulnerability Increase
4.5. Transformation of Wetlands
4.6. Economics: Increased Operation, Maintenance and Replacement Costs (OMR)
- (i)
- It is extremely hard to get the whole list of interventions (and associated dates and costs).
- (ii)
- It is very hard to discern based on denominations/descriptions whether it was actually an OMR cost of an existing work or rather a different, new work.
- (iii)
- The behavior of the system was certainly (very) different from the one that will take place in the future once the new interventions will be implemented.
5. Conclusions
Supplementary Materials
Acknowledgments
Author Contributions
Conflicts of Interest
Abbreviations
| IDEA | Instituto de Estudios Ambientales, Universidad Nacional de Colombia—Sede Manizales (Environmental Studies Institute in the Colombia National University, Manizales branch) |
| GTA | Grupo de Trabajo Académico (Academic Work Group) |
| CIRF | Centro Italiano per la Riqualificazione Fluviale (Italian Centre for River Restoration) |
| ENSO | El Niño/La Niña Southern Oscillation |
| DNP | Departamento de Planeación Nacional (National Planning Department) |
| IDEAM | Instituto de Hidrología, Meteorología y Estudios Ambientales (Institute of Hydrology, Meteorology and Environmental Studies) |
| NGO | Non Governmental Organizations |
| GIS | Geographic Information System |
| INVIAS | Instituto Nacional de Vías (National Roads Institute) |
| RUSLE | Revised Universal Soil Loss Equation |
| OMR | Operation Maintenance and Replacement costs of the infrastructural works |
References
- Modelación Hidrodinámica de La Mojana—Informe del Procesamiento de la Información Secundaria; Fondo de Adaptación—Grupo nacional de modelación: Bogotá, Colombia, 2013.
- Recomendaciones Para la Incorporación de Variables Ambientales en la Formulación del Plan de Acción: Características Socioeconómicas e Impulsores de Degradación Ambiental en el Núcleo de Once Municipios de la Región de La Mojana; Fondo de Adaptación: Bogotá, Colombia, 2015.
- Programa de Desarrollo Sostenible de la Región de La Mojana; Departamento Nacional de Planeación—DNP; Organización de las Naciones Unidas para la Agricultura y la Alimentación—FAO; y Dirección de Desarrollo Territorial—DDT: Bogotá, Colombia, 2003.
- Estudios Ambientales y de Planeación Vial de la Región de La Mojana; Consultoría Colombiana S.A—CONCOL y Instituto Nacional de Vías—INVIAS: Bogotá, Colombia, 2008.
- Adaptabilidad de la Producción Agropecuaria Sostenible en el Ecosistema de la Mojana. Modelación Hidrológica Y Dinámica Fluvial. Fase 2, Etapa-1; Corporación Colombiana de Investigación Agropecuaria—CORPOICA y Universidad de los Andes—UNIANDES: Bogotá, Colombia, 1998.
- Control de Inundaciones en la Región de La Mojana; Universidad Nacional de Colombia—Sede Medellín, Ministerio de Transporte, y Instituto Nacional de Vías—INVIAS: Medellín, Colombia, 2006.
- La Mojana: Riqueza Natural y Potencial Económico; Banco de la República: Bogotá, Colombia, 2006.
- Estudios, Análisis y Recomendaciones Para el Ordenamiento Ambiental y el Desarrollo Territorial de La Mojana; Departamento Nacional de Planeación—DNP y Universidad Nacional de Colombia—Sede Medellín: Bogotá, Colombia, 2012.
- Informe de la Caracterización Geomorfológica y Fisiográfica de La Mojana a Escala 1:100.000; Fondo de Adaptación: Bogotá, Colombia, 2015.
- Plan de Acciones Regionales Prioritarias Para el Desarrollo Sustentable de la Mojana: Articulación de Iniciativas Regionales Para Estructurar Áreas de Desarrollo Territorial; Departamento Nacional de Planeación—DNP; Programa de las Naciones Unidas para el Desarrollo—PNUD; y Dirección de Prevención y Atención de Desastres del Ministerio del Interior y Justicia—DPAD: Bogotá, Colombia, 2008.
- Estudios Hidráulicos, Sedimentológicos Y Morfológicos, Con Énfasis en Modelación Matemática Relacionados Con el Plan Integral de Intervención a Corto Y Largo Plazo Entre Colorado (Antioquia) y Achí (Bolívar), Convenio n. 1069–2011; Universidad del Norte—UNINORTE: Barranquilla, Colombia, 2012.
- Convenio de Cooperación Técnica Entre la Corporación Colombiana De Investigación Agropecuaria—CORPOICA y el Fondo de Adaptación Para Actualizar la Información Socioeconómica y Climática, Medir el Impacto de la Inundación en Los Sistemas de Producción y Establecer, a Nivel de Prefactibilidad, la Viabilidad de Sistemas de Producción Alternativos, Adaptados a Las Condiciones Socioeconómicas y Agroecológicas y Que Contribuyan al Desarrollo Humano-Sostenible de La Mojana; Corporación Colombiana de Investigación Agropecuaria—CORPOICA y Fondo de Adaptación: Bogotá, Colombia, 2013.
- Funcionamiento del Sistema Natural y Características de Los Ecosistemas del Núcleo de Once Municipios de la Región de La Mojana; Fondo de Adaptación: Bogotá, Colombia, 2014.
- Shah, S.H.; Gibson, R.B. Large dam development in India: sustainability criteria for the assessment of critical river basin infrastructure. Int. J. River Basin Manag. 2013, 11, 33–53. [Google Scholar] [CrossRef]
- Everard, M.; Quinn, N. Realizing the value of fluvial geomorphology. Int. J. River Basin Manag. 2015, 13, 487–500. [Google Scholar] [CrossRef]
- Habersack, H.; Haspel, D.; Campbell, I. Integrated management of large river systems. Int. J. River Basin Manag. 2013, 11, 137–137. [Google Scholar] [CrossRef]
- Guerrero, M.; Nones, M.; Saurral, R.; Montroull, N.; Szupiany, R.N. Parana River morphodynamics in the context of climate change. Int. J. River Basin Manag. 2013, 11, 423–437. [Google Scholar] [CrossRef]
- Valoración Integral de la Biodiversidad y Los Servicios Ecosistémicos en el Núcleo de Once Municipios de la Región de La Mojana; Fondo de Adaptación: Bogotá, Colombia, 2015.
- O’Riordan, T.; Jordan, A. The Precautionary Principle in Contemporary Environmental Politics. Environ. Values 1995, 4, 191–212. [Google Scholar] [CrossRef]
- Weiss, C. Scientific uncertainty and science-based precaution. Int. Environ. Agreem. 2003, 3, 137–166. [Google Scholar] [CrossRef]
- Van Asselt, M.B.A.; Vos, E. The Precautionary Principle and the Uncertainty Paradox. J. Risk Res. 2006, 9, 313–336. [Google Scholar] [CrossRef]
- O’Riordan, T.; Cameron, J.; Jordan, A. Reinterpreting the Precautionary Principle; Cameron May: London, UK, 2000. [Google Scholar]
- Van Der Sluijs, J. Uncertainty as a monster in the science-policy interface: four coping strategies. Water Sci. Technol. 2005, 52, 87–92. [Google Scholar] [PubMed]
- Schrimpff, S. Canales del Zenú. Available online: https://www.flickr.com/photos/museodeloro/4626057636/in/photostream/ (accessed on 21 June 2016).
- García, L. Características Sistema Natural, Biodiversidad y Servicios Ecosistémicos La Mojana. Presentado en Fondo de Adaptación; Fondo de Adaptación: Bogotá, Colombia, 2015. [Google Scholar]
- Brierley, G.J.; Fryirs, K.A. Geomorphology and River Management. Applications of the River Styles Framework; ISBN 978-1-4051-1516-2 URL. Wiley-Blackwell Publishing: Carlton, Australia, 2005. [Google Scholar]
- Rosgen, D.L. A classification of natural rivers. CATENA 1994, 22, 169–199. [Google Scholar] [CrossRef]
- Martínez, A. Subsidencia y Geomorfología de la Depresión Inundable del Río Magdalena. CIAF 1981, 6, 319–328. [Google Scholar]
- Van der Hammen, T. Fluctuaciones holocénicas del nivel de inundaciones en la cuenca del bajo Magdalena –Cauca- San Jorge (Colombia). Geol. Norandina 1986, 10, 11–18. [Google Scholar]
- 2a Comunicación nacional ante la Convención Marco de las Naciones Unidas sobre el cambio climático; Instituto de Hidrología, Meteorología y Estudios Ambientales-IDEAM, Ministerio del Medio Ambiente y Programa de las Naciones Unidas para el Desarrollo-PNUD: Bogotá, Colombia, 2010.
- Restrepo, J.D.; Syvitski, J.P.M. Assessing the Effect of Natural Controls and Land Use Change on Sediment Yield in a Major Andean River: The Magdalena Drainage Basin, Colombia. AMBIO J. Hum. Environ. 2006, 35, 65–74. [Google Scholar] [CrossRef]
- Zapata, J.P.; Diaz, J.; Garzonferreira, J.; Garcia, C. Fluvial fluxes into the Caribbean Sea and their impact on coastal ecosystems: The Magdalena River, Colombia. Glob. Planet. Chang. 2006, 50, 33–49. [Google Scholar]
- Kettner, A.J.; Restrepo, J.D.; Syvitski, J.P.M. A Spatial Simulation Experiment to Replicate Fluvial Sediment Fluxes within the Magdalena River Basin, Colombia. J. Geol. 2010, 118, 363–379. [Google Scholar] [CrossRef]
- Olivero-Verbel, J.; Johnson-Restrepo, B.; Mendoza-Marín, C.; Paz-Martinez, R.; Olivero-Verbel, R. Mercury in the aquatic environment of the village of Caimito at the Mojana region, north of Colombia. Water Air Soil Pollut. 2004, 159, 409–420. [Google Scholar] [CrossRef]
- Mancera-Rodríguez, N.J.; Álvarez-León, R. Estado del conocimiento de las concentraciones de mercurio y otros metales pesados en peces dulceacuícolas de Colombia. Acta Biológica Colomb. 2006, 11, 3–23. [Google Scholar]
- Marrugo, J.; Lans, E.; Benítez, L. Hallazgo de mercurio en peces de la Ciénaga de Ayapel, Córdoba, Colombia. Rev. MVZ Córdoba 2007, 12, 878–886. [Google Scholar]
- Niveles de Mercurio en Sedimentos, Agua y Tejido Vivo “Buchón, Arroz, Peces, Cabello” en Los Humedales de la Mojana Sucreña; Corporación Autónoma Regional del Centro de Antioquia—CORANTIOQUIA y Grupo investigación de Gestión y Modelación Ambiental—GAIA; Facultad de Ingeniería, Universidad de Antioquia: Medellín, Colombia, 2008.
- Marrugo-Negrete, J.; Benítez, L.N.; Olivero-Verbel, J.; Lans, E.; Gutierrez, F.V. Spatial and seasonal mercury distribution in the Ayapel Marsh, Mojana region, Colombia. Int. J. Environ. Health Res. 2010, 20, 451–459. [Google Scholar] [CrossRef] [PubMed]
- Alvarez, S.; Jessick, A.M.; Palacio, J.A.; Kolok, A.S. Methylmercury Concentrations in Six Fish Species from Two Colombian Rivers. Bull. Environ. Contam. Toxicol. 2012, 88, 65–68. [Google Scholar] [CrossRef] [PubMed]
- Rúa Cardona, A.F.; Flórez Molina, M.T.; Palacio Baena, J. Variations of seasonal and spatial Hg, Pb, Cr and organic matter contents in Ayapel Flood Plain Lake sediments, Córdoba, northwest Colombia. Rev. Fac. Ing. Univ. Antioqui. 2013, 69, 244–255. [Google Scholar]
- Pinedo-Hernández, J.; Marrugo-Negrete, J.; Díez, S. Speciation and bioavailability of mercury in sediments impacted by gold mining in Colombia. Chemosphere 2015, 119, 1289–1295. [Google Scholar] [CrossRef] [PubMed]
- Degoutte, G. Diagnostic, Aménagement et Gestion des Rivières—Hydraulique et Morphologie Fluviales Appliquées; Lavoisier: Cachan, France, 2012. [Google Scholar]
- Ashmore, P.; Church, M. The Impact of Climate Change on Rivers and River Processes in Canada; Geological Survey of Canada: Ottawa, ON, Canada, 2001. [Google Scholar]
- Demarchi, L.; Bizzi, S.; Piégay, H. Hierarchical Object-Based Mapping of Riverscape Units and in-Stream Mesohabitats Using LiDAR and VHR Imagery. Remote Sens. 2016, 8, 97. [Google Scholar] [CrossRef] [Green Version]
- Renard, K.G.; Foster, G.R.; Weesies, G.A.; Porter, J.P. RUSLE—Revised universal soil loss equation. J. Soil Water Conserv. 1991, 46, 30–33. [Google Scholar]
- Nardini, A.; Pavan, S. What river morphology after restoration? The methodology VALURI. J. River Basin Manag. 2012, 10, 29–47. [Google Scholar] [CrossRef]
- Chen, Y.; Syvitski, J.P.M.; Gao, S.; Overeem, I.; Kettner, A.J. Socio-economic Impacts on Flooding: A 4000-Year History of the Yellow River, China. AMBIO 2012, 41, 682–698. [Google Scholar] [CrossRef] [PubMed]
- Malavoi, J.R.; Bravard, J.P.; Piégay, H.; Héroin, E.; Ramez, P. Determination de l’espace de liberté des cours d’eau. In Bassin Rhone Mediterranee Corse—Guide Technique No. 2; Agence de l’eau Rhône Méditerranée Corse: Lyon, France, 1998. [Google Scholar]
- Fuller, I.C.; Basher, L.R.; Hicks, D.M. Towards understanding river sediment dynamics as a basis for improved catchment, channel and coastal management: The case of the Motueka catchment, Nelson, New Zealand. Int. J. River Basin Manag. 2014, 12, 175–192. [Google Scholar] [CrossRef]
- Casa Editorial El Tiempo, Bridge between Plato and Zambrano (Colombia) over the Magdalena River. Available online: http://images.et.eltiempo.digital/contenido/multimedia/fotos/colombia10/IMAGEN/IMAGEN-16495571-2.jpg (accessed on 21 June 2016).
- Rubin, Z.K.; Kondolf, G.M.; Carling, P.A. Anticipated geomorphic impacts from Mekong basin dam construction. Int. J. River Basin Manag. 2015, 13, 105–121. [Google Scholar] [CrossRef]
- Vörösmarty, C.J.; Meybeck, M.; Fekete, B.; Sharma, K.; Green, P.; Syvitski, J.P. Anthropogenic sediment retention: major global impact from registered river impoundments. Glob. Planet. Chang. 2003, 39, 169–190. [Google Scholar] [CrossRef]
- Mosselman, E.; Kok, M.; Leenen, H.; Van, M. Flood Risk Management for La Mojana; DELTARES (Enabling Delta Life): Wageningen, The Netherlands, 2012. [Google Scholar]


| Surface area of Colombia | 1,141,748 km2 |
| Magdalena-Cauca Rivers basin area | 271,249 km2 |
| Mojana region | 28,461 km2—28 municipalities in 4 political regions Antioquia, Córdoba, Bolívar and Sucre |
| Area covered by the Fondo de Adaptación within the Mojana region | 10,982 km2 (11 municipalities), Antioquia (Nechí), Córdoba (Ayapél), Bolívar (Magangué, San Jacinto del Cauca and Achí), Sucre (San Marcos, Guaranda, Majagual, Sucre, Caimito and San Benito Abad) |
| Total population (est. 2014) | 401,734 inhabitants |
| Average Unsatisfied Basic Needs | 70.1% |
| Population affected by La Niña ENSO floods in 2010–2011 | 170,000 (39%) |
| Portion of the population in subsistence activities | About 70% (of which: 44% Agriculture, 35% Livestock, 18% Fishing, 3% Not reported) |
| Ecosystems Characterization in the Mojana Region According to the Temporary Flood | % of Total Area | |
|---|---|---|
| Aquatic ecosystems | Lotic waterbodies (rivers, creeks and streams) | 4 |
| Average lentic waterbodies (swamps, wetlands—humedales or ciénagas) | 8.8 | |
| Transitional ecosystems (aquatic and terrestrial interface) | Temporary emerged bars (riparian and emergent aquatic vegetation, grasslands and wetlands) | 17.1 |
| Zápales (flooded forests) | 5.4 | |
| Terrestrial | Natural areas (forest dense, open and fragmented secondary vegetation and pasture in natural spaces) | 9.0 |
| Agricultural areas (permanent and temporary crops and heterogeneous areas) | 6.8 | |
| Livestock areas (clean pastures, choked and scrubby) | 39.6 | |
| Mining, burned areas, among others | 2.6 | |
| Not reported | 6.7 | |
| ID Denomination | Valley Reach Length Lv (km) | U_Landscape | Natural Confinement | Artificial Confinement | Valley Width V (km) | Start Elevation ys (masl) | End Elevation ye (masl) | Valley Slope i (‰) | Bankfull Flow Q (m3/s) | River Reach Length L (km) | Sinuosity s | Width of Meanders Belt B (km) | Alignment | N Canals |
|---|---|---|---|---|---|---|---|---|---|---|---|---|---|---|
| 1 Margento-Colorado-Puerto Nare | 13.5 | hilly and undulated | unconfined | levee at left side | 6.0 | 38.2 | 35.0 | 0.24 | 2600 | 16.7 | 1.24 | 2.9 | central | 1–2 |
| 2 Nechí-Mejico | 16.3 | hilly and undulated | partially confined on the right | levee at left side | 5.1 | 35.0 | 31.8 | 0.20 | 3700 | 17.8 | 1.09 | 1.4 | right | 1–2 |
| 3 San Jacinto-Galindo | 23.4 | piedmont of hills | unconfined | levee at left side | 41.0 | 31.8 | 28.4 | 0.15 | 3700 | 29.2 | 1.25 | 3.6 | right | 1–4 |
| 4 Caimatal-Boyacá | 18.4 | piedmont of hills | confined | several groynes | 1.5 | 28.4 | 26.0 | 0.13 | 3700 | 22.4 | 1.22 | 1.5 | alternated | 2–1 |
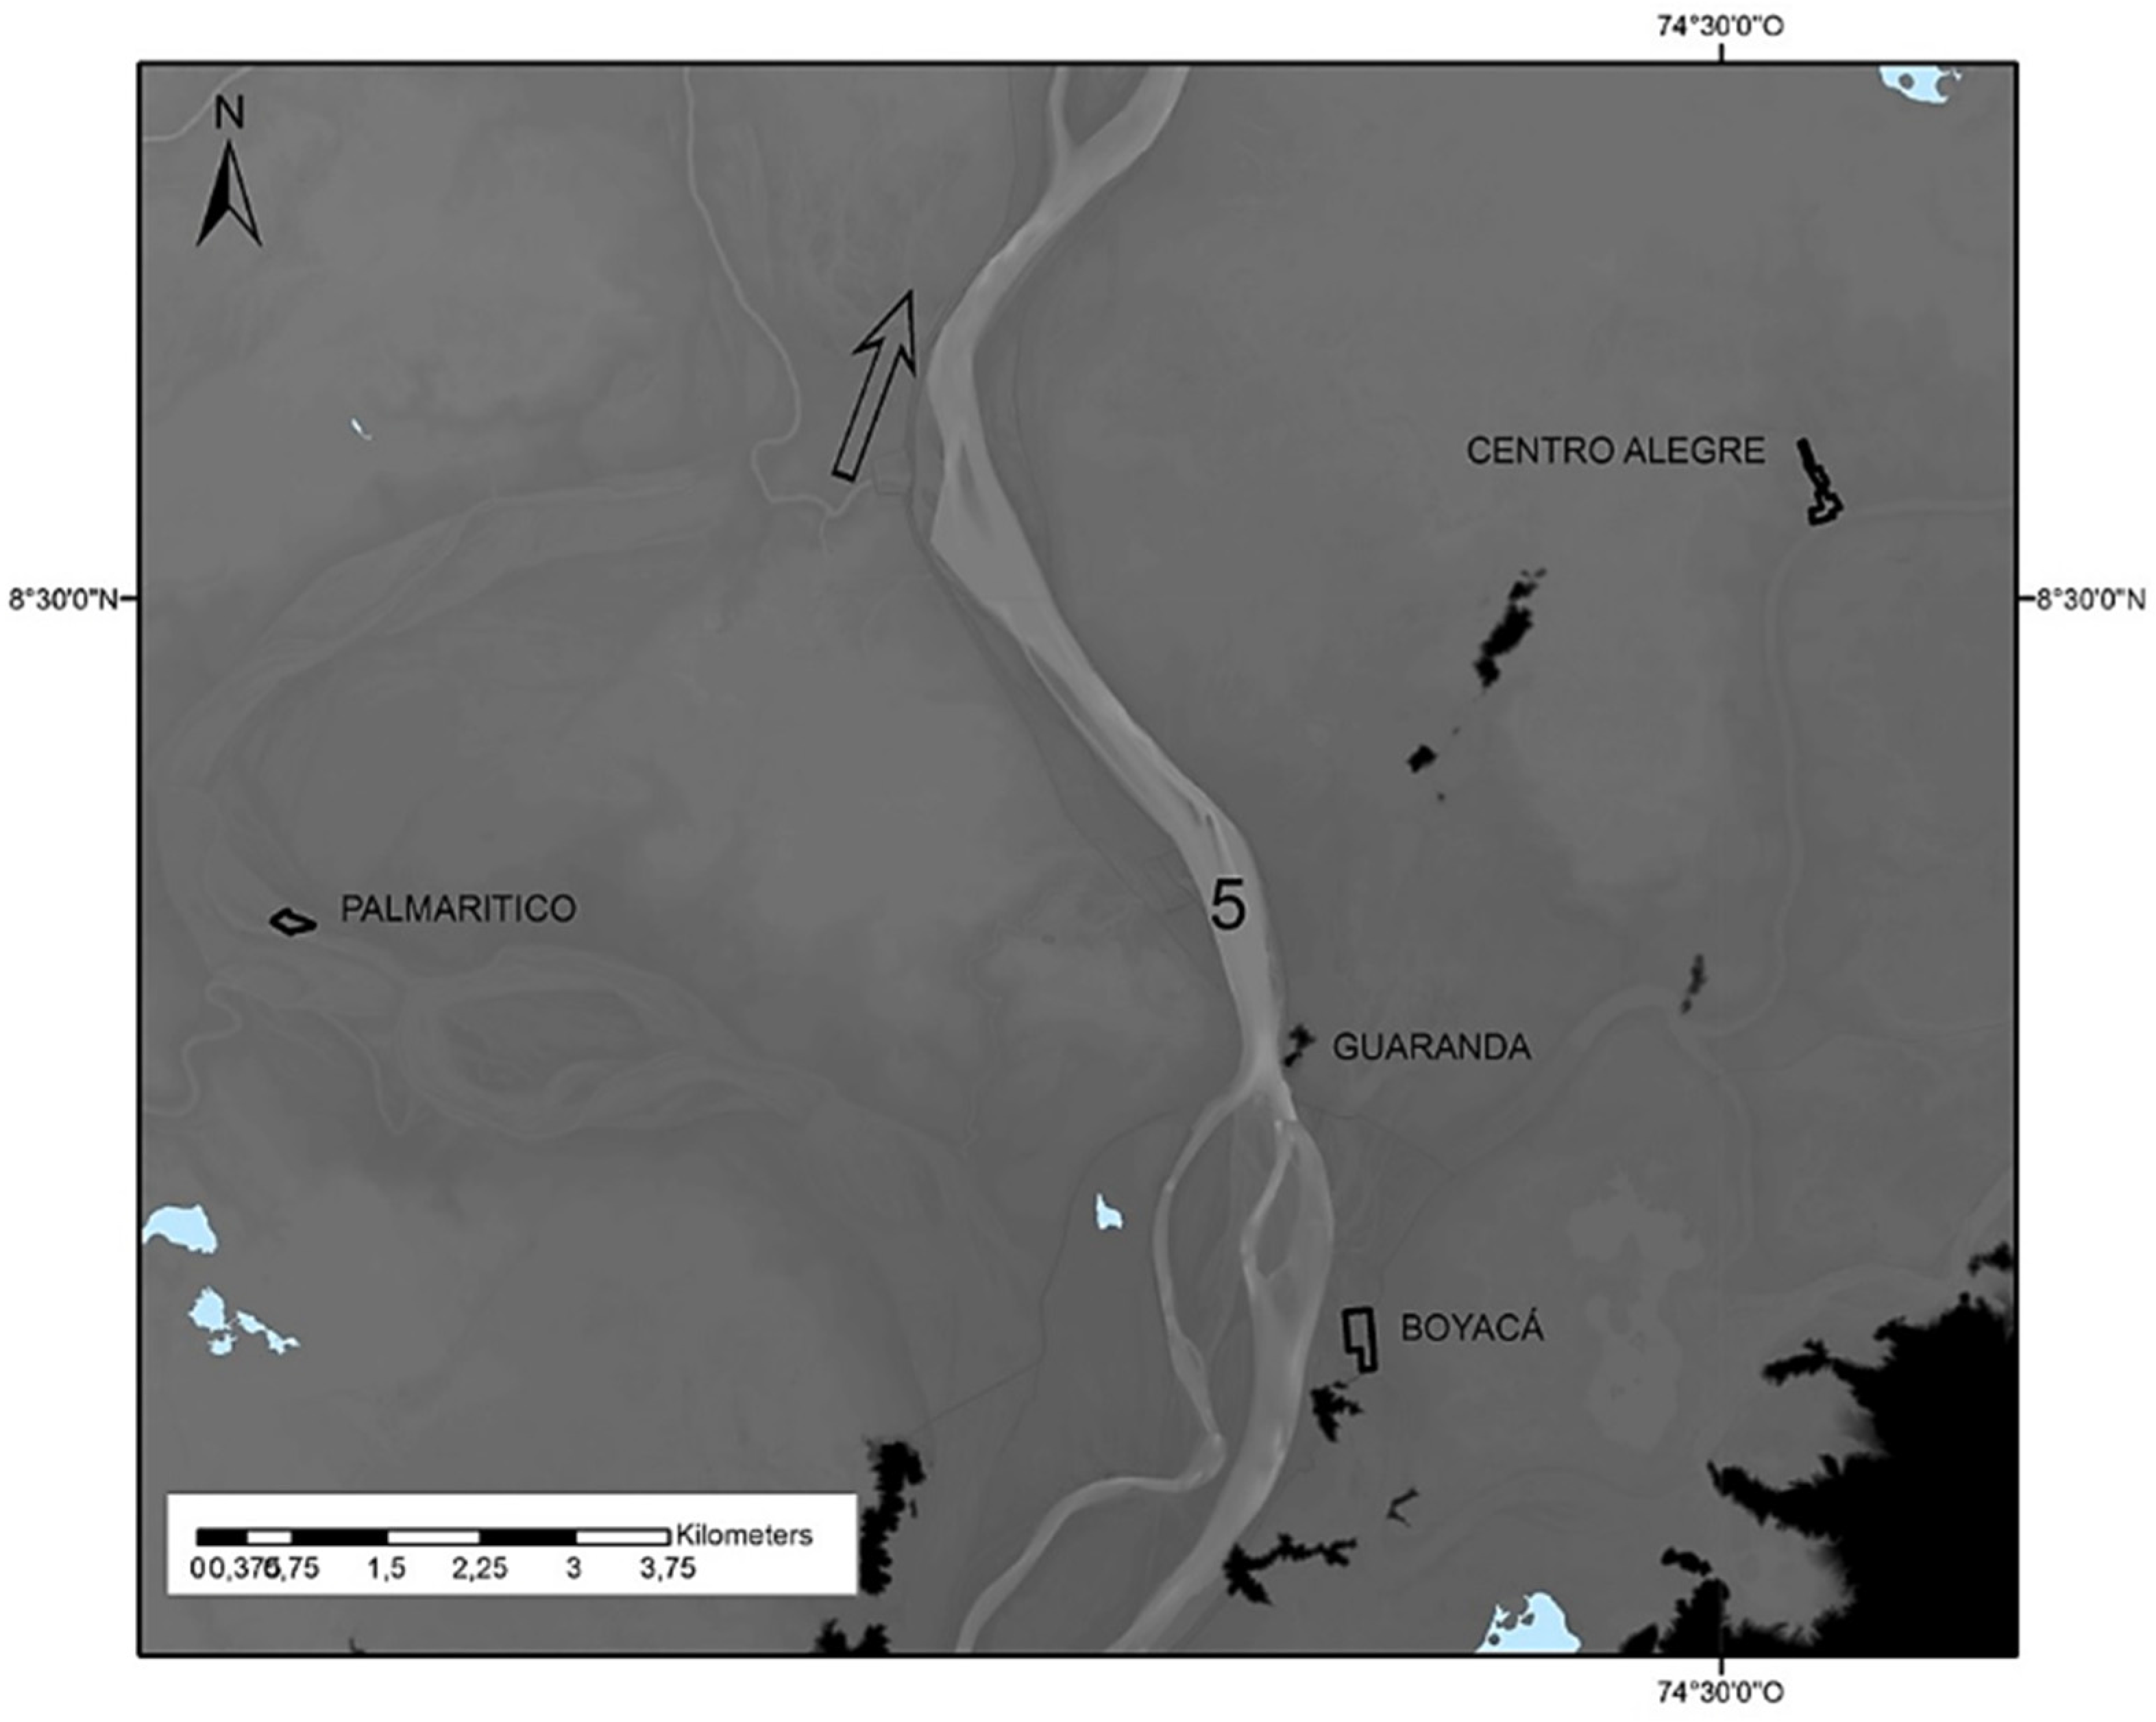
| 5 Guaranda-Buenavista | 15.0 | alluvial plain | unconfined | some groynes | 55.0 | 26.0 | 25.8 | 0.01 | 3600 | 19.4 | 1.29 | 2.5 | central | 1–3 |
| 6 Pto. Isabel-Guacamayo-Playa Alta | 26.1 | alluvial plain | unconfined | - | 29.0 | 25.8 | 20.3 | 0.21 | 3600 | 27.8 | 1.06 | 1.9 | central | 1–3 |
| 7 Santa Mónica-Desembocadura | 10.3 | alluvial plain | unconfined | - | 6.0 | 20.3 | 17.5 | 0.27 | 4500 | 16.5 | 1.61 | 3.0 | central | 1 |
| ID Denomination | River Slope iR (‰) | Surface Area of Bankfull Reach A (km2) | Bankfull Width w (km) | Bankfull Depth h (m) | Entrenchment | Pseudo-Entrenchment | Specific Stream-Power (W/m2) | w/h Ratio | Corridor Units | Channel Units | Lateral Movement | |||
| 1 Margento-Colorado-Puerto Nare | 0.19 | 6.3690 | 0.382 | 5.0 | 0.06 | 0.48 | 12.8 | 76 | natural levees; crevasse and splays; meanders cut-offs; paleo-channels; ridge and swales | high | ||||
| 2 Nechí-Mejico | 0.18 | 7.8027 | 0.437 | 5.0 | 0.09 | 0.27 | 14.9 | 87 | natural levees; crevasse and splays; paleo-channels (madreviejas); input of Nechí tributary | significant, but with fixed points | ||||
| 3 San Jacinto-Galindo | 0.12 | 14.1319 | 0.484 | 5.0 | 0.01 | 0.09 | 8.7 | 97 | natural levees; crevasse and splays; paleo-channels; ridge and swales; anastomosed arm | several islands | significant, but with fixed points | |||
| 4 Caimatal-Boyacá | 0.11 | 10.6810 | 0.477 | 5.0 | 0.32 | 1.00 | 8.2 | 95 | ridge and swales; input of Caribona tributary | islands | high at the entrance, then moderate | |||
| 5 Guaranda-Buenavista | 0.01 | 8.4516 | 0.436 | 5.0 | 0.01 | 0.05 | 0.8 | 87 | natural levees; paleo-channels by meanders cut-off ; crevasse and splays; derived channels | islands | significant nearby Achí | |||
| 6 Pto. Isabel-Guacamayo-Playa Alta | 0.20 | 10.9776 | 0.395 | 5.0 | 0.01 | 0.07 | 17.7 | 79 | natural levees; paleo-channels; derived channels; anastomosed natural channel | islands | moderate | |||
| 7 Santa Mónica-Desembocadura | 0.17 | 5.3841 | 0.326 | 5.0 | 0.05 | 0.50 | 23.0 | 65 | crevasse and splays; wetland connection | islands | low, but with marked modifications of the island | |||
| Item | Data | Hypothesis | Computations | ||||||
|---|---|---|---|---|---|---|---|---|---|
| definition | dead storage | specific weight of solids | solid flow of Magdalena | horizon | porosity | captured volume | dry solid flow captured | dry solid flow captured | fraction captured |
| symbol | Vd | g | QS Magda | T | h | Qd | QS* | QS* | b |
| units | 106 m3 | kg/m3 | kt/day | year | – | 106 m3/yr | 106 kg/yr | kt/day | % |
| lower | 1500 | 2600 | 400 | 50 | 0.85 | 30 | 11,700 | 32 | 8 |
| upper | 2100 | 2600 | 400 | 30 | 0.58 | 70 | 76,440 | 209 | 52 |
© 2016 by the authors; licensee MDPI, Basel, Switzerland. This article is an open access article distributed under the terms and conditions of the Creative Commons Attribution (CC-BY) license (http://creativecommons.org/licenses/by/4.0/).
Share and Cite
Nardini, A.; Franco Idarraga, F.L. A Qualitative Hydro-Geomorphic Prediction of the Destiny of the Mojana Region (Magdalena-Cauca Basin, Colombia), to Inform Large Scale Decision Making. Resources 2016, 5, 22. https://doi.org/10.3390/resources5030022
Nardini A, Franco Idarraga FL. A Qualitative Hydro-Geomorphic Prediction of the Destiny of the Mojana Region (Magdalena-Cauca Basin, Colombia), to Inform Large Scale Decision Making. Resources. 2016; 5(3):22. https://doi.org/10.3390/resources5030022
Chicago/Turabian StyleNardini, Andrea, and Freddy Leonardo Franco Idarraga. 2016. "A Qualitative Hydro-Geomorphic Prediction of the Destiny of the Mojana Region (Magdalena-Cauca Basin, Colombia), to Inform Large Scale Decision Making" Resources 5, no. 3: 22. https://doi.org/10.3390/resources5030022