1. Background
Energy efficiency has been one of the most dominant topics of our time. It gathered pace starting in the early 1990s, when the scientific community started actively discussing the link between climate change and the sustainable use of energy resources. However, the need to conserve energy resources is at variance with the imperative for development. Some researchers have argued that it would be difficult to have any meaningful development without the use of energy resources (see, for instance, [
1]. There is a need, therefore, to find the right balance between energy consumption and development. The global community has reached a consensus that the responsibility for sustainable consumption of energy resources lies with every nation. African countries, and Zambia in particular, also need to contribute to this global effort.
Many studies done in developed countries have concentrated on the analysis and quantification of the impact of lifestyle factors on current and future energy demands. Some studies have shown that apart from the design and location of a building, the behavior of the users or occupants is also an important determinant of domestic energy consumption ([
2,
3]). According to Janda [
4], building users play a critical but poorly understood role in determining energy consumption in buildings. She argues that the general approach by many researchers and authorities in charge of energy has been to assume that giving more information to the consumers will result in better usage of energy, which is not always correct (see also [
5]). Owens and Driffill [
6] came to the same conclusion when they stated that “
government campaigns in the energy and environmental fields have often been predicated on a rationalist ‘information deficit model’ which assumes that environmental education drawing from scientific work will lead to people making the link between policy and action.”
Evidence from studies on this subject has shown that the potential for energy saving as a result of changes in consumer behavior can be as high as 25% of current consumption in the residential sector in the USA [
7]. Elsewhere, it has been argued that feedback can help reduce energy consumption in a household by up to 15% [
8]. Feedback, in this case, is largely the information that comes from utility companies or from energy meters, giving a breakdown of the consumption patterns of a household.
Apart from using energy on household activities and other chores, households also consume energy in the quest to achieve thermal comfort. Thermal comfort has been described as the state of thermal equilibrium—a state in which a human being feels neither warm nor cold. It is taken as one of the basic requirements for humanity’s enjoyment of buildings (which is important for the happiness of the building users). Humanity’s quest for thermal comfort enlists a response from building users that has an effect on the way they use energy in buildings. This response comes in different ways; it could be that they switch on heaters when it is cold or switch on a fan or air conditioner when it is hot. Malama [
9], who did some work on this subject in Zambia, found that building users use the following strategies in their attempt to achieve thermal comfort: opening or closing of windows, reducing or increasing the number of items of clothing one is wearing, starting a fire, or moving to a part of the house that is either warmer or colder. Other responses identified in the study involved the use of energy-consuming devices such as heaters, fans, and air conditioners. This investigation took place in Zambia, a developing country with an energy deficit, which demands an enquiry into the energy efficiency measures that could be employed by various income groups.
Zambia is a country in Southern Africa and covers an area of 756,000 km
2 with a population of 13.1 million people [
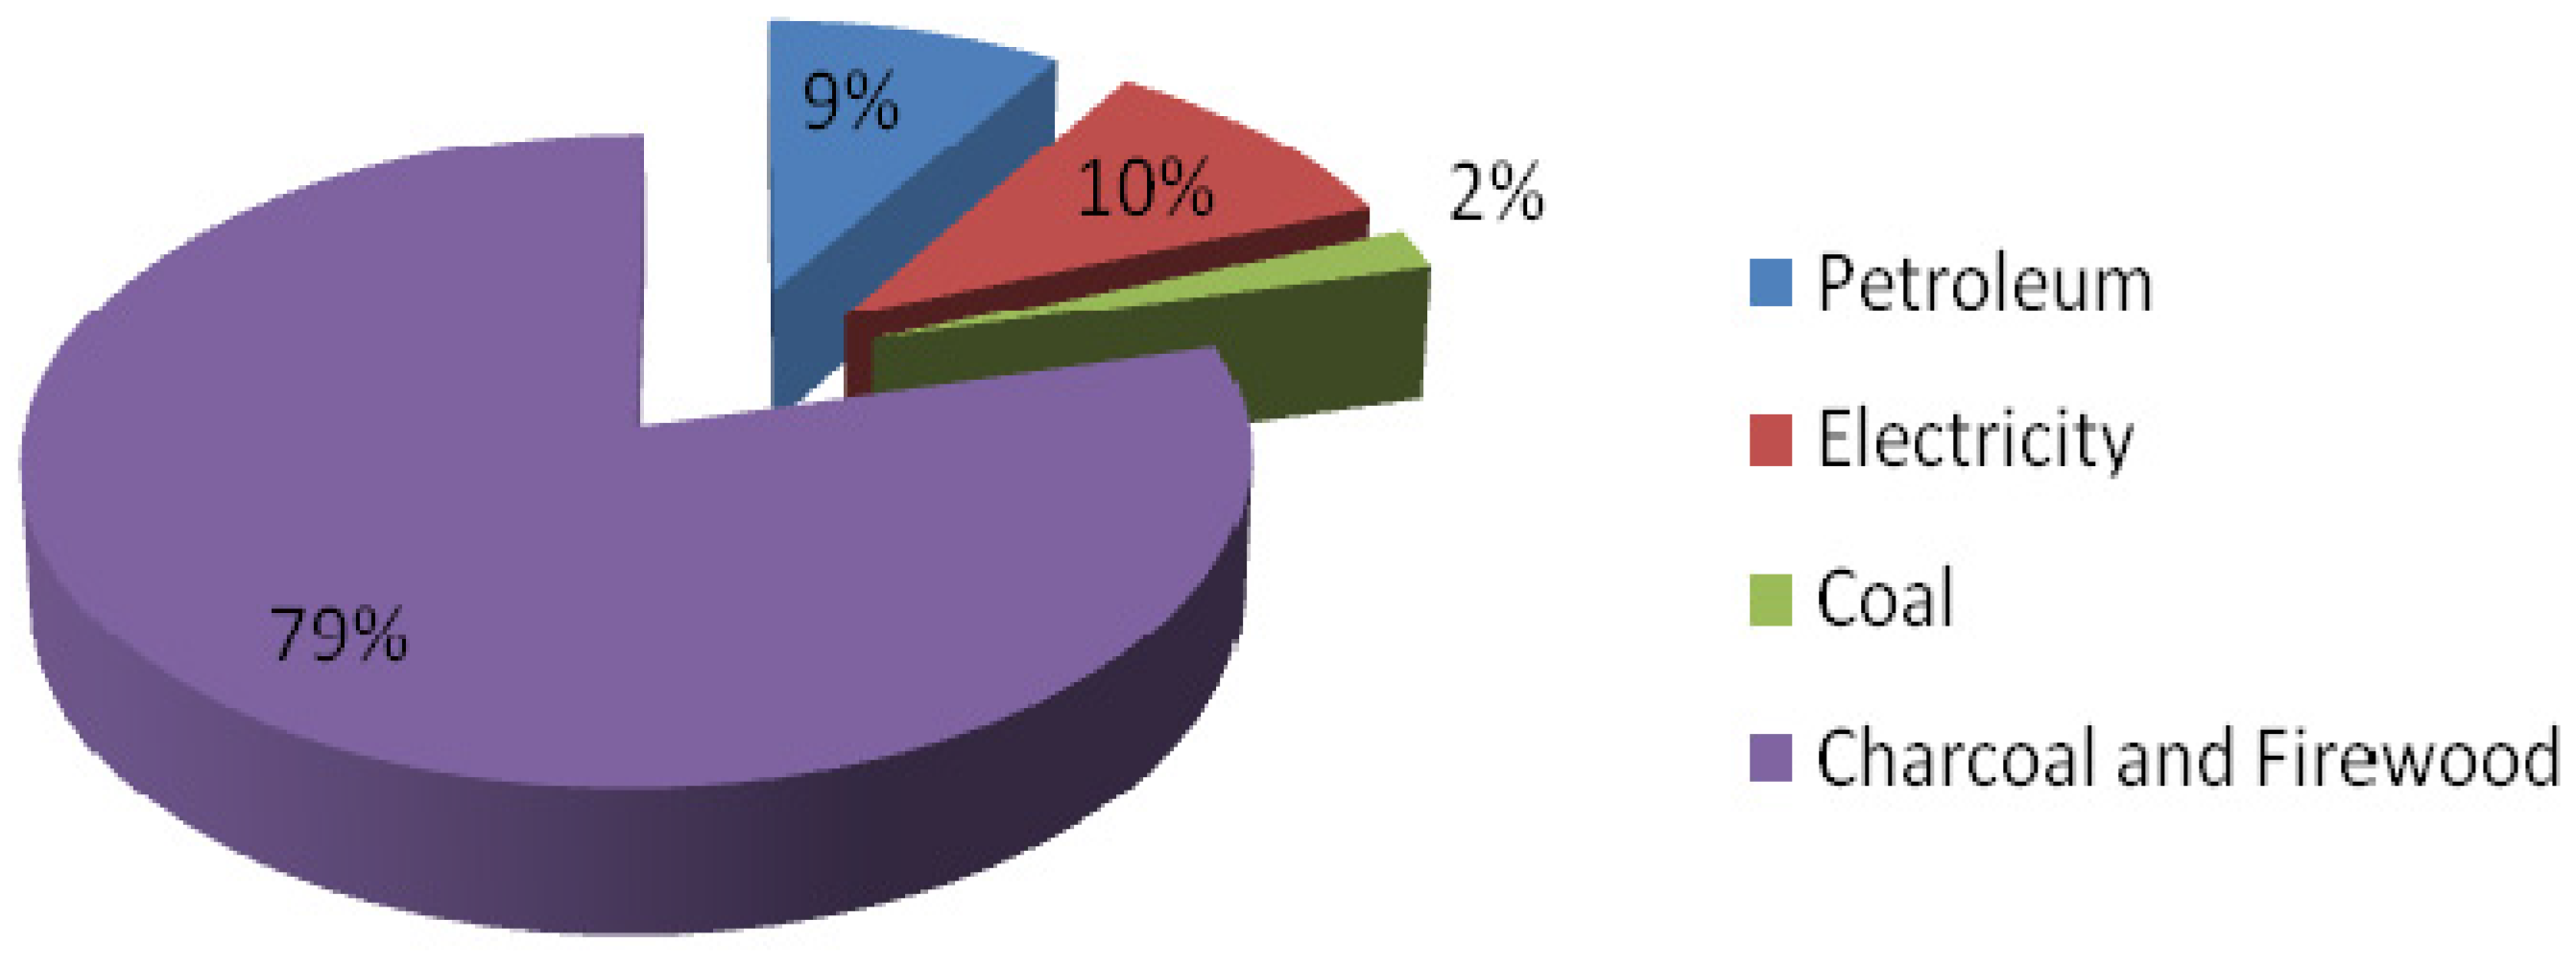
10]. According to the same report, only 22% of the population of Zambia is connected to electricity. Of the total energy consumed in the country, wood energy (in the form of charcoal and firewood) accounts for 79%, with the rest as follows: electricity—10%, petroleum products—9%, and coal—2% [
11] (See
Figure 1).
Figure 1.
Energy usage in Zambia.
Figure 1.
Energy usage in Zambia.
Most of the energy consumed in households is used for cooking and lighting. The key sources of energy used for lighting include electricity, candles, diesel, open fires, solar panels, and torches. For cooking, [
10] reported that 54% of households in Zambia use firewood as the main source of energy, followed by charcoal at 29% and electricity at 10%. Although Zambia possesses 40% of the water resources in the Southern African Development Community (SADC) region, and has a 6000 MW potential of unexploited hydro-power, its installed capacity of electricity generation is only about 2000 MW. Similarly, the country has solar radiation averaging 5.5 kWh/m
2/day, with up to 3000 sunshine hours per annum. This represents a significant potential for exploiting the generation of electricity through solar thermal and photovoltaic technologies.
Zambia has experienced positive economic growth in the recent past, leading to increased demand for energy, especially with the increase in mining and other economic activities in the country. This has worsened the electricity deficit, resulting in widespread power rationing by Zambia Electricity Supply Corporation (ZESCO) (Lusaka, Zambia) the national power utility company with the legal mandate of generation, transmission, distribution, and supply of power to residential, commercial, and industrial consumers.
The aim of the research (which is the basis of this paper) was to find out whether households belonging to different income groups behave differently with regard to the adoption of energy efficiency measures. A key objective was to establish whether there was a difference in results between the inferential and descriptive statistics. The other objectives of the study were to establish:
How much households know about energy efficiency measures;
Households’ patterns of usage of energy-consuming devices;
Households’ response to cold/hot environments within the house;
What motivates the households to reduce energy consumption; and
What barriers exist that constrain the adoption of energy efficiency measures by the households.
In order to achieve the aforementioned objectives, an elaborate methodology was pursued. Before elaborating on the methodology, it is important to review other related studies to establish an understanding of the domain and identify knowledge gaps.
2. Literature Review
Energy is a key resource in the development of any nation. It has been one of the most important resources of the 20th century. The quantity of energy consumed by a nation has been used as a proxy for how well it has developed or for establishing the pace at which it is developing. As indicated above, the consumption of energy has not been without problems given that it is now widely accepted by the scientific community and beyond that its usage has a negative impact on the environment.
Empirical evidence has shown that management of energy resources at the household level is a challenge. Ehrhardt-Martinez [
12] has argued that in comparison with the more traditional sources of energy such as wood and coal (whose quantities the consumer can see), electricity is an invisible resource. This, the above paper contends, makes it difficult for consumers to estimate the amount they are consuming. The paper further argued that for most people the only measure they have of the energy they have consumed is the electricity bill, which, it contends, is an inadequate tool for managing energy resources [
12]. Elsewhere, Costanzo
et al. [
13] have stated that the electricity bill that reflects the total energy consumed in the household presents an impoverished and undifferentiated information communication that makes better understanding of energy usage by households very unlikely.
It has also been argued that the invisibility of modern energy resources impedes the establishment of social norms with regards to what is the appropriate level of energy consumption [
12]. Energy consumers are not only unaware of their own levels of consumption in many ways but also do not know the amount of energy consumed by others [
12].
Empirical analyses provide evidence on the importance of consumer behavior in determining energy consumption in households. This means that even when a building is designed to meet all the requirements for energy efficiency, the way it is used by the building’s occupants will have an impact on the effectiveness of the energy efficiency design [
4]. Research has shown that there is a correlation between energy consumption and lifestyle (see, for instance, [
14,
15]). An analysis of empirical evidence from work by various researchers shows that the following are key factors that have an impact on the adoption of energy efficiency measures by households: income of the household, behavior (which would be affected by the norms, beliefs, and lifestyle of the household), technology (some technologies make it easy for households to adopt energy efficiency measures, while other forms of technology present a barrier because they may be expensive for the household to adopt), and information/knowledge of energy efficiency measures.
2.1. Income
This paper seeks to explore the role income plays in determining energy efficiency behavior in households. It draws on studies that have investigated the link between income and the energy efficiency behavior of building users. Hackett and Lutzenhiser [
16] have shown that energy consumption among different households varies widely, not only due to the difference in design and technology of the houses but also due to socio-demographic differences such as household size, members’ ages, income, ethnicity, and race as well as differences in values, beliefs, habits, and norms. They have argued that this variation in energy consumption due to non-physical factors can be as high as 33% for houses with similar construction. Elsewhere, Ehrahardt-Martinez [
17] contends that consumers are different and because of that they will behave differently according to their individual characteristics.
Interestingly, empirical evidence also shows that although income has been found to be a significant determinant of baseline energy use, it has no impact on the energy conservation behavior of households in relation to feedback ([
18,
19]). This means that, although households’ level of consumption of energy is correlated with their incomes, their energy conservation behavior is not. Furthermore, Allen and Janda [
20] have shown that although high-income consumers are more likely to be environmentally conscious they are also less likely to engage in frequent behavior related to energy conservation. Elsewhere, Owens and Driffill [
6] have shown that pro-environmental attitudes among energy consumers do not necessarily translate into significant shifts in energy efficiency behavior.
It can be argued, therefore, that the consumption of energy by households is dependent on income and that the higher the household income the higher the environmental consciousness of the household. However, from the literature, it is also true that neither the difference in income nor the difference in environmental consciousness actually translates into changes in the energy efficiency behavior of the household.
2.2. Behavior
As indicated above, the amount of energy consumed by households depends not only on their income levels but also on the behavior of the households. It is important to understand the behavior of households (and which behaviors yield the most energy savings) because this will enable researchers and policy makers to target those behaviors that will result in maximum benefits (in terms of reduction in energy consumption) from behavioral change [
17]. Empirical evidence has shown that there are considerable energy savings that can be made from changes in the behavior of households [
21].
Devine-Wright and Devine-Wright [
22] have shown that behavior is influenced in a complex way by many factors such as price, awareness, trust, commitment, and in some cases a sense of moral obligation. Behavioral change can sometimes be effected without an explicit change in attitude through regulation or through economic instruments such as pricing and taxation [
6]. However, using such instruments in isolation carries with it some political risks (ibid). In Zambia, for example, studies have shown that the introduction of prepayment electricity meters forced some households to start budgeting for electricity, which they were not doing before [
23]. Anecdotal evidence collected during the same study showed that most of the households interpreted the introduction of prepayment meters as being the same as an increase in the price of electricity. This was because the households were now able to see how their money was being consumed by observing how quickly the meter run out of credit (which was markedly different from having to wait for a bill after a month of consumption). Behavior is also influenced strongly by culture, norms, routine habits and practices, social networks, and technologies [
6]. Ehrhardt-Martinez [
17] has identified nine behavioral categories that she has used in analyzing the impact of behavior on energy consumption. Although there are nine behavioral categories, they are identified according to three broad groups
i.e., purchases, practices, and a middle grouping that involves both purchase and practice. This categorization is shown in
Table 1.
Table 1.
Categorization of energy efficiency behavior, according to Ehrhardt-Martinez [
17].
Table 1.
Categorization of energy efficiency behavior, according to Ehrhardt-Martinez [17].
| | Behavior Category | Type | Description |
|---|
| 1. | Alternative technology choice | Practices | Choosing between two technologies to achieve the same goal but with different energy implications (e.g., using a window or fan instead of air conditioning, or a compact fluorescent lamp (CFL) instead of an incandescent light bulb) |
| 2. | Conservation behavior | Practices | Doing things differently in ways that save energy (e.g., washing and drying full loads of laundry, taking shorter showers) |
| 3. | Conservation setting | Practices | Changing the settings on lights, appliances and electronics (e.g., changing the thermostat setting, changing computer settings, reducing refrigerator and hot water heater settings) |
| 4. | Enhanced control | Practices/purchase | Purchasing and using special equipment that allows for enhanced control (e.g., using power strips, timers, and programmable thermostats) |
| 5. | Investment decision | Purchase | Purchasing more energy efficient technologies that cost $200 or more (e.g., purchase attic and wall insulation, a new furnace or A/C unit, new kitchen appliances) |
| 6. | Low cost investment | Purchase | Purchase relatively inexpensive things (less than $200) that do not need to be replaced often with the goal of reducing energy consumption (e.g., insulation for a hot water heater, low flow shower head) |
| 7. | Maintenance | Practices/purchase | Maintaining existing equipment in ways that reduce energy consumption (e.g., cleaning furnace filters, cleaning dryer filters, replacing refrigerator seals) |
| 8. | Turning off | Practices | Turning off appliances, electronics, and any energy-using device |
| 9. | Unplugging | Practices | Unplugging appliances, electronics, or any energy-using device |
The adoption of some energy efficient habits is constrained by the cost of the technology involved. For example, in Zambia the shift to use the Compact Florescent Tubes (CFLs) from traditional incandescent technology has been constrained by the cost of the CFLs. The CFLs cost about K24.00 (The exchange rate is: 1 US$ to K10.50) in comparison with the incandescent lamps, which cost about K4.50. To increase the usage of CFLs among households ZESCO has been exchanging CFLs for incandescent lamps. Recently, ZESCO announced that they had distributed 1.6 million CFLs in exchange for the incandescent lamps at the cost of USD 4 million, which had resulted in saving 94 MW of electricity [
24].
2.3. Technology
Many researchers have in the recent past investigated the use of technology as a strategy for improving energy efficiency in households. According to Gardner and Stern [
21], readily available technologies provide an opportunity to reduce the current residential sector energy demand by more than 25%. Ehrhardt-Martinez [
17] has identified some of these technologies as follows: installation of attic insulation, purchase of more energy efficient heating, ventilation, and air conditioning (HVAC) systems, use of CFLs, caulking and weather-stripping, purchase of more energy-efficient refrigerator, washer, and water heater,
etc. Empirical research has shown that the adoption of technology alone is not enough as social and behavioral considerations are important in that they shape and constrain the decisions to adopt technology, technology choices and operation, and how these technologies are used on a day-to-day basis [
17]. Ehrhardt-Martinez [
17] has argued that notwithstanding technology, behavioral change can also reduce energy consumption more directly by changing habits, lifestyles, and everyday energy use practices. Thus, although technology is available and can be used as a strategy for energy conservation, its adoption (in itself) does not translate into better energy management or conservation as that depends on other factors, of which behavior is a major one. Technology has been a major strategy used by society in its quest to achieve energy efficiency. The use of technology in this way has resulted in the rise to prominence of energy-efficient appliances such as those used in the performance of house chores (e.g., washers and clothes dryers) and those used in space and water heating.
2.4. Energy Efficiency: Information versus Action
As indicated above, there is an assumption by authorities that if consumers have information and knowledge on energy efficiency they will act on it. As seen in
Section 1, above, this is not always the case. Studies have shown that although providing information may in some circumstances influence attitudes on issues like energy and the environment, it often has little or no impact on behavior (see [
25]). Elsewhere, research has shown that attitudes towards energy consumption are correlated only with conservation knowledge, not actual conservation [
26].
In their study on the impact of feedback on energy use, Allen and Janda [
20] contended that it was inconclusive that additional knowledge on the usage of energy would lead to enough behavioral change to justify the purchase of feedback meters.
Thus, the fact that one has information about energy efficiency measures or strategies does not mean that they will use that information to change their energy consumption behavior. An interesting aside to this discussion is that there is a correlation between the perceived credibility of the source of the information and the change in the attitude of the one receiving the information. Work by Armel [
27] has shown that messages attributed to highly credible sources produce greater attitude change than the same message attributed to less credible sources. In the absence of clear information about the true benefits of different energy-saving measures, people are likely to go along with the sources they consider credible (ibid). These sources are likely to be either institutions or individuals that have a good standing in the minds of consumers. The examples of Oprah Winfrey and Bill Gates were cited as sources of information people in the USA consider credible (ibid). Additionally, consumers are more likely to reduce energy consumption when they learn that their neighbors are consuming less energy rather than when they were told about the environmental benefits (of reducing energy consumption) or about reduction in personal costs (see [
28]).
Thus, the advertising campaigns that are the main strategy used by ZESCO to encourage people to conserve power are unlikely to be successful. This is because ZESCO has a serious credibility problem; not least because consumers have always been suspicious of the bills they receive but also because ZESCO is seen as a very inefficient and ineffective institution. In Malama
et al. [
23], some of the interviewees reported that each time ZESCO visited their houses to check on their prepayment electricity meters, the rate of energy consumption on the meter went up. In this study the residents of Bulangililo, a township in Kitwe, Zambia, were initially hostile to the researchers, thinking that they were from ZESCO. Stern and Aronson [
29] have suggested the following solutions to the credibility problem: creating partnerships between low- and high-credibility sources, utilizing grassroots organizations and pre-existing neighborhoods, and creating new organizations that are not tainted by conflict of interest.
Costanzo
et al. [
13] have also shown that households very rarely adopt the energy efficiency information they receive from advertising. Empirical evidence has shown that the use of social diffusion as a way of dealing with the problems of the low uptake of information is more effective than advertising. Social diffusion is where information is received through interpersonal channels. The argument for using social diffusion is that information received this way is more likely to be perceived, favorably evaluated, understood, and remembered.
Although there is an ever-increasing body of knowledge on the behavior of households in relation to the adoption of energy efficiency measures, there is a dearth of research done on this subject in developing countries such as Zambia. A recent paper by Malama
et al. [
23] showed that there is a strong link between lifestyle and energy consumption in the high-income energy consumers in Zambia. It has to be said, though, that this paper was largely descriptive and exploratory. Other papers done recently on this subject are Makashini
et al. [
30] and Nematchoua
et al. [
31].
The current paper therefore aims to build on Malama
et al. [
23] and Makashini
et al. [
30] by using inferential statistics to investigate the relationships between the income status of households and their behavior with regards to energy efficiency. This study is important as it provides empirical evidence that will inform policy on how households of different income categories behave in relation to energy efficiency.
3. Research Methods
This research was predominantly quantitative in nature, with questionnaires used as the main data collection instrument. Field work was conducted in March 2014 in two contrasting neighborhoods of Kitwe-Bulangililo (low income) and Riverside (high income). The City of Kitwe, the second largest in Zambia, is approximately 777 km
2 in size and has an estimated population of about 520,000 people [
32]. The main economic activities in the city are mining, agriculture, and manufacturing. The majority of residents in the high-income areas are engaged in formal employment, while those in low-income areas are involved in informal trading, formal employment, and work in high- and medium-income neighborhoods as domestic workers. The two neighborhoods were selected as case study areas to capture two contrasting classes of neighborhoods. The two neighborhoods were also selected due to their proximity to the university where the researchers work, as this helped to lower the research costs. The questionnaire was carefully designed so as to conform to the cultural orientation of the targeted respondents, especially in low-income areas where literacy levels are relatively low. The questionnaire was organized into four sections. The first section was aimed at profiling the respondents, while the second section was aimed at capturing respondents’ knowledge and behavior about energy efficiency measures. The penultimate section was about factors motivating households’ decisions to reduce energy consumption, while the last section captured factors hindering respondents’ uptake of measures to reduce energy consumption.
When administering questionnaires, care was taken to ensure that the field research team, particularly the Principal Investigator, applied excellent listening skills in order to, as Yin [
33] advises, “receive information through multiple modalities… not just using the aural modality.” This was important as it helped to capture non-verbal evidence. Furthermore, for purposes of encouraging full engagement of the participants, the questionnaires were structured in such a way that they played the role of being a guide to conversation rather than examination-like question-and-answer sessions, which could potentially intimidate the respondents.
As indicated above, a problem emerged when the research team visited the low-income area because the local people were suspicious that the research team members were from ZESCO and had come to conduct electricity disconnections. Upon realizing this, the team needed to quickly employ skills to deal with the respondents’ fears, mistrust, and doubts about the purpose of the research exercise and the research team. In order to achieve this, it was necessary to, among other things, respect and observe local customs of hospitality, and come up with strategies that would win the community’s acceptance of the research team, as advised by a number of writers (e.g., [
34,
35]). This included identifying a local person with whom to conduct interviews.
The respondents from the high-income area (Riverside) were found to be more used to such exercises and often too busy for the interviews. In all the interviews conducted in Riverside, only one respondent was present during the interview. In Bulangililo, on the other hand, interviews that were initially intended to be conducted in privacy ended up being mini focus group discussions as the presence of a “stranger” in these areas was found to have the effect of exciting and attracting passersby and even neighbors. Because of the rich social networks, residents in low-income locations learn about the presence of strangers very quickly. During interviews with respondents from high-income localities, it is essential to abide by Social and Community Planning Research advice (SCPR, 1972 [
36]),
i.e., unlike in the low-income area, where respondents worried less about the length of the questionnaire interview even after it lasted longer than the promised duration, the time factor was strictly observed when interviewing high-income respondents.
A total of 56 households responded to the questionnaires administered for this survey, as shown in
Table 2.
Table 2.
Case study neighborhoods and respective number of respondents.
Table 2.
Case study neighborhoods and respective number of respondents.
| Neighborhood Name | Class | Number of Respondents | % | Distance from the Central Business District (CBD) |
|---|
| Riverside | High income | 29 | 51.8% | 5 km |
| Bulangililo | Low income | 27 | 48.2% | 7 km |
| Total | | 56 | 100% | |
The respondents were selected randomly with the decision to stop further sampling being made once it was determined that an acceptable response rate had been reached. In the sampling of the households, every third house of every third road was selected. However, in cases where there was either no one at home or the household did not want to take part, the next house was targeted. Using this approach, the total number of homes covered in the two neighborhoods was 146. The research team ensured that the 56 respondents completed at least 80% of the questions on the questionnaire. Therefore, the response rates of this survey was 38.4% (56/146 × 100), which is consistent with other response rates in most scientific literature. In Bright Ideas [
37], it has been argued that acceptable response rates can be as low as 10% and high as 75%. The response rate is also consistent with most questionnaire surveys in the construction industry [
38].
4. Results
As indicated earlier, one of the key aspects distinguishing this study from others such as Malama
et al. [
23] and Makashini
et al. [
30] is that it uses not only descriptive but also inferential statistics to determine the relationship between the energy consumption and behavioral lifestyle of households from different income categories. Descriptive statistics are distinguished from inferential statistics (or inductive statistics) in that, while the former aim to summarize a sample, the latter use the data to learn more about the population that the sample represents. Thus, in addition to the cross tabulation of the data (descriptive statistics), a chi-square, a type of a non-parametric test (inferential statistics) commonly used on nominal data, was also employed to establish the relationship between variables. This interpretation is often called “chi-square (
) test of independence.” The null hypothesis that is tested is that the two variables are independent (not related). The alternative hypothesis is that the two variables are related (not independent). In order to use this test, certain conditions have to be fulfilled. For instance, for a 2 × 2 table (
i.e., only two categories in each variable):
If the total sample size is greater than 40, then a chi-square can be used;
If the total sample size is between 20 and 40, and the smallest expected frequency is at least 5, the chi-square can be used;
Otherwise, Fisher’s exact test must be used.
For other tables, chi-square can be used if no more than 20% of the expected count is less than 5% or 80% of cells have an expected frequency of 5 or more. To conduct a chi-square test of independence, two hypotheses are often stated ([
39,
40]). The null hypothesis that is tested is that the two variables are independent (not related). The alternative hypothesis is that the two variables are related (not independent),
viz.:
H0: There is no relationship between income groups or level of income and knowledge about household energy reduction measures or any other variable being tested (in other words, the two variables are independent).
H1: There is a relationship between income groups or level of income and knowledge about household energy reduction measures or any other variable being tested (in other words, the two variables are dependent on each other).
For both types of statistics
i.e., descriptive and inferential, the results are presented under the following sections: (i) different energy devices used by the households; (ii) households’ knowledge of energy reduction strategies; (iii) different energy saving strategies used by households (iv) use of cold minimization strategies; (v) use of heat minimization strategies; (vi) motives for adoption of different energy reduction strategies; and (vii) barriers to the adoption of energy reduction strategies. The descriptive statistics are presented first, followed by the inferential statistics. Only the summarized descriptive results are presented here. Detailed tables are presented in the
Appendix (
Table A1,
Table A2,
Table A3,
Table A4,
Table A5 and
Table A6).
4.1. Types of Common Household Energy Devices
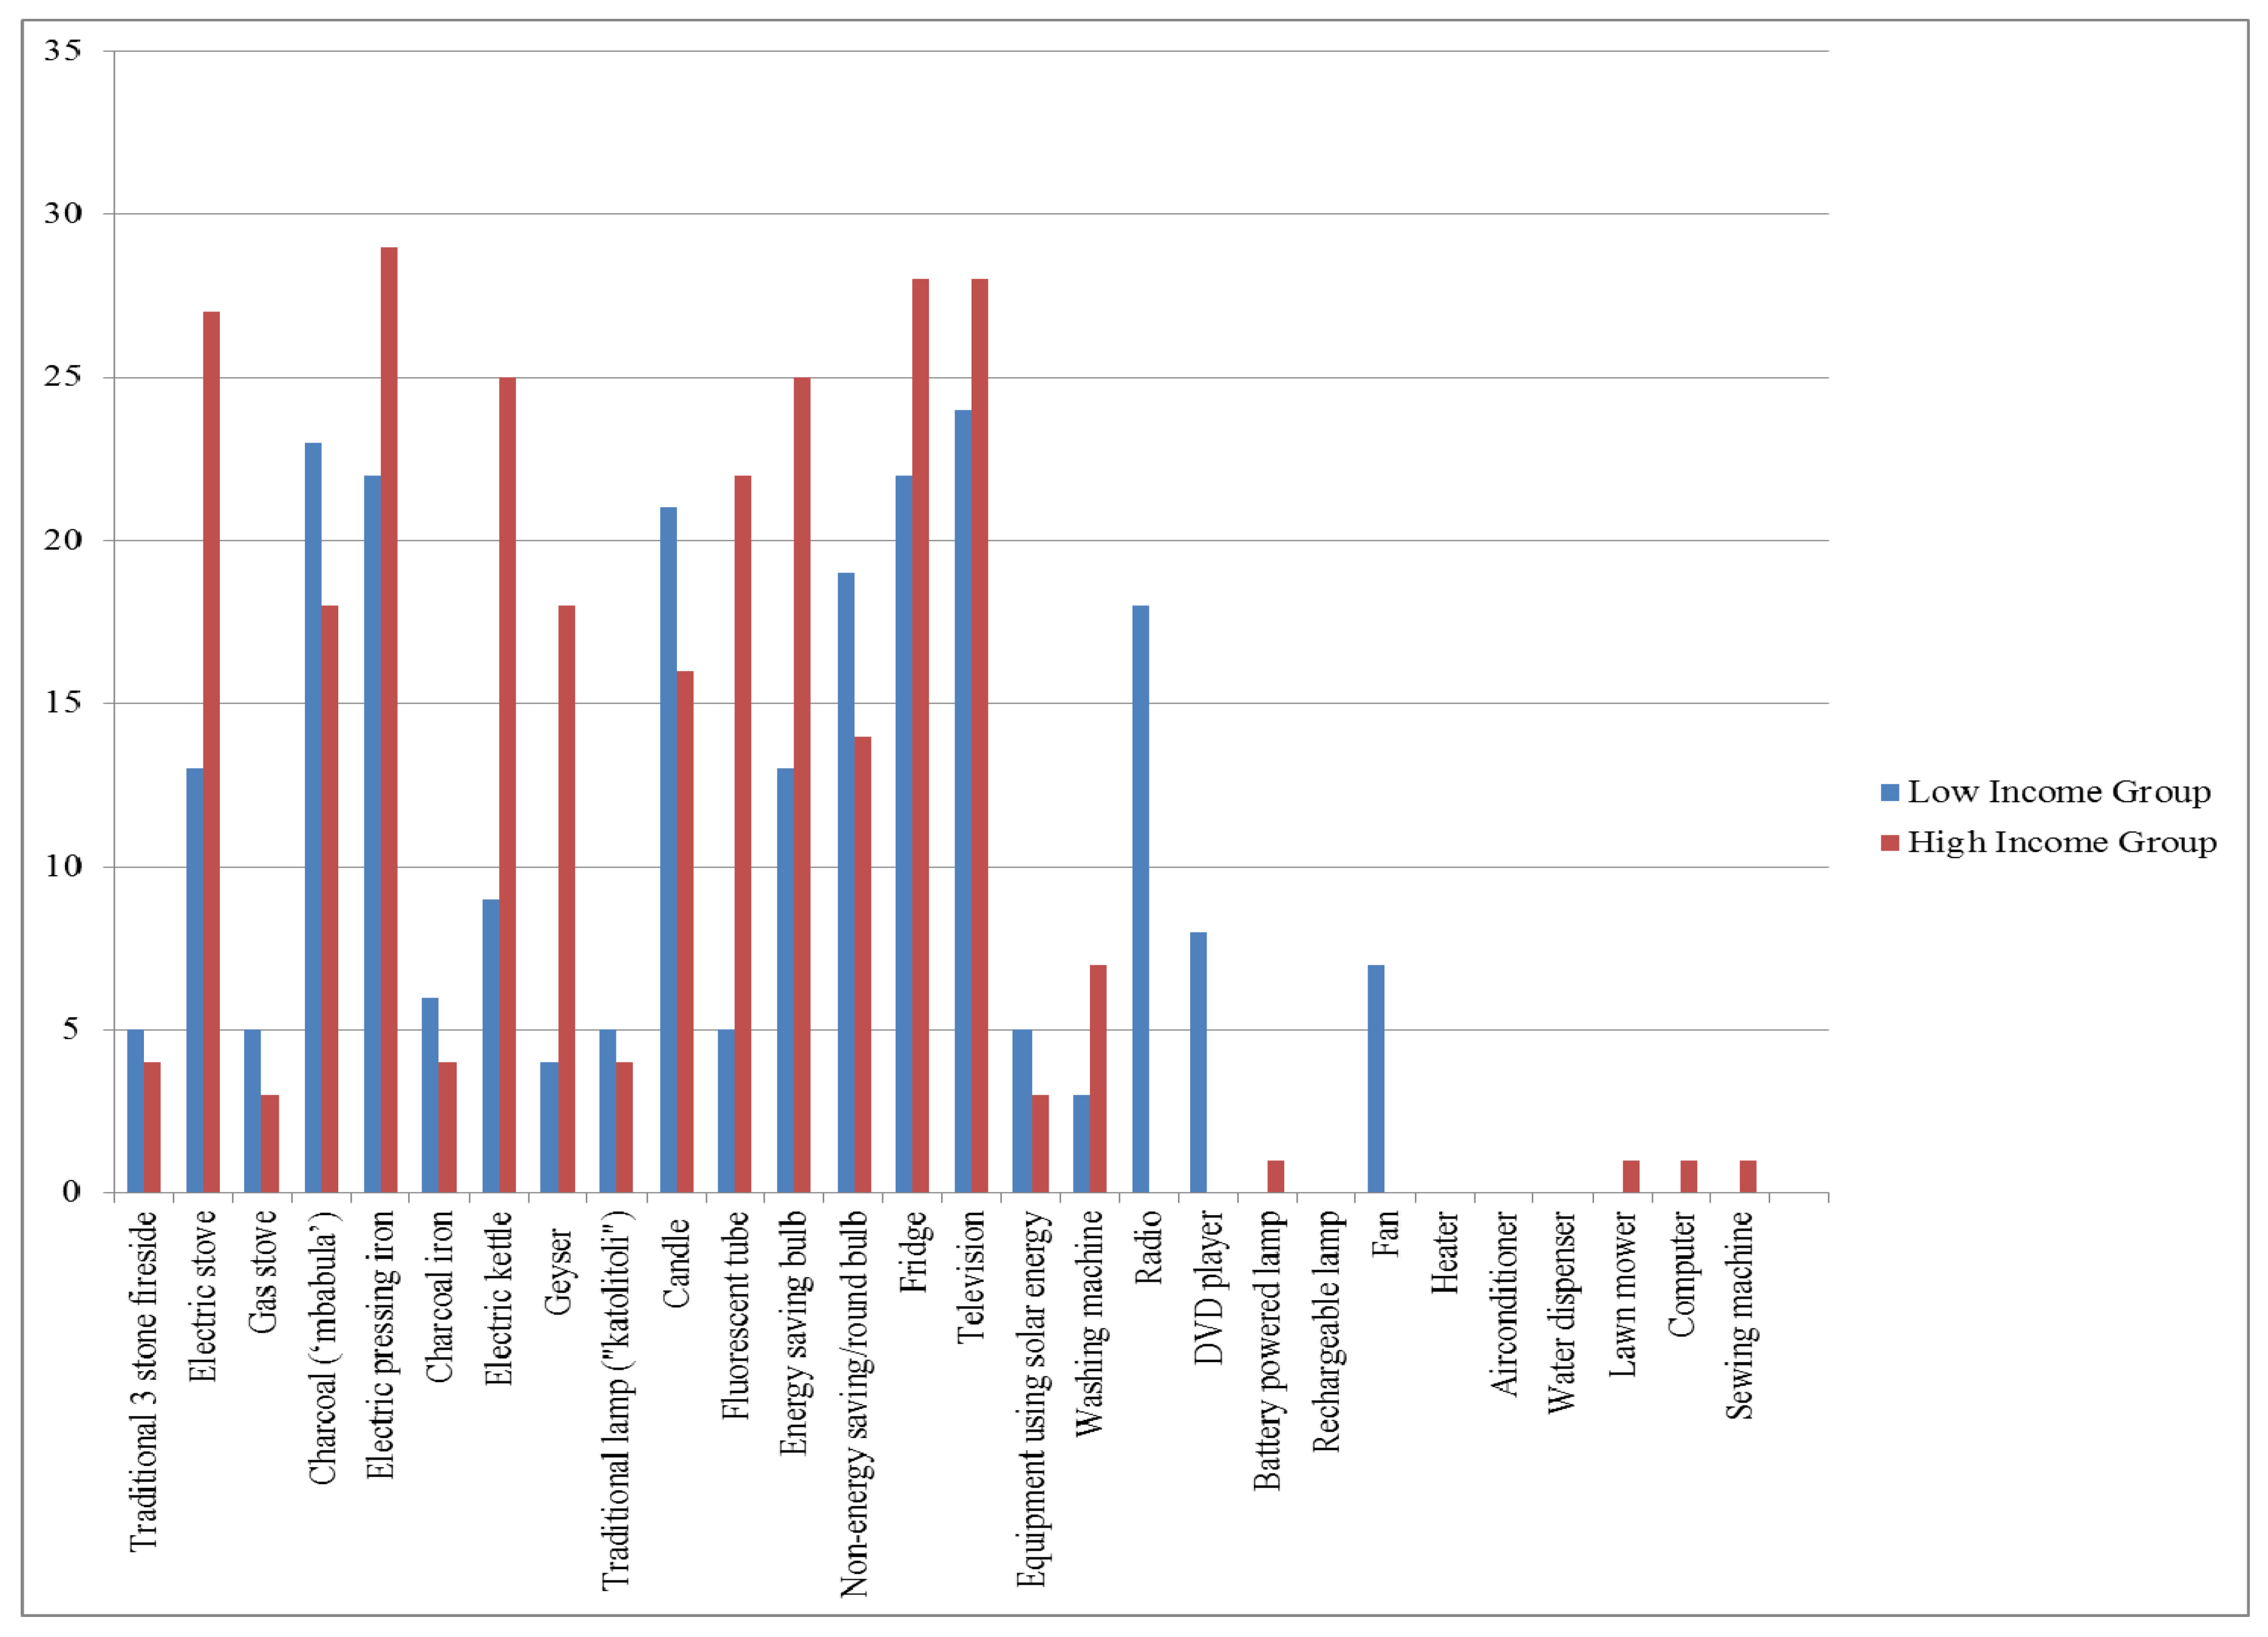
The patterns of usage of energy-consuming devices are shown in
Figure 2. It can be seen that the majority of the respondents in the high-income category use TVs, fridges, cookers, electric kettles, pressing irons, geysers (for heating water), and energy-efficient electricity lamps. In the low-income neighborhood, however, there was more widespread use of charcoal for cooking and ironing, candles, and round bulbs, which are not energy efficient. As indicated above, one of the key findings of Malama
et al. [
23] was that there was a larger shift in patterns of consumption of energy from electricity to charcoal in the low-income group (34%) as compared to the high-income group (12%). This would be in keeping with the results of this study, which show more use of charcoal in low-income areas as compared to the high-income category. The results also show that energy is mostly used for cooking and lighting in the low-income households (which are important but basic activities), whereas in the high-income households it is used more for activities that maintain a lifestyle of comfort.
4.2. Is Knowledge about Household Energy Reduction Related to the Level of Income?
As discussed earlier, according to the information deficit model, lack of information has been cited as one of the reasons for the low uptake of energy efficiency measures by households ([
4,
5]). The results in
Table 3 show that there is very little awareness of the energy efficiency measures in the low-income category, where the majority of the respondents indicated knowing either none or only one way of reducing energy consumption. However, there was better appreciation of energy efficiency measures in the high-income category, with many of the households indicating knowledge of either three or four energy efficiency measures. Malama
et al. [
23] found that the majority of people in the low-income category base their energy efficiency decisions on information from friends (63%). In both the high- and low-income areas less than 3% of all respondents indicated that they get their information from ZESCO. The high-income category would be more knowledgeable about energy efficiency because they are likely to be more educated and would thus have more access to such information as compared to the low-income category.
Figure 2.
Types of household energy devices used in low and high income groups.
Figure 2.
Types of household energy devices used in low and high income groups.
Table 3.
Income group versus knowledge about household energy reduction measures cross tabulation (% within income group).
Table 3.
Income group versus knowledge about household energy reduction measures cross tabulation (% within income group).
| | Not Sure How to Reduce Energy Consumption | Know at Least One Way | Know at Least Two Ways | Know at Least Three Ways | Know at Least Four Ways |
|---|
| High Income | 17.2% | 13.8% | 20.7% | 24.1% | 24.1% |
| Low Income | 18.5% | 29.6% | 18.5% | 18.5% | 14.8% |
| Total | 17.9% | 21.4% | 19.6% | 21.4% | 19.6% |
From
Table 4 it can be seen that the chi-squared value (appearing in the row labeled Pearson Chi-Square) is 2.508, with four degrees of freedom. The corresponding
p-value is 0.643 greater than
p = 0.05, hence the null hypothesis cannot be rejected. This means that there is no relationship between income groups or level of income and knowledge about household energy reduction measures.
Table 4.
Income Group versus Knowledge about household energy reduction measures (Chi-Square Tests).
Table 4.
Income Group versus Knowledge about household energy reduction measures (Chi-Square Tests).
| | Value | df | Asymp. Sig. (2-Sided) |
|---|
| Pearson Chi-Square | 2.508 a | 4 | 0.643 |
| Likelihood Ratio | 2.542 | 4 | 0.637 |
| No of Valid Cases | 56 | | |
4.3. Are the Energy-Saving Measures Used Related to the Level of Income?
The results from
Table 5 show that respondents from the low-income households indicated a low level of usage of energy-efficient equipment compared to the high-income group. In the high-income category there was a higher usage of the following measures: open windows, turn off lights, and unplug appliances that are not being used. This was not the case in the low-income households. Both categories, however, reported covering pots when cooking. It has been reported elsewhere that this could be attributed to hygiene and not entirely to energy efficiency alone [
30]. The general picture from the descriptive statistics is that the high-income households are more likely to use energy efficiency measures than their low-income counterparts.
Table 5.
Comparison of energy-saving measures (% within income group).
Table 5.
Comparison of energy-saving measures (% within income group).
| | Very Often | Often | Less Often | Never |
|---|
| Use efficient equipment |
| High-Income Group | 51.7% | 20.7% | 20.7% | 6.9% |
| Low-Income Group | 25.9% | 18.5% | 25.9% | 29.6% |
| Total | 39.3% | 19.6% | 23.2% | 17.9% |
| Open windows at required times |
| High-Income Group | 51.7% | 17.2% | 13.8% | 17.2% |
| Low-Income Group | 33.3% | 22.2% | 22.2% | 22.2% |
| Total | 42.9% | 19.6% | 17.9% | 19.6% |
| Unplug appliances that are not in use |
| High-Income Group | 41.4% | 20.7% | 10.3% | 27.6% |
| Low-Income Group | 37.0% | 18.5% | 33.3% | 11.1% |
| Total | 39.3% | 19.6% | 21.4% | 19.6% |
| Turn off lights when not in use |
| High-Income Group | 37.9% | 20.7% | 13.8% | 27.6% |
| Low-Income Group | 44.4% | 18.5% | 25.9% | 11.1% |
| Total | 41.1% | 19.6% | 19.6% | 19.6% |
| Do not open the oven more than necessary |
| High-Income Group | 28.6% | 35.7% | 28.6% | 7.1% |
| Low-Income Group | 22.2% | 22.2% | 11.1% | 44.4% |
| Total | 25.5% | 29.1% | 20.0% | 25.5% |
| Cover pots and pans to keep in the heat when cooking |
| High-Income Group | 65.5% | 24.1% | 10.3% | 0% |
| Low-Income Group | 55.6% | 14.8% | 29.6% | 0% |
| Total | 60.7% | 19.6% | 19.6% | 0% |
| Match the size of the stove plate to the size of the pot used |
| High-Income Group | 34.5% | 13.8% | 24.1% | 27.6% |
| Low-Income Group | 44.4% | 29.6% | 14.8% | 11.1% |
| Total | 39.3% | 21.4% | 19.6% | 19.6% |
| Keep your stovetop clean (dirty stoves absorb more heat/energy) |
| High-Income Group | 48.3% | 24.1% | 3.4% | 24.1% |
| Low-Income Group | 29.6% | 22.2% | 37.0% | 11.1% |
| Total | 39.3% | 23.2% | 19.6% | 17.9% |
| Turn off the oven shortly before you have finished cooking |
| High-Income Group | 37.9% | 31.0% | 17.2% | 13.8% |
| Low-Income Group | 22.2% | 29.6% | 25.9% | 22.2% |
| Total | 30.4% | 30.4% | 21.4% | 17.9% |
Based on
Table 6, the
p-values lead to the conclusion that the null hypotheses cannot be rejected except for two variables
i.e., “not opening the oven too often” and “cleaning the stove.” This means that most energy-saving measures are independent of the income group of the household. With regards to the two variables (for which the results show a relationship with the income group of the household), a further interview was conducted with some residents to gain a deeper understanding of the reasons why they chose the actions that they took. Firstly, for “not opening the oven too often” it emerged that this is done routinely and not solely for energy-saving purposes. Secondly, with regards to “cleaning the top of stoves,” some respondents indicated that they do that for hygienic purposes too. This result can also be explained by the fact that not so many people in the low-income category use stoves, especially after the introduction of the electricity prepayment meters.
Table 6.
Energy-saving measures versus income group-chi-square test.
Table 6.
Energy-saving measures versus income group-chi-square test.
| | Pearson Chi-Square | df | Asymp. Sig. (2-Sided) | Chi-Square Assumptions | Hypothesis |
|---|
| Use efficient equipment | 6.614 | 3 | 0.085 | 1 cell (12.5%) has an expected count less than 5. The minimum expected count is 4.82. | The p-value is 0.085 greater than p = 0.05, hence H0 holds. |
| Open windows at required times | 2.013 | 3 | 0.57 | 1 cell (12.5%) has an expected count less than 5. The minimum expected count is 4.82. | The p-value is 0.57 greater than p = 0.05, hence H0 holds. |
| Turn off lights when not in use | 3.158 | 3 | 0.368 | 0 cells (0.0%) have an expected count less than 5. The minimum expected count is 5.30 | The p-value is 0.368 greater than p = 0.05, hence H0 holds. |
| Turn off the oven shortly before you have finished cooking (as the oven will retain enough heat to finish the cooking) | 2.194 | 3 | 0.533 | 1 cell (12.5%) has an expected count less than 5. The minimum expected count is 4.82. | The p-value is 0.533 greater than p = 0.05, hence H0 holds. |
| Unplug appliances that are not in use | 5.481 | 3 | 0.140 | 0 cells (0.0%) have an expected count less than 5. The minimum expected count is 5.30. | The p-value is 0.140 greater than p = 0.05, hence H0 holds. |
| Cover pots and pans to keep in the heat when cooking | 3.495 | 2 | 0.174 | 0 cells (0.0%) have an expected count less than 5. The minimum expected count is 5.30. | The p-value is 0.174 greater than p = 0.05, hence H0 holds. |
| Not open the oven more than necessary. Every time you open the oven door you lose up to 10 °C | 10.687 | 3 | 0.014 | 0 cells (0.0%) have an expected count less than 5. The minimum expected count is 5.40. | The p-value is 0.014 less than p = 0.05, hence H1 holds. |
| Match the size of the stove plate to the size of the pot used (using a smaller pot on a larger stove plate means that energy from the exposed part of the stove plate is being wasted) | 4.540 | 3 | 0.209 | 0 cells (0.0%) have an expected count less than 5. The minimum expected count is 5.30. | The p-value is 0.209 greater than p = 0.05, hence H0 holds. |
| Keep your stovetop clean (as dirty stoves absorb more heat/energy) | 10.619 | 3 | 0.014 | 1 cell (12.5%) has an expected count less than 5. The minimum expected count is 4.82. | The p-value is 0.014 less than p = 0.05, hence H1 holds. |
4.4. Is the Type of Cold Minimization Strategy Related to the Income Level?
Table 7 shows that both sets of respondents use the following measures to create warm comfort conditions when it is cold: use of additional clothing, use of warm water for bathing, and staying indoors when it is cold. This would be during the cold season, which runs from May/June to July/August. However, fewer respondents indicated turning on the heating in the low-income households as compared to the high-income ones. This could be due to the fact that ownership of heaters in the low-income households is lower than in the high-income households.
Table 7.
Comparison of cold minimization strategy.
Table 7.
Comparison of cold minimization strategy.
| | Very Often | Often | Less Often | Never |
|---|
| Go to bed and cover yourself in blankets |
| High-Income Group | 48.3% | 20.7% | 10.3% | 20.7% |
| Low-Income Group | 37.0% | 18.5% | 25.9% | 18.5% |
| Use a fire to warm yourself |
| High-Income Group | 6.9% | 17.2% | 17.2% | 58.6% |
| Low-Income Group | 33.3% | 29.6% | 29.6% | 7.4% |
| Total | 19.6% | 23.2% | 23.2% | 33.9% |
| Turn the heating on |
| High-Income Group | 34.5% | 37.9% | 17.2% | 10.3% |
| Low-Income Group | 3.7% | 14.8% | 44.4% | 37.0% |
| Total | 19.6% | 26.8% | 30.4% | 23.2% |
| Wear additional clothes |
| High-Income Group | 41.4% | 10.3% | 24.1% | 24.1% |
| Low-Income Group | 40.7% | 29.6% | 14.8% | 14.8% |
| Total | 41.1% | 19.6% | 19.6% | 19.6% |
| Lock up windows and doors |
| High-Income Group | 44.8% | 24.1% | 13.8% | 17.2% |
| Low-Income Group | 25.9% | 22.2% | 33.3% | 18.5% |
| Total | 35.7% | 23.2% | 23.2% | 17.9% |
| Reduce the number of showers (if the cold lasts for days) |
| High-Income Group | 3.4% | 6.9% | 20.7% | 69.0% |
| Low-Income Group | 7.4% | 7.4% | 18.5% | 66.7% |
| Total | 5.4% | 7.1% | 19.6% | 67.9% |
| Use warm water for showers (instead of cold water) |
| High-Income Group | 48.3% | 20.7% | 10.3% | 20.7% |
| Low-Income Group | 37.0% | 18.5% | 29.6% | 14.8% |
| Total | 42.9% | 19.6% | 19.6% | 17.9% |
Malama [
9] also reported that most of the respondents who took part in his survey increased the amount of clothing they wore in their quest to achieve thermal comfort. Very few respondents, in both categories, reported making tea to keep their bodies warm as tea is not widely used for keeping warm in Zambia. Additionally, very few reported keeping warm through going to bed and covering themselves with blankets in the low-income area compared to the high-income category because habitable spaces in the low-income area tend to have multiple uses due to the high numbers of occupants in each household. Thus, one space may serve as a living space during the day and become a bedroom during the night.
Based on
Table 8, the
p-values lead to the conclusion that the null hypotheses cannot be rejected except for one variable. This means most cold minimization strategies are independent of the income group. The one variable that is not independent of the income group is “use of fire to warm yourself.” From the descriptive statistics it can be seen that the two income groups respond differently to this variable. For example, 17 out of 27 low-income group respondents (62.9%) are more likely to use fire to keep warm compared to 7 out of 29 (
i.e., 24.1%) in the high-income group. Perhaps this is due to the fact that more respondents in the low-income group use the three-stone fireside and charcoal (mbabula) than the high-income group (see
Figure 2).
Table 8.
Relationship between cold minimization strategy versus income group-chi-square test.
Table 8.
Relationship between cold minimization strategy versus income group-chi-square test.
| | Pearson Chi-Square | df | Asymp. Sig. (2-Sided) | Ch-Square Assumptions | Hypothesis |
|---|
| Go to bed and cover yourself in blankets | 2.380 | 3 | 0.497 | 1 cell (12.5%) has an expected count less than 5. The minimum expected count is 4.82. | The p-value is 0.497 greater than p = 0.05, hence H0 holds; |
| Use fire to warm yourself | 17.632 | 3 | 0.001 | 0 cells (0.0%) have an expected count less than 5. The minimum expected count is 5.30. | The p-value is 0.001 less than p = 0.05, hence H1 holds; |
| Wear additional clothes | 3.886 | 3 | 0.274 | 0 cells (0.0%) have an expected count less than 5. The minimum expected count is 5.30. | The p-value is 0.274 greater than p = 0.05, hence H0 holds; |
| Lock up windows and doors | 3.733 | 3 | 0.292 | 1 cell (12.5%) has an expected count less than 5. The minimum expected count is 4.82. | The p-value is 0.292 greater than p = 0.05, hence H0 holds; |
| Reduce the number of showers (if the cold lasts for days) | 0.459 | 3 | 0.928 | 4 cells (50.0%) have an expected count less than 5. The minimum expected count is 1.45. | Chi-square test fails as 50% of expected count is less than 5; |
| Use warm water for showers (instead of cold water) | 3.363 | 3 | 0.339 | 1 cell (12.5%) has an expected count less than 5. The minimum expected count is 4.82. | The p-value is 0.339 greater than p = 0.05, hence H0 holds; |
4.5. Is the Type of Heat Minimization Strategy Related to the Level of Income?
From
Table 9 it can be seen that both sets of respondents reported wearing light clothing, opening windows and/or doors, and having cold baths in response to the heat during the hot season. The hot season runs from September to November/December. These measures seem to be the opposite of those used during the cold season. However, there was more use of fans and air-conditioning reported in the high-income group compared with the low-income category. This can be explained by the fact that these appliances are fewer in the low-income group (as compared to the high-income group) since they are expensive to acquire and run. Some respondents in the low-income group reported sitting outside as a way of keeping cool but none reported using this strategy in the high-income group. The likely explanation for this is the fact that the lifestyle of the people in the high-income group is such that they spend most of their time indoors watching TV or playing games. Malama [
9] also reported that most of the respondents who took part in his survey reduced their clothing and opened the windows and doors in their quest to achieve comfort.
Table 9.
Comparison of heat minimization strategy between the low- and high-income groups.
Table 9.
Comparison of heat minimization strategy between the low- and high-income groups.
| | Very Often | Often | Less Often | Never |
|---|
| Sleep outside on the balcony |
| High-Income Group | 13.8% | 13.8% | 31.0% | 41.4% |
| Low-Income Group | 37.0% | 25.9% | 25.9% | 11.1% |
| Total | 25.0% | 19.6% | 28.6% | 26.8% |
| Wear summer/light clothes |
| High-Income Group | 69.0% | 20.7% | 3.4% | 6.9% |
| Low-Income Group | 59.3% | 22.2% | 11.1% | 7.4% |
| Total | 64.3% | 21.4% | 7.1% | 7.1% |
| Open windows and/or doors |
| High-Income Group | 48.3% | 13.8% | 27.6% | 10.3% |
| Low-Income Group | 37.0% | 25.9% | 7.4% | 29.6% |
| Total | 42.9% | 19.6% | 17.9% | 19.6% |
| Use air conditioning systems |
| High-Income Group | 31.0% | 34.5% | 24.1% | 10.3% |
| Low-Income Group | 18.5% | 11.1% | 11.1% | 59.3% |
| Total | 25.0% | 23.2% | 17.9% | 33.9% |
| Use fans |
| High-Income Group | 51.7% | 20.7% | 10.3% | 17.2% |
| Low-Income Group | 18.5% | 29.6% | 29.6% | 22.2% |
| Total | 35.7% | 25.0% | 19.6% | 19.6% |
| Have (cold) showers more often |
| High-Income Group | 34.5% | 24.1% | 24.1% | 17.2% |
| Low-Income Group | 29.6% | 22.2% | 18.5% | 29.6% |
| Total | 32.1% | 23.2% | 21.4% | 23.2% |
Based on
Table 10, the
p-values lead to the conclusion that the null hypotheses cannot be rejected except for two variables. Thus, most heat minimization strategies are independent of the income group. The two variables that showed a relationship with income groups are: “sleep outside on the balcony” and “use air conditioning systems.” An analysis of the descriptive statistics shows that there are differences in the response of the households to these variables with respect to the two income groups. For example, 17 out of 27 low-income group respondents (63%) are more likely to sleep outside in the balcony compared to 8 out of 29 (
i.e., 27.6%) high-income group respondents. Furthermore, 19 out of 29 (65.5%) high-income group respondents are more likely to use air conditioning systems compared to 8 out of 27 (
i.e., 29.6%) in the low-income group.
Table 10.
Heat minimization strategy versus income group.
Table 10.
Heat minimization strategy versus income group.
| | Pearson Chi-Square | df | Asymp. Sig. (2-Sided) | Ch-Square Assumptions | Hypothesis |
|---|
| Sleep outside in the balcony | 8.980 | 3 | 0.030 | 0 cells (0.0%) have an expected count less than 5. The minimum expected count is 5.30. | The p-value is 0.03 less than p = 0.05, hence H1 holds |
| Wear summer/light clothes | 1.375 | 3 | 0.711 | 4 cells (50.0%) have an expected count less than 5. The minimum expected count is 1.93. | Chi-square test fails as 50% of expected count is less than 5 |
| Open windows and/or doors | 7.295 | 3 | 0.063 | 1 cell (12.5%) has an expected count less than 5. The minimum expected count is 4.82. | The p-value is 0.063 greater than p = 0.05, hence H0 holds |
| Use air conditioning systems | 15.355 | 3 | 0.002 | 1 cell (12.5%) has an expected count less than 5. The minimum expected count is 4.82. | The p-value is 0.002 less than p = 0.05, hence H1 holds |
| Use fans | 7.588 | 3 | 0.055 | 0 cells (0.0%) have an expected count less than 5. The minimum expected count is 5.30. | The p-value is 0.055 greater than p = 0.05, hence H0 holds |
| Have (cold) shower more often | 1.255 | 3 | 0.74 | 0 cells (0.0%) have an expected count less than 5. The minimum expected count is 5.79. | The p-value is 0.74 greater than p = 0.05, hence H0 holds |
4.6. Is the Motive for Energy Reduction Strategy Related to the Level of Income?
It can be seen from
Table 11 that both groups of households indicated that reduction of energy consumption (and consequently energy bills) is important to them. The results from the high-income respondents also indicated that they consider energy efficiency to be an act of responsible behavior. This group also indicated that they use energy efficiency measures as a way of meeting the needs of the present without jeopardizing the needs of future generations. Compliance to government policies was also reported as a key driver for energy-efficient behavior in the high-income group. In the low-income category, on the other hand, the respondents do not highly consider issues of sustainability, government policy, and responsible behavior in their decision making. It would appear from the results that a key driver in both categories for energy efficiency behavior is the need to reduce the energy bill.
Table 11.
Comparison of energy reduction strategy between the low- and high-income groups.
Table 11.
Comparison of energy reduction strategy between the low- and high-income groups.
| | Very Often | Often | Less Often | Never |
|---|
| Reduce energy consumption and hence bills |
| High-Income Group | 79.3% | 13.8% | 3.4% | 3.4% |
| Low-Income Group | 55.6% | 18.5% | 14.8% | 11.1% |
| Total | 67.9% | 16.1% | 8.9% | 7.1% |
| Limited energy sources |
| High-Income Group | 34.5% | 34.5% | 6.9% | 24.1% |
| Low-Income Group | 18.5% | 37.0% | 33.3% | 11.1% |
| Total | 26.8% | 35.7% | 19.6% | 17.9% |
| It is an act of responsibility |
| High-Income Group | 44.8% | 20.7% | 31.0% | 3.4% |
| Low-Income Group | 14.8% | 3.7% | 3.7% | 77.8% |
| Total | 30.4% | 12.5% | 17.9% | 39.3% |
| Meeting the needs of the present without jeopardizing the ability of future generations to meet their own needs (sustainable development) |
| High-Income Group | 44.4% | 22.2% | 29.6% | 3.7% |
| Low-Income Group | 14.8% | 18.5% | 3.7% | 63.0% |
| Total | 29.6% | 20.4% | 16.7% | 33.3% |
| Compliance to government policies |
| High-Income Group | 48.3% | 27.6% | 17.2% | 6.9% |
| Low-Income Group | 19.2% | 26.9% | 19.2% | 34.6% |
| Total | 34.5% | 27.3% | 18.2% | 20.0% |
Based on
Table 12, most of the variables have failed the chi-square test. Hence nothing can be said about these variables as to whether they are dependent on or independent of one another. Surprisingly, the results show that “compliance to government policies” is dependent on income group. According to
Table 5, the low-income group revealed a clear lack of knowledge of energy efficiency measures. It is thus very unlikely that there should be a relationship between this group and the variable “compliance to government policies.”
Table 12.
Motivation for energy reduction strategy versus income group.
Table 12.
Motivation for energy reduction strategy versus income group.
| | Pearson Chi-Square | Df | Asymp. Sig. (2-Sided) | Ch-Square Assumptions | Hypothesis |
|---|
| Reduce energy consumption and hence bills | 4.530 | 3 | 0.21 | 6 cells (75.0%) have an expected count less than 5. The minimum expected count is 1.93. | Chi-square test fails as 75% of expected count is less than 5. |
| Limited energy sources | 7.660 | 3 | 0.054 | 1 cell (12.5%) has an expected count less than 5. The minimum expected count is 4.82. | |
| It is an act of responsibility | 32.888 | 3 | 0.000 | 3 cells (37.5%) have an expected count less than 5. The minimum expected count is 3.38. | Chi-square test fails as 37.5% of expected count is less than 5. |
| Meeting the needs of the present without affecting the ability of future generations to meet their own needs | 23.758 | 3 | 0.000 | 2 cells (25.0%) have an expected count less than 5. The minimum expected count is 4.50. | Chi-square test fails as 25% of expected count is less than 5. |
| Compliance with government policies | 8.646 | 3 | 0.034 | 1 cell (12.5%) has an expected count less than 5. The minimum expected count is 4.73. | The p-value is 0.034 less than p = 0.05, hence H1 holds. |
4.7. Is the Type of Barrier Related to the Level of Income?
From
Table 13 it can be seen that the low-income group (66.6%) considered lack of knowledge about the technologies to be a more significant barrier (to the adoption of energy efficiency measures) than the high-income group did (44.8%). Furthermore, the hig- income group did not consider the cost of the technologies to be a major barrier to the adoption of energy efficiency measures, whereas the low-income category considered it to be one.
Table 13.
Comparison of barriers between the low- and high-income groups.
Table 13.
Comparison of barriers between the low- and high-income groups.
| | Highly Significant | Significant | Less Significant | Not Significant | Not Applicable |
|---|
| Lack of Knowledge about the Technologies |
| High-Income Group | 34.5% | 10.3% | 27.6% | 24.1% | 3.4% |
| Low-Income Group | 33.3% | 33.3% | 11.1% | 18.5% | 3.7% |
| Total | 33.9% | 21.4% | 19.6% | 21.4% | 3.6% |
| High Cost of Energy-Efficient Technologies |
| High-Income Group | 17.2% | 48.3% | 20.7% | 10.3% | 3.4% |
| Low-Income Group | 33.3% | 22.2% | 25.9% | 14.8% | 3.7% |
| Total | 25.0% | 35.7% | 23.2% | 12.5% | 3.6% |
| OtherPriorities Are More ImportantthanUsing Energy-Efficient Technologies |
| High-Income Group | 17.2% | 27.6% | 24.1% | 10.3% | 20.7% |
| Low-Income Group | 18.5% | 14.8% | 22.2% | 29.6% | 14.8% |
| Total | 17.9% | 21.4% | 23.2% | 19.6% | 17.9% |
Based on
Table 14, the
p-values lead to the conclusion that the null hypotheses cannot be rejected for two variables,
i.e., “lack of knowledge about the technologies” and “other priorities are more important than using energy-efficient technologies.” It can thus be concluded that these variables do not depend on income group. With respect to both income groups, the “high cost of energy-efficient technologies” failed the chi-square test. Hence nothing can be said about this variable as to whether they are dependent on or independent of one another.
Table 14.
Barriers versus income group.
Table 14.
Barriers versus income group.
| | Pearson Chi-Square | df | Asymp. Sig. (2-Sided) | Chi-Square Assumptions | Hypothesis |
|---|
| Lack of knowledge about the technologies | 5.594 | 4 | 0.232 | 2 cells (20.0%) have an expected count less than 5. The minimum expected count is 0.96. | The p-value is 0.232 greater than p = 0.05, hence H0 holds. |
| High cost of energy-efficient technologies | 4.497 | 4 | 0.343 | 4 cells (40.0%) have an expected count less than 5. The minimum expected count is 0.96. | Chi-square test fails as 40% of expected count is less than 5. |
| Other priorities are more important than using energy-efficient technologies | 4.017 | 4 | 0.404 | 2 cells (20.0%) have an expected count less than 5. The minimum expected count is 4.82. | The p-value is 0.404 greater than p = 0.05, hence H0 holds. |
5. Discussion
The use of both inferential and descriptive statistics has brought forth some interesting points for discussion, not least the fact that there is an apparent difference between the two sets of results.
Inferential statistics: The results from the inferential statistics show that generally there was no relationship between the variables,
i.e., knowledge of energy reduction measures, energy-saving strategies, cold/heat minimization strategies, barriers to usage of energy-saving measures, and the motive for using the energy-saving measures on the one hand, and the two income groups the households belong to on the other hand. However, there are exceptions to this. For example, the results show that there is a relationship between the following specific aspects of the different variables and the income groups of the households:
Not opening the oven too frequently,
Keeping the top of the stove clean,
Use of a fire to keep oneself warm,
Sleeping outside on the balcony, and
Using air conditioning systems to keep cool when it is hot.
The reasons for these relationships have varied from hygiene to routine behavior and are not necessarily connected to energy efficiency. Thus, the relationships cannot be attributed to the need by households to implement energy efficiency measures.
Descriptive statistics: The results from the descriptive statistics, however, show that although there are no general inferences to be made between the relationship of the different variables and the two income groups, there are patterns of behavior exhibited by the households that are worth noting.
The descriptive results show that there is little awareness about energy efficiency measures in low-income areas, whereas the high-income area has better awareness. These results confirm the information deficit model discussed above by Janda [
4]: many households lack information on energy efficiency, which is likely to have a negative impact on the uptake of energy efficiency measures. It also confirms the results from a preliminary survey done on the awareness of households about energy efficiency in the Kalingalinga, Garden, and Kayosha informal settlements in Lusaka (Zambia), which showed very little awareness of energy efficiency strategies [
41]. The results are also in line with conclusions from other studies (see, for instance, [
20]) that contend that higher income households tend to be more knowledgeable about energy efficiency than low-income households.
There is also a difference in the patterns of usage of energy-consuming devices, with the high-income category preferring to use electric devices whereas the low-income category prefers to use charcoal for cooking and ironing and candles for lighting. This is because there is a perception in the low-income category that electric devices have higher energy consumption so respondents have an aversion to using them. This is similar to the results from the study done by Malama
et al. [
23] (discussed above), which found that there has been a shift from using electricity to charcoal in the low-income houses after the introduction of electricity prepayment meters. The same study also reported that the high-income category, however, continued with the use of electric devices, which are important for the maintenance of their lifestyle. Interestingly, though, despite the fact that there is a strong perception in the low-income households that the use of charcoal for cooking (mbabula) consumes a lot of energy, they still prefer it to the use of electric stoves. This perception could be a result of charcoal continuing to provide heat after the completion of cooking activities. Additionally, a lot of decisions made by customers are based on what they hear from their friends and not on any evidence provided either by the authorities or the research community. This is in agreement with what Cialdini
et al. [
28] showed—consumers are more likely to take in information that comes from what they see as a credible source. In this case, information coming from ZESCO has not been taken on board by consumers, who prefer to get their information from friends, neighbors, and acquaintances, which is exactly what Cialdini
et al. [
28] argued. It is also in agreement with the results from Malama
et al. [
23], which showed that very few households considered ZESCO a credible source of information. As indicated above, ZESCO has credibility problems with consumers.
The respondents from the low-income households also show a low level of usage of energy-efficient equipment compared with the high-income respondents. This is also in keeping with other results (such as [
23]) that show that there is a perception in the low-income category that energy-efficient equipment tends to be expensive and therefore out of reach. A case in point would be the cost of CFLs, which is four times the cost of ordinary electric bulbs, as discussed earlier. This has to do with the fact that the information on the benefits in terms of savings from switching to the CFLs has not reached most consumers, and even many of those who have received this information have not acted on it. ZESCO has been using advertising to get this information to consumers. As discussed above, based on empirical evidence from work done elsewhere, many consumers do not act on information they get through advertising.
In the cold and hot seasons both sets of respondents indicated wearing more or less clothing in reaction to the weather, opening windows and doors, and using warm or cool water for bathing. However, electrical appliances such as fans, heaters, and air-conditioning units are more likely to be used to achieve thermal comfort in the high-income category than in the low-income households. This is because these devices are expensive to acquire and to run so most people in the low-income households cannot afford them.
Both categories see reduction in the use of energy as being important for the reduction of their energy bills, although the high-income respondents see adopting energy efficiency measures as acting responsibly as well as taking care of the needs of the future generations, which is not the case in the low-income households. This could be because the households in the high-income areas are more knowledgeable about issues of energy efficiency as compared with those in the low-income households. In terms of barriers to the uptake of energy efficiency measures, the respondents in the low-income category indicated lack of information as an important barrier as compared to the high-income group. The low-income households also indicated the high cost of the technologies as another barrier to the adoption of the energy efficiency measures. This point has been made above when the cost of the energy-efficient lamp was compared with that of the ordinary electric bulb. The government has tried to help in this regard by giving tax incentives to those importing energy-efficient technologies. There is, however, no clearly defined policy on energy efficiency in Zambia that would help deal with all issues to do with energy efficiency in a more systematic way.
6. Conclusions and Recommendations
This paper sought to provide empirical evidence on how different income categories behave regarding the adoption of energy efficiency measures in households. The results have been grouped into two segments. In the first segment are those from the inferential statistics that investigated the relationship between the income groups the households belong to and the different behavior-related variables identified for investigation. In the second segment are the results from descriptive statistics, which show patterns of behavior of the households from different income groups without necessarily indicating that there is a relationship between the identified variables and the income groups the households belong to.
As seen above, the results from the inferential statistics show that there is no generalized relationship between the different variables and the household income groups except for a few variables like not opening the oven too frequently, keeping the top of the stove clean, use of a fire to keep oneself warm, sleeping outside on the balcony, and using air conditioning to keep cool when it is hot. The works of Matsukwa [
18] and Brandon and Lewis [
19] are particularly relevant here as they showed that although income has been known to affect baseline energy use, it does not affect energy conservation behavior.
The results from the descriptive statistics, on the other hand, showed some patterns of behavior worth noting.
The key conclusion from this study is that there is no difference in energy efficiency response between the high-income and low-income groups. This is contrary to the results from Malama
et al. [
23], who found that there was a difference in the response to the introduction of electricity prepayment meters between the different income groups. Although there are discernible differences in the patterns of behavior between the two income groups (according to the descriptive statistics), this is not sufficient to indicate a definite relationship between the various variables and the two income groups. It can be argued, though, that the work of Malama
et al. [
23] was based on the response of different income groups to the introduction of electricity meters, which (unlike the adoption of energy efficiency measures) forced all consumers to take some form of response to what was seen as the equivalent of an increase in the energy bills.
The main general lesson from the foregoing discussion is that there is a low level of adherence to energy efficiency measures in both low- and high-income households and that there is a need for more concerted efforts by the authorities to reach all segments of society in a way that will lead to a change in consumers’ energy efficiency behavior. The current method of using advertising is not working. The work of Costanzo [
13] showed that consumers are unlikely to believe information that they get from advertising. Stern and Aronson [
29] have suggested the use of social diffusion and partnership of institutions to bridge the credibility gap. These are two strategies that will be very helpful to get consumers to adopt and act on the energy efficiency message that the authorities have been disseminating since 2007.
Specific recommendations from this study center around two issues
i.e., (1) lack of information on energy efficiency and low level of uptake of energy efficiency measures; and (2) low level of usage of energy efficiency equipment:
Information vs. Energy Efficiency Actions: Although ZESCO has been disseminating information on energy efficiency, many of the consumers this information is intended for have not acted on it. ZESCO needs to change the way information flows to consumers. They need to move from advertising to using other strategies such as social diffusion. This can be done by the use of selected members of the community who could act as energy efficiency ambassadors for their neighborhoods. ZESCO should also consider the use of drama, which is a very popular form of entertainment in Zambia, through making use of the services of some well-known comedians and groups who do cultural performances.
ZESCO also has to consider identifying households that can be used to demonstrate the benefits of adopting energy efficiency measures. These households would then be used as living examples of the benefits of adopting energy efficiency measures. Since both categories of households identified reduction in energy bills as an important driver in the adoption of energy efficiency measures, that can be one of the key objectives of these demonstration projects.
Low Usage of Energy-Efficient Equipment: The general uptake of the use of energy-efficient equipment has been low despite the fact that both the government and ZESCO have been making efforts to encourage this through reduction of taxes on imported equipment and distribution of free CFLs, respectively. Cost has been a major barrier in this case so there is need for further reduction in the cost of energy-efficient equipment through further reductions in import duty and tax. The government could also consider introducing a subsidy on the CFLs (which would lead to a reduction in the price of the lamps), for example, as the benefits in terms of savings through a reduction in the energy consumed and also in the reduced impact on the environment would make up for the cost of the subsidy.


