
Stakeholder Perceptions of Unit Based Waste Disposal Schemes in Ontario, Canada

Department of Geography, Wilfrid Laurier University, Waterloo, ON L6S2X5, Canada
Resources 2015, 4(3), 434-456; https://doi.org/10.3390/resources4030434
Submission received: 7 April 2015
/
Revised: 11 June 2015
/
Accepted: 16 June 2015
/
Published: 25 June 2015
Abstract
:This study examines stakeholder perceptions of pay as you throw schemes (PAYT) in Ontario, Canada. Using a combination of panel and semi-structured survey data from provincial municipalities, focus is placed on analyzing: (a) the effects of PAYT systems on municipal recycling rates and program costs (b) stakeholder perceptions on the perceived effectiveness of PAYT policy (c) how locality affects PAYT program costs and affect municipal recycling rates and (d) the impact of Ontario’s “one Blue Box per household” provision on PAYT schemes. The results of the analysis show that while the implementation of PAYT schemes do increase municipal recycling rates, there are opportunities for further improvement. In Ontario, the effectiveness of PAYT policy is impaired by inconsistent enforcement, administrative burden, and the inadequate capacity of household recycling bins (“blue bins”).
1. Introduction
In North America, pay as you throw and unit-based pricing of residential waste has become an increasingly popular mechanism for financing residential solid waste management and encouraging household waste reduction [1]. Under this scheme, households are charged based on the amount of waste they put out for collection as opposed to paying a fixed fee for service. The U.S Environmental protection agency estimates that 26% of all communities in the United States implement some form of unit based pricing [1]. The intuition behind PAYT systems is that households will recycle more, compost more and reduce the demand for landfill and incineration services. Further to this point, unit based pricing ensures that municipalities do not bear an inordinate share of the costs in managing residential waste generation.
Conventional economic reasoning would support these claims, as pay as you throw pricing promotes the efficient use of waste management services. Under a fixed fee system, once the initial fee has been paid, the household marginal cost of increased waste disposal is the effort expended in sorting, storing, and setting out more waste for collection. The marginal cost to the municipality as a whole is much greater, as provisions must be made for increases in waste generation (adequate landfill infrastructure, curbside collection of waste etc.) [2]. This disequilibrium in the marginal cost of waste disposal gives rise to inefficiency, as households will overuse waste management services relative to the true operating cost of the system.
This research concerns itself with the effect of PAYT systems on residential recycling rates in Ontario, Canada. Presently, 125 provincial programs implement pay as you throw systems for residential waste disposal. As demonstrated by Callan and Thomas [3], in the presence of a curbside recycling program, increases in the cost of waste disposal reduces the relative cost of recycling, thereby incentivizing source separation of recyclables. While there is significant research supporting the efficacy of PAYT systems in increasing household recycling, this paper investigates whether the effectiveness of user pay schemes changes in the presence of recycling legislation and/or limits on household recycling. Additionally, this research examines how recycling stakeholders perceive and respond to PAYT policy. Using a combination of panel and semi structured survey data from provincial municipalities, this research explores the following questions:
- (1)
- Do municipalities who implement PAYT systems recycle more than those that do not?
- (2)
- Are there additional costs associated with implementing PAYT schemes in provincial municipalities?
- (3)
- How does locality affect PAYT program costs and affect municipal recycling rates?
- (4)
- How do recycling stakeholders, namely households, packaging producers, and municipal waste managers, perceive the effectiveness of PAYT policy?
Of note, this study does not explore how PAYT schemes in Ontario affect household waste generation. The data used in this study pertains only to the quantities of printed paper and packaging waste recycled—at this time, information on household waste generation by municipality was not available. While a rich scholarship exists that specifically explores the affect of PAYT systems on quantities of household waste generated (see [4,5,6]), it is recommended that additional research in this area be conducted in an Ontario context.
2. Literature Review
The effects of municipal user pay systems on waste and recycling activity is a topic that has generated significant attention from a multitude of researchers. Early literature on the topic sought to develop a household demand function for waste services, exploring the effects of PAYT on household waste generation. Such studies include seminal pieces by McFarland et al. [7], Wertz [8], Jenkins [9] and Repetto et al. [10]. Subsequent studies by Baur et al. posited that households may reduce quantities of waste disposed under a variable fee system, opting to reuse items and/or change purchasing behaviour (i.e., buying durable instead of one time use items etc.) [6]. While changes in consumer purchasing behaviour and waste generation are largely dependent on the magnitude of the PAYT price signal (the penalty for excess garbage must be sufficient to induce behavioural change), there is empirical evidence linking PAYT policy to reduced household generation rates and changes in household consumption. A Belgium study on the effects of PAYT schemes found that household waste generation decreased by 9.1% over a ten year period [11]. Similar results were observed in a review of PAYT schemes in 27 European Union states—Austria, Germany, Finland and Ireland all reported decreases in household generation and an increase in the proportion of material recycled post implementation of PAYT policy [12].
Tangent to this line of inquiry, an increasing number of researchers have expanded the household waste demand function to include recycling, attempting to determine the effects of PAYT on overall waste diversion ([2,12,13,14]).
The general argument in favour of unit based pricing is that such schemes promote the efficient use of waste management resources [3]. Households are incentivized to generate less waste if they are forced to pay for the management of additional material.
As demonstrated by Podolski and Siegel [15] and Jenkins [9], these studies find statistical support for the negative relationship between the price paid per bag and the quantity demanded of disposal services. In a study using community level data for 149 New Jersey municipalities, pay as you throw schemes were found to significantly reduce the amount of solid waste disposed by households, while increasing the amount of material recycled [15]. Kinnaman and Fullerton [2] derive a similar conclusion by analyzing cross-section data of more than 900 U.S. communities. Consumers will also be less likely to dispose of items such as white goods (fridges, microwaves), waste electronics, and yard waste in the residential waste stream when PAYT systems are implemented [3].
Brown and Johnstone [16] also found that there is public support for garbage bag limits/unit based pricing among residents living in PAYT communities. In an analysis of environmental taxes (expressed as PAYT fees) in communities across four countries, it was found that household support for PAYT schemes was a direct function of exposure to such systems. Opposition and/or resistance to PAYT policy was observed to decrease over time, a finding that was supported by other studies examining similar forms of environmental taxation (see [17,18,19]). Of note, Brown and Johnstone [16] found an inverse relationship between support for PAYT schemes and levels of household waste generation (households with higher rates of waste generation expressed lower levels of support for PAYT policy). This result is consistent with our understanding surrounding how PAYT policies affect behavior—those most affected by garbage bag limits/unit based pricing are most likely to be opposed to its implementation. What is unknown is whether “high generation” households modified consumption and disposal behaviour in response to PAYT policy over time.
Despite the extensive empirical evidence supporting the use of PAYT systems in increasing waste diversion, there remains considerable debate as to whether they benefit the community as a whole. As noted by [19,20,21], PAYT systems may give rise to illegal dumping and in fact, may be more costly for municipalities to implement relative to a fixed fee scheme. The administrative challenges of measuring and billing individual households may be sufficient to offset any benefits from diverting material from the residential waste stream. To date, there is little consensus regarding the long term efficacy of PAYT schemes despite an increasing trend to adopt such systems in North American cities [1].
This paper does not attempt to provide any definitive guidance regarding the appropriateness of PAYT systems as a waste diversion strategy. However, it does build upon the existing discourse by exploring conditions that may impact the effectiveness of PAYT in promoting household recycling. To date, this is the only study of its kind to explore the relationship between recycling legislation, recycling bin capacity and PAYT effectiveness in a Canadian context. A further unique aspect of this research is the use of both community and household level data. This is advantageous for two reasons: (1) Using community level data allows for an easier comparison of communities with user pay and flat fee systems and (2) The use of household level data allows for the capture of local characteristics that may impact waste disposal and diversion. A combination of both data types enables meaningful and credible analysis related to effects of PAYT and user pay systems on waste diversion.
3. Materials and Methods
3.1. Description of the Data
For the purposes of this study, community level data for Ontario’s residential recycling system was obtained from the Waste Diversion Ontario (WDO) municipal Data call. Each year, the WDO requests that every municipality within the province report detailed recycling and cost information (where costs refer to the cost of recyclable collection, processing/sorting, investments in recycling promotion and education and administrative charges) regarding the management of their waste diversion programs [22]. Data collected includes information on the amount of material recovered, the types of material recovered and whether a program imposes bag limits/user pay systems. To maintain data integrity and ensure that municipalities are correctly interpreting and answering data call questions, the WDO, in association with the Municipal Industry Program Committee (MIPC) and Stewardship Ontario, provide data call support and 3rd party verification of the information reported into the data call. Municipalities work directly with a MIPC representative to ensure that the data call survey, is filled out and submitted correctly. Stewardship Ontario finances third party audits of municipal recycling programs to ensure that cost and recovery information is accurate. This study operates under the assumption that the data extracted from the WDO data call is valid and consistent with actual municipal costs and recycling performance. All data used in this study pertains to printed paper and packaging recyclables found in the residential “Blue Box” recycling stream. This includes the following materials: newsprint, cardboard, glass, aluminum, steel, composite packaging, and plastics (PET, HDPE etc.). Community level data exists for 223 provincial programs spanning a nine year period (between 2003 and 2012).
Data pertaining to population size, population density, median age, and education levels were obtained from the Stats Canada 2006 and 2011 census [23].
3.2. Municipal Groups
Municipal groups are classified using two primary and two secondary criteria. Primary criteria includes a municipalities’ population and population density. Secondary criteria include a municipalities’ location (northern Ontario or southern Ontario) and type of service (curbside or depot). For programs with populations less than 50,000 and a population density less than 4/km2, the municipal groups have been further subdivided based on geographic location into (“north” and “south”)as defined by O. Reg. 101/94; and type of service (which may also include depot). Using the aforementioned criteria, provincial municipalities are classified as follows in the WDO Data call.

| Municipal Group | Description |
|---|---|
| Large Urban (Group 1) |
|
| Urban Regional (Group 2) |
|
| Medium Urban (Group 3) |
|
| Rural Regional (Group 4) |
|
| Small Urban (Group 5) |
|
| Rural Collection South (Group 6) |
|
| Rural Depot South (Group 7) |
|
| Rural Collection North (Group 8) |
|
| Rural Depot North (Group 9) |
|
A Note on What is Meant by Recycling/Recovery
For the purposes of this study, the terms recovery and recycling are used interchangeably. While this is not generally a common practice in the existing literature, it is consistent with how WDO and Stewardship Ontario use the terms. Recovery/Recycling refers to packaging material that has been collected, processed, and baled by a municipality. Quantities of recycled/recovered tonnes are measured at the point of sale (material that is marketed for sale to re-processors by the municipality). This value already takes into account residue losses that occur at a MRF (due to contamination, sorting inefficiencies etc.). Generally speaking, there is between a 6 and 10 percent loss in the number of tonnes that enter a MRF vs. the number of tonnes marketed by a municipality (Stewardship Ontario, 2013). It should be noted that both Environment Canada and the Ministry of the Environment and Climate Change make a distinction between the terms recycling and recovery, with the latter referring to recycling as well as energy from waste.
Net cost of material management is calculated by taking the gross cost of material management and subtracting revenue from the sale of marketed material, where marketed material refers to the bales of Blue Box materials sold by municipalities to commodity brokers/end markets. Municipal recycling rates are calculated by dividing the total quantities of material recovered by the total quantities of material generated.
3.3. What’s Being Tested and Expected Results
To determine whether PAYT systems are achieving their intended objective, weighted average recycling rates and net program costs for municipalities with PAYT were compared against those without user pay systems. These results were then graphed and shown in Figure 1 and Figure 2 respectively. Data from each of Ontario’s 223 municipalities (over the 10 years included in the data set) were aggregated and subsequently analyzed in Microsoft Excel. Our expectation was that municipalities who implement volume/weight based pricing for waste disposal will achieve higher recycling rates than those that do not (as noted in the literature by [9,13,15]). Conversely, we also expect that program costs for municipalities who implement PAYT programs will be higher due to the additional resources required in administering and enforcing bag limit policy.
To provide further context to these results, survey data with recycling stakeholders was analyzed to see how they perceive the implementation and effectiveness of PAYT systems. Survey results were broken down into separate sections to represent differences in stakeholder responses (households, municipal waste managers, and packaging producers). We first begin by exploring the effects of recycling bin capacity, mandatory recycling legislation, and bag limit enforcement on self-reported recycling behavior among householders. This is then followed by a review of how municipal waste managers and recycling stakeholders perceive PAYT policies and their effectiveness to date.
Figure 1.
Comparison of Recycling Rates between Programs with and Without PAYT (System Wide).
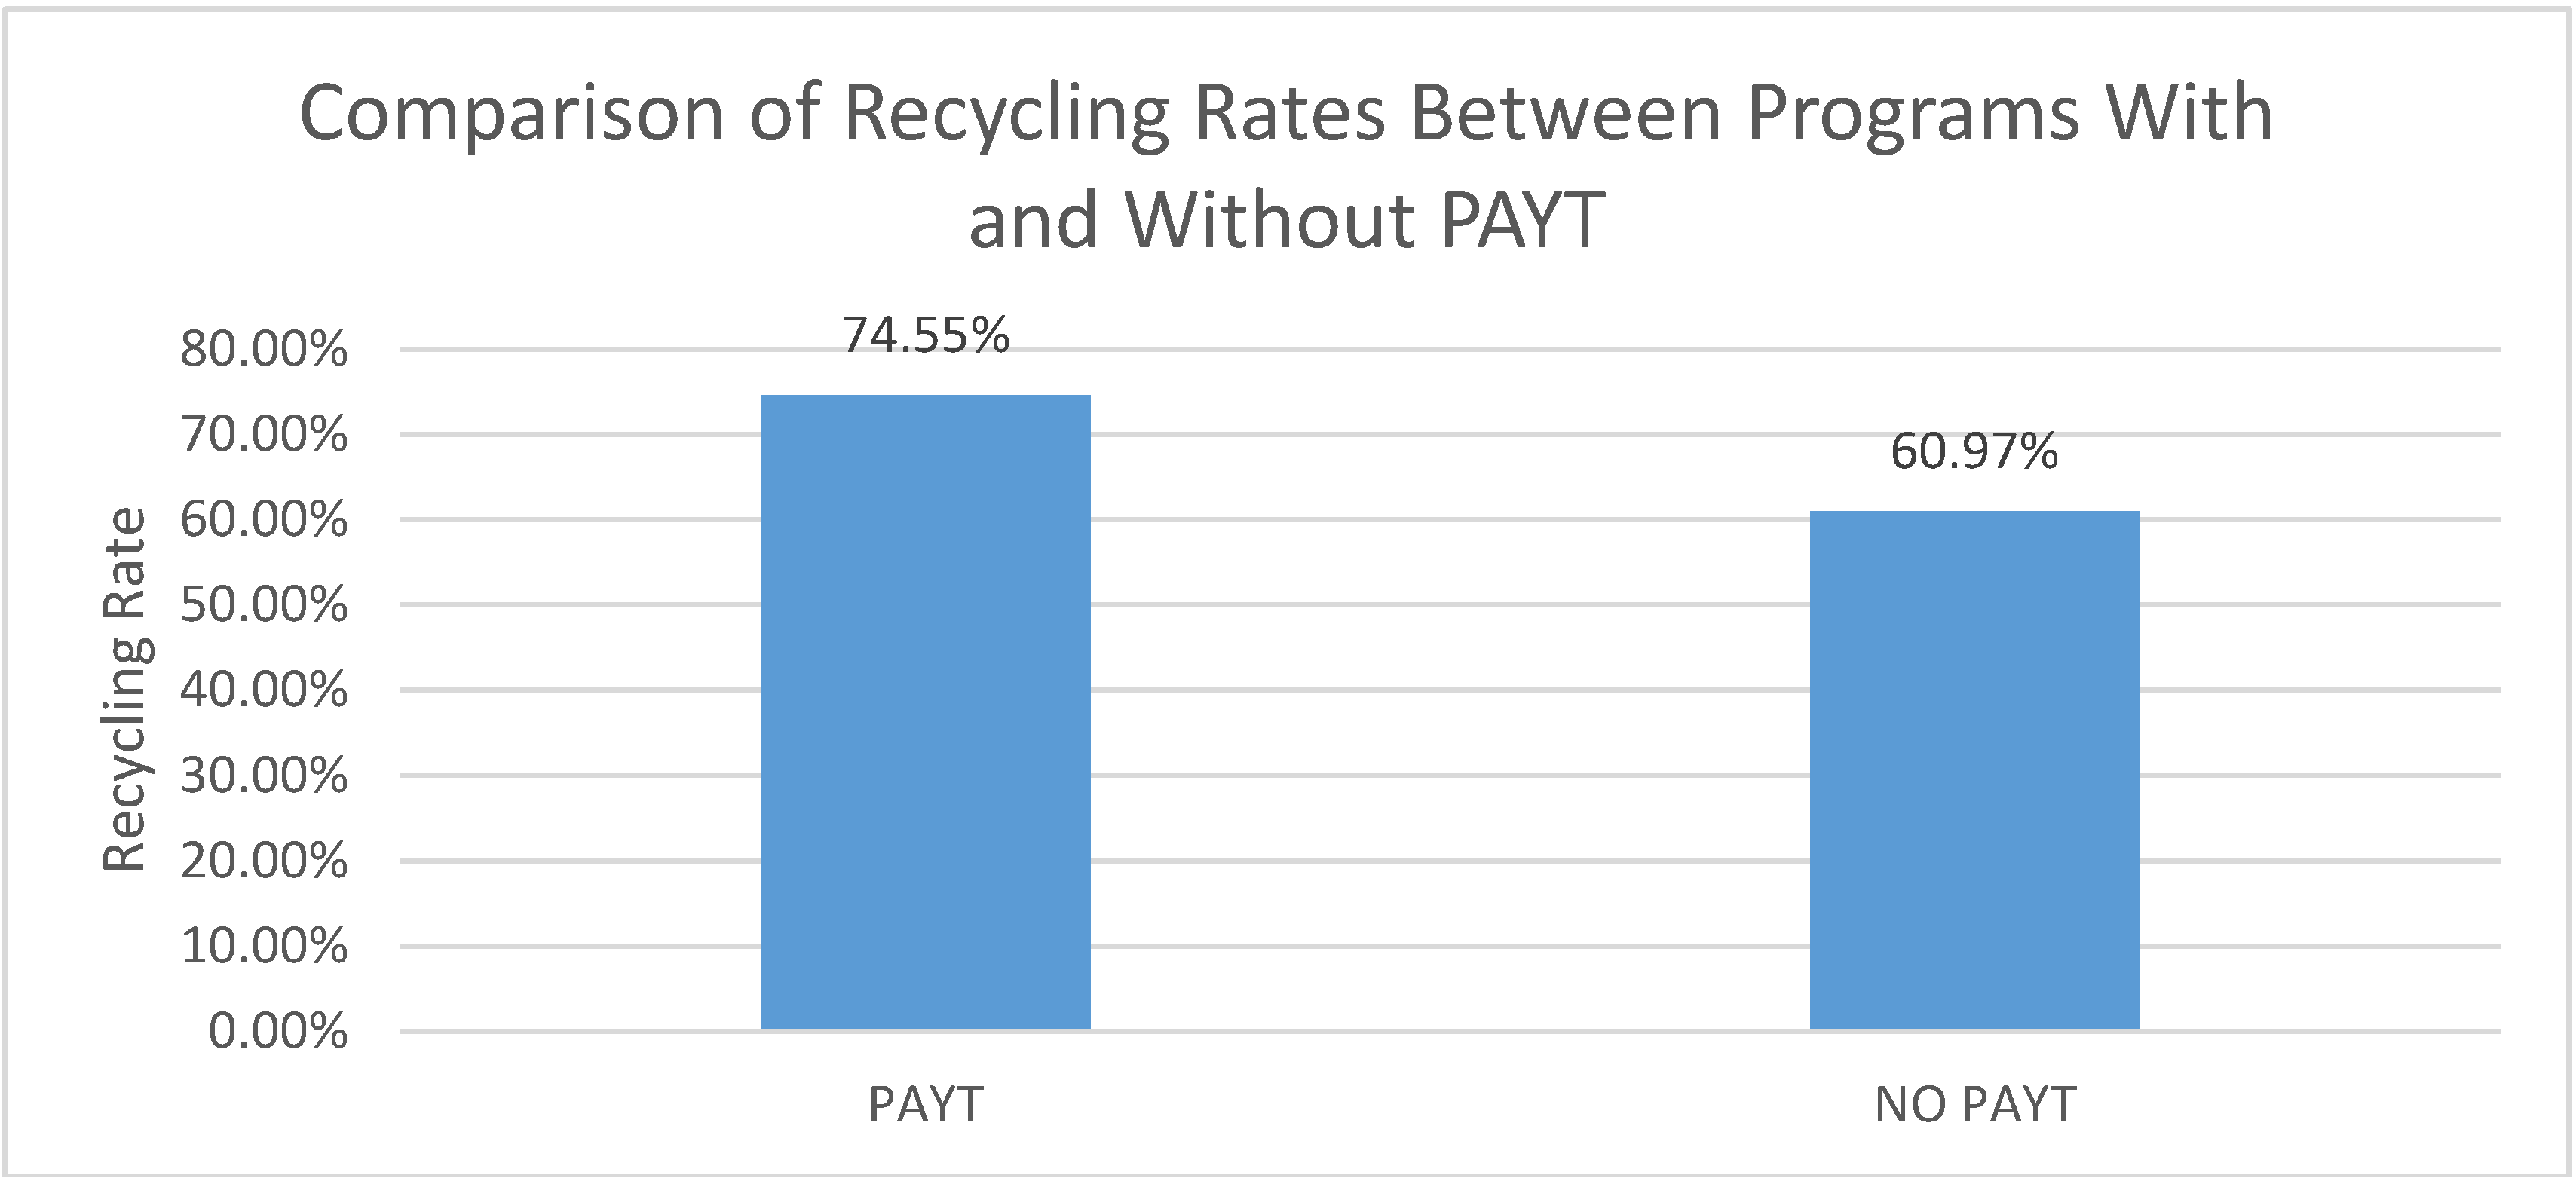
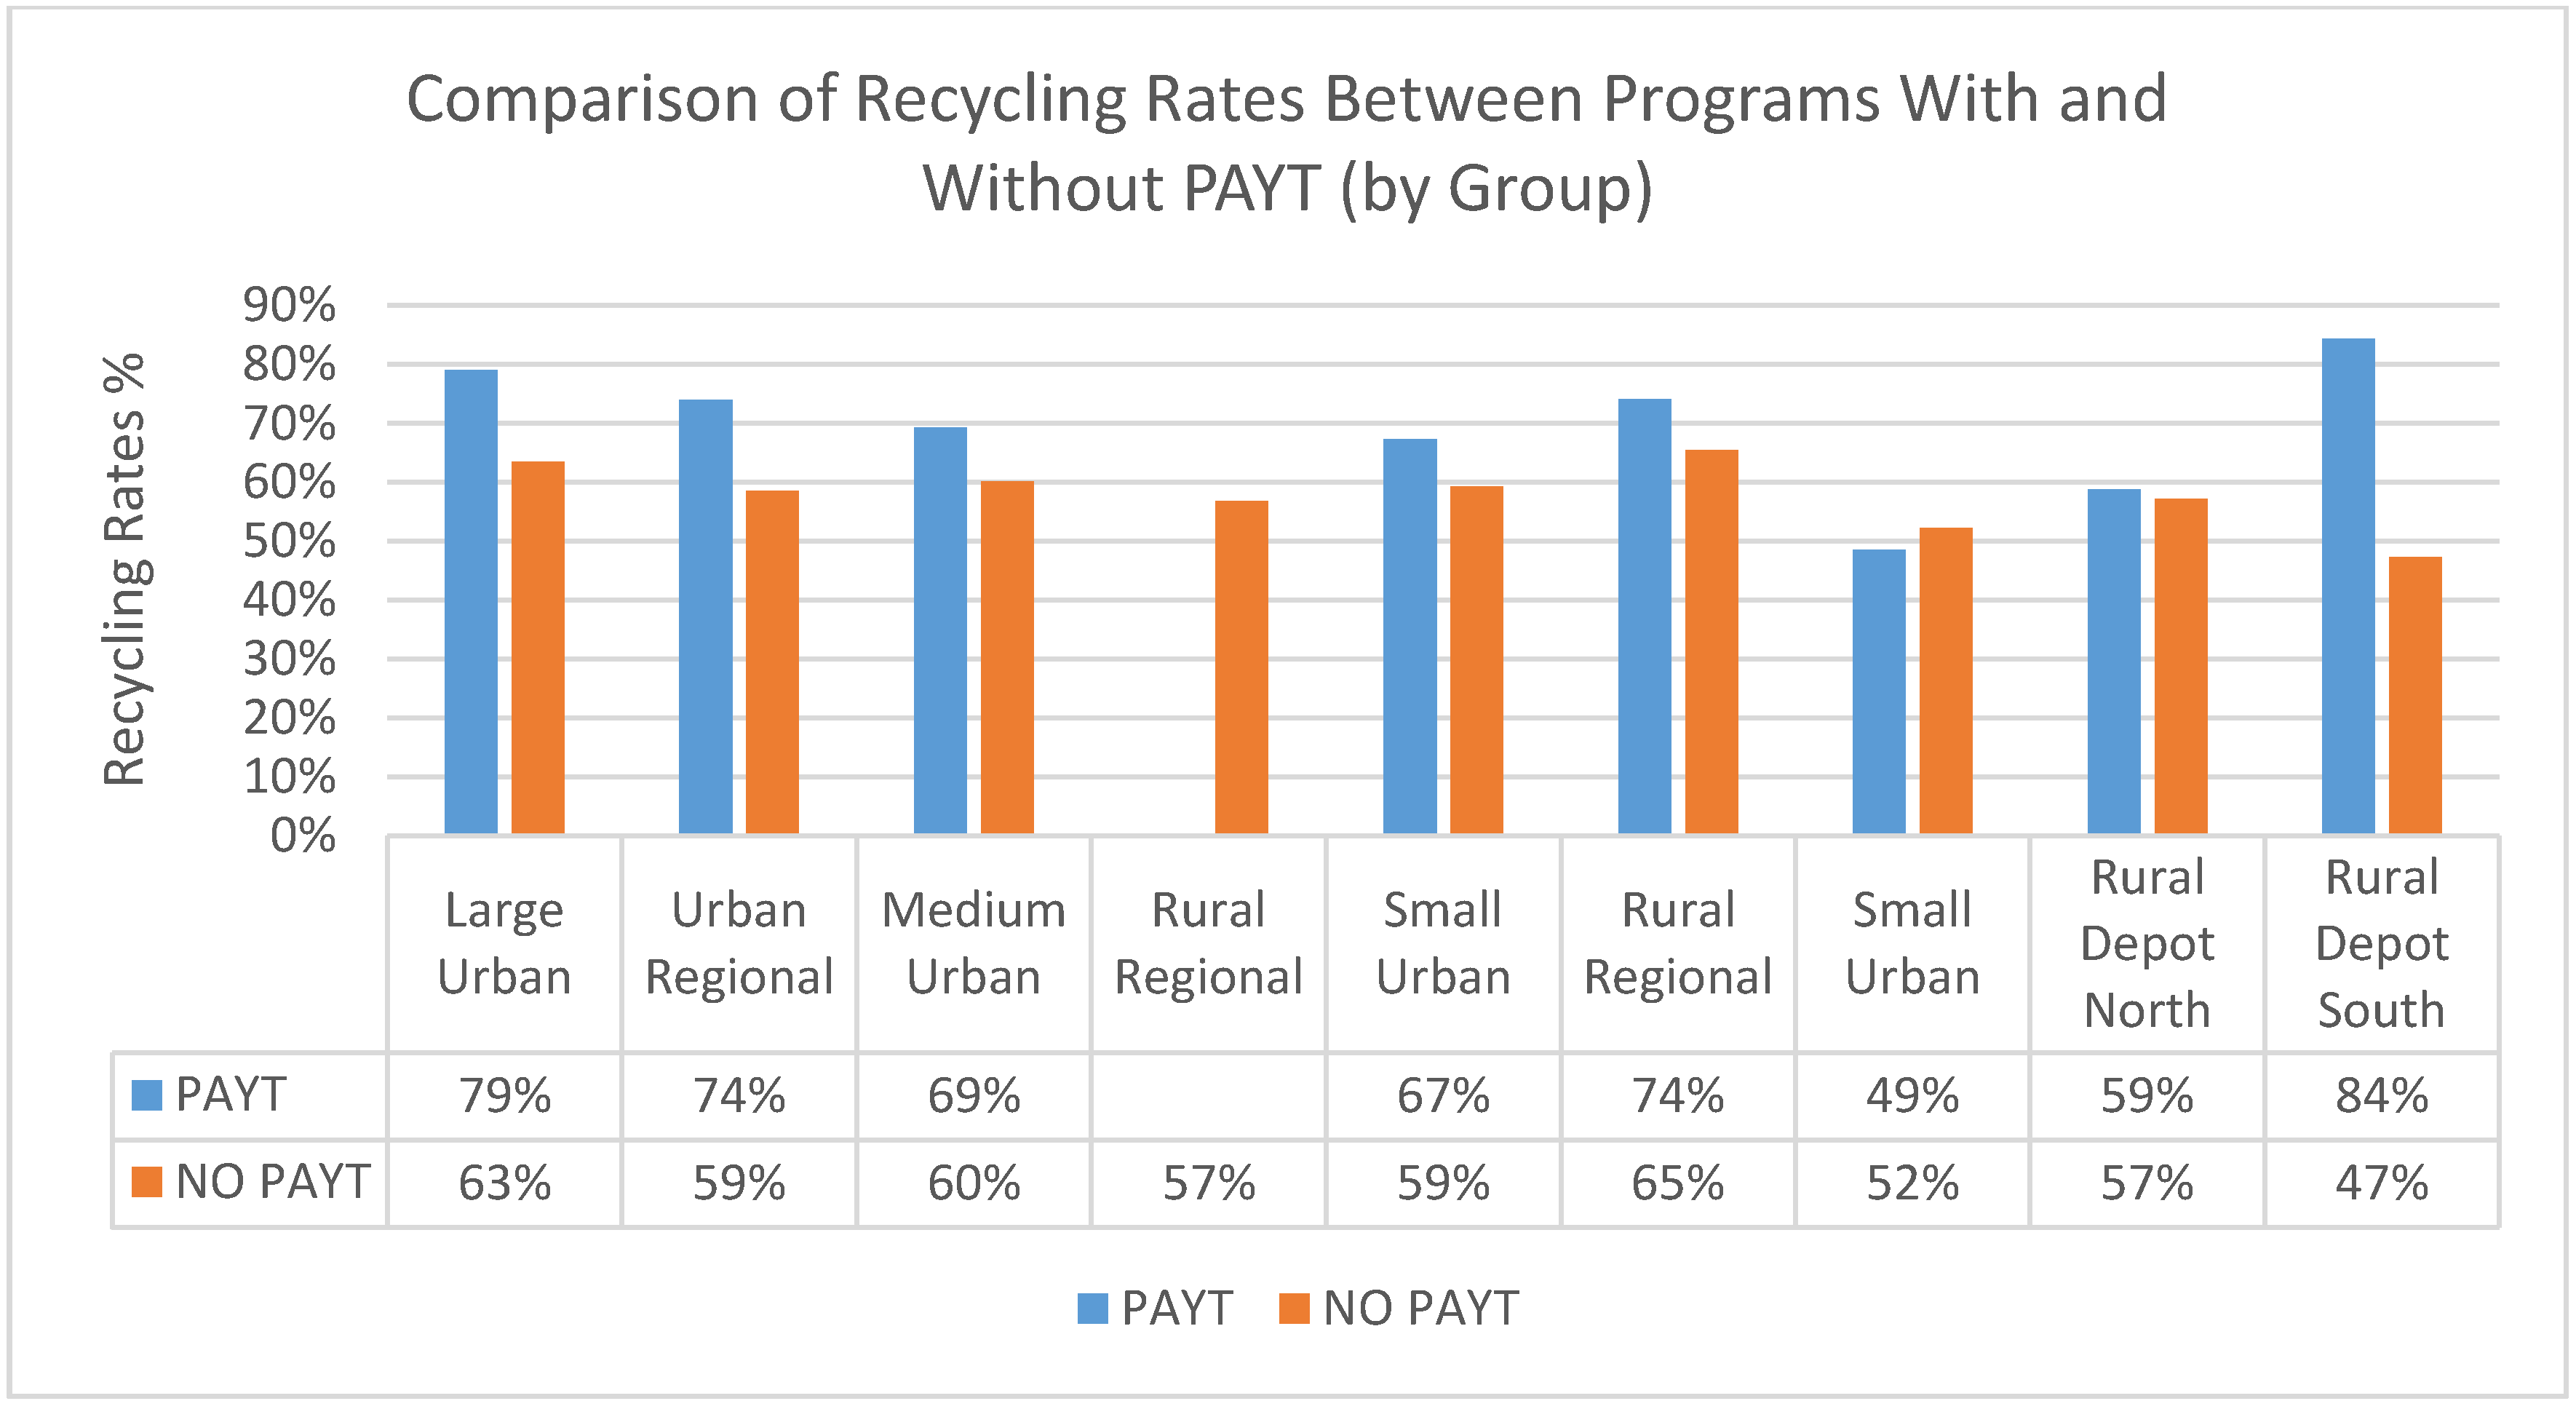
Figure 2.
Comparison of Recycling Rates between Programs With and Without PAYT (By municipal group).
Figure 2.
Comparison of Recycling Rates between Programs With and Without PAYT (By municipal group).
While there is no precedence in the literature to indicate how factors such as bin capacity and recycling legislation impact the efficacy of PAYT systems, we can intuit the following:
- (1)
- In the absence of sufficient recycling bin capacity, residents will place more recyclable material in the waste stream. In the presence of a garbage bag limit, residents may be more inclined to dump excess material illegally.
- (2)
- In the presence of mandatory recycling programs (where all households are legally obligated to source separate recyclables from the waste stream), the efficacy of PAYT systems is indeterminate. Arguably, PAYT schemes can be seen as a complimentary policy to existing waste management legislation. Conversely, given that the intended objective of PAYT and mandatory household recycling is the same, PAYT systems may prove ineffective due to the redundancy of the policy effect.
- (3)
- The efficacy of PAYT systems is highly dependent on whether it is actually enforced by municipal officials. If households are able to exceed the designated bag limit without facing a penalty for doing so, the effectiveness of PAYT systems greatly diminishes.
Further to this analysis, survey data was used to determine the prevalence of illegal dumping and garbage “switching” in communities with garbage bag limits.
A potential limitation of this study is that it does not take into account the types of PAYT schemes implemented by municipalities in Ontario. Due to the nature in which data is submitted to the WDO Data call, municipalities only respond “Yes” or “No” when indicating whether they implement some form of unit based pricing on garbage disposal. The amount that households are charged for excess waste, and the number of allowable bags, is set at the discretion of the municipality, and may change from year to year. A worthwhile future study would be an examination of how different fee schedules and bag limits affect household recycling behavior.
An elaboration of the empirical methodology is done in the results and discussion section in order to explain how the aforementioned relationships are examined and analyzed.
4. Results and Discussion
4.1. Relationship between PAYT Systems and Municipal Recycling Rates
As noted earlier, the purpose of this study was to determine the effect of PAYT systems on municipal recycling rates. To do so, weighted average recycling rates for programs with and without PAYT systems were calculated and compared. This was done on both a system wide (all 223 municipalities in Ontario) and region specific (using the 9 municipal groupings specified by the WDO) basis. These results have been graphed and are illustrated in Figure 1 and Figure 2 respectively.
As shown in Figure 1, weighted average recycling rates for programs with PAYT systems are, on average, ~13.5% higher than municipalities without unit based garbage pricing schemes. This is consistent with previous findings from the literature (see [2,13]), although the magnitude of the differences in recycling rates was larger in this study. When looking at differences in recycling rates by regional group (shown in Figure 2), we observe an interesting phenomenon—the effectiveness of PAYT schemes diminishes the further you go outside major urban areas. In Group 1 (Large Urban) differences in recycling rates between PAYT and non PAYT municipalities was 15.5%. However, as you move from Large Urban to Medium Urban and then Rural Regional groups, the gap in recycling rates narrows. For municipal groups 7 (Small Urban) through 8 (Rural Depot South), there is no appreciable difference in recycling rates between municipalities who choose to implement PAYT systems and those that don’t. While it is difficult to isolate the reason for why this occurs, results from surveys with householders shed light on this issue. Enforcement of garbage bag limits by the municipality tends to be much higher in urban areas. There are also fewer opportunities for households to illegally dump garbage in densely populated communities. As you move outside of Ontario’s major urban centers, the effect of PAYT on household recycling decreases, as it is not perceived as being enforced consistently.
Table 2 below summarizes the results of a two tail t test to determine whether differences in municipal recycling rate values are explained by chance, or measurable differences between PAYT and non PAYT municipalities. For all groups (with the exception of Rural Regional, which does not have a PAYT program), differences in recycling rates are statistically significant.
| Municipal Group | t | p | DF |
|---|---|---|---|
| Large Urban | 4.015 | 0.001* | 60 |
| Urban Regional | 4.073 | 0.001* | 60 |
| Medium Urban | 3.819 | 0.001* | 70 |
| Rural Regional | - | - | 140 |
| Small Urban | 3.707 | 0.001* | 230 |
| Rural Regional | 3.659 | 0.001* | 320 |
| Small Urban | 3.646 | 0.001* | 630 |
| Rural Depot North | 3.195 | 0.001* | 460 |
| Rural Depot South | 3.232 | 0.001* | 330 |
Note: * 99.99% Confidence Interval.
4.2. Relationship between PAYT Systems and Municipal Program Costs
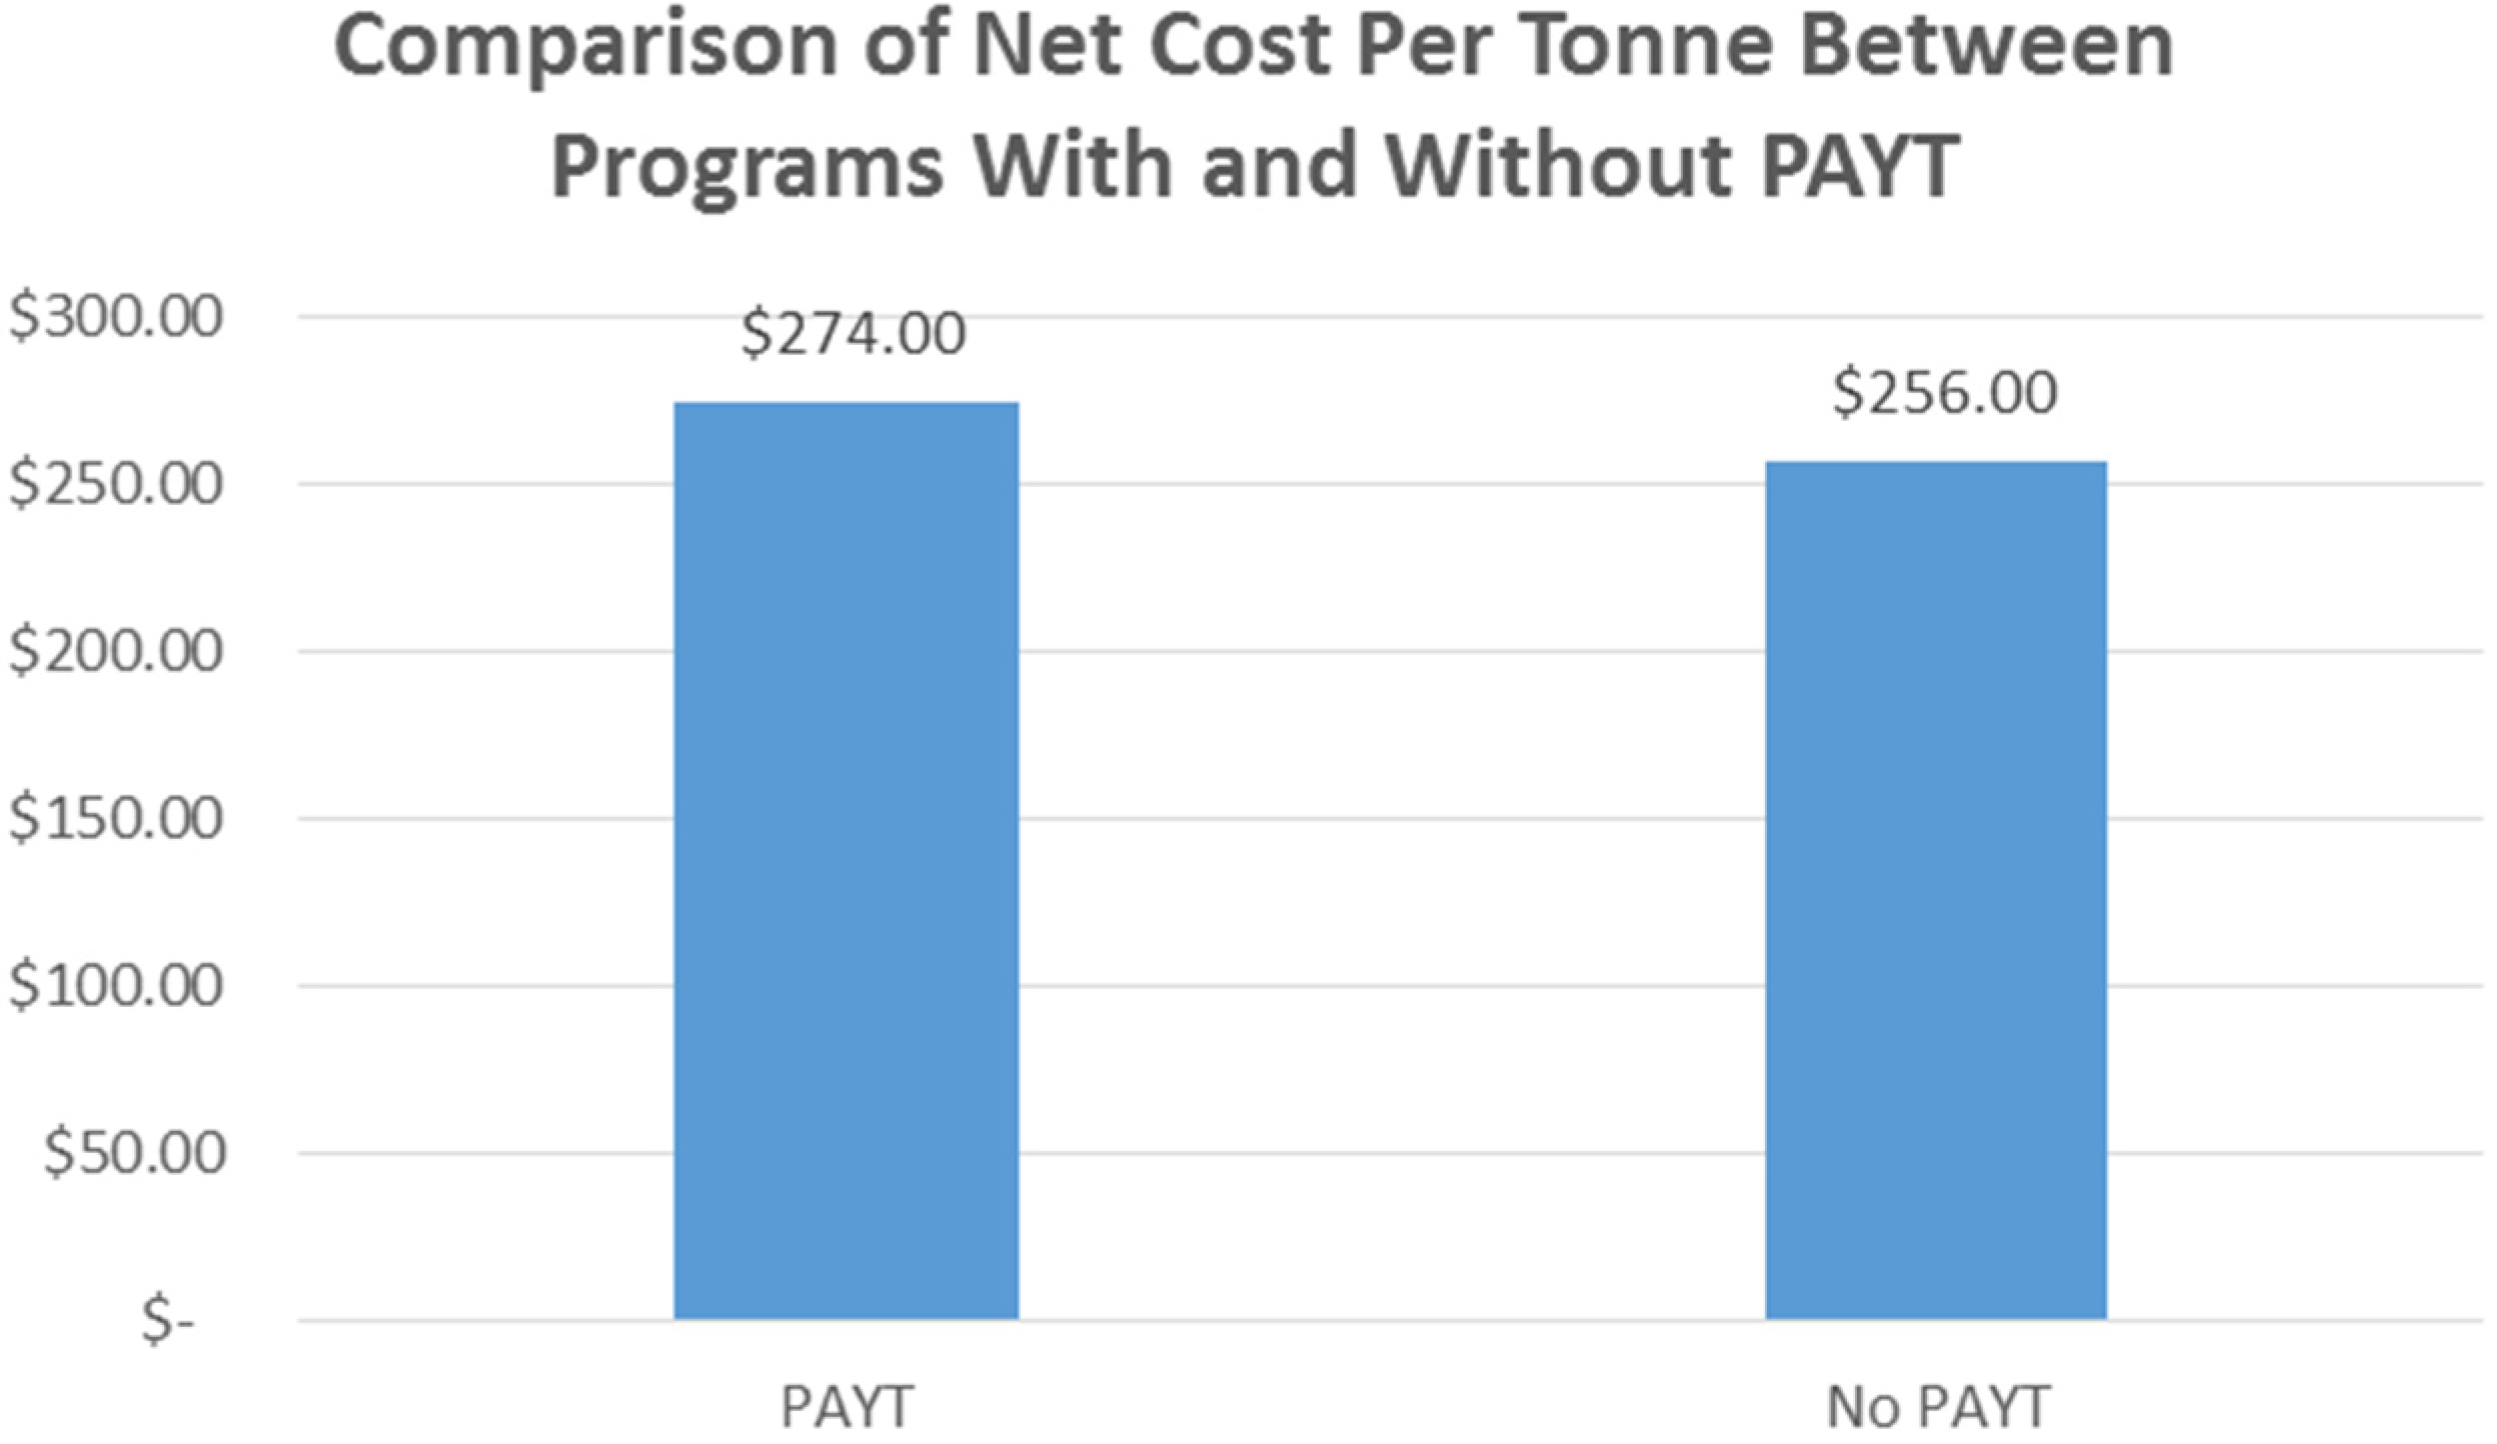
A secondary objective of this study is to determine the effect of PAYT systems on municipal program costs. Weighted average net costs (expressed on a per tonne basis) for programs with and without PAYT systems were calculated and compared (Note: Net cost is calculated by taking the gross cost of material management reported by the municipality and subtracting revenues received from the sale of recyclable material). This was done on both a system wide (all 223 municipalities in Ontario) and region specific (using the 9 municipal groupings specified by the WDO) basis. These results have been graphed and are illustrated in Figure 3 and Figure 4 respectively.
Figure 3.
Comparison of Weighted Average Net Cost per Tonne for Programs with and Without PAYT (System Wide).
Figure 3.
Comparison of Weighted Average Net Cost per Tonne for Programs with and Without PAYT (System Wide).

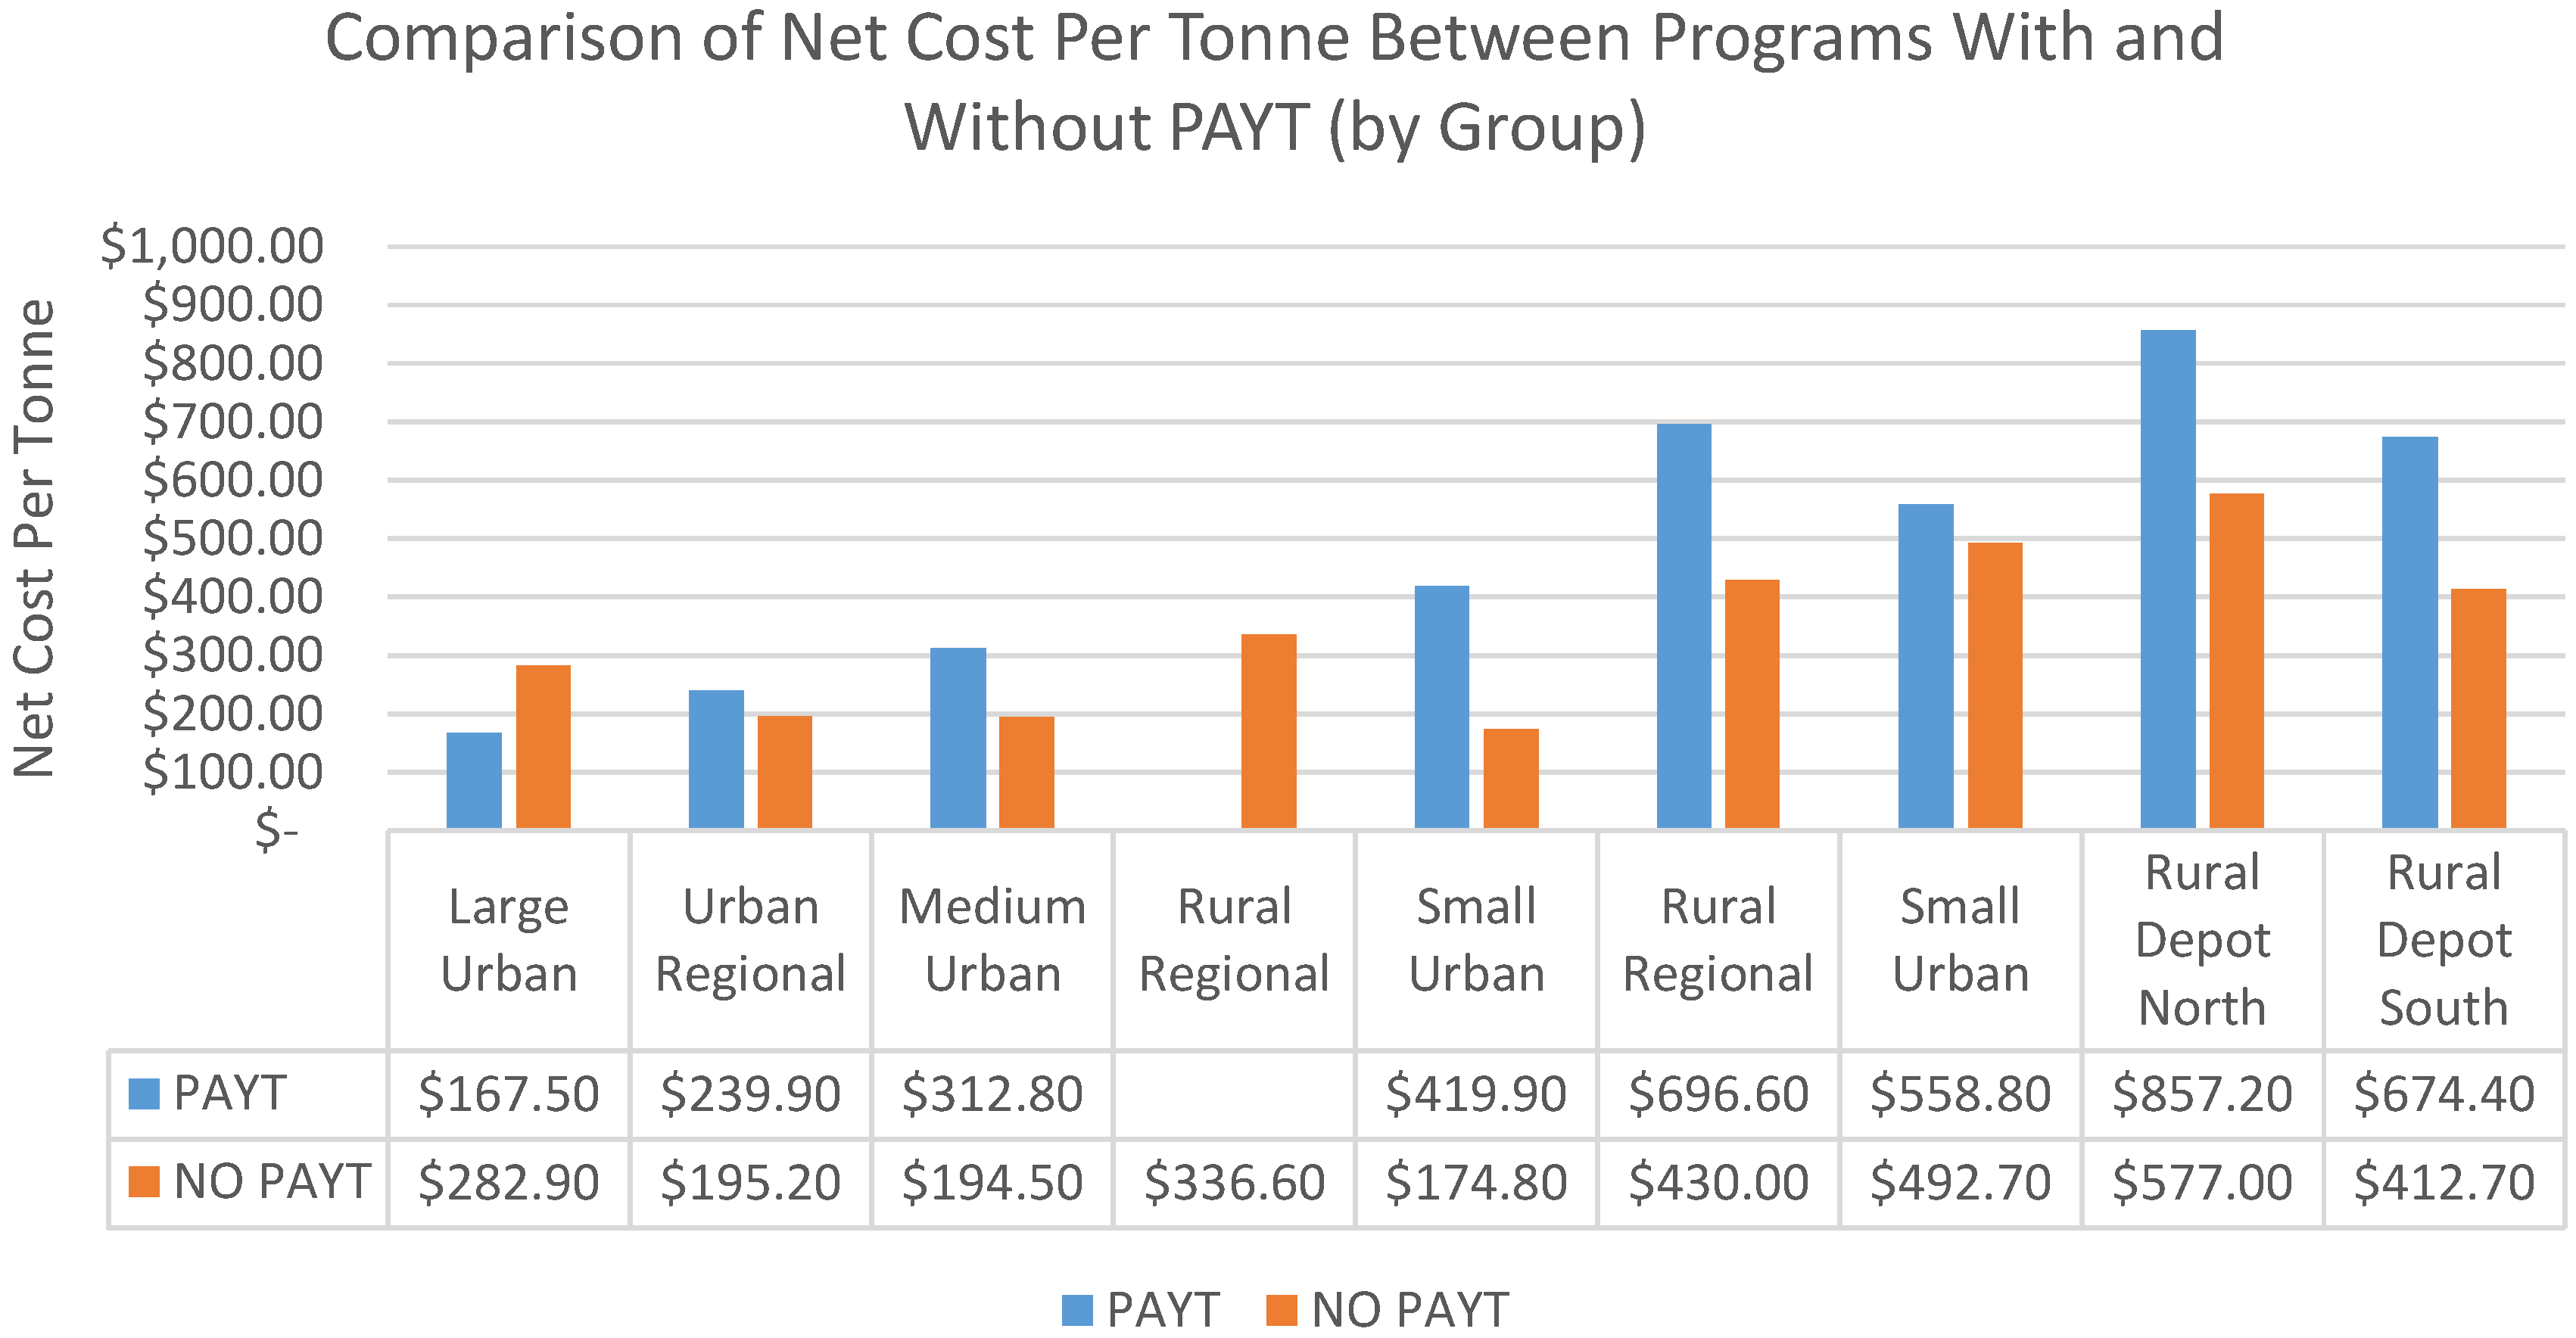
Figure 4.
Comparison of Weighted Average Net Cost per Tonne for Programs With and Without PAYT (By municipal group).
Figure 4.
Comparison of Weighted Average Net Cost per Tonne for Programs With and Without PAYT (By municipal group).
As shown above, the net cost of material management (on a per tonne basis) is approximately 8 percent higher in municipalities who implement some form of unit based pricing for weight disposal. This is once again consistent with our understanding of the costs incurred for administering, maintaining and enforcing PAYT systems in a community. Additional resources are required for waste collectors to “ticket/fine” households for setting out more than the designated limit of garbage bags. However, when looking at material management costs by municipal group, we notice that PAYT municipalities classified as “Large Urban” actually have lower material management costs than those that don’t. At this time, it is unclear as to why this is result occurred—there may be certain infrastructural and operational characteristics for PAYT municipalities in group 1 that result in lower material management costs on the whole. Densely populated urban areas tend to enjoy cost advantages relative to other areas on the whole—independent of PAYT policy. Collection costs, on average, tend to be lower in urban areas as a greater quantity of households can be serviced per trip (due to population density). Urban areas also tend to generate a “critical mass” of recyclables that are required to make curbside collection an economically viable waste management option. An analysis of groups 2 through 9 produced results more in line with our previous expectation. PAYT municipalities, on average, face higher material management costs than municipalities who do not impose bag/volume limits on household waste. However, the implementation of PAYT systems in groups 6 through 9 fails to result in appreciably higher recycling rates. Given that these programs are facing higher material management costs (in part due to the administrative burden of implementing PAYT schemes), it calls into question whether garbage bag limits are an appropriate policy for encouraging household waste diversion.
Table 3 below summarizes the results of a two tail t test to determine whether differences in municipal net cost per tonne values are explained by chance, or measurable differences between PAYT and non PAYT municipalities. For all groups (with the exception of Rural Regional, which does not have a PAYT program), differences in net cost per tonne are statistically significant.
| Municipal Group | t | p | DF |
|---|---|---|---|
| Large Urban | 3.837 | 0.001* | 60 |
| Urban Regional | 4.197 | 0.001* | 60 |
| Medium Urban | 3.828 | 0.001* | 70 |
| Rural Regional | - | - | 140 |
| Small Urban | 3.396 | 0.001* | 230 |
| Rural Regional | 3.421 | 0.001* | 320 |
| Small Urban | 3.551 | 0.001* | 630 |
| Rural Depot North | 3.837 | 0.001* | 460 |
| Rural Depot South | 3.745 | 0.001* | 330 |
Note: * 99.9% Confidence Interval.
4.3. Analysis of Household Survey Responses
Seven geographical regions (as specified by Waste Diversion Ontario) were targeted to complete questionnaires pertaining to daily household recycling activity. Geographic regions are defined by population density, geographic location and collection type (curbside collection vs. depot systems).
These groups include:
- (1)
- Large Urban (Toronto, Peel Region)
- (2)
- Urban Regional (Barrie)
- (3)
- Medium Urban (Windsor)
- (4)
- Rural Regional (Peterborough)
- (5)
- Small Urban (Orangeville)
- (6)
- Rural Collection—North (Timmins)
- (7)
- Rural Collection—South (North Glengary)
These groups were selected on the basis that they adequately represent the geographic differences in the province. Survey data surrounding household perceptions of and response to PAYT schemes is summarized based on the answers provided by respondents.
Table 4 describes the statements that were used in the survey to elicit household’s experience, knowledge and attitudes towards pay as you throw policy along with the respective distribution of Likert scale responses. A five point Likert scale was used to measure respondent’s answers (Strongly Disagree, Somewhat Disagree, Neither Agree or Disagree, Somewhat Agree, Strongly Agree). A total of 223 household survey responses were collected.
| Survey Code | Survey Statement |
|---|---|
| LIMIT | “I am aware that the city imposes limits on how much garbage I can place on my curb” |
| FEE | “I pay a fee for putting out more garbage bags than the city allows” |
| ENFORCE | “The city enforces their garbage bag limit policy” |
| ULIMIT | “I put out more garbage on days where the city has unlimited garbage pickup” |
| BINCAP | “My recycling bin has enough space for the amount of recyclables my house generates” |
| GARBSWITCH | “I put my recyclables in the garbage bin because I don't have enough space in my recycling bin” |
| BINBUY | “I know that I can purchase additional recycling bins and bags from the city” |
| WILLBINBUY | “I am willing to purchase additional recycling bins to store my recyclables” |
| IDUMP | “I illegally dump garbage to avoid paying the bag limit fee” |
| NDUMP | “I notice my neighbors illegally dumping garbage to avoid paying the bag limit fee” |
| AWARER | “I know that recycling is mandatory in Ontario” |
Figure 5.
Household Survey Responses.
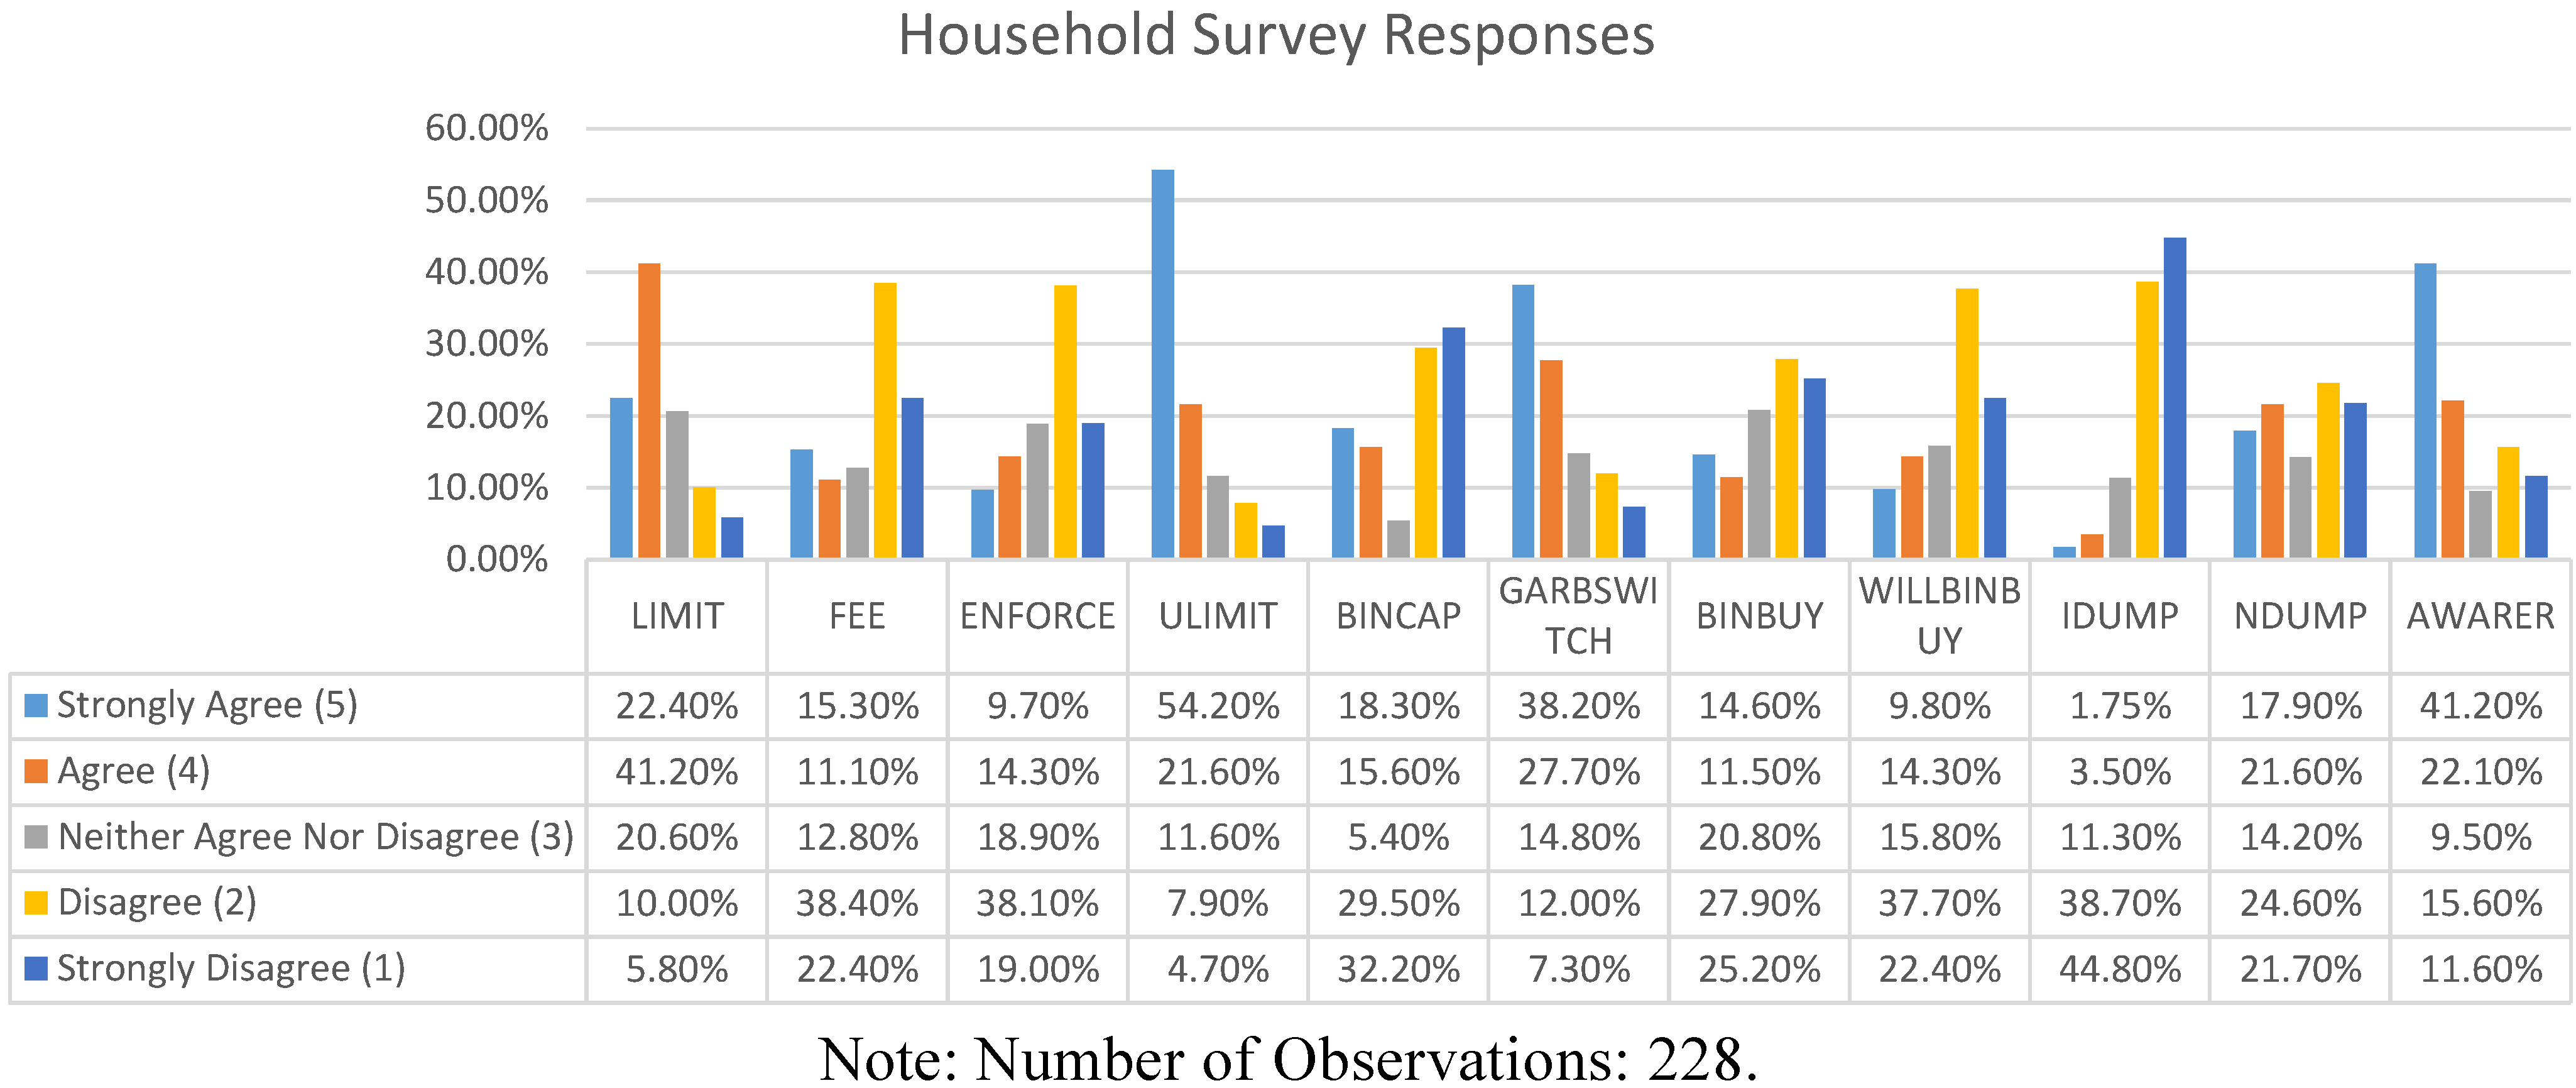
Note: Number of Observations: 228.
| Survey Statement | LIMIT | FEE | ENFORCE | ULIMIT | BINCAP | GARBSWITCH | BINBUY | WILLBINBUY | IDUMP | NDUMP | AWARER |
|---|---|---|---|---|---|---|---|---|---|---|---|
| Mean | 3.64 | 2.12 | 2.58 | 4.13 | 2.61 | 3.78 | 2.62 | 2.51 | 1.79 | 2.89 | 3.84 |
| Standard Deviation | 1.12 | 1.24 | 1.18 | 1.35 | 1.51 | 1.27 | 1.36 | 1.25 | 0.89 | 1.43 | 1.44 |
4.3.1. Awareness and Enforcement of PAYT Systems
Awareness
Survey Statement:
- (1)
- “I am aware that the city imposes limits on how much garbage I can place on my curb”
63.6% of respondents indicated they either agreed, or strongly agreed with the above statement. Differences in awareness were observed among the seven communities targeted in the study. Communities situated in densely populated urban areas demonstrated higher levels of awareness than those located in rural or northern areas.
Of the 36 respondents who indicated that they either disagreed or strongly disagreed with the statement, all were from regions classified as rural.
Enforcement
Survey Statement:
- (1)
- “I pay a fee for putting out more garbage bags than the city allows”
- (2)
- “The city enforces their garbage bag limit policy”
60.8% of respondents disagreed or strongly disagreed when read the statement regarding fee payment. The majority of respondents indicated they rarely or never pay fees for placing excess garbage on the curbs. This result was reinforced when the follow up statement regarding enforcement was asked, where only 24% of respondents agreed that their city enforces garbage bag limit policy.
Once again, regional differences were observed in the perceived level of PAYT enforcement, with 37.5% of survey respondents from urban communities answering that PAYT schemes were enforced to some degree. This is compared to only 17.2% of respondents in rural and northern communities who felt that garbage disposal limits were being enforced. This disparity in the perceived level of enforcement among urban and rural/northern areas may also explain the difference in PAYT awareness. Generally speaking, there is very little communication on the part of the municipality in informing residents that PAYT systems are in effect in a given area. Thus, policy awareness becomes a function of whether bag limits are being enforced—unless households observe the policy in effect, they are ignorant to its existence.
4.3.2. Capacity of Recycling Bins
Survey Statement:
- (1)
- “I put out more garbage on days where the city has unlimited garbage pickup”
- (2)
- “My recycling bin has enough space for the amount the recyclables my house generates”
- (3)
- “I put my recyclables in the garbage bin because I don’t have enough space in my recycling bin”
- (4)
- “I know that I can purchase additional recycling bins and bags from the city”
- (5)
- “I am willing to purchase additional recycling bins to store my recyclables”
The above group of questions were asked to respondents to gauge whether there was sufficient recycling bin capacity given the amount of waste/recyclables generated by households. Gauging whether there is sufficient recycling capacity is of particular importance in PAYT systems, as PAYT systems are only effective if recycling bins have sufficient capacity to allow for recyclable material that would otherwise be placed in the waste stream.
Overwhelmingly, respondents indicated that there was insufficient recycling bin capacity (61.7%) with majority of respondents indicating that they were forced to put items they identified as recyclable in the garbage due to insufficient space in the recycling bin (65.9%). Respondents also indicated that they stockpiled garbage due to bag limit policy, waiting for “Unlimited” garbage days by the city before placing all material out on the curb. (Some municipalities have special days where they remove the limits on the number of garbage bags set out by households).
Despite the dearth of recycling bin space for households, the majority of survey respondents indicated that they were unaware that they could purchase additional recycling bins or bags (53.1%) and were seemingly unwilling to do so (with 60.1% of respondents indicating that they disagreed or strongly disagreed with the statement “I am willing to purchase additional recycling bins to store my recyclables”).
This suggests that while households are generally in favor of recycling, they are unwilling to incur additional costs beyond the time it takes to source separate recyclables.
4.3.3. Illegal Dumping of Excess Garbage
Survey Statement:
- (1)
- “I illegally dump garbage to avoid paying the bag limit fee”
- (2)
- “I notice my neighbors illegally dumping garbage to avoid paying the bag limit fee”
5.25% of respondents admitted to illegally dumping waste generated by their households (i.e., in neighbors garbage bins, community dumpsters, public space garbage bins etc.). This number may be under reported, as 39.5% of respondents said that they witnessed other members of their community illegally dumping garbage. Given the potentially sensitive nature of the question (households are fined for the act), it seems likely that respondents are unwilling to divulge their propensity to illegally dump material. Of note, of the 12 respondents who admitted to illegal dumping, all lived in areas classified as either rural or northern communities. As noted by the USEPA [1], illegal dumping is more likely to take place in remote areas where access to recycling services is limited. Further to that point, rural communities provide more opportunities to dispose of material in a clandestine manner relative to densely populated urban areas.
4.4. Open Ended Analysis
For open ended survey questions, all survey responses were recorded, transcribed and reviewed to identify thematic categories and codes. Respondents were asked to answer two open ended questions related to PAYT schemes: (1) Do you think garbage bag limits are a good thing? Please explain your answer; and (2) Would you still recycle if your city eliminated limits on the amount of garbage bag you could put out? Please explain your answer. Respondents were asked to answer freely, and did not receive any additional input or instructions from the enumerator (beyond issues of clarification).
After a careful review of the interviews with each of the 228 respondents, nine and eight coding categories were identified for open ended questions one and two respectively. These findings have been summarized in Table 6 below:
| Do You Think Garbage Bag Limits Are a Good Thing? | |
| Positive Attitudes (Yes) | Negative Attitudes (No) |
| “Good for the environment”—57 | “Should be eliminated”—97 |
| “Reduces pollution”—15 | “Inconsistent enforcement”—55 |
| “Stops wasteful behavior”—84 | “Unfair”—112 |
| Would you still recycle if your city eliminated limits on the amount of garbage bag you could put out? | |
| Positive Attitudes (Yes) | Negative Attitudes (No) |
| “I am legally obligated to”—178 | “Saves me time”—34 |
| “It’s good for the environment”—29 | “Don’t care”—14 |
| “Sets a good example”—10 | “Doesn’t make a difference”—11 |
Codes have been organized into two additional container categories indicating positive/negative attitudes towards pay as you throw policy and recycling as a whole.
A “best fit” approach was utilized to categorize respondent’s answers. For example, “It makes people throw away less garbage” was coded under the stops wasteful behavior category. The results from our analysis suggest that the majority of respondents viewed garbage bag limits unfavorably. 57% of respondents (130 of 228) thought that PAYT schemes should be eliminated, citing reasons such as being unfair, inconsistently enforced, and time consuming. Many respondents viewed bag limits as a form of tax grab by the city, and did not understand why they were being forced to pay both a property tax and bag fee. Anecdotes such as “my neighbor throws away more than two bags nearly every week, but never pays a fee” were noted during the interviews. For these respondents, the objection to bag limits was not attributed to the policy itself, but its lack of enforcement. Respondents indicated that bag limits were a waste of time if the policy was not going to be consistently and uniformly enforced.
Conversely, 98% of respondents felt that bag limits should not be eliminated, and served a role in promoting recycling and environmental wellbeing, while serving as a deterrent to wasteful behavior. 14.9% of respondents felt that bag limits reduced the amount of material being sent to the landfill, which in turn, was good for the environment. 6.5% of respondents felt as though bag limits reduced pollution (it was unclear as to what respondents meant by pollution), while 25% felt that it was good for the environment. The general opinion of respondents who viewed bag limit policy favorably was that it prevented unnecessary excess. More than 36% of respondents felt that bag limits prevented wasteful behavior.
Overwhelmingly, survey participants indicated that they would continue to recycle even if PAYT policy was eliminated. The primary reason given by respondents was that recycling was legally mandated by the province, so the threat of penalty remained even with bag limit fees removed. As per Ontario regulation 101/94, every municipality in the province with a population greater than 5000 people must implement a residential recycling program. This result, coupled with the findings from our statistical analysis, indicate that there is a synergistic effect between mandatory recycling legislation and bag limit policy. While most people recycle because of a legal obligation, they will recycle more because of garbage bag limits. Moral imperative and personal concern for the environment also ranked highly on reasons for continued recycling among respondents, as many indicated that recycling was “the right thing to do” and “good for the environment”. Of the 48 respondents who said they would stop recycling if PAYT systems were eliminated, 14 indicated that they did not care about recycling, while the remaining 34 said that recycling required too much time to sort through the garbage and store recyclable material separately.
Table 7 provides the summary statistics for responses provided by the 223 survey respondents. Age and Gender are included as demographic variables, while Income and Education are used as socioeconomic controls. Education was coded as a four point categorical scale, with higher values indicated greater levels of educational attainment. For the income variable, respondents were asked to select from five income ranges that best represents their earnings, not actual values. Gender is coded as a dummy variable, 1 = male, 0 = female.
| Variable | Mean/Percent |
|---|---|
| Gender | 49.2% 1 |
| Age | 41.2 |
| College | 51.5% 2 |
| Income | $45,000–$60,000 |
Notes: 1 Percentage of respondents who identified as being male (else female); 2 Percentage of respondents with college education or higher.
An ordered logit model is used to test for any relationships between the survey responses and socioeconomic/demographic variables, as well as locality.
Table 8 presents the ordered Logit results for the 11 dependent variables taken from the survey data.
Table 8.
Ordered Logit Model of Demographic/Socioeconomic variables on Attitudes towards PAYT Policy.
| VARIABLE | LIMIT | FEE | ENFORCE | ULIMIT | BINCAP | GARBSWITCH | BINBUY | WILLBINBUY | IDUMP | NDUMP | AWARER |
|---|---|---|---|---|---|---|---|---|---|---|---|
| GENDER | 0.380 | −0.021 | −0.144 | 0.875 * | 0.011 | 0.644 | 0.244 | −0.142 | 0.141 | 0.021 | 0.004 |
| AGE | 0.727 | 0.061 | 0.191 | 0.884 | 0.445 | 0.122 | 0.412 | 0.754 | 0.143 | 0.174 | 0.947 * |
| INCOME | −0.019 | 0.015 | 0.087 | −0.215 | −1.794 ** | −0.248 | 0.341 | 0.633 | −0.054 | −0.782 | 0.874 |
| EDUCATION | 0.083 | −0.002 | 0.004 | −0.045 | −0.244 | −0.211 | 0.774 | 0.716 | −0.035 | −0.225 | 1.133 * |
| MUNICIPAL GROUP | YES *** | YES *** | YES ** | YES ** | YES * | YES ** | YES * | YES | YES | YES *** | YES ** |
Notes: * p = 0.1; ** p = 0.05; *** p = 0.01.
As can be seen, municipal group (municipality’s location) has the greatest bearing on attitudes towards and perception of PAYT policy among study participants. In 9 of the 11 dependent statements taken from the survey data, municipal grouping had a statistically significant influence. Consistent with our expectation, municipalities classified as rural and/or northern reported inconsistent enforcement of PAYT policy, higher incidences of illegal dumping, and less awareness surrounding the implementation of said policy. Of note, there was an inverse relationship between stated income levels and the survey statement “My recycling bin has enough space for the amount of recyclables my household generates”. Respondents with higher levels of income reported having insufficient space for recyclables in their Blue Bin. This would suggest a positive relationship between income and household waste generation, a finding that has mixed empirical support (see [24,25]). Other salient findings gleaned from Table 6 indicate that awareness of Ontario’s mandatory recycling policy is a function of both age and education. Generally speaking however, age, income, and gender had little bearing on how study participants responded to survey statements.
4.5. Survey—Municipal Waste Managers and Packaging Producers
Semi-structured interviews and surveys were developed in an attempt to gauge the attitudes and opinions of recycling stakeholders regarding existing and future policy initiatives.
Semi-structured interviews and surveys were conducted with recycling stakeholders from nine geographic areas in the province. Interview participants were selected on the basis of representing Ontario’s different recycling stakeholder groups (municipal officials, industry stewards & industry funded organizations). Table 9 below briefly describes each recycling stakeholder and their role within the provincial recycling system.
| Stakeholder | Description | # of Respondents |
|---|---|---|
| Municipal Waste Managers | Municipal waste managers are municipal employees responsible for operation, delivery, and maintenance of waste management services. Municipal waste managers are traditionally tasked with setting budgets, allocating staff resources, and setting policy priorities for municipal waste programs. Most municipal waste managers belong to the Municipal Industry Panel Committee (MIPC), advocating for the financial interests of their particular municipality. | 29 |
| Packaging Producers | Packaging producers are representatives from packaging companies that are financially obligated to remit fees to Stewardship Ontario. These fees are used to (partially) finance the operation of the Blue Box program under Ontario’s shared producer responsibility model. In most instances, packaging producers who agreed to participate in the study were specially designated employees responsible for end of life management of company waste. | 12 |
| Industry Funded Organization | Study participants from industry funded organizations included representatives from Stewardship Ontario, the Canadian Beverage Council, The Paper and Paperboard Packaging Environmental Council and the Canadian Plastics Industry Association. Industry Funded Organizations represent and advocate for the interests of their respective members. They are financed through membership dues. Generally speaking, IFOs represent the interests of a specific sector or packaging type. | 6 |
A request for participation was sent via email to potential study participants. This correspondence outlined the purpose of the study, what the data and findings would be used for, and what results would be shared with potential participants. Interviews were conducted in person, via telephone and electronic correspondence. How the interview was administered was decided by interviewees and scheduled at their convenience.
A high-level summary highlighting the findings from phase 1 of the study (best practice testing) was sent to all study participants two weeks prior to conducting the surveys/interviews. This was done to ensure that participants had sufficient time to review the outcome of the analysis and seek clarity on any issues surrounding methodology, findings, etc. Questionnaires were pre-tested and refined prior to conducting the official survey. The pre-test allowed for wording refinements and changes to the ordering of the questions. The finalized survey was conducted over a twelve-week period beginning in February and running through to April 2014.
For the semi-structured survey, respondents were asked to answer questions using a combination of Likert scales and open-ended statements. Depending on how the survey was administered, respondents were either: (a) read questions and asked to mark their responses on the survey with the assistance of an enumerator; or (b) asked to complete the survey electronically and submit their responses via email to the project lead. Electronic surveys included a contact number and email for the project lead (I served as the project lead), in the event that the respondent required assistance in completing the questionnaire.
Upon completion of the survey, respondents were asked a series of open ended questions related to existing best practices, the current state of recycling in Ontario, the proposed waste reduction act, and where they see the Blue Box program going in the future. Interviews conducted in person were recorded and later transcribed in full. For participants who opted to participate electronically, additional comment pages were included at the end of the survey to allow for respondents to record their answers.
A total of 114 stakeholders were contacted and asked to participate in the study. Of those contacted, 47 respondents successfully completed the survey (32 electronically, 15 in person), for a response rate of 41.22%. Table 10 further breaks down the stakeholder group “municipal waste managers” by geographic region.
| Region | # of Respondents |
|---|---|
| Large Urban | 12* |
| Urban Regional | 4 |
| Medium Urban | 5 |
| Rural Regional | 2 |
| Small Urban | 1 |
| Rural Collection—North | 2 |
| Rural Collection—South | 1 |
| Rural Depot—North | 1 |
| Rural Depot—South | 1 |
Note: * While the large urban group is comprised of only six municipal groups, more than one municipal waste manager from the Region of Peel, City of Toronto and York Region chose to participate in the survey.
4.6. Analysis of Municipal Waste Manager and Packaging Producer Survey Responses
Survey data surrounding municipal waste managers and packaging producers’ perception of PAYT policy and their effectiveness are summarized in Table 11 and Table 12. Much like the household surveys, municipal waste managers and packaging producers were read a series of statements regarding PAYT policy, and asked to indicate their level of agreement/disagreement with the statement. A five point Likert scale was used to measure respondent’s answers (Strongly Disagree, Somewhat Disagree, Neither Agree or Disagree, Somewhat Agree, Strongly Agree). These results from the respective stakeholders (municipal waste managers and packaging producers) were compared and contrasted to elucidate any differences in their responses. Given that these two groups traditionally have competing interests and policy objectives, I thought it may be useful to measure differences (if any) in how they perceived policies such as PAYT. The most frequently coded responses from municipal waste managers during the semi structured interviews are also included. It should be noted that interviews conducted with packaging producers regarding PAYT policy and experiences resulted in limited feedback. Packaging producers acknowledged that were not overly familiar with how such policies were implemented, or the challenges associated with them. Beyond comments with respect to the perceived effectiveness of PAYT policy, most declined to offer any additional commentary or provide any personal anecdotes.
| Survey Statement | Strongly Agree (5) | Agree (4) | Neither Agree Nor Disagree (3) | Disagree (2) | Strongly Disagree (1) | Mean | Standard Deviation |
|---|---|---|---|---|---|---|---|
| “I think that pay as you throw schemes are an effective way to increase household recycling.” | 32.7% | 35.8% | 12.4% | 14.1% | 5% | 4.14 | 1.11 |
| “Pay as you throw policies are an easy policy to enforce.” | 10.3% | 13.7% | 20.8% | 33.8% | 21.3% | 2.54 | 1.21 |
| “Pay as you throw policy requires significant administrative and staffing resources.” | 28.9% | 40.7% | 11.4% | 6.6% | 13.4% | 4.19 | 1.25 |
| “Pay as you throw policy results in households illegally dumping garbage.” | 27.8% | 22.5% | 19.7% | 20.8% | 9.2% | 2.61 | 1.17 |
| “Pay as you throw schemes should be promoted as a recycling best practice.” | 22.7% | 30.6% | 12.7% | 20.6% | 13.4% | 4.12 | 1.28 |
Notes: Coded Comments from Interviews: “Effective”—25; “Costly”—18; “Illegal Dumping”—14; “Administrative Burden”—14; “Best Practice”—9.
The vast majority of both municipal waste managers and packaging producers agreed (or strongly agreed) with PAYT schemes being an effective way to increase household recycling (although municipal waste managers indicated higher levels of agreement (68.5% vs. 50.9%). Only 16% of municipal waste managers did not believe PAYT schemes were an effective method for improving diversion (compared to 34.1% of packaging producers). Despite municipal waste managers viewing PAYT policy as more effective than packaging producers, they expressed lower levels of agreement when read the statement “Pay as you throw schemes should be promoted as a recycling best practice” (53.3% vs. 60%). This result was surprising, particularly given the perceived efficacy of PAYT in promoting household recycling among municipal waste managers. To understand this unexpected result, we turn to examining the additional survey responses provided by municipal waste managers.
| Survey Statement | Strongly Agree (5) | Agree (4) | Neither Agree Nor Disagree (3) | Disagree (2) | Strongly Disagree (1) | Mean | Standard Deviation |
|---|---|---|---|---|---|---|---|
| “I think that pay as you throw schemes are an effective way to increase household recycling.” | 24.8% | 26.1% | 15 | 18.3% | 15.8% | 3.92 | 1.22 |
| “Pay as you throw schemes should be promoted as a recycling best practice.” | 28.5% | 31.5% | 14.7% | 18.6% | 6.7% | 3.98 | 1.25 |
Despite the effectiveness of PAYT policy, most municipal waste managers felt as though PAYT schemes were difficult to administer and implement (with more than 50% of all municipal waste managers disagreeing (or strongly disagreeing) with the statement “Pay as you throw policies are easy to implement”). Survey respondents also indicated that PAYT policy posed an administrative burden, with 69.6% of municipal waste managers feeling as though PAYT policy required significant staffing resources. Anecdotes provided by municipal waste managers during the semi-structured interview suggested that PAYT policies were only effective if they were being enforced (a result that is confirmed during interviews with households). Some municipalities, particularly those in rural and northern areas, lack the necessary resources to ensure households are complying with a bag limit policy. Several participants from the waste manager survey also indicated that enforcement of bag limit policy actually encouraged disposing of waste illegally among households. 53.3% of municipal waste managers felt as though PAYT policies gave rise to illegal dumping of garbage in their communities. Illegal dumping of garbage in public space results in additional costs incurred by the municipality—costs that they are unable to recover under the province’s existing producer responsibility model. In Ontario, municipalities are only eligible to receive reimbursement for waste collected from households. When waste is illegally disposed of in places like parks, dumpsters etc., the municipality must bear the entire cost for managing that material.
The concerns expressed by municipal waste managers in this study’s survey echo the sentiments expressed by others in the existing literature on PAYT policy. While few dispute the effectiveness of PAYT schemes in promoting diversion, there remains considerable debate as to whether such policies are worth the accompanying administrative challenges.
5. Conclusions
While the results of this paper further substantiate the efficacy of PAYT systems in promoting waste diversion, the findings from the survey study suggest there are opportunities for further improvement.
Municipalities need to make greater efforts in making the community aware that PAYT systems are being enforced in their areas. Further to that point, municipalities must be sure to enforce penalties for exceeding the designated bag limit to ensure the continued efficacy of user pay garbage systems. Additional efforts should also be made to increase the capacity of recycling bins, or alternatively, make provisions for more than one bin per household. The results from our survey suggest that recyclable material is ending up in the waste stream due to insufficient recycling bin capacity. Furthermore, most household survey respondents indicated that they would be unwilling to purchase additional Blue Bins or recycling bags. As such, recycling rates may further be improved by providing additional storage for recyclables. It should be noted that municipalities must weigh any potential benefits in increasing waste diversion against the costs of providing additional recycling bins.
Of note, the findings of this study were not supportive of previous investigations examining household attitudes towards PAYT policy. As noted by both [16,18], households living in PAYT communities viewed the policy favorably over time. This study found the opposite to be true, with the majority of households expressing displeasure with both the efficacy and fairness of PAYT schemes. This could be due to the perceived inefficiencies of PAYT implementation (lack of Blue Bin space, lack of enforcement) in Ontario. While exposure to PAYT policy has been shown to positively affect attitudes towards user pay garbage systems, public support for such policies is a function of a multitude of factors—including a broad range of environmental and economic factors. It seems plausible that sentiment towards PAYT policy in Ontario may change if municipalities can improve upon policy implementation.
Additional research needs to be done in the above areas (particularly surrounding the effects of PAYT policy on household waste generation in Ontario), as the effectiveness of PAYT schemes may be further improved with modifications to how such systems are enforced, implemented, and financed.
Acknowledgments
The author would like to acknowledge the assistance of Waste Diversion Ontario and Stewardship Ontario in graciously providing the data used in this study. Special thanks to Scott Slocombe for his guidance and input throughout the project. This study did not receive funding from any external agencies.
Conflicts of Interest
The authors declare no conflict of interest.
References
- USEPA. Municipal Solid Waste in the United States, 2007 Facts and Figures; USEPA: Washington, DC, USA, 2007.
- Kinnaman, T.C.; Fullerton, D. Garbage and Recycling in Communities with Curbside Recycling and Unit-Based Pricing; NBER Working Papers 6021; National Bureau of Economic Research, Inc.: Cambridge, MA, USA, 1997. [Google Scholar]
- Callan, S.J.; Thomas, J.M. Analyzing demand for disposal and recycling services: A systems approach. East. Econ. J. 2006, 32, 221–240. [Google Scholar]
- Park, J.W. 3R Policies of Korea. 2009. Available online: http://eng.me.go.kr/file.do?method=fileDownloader&attachSeq=1133 (accessed on 15 January 2015). [Google Scholar]
- Folz, D.H.; Giles, J. Municipal experience with pay as you throw policies: Findings from a national survey. State Local Gov. Rev. 2002, 34, 105–115. [Google Scholar] [CrossRef]
- Bauer, S.; Miranda, M. The Urban Performance of Unit Pricing: An Analysis of Variable Rates for Residential Garbage Collection in Urban Areas; Report Prepared for Office of Policy, Planning and Evaluation; U.S. Environmental Protection Agency: Washington, DC, USA, 1996. Available online: www.epa.gov/docs/oppe/eaed/upaperf1.pdf (accessed on 19 November 2014).
- McFarland, J.M. Comprehensive Studies of Solid Waste Management, in Comprehensive Studies of Solid Waste Management; Final Report; Report No. 72–73; Sanitary Engineering Research Laboratory, College of Engineering and School of Public Health, University of California: Berkeley, CA, USA, 1972; pp. 41–106. [Google Scholar]
- Wertz, K.L. Economic factors influencing household production of refuse. J. Environ. Econ. Manag. 1976, 2, 263–272. [Google Scholar] [CrossRef]
- Jenkins, R. The Economics of Solid Waste Reduction: The Impact of User Fees; Edward Elgar Publishing: London, UK, 1993. [Google Scholar]
- Repetto, R.; Dower, R.; Jenkins, R.; Geoghegan, J. Green Fees: How a Tax Shift Can Work for the Environment and the Economy; The World Resources Institute: Washington, DC, USA, 1992. [Google Scholar]
- Flemish Waste Institute. Flanders, Belgium: Europe’s Best Recycling and Prevention Program. 2013. Available online: http://no-burn.org/downloads/ZW%20Flanders.pdf (accessed on 21 November 2014).
- Bio Intelligence Services (BIOS). Use of Economic Instruments and Waste Management Performances: Final Report. 2012. Available online: http://ec.europa.eu/environment/waste/pdf/finalreport 10042012.pdf (accessed on 7 January 2015).
- Hong, S. The effects of unit pricing system upon household solid waste management: The Korean experience. J. Environ. Manag. 1999, 57, 1–10. [Google Scholar] [CrossRef]
- Sidique, S.F.; Lupi, F.; Joshi, S.V. Factors influencing the rate of recycling: An analysis of Minnesota counties. Resour. Conserv. Recycl. 2010, 54, 242–249. [Google Scholar] [CrossRef]
- Podolsky, M.J.; Spiegel, M. Municipal waste disposal: Unit pricing and recycling opportunities. Public Works Manag. Policy 1998, 3, 27–39. [Google Scholar]
- Brown, Z.S.; Johnstone, N. Better the devil you throw: Experience and support for pay-as-you-throw waste charges. Environ. Sci. Policy 2014, 38, 138–142. [Google Scholar] [CrossRef]
- Schuitema, G.; Steg, L.; Forward, S. Explaining differences in acceptability before and acceptance after the implementation of a congestion charge in Stockholm. Transp. Res. A Policy Pract. 2010, 44, 99–109. [Google Scholar] [CrossRef]
- Dunne, L.; Convery, F.J.; Gallagher, L. An investigation into waste charges in Ireland, with emphasis on public acceptability. Waste Manag. 2008, 28, 2826–2834. [Google Scholar] [CrossRef] [PubMed]
- Kinnaman, T. Examining the justification for residential recycling. J. Econ. Perspect. 2006, 20, 219–232. [Google Scholar] [CrossRef]
- Kinnaman, T. The Economics of Municipal Solid Waste Management. Waste Manag. 2008, 29, 2615–1617. [Google Scholar] [CrossRef] [PubMed]
- Allers, M.; Hoebin, C. Effects of unit based garbage pricing: A differences in differences approach. Environ. Res. Econ. 2010, 45, 405–428. [Google Scholar] [CrossRef]
- Waste Diversion Ontario Blue Box Tonnage Highlights and Summary. 2013. Available online: http://www.wdo.ca/content/?path=page82+item35931 (accessed on 10 January 2015).
- Stats Canada. 2011 Canadian Census—Population Density. 2011. Available online: http://www.12.statcan.gc.ca/census-recensement/index-eng.cfm (accessed on 15 January 2015). [Google Scholar]
- Sivakumar, K.; Sugirtharan, M. Impact of family income and size on per capita solid waste generation. J. Sci. Univ. Kelaniya 2010, 5, 13–23. [Google Scholar]
- Dyson, B.; Ni-Bin, C. Forecasting municipal solid waste generation in a fastgrowing region with system dynamics modeling. Waste Manag. 2005, 25, 669–679. [Google Scholar] [CrossRef] [PubMed]
© 2015 by the authors; licensee MDPI, Basel, Switzerland. This article is an open access article distributed under the terms and conditions of the Creative Commons Attribution license (http://creativecommons.org/licenses/by/4.0/).
Share and Cite
MDPI and ACS Style
Lakhan, C. Stakeholder Perceptions of Unit Based Waste Disposal Schemes in Ontario, Canada. Resources 2015, 4, 434-456. https://doi.org/10.3390/resources4030434
AMA Style
Lakhan C. Stakeholder Perceptions of Unit Based Waste Disposal Schemes in Ontario, Canada. Resources. 2015; 4(3):434-456. https://doi.org/10.3390/resources4030434
Chicago/Turabian StyleLakhan, Calvin. 2015. "Stakeholder Perceptions of Unit Based Waste Disposal Schemes in Ontario, Canada" Resources 4, no. 3: 434-456. https://doi.org/10.3390/resources4030434