
Wind Resource Quality Affected by High Levels of Renewables

National Renewable Energy Laboratory, 15013 Denver West Pkwy, RSF 300, Golden, CO 80401, USA
Resources 2015, 4(2), 378-383; https://doi.org/10.3390/resources4020378
Submission received: 4 March 2015
/
Revised: 4 June 2015
/
Accepted: 12 June 2015
/
Published: 17 June 2015
(This article belongs to the Special Issue Spatial and Temporal Variation of the Wind Resource)
Abstract
:For solar photovoltaic (PV) and wind resources, the capacity factor is an important parameter describing the quality of the resource. As the share of variable renewable resources (such as PV and wind) on the electric system is increasing, so does curtailment (and the fraction of time when it cannot be avoided). At high levels of renewable generation, curtailments effectively change the practical measure of resource quality from capacity factor to the incremental capacity factor. The latter accounts only for generation during hours of no curtailment and is directly connected with the marginal capital cost of renewable generators for a given level of renewable generation during the year. The Western U.S. wind generation is analyzed hourly for a system with 75% of annual generation from wind, and it is found that the value for the system of resources with equal capacity factors can vary by a factor of 2, which highlights the importance of using the incremental capacity factor instead. The effect is expected to be more pronounced in smaller geographic areas (or when transmission limitations imposed) and less pronounced at lower levels of renewable energy in the system with less curtailment.
1. Introduction
The increasing levels of wind and solar photovoltaic (PV) in the electric sector [1] may affect the economic performance of power generators in many ways [2]. The amount of contributed generation is one of the most important parameters characterizing the performance of a generating unit. For renewable (PV and wind) generation, the capacity factor [3] directly affects the levelized cost of energy [4] and subsequent investment decisions. Generation curtailments present an example of how higher levels of renewable generation (RE), mostly wind and PV, can affect the performance of individual generators. In some cases [5], the fraction of time with curtailments can be significant.
In the present work, load matching techniques (Renewable Energy Load Matching model, RELM, Copyright 2013 Alliance for Sustainable Energy, LLC) [6] are used to quantify the effect. For (extremely) high levels of RE (75% of load is met by wind) in the Western U.S., the optimal set of wind generators is selected from the Western Wind and Solar Integration Study (WWSIS) database [7]. The selection is minimizing the overall nameplate capacity of the wind farms fleet, which in essence minimizes the capital costs of building the fleet. Transmission limitations are not considered for two reasons: (i) The WWSIS dataset mostly contains sites in the proximity of existing major power lines; (ii) the large scale transmission limitations seem to have a limited effect on load matching in the high-renewables cases [8].
The results clearly demonstrate: with large fraction of renewable generation in the system, the capacity factor does not accurately reflect the quality of the resource, while the incremental capacity factor does.
2. Results and Discussion
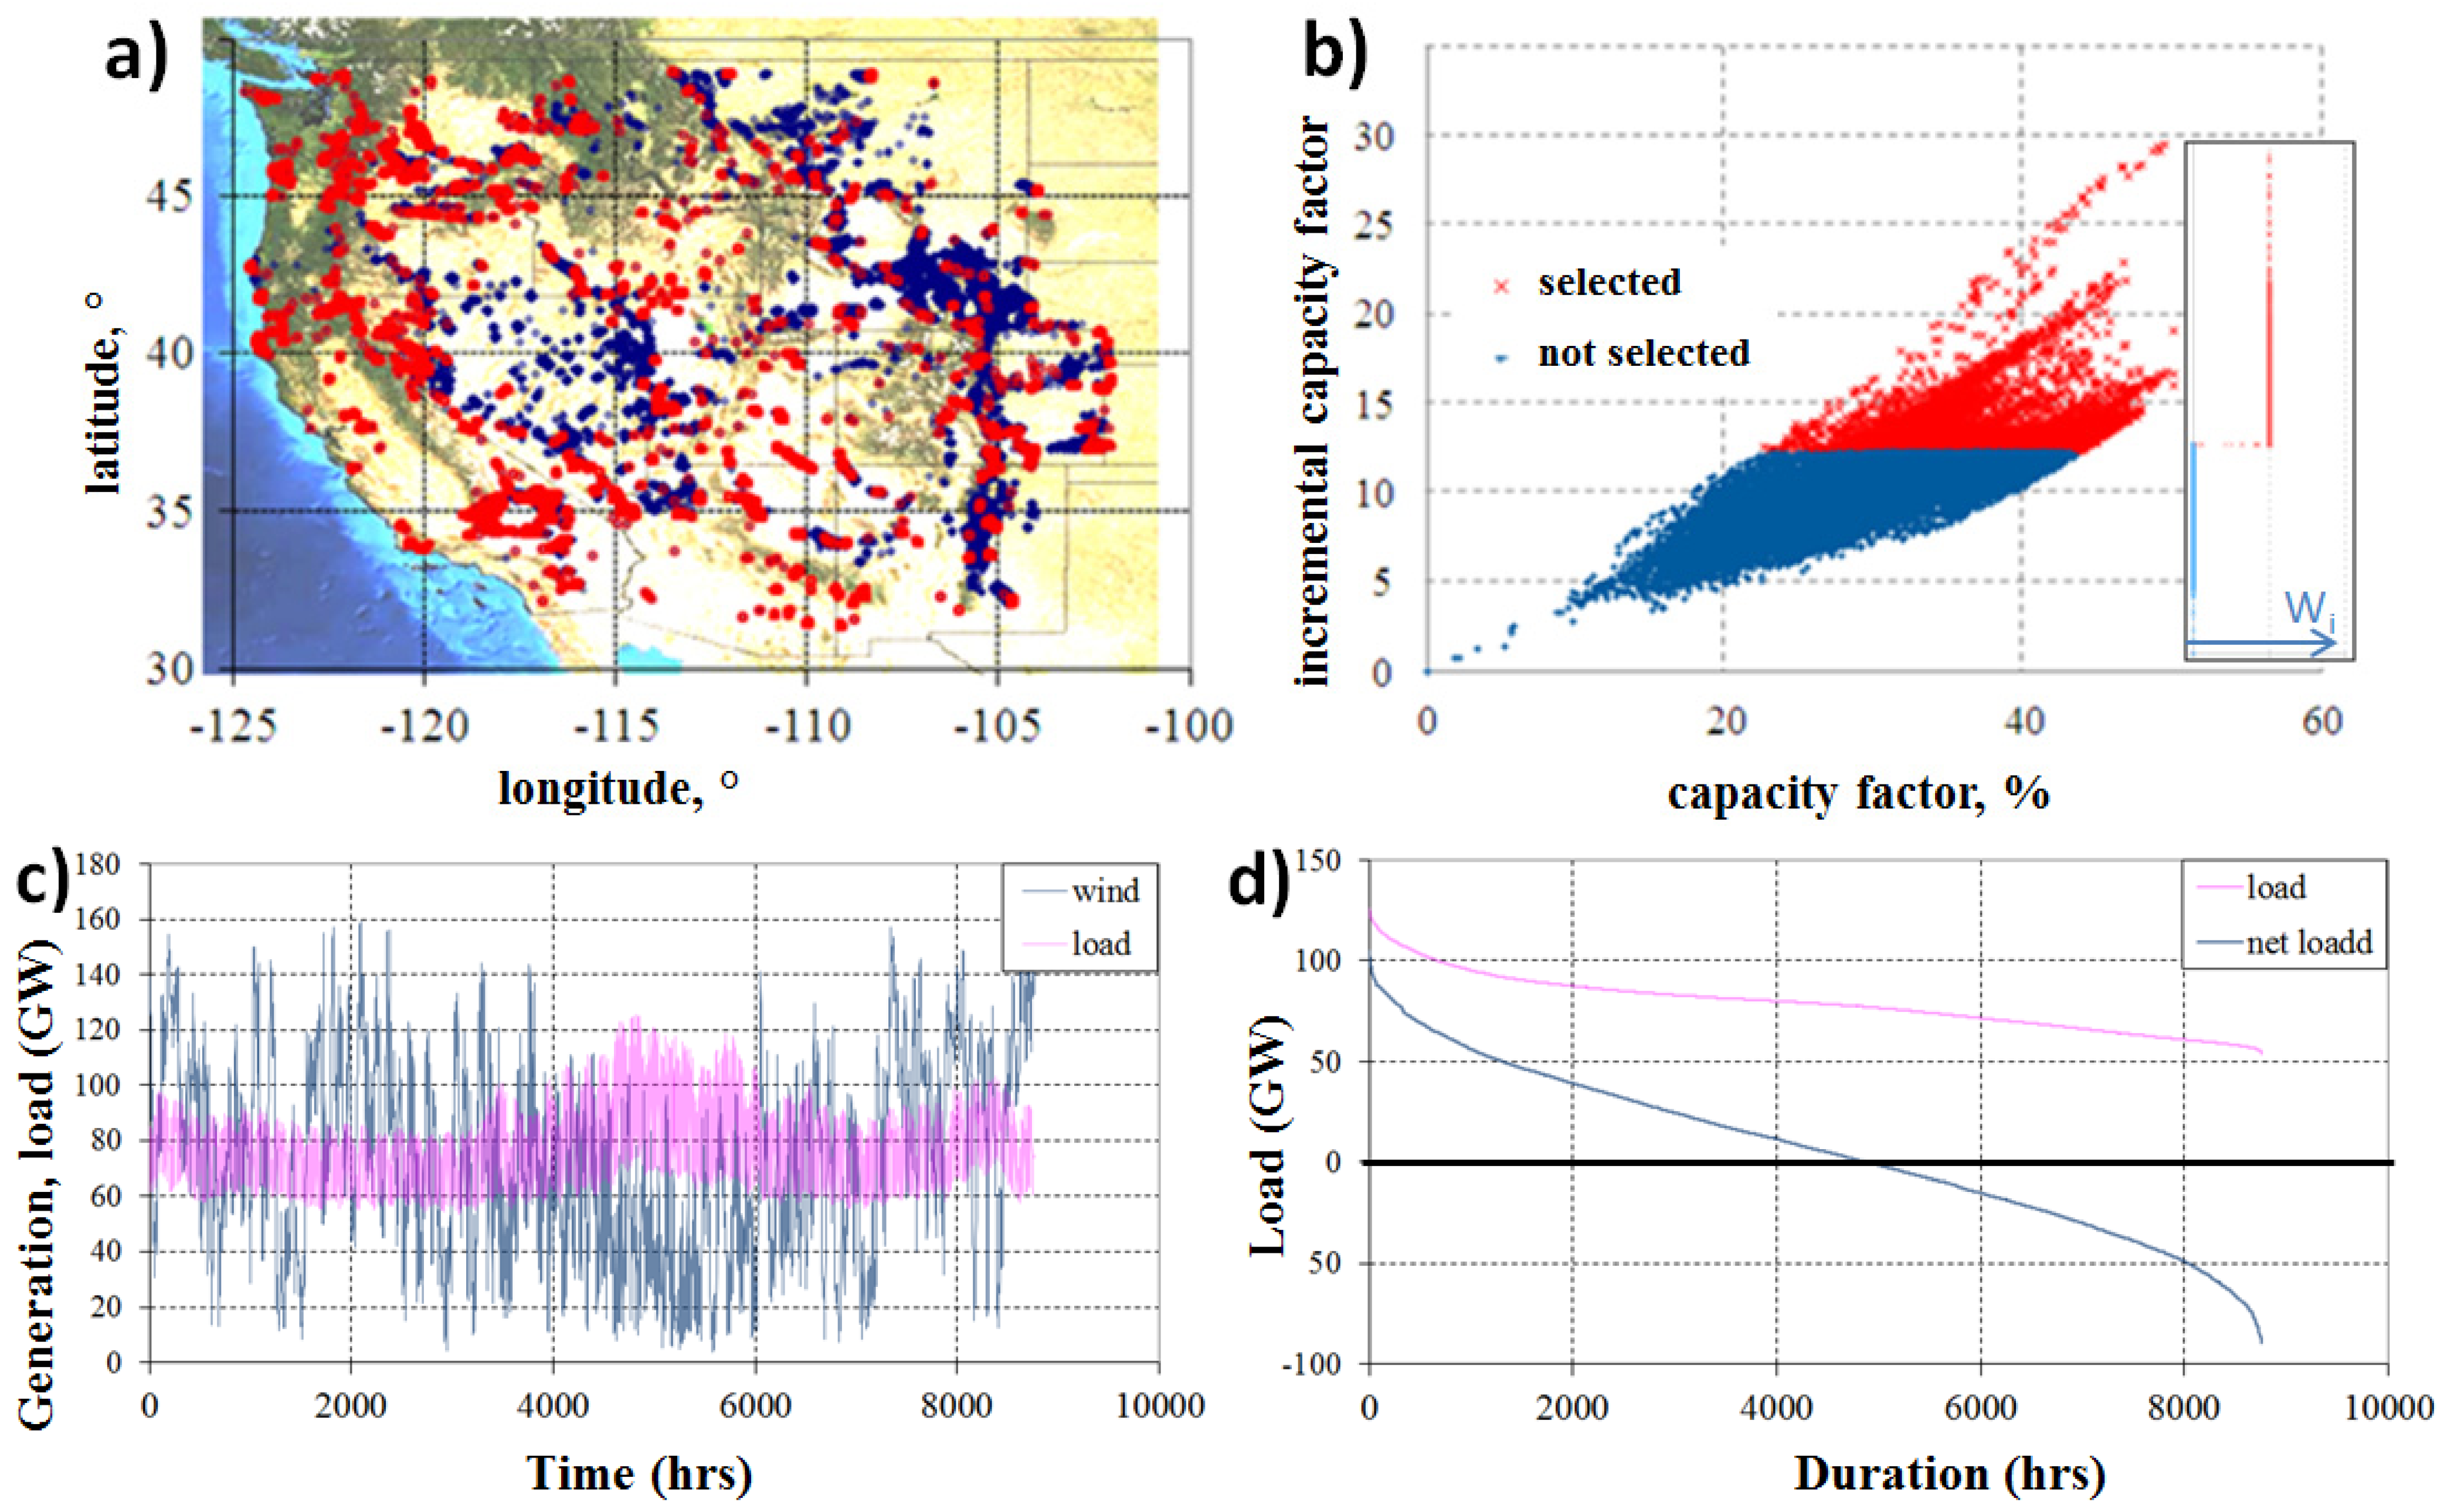
The broad set of wind sites in the Western part of the U.S. (the Western interconnect, or Western Electric Coordinating Council (WECC)) is shown in Figure 1a, each dot on the map representing a potential wind site from the broad set of about 30,000 sites, 30 MW nameplate capacity each. By using hourly generation profiles for these sites (for the year 2005, in this example), the selected “planned” set of wind generation sites that would be employed to meet 75% of the load has been determined: RELM [6] was used to minimize the built wind capacity (analogous to minimizing capital costs). The resulting planned site selection is color-coded in Figure 1a with each red dot representing a site “planned”, and the blue dots showing the remaining non-selected wind sites. From the 30,000 available, the optimal selection consists of a set of 6418 sites totaling 192 GW installed capacity. Most importantly, for this “planned” set of generation sites (and for the 2005 electric load), time periods with curtailed generation were determined. When calculating the incremental capacity factor, we exclude generation during the hours of curtailment (when no extra energy is useful). The minimization of installed capacity is equivalent to selecting wind sites with highest incremental capacity factors. The comparison between the incremental and the “overall” (commonly used) capacity factors is shown in Figure 1b. There are significant differences between the two. Some wind sites show high “overall” capacity factors while performing not that great in the non-curtailment hours. On the opposite, some lower “overall” capacity wind sites show decent performance when it is needed most. The sites with no assigned capacity (shown in blue) fall below the 12% borderline on Figure 1b, the selected sites (shown in red) are above the borderline on the graph. And a small number of sites (11 out of 6418) are selected by the model at fractional (positive but less than maximal) capacity. These are also shown in red and fall exactly on the borderline.
In effect, minimization of installed capacity decreases the amount of time with curtailment, by employing the geographic diversity of the available wind sites.
Figure 1.
Optimal selection of wind sites that minimizes the overall installed wind capacity at 75% wind energy in the system (a) Geographic distribution of selected (red) and omitted (blue) wind sites; (b) Site quality characterization: The selection from Figure 1a is displayed on this plot; minimizing the installed capacity results in choosing wind sites with highest incremental capacity factors. In this example, only the wind sites with incremental capacity factors above 12% are selected. The insert shows the distribution of the build-out coefficients; (c) Hourly load and wind generation aggregated from the selected sites; (d) Load and net-load duration curves. The net-load was calculated as load discounted for the aggregated wind generation. Negative net-load values correspond to time intervals when wind generation exceeds load and is curtailed.

3. Methods and Data
The computer model originates from [6] and answers the following question: What is the best match to loads in the western portion of the U.S. that could be achieved with wind power? (Specifically, wind resources and loads in the U.S. area of the Western Electric Coordinating Council, WECC, are examined.)
The primary decision variables are where and how much wind (Wi, the fraction of maximal allowed wind farm capacity) should be built at each wind site (index i); wit is the generation that could be produced at hour t by the wind resource at site i (wit is an input, the model does not determine how large it should be), the values for these inputs come from the WWSIS database [7]. The WWSIS dataset is based on mesoscale numerical weather prediction model, covering over 4 million square kilometers with a spatial resolution of approximately two-kilometers over a period of three years with a temporal resolution of 10 min. For our purposes, the model outputs are aggregated to hourly values. The model includes meteorological data necessary to calculate wind energy production. Downselecting from the 2 × 2 km grid, individual time series were produced for over 30 thousand locations of potential wind power generation. Each of these locations was modeled as an individual project with ten VestasV-90 (3 MW) turbines. A perfect forecast throughout the year is assumed. The year 2005 data (load and wind potential generation) are used.
The model is a linear program that selects wind sites to minimize the wind built capacity, subject to several constraints. The first constraint is that over all 8760 h of the year the load (lt) is met with a combination of wind (Wi × wit) and dispatchable (Gt) generation, allowing curtailments (Ct). Curtailments, as well as dispatchable generation, are modeled hourly. The sub-hourly variability of load and wind resources is not considered, and the sub-hourly details of curtailment are not considered either. The second constraint limits the size of the wind farms. Then, the wind generates a fixed fraction (0.75) of the load. As a rule, the names for model variables (all are non-negative) start with a capital letter, while constant parameters begin with a small letter:
Minimize ∑i Wi
Subject to constraints
lt + Ct = ∑i Wi × wit + Gt for all hours t
0 < Wi < 1 for all sites i
∑t ∑i Wi × wit = 0.75 × ∑t lt + ∑t Ct
The model is fairly straightforward. It is only the large number of wind sites that poses some computational challenges. A similar approach, although based on costs and a different wind/PV dataset, has been described recently [9].
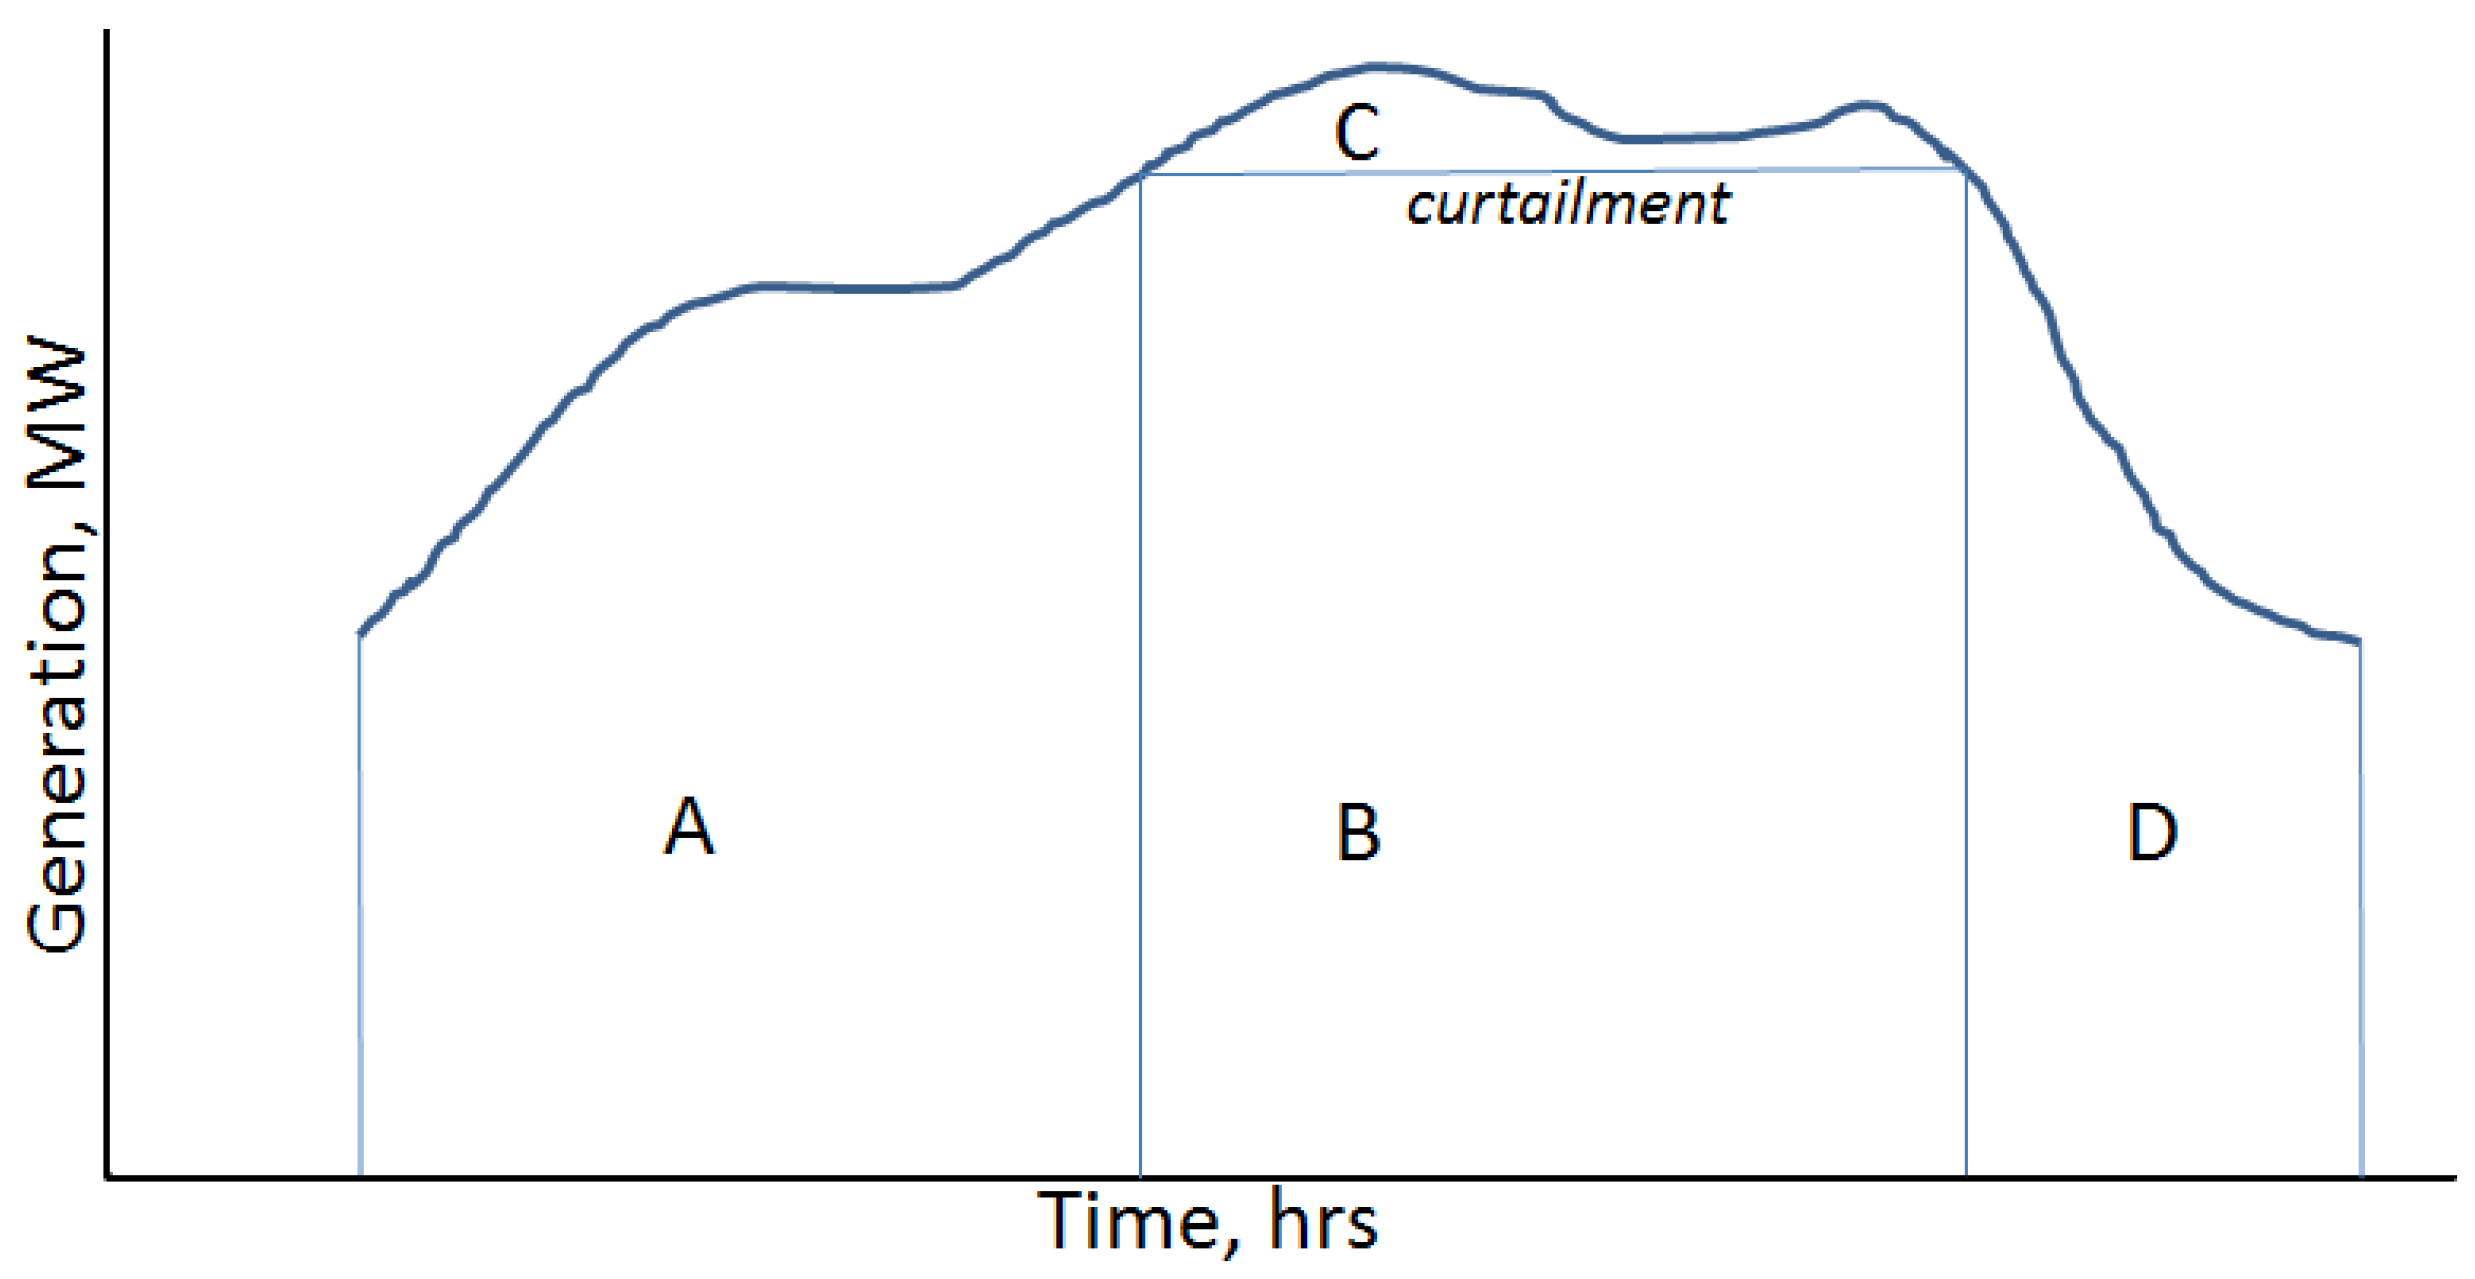
The incremental capacity factor, as mentioned above, does not account for wind generation during the time of curtailment. Figure 2 gives a visual representation for this statement. For example, if the areas A, B, C, D on the Figure are 30, 40, 10 and 20 GWh, respectively, and the capacity factor for the shown time interval is 50%, then the incremental capacity factor is half of that because 50% × (30 + 20)/(30 + 40 + 10 + 20) = 25%.
Figure 2.
Incremental capacity factor affected by curtailment (schematics): with curtailment (area C), only generation outside the curtailment interval (areas A and D, not B, not C) is taken into account to calculate the incremental capacity factor.
Figure 2.
Incremental capacity factor affected by curtailment (schematics): with curtailment (area C), only generation outside the curtailment interval (areas A and D, not B, not C) is taken into account to calculate the incremental capacity factor.

4. Conclusions
The differences between the incremental (i.e., relevant for capital investment decisions) and “overall” capacity factors can be significant at high levels of renewable energy. The optimal selection of wind sites effectively reduces curtailment alongside with the difference between these two capacity factors. In real life, the selection of sites is rarely optimal, and this will increase the difference between the incremental and the “overall” capacity factors. On the other hand, lower levels of renewable energy will dampen this difference.
Finally, the presented results are obtained for a large region (the U.S. part of the Western Interconnect) assuming no transmission limitations. Smaller regions (and/or transmission limitations) reduce geographic diversity of renewables and will increase curtailments; baseload generation can do that as well. This should increase the significance of the incremental (vs. the commonly used) capacity factor.
Acknowledgments
The author acknowledges valuable help form Trieu Mai, Patrick Sullivan, Aaron Bloom, Paul Denholm and Gregory Brinkman (all from NREL) in discussing the results presented here and Anne Miller (NREL) in copyrighting the computer model.
Conflicts of Interest
The author declares no conflict of interest.
References and Notes
- Energy Information Administration. Short Term Energy Outlook; January 2015. Available online: http://www.eia.gov/forecasts/steo/pdf/steo_full.pdf (accessed on 26 January 2015).
- Cochran, J.; Miller, M.; Milligan, M.; Ela, E.; Arent, D.; Bloom, A.; Futch, M.; Kiviluoma, J.; Holtinnen, H.; Orths, A.; et al. Market Evolution: Wholesale Electricity Market Design for 21st Power Systems. Technical Report NREL/TP-6A20-57477; 2014. Available online: http://www.nrel.gov/docs/fy14osti/57477.pdf (accessed on 26 January 2015). [Google Scholar]
- Justus, C.G.; Hargraves, W.R.; Yalcin, A. Nationwide Assessment of Potential Output from Wind-Powered Generators. J. Appl. Meteorol. 1976, 15, 673–678. [Google Scholar] [CrossRef]
- Tidball, R.; Bluestein, J.; Rodriguez, N.; Knoke, S.; Macknick, J. Cost and Performance Assumptions for Modeling Electricity Generation Technologies; Subcontract Report NREL/SR-6A20-48595; 2010. Available online: http://www.nrel.gov/docs/fy11osti/48595.pdf (accessed on 26 January 2015).
- Liu, S. Review of the ISO 2014 LTPP System Flexibility Study. Available online: http://www.caiso.com/Documents/Presentation_2014LTPPSystemFlexibilityStudy_SHcall.pdf (accessed on 26 January 2015).
- Short, W.; Diakov, V. Matching Western US Electricity Consumption with Wind and Solar Resources. Wind Energy 2013, 16, 491–500. [Google Scholar] [CrossRef]
- Potter, C.W.; Lew, D.; McCaa, J.; Cheng, S.; Eichelberger, S.; Grimit, E. Creating the Dataset for the Western Wind and Solar Integration Study (U.S.A.). Wind Eng. 2008, 32, 325–338. [Google Scholar] [CrossRef]
- Diakov, V.; Short, W.; Gilchrist, B. Effect of Large Scale Transmission Limitations on Renewable Energy Load Matching for Western U.S; NREL Report No. CP-6A20-54688; 2012. Available online: http://www.nrel.gov/docs/fy12osti/54688.pdf (accessed on 26 January 2015).
- Clack, C.T.M.; Xie, Y.; MacDonald, A.E. Linear programming techniques for developing an optimal electrical system including high-voltage direct-current transmission and storage. Int. J. Electr. Power Energy Syst. 2015, 68, 103–114. [Google Scholar] [CrossRef]
© 2015 by the authors; licensee MDPI, Basel, Switzerland. This article is an open access article distributed under the terms and conditions of the Creative Commons Attribution license (http://creativecommons.org/licenses/by/4.0/).
Share and Cite
MDPI and ACS Style
Diakov, V. Wind Resource Quality Affected by High Levels of Renewables. Resources 2015, 4, 378-383. https://doi.org/10.3390/resources4020378
AMA Style
Diakov V. Wind Resource Quality Affected by High Levels of Renewables. Resources. 2015; 4(2):378-383. https://doi.org/10.3390/resources4020378
Chicago/Turabian StyleDiakov, Victor. 2015. "Wind Resource Quality Affected by High Levels of Renewables" Resources 4, no. 2: 378-383. https://doi.org/10.3390/resources4020378