Article

The Energy-Water Nexus: An Analysis and Comparison of Various Configurations Integrating Desalination with Renewable Power

The University of Texas at Austin, 204 E. Dean Keeton Street, Stop C2200, Austin, TX 78712, USA
*
Author to whom correspondence should be addressed.
Resources 2015, 4(2), 227-276; https://doi.org/10.3390/resources4020227
Submission received: 7 February 2015 / Revised: 13 April 2015 / Accepted: 14 April 2015 / Published: 27 April 2015
(This article belongs to the Special Issue Groundwater Quantity and Quality)

Abstract

:
This investigation studies desalination powered by wind and solar energy, including a study of a configuration using PVT solar panels. First, a water treatment was developed to estimate the power requirement for brackish groundwater reverse-osmosis (BWRO) desalination. Next, an energy model was designed to (1) size a wind farm based on this power requirement and (2) size a solar farm to preheat water before reverse osmosis treatment. Finally, an integrated model was developed that combines results from the water treatment and energy models. The integrated model optimizes performances of the proposed facility to maximize daily operational profits. Results indicate that integrated facility can reduce grid-purchased electricity costs by 88% during summer months and 89% during winter when compared to a stand-alone desalination plant. Additionally, the model suggests that the integrated configuration can generate $574 during summer and $252 during winter from sales of wind- and solar-generated electricity to supplement revenue from water production. These results indicate that an integrated facility combining desalination, wind power, and solar power can potentially reduce reliance on grid-purchased electricity and advance the use of renewable power.

1. Introduction

Energy and water are inseparable: energy is used to collect, treat, and distribute water while water is used to cool reactors, run turbines, and act as a working fluid for power plants. Management strategies for water and energy should be aligned due to the strong interdependence between vital water and energy resources.
Both water and energy face current and future challenges caused by societal demands. In the water sector, rising population, overconsumption of freshwater resources, and a changing climate have and will continue to create challenges to meet water demand around the world. Specifically, areas such as the southwest United States are experiencing rapid population growth, more than double the national average in recent years [1]. At the same time, many regions including the southwest United States are facing alarming drought conditions. These droughts are expected to increase in duration and intensity in years to come [2] due to natural weather variability and factors associated with a changing climate. As the availability of current water resources diminishes, municipalities and water planners are looking towards new and innovative solutions to keep up with rising water demand. However, alternative water resources are often times located further away from demand centers or are of lower quality and therefore require more energy for transportation and treatment.
A promising alternative to relying more on freshwater supplies is desalination of brackish and saline water. Desalination of seawater is gaining support in coastal areas while desalination of brackish groundwater is seen as a potential solution for inland regions. While desalination offers the advantage of diversifying water supplies, the energetic impacts can be significant. Desalination requires significantly more energy than typical surface water treatment. This energy investment can incur high financial costs on desalination operations and also result in significant carbon dioxide emissions.
Renewable energy technologies offer a solution to meet the energy demands of desalination. By using renewably generated electricity, it is possible to meet the energy demand of desalination in a sustainable way. Coupling renewable power such as wind and solar with desalination offers a means to meet the energetic needs of desalination without increasing reliance on fossil fuels. Such an integration of technologies would limit carbon dioxide emissions.
At the same time, desalination provides a solution to inherent difficulties associated with renewable energy. Wind and solar power are limited by both diurnal and seasonal variability. Wind power faces predictable daily and seasonal variability and less predictable weather-induced fluctuations. These fluctuations are challenging because inland wind availability does not typically match energy demand. In many regions, wind speeds are strongest during nighttime hours, when energy demand is low, and are weakest in the afternoons, when energy demand peaks. Seasonally, wind speeds are strongest during winter months, the time when energy demand drops in warm regions, while weaker during summer months, when energy demand peaks. The fact that wind power availability is out of phase with energy demand creates challenges implementing wind power. It’s difficult for operators to incorporate grid-scale wind farms due to the variable nature of power from these facilities. The daily and seasonal fluctuations do not allow operators to meet energy demand on the same dispatchable basis as conventional power plants. The inherent variability of wind power can be a major setback in the advancement of renewable power technologies.
Desalination offers a solution to the variability of wind power because water treatment is a time-flexible process that can be operated during off-peak hours. Integrating a desalination plant with wind power provides an opportunity to utilize electricity generated from renewables in a way that is not negatively impacted by its inherent variability. A grid-connected integrated facility can provide energy for desalination when energy demand is low while generating electricity for the grid during times when demand rises. By supplying energy for desalination during off-peak hours, grid-scale wind power can be used to produce freshwater while also providing municipal electricity in a way that is not negatively impacted by daily and seasonal fluctuations.
Collocating a desalination facility with a solar farm offers multiple benefits. The exchange of heat between relatively cool water and warm solar panels is an opportunity to improve solar power production. Typically, photovoltaic (PV) solar panels suffer a loss in efficiency when the PV cells heat up. Solar energy is lost as “waste heat” that is not converted into electricity when these panels increase in temperature. However, efficiency losses can be mitigated if solar panels are cooled. Brackish groundwater is typically at a relatively cool temperature and can therefore be used to decrease the temperature of solar panels for a solar-power facility co-located with a desalination plant. In cooling solar panels with brackish groundwater water, coupling desalination with a solar power plant can increase the efficiency of solar power production.
Furthermore, there are water-treatment benefits of providing on-site solar power at a desalination facility. Using slightly warm feed water for desalination reduces the energetic requirement of the water treatment process. Therefore, preheating feed water using onsite solar panels prior to desalination is an opportunity to reduce the energy consumption and costs. Coupling desalination with solar power can be mutually beneficial to both technologies as water is used to improve the efficiency of solar-power production, while solar panels are used to reduce the energy required for desalination.
Additionally, a joined facility that produces water and electricity can mitigate risks associated with potential fluctuations in the water or energy markets. By providing two sources of revenue, water and electricity, an integrated facility can protect itself from the risk of declining water or electricity sales. If water sales dip for a period of time, the facility can still bring in money by selling electricity to the grid. Likewise, if wind and solar resources are weak on certain days, the facility will still be able to have revenue from producing water. Providing two sources of revenue at an integrated facility provides diversity to reduce the risk of fluctuations in the water or energy sectors.
The three technologies studied in this investigation, desalination, wind, and solar power, are rapidly developing. However, all three face inherent challenges. Integrating these technologies can advance their development and implementation. Additionally, coupling desalination with wind and solar power solves challenges faced by both the energy and water sectors. A desalination facility integrated with wind and solar power can meet water-supply challenges while simultaneously providing sustainable renewable power. Coupling desalination with renewable power allows the water and energy sectors to work together to meet current and future needs for strained resources.
This analysis focuses on brackish groundwater desalination in the region of Central Texas. Previous geographic studies have indicated that Central Texas offers a viable location to integrate desalination with renewable power due to the availability of brackish groundwater, wind, and solar resources in this region [3]. The methodology outlined in this report is widely applicable to regions beyond Texas where these resources are similarly available.

2. Background

2.1. Reverse Osmosis Desalination of Brackish Groundwater

Desalination of brackish and saline water is becoming an increasingly popular means for municipalities to meet water demand. Water with total dissolved solids (TDS) between 1000 and 10,000 mg/L is considered “brackish”, while water with TDS greater than 10,000 mg/L is considered “saline” [4]. In these TDS ranges, water is not useful for most purposes without treatment. However, desalination provides a means to reduce the salt content so that the water may be used for municipal, agricultural, or industrial purposes. There are a multitude of desalination technologies and methodologies including multistage flash distillation, multi effect distillation, vapor compression, electrodialysis, and reverse osmosis (RO).
The investigation discussed in this paper focuses on reverse osmosis. RO desalination is a process in which high pressure feed-water is forced through a semi-permeable membrane. The membrane filters out bluedissolved salt ions, resulting in two separate products: low TDS product water and high concentrate brine [5]. Recovery of low TDS product water ranges from 50% to 90% depending on water quality and operating conditions [6]. Reverse osmosis is currently the world’s leading technology for new desalination installations and has developed an 80% share of current desalination plants worldwide [7]. Additionally, RO desalination is an electricity-driven process and therefore can be viably integrated with wind- or solar-generated electricity.
Brackish groundwater is an abundant resource in Texas and one for which there is less competition than there is for fresh water because treatment is required before municipal, agricultural, or industrial use. The Texas Commission on Environmental Quality has established a primary standard for TDS at 500 mg/L and a secondary standard at 1000 mg/L for municipal use while groundwater containing TDS up to 3000 mg/L can be used for irrigation [4]. There are currently 46 municipal brackish water desalination plants in operation throughout Texas, 12 of which treat surface water while the remaining 34 use brackish groundwater as a feed source. Reverse osmosis is the primary desalination technology, used in 44 of the 46 desalination plants in the state of Texas [4]. Desalination of brackish groundwater is a growing water-supply option in the state, with a design capacity that has increased from 104 million cubic meters per year in 2005 to 166 million cubic meters per year in 2010 [8].
Strong recommendations to expand desalination practices in Texas have been indicated by the Texas Water Development Board (TWDB). By the year 2060, the Board projects a 22% increase in water demand and 10% decrease in water supply [9]. To meet this growing water demand, TWDB has suggested increasing brackish groundwater desalination capacities to 224 million cubic meters per year by 2060, accounting for approximately 2% of all recommended water management strategies [4].
There are a number of challenges associated with desalination that can limit implementation. For inland desalination plants, brine disposal is an environmental and economic concern. Current options include wastewater or surface water discharge following treatment, land application, deep well injection, evaporation ponds, and zero point discharge [10]. The major challenge, however, is the high energetic requirement of desalination. Desalination consumes approximately ten times as much energy as typical surface water treatment [6]. This significant energy requirement can be environmentally detrimental by driving up reliance on fossil fuels and increasing carbon dioxide emissions. Additionally, meeting energetic requirements can be costly to plant operators and are typically the single largest expense of desalination facility operations. Electricity costs of RO desalination typically comprise of 30% to 50% of total desalination operational expenses [11]. While desalination of brackish groundwater offers a promising means to meet increasing water demand, challenges associated with the high energy requirement of this process must be considered.

2.2. Wind-Powered Desalination

The United States wind power industry is growing rapidly. Adding 13.1 gigawatts (GW) of new capacity and bringing in an investment of 25 billion dollars in 2012, the installed wind power capacity in the U.S. rose to 60 GW [12]. These additions made wind power the largest source of electrical-generating capacity additions in the country. Wind power constituted 43% of new power additions in 2012 to overtake natural gas as the leading source of new capacity for that year [12]. Figure 1 indicates that the the growth in wind power has been a long-term trend over the past decade, as energy planners hope to diversify power sources, limit reliance on fossil fuels, and curb carbon emissions.
Figure 1. Annual and cumulative wind power added in the United States [13].
Resources 04 00227 g001
Despite the rapid growth of wind power in recent years, the inherent variability of wind limits this technology. Daily and seasonal fluctuations in the availability of wind power prohibits plant operators from using wind power on a dispatchable basis to meet demand as they do with conventional power plants. An additional complication is that the diurnal and seasonal variability of inland continental wind mismatches demand [14]. When electricity demand peaks during the afternoon, inland continental wind speeds are typically weak. When electricity demand decreases at night and in the early morning, inland continental wind speeds peak. Similarly, inland continental wind speeds are weakest during the summer, when electricity demand is highest, and strongest during the winter and shoulder months, when electricity demands are typically lower [14]. Fluctuations in wind power availability that mismatches demand creates challenges in integrating wind power to the grid for policy makers in the energy sector, who have indicated a pressing need for the development of storage technologies [15]. A possible solution to these challenges is to dedicate wind power to a time-flexible process, such as water treatment. Desalination is a process that can be operated intermittently, a characteristic that makes it conducive to integration with wind power. In essence, desalinated water could act as a proxy for storing wind energy. Additionally, when wind power generation is above the requirement for desalination, wind-generated electricity can be sold to the grid. When wind power is below the requirement for desalination, electricity can be purchased from the grid to power the water treatment process. This idea provides a solution to the intermittency of wind-power availability and to problems associated with the high energy intensity of desalination.
Wind-driven desalination has been investigated since the 1980s when installation projects began in Europe. Development began in Ile du Planier, France starting in 1982, comprising of a 4 kW turbine used to desalinate seawater [16]. While the majority of wind-driven RO desalination systems treat seawater, there have been a few investigations into wind-powered brackish groundwater desalination. A current demonstration project in Seminole, Texas is investigating wind-powered RO desalination of brackish groundwater from the Ogallala aquifer. The required power in this project is supplied by a combination of grid-electricity and electricity generated by a 50 kW wind turbine [11]. The operational analysis of this demonstration project is still to come at the time of writing this paper, however, the project indicates the technical feasibility of wind-powered RO desalination of brackish groundwater. Additionally, research into the economic feasibility of these systems has indicated that wind-powered desalination can be cost competitive with stand-alone desalination facilities in regions with strong wind resources high electricity costs [17].
Due to the inherent variability of wind-power production, the majority of wind-driven desalination projects and operations include battery storage or backup power by alternative sources such as a diesel generator. Studies exist that have investigated the possibility of combining wind-power with grid-electricity to drive the desalination process [18,19]. This possibility offers a potential solution to the intermittent nature of wind power. Recently, studies have investigated a configuration in which a desalination facility and wind farm are grid connected. Electricity purchased from the grid can potentially drive desalination during hours when wind-power is not available. Additionally, including an on-grid wind farm enables the facility to sell electricity to the grid during times when it is economically attractive to sell wind-generated electricity rather than use it for desalination. Grid-connected wind desalination was determined to be economically feasible in a study by Clayton, Stillwell, and Webber that investigated integration of desalination with wind-power in a grid-connected configuration [3]. One of the goals of this investigation is to expand on work conducted in that analysis by adding an investigation of integrating both wind and solar power with RO desalination.

2.3. Solar-Powered Desalination

Similar to the wind power industry, the solar power sector is experiencing rapid growth as indicated by Figure 2.
Figure 2. United States cumulative installed photovoltaic (PV) solar capacity [21].
Resources 04 00227 g002
Like wind power, solar power faces challenges associated with variability. Although solar-power production more closely matches demand than wind, operators nonetheless experience challenges with integrating solar power with the electricity grid due to daily and seasonal fluctuations. Specifically, solar insolation captured during off-peak morning hours is often of low value due to limited energy demands in the early morning [15]. A possible solution to this challenge is to use low-valued solar power for a time-flexible process such as water treatment by integrating solar power with desalination. During off-peak hours, solar-generated electricity can power the desalination process, enabling the treated water to act as a storage proxy for solar energy. When energy demand and electricity prices rise, the higher-valued electricity generated from the solar farm can be sold to the grid. Coupling solar power with desalination can advance the implementation of solar-power technology by providing a use for electricity generated during off-peak hours.
For desalination applications, electricity generated from a solar farm can be used to power pumps that develop the high pressure needed to force feedwater through the semi-permeable membrane used in the desalination process. Investigation into solar-powered desalination has been conducted since the 1970s and demonstration projects were developed as early at 1978 [22]. Since this time, there have been a number of demonstration units and small-scale plants implemented. However, projects have been limited to supplying relatively modest amounts of product water, with the largest plant producing approximately 75.7 cubic meters per day [23], a small fraction of the product water supplied by municipal desalination plants in the United States.
Despite a general decreasing trend in the cost to produce desalinated water using solar energy, PV-powered RO desalination is not yet cost-competitive with conventional desalination plants that use energy from the grid [24]. The majority of solar-powered desalination projects are designated to remote regions where grid electricity is not available. Additionally, most current PV-powered RO operations require battery storage of electricity in order to provide energy during hours when solar power cannot be produced.
An integrated solar power/desalination facility that is connected to the grid could potentially supply fresh water and renewable power without the need for battery storage. A grid-connected system provides the opportunity to use either solar-generated electricity or electricity purchased from the grid to power desalination depending on times of day when each option is economically attractive. An on-grid PV system additionally allows the integrated facility to sell electricity to the grid during hours of peak electricity demand, when electricity prices are high. Grid-connected solar-powered desalination can potentially offer an economically attractive opportunity for an integrated facility to generate revenue from both water production and electricity generation.

2.4. Wind/Solar-Powered RO Desalination

Hybrid systems in which wind and PV solar energy are used to power desalination have been investigated for quite some time. Providing a combination of wind and solar energy can be advantageous because power availability from these sources often occurs during different times of day. As discussed previously, solar power typically peaks in the afternoon while the highest wind speeds occur during the night in many regions. Additionally, solar insolation is strongest during summer months, while more wind power is typically generated during the winter than during summer. Hence, power generated from wind and solar technologies do not match one another on a daily or seasonal basis. Power from wind can be used during certain times when solar power is not available and vice versa. The diurnal and seasonal variability of wind and solar power is conducive to combining these renewable energy technologies.
Successful operation of a hybrid wind/PV solar RO desalination unit has been reported in some arid and isolated regions. Daily production of 3 cubic meters has been maintained in an Israeli demonstration project that desalinates brackish groundwater using a combination of PV solar and wind power [25]. This unit included two-day battery storage by a backup diesel generator for times when wind and solar power could not generate sufficient electricity for desalination. From this investigation and similar ones, it is clear that backup power would be necessary due to the intermittent nature of wind and solar power.
Additional considerations regarding wind and solar powered desalination include capital and operational costs as well as the potential for energy recovery. These considerations were analyzed by Zhu et al., (2010) is a an analysis focusing on optimizing specific energy consumption [26]. Results from this analysis provide context and important considerations for the study of desalination powered by renewable energy. However, capital and operational costs as well as the potential for energy recovery are beyond the scope of this work. The analysis discussed here focuses on operational profiles and potential revenue.
Possible extensions not included in this analysis are the potential for energy storage through battery technology and different energy systems such as biofuels for off-grid cases. There are advantages and limitations to energy storage for desalination that have been recently analyzed [27]. Likewise, additional energy sources such as biofuels and biogas have been studies for off-grid membrane desalination in a number of applications [28]. While these considerations are important to the field of renewable power and desalination, the focus of the analysis discussed here is limited to wind and solar-powered desalination without energy storage. Future work may incorporate additional energy sources and storage potential.

2.5. Photovoltaic Thermal System Used for Reverse Osmosis Desalination

2.5.1. Photovoltaic Thermal Solar Technology

In recent years, there have been substantial research developments regarding photovoltaic thermal (PVT) solar technologies as a way to improve the efficiency of harnessing solar energy. These systems are a combination of photovoltaic and thermal solar components that can produce both electricity and heat for useful purposes. Though many collector types have been investigated, air or water is often used a heat collector in these panels [29]. 
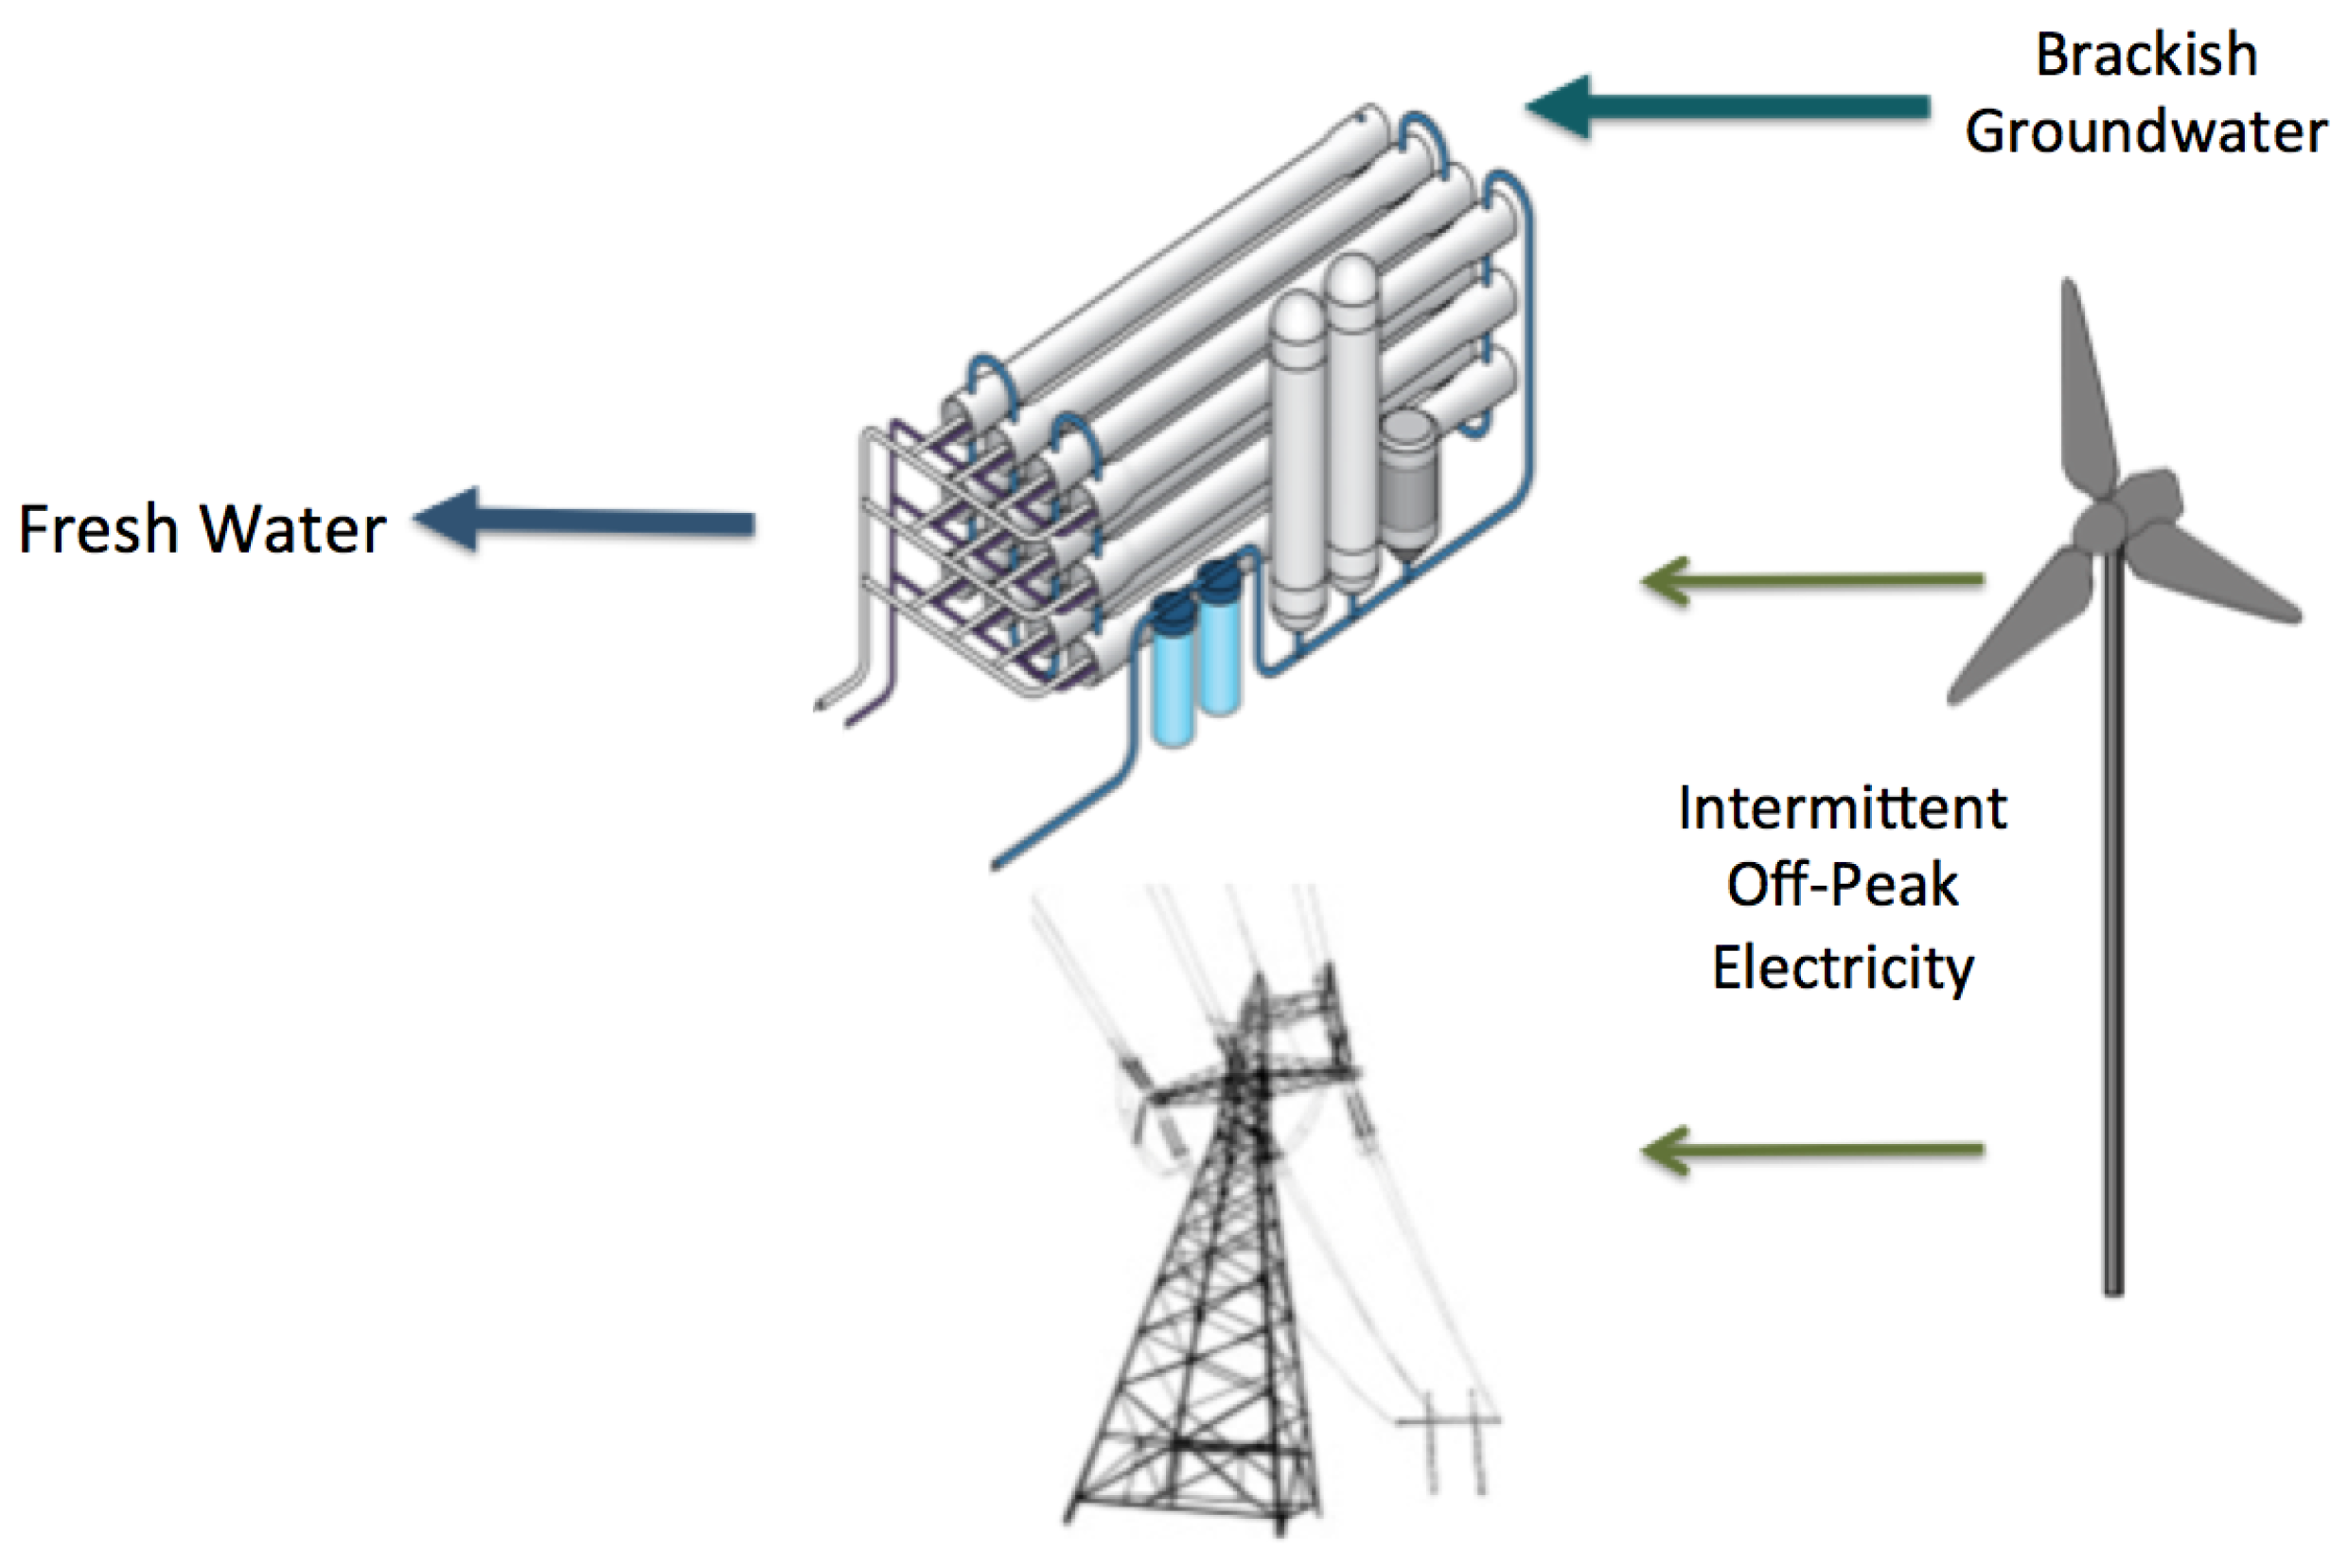
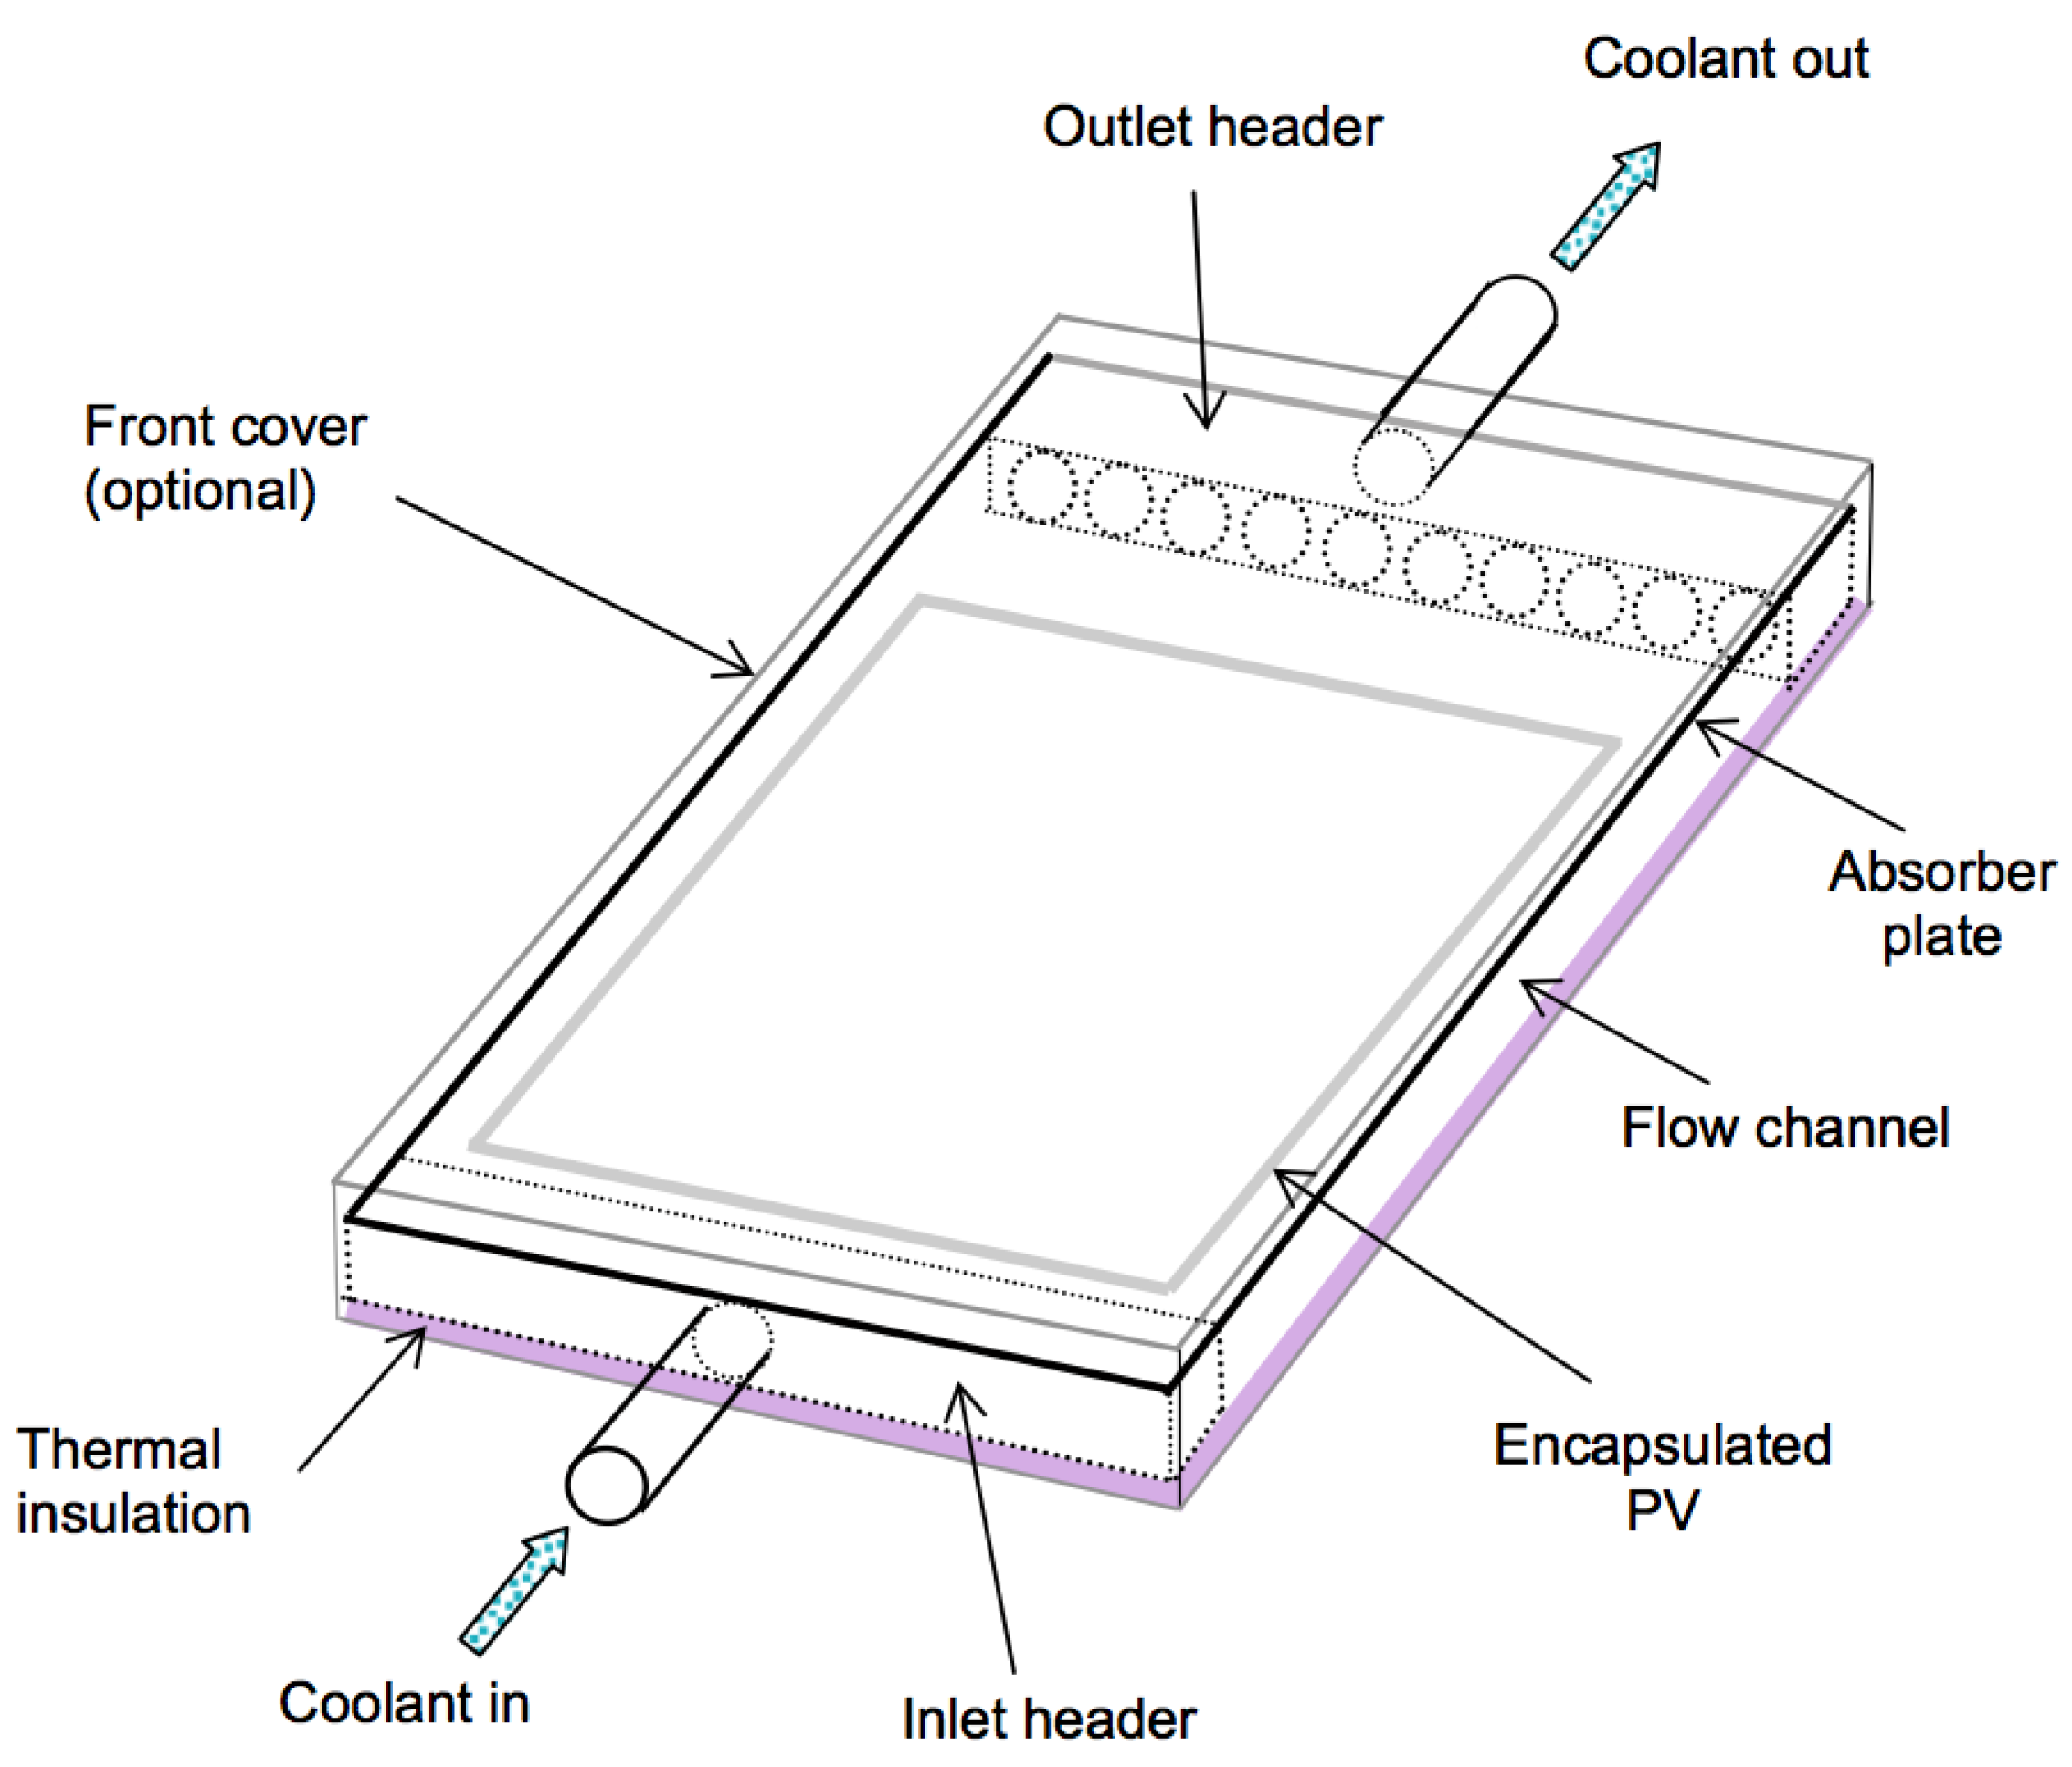
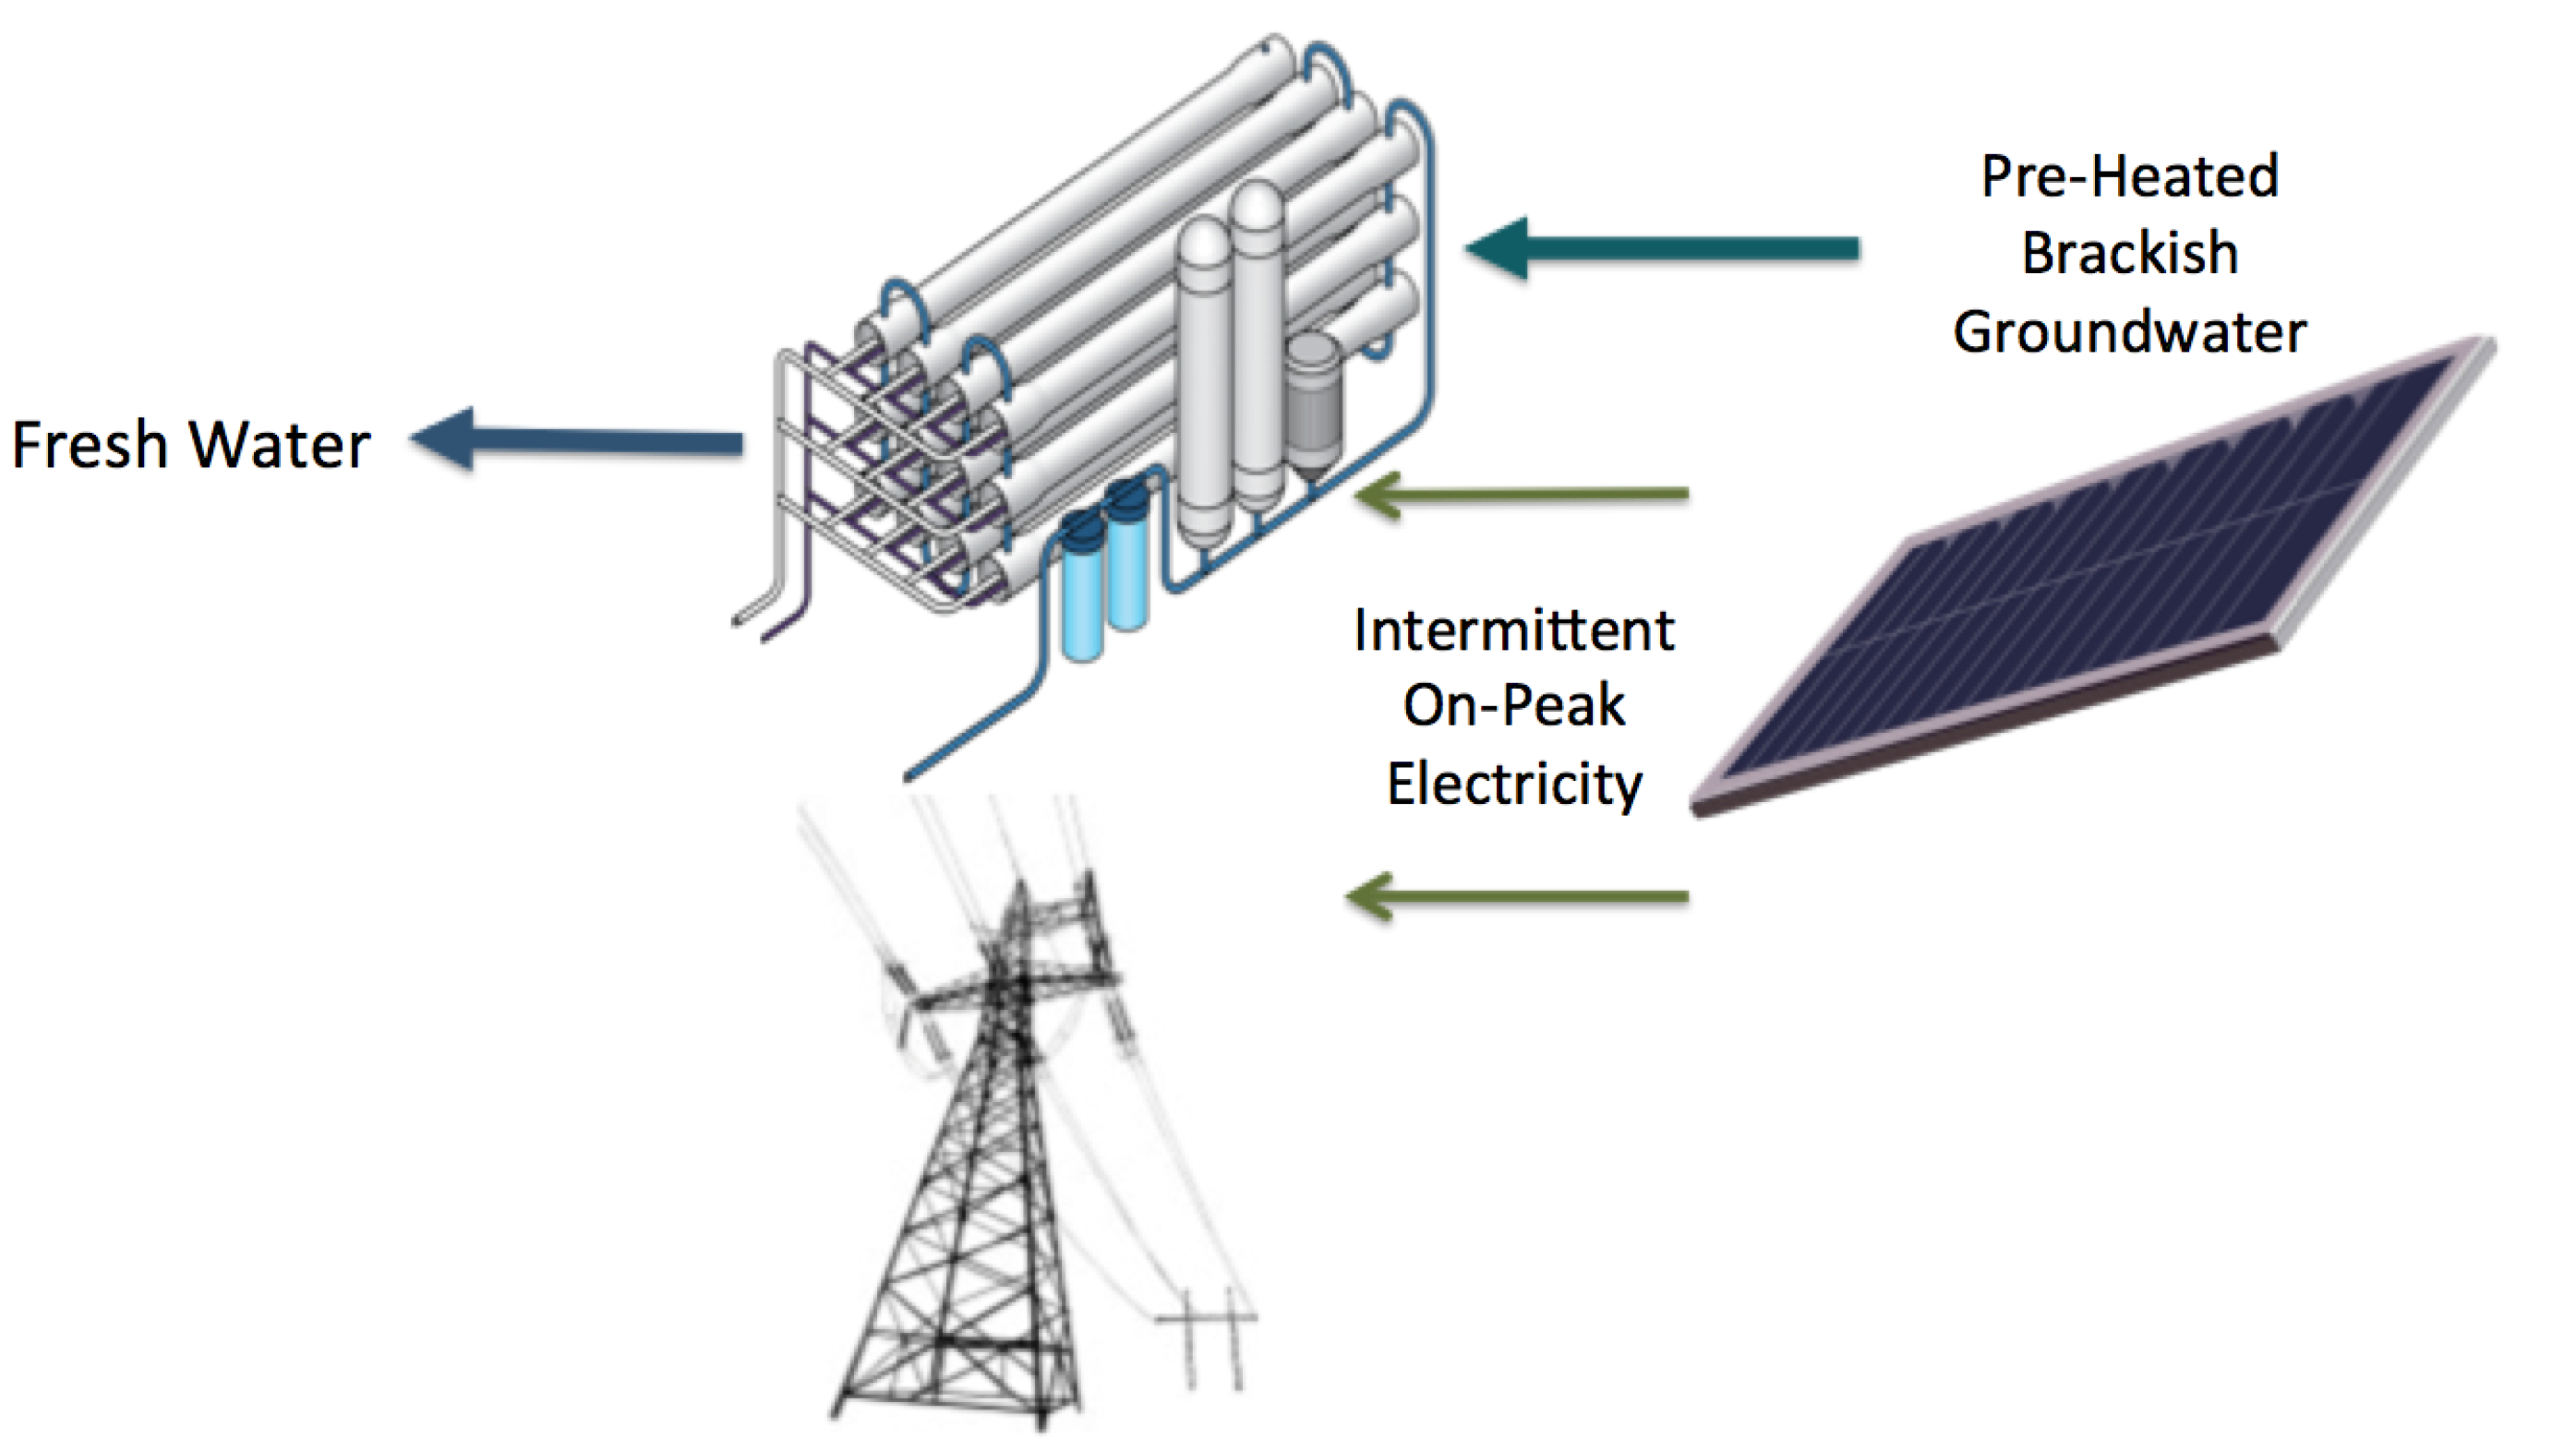
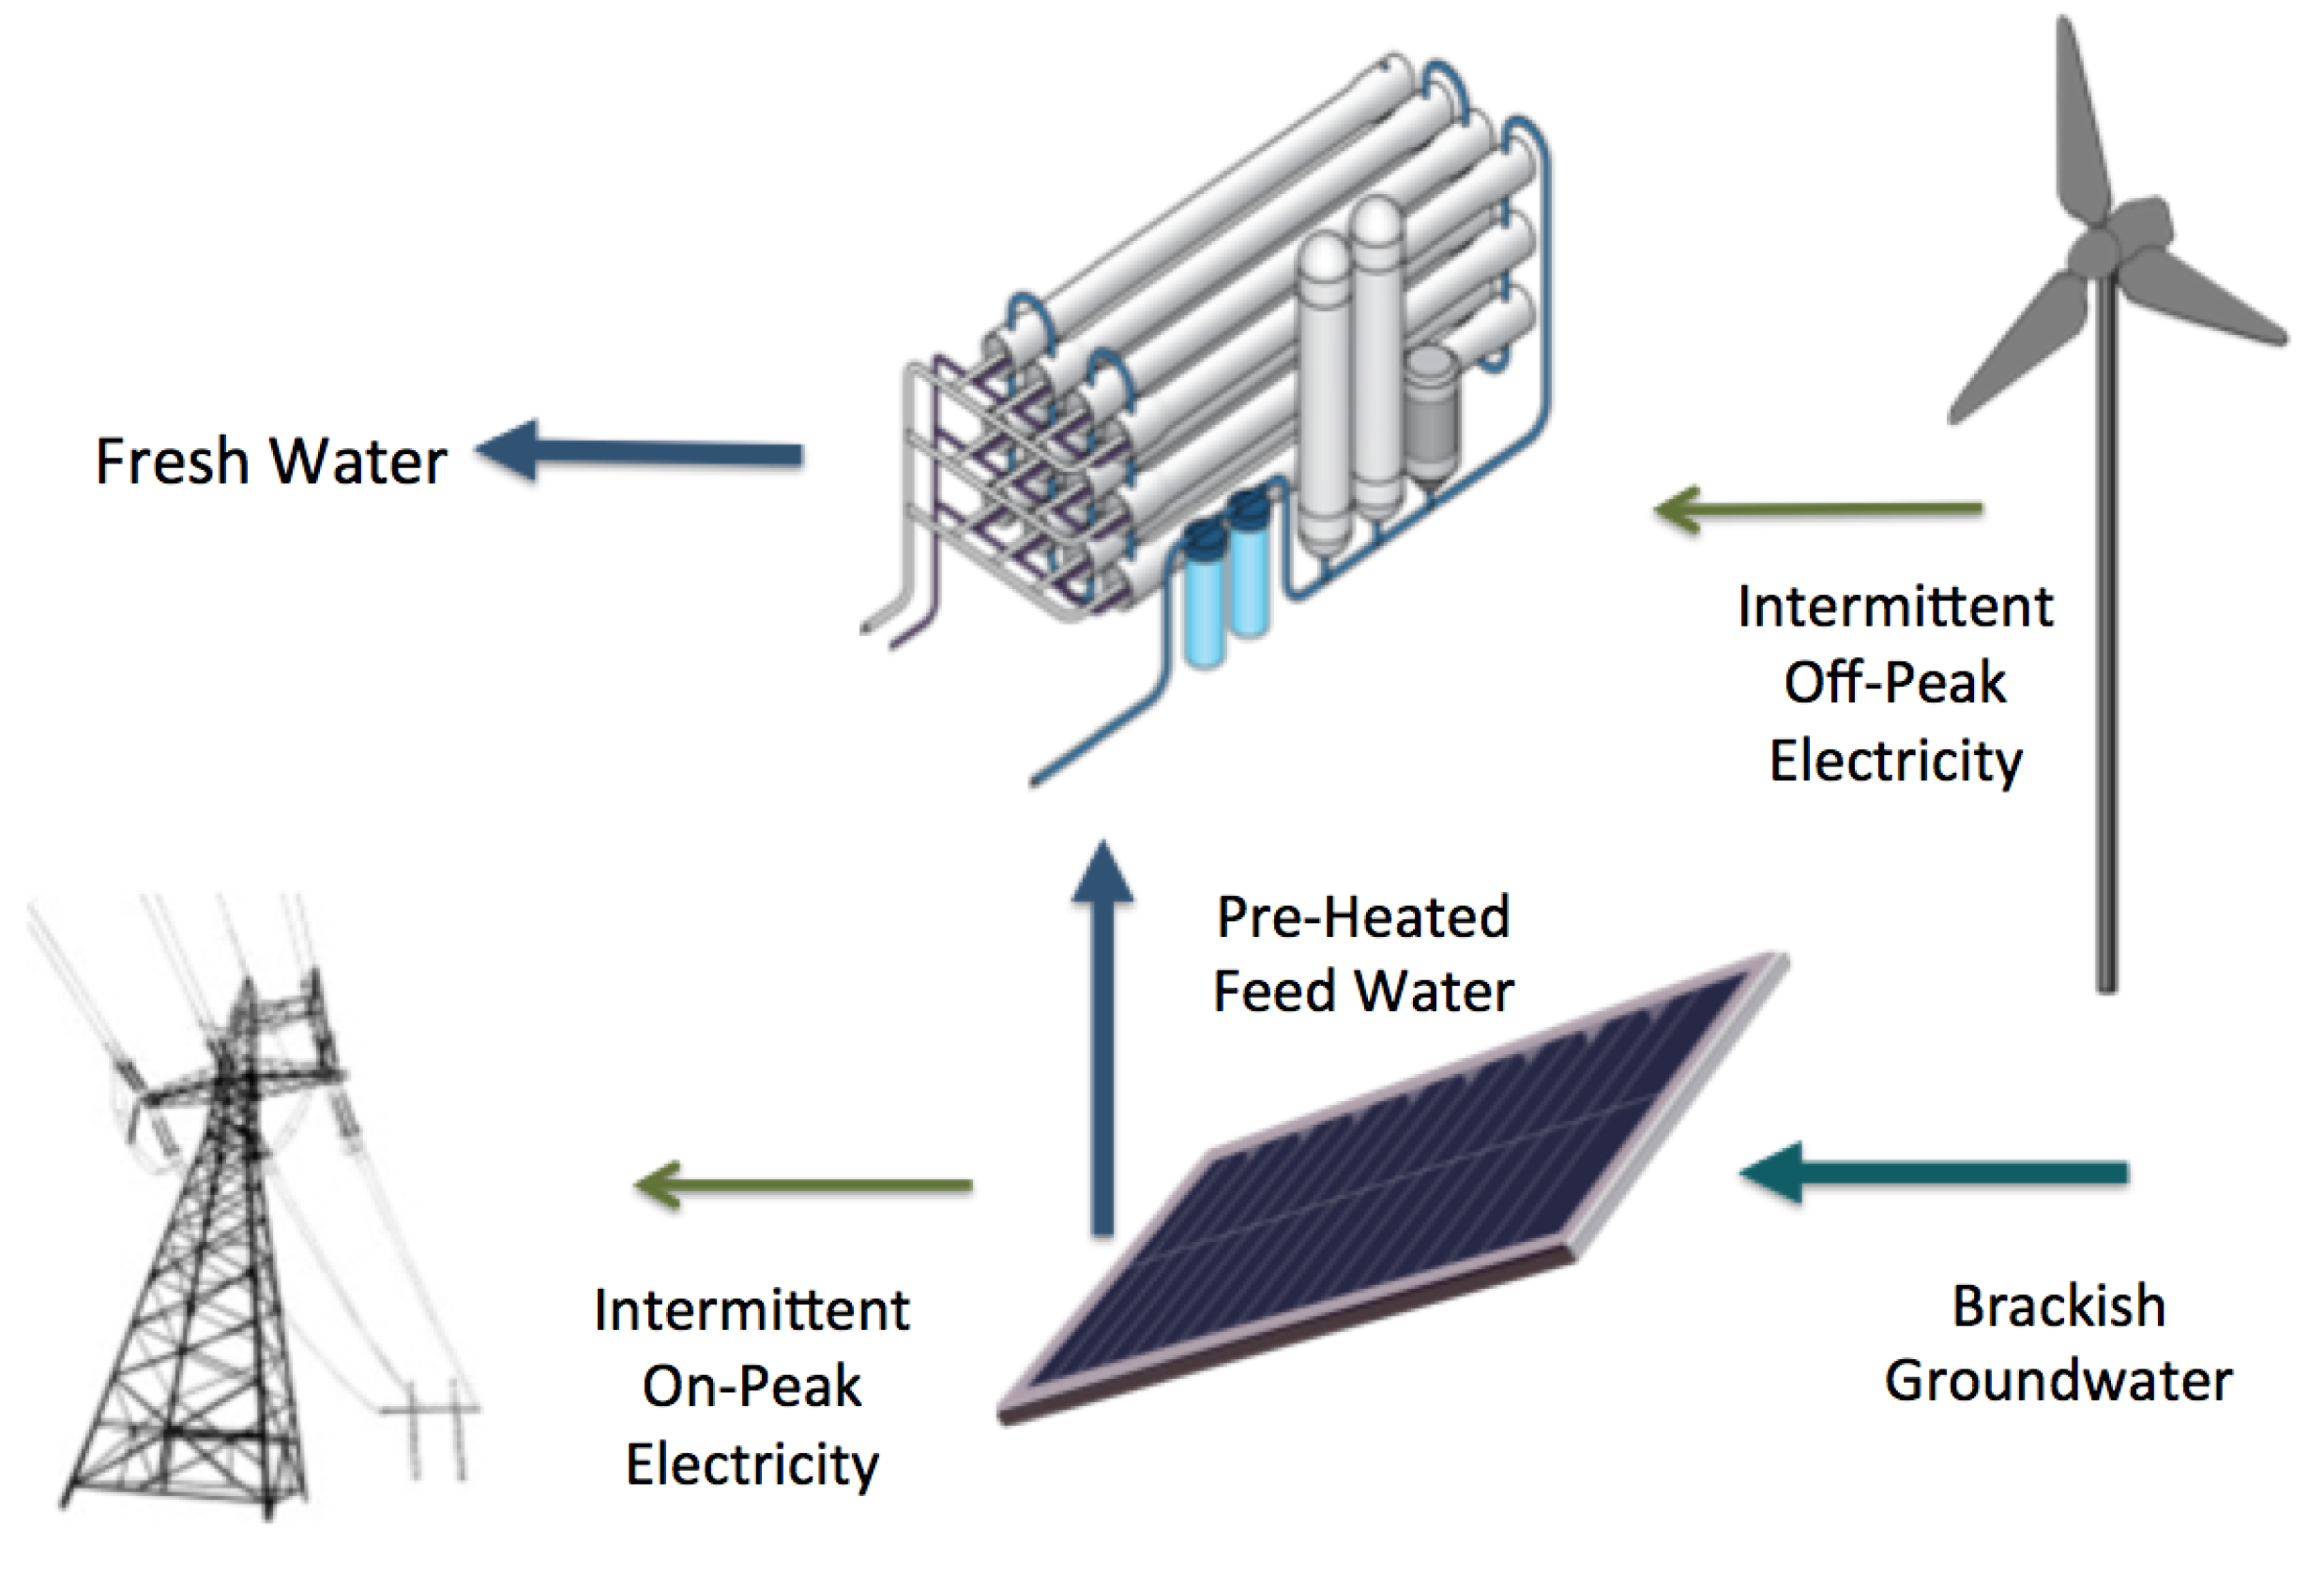
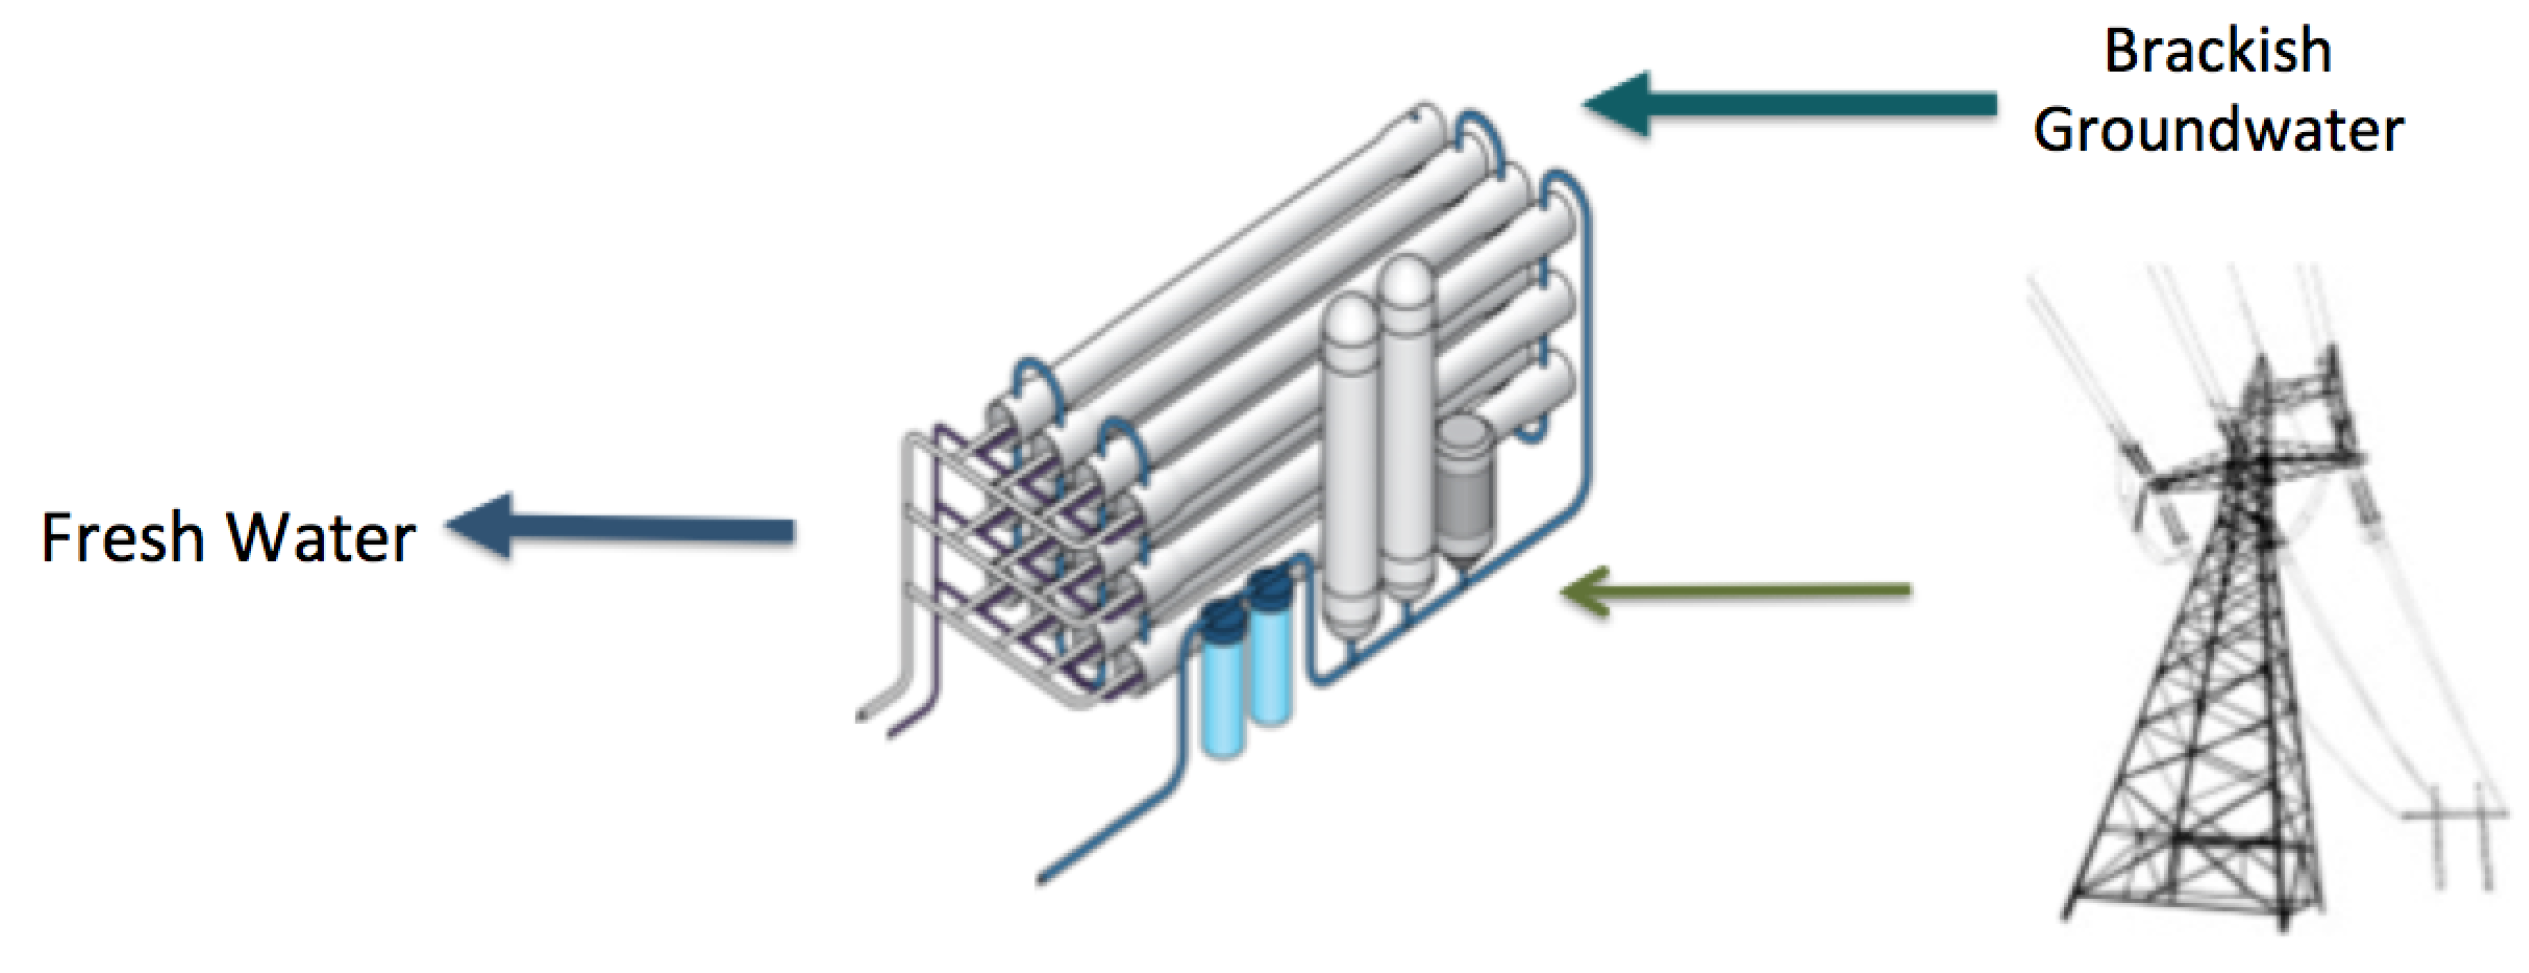
Figure 3 displays a typical configuration of a flat-plate PVT solar panel. These systems include an enclosed PV model that is cooled by a working fluid entering one end of the panel and leaving through the opposite end. For the analysis discussed in this investigation, brackish groundwater is considered as the PVT module coolant.
Figure 3. Configuration of a flat-plat photovoltaic thermal (PVT) panel [29].
Resources 04 00227 g003
Traditional PV panels convert only 5% to 18% of incoming solar insolation into electricity [30]. A majority of solar energy is converted to heat, raising the temperature of the solar cells. Studies have indicated a significant correlation between the PV module temperature and the efficiency of solar energy conversion into electricity. As the temperature of the PV panel increases, efficiency of energy conversion to electricity declines [30,31]. By cooling the solar panels, the efficiency of electricity production can be improved. A PVT solar system, compared to a traditional PV system, can significantly enhance solar power production by limiting the temperature increase of the panels.
Additionally, heat extracted from the solar panels by the coolant can be resourcefully reused. For instance, a European company, Solimpeks, has developed PVT panels cooled by water, in which the hot water leaving the solar panels is used for domestic purposes. The company suggests that its PVT panels are significantly more efficient than typical PV solar systems due to the cooling mechanism. The advertised efficiency of solar energy conversion to electrical power is 25%, more than 50% greater than that of non-cooled PV solar panels [32]. Although there has been extensive research regarding PVT solar panels over the past decade, applications for heated water using this technology are still very limited [29].
Studies have been conducted regarding PVT solar modules for desalination using processes other than reverse osmosis. For instance, the use of “waste heat” for Multiple Effect Evaporation (MEE) has been investigated and simulated by researchers in Israel [33]. MEE systems utilize heat for an evaporation process in which water is separated from solids in a multi-stage system. The process allows for relatively high operating flexibility and short start up time, making it conducive to meeting water demand efficiently [34]. Researchers suggest that power generation from the combined PVT-desalination process can outperform that of conventional solar farms [35]. Additionally, under specific circumstances, these studies suggest that PVT-MEE desalination can be cost competitive with conventional desalination [33].
The investigation discussed in this paper considers a design in which brackish groundwater is used to cool the panels of the modeled solar farm. Research over the past couple of decades has accelerated improvements in PVT systems that have drastically increased the thermal and electrical efficiencies of these modules [36]. Integrating desalination with solar power offers a potential application for new and exciting PVT technologies. Brackish groundwater can be used in a PVT system to cool solar panels and collect PVT “waste heat”. This configuration is possible because brackish groundwater is typically at a relatively cool temperature compared to the solar panels. By incorporating a design that includes PVT solar modules, the temperature difference between the cool brackish groundwater and the hot solar panels can be used to an engineering advantage to improve the efficiency of solar power production. Using brackish groundwater as a coolant in the PVT system prior to treatment can increase the percent of incoming solar insolation that is converted into electricity. As discussed in the following section, exchanging thermal energy between the brackish groundwater and the solar panels is also advantageous in the water treatment process. Additional implications of heating brackish groundwater prior to desalination should be considered in experimental studies of this technology. However, these additional considerations are beyond the scope of the systems analysis discussed in this paper.

2.5.2. Reverse Osmosis Feed Water Temperature

Recent studies indicate that raising the temperature of feed water in the RO process can reduce energetic requirements for treatment. As discussed previously, RO is a pressure-driven process in which a significant amount of energy is required to provide a high pressure to force feed water through a semi-permeable membrane. A feed pressure of up to 300 to 400 pounds per square inch (PSI) is required for brackish groundwater desalination [6]. However, research at the University of Texas at El Paso (UTEP) Center for Inland Desalination has indicated that the required pressure can be reduced if the water temperature is increased. These studies indicate that the specific energy required to drive the desalination process is reduced by 3.4% when feed water temperature increases from 25 degrees Celsius to 30 degrees Celsius [37]. By preheating brackish groundwater before RO treatment, it is possible to reduce the energy intensity of the process by limiting the pressure required to force water through the RO membranes.

2.5.3. Texas as a Testbed

This study focuses on Texas, although the methodology is applicable to other regions with available resources. As indicated previously, Texas is facing tough circumstances with respect to population growth and depletion of water resources. The 2012 State Water Plan has recommended increasing brackish groundwater desalination as a water management strategy and outlined a number of projects that can provide new water supplies through this process. While desalination may provide a means to meet water supply challenges, the potential increase in energetic requirements to collect and treat brackish groundwater are incongruent with goals to limit the reliance on fossil fuels and reduce carbon emissions. Additionally, municipalities are likely to experience undesirable increases in the cost of water treatment as a result of advancement in desalination activities. Given the State’s plan to install brackish groundwater desalination facilities, it will be prudent for Texas water planners to consider integrating these facilities with renewable power to mitigate unwanted increases in carbon emissions and electricity costs from the grid. Based on plans indicated by water managers across the state, Texas is a time-relevant location to choose for this investigation.
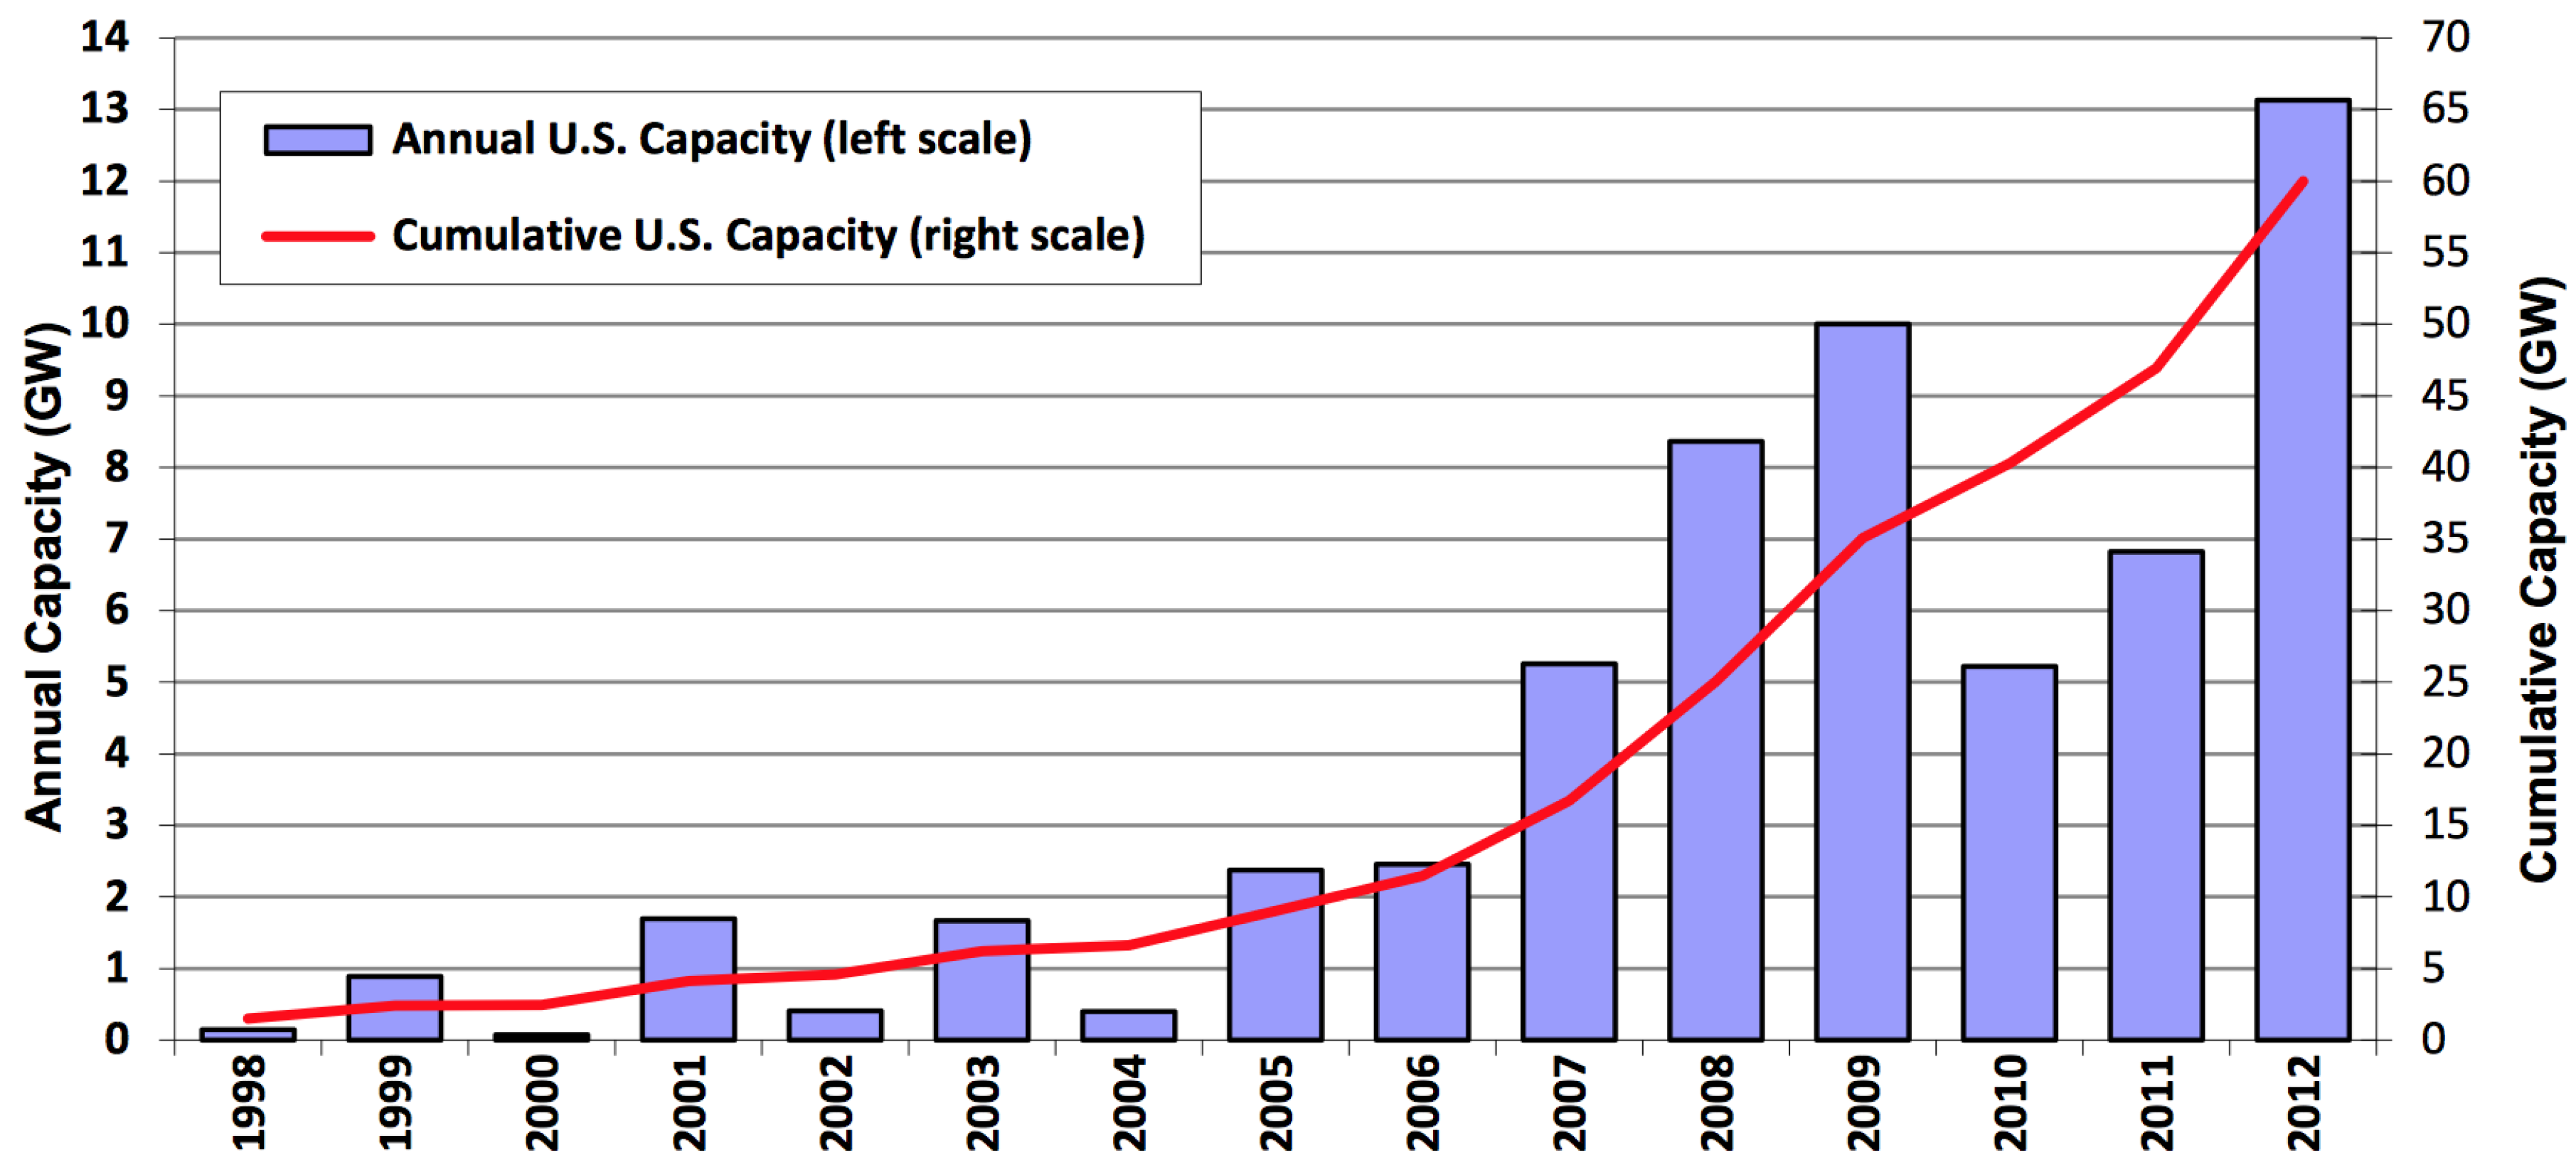
Additionally, the geographic availability of water, wind, and solar resources in Texas, make the state a feasible location for this analysis. Wind speeds adequate for generating power are prevalent in Texas and the state is the nationwide leader in wind power. Over 20% of installed wind capacity in the United States is in Texas, with 12,355 megawatts (MW) of the total 61,108 MW [38]. The wind power sector in Texas is growing rapidly, and the state installed more wind power capacity (1826 MW) than any other state in the year 2012 [12]. Additionally, Texas is the lowest cost region for installing wind power projects [
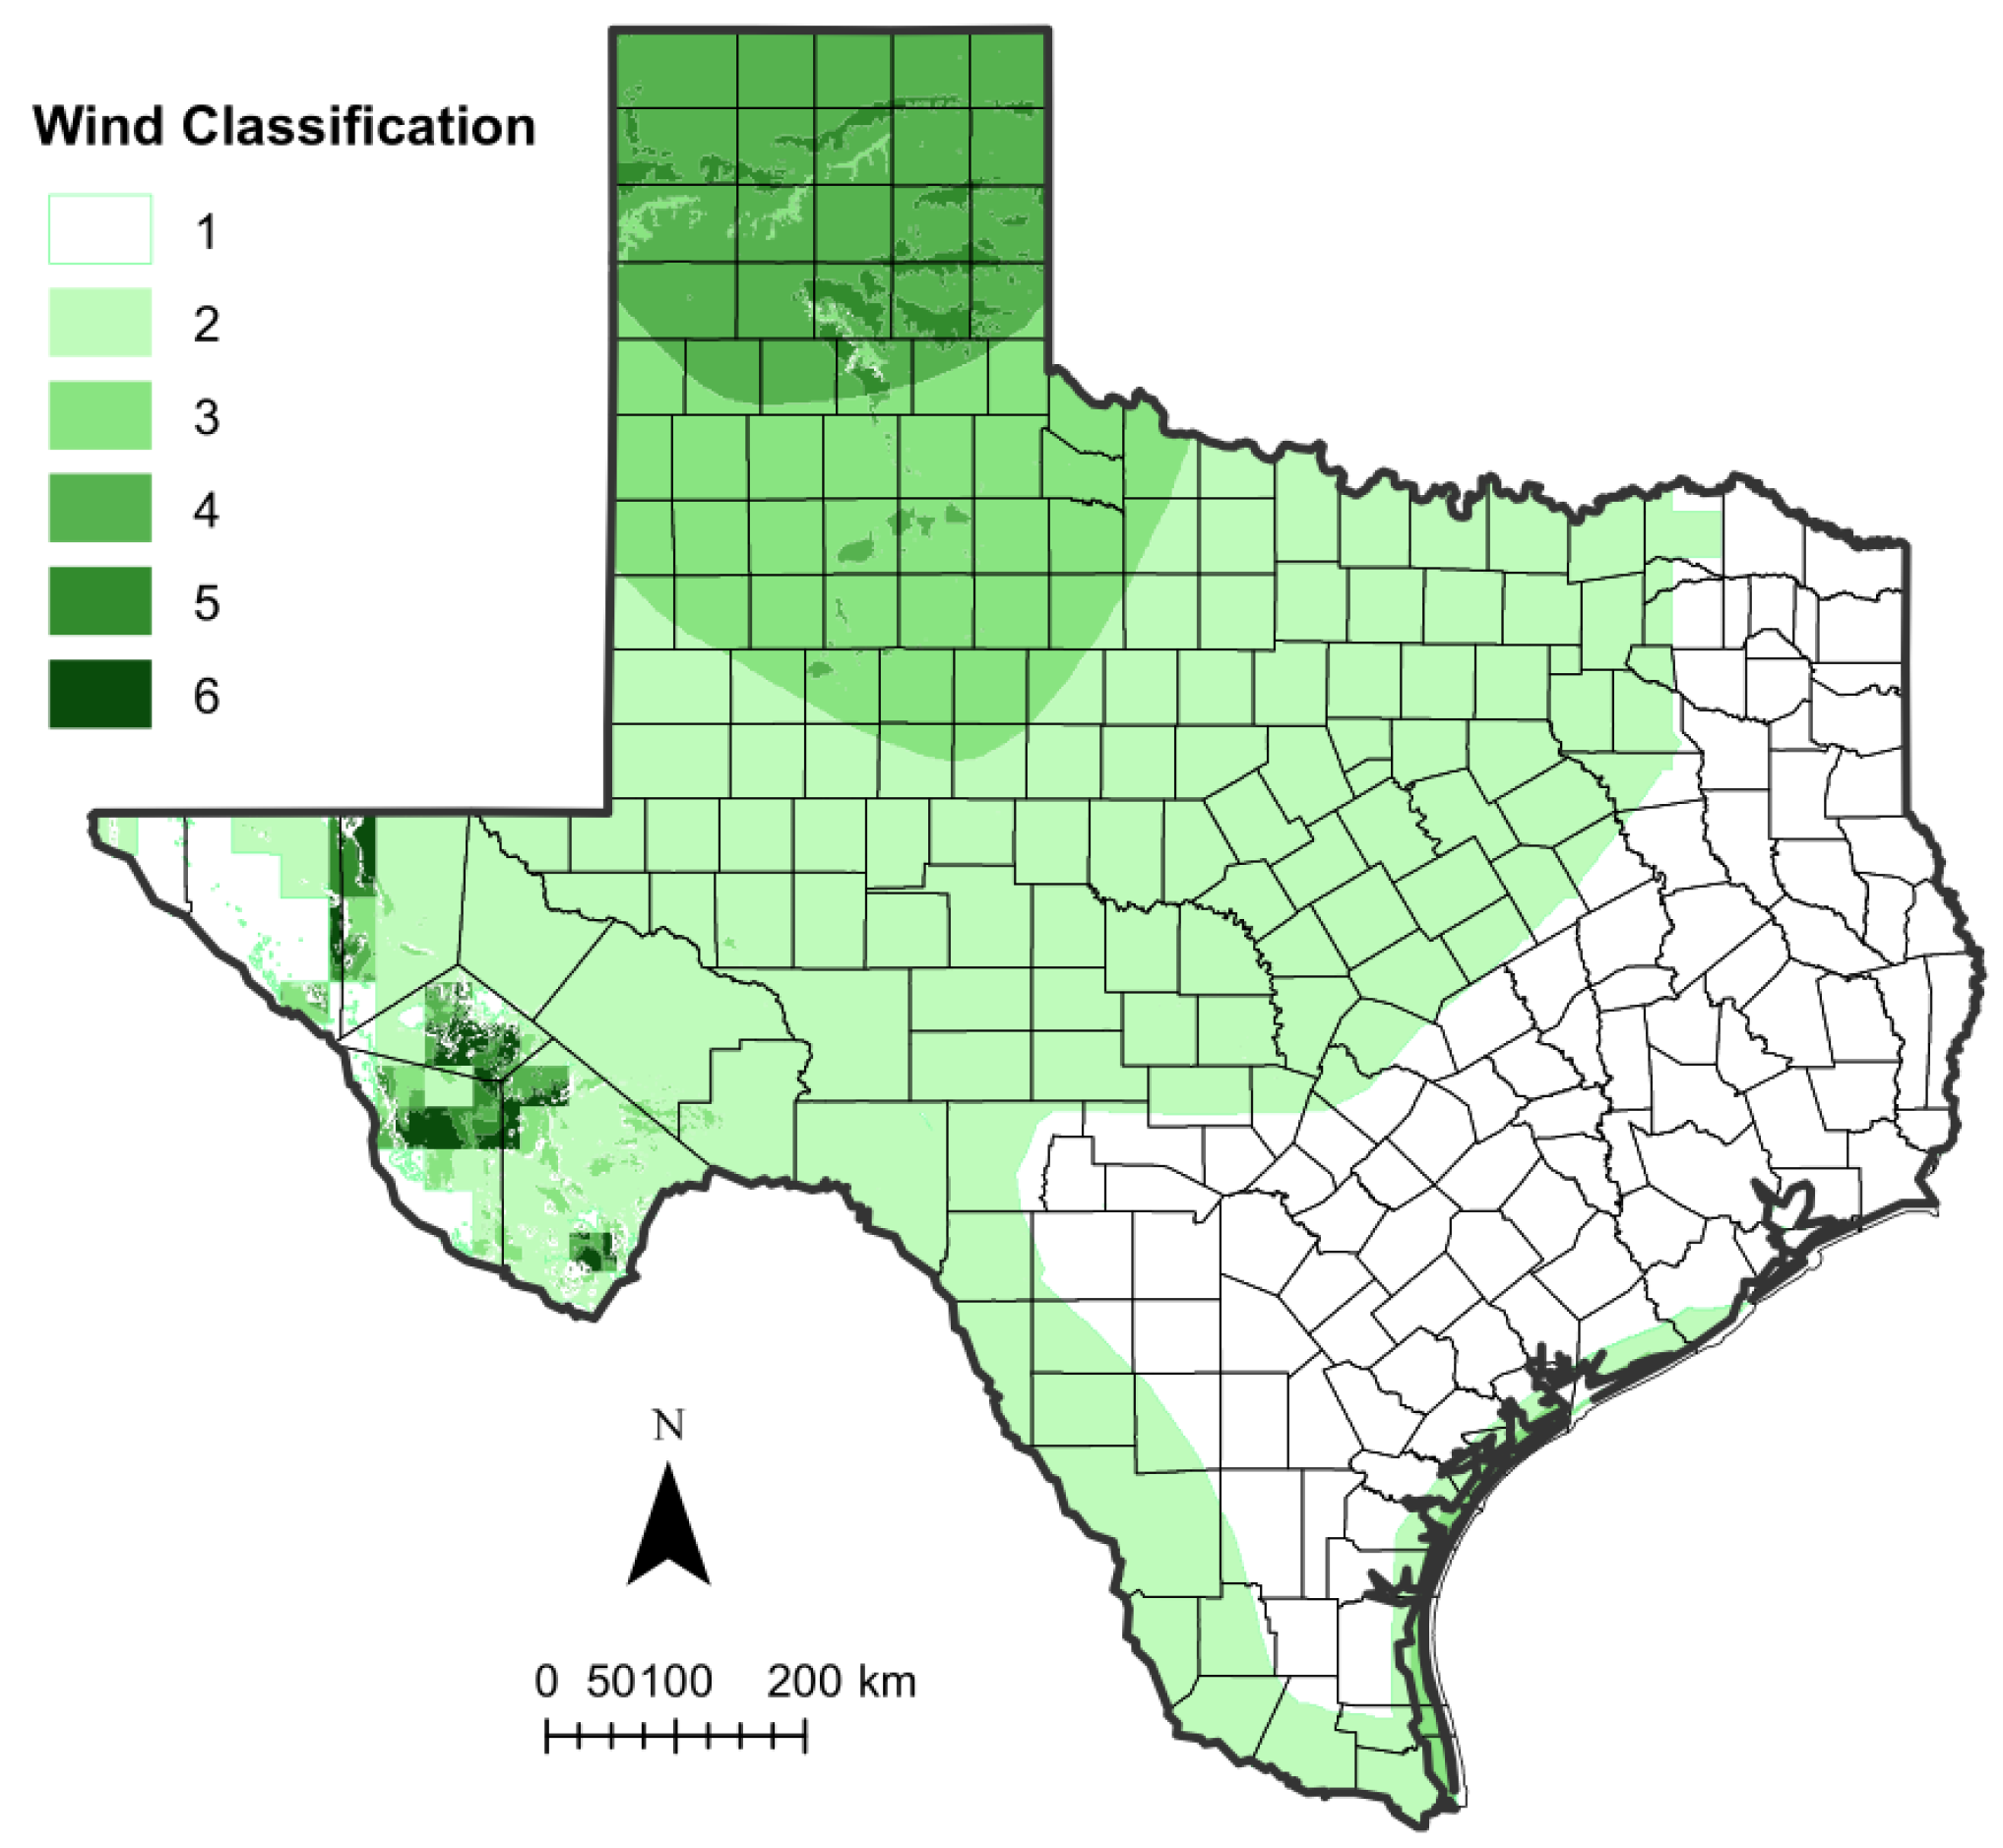
12]. Generally, a wind power classification greater than three is considered to be profitable for generating power from a utility scale wind turbine. As shown in Figure 4, regions of central Texas and the panhandle have wind classifications above this required threshold [3]. The availability of wind and the relatively low cost of installation compared to other states make Texas a conducive environment for the development of wind farms as means to meet the growing energy demand.
Figure 4. Geographic variability of wind classification across Texas [39].
Resources 04 00227 g004
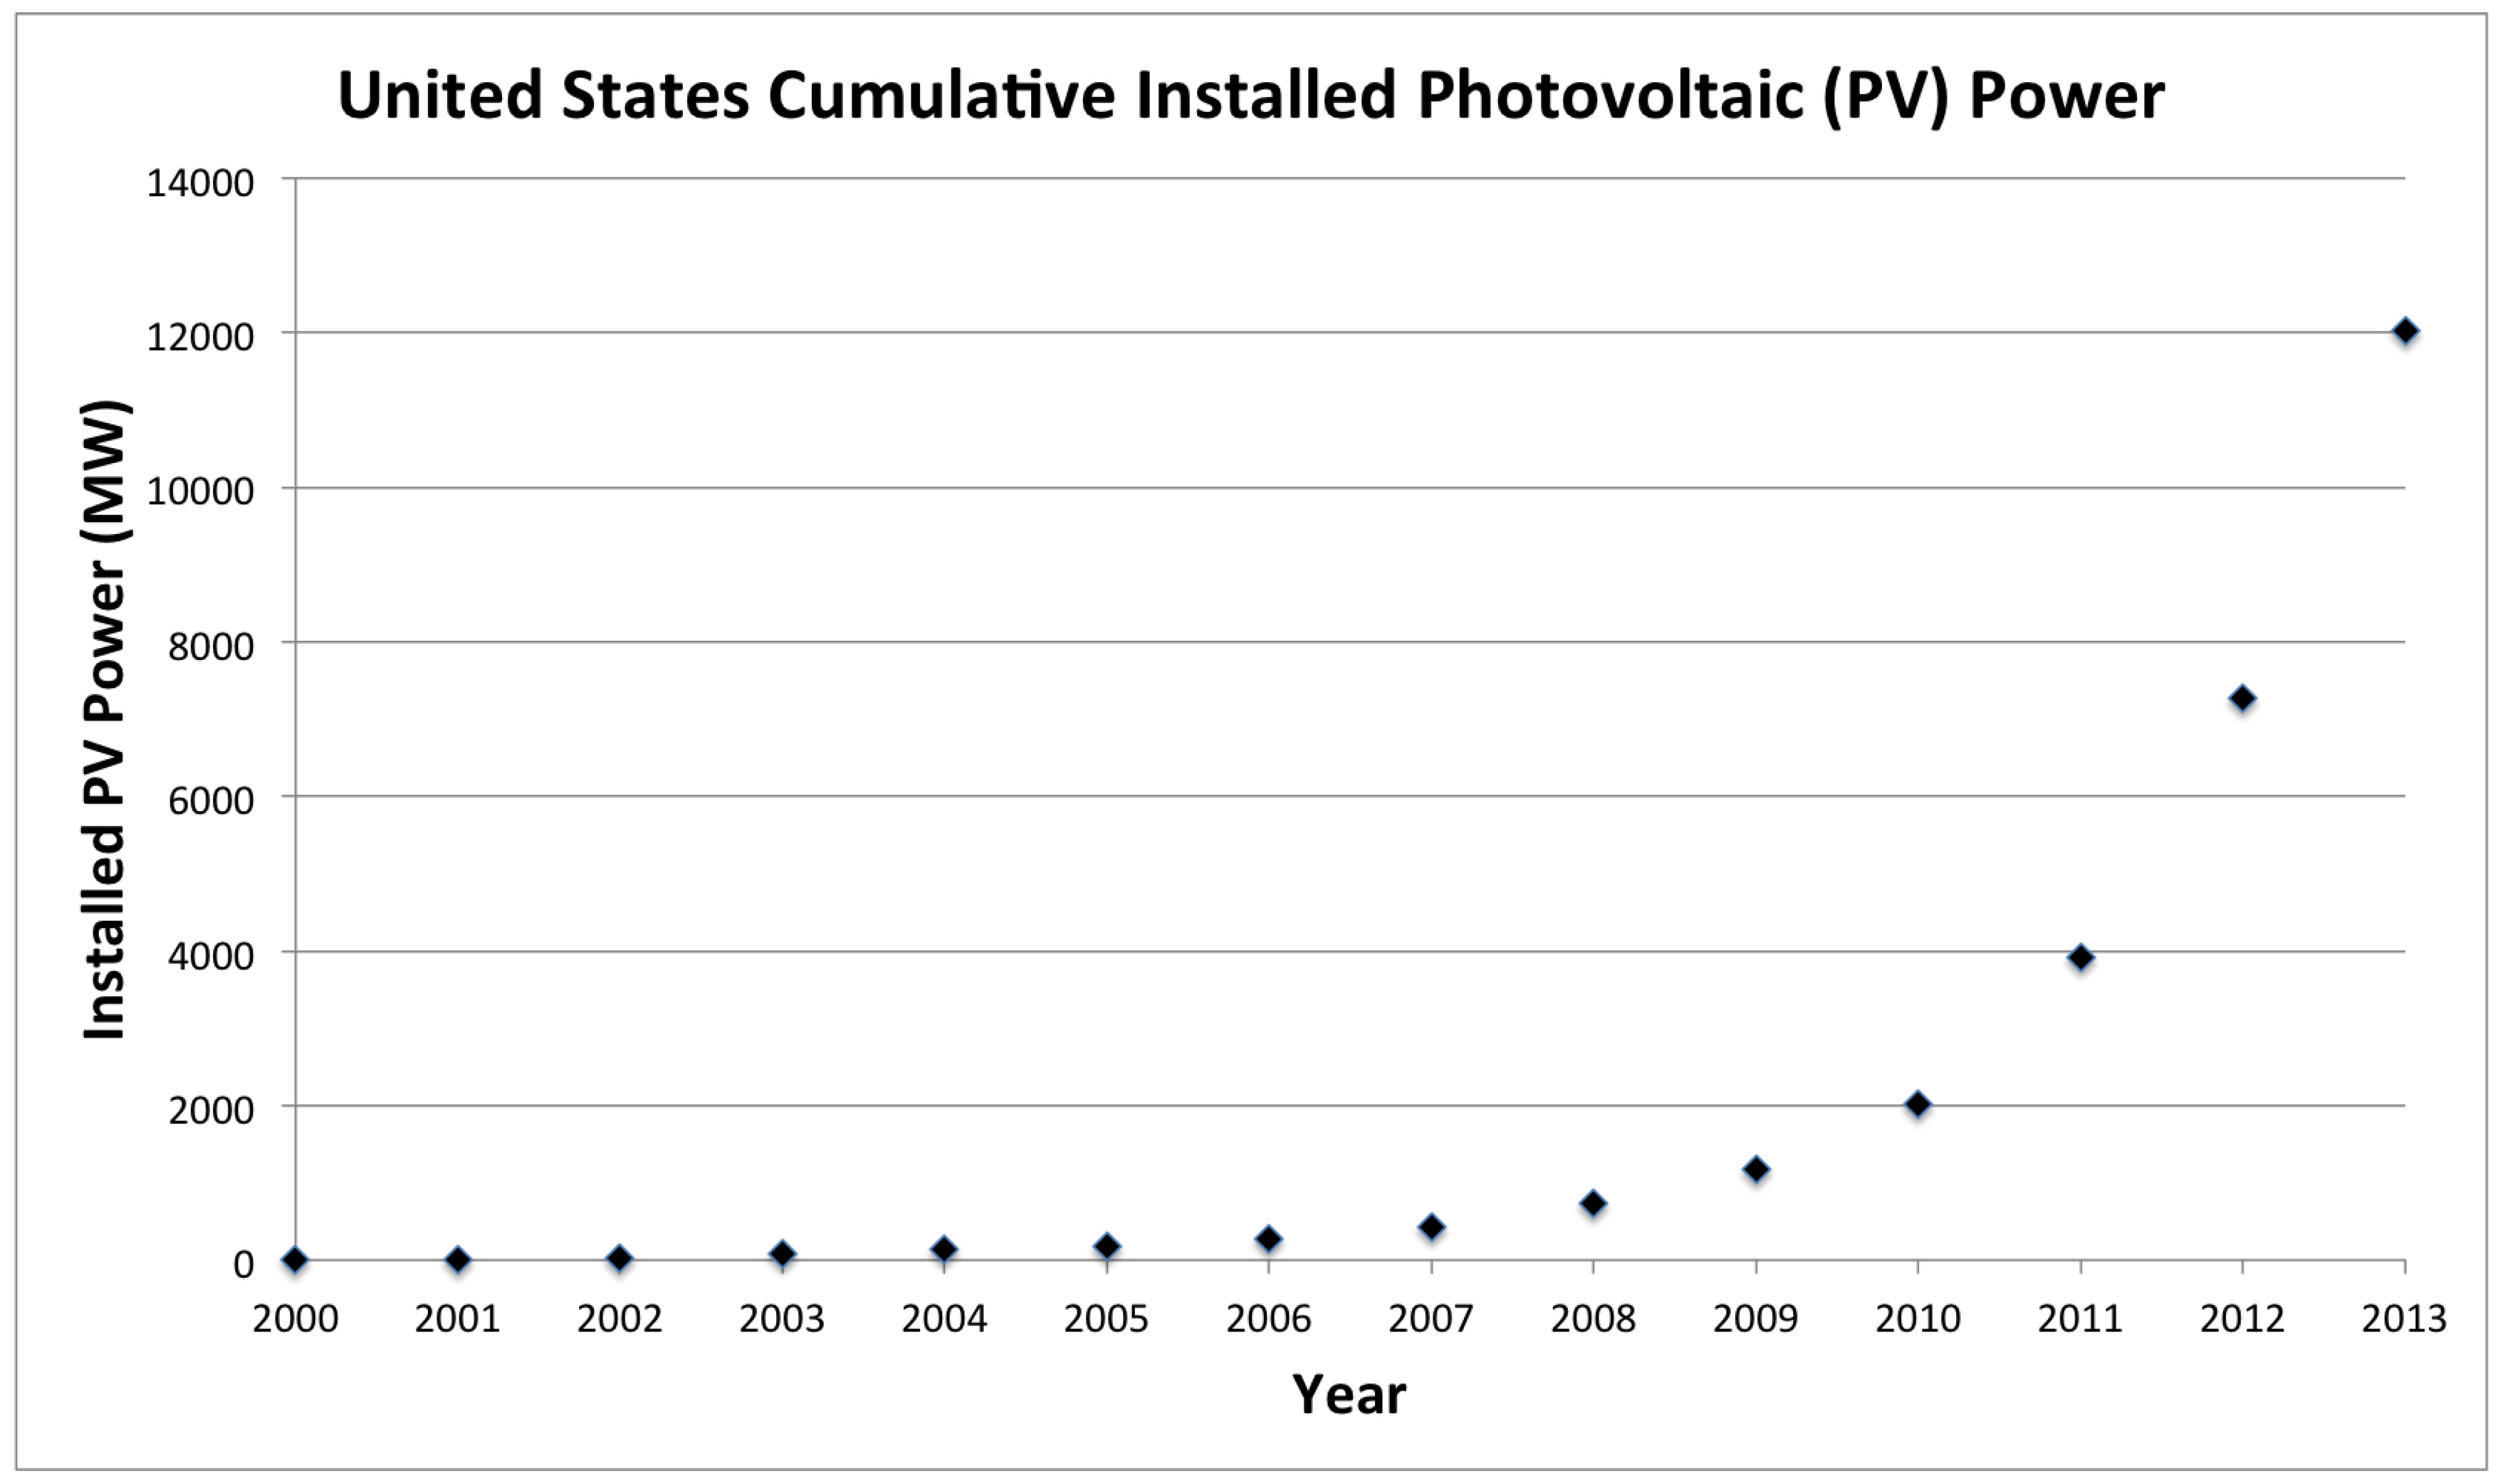
Texas is also an attractive region for the development of solar power. In a recent assessment of technical potential for PV solar power accounting for the prospective market, economic and technical considerations, and available resources, Texas was rated as the state having the greatest potential for utility-scale solar power [40]. While solar insolation is strongest in the west and central region of the state, there is technical potential for utility scale solar power throughout much of Texas as a result of available solar resources as well as large and growing populations [41]. Texas currently ranks seventh in the United States in total installed solar capacity with 134 MW and ninth lowest in the Nation for installed cost at $5.83 per Watt [
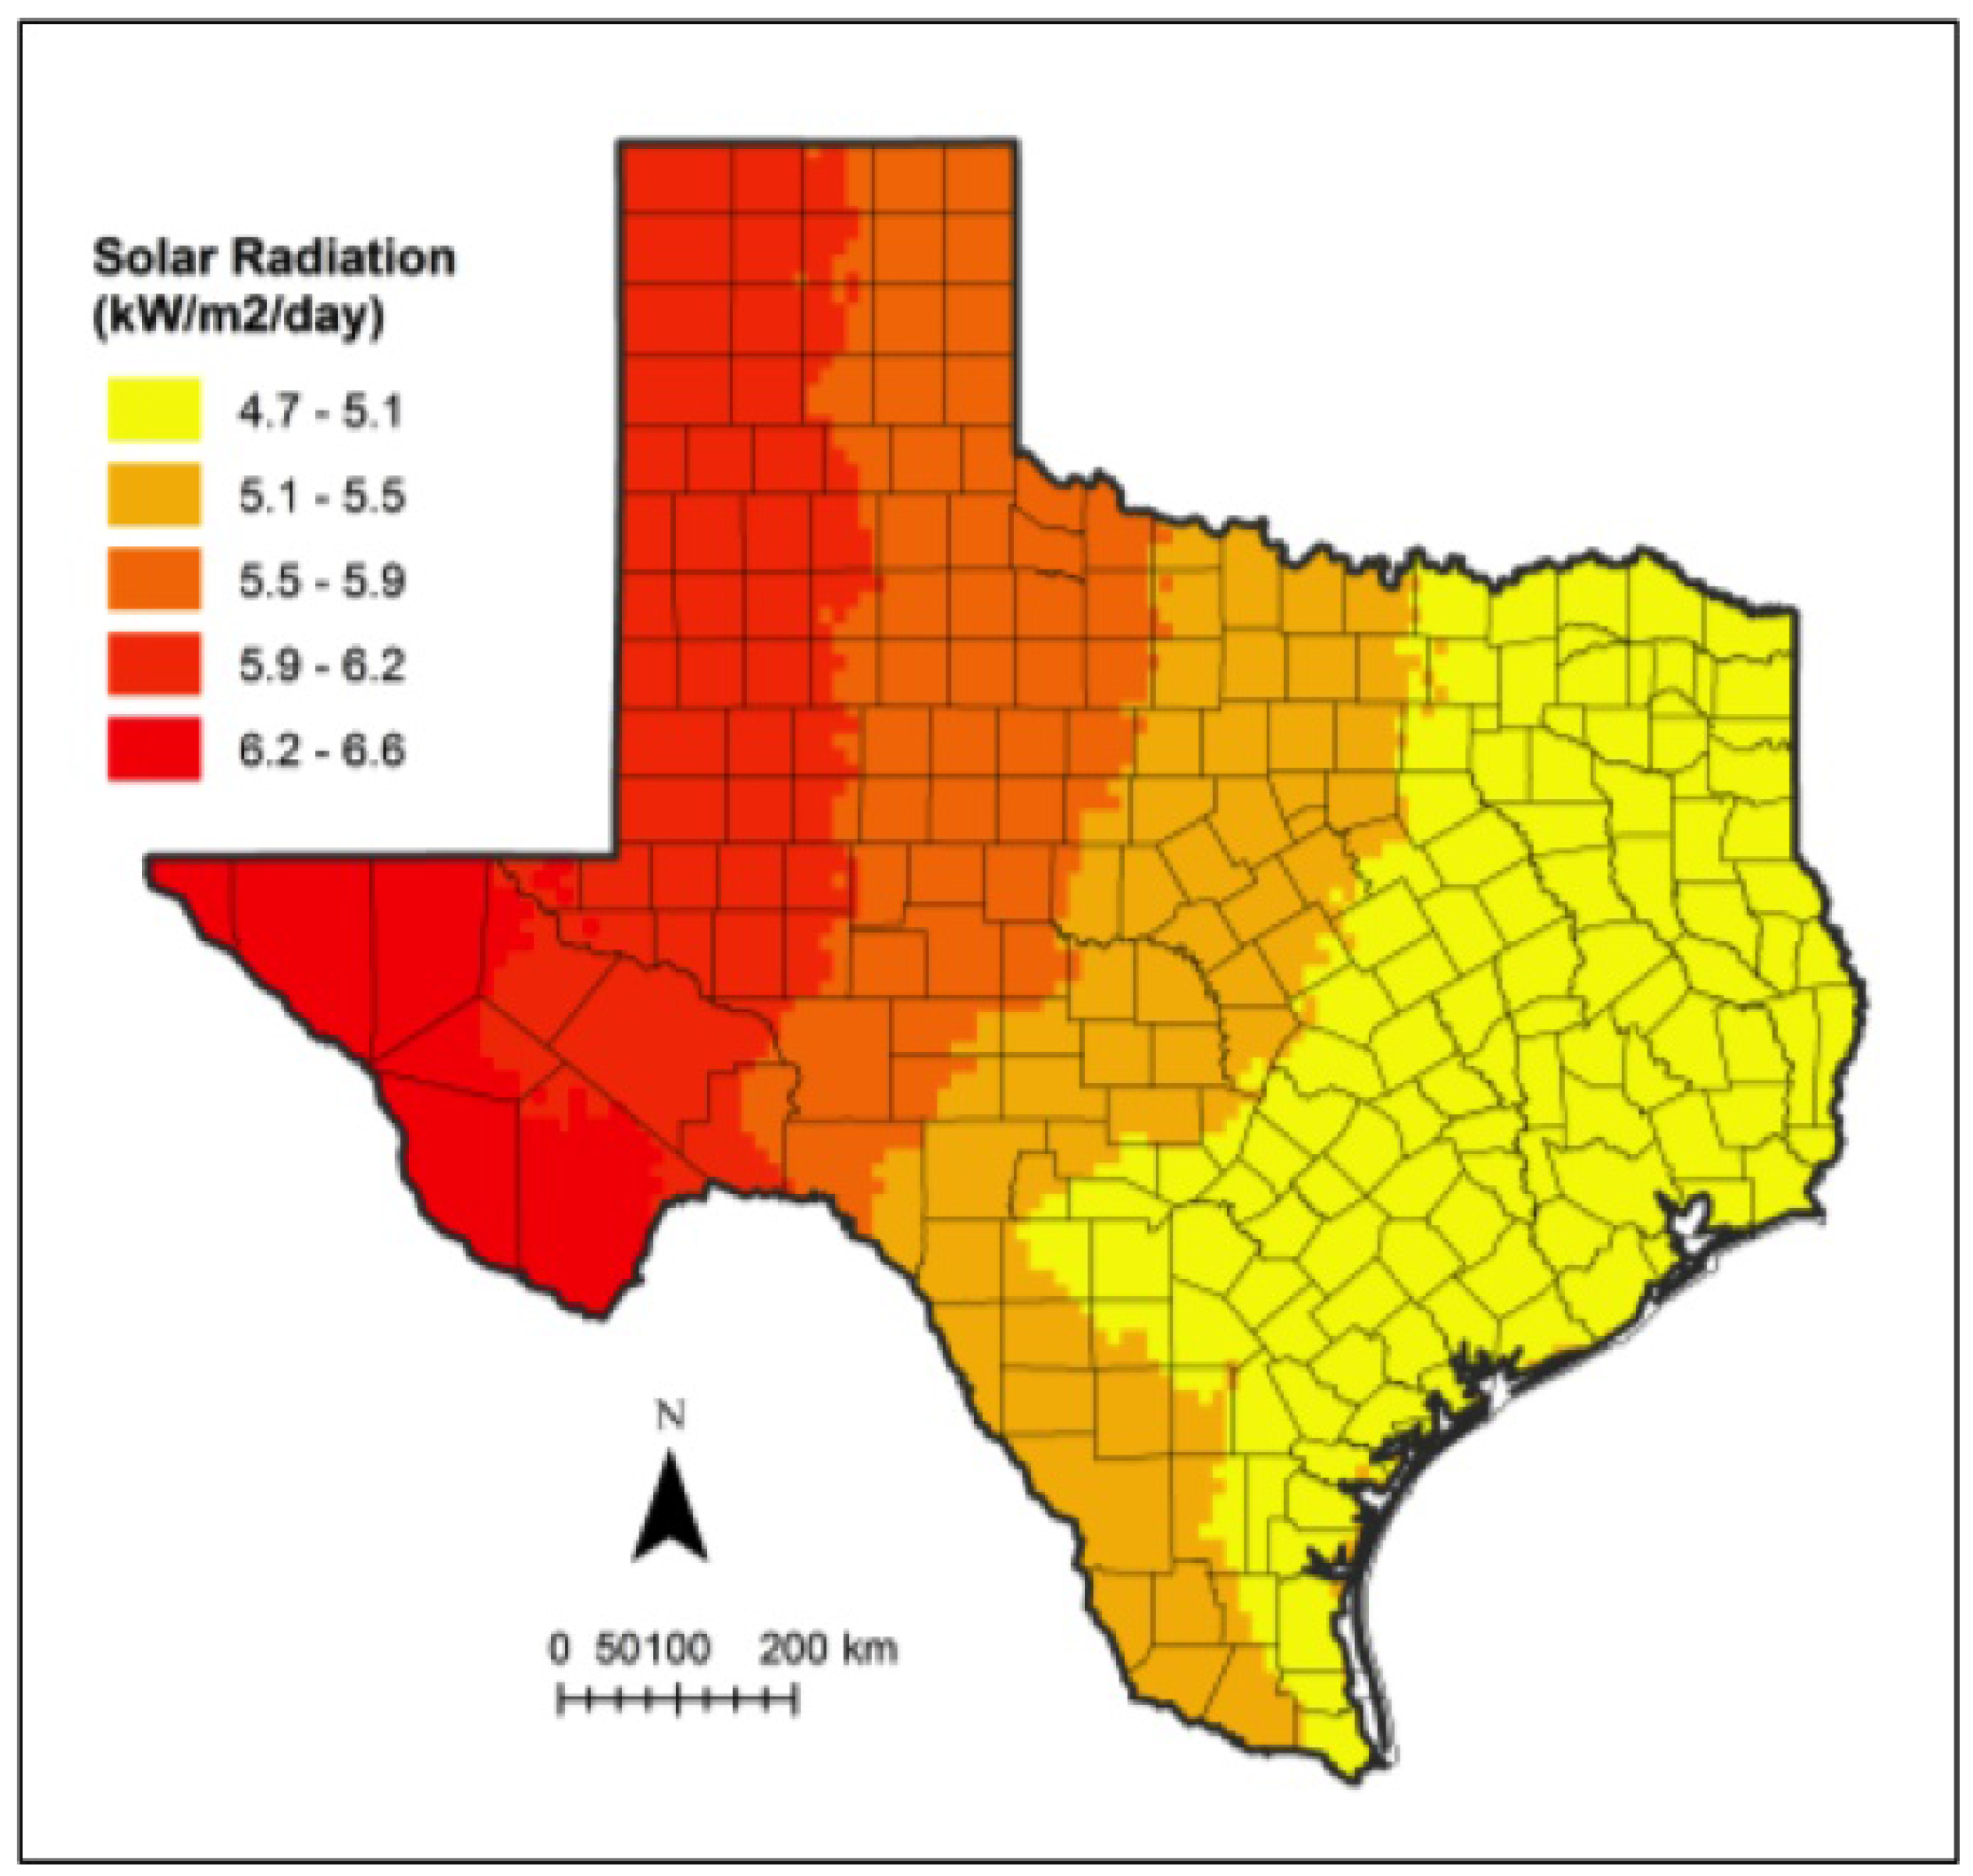
42]. Solar energy potential increases from east to west across the state, as shown in Figure 5, which displays the annual average solar insolation. Across the state, solar insolation ranges from 2 to 7.2 kilowatt hours (kWh) per square meter per day [43]. This range of solar insolation, in addition to growing energy demand in the state, makes Texas an ideal region for utility-scale PV solar installations.
Figure 5. Annual average solar insolation in Texas [43,44].
Resources 04 00227 g005
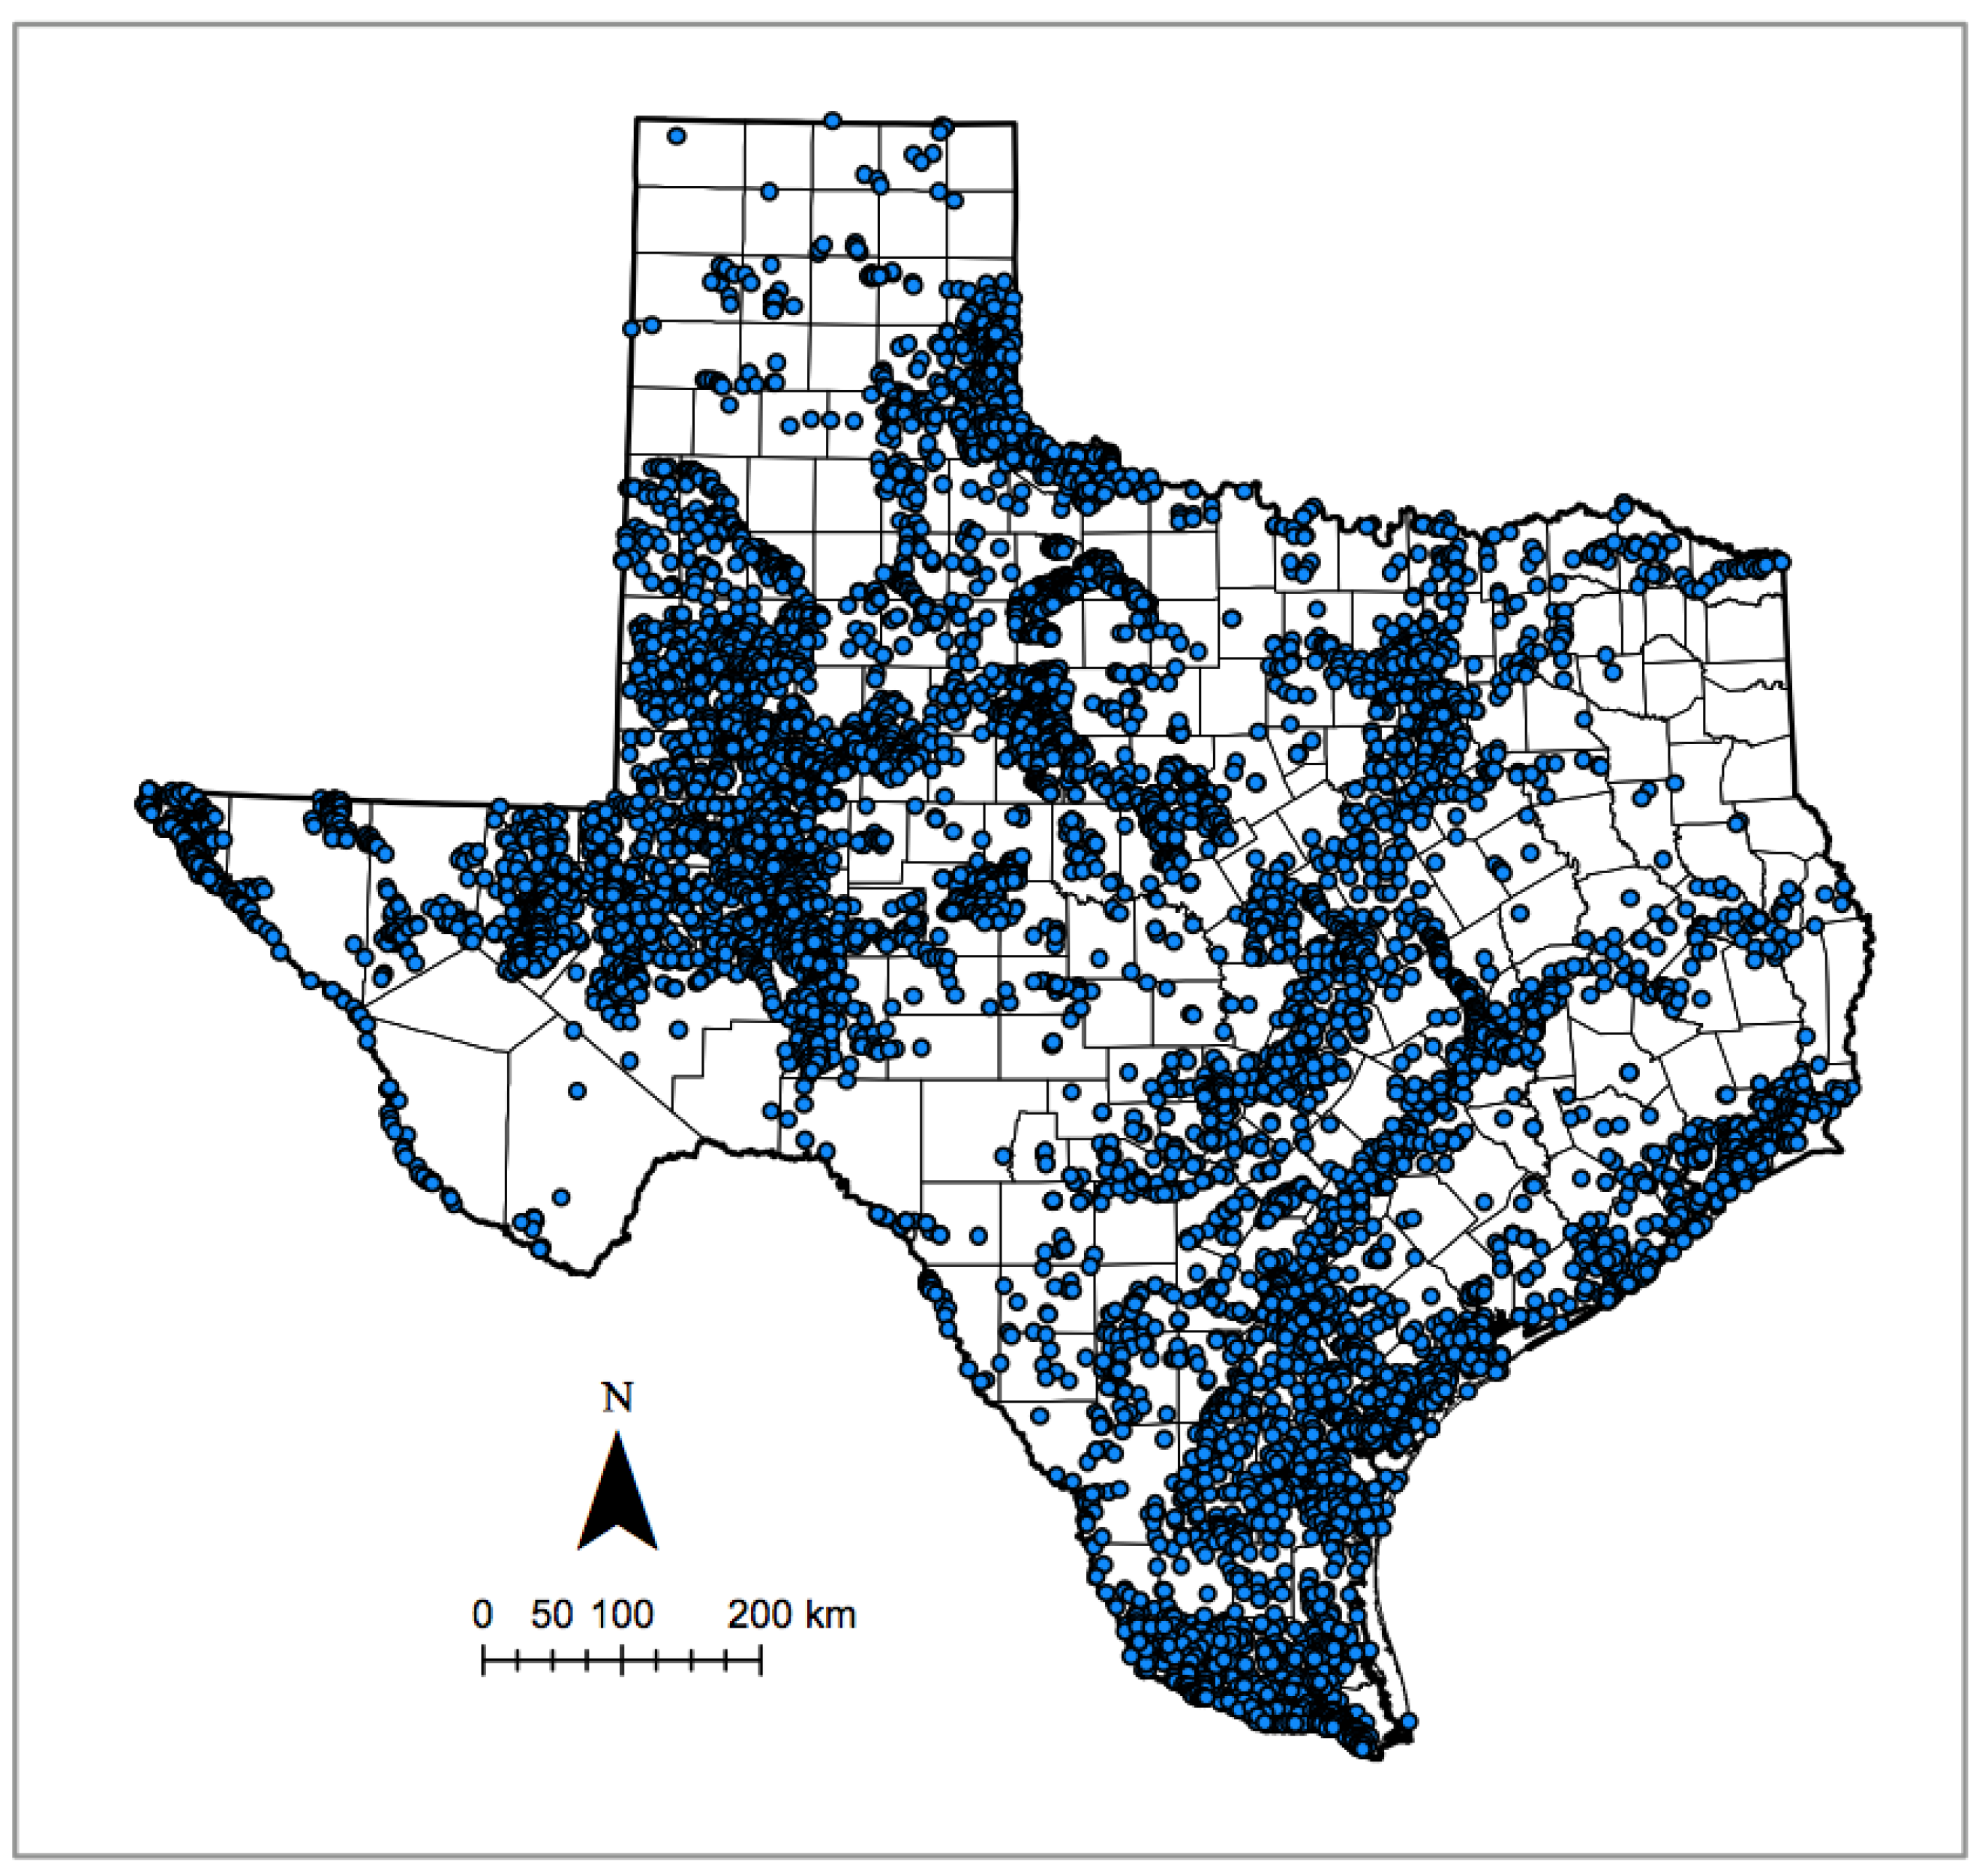
The abundance of brackish groundwater throughout the State is another key reason Texas is a conducive location for this analysis. As shown in Figure 6, there are over 10,000 current wells reaching groundwater considered “brackish” (TDS between 1000 and 10,000 mg/L) [45]. There is an estimated 2.7 billion acre-feet of brackish groundwater in the Texas [4]. The strategies outlined by water planners and availability of brackish groundwater make Texas a suitable region to study in this analysis.
Given the availability of these resources around the state, Texas offers an appropriate location to study the integration of brackish groundwater desalination with wind and solar power. Developing a model with Texas as a testbed enables this analysis to provide a methodology that will also be applicable to other regions with similar solar, wind, and water resources.
Figure 6. Brackish groundwater wells in Texas [45].
Resources 04 00227 g006
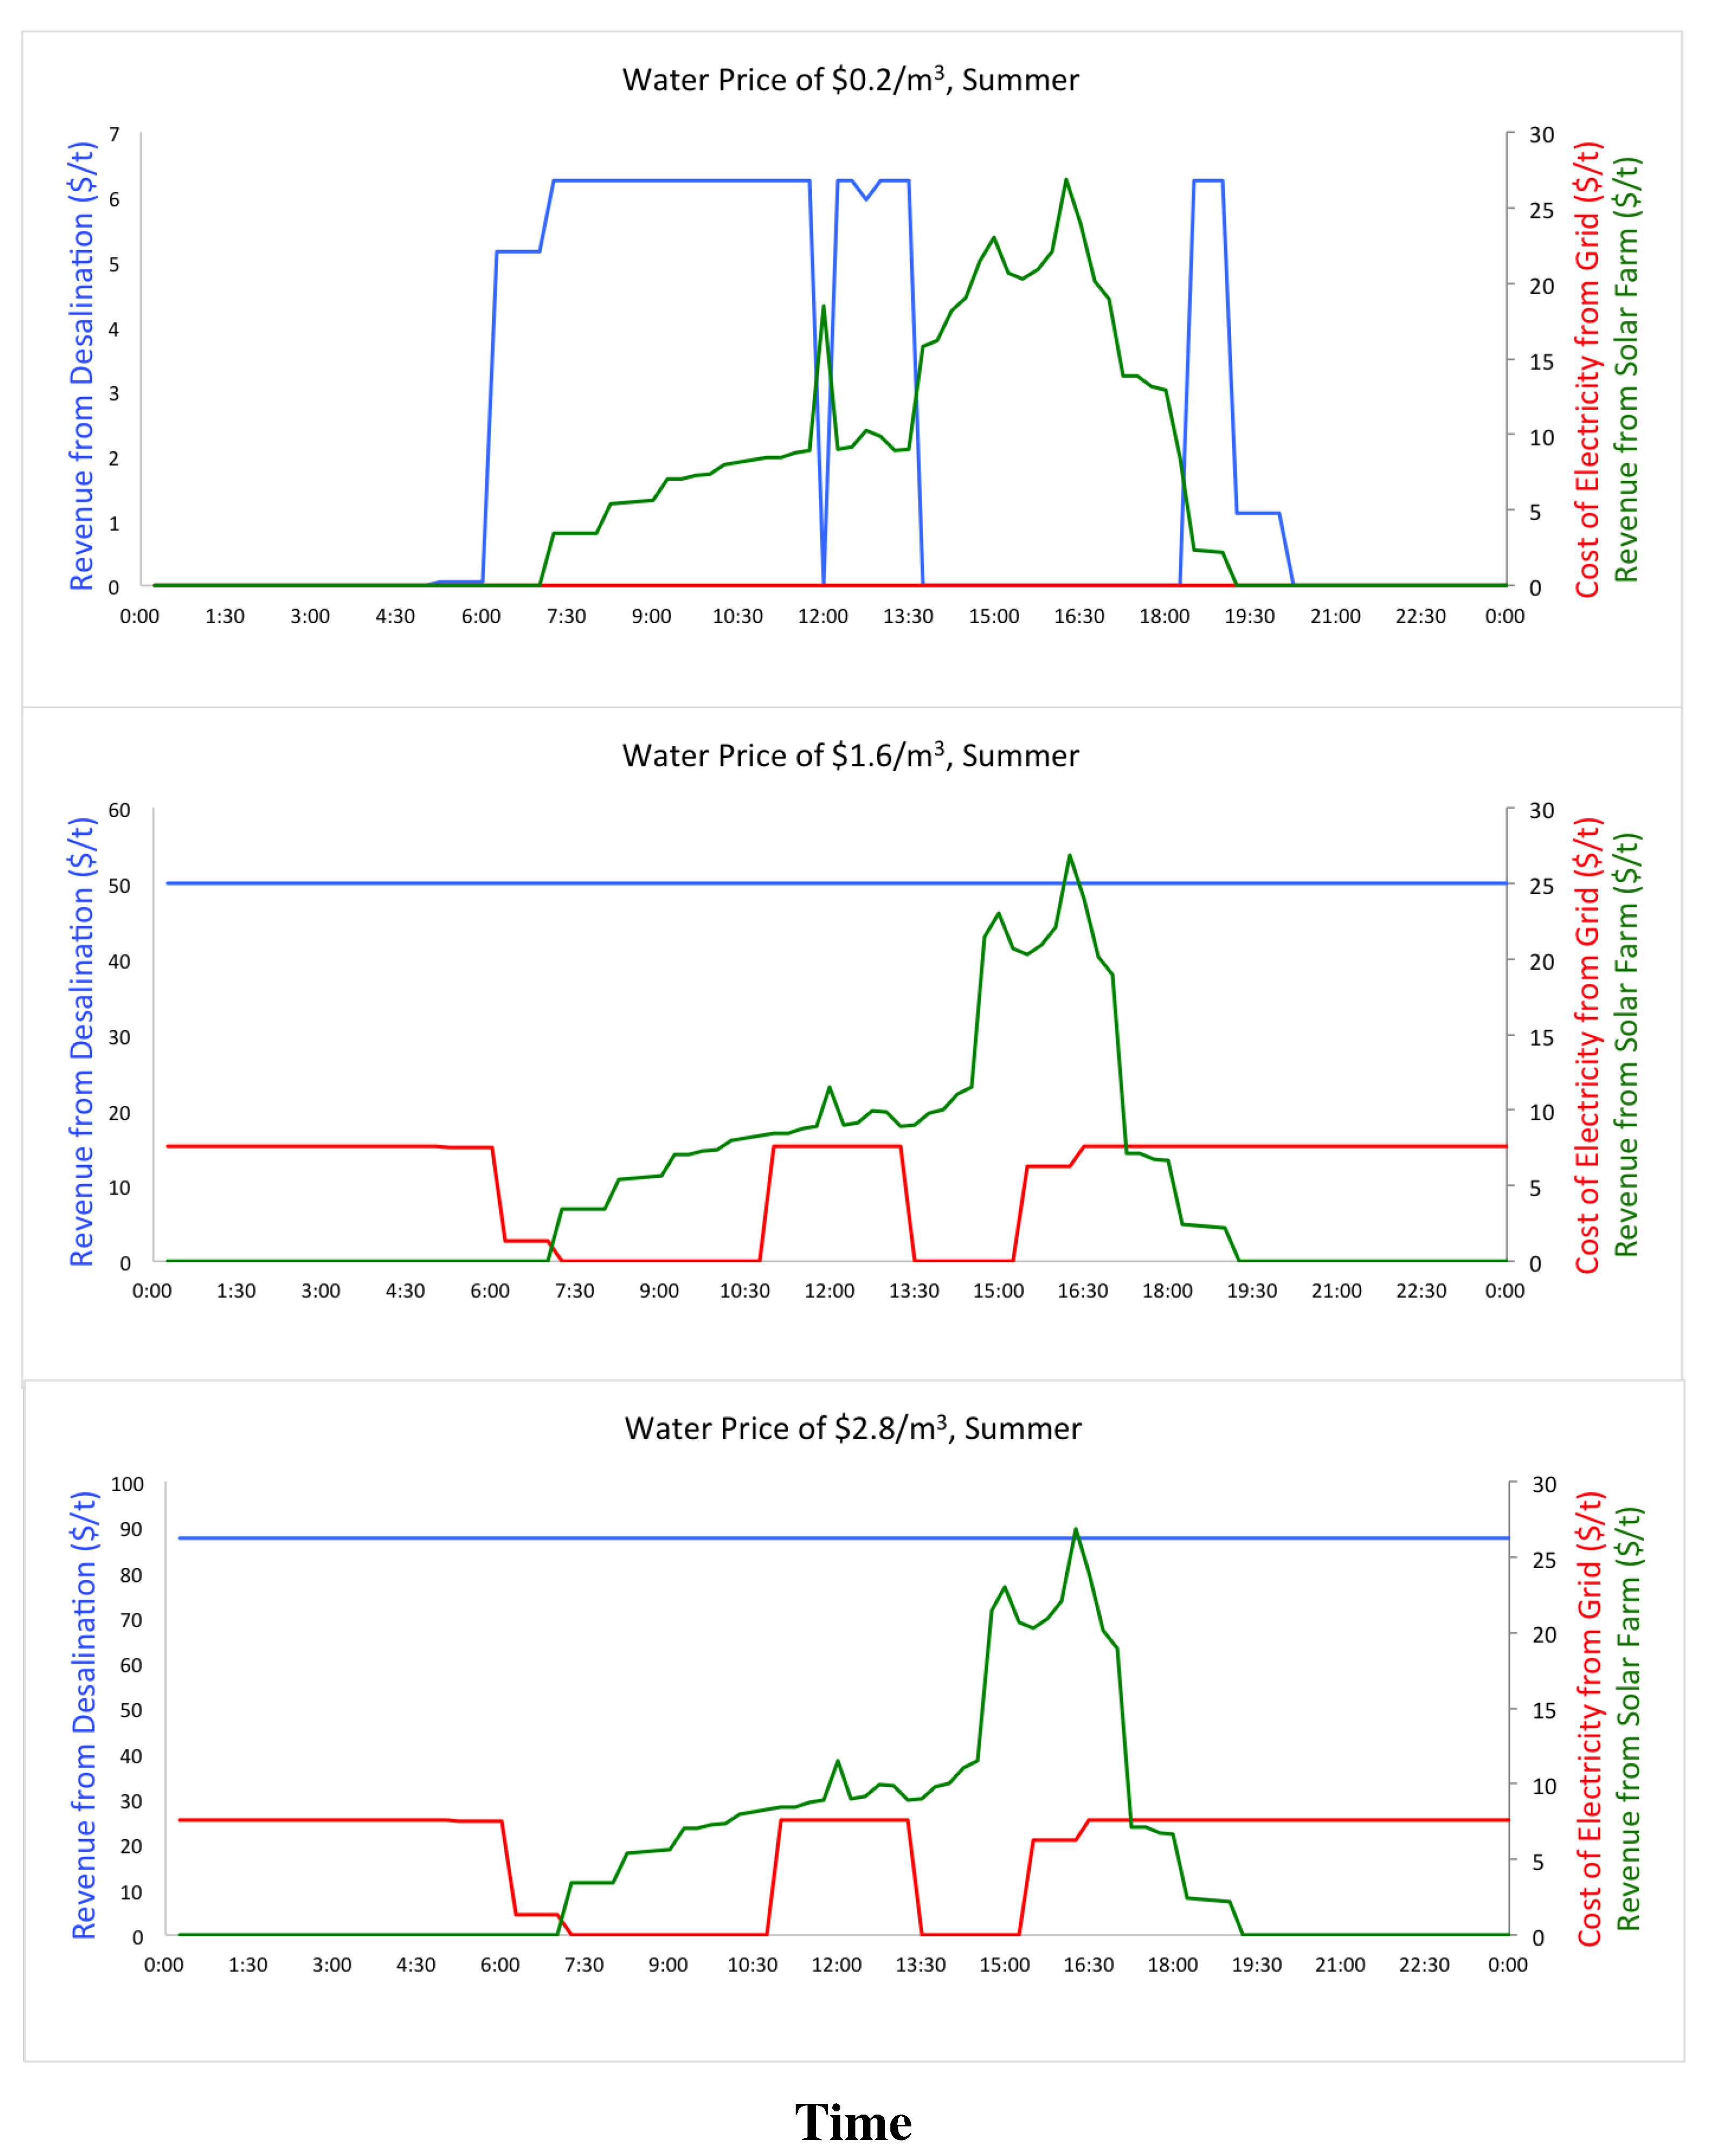
This investigation offers an analysis of desalination powered by renewable energy sources. By developing a water treatment model based on fluid dynamics, an energy model based on thermodynamics, and an optimization model that integrates the water treatment and energy models, this investigation provides insight into the potential for powering desalination with renewable energy. Consideration is given toward the economics of wind and solar powered desalination in the optimization model. This model develops a daily schedule for desalination based on electricity prices and availability of renewable power. Additionally, the optimization model develops results and a methodology to determine expected revenue from water production, electricity sales to the grid, as well as the cost of electricity purchased from the grid for a desalination facility integrated with wind and solar power. By modeling a desalination plant coupled with wind and solar power and considering the economics of this idea, the hope of this analysis is to gain a practical understanding of the benefits and tradeoffs involved in water treatment powered by renewable energy.
Additionally, the analysis performed here offers a novel approach to blueinvestigate the energy-water nexus in the realm of water treatment and renewable power. As discussed in the previous sections, earlier models have analyzed solar-powered desalination, wind-powered desalination, and solar/wind-powered desalination. However, few models have analyzed the possibility of solar and/or wind powered desalination in which the facility is also integrated with an electricity grid, in this case with the Electric Reliability Council of Texas (ERCOT) grid. Moreover, with the exception Clayton’s analysis of wind-powered desalination [3], there have not been investigations to model an integrated facility in which power can not only be bought from the grid, but also sold to the grid from the modeled wind or solar farm. There are potentially times of day when electricity prices are high enough that an integrated facility would prefer to sell wind or solar-generated electricity to the grid rather than use the electricity for desalination. An economic analysis of a modeled wind/solar powered desalination facility can provide insight into the expected operational schedule of such a facility. The analysis in this investigation builds and uses an optimization model to determine times of day when it is economically beneficial to make one of three decisions: use wind or solar power for desalination, sell wind or solar power to the grid and buy electricity from the grid to power desalination, or halt the desalination process. In addition, the analysis develops a model to estimate daily revenues from desalinated water sales and wind/solar power production as well as the expected cost of electricity from the grid. By analyzing grid-connect wind and solar-powered desalination, this investigation fills a knowledge gap regarding how an integrated wind/solar-powered desalination facility can interact with the electricity grid to provide both desalinated water and renewable power.
Furthermore, this investigation includes analysis of a PVT solar configuration in which water is used to cool solar panels while thermal energy from solar panels is used to preheat feed water. As discussed in previously, a PVT solar module can be used as a sort of heat exchanger between the solar panels and brackish groundwater. Transferring heat from the solar panels to the water is mutually beneficial for solar power production and water treatment: cooler solar panels are more efficient at converting solar insolation into electricity while preheated water requires less energy in the desalination process. By considering the possibility of using PVT solar panels as part of a desalination plant, this investigation attempts to fill the void in offering a new and potentially beneficial use for PVT panels. This investigation hopes to answer questions regarding how a PVT solar configuration may perform compared to other configurations in a modeled desalination plant and offer insight into the potential for use of PVT solar panels at a desalination facility.
Another novel aspect of this this investigation is to investigate the potential to diversify revenue in a desalination facility combined with renewable power. It is possible that providing wind and solar power at a desalination facility can mitigate risks associated with declining water sales by providing revenue from electricity. Similarly, the facility may also reduce the risk of declining electricity sales by selling water. A desalination facility integrated with renewable power brings in revenue from two different markets, water and energy, incorporating diversity in revenue.

3. Modeling Methods

3.1. Overview

The methodology in this investigation is divided into three sections to develop the tools necessary to conduct an investigation of a brackish groundwater reverse osmosis desalination plant powered bywind- and/or solar-generated electricity. The three models used as the basis for this analysis are as follows: (1) water treatment model; (2) energetic model; (3) integrated optimization model.
Using these models, four different scenarios are analyzed in this investigation to compare desalination powered by different energy sources and a combination of these sources. Scenario A analyzes a desalination plant that can be powered by electricity generated at an integrated solar farm or by grid-purchased electricity. Correspondingly, power from the modeled solar farm can be either used for desalination or sold to the electricity grid, as shown in Figure 7.
Figure 7. Scenario A models a desalination facility integrated with solar power that can either use solar-generated electricity for water treatment or sell solar-generated electricity to the grid.
Resources 04 00227 g007
Scenario B assumes the same circumstances, except incorporating a modeled wind farm rather than a solar farm, similar to work by Clayton, Stillwell, and Webber [3]. Desalination in this scenario can either be powered by the wind turbines or by electricity purchased from the grid; similarly, wind power can be either used for desalination or sold to the grid, as shown in Figure 8.
Figure 8. Scenario B models a desalination facility integrated with wind power that can either use wind-generated electricity for water treatment or sell wind-generated electricity to the grid.
Resources 04 00227 g008
Scenario C analyzes a desalination facility integrated with a wind farm and co-located with a solar farm. In Scenario C, wind-generated energy can be sold to the grid or used for desalination; similarly, desalination can be powered by either wind-generated electricity or by electricity purchased from the grid. Solar-generated electricity from the co-located solar farm is assumed to be sold to grid. In addition to the opportunity to sell solar power, the purpose of the co-located solar farm is to provide heat exchange between the solar panels and the pretreated brackish groundwater using PVT modules. The brackish groundwater is assumed to be preheated before water treatment to reduce the energy intensity of desalination while the solar panels are assumed to be cooled using brackish groundwater to improve the efficiency of solar power production. In Scenario C, the solar farm and desalination facility are co-located for the purpose of yielding these mutual benefits and it is therefore assumed that all solar-generated electricity is sold to the grid. Revenue generated from the co-located solar farm can also be an important source of revenue from this facility to make desalination integrated with renewable power more attractive. This scenario is shown in Figure 9.
Figure 9. Scenario C models a desalination facility integrated with a wind farm and co-located with a solar farm. Wind-generated electricity is used to power the water treatment process while the solar panels are used to reduce the energetic intensity of desalination.
Resources 04 00227 g009
Finally, Scenarios A, B, and C are compared to Scenario D in which desalination is powered solely by electricity purchased from the grid. Electricity from the grid is assumed to be purchased at an industrial price, as discussed in the section regarding the integrated this model. This final scenario is shown in Figure 10.
The following sections describe the models used to analyze Scenarios A, B, and C of desalination powered by renewable energy, and Scenario D of desalination powered by the electricity grid.
Figure 10. Scenario D models the traditional approach of a desalination facility that is powered by electricity purchased from the grid.
Resources 04 00227 g010

3.2. Water Treatment Model

The power requirement for brackish groundwater desalination is estimated to determine the energetic needs of the proposed integrated facility and to size the modeled wind and solar farms. Using a modified version of the approach developed by Clayton, Stillwell, and Webber [3], the total power needed by the desalination facility (P) is estimated by combing the power required for pumping water from the aquifer and through pipelines (P P ) and the power required to push water through the desalinating membranes (P D ), as shown in Equation (1).
P = P P + P D
The power required for pumping, shown in Equation (2), utilizes the Darcey-Weisbach for head loss in a pipe due to frictional and gravitational forces. The calculated pumping power requirement is a function of the density of water (ρ), the pump efficiency ( η P ), the acceleration due to gravity (g), the desalination capacity factor (CF D ), the depth to the aquifer (z), the pipe length (l), the pipe diameter (D), and the friction factor (f), as shown in Equation (2).
P P [ k W ] = ( ρ [ k g m 3 ] g [ m s 2 ] q [ m 3 s ] 1000 η P C F D ) × ( z [ m ] + ( 4 q [ m 3 s ] π ( d [ m ] ) 2 ) 2 2 g [ m s 2 ] × f d [ m ] × ( z [ m ] + l [ m ] ) )
The flow rate of water (q) is calculated from the desired daily treated water generation (G D ) divided by the reverse osmosis recovery factor (R D ), which is the ratio of product water to incoming groundwater, assumed to be 0.8 in this analysis. The calculation used to determine the assumed flow rate is given in Equation (3).
q [ m 3 s ] = G D [ m 3 d ] R D × 1 86400 [ d s ]
The power required for the reverse osmosis desalination process (P D ) is a function of the energy intensity of desalination (E D ), the desalination capacity factor (CF D ), and the flow rate (q), as shown in Equation (4).
P D [ k W ] = E D [ k W h m 3 ] q [ m 3 s ] C F D × 3600 [ s ] [ h o u r ]
The energy intensity of desalination used in this analysis is 1.5 k W h m 3 based on values reported in literature for reverse osmosis desalination of brackish groundwater [46,47,48]. The 1.5 k W h m 3 value is used for models in this investigation that do not assume brackish groundwater is preheated before treatment.
As indicated previously, research has shown that preheating brackish groundwater before treatment can alleviate the energy intensity of the desalination process by decreasing the pressure required to force water through the semi-permeable membrane. Research at the Center for Inland Desalination at the University of Texas at El Paso (UTEP) suggests that the specific energy required to operate desalination units decreases by 3.4% if water is heated just 5 degrees Celsius [37]. Using results from this research, it is assumed that the energetic intensity of desalination (E D ) is reduced by 3.4% for the scenarios involving PVT solar panels that enable the water to be preheated prior to the desalination process. Hence, for Scenarios A and C, which assume brackish groundwater is preheated before treatment, the energy intensity of desalination used is 1.4 kWh/ m 3
The desalination capacity factor (CF D ) is the ratio of the actual output of treated water to the potential output of treated water for the plant operating in an ideal situation. This factor is included to account for maintenance interruptions and is assumed to be 0.95 (the actual output is 95% of potential output).
For this analysis, a daily product water generation of 3000 m 3 /day is used, which is just over 790,000 gallons per day. This daily water generation would be capable of supplying the municipal demand serving a population of 4000 assuming a per capita demand of 195 gallons per person per day, the average daily use in Texas’s 40 largest cities in 2000 [49]. However water conservation efforts recommended by the Texas Water Development Board encourage 1% annual reduction in water demand until the goal of 140 gallons per person per day is reached [50]. Assuming a daily use meeting this goal, the modeled desalination plant would meet the daily municipal demand for a population of approximately 5600.
Equation (1) through Equation (4) represent the water treatment model used in this investigation. These equations are used in order to determine the energetic requirement of the desalination plant modeled in this analysis. Parameter assumptions used in the water treatment model are shown in Table 1.
Utilizing this water treatment model, Scenarios A, B, C, and D were analyzed in order to estimate the energetic requirement of brackish groundwater desalination. This estimation was incorporated into the energy model discussed in the following section.
Table 1. Water treatment model parameter values.
ParameterSymbolValue
Depth to aquiferz275 m
Pipe lengthl5250 m
Density of waterρ1000 kg/m 3
Pump efficiency η P 0.65
Acceleration due to gravityg9.81 m/s 2
Pipe diameterD0.3 m
Friction factorf0.0162
Reverse osmosis recovery factorR D 0.8
Energy intensity of reverse osmosis for Scenarios B and DE D 1.5 kWh/m 3
Energy intensity of reverse osmosis for Scenarios A and CE D 1.4 kWh/m 3
Desalination capacity factorCF D 0.95
Desired daily product waterG D 3000 m 3 /day

3.3. Energy Model

The energetic model was developed to estimate the appropriate size for the required wind and/or solar farm to integrate or collocate with desalination in Scenarios A, B, and C. Using historical wind and solar farm output data as well as basic principles of thermodynamics, the energetic model is used to estimate sizing and power output that can be used alongside the water treatment model for this analysis of desalination powered by renewable energy.

3.3.1. Solar Farm Sized for Preheating Water in Scenario C

A thermodynamic analysis of the heat required to raise brackish groundwater temperature sufficiently to reduce the energetic intensity of desalination was performed following basic thermodynamic principles [51]. For Scenario C, it is assumed that brackish groundwater is preheated before treatment to lower the energetic requirement of desalination and that the solar panels are cooled with pretreated water to improve the efficiency of solar-power production. In this scenario, the solar farm is assumed to be co-located with a desalination plant to yield these mutual benefits. Accordingly, the solar farm is sized to provide sufficient thermal energy to enable water to be heated before treatment. Based on results from the UTEP Center for Inland Desalination [37] discussed previously, the energy intensity of desalination can be reduced by approximately 3.4% if brackish groundwater is heated 5 degrees Celsius. In accordance with this research, the solar farm is sized to provide sufficient thermal energy to heat brackish groundwater by 5 degrees Celsius, from 25 to 30 degrees.
The “Zeroth” Law states that all mass is conserved within the boundaries of a closed system and all mass that enters an open system must exit or be stored in the system. Here, an open system of the PVT modules is assumed to be operating at steady state, such that the mass entering equals the mass exiting. The working fluid and mass of interest in this scenario is water, which is assumed to absorb thermal energy from the solar panels. The PVT solar panels in Scenario C act as a heat exchanger in which “waste heat" from the relatively hot panels is transferred to the relatively cool water. As previously discussed and shown in Figure 3, a working fluid, water in this case, enters one end of the PVT panel and exits the other end at a higher temperature. The mass of water entering the PVT exchanger ( i n ) equals the mass of water exiting ( o u t ), as shown in Equation (5).
m ˙ i n = m ˙ o u t = c o n s t a n t
The mass flow rate of water () is calculated based on the desired daily product water (G D ). This value must be divided by the desalination recovery rate (R D ) to account for the fact that not all pumped water is treated to drinking-water quality in the desalination process. Additionally, the desired daily product water (G D ) must be divided by the inverse of density for water ( 1 ρ ) to convert a volume flow rate to a mass flow rate. The calculation of this mass flow rate () is shown in Equation (6).
m ˙ [ k g s ] = G D [ m 3 d a y ] 1 ρ [ m 3 k g ] R D × 1 86400 [ d a y s e c ]
The “system” in this thermodynamic analysis is defined as a control volume consisting of the brackish groundwater passing through the PVT panels. Heat () is transferred from the hot solar panels to the relatively cool brackish groundwater. The specific enthalpy of the brackish groundwater entering the PVT panels ( i n ) is increased and the water leaves with a higher specific enthalpy ( o u t ) due to the heat transfer from the warm panels to the cool water. This concept is the conservation of energy, known as the First Law of Thermodynamics, and presented in Equation (7).
Q ˙ [ k W ] = m ˙ × ( h o u t [ k J k g ] h i n [ k J k g ] )
The specific enthalpy of water is a function of water temperature and can be found using thermodynamic property tables [51]. The energetic model assumes water temperature is increased five degrees Celsius, from 25 to 30 degrees Celsius based on research of preheating reverse osmosis feed water [37] and the temperature of naturally occurring groundwater in central Texas [52]. Hence, specific enthalpies of entering and exiting water in Equation (7) are taken at 25 and 30 degrees Celsius, respectively. While density is also a temperature dependent property, this value varies negligibly for water between 25 and 30 degrees Celsius. Parameter value for Equations (6) and (7) are listed in Table 2.
Table 2. Heat exchange parameters.
ParameterSymbolValue
Inverse of density of water 1 ρ 0.001003 m 3 k g
Specific enthalpy of water entering PVT panelh i n 104.89 k J k g
Specific enthalpy of water exiting PVT panelh o u t 125.79 k J k g
Finally, the required solar farm capacity in Scenario C (C S O L A R , C ) is estimated by dividing the heat () found in Equation (7) by the thermal efficiency of the PVT solar modules ( η P V T ). In this analysis, a thermal efficiency of 0.55 is assumed based on average values reported from studies regarding experimental performance of PVT solar panels [35,53]. This final calculation of the solar farm sizing in Scenario C is shown in Equation (8).
C S O L A R , C [ k W ] = Q ˙ [ k W ] C F S O L A R η P V T
These calculations were performed to estimate the solar power capacity for a modeled solar farm that is sized to preheat brackish groundwater. The next section uses similar methodology, but is used to estimate the required size for a solar farm used to power desalination.

3.3.2. Solar Farm Sized for BWRO Desalination in Scenario A

In the energetic model for Scenario A, the solar farm is integrated with the BWRO desalination facility for the primary purpose of supplying power for the water treatment process. Hence, the modeled solar farm is sized to meet the power requirement of BWRO desalination. The required power in this process (P) is calculated using Equation (1) and divided by the solar power capacity factor (CF S O L A R ) to account for the intermittent nature of available solar power. Using the estimated power for desalination and the capacity factor, Equation (9) is developed to calculate the required solar farm size for Scenario A (C S O L A R , A ).
C S O L A R , A [ k W ] = P [ k W ] C F S O L A R
The solar energy supplied to BWRO desalination plant will not be constant because of the inherent daily and hourly variability of solar resources. Therefore, the modeled solar farm utilizes the capacity factor (CF S O L A R ) to size the facility to meet the heating requirement of the BWRO desalination facility based on the average generation from the solar farm. Data of hourly solar insolation measured in Abilene, a city in Central Texas, was used to determine average solar insolation and calculate the solar farm capacity factor (CF S O L A R ) [44,54]. Based on these data, on a typical day, it is determined that average incoming solar insolation is 21% of peak incoming solar insolation at the location and therefore average output for the modeled solar farm is 21% of peak installed solar capacity. The capacity factor for solar power (CF S O L A R ) of 0.21 is used in Equation (9) to estimate the required solar farm capacity (C S O L A R , C ) based on the power required for desalination (P) in Scenario A.
Using data solar insolation data recorded in Abilene [54], the modeled solar farm is sized in Scenario A assuming that typical output is 21% of peak solar farm capacity. On some days, it is therefore possible that power generation from the solar farm may be above or below the required power for desalination. Solar-generated electricity can be sold to the grid on days when power is above typical output while electricity can be purchased from the grid on days when output is below the requirement for water treatment. This idea is incorporated in the integrated model and is an essential concept of the grid-connected integrated facility discussed in this investigation.

3.3.3. Wind Farm Sizing for Scenarios B and C

Another primary purpose of this investigation is to compare the benefits and tradeoffs of integrating desalination with different sources of renewable power, namely wind versus solar. An integrated facility consisting of a solar farm (Scenario A), a wind farm (Scenario B), and a combination of a wind and a solar farm (Scenario C) are investigated in this analysis. The methodology for the energetic module in Scenario B is based on the wind-powered desalination investigation performed by Clayton, Stillwell, and Webber [3].
The wind farm modeled in Scenario B is sized to meet the power requirement of BWRO desalination. Similar to the solar farm modeled in Scenario A, the wind farm modeled in Scenario B will not be constant due to the inherent variability of wind resources. Therefore, the modeled wind farm is sized to meet the power requirement of the BWRO desalination facility based on average generation from the wind farm. Data of wind-power generation from the Sweetwater 1 Wind Farm in Central Texas were used in this analysis to determine the average output and calculate the wind farm capacityfactor (CF W I N D ) [55]. Based on these data, it is determined that average output is approximately 35% of installed capacity. Therefore, the modeled wind farm will be sized to provide power for the BWRO facility accounting for a wind farm capacity factor (CF W I N D ) of 0.35. The required wind farm size for Scenario B (C W I N D , B ) is a function of this capacity factor and the estimated power requirement of BWRO desalination (P), as shown in Equation (10).
C W I N D , B [ k W ] = P [ k W ] C F W I N D
Similar to the solar farm in Scenario A, the wind farm in Scenario B is sized based on the energetic requirement of BWRO desalination assuming average of the peak output from the wind turbines. Power generation from the wind farm can vary above or below the required power for desalination due to fluctuations in wind power availability. Hence, when wind power generation is above the requirement for desalination, wind-generated electricity can be sold to the grid. When wind power is below the requirement for desalination, electricity can be purchased from the grid to power the water treatment process. The integrated model incorporates this idea for the grid-connected wind farm in Scenario B.
Results from the water treatment and energy models are used in the integrated model to investigate the potential daily operational schedule for desalination powered by renewable energy, as discussed in the following section.

3.4. Integrated Model

A grid-connected BWRO desalination facility integrated with renewable power offers an opportunity to provide both treated water and electricity. One of the goals of this analysis is to develop a daily operational schedule to understand when wind and solar-generated electricity would be used for desalination versus when this electricity would be sold to the grid. A related assessment is investigating the times electricity must be purchased from the grid in order to meet the energetic requirement for desalination when renewable power is unavailable or sold for other uses. The integrated model discussed in this section provides these assessments. Using results from the water treatment and energy models, the integrated model provides an analysis of the potential daily operational schedule of a desalination facility integrated with wind or solar power. Additionally, the integrated model estimates potential daily revenue from desalination, daily revenue from power production, and the daily cost of electricity purchased from the grid.
The integrated model is programmed to develop a daily operational schedule that would maximize overall daily revenue from a modeled desalination facility integrated with renewable power. Capital and operational costs are an important consideration, however, are beyond the scope of this work, which focuses on daily revenue. To perform this optimization, a General Algebraic Modeling System (GAMS) [56] was developed for each of the three Scenarios (A, B, and C) and compared to a baseline case of desalination powered by grid-purchased electricity (Scenario D). The model is based on 15 min time intervals, the given interval for electricity pricing in Texas as determined by the Electric Reliability Council of Texas (ERCOT). At each 15 min time interval, the model optimizes operations by determining if the facility should produce water using wind/solar-generated electricity, produce water using electricity purchased from the ERCOT grid, or pause desalination in order save money on electricity and brine disposal. For Scenarios A, B, and C, the model determines if wind- or solar-generated electricity should be used for water production or sold to the ERCOT grid, depending on which option is more profitable at the given 15 min interval. By developing optimal operational schedules for wind/solar powered desalination, the integrated model offers insight into how an integrated facility may interact with the electric grid.
Wind and solar resources as well as electricity prices vary seasonally. Therefore, the operational analyses in this investigation develops optimal daily profiles for a typical summer day and a typical winter day. Electricity and output data from July, August, and September were used for summer months while data from December, January, and February were used for winter months. The following section discuss this seasonal analysis of optimal daily profiles and provide details regarding modeling differences between Scenarios A, B, C, and D.

3.4.1. Water Production Revenue and Cost for Scenarios A, B, C and D

For all scenarios analyzed in this investigation, the revenue generated from desalination (R D E S A L ) is calculated by multiplying the price of water (Pr W A T E R ) by the quantity of water generated in each of the 15-minute interval (G D , t ), as shown in Equation (11).
R D E S A L [ $ d a y ] = P r W A T E R [ $ m 3 ] × t = 1 96 G D , t [ m 3 t ]
Additionally for all scenarios, the analysis of desalination must account for the cost of disposing of the high salinity brine (C B R I N E ) that is generated in the reverse osmosis process. This cost is a function of the unit cost of brine disposal (Pr B R I N E ) and the quantity of water generated in the each 15 min interval, demonstrated in Equation (12).
C B R I N E [ $ d a y ] = P r B R I N E [ $ m 3 ] × t = 1 96 G D , t [ m 3 t ]
Municipal water prices in Texas range from $0.20 to $2.80 per m 3 [57]. This investigation was therefore performed to compare low, moderate, and high water prices of $0.20, $1.60, and $2.80 per m 3 . The unit cost of brine disposal is assumed to be $0.04 per m 3 based on the assumption of deep-well injection as the brine disposal method at the modeled desalination facility [58,59].
To estimate the electricity that must be provided by either the grid or the renewable energy sources, the power used for water production (E D E S A L ) must be calculated in each 15 min interval based on the desired daily product (G D ), power required per unit of water production (P), and quantity of water produced in each interval (G D , t ), as shown in Equation (13).
E D E S A L [ k W h t ] = P [ k W ] G D [ m 3 d a y ] × * G D , t [ m 3 t ] × 24 [ h o u r ] [ d a y ]
An additional cost that Scenarios A, B, C and D all incorporate is the cost of electricity purchased from the grid. Recall that in Scenarios A, B, and C, electricity can be purchased from the grid if wind- or solar-generated electricity is unavailable or if wind- or solar-generated electricity is sold to the grid rather than used for desalination. For this analysis, the price of electricity purchased from the grid (P E L E C T R I C I T Y ) is assumed to be $0.068 per kilowatt hour (kWh), the average price of electricity for industrial consumers in 2011 [60]. The total cost of grid-purchased (C E L E C T R I C I T Y ) electricity is a function of this price and the quantity of electricity purchased from the grid (E G R I D ) during each 15 min interval, as shown in Equation (14).
C E L E C T R I C I T Y [ $ d a y ] = P E L E C T R I C I T Y [ $ k W h ] × t = 1 96 E G R I D [ k W h t ]
For all scenarios analyzed in this investigation, the price of electricity used is the average wholesale electricity price for each 15 min interval during the given season (summer or winter). ERCOT data from 2012 was used for grid electricity prices (P E L E C T R I C I T Y ) [61].
A constraint included in the models for Scenarios A, B, C and D is that for the daily water production must be at least 1000 m 3 per day. This constraint is included to model a practical scenario in which a minimum daily requirement of water must be met regardless of the economic favorability of the operations to meet water demand of a municipality. The facility is designed to produce 3000 m 3 per day, but may generate less water if economic circumstances indicate it is more profitable to halt desalination during certain times of day.
Equations (11)–(14) are used in the integrated GAMS model for all scenarios, A, B, C, and D. The following sections discuss additional equations used respectively by each unique scenario.

3.4.2. Integrated GAMS Model for Scenario A

The integrated GAMS model for Scenario A calculates the solar-generated electricity sold to the grid and the solar-generated electricity used for desalination. Data from Abilene discussed previously were used to estimate the expected availability of solar energy at each 15 min interval throughout the day. The electricity provided by the modeled solar farm (E S O L A R A , t ) is assumed to be proportional to the direct solar insolation (SR) at the given 15-minute interval, as shown in Equation (15). Note that the factor of 1/4 is included in the following equation to account for the fact that there are four fifteen-minute intervals, the time step of this analysis, in each hour.
E S O L A R A , t [ k W h t ] = S R t [ W m 2 ] S R M A X [ W m 2 ] × C S O L A R , A [ k W ] × 1 4 h o u r t
The electricity generated at the solar farm sold the the grid in Scenario A (E S O L A R G R I D A , t ) is calculated by taking the solar energy produced (E S O L A R A , t ) minus the energy used for desalination (E D E S A L A , t ) in each 15 min time interval, represented in Equation (16).
E S O L A R G R I D A , t [ k W h t ] = E S O L A R A , t [ k W h t ] E D E S A L A , t [ k W h t ]
The revenue from solar energy sold to the grid in each 15-minute interval (R S O L A R A , t ) is calculated by multiplying the amount of solar energy sold to the grid (E S O L A R G R I D A , t ) by the electricity price (Pr E L E C T R I C I T Y ) at each time period. Total revenue from solar energy (R S O L A R A ) is then taken as the sum of the revenue in each 15-minute interval. These relationships are shown in Equations (29) and (30).
R S O L A R A , t [ $ t ] = E S O L A R G R I D A , t [ k W h t ] × P r E L E C T R I C I T Y [ $ k W h ]
R S O L A R A [ $ ] = t = 1 96 R S O L A R A , t [ $ t ]
For the price of electricity in each 15 min interval (Pr E L E C T R I C I T Y ), ERCOT West Zone Real Time electricity prices from 2012 were used [61]. The wind and solar farms from which the data were collected are located in this electricity pricing zone.
Finally, the total revenue for Scenario A (R A ) can be calculated based on the revenue from desalination (R D E S A L ), revenue from solar power (R S O L A R ), cost of electricity from the grid (C E L E C T R I C I T Y ), and cost of brine disposal (C B R I N E ), as shown by Equation (19).
R A [ $ ] = R D E S A L A [ $ ] + R S O L A R A [ $ ] C E L E C T R I C I T Y A [ $ ] C B R I N E A [ $ ]
By maximizing the objective function defined in Equation (19), the GAMS model computes a daily schedule for Scenario A to maximize daily revenue.

3.4.3. Integrated GAMS Model for Scenario B

The integrated GAMS model for Scenario B is developed in a similar fashion to that for Scenario A, except using a modeled wind farm rather than a modeled solar farm. For input data to estimate the availability of wind resources, daily profiles from the Sweetwater 1 Wind Farm were used. The electrical energy provided by the modeled wind farm is assumed to be proportional to the average capacity factor from the Sweetwater 1 Wind Farm dataset at each 15 min interval for the given season (summer or winter), as shown in Equation (20). Note that the factor of 1/4 is included in the following equation to account for the fact that there are four fifteen-minute intervals, the time step of this analysis, ineach hour.
E W I N D , t [ k W h t ] = C F A V G , t × C W I N D , B [ k W ] × 1 4 h o u r t
Similar to the solar farm in Scenario A, the electricity generated from the wind farm in Scenario B that is sold to the grid (E W I N D G R I D B , t ) is calculated by taking the difference of wind energy produced (E W I N D B , t ) the energy used for desalination (E D E S A L B , t ) in each 15 min time interval, represented in Equation (25).
E W I N D G R I D B , t [ k W h t ] = E W I N D B , t [ k W h t ] E D E S A L B , t [ k W h t ]
The revenue from wind energy sold to the grid in each 15-minute interval (R W I N D B , t ) is calculated by multiplying the amount of wind energy sold to the grid (E W I N D G R I D B , t ) by the electricity price (Pr E L E C T R I C I T Y ) at each time period. Total revenue from wind energy (R W I N D B ) is then taken as the sum of the revenue in each 15 min interval. These relationships are shown in Equations (26) and (27).
R W I N D B , t [ $ t ] = E W I N D G R I D B , t [ k W h t ] × P r E L E C T R I C I T Y [ $ k W h ]
R W I N D B [ $ ] = t = 1 96 R W I N D B , t [ $ t ]
Similar to Scenario A, the total revenue for Scenario B (R B ) can be calculated using the revenue from desalination (R D E S A L B ), revenue from wind power (R W I N D B ), cost of electricity from the grid (C E L E C T R I C I T Y B ), and cost of brine disposal (C B R I N E B ), as shown by Equation (24).
R B [ $ ] = R D E S A L B [ $ ] + R W I N D B [ $ ] C E L E C T R I C I T Y B [ $ ] C B R I N E B [ $ ]
Equation (24) is used as the objective equation in the GAMS model to determine the daily schedule that maximizes total revenue for Scenario B.

3.4.4. Integrated GAMS Model for Scenario C

Scenario C models a desalination facility integrated with a wind farm to power water production and co-located with a solar farm to provide preheating of brackish groundwater. Wind energy can be used for water treatment or sold to the grid depending on temporally varying electricity prices. Correspondingly, desalination can be powered by either wind-generated electricity or by electricity purchased from the grid. The desalination plant coupled with wind power utilizes the same governing Equations (25)–(27) in Scenario C as in Scenario B, shown below.
E W I N D G R I D C , t [ k W h t ] = E W I N D C , t [ k W h t ] E D E S A L C , t [ k W h t ]
R W I N D C , t [ $ t ] = E W I N D G R I D C , t [ k W h t ] × P r E L E C T R I C I T Y [ $ k W h ]
R W I N D C [ $ ] = t = 1 96 R W I N D C , t [ $ t ]
In Scenario C, the purpose of collocating the desalination plant with a solar farm is to provide preheating of brackish groundwater and cooling of solar panels. As discussed previously, all solar power is assumed to be sold to the grid in this scenario. Hence, the solar electricity sold to the grid (E S O L A R G R I D C , t ) in this case is the summation of the solar electricity generated, as shown in Equation (28).
E S O L A R G R I D C , t [ k W h t ] = E S O L A R C , t [ k W h t ]
Once this modification is made, the governing equations to calculate the revenue from solar energy (R S O L A R ) in Scenario C are the same as those for Scenario A, shown below.
R S O L A R C , t [ $ t ] = E S O L A R G R I D C , t [ k W h t ] × P r E L E C T R I C I T Y [ $ k W h ]
R S O L A R C [ $ ] = t = 1 96 R S O L A R C , t [ $ t ]
Total revenue in Scenario C accounts for revenue from desalination (R D E S A L C ), revenue from solar-generated electricity (R S O L A R C ), revenue from wind-generated electricity (R W I N D C ) as well as the cost of electricity from the grid (C E L E C T R I C I T Y C ) and the cost brine disposal (C B R I N E C ), as shown in Equation (31). The potential efficiency increase associated with cooler solar panels is not considered in this analysis.
R C [ $ ] = R D E S A L C [ $ ] + R S O L A R C [ $ ] + R W I N D C [ $ ] C E L E C T R I C I T Y C [ $ ] C B R I N E C [ $ ]
The objective function shown in Equation (31) is maximized for each 15-minute interval to develop an optimal daily schedule for the desalination facility integrated with wind power and co-located with a solar farm.

3.4.5. Integrated GAMS Model for Scenario D

Scenarios A, B, and C are compared to a situation in which all energy required for desalination is purchased from the ERCOT electric grid. For this case, the electricity purchased from the grid in each 15-minute interval (E G R I D D , t ) is equal to the energy required for desalination (E D E S A L D , t ) in that time period, indicated in Equation (32).
E G R I D D , t [ k W h t ] = E D E S A L D , t [ k W h t ]
The total cost of grid-purchased electricity is the summation of the electricity purchased in each of these intervals (E G R I D D , t ) multiplied by the industrial electricity price (Pr E L E C T R I C I T Y ), as shown in Equation (33).
C E L E C T R I C I T Y D [ $ ] = P r E L E C T R I C I T Y [ $ k W h ] × t = 1 96 E G R I D D , t [ k W h t ]
The total project revenue for Scenario D is the revenue from desalination minus the costs of electricity and brine disposal, shown in Equation (34).
R D [ $ ] = R D E S A L D [ $ ] C E L E C T R I C I T Y D [ $ ] C B R I N E D [ $ ]
Equation (34) represents the objective function for a typical scenario is which desalination is powered by electricity purchased from grid.
The equations developed in the optimal operation analysis for Scenarios A, B, C, and D were run in a GAMS optimization model. Using the revenue equation as the criterion value in each case, the model maximizes total profits by determining when desalination should be powered by wind/solar-generated electricity or when wind/solar-generated electricity should be sold to the grid and desalination should be powered by grid-purchased electricity. If electricity and brine-disposal costs are greater than revenue from desalination at any given time, the model can also discontinue desalination to maximize total project revenue. By running this optimization model, daily schedules for desalination were developed for a typical summer and a typical winter day. Additionally, revenues from desalination, wind power, and solar power were calculated, as well as electricity cost from the grid. Using results from the water treatment and energy models, this integrated model offers insight into potential operations of a grid-connected desalination facility powered by renewable energy. Results from these models are discussed in the following sections.
The design variables in this analysis vary in each scenario. In Scenario A, the model determines if solar generated electricity is sold to the grid or used for water treatment. Likewise, for Scenario B, the model determines if wind-generated electricity is sold to the grid or used for desalination. Scenario C considers the same decision as Scenario B, but with the addition of pre heating feed water. For Scenario D, the model determines if electricity should be purchased from the grid or if desalination should be halted in each time interval. In all the scenarios described above, the determination is made with the goal of maximizing daily operational revenue. In essence, the design variable is what the model chooses to do with electricity at any given time interval to maximize the criterion function of daily revenue.

4. Results and Discussion

4.1. Overview

Four Scenarios (A, B, C, and D) were analyzed each at three different water prices ($0.2, $1.6, and $2.8 per cubic meter) to generate optimal daily profiles for two different seasons (summer and winter). Results from the water treatment and energy models were utilized in an integrated model to investigate the potential operational schedule of a desalination facility integrated with renewable power. Optimal operational schedules developed by the integrated model offer insight into the potential benefits and tradeoffs associated with combining desalination with wind and solar power.

4.2. Water Treatment Model Results

The primary purpose of the water treatment model is to provide an estimate of the energy intensity of BWRO desalination for a specified location, in this case, Central Texas. Recall that Scenarios A and C involved the assumption of preheating water before treatment, while Scenarios B and D assume water is fed to the treatment facility at its underground temperature. Hence, the power requirement for water treatment will be reduced for Scenarios A and C compared to Scenarios B and D based on the assumption that preheating feed water lowers the energetic intensity of reverse-osmosis desalination [37].
For Scenarios B and D, using the parameters summarized in Table 1, an estimated 440 kW of power is required by the BWRO desalination plant. Of this 440 kW, approximately 194 kW is required for pumping water from the ground and through facility pipelines, while 246 kW is needed for the reverse osmosis treatment process. For the cases that assume preheating of brackish groundwater, Scenarios A and C, the power requirement is estimated to be approximately 432 kW (194 kW for pumping and 238 kW for reverse osmosis treatment). The reduction in the energy consumed by desalination for the cases assuming preheating in this modeled situation is quite small. Because the water treatment model assumes a conservative estimate for the reduction in specific energy due to preheating of approximately 3.4% [37], the overall energy requirement in the preheating case remains very similar to the non-preheating case. However, a more significant reduction in the energy requirement of BWRO desalination could be achieved for models assuming larger quantities of daily product water or assuming water is heated to a higher temperature.
The results shown in Table 3 indicate that while the specific energy intensity of desalination can be reduced by preheating water before treatment, the reduction in the energetic requirement of the desalination plant may be minimal. However, a configuration of desalination coupled with solar power offers the additional benefit of improving solar panel efficiency. While improvements in the energetic performance of these systems may be small, benefits to solar power production must also be considered and could make a desalination facility integrated with solar power a favorable configuration.
Table 3. Water treatment power requirement.
Scenarios A and CScenarios B and D
Total power requirement by desalination plant432 kW440 kW
Power required for pumping194 kW194 kW
Power required for RO treatment238 kW246 kW

4.3. Energy Model Results

The energy model was developed to estimate the size of the modeled solar and/or wind farm to be integrated with BRWO desalination. This section discusses the results the energetic analysis.
For Scenario A, the solar farm was sized to provide adequate power for water treatment when solar resources are available. In this scenario, the BWRO facility power requirement makes use of the reduced energy intensity due to the assumption of preheating water before treatment. Using this power requirement and a capacity factor 0.21 taken from solar data in Abilene [54], the model estimates a 2057 kW solar farm to be coupled with desalination for this application.
The other configuration involving solar power, Scenario C, sizes the solar farm in order to provide adequate thermal energy to preheat water before treatment. Based on principles of thermodynamics discussed in Chapter 3 [51], the energy model estimates a 1644 kW solar farm would provide adequate thermal energy for preheating of feed water to reduce the energetic intensity of desalination by the assumed value of 3.4%.
Finally, the energetic model is used to estimate the required wind farm size to provide adequate power for BWRO desalination. Scenario C assumes water is preheated before treatment while Scenario B does not include a solar farm so this assumption is omitted. The estimated wind farm size of Scenario B (1257 kW) is therefore higher than that of Scenario C (1233 kW). These results, as well as the results solar farm sizing in the energy model are summarized in Table 4.
Table 4. Solar and wind farm sizes.
Solar FarmWind Farm
Scenario A2057 kWN/A
Scenario BN/A1257 kW
Scenario C1644 kW1233 kW
The solar farm capacity to provide power for water production is greater than the required size to provide preheating of groundwater. Accordingly, feed water in Scenario A can be assumed to be preheated, because the solar farm size is greater than the necessary capacity for preheating that is estimated for Scenario C.
The results in Table 4 indicate that the capacity of the required solar and wind farms for a BWRO facility integrated with renewable power is significantly greater than the nominal power required for water production at the desalination facility. This result is expected because of the intermittent nature of wind and solar power, accounted for by the sizing capacity factors. To generate the desired daily product of 3000 m 3 per day, the solar and wind farms must have a capacity significantly larger than the power required for desalination in order to accommodate for days and hours when wind speeds and solar insolation may be weaker than the farm’s capacity and therefore the wind and solar farm output is less than the facility’s maximum power output. A key benefit of coupling renewable power with desalination is that water treatment is a time-flexible process that can be operated when wind and solar resources are available to drive water production. Water is easily stored and therefore water treatment offers an ideal opportunity to utilize renewable energy, which is often produced at non-ideal times. The fact that water treatment process can be operated on a schedule determined by power availability rather than power demand makes combining wind and solar with desalination a plausible option. The energy model and associated wind and solar farm sizings estimated here indicate that it is possible to supply the desired daily product at a water treatment facility coupled with renewable power as long as the wind and solar farms are sized adequately above the nominal power requirement for desalination.

4.4. Operational Profiles from the Integrated Model

Results from the water treatment model and the energy model were used in an integrated model to develop daily schedules for a BWRO facility integrated with renewable power. By developing an optimization program to maximize revenue, the integrated model offers insight onto how a desalination plant may perform if coupled with wind and solar power. Additionally, the optimization model gives indications regarding how the desalination facility may balance the use of grid-purchased electricity versus using renewably-generated electricity.

4.4.1. Operational Profiles for Scenario A

Scenario A models a BWRO desalination plant integrated with solar power in which the solar farm is sized to provide power for water production. To gain understanding into the operations of a grid-connected solar farm, the optimization model allows for the plant to sell solar power to the ERCOT grid and buy electricity for desalination during times when it is economically favorable to do so. This situation was analyzed for a typical summer and winter day, as well for water prices of $0.20, $1.60, and $2.80 per m 3 . Figure 11 shows the potential daily operations for Scenario A on a typical summer day.
In Figure 11, it is interesting to note that there exist significantly long times of day when solar-generated electricity is sold to the grid rather than used for water treatment. During times when electricity prices are high, specifically during late afternoon and early evening, it is more profitable for the integrated BWRO/solar facility to sell solar-generated electricity to the grid, rather than use it for desalination. For water prices of $1.60 and $2.80 per m 3 , the facility elects to purchase additional electricity because producing water is economically attractive in the cases modeling moderate and relatively high water prices. For a water price of $0.20 per m 3 , the facility chooses to halt desalination and only produce the minimum desired daily product when solar power is unavailable or being sold to the grid.
Figure 11. Optimal operational profiles for Scenario A during summer.
Resources 04 00227 g011
Similarly, for Scenario A during winter, there are times of day when electricity prices are high enough that it is economically attractive to sell solar-generated electricity to the grid rather than use it for water production. Additional electricity is purchased from the grid to power desalination for water prices of $1.60 and $2.80 per m 3 , while desalination is temporarily discontinued when the modeled water price is $0.20 per m 3 .
The optimal operational profiles for Scenario A indicate that coupling desalination with solar power offers a potential benefit in providing flexibility to the integrated facility; revenue can be generated from water production or from solar power production depending on the season and time of day. However, the daily profiles also indicate that coupling solar power with desalination may not be appropriate for regions with high electricity prices and low water prices. Figure 11 and Figure 12 suggest that there are a number of times of day when the facility would prefer to sell solar-generated electricity to the grid and purchase additional electricity for desalination. The fact that solar power availability typically matches demand means that it is often economically attractive to use solar-generated electricity to meet demand from the grid, rather than use it for a time-flexible process such as desalination. The operational profiles shown in Figure 11 and Figure 12 suggest that there are a number of times of day during both winter and summer that the integrated facility may choose to sell solar-generated electricity rather than use this on-peak energy source for desalination.
Figure 12. Optimal operational profiles for Scenario A during winter.
Resources 04 00227 g012

4.4.2. Operational Profiles for Scenario B

Results from Scenario B indicate that coupling desalination with an off-peak energy source such as wind power may be a better fit configuration to integrate with water production than solar power. In Scenario B, there are very limited periods of time when the facility elects to sell wind power to the grid, rather than use it for desalination. Throughout most of the day, wind is dedicated to the water treatment process. These results are in sharp contrast with results for Scenario A, when the facility elects to sell power to the grid on multiple instances. As indicated in the following results from Scenario B, coupling wind power with desalination is preferable to integrating solar power with desalination.
In the summer profile for Scenario B, there is a brief period in the afternoon when wind-generated electricity is sold to the grid rather than used for water production. Additional electricity was purchased during this time at a modeled water prices of $1.60 and $2.80 per m 3 so that the BWRO facility may continue to operate at full capacity. At the water price of $0.20 per m 3 , desalination was discontinued in the afternoon when electricity prices rise and the facility chooses to sell wind-generated electricity to the grid. These results are shown in Figure 13.
Figure 13. Optimal operational profiles for Scenario B during summer.
Resources 04 00227 g013
For the winter day in Scenario B shown in Figure 14, wind power is dedicated to desalination rather than sold to the grid. For the cases modeling moderate and high water prices, wind-generated electricity is used exclusively for desalination whenever available and only excess wind power is sold to the grid once the energetic requirement for water production is met. This result occurs because wind power mismatches energy demand, meaning peak output from the farm occurs during the off-peak hours of energy demand. Accordingly, electricity prices are not high enough when wind speeds are strong to warrant selling wind-generated electricity to the grid. Figure 14 showing Scenario B during a typical winter day indicates that wind power is used for water production throughout the entirety of the day in the situations modeling moderate and high water prices. In these cases, it makes sense for the facility to use wind power exclusively for water production and only sell wind-generated electricity to the grid once the demand from desalination is met. The fact that the plant elects to use wind-generated electricity for desalination rather than sell wind power to the grid indicates that using wind power for a time-flexible process such as desalination may be an appropriate application for this intermittent energy source.
Figure 14. Optimal operational profiles for Scenario B during winter.
Resources 04 00227 g014
A comparison of Scenario A and Scenario B shows that electricity is sold to the grid more frequently when the desalination plant is coupled with solar power than when desalination is integrated with wind power. This result occurs because solar power production matches energy demand while wind power production typically mismatches demand. A comparison of the operational profiles for Scenarios A and B indicate that wind power is better suited than solar power for a time flexible process such as water production than solar power. The following section compares these operational profiles.

4.4.3. Operational Profiles for Scenario C

Results from Scenario C indicate that using a co-located solar farm to preheat brackish groundwater water (while simultaneously cooling solar panels with water) and dedicating wind-generated electricity to water production may be a prudent appropriation of resources for a desalination facility integrated with renewable power. As shown in the following section, this configuration appears to offer beneficial timing of available wind and solar power. Solar panels can be used to reduce the energy required to treat water while generating electricity to meet demand from the grid. Wind power, which mismatches energy demand, can be used for time-flexible process such as desalination. The results from Scenario C demonstrate this idea.
During a typical summer day, shown in Figure 15, wind-generated electricity is able to provide adequate power for desalination for a majority of the day, while solar-generated electricity is sold to the grid during times of high energy demand. For the modeled water price of $0.20 per m 3 , water treatment is operated throughout the night and early morning. Wind-generated electricity is sufficient to power this process, as indicated by the fact that electricity is not purchased from the grid while desalination is operated. When electricity prices rise in the afternoon, desalination is discontinued because it is economically favorable to sell wind-generated electricity to the grid rather use wind power for desalination in the model when the water price is low. For the case with this low modeled water price, the BWRO desalination plant is not operating at capacity, but rather provides the minimum daily requirement, 1000 m 3 of treated water.
At the modeled moderate and high water prices, desalination is economically attractive and facility operates at capacity all day. Throughout the night and during a majority of the day, the facility uses exclusively wind-generated electricity to produce water. There is a short period of time in the afternoon when electricity is purchased from the grid to power the desalination process and wind resources are sold to the grid. However, for water prices of $1.60 and $2.80 per m 3 , the BWRO facility is able to produce water using wind-generated electricity throughout most of the day. During the night, morning, and part of the afternoon, wind resources are sufficient to power desalination and no electricity is purchased by the BWRO plant. Electricity prices are high enough in late afternoon (approximately 15:00 to 17:00) such that wind-generated electricity is sold to the grid and additional electricity is purchased to power desalination. For the remainder of the day, water treatment is powered solely by wind-generated electricity and only excess wind power is sold to the grid at times when wind speeds are strong enough to power water production and produce excess electricity to sell to the grid. The fact that the facility would be reliant on wind rather than grid-purchased electricity for most of the day indicates that wind power is ideal for coupling with desalination; wind power is typically available during time periods when energy demand from the grid is low and therefore can be paired with a time-flexible process such as desalination. Figure 15 demonstrates this idea with the indication that wind-generated electricity is dedicated to desalination during a majority of the day and there is only a short period of time when electricity is purchased from the grid.
Figure 15. Optimal operational profiles for Scenario C during summer.
Resources 04 00227 g015
Additionally, Figure 15 indicates that solar-generated electricity is well suited to meet energy demand from the grid. As expected, revenue is generated from solar power during daytime hours and peaks during the late afternoon when energy demand rises and solar insolation is strong. The times when the facility is able to sell solar power to the grid match times of highest demand, in the morning and afternoon. Accordingly, the facility is able to sell electricity at peak prices. Revenue from selling solar electricity is an important component in the analysis of revenue sources for Scenario C, discussed later in this report. The results in Figure 15 demonstrate that wind power can adequately supply the energetic requirement for desalination while solar-generated electricity can bring in an additional revenue stream during peak times of day.
The winter profiles for Scenario C also demonstrate a situation in which wind-generated electricity is dedicated to desalination while solar power is produced during times with relatively high electricity demand. Figure 16 suggests that wind resources are used only for desalination when the modeled water price $0.20 per m 3 , with the exception of three very short time periods where wind-generated electricity is sold to the grid and water treatment is temporarily discontinued. For the majority of the day, wind power is dedicated to desalination and provides adequate power for the treatment process.
Figure 16. Optimal operational profiles for Scenario C during winter.
Resources 04 00227 g016
For the relatively moderate and high modeled water prices of $1.60 and $2.80 per m 3 , wind-generated electricity is used exclusively for water production. Only excess wind-power, beyond that required for desalination, is sold to the grid during nighttime hours and in the very early morning. There exists no times in the day when it is economically favorable to sell wind power to the grid and purchase electricity for desalination, indicating that integrating desalination with wind power is a suitable combination based on the time-availability of wind resources. Because wind-generated electricity is typically available during times of low energy demand, the integrated model suggests that wind energy should be dedicated to desalination rather than sold to the grid at the modeled facility in order to limit cost and maximize total project revenue. Figure 16 indicates that dedicating wind power to water production is an economically attractive approach, as there exist limited times in the day when wind power is sold to the grid rather than used for desalination.
Similar to the summer profile, solar power in the profile for the typical winter day shows that using solar power to meet energy demand from the grid and to preheat water at the BWRO plant is an appropriate use of resources. Figure 16 indicates that revenue from solar power is generated during a majority of the day (from about 7:00 to 19:00) when energy demand from the grid is relatively high. The modeled facility therefore generates revenue from the sale of solar-generated electricity, while using wind power to meet the energy demands of the water treatment process.
Results from Scenario C shown in Figure 15 and Figure 16 indicate that this configuration fits aptly with the intermittent nature of wind and solar resources: wind power is typically available during times of low energy demand and can therefore be used for desalination while solar power is typically available during times of peak energy demand and can therefore be sold to the grid. The relatively low frequency of purchasing grid electricity for the operational profile of Scenario C indicates that wind provides adequate power for water production. Additionally, the solar farm is an important aspect of this configuration for its role in reducing the energy intensity of the BWRO treatment process. The operational analysis shown here provides insight into the potential performance of a desalination facility integrated with both wind and solar power.

4.4.4. Operational Profiles for Scenario D

Finally, the integrated model was run for Scenario D, assuming electricity is supplied solely by the ERCOT grid at the average retail price of electricity for industrial consumers from 2012, which was $0.068 per kilowatt hour [60]. Scenario D can be used as a reference point to compare desalination power by renewable energy in Scenarios A, B, and C to a standard case in which desalination is powered by grid-purchased electricity.
Results for Scenario D indicate that the model is highly sensitive the chosen price of water. At a water price of $0.20 per m 3 , the plant elects to not operate at capacity, but rather provide only the minimum daily product of 1000 m 3 per day indicating that it is not economically desirable to produce water at this price. Intermittent times of day for desalination are chosen to produce the minimum daily product. For the remainder of the day, the plant discontinues desalination to maximize project revenue because the cost of electricity and brine disposal are greater than the revenue from water sales. These findings suggest that a desalination facility without integrated renewable power may not be an economically attractive option for water production in regions with low water prices. As indicated by Figure 17, it is prudent for plant to discontinue desalination and only provide the minimum daily product for Scenario D at a water price of $0.20 per m 3 . As shown in Figure 17, the operation of water production is intermittent. The intermittent operation is a result of the optimization setup. The model selects random times to produce water to meet the minimum requirement.
Figure 17. Operational profiles for Scenario D assuming a low modeled water price.
Resources 04 00227 g017
The analysis of Scenario D indicates that when the modeled water price is moderate to high, water production is profitable for the BWRO plant and therefore the facility chooses to operate at capacity at all times. At any chosen water price above $1.60 per m 3 , the facility elects to produce the daily maximum of water because the cost of selling water outweighs the costs of purchasing electricity from the grid and of brine disposal. For any modeled water price greater than $1.60 per m 3 , the facility will produce water throughout the entirety of the day using electricity purchased from the grid at an industrial electricity price. This result indicates that desalination may be economically attractive for regions with moderate to high electricity prices in Texas, even when no renewable power is provided and the facility purchases electricity from the grid. However, this determination cannot be fully concluded without an analysis of capital and operational costs. An analysis of capital and operational costs is beyond the scope of this work, but may be included in future work.
It is economically desirable for the plant to produce water for the moderate and high water prices of $1.60 and $2.80 per m 3 . Electricity is purchased from the grid to supply the energetic requirement of desalination for the entirety of the day, as shown in the figure below.
Results from Scenario D provide insight into the findings from Scenarios A, B, and C and demonstrate the sensitivity of this model to the chosen price of water. For the low modeled water price in Scenario D, it is not economically desirable to produce water and therefore the plant elects to only provide the minimum daily product. These results correspond to cases where the model chooses to halt desalination in Scenarios A, B, and C. For the renewable power configurations (solar power in Scenario A and wind power in Scenarios B and C) electricity resources are used for desalination to produce only the minimum daily product at selected times. Once the minimum desired daily product is met, wind- and solar-generated electricity are sold to the grid to maximize profits because it is more profitable to sell electricity than to produce water at a low modeled price of water. In these cases, the maximum allowable wind and solar power are sold to the grid and the minimum allowable amount of water is produced to maximize revenue. The model only desalinates water using renewable power when electricity prices are low.
Conversely, for the moderate and high water prices in Scenario D, it is economically desirable to produce water and therefore the plant elects to operate at capacity at all times. This result corresponds to findings in the operational profiles of Scenarios A, B, and C with respect to purchasing electricity from the grid. In these scenarios, there are certain times of day when it is more profitable to sell solar- or wind-generated electricity to the grid rather than use it for desalination. However, producing water is still economically profitable, and therefore additional electricity is purchased to enable the plant to operate at capacity at all times of day. Scenario D indicates that desalination is economically attractive for moderate and high modeled water prices, even when the plant must spend additional money to purchase electricity. Results from Scenario D correspond to findings in Scenarios A, B, and C indicating electricity is purchased from the grid during times when renewable power is sold to the grid to continue desalinating water at all times.
Results from Scenario D are valuable in assessing the sensitivity of the model to the chosen water price. When a low modeled water price is selected, desalination is not profitable because the cost of electricity and brine disposal outweigh revenue from water production. The facility therefore elects to only produce the minimum daily product. When a moderate to high water price is chosen, desalination is economically attractive and the facility elects to produce water at capacity throughout the entirety of the day. These findings indicate that desalination can be profitable for regions in Texas with moderate to high water prices, even if renewable power is not provided and the facility purchases electricity from the grid.

4.5. Comparison of Electricity Costs

A comparison of electricity costs indicates that integrating desalination with renewable power can significantly reduce operational costs of water treatment. Table 5 and Table 6 list electricity costs for each scenario for a typical summer and winter day, respectively.
Table 5. Daily electricity cost for a typical summer day.
Water Price$0.20 per m 3 $1.60 per m 3 $2.80 per m 3
Daily cost of electricity for Scenario A$0$409$409
Daily cost of electricity for Scenario B$0$97$97
Daily cost of electricity for Scenario C$0$91$91
Daily cost of electricity for Scenario D$243$729$729
Table 6. Daily electricity cost for a typical winter day.
Water Price$0.20 per m 3 $1.60 per m 3 $2.80 per m 3
Daily cost of electricity for Scenario A$0$426$426
Daily cost of electricity for Scenario B$0$89$89
Daily cost of electricity for Scenario C$0$78$78
Daily cost of electricity for Scenario D$243$729$729
Scenario C provides the configuration with the lowest daily cost of electricity due to the capability of this modeled facility to power the treatment process with wind energy while using solar panels to reduce the energetic intensity of desalination. Having wind power on site significantly reduces electricity costs because the facility chooses to use wind power for desalination throughout most of the day in this scenario. Compared to Scenario D, in which all electricity for water production is purchased from the grid, daily electricity costs in Scenario C are significantly lower. Offering such a configuration can significantly reduce operational expenses at a desalination plant because the electricity costs often comprise the greatest expense of a desalination plant [11]. Scenario C provides the most cost-effective configuration for reducing electricity costs.
Scenario B, the modeled desalination facility integrated with wind power, offers another economical solution to limiting energy costs. The daily cost of electricity in Scenario B is a fraction of that in Scenario A. This result indicates that integrating desalination with wind power is an intelligent paring while desalination integrated with solar power may not be a good fit. In Scenario B, the times when wind is available coincide with times of low energy demand and therefore low electricity prices on the grid. Therefore, the facility chooses to use wind to power water treatment rather than selling wind-generated electricity. Because wind is used for desalination, electricity costs from the grid are low in Scenario B. Conversely, the times when solar power is available coincide with times of high electricity prices and the facility therefore chooses to sell solar power to the grid rather than use it for desalination. The configuration in Scenario A is required to purchase energy to power water treatment from the grid which results in relatively high electricity costs. As indicated by the comparison shown in Table 5 and Table 6, electricity costs for the desalination facility integrated with wind power are significantly lower than the modeled desalination facility integrated with solar power. Pairing wind with water treatment offers an economically attractive configuration that can significantly reduce electricity purchases from the grid and operational expenses.
Scenario C, the configuration of desalination integrated with a wind farm and co-located with a solar farm, is a prudent option for reducing electricity costs. This facility is able to power desalination with an on-site resource (wind) while using an onsite technology (solar panels) to reduce the electricity requirement of desalination. The modeled scenarios shown here suggest that paring desalination with renewable power can significantly limit operational expenses.

4.6. Comparison of Revenues from Water and Electricity in Scenario C

The analysis of Scenario C indicates this configuration is also economically preferable because it allows the facility to generate significant revenue from two different and unrelated sources: water and electricity. By selling water from the integrated desalination facility and on-peak electricity from the co-located solar farm (and a small amount of electricity from the wind farm), the configuration offered in Scenario C can reduce risks associated with a decline of either water or electricity sales. For periods of time where water sales drop, the facility can potentially profit from electricity generation. When solar resources are weak, the facility can still bring in money from water sales. The revenue breakdown discussed in this section indicates that electricity sales from the co-located solar farm and integrated wind farm make a significant portion of overall revenue from the facility modeled in Scenario C.
Figure 18 shows the revenue breakdown for a low modeled water price of $0.20 per m 3 .
Figure 18. Relative revenue from water and electricity sales for cases with a low modeled water price.
Resources 04 00227 g018
As indicated in Figure 18, daily revenue from electricity sales comprise a significant portion of overall revenue at a low water price. For the modeled summer day, revenue from solar and wind power production are actually greater than revenue from water sales. Revenue from water sales outweighs that from electricity sales for the winter day, however, electricity sales nonetheless provide over 35% of overall revenue. The fact that revenue expected from electricity sales and water sales are comparable indicates that the facility will not be at risk of major losses on a day where either electricity or water sales are low. If the facility is not able to sell water on a particular day, the plant can still generate significant revenue from electricity generation. On days when solar and wind power production are weaker than usual, the facility will still be able to generate revenue from water production. By providing these two revenue streams, the configuration offered in Scenario C can potentially reduce risks associated with dips in either water or electricity sales. Diversity in revenue streams could me a prudent approach.
For modeled cases with moderate and high electricity prices, revenue from water sales outweighs that from electricity, as shown in Figure 19 and Figure 20. However, revenue from electricity is nonetheless significant in these cases.
Figure 19 and Figure 20 indicate for regions with moderate or high water prices, revenue from water sales will control the overall potential profitability of the facility. However, although electricity sales are a much smaller portion of overall plant revenue, solar and wind power production can still improve the economic attractiveness of the desalination facility in these cases. The model indicates that the percentage of revenue from electricity ranges from approximately 3% to 11% when the modeled water price is moderate to high. These numbers suggest that revenue from electricity could still be significant to overall plant revenue, even though revenue from water sales are much greater than that of electricity sales. The facility is able to generate more of its profit from water because of the increased water rate, however, revenue from electricity sales makes up a noticeable portion of overall operating revenue in these cases.
Figure 19. Relative revenue from water and electricity sales for cases with a moderate modeled water price.
Resources 04 00227 g019
Figure 20. Relative revenue from water and electricity sales for cases with a high modeled water price.
Resources 04 00227 g020
Risk from reduced water production can be mitigated by altering the sizing methodology of the integrated wind farm or co-located solar farm. Recall that in Scenario C, the wind farm is sized to provide adequate power for water production while the solar farm is sized to provide preheating of brackish groundwater. However, the size of the wind and/or solar farm can be increased if the investor would like to further reduce the risk of a decline in water sales. Likely, the solar farm capacity will be increased, which would allow the facility to sell more solar power and generate a greater portion of overall profit from electricity. Sizing the solar farm for economic purposes rather than to preheat feed water for the desalination facility can make Scenario C a less risky investment by ensuring a significant portion of revenue is generated from electricity generation.
The revenue breakdown between water and electricity in Scenario C indicates that this configuration offers an investment that is potentially protected from changes in the water or electricity markets. The facility can generate significant revenue from electricity if water sales decline. Likewise, the facility can make money from water production on days when solar or wind resources are weak. Diversity in revenue streams is an important consideration of a desalination plant integrated with renewable power.
The analysis performed in this investigation contributes insight into the water-energy nexus involved with desalination. Results indicate that wind and solar power have advantages for pairing with brackish groundwater desalination. Additionally, this investigation provides a modeling methodology to study desalination integrated with wind and solar power. The following section highlights some of the key results, discusses ideas for future work, and offers policy recommendations.

5. Conclusions

As demonstrated in the integrated model for Scenario C, wind-generated electricity is sufficient to meet the energetic requirement of desalination for a majority of the day while solar-generated can be sold to the grid at times of relatively high energy demand. The operational profile for this configuration indicates that electricity purchased from the grid is limited. Having power from the wind farm available during night and early morning limits the amount of electricity purchased from the grid by the integrated facility. The configuration is therefore not heavily reliant on carbon-emitting fossil fuels and offers a suitable use for intermittent wind resources. Additionally, the analysis indicates that the facility can generate significant revenue from solar power, which is produced at on-peak hours when electricity prices are high. The times when solar-generated electricity is sold to the grid in Scenario C match times of relatively high energy demand. Hence this configuration offers an advantage of providing an additional revenue stream from solar power production that could be important to diversifying the revenue streams at the facility. By selling electricity to the grid during times of peak demand and preheating feed water to reduce the energetic intensity of water production, the solar farm is a key aspect of Scenario C. The BWRO facility integrated with wind power and co-located with a solar farm offers advantages inherent to both wind and solar power.
The breakdown of daily revenue in Scenario C indicates that this configuration may provide an opportunity to mitigate risks associated with fluctuations in the water or electricity markets. In Scenario C, the facility is able to generate revenue from both water and electricity sales, diversifying potential profit sources. The analysis demonstrates that revenue from electricity and water sales are comparable in size for cases with low modeled water prices, meaning the facility will not be dependent on one revenue source, but rather will have diversity. For cases with moderate to high water prices, revenue from water sales is greater than that from power production, however, revenue from electricity is still significant in these cases. In finding that revenue from electricity sales are significant in all cases, it can be concluded that providing a co-located solar farm is an opportunity to incorporate diversity in the revenue streams of the facility. The model of Scenario C suggests that the facility will be protected from suffering big losses if either water or electricity sales decline. If the facility is unable to sell water for a particular period of time, electricity sales can still bring in revenue. Likewise, on days when solar or wind resources are weak and electricity is not being generated, the facility can still profit from water production. By providing two sources of revenue, a desalination facility integrated with wind power and co-located with a solar farm can reduce the risk of investing in stand-alone desalination or renewable energy.

5.1. Future Work

There are many extensions on this analysis of the water-energy nexus that are possible. While this analysis investigated potential daily revenue from solar power, wind power, and water production, future work estimating the cost of the required technologies would be a useful addition. In particular, an investigation of the capital and operational costs of a desalination facility powered by a wind farm and co-located with a solar farm with PVT modules would offer insight into benefits and tradeoffs associated with such as system. The cost of providing both wind and solar power are likely significant considerations that must be accounted for and therefore a cost-benefit analysis of such a system would be useful. The breakdown of daily revenue water and electricity sales estimated in this investigation would offer useful methodology if such a cost-benefit analysis is performed. Additionally, the potential for the integrated facility to participate in an ancillary services market should be considered in the cost-benefit analysis. Power providers can often benefit from selling ancillary services in addition to directly participating in the real-time electricity market. It is possible that the wind and solar farm modeled in this analysis can improve their profitability by being part of the ancillary services market. A cost-benefit analysis of capital and operational costs that includes potential to sell ancillary services would be a useful extension of the work discussed in this investigation.

5.2. Recommendations

A key recommendation concluded by the investigation is that the energy and water sectors have a chance to collaborate for the benefit of both parties. Meeting water needs can have adverse consequences on the energy sector’s goal of reducing reliance on carbon-emitting fuels. At the same time, however, supplying drinking water offers an opportunity to advance renewable power technologies, taking positive steps on the energy front. Integrating desalination with renewable power is a unique opportunity to advance the implementation and uses of wind and solar power. Results from this investigation indicate that collaboration can unite the water and energy sectors for the benefit of both parties. Particularly, combining desalination, wind power, and solar power can overcome challenges associated with each of these technologies and may be preferable to stand-alone water or power producing facilities.

Acknowledgments

Gary M. Gold would like to acknowledge the National Science Foundation for the Graduate Research Fellowship funding opportunity.
Additional support was also provided by the Texas State Energy Conservation Office.

Author Contributions

Gary Gold synthesized the maps, text, analysis, and figures in this paper. Michael E. Webber was a principal investigator and provided text, guidance, and editing to this paper.

Conflicts of Interest

The authors declare no conflict of interest.

References

  1. United State Census Bureau. State and County Quick Facts; United State Census Bureau: Washington, DC, USA, 2010.
  2. United States Global Change Research Program, National Climate Assessment. Climate Change Impacts in the United States; United States Global Change Research Program: Washington, DC, USA, 2014.
  3. Clayton, M.; Stillwell, A.; Webber, M. Implementation of Brackish Groundwater Desalination Using Wind-Generated Electricity: A Case Study of the Energy-Water Nexus in Texas. Sustainability 2014, 6, 758–778. [Google Scholar] [CrossRef]
  4. Desalination : Brackish Groundwater; Texas Water Development Board: Austin, TX, USA, 2013.
  5. Miller, J.E. Review of Water Resources and Desalination Technologies; Sandia National Laboratories: Albuquerque, NM; Livermore, CA, USA, 2003.
  6. Committee on Advancing Desalination Technology. Desalination: A national perspective; The National Academies Press: Washington, DC, USA, 2008. [Google Scholar]
  7. Greenlee, L.F.; Lawler, D.F.; Freeman, B.D.; Marrot, B.; Moulin, P. Reverse osmosis desalination: Water sources, technology, and today’s challenges. Water Res. 2009, 43, 2317–2348. [Google Scholar] [CrossRef]
  8. Desalination Plant Database; Texas Water Development Board: Austin, TX, USA, 2014.
  9. 2012 State Water Plan; Texas Water Development Board: Austin, TX, USA, 2012.
  10. Mickley and Associates. Membrane Concentrate Disposal : Practices and Regulation; U.S. Department of the Interior: Denver, CO, USA, 2006.
  11. Rainwater, K.; Nash, P.; Song, L.; Schroeder, J. The Seminole Project: Renewable Energy for Municipal Water Desalination. J. Contemp. Water Res. Educ. 2013, 151, 50–60. [Google Scholar] [CrossRef]
  12. United States Department of Energy. 2012 Wind Technologies Market Report; United States Department of Energy: Washington, DC, USA, 2012.
  13. United States Department of Energy. 2013 Wind Technologies Market Report; United States Department of Energy: Washington, DC, USA, 2013.
  14. Electric Reliability Council of Texas (ERCOT). Entity-Specific Resource Output; ERCOT: Austin, TX, USA, 2012. [Google Scholar]
  15. Sandia National Laboratories. Electric Power Industry Need for Grid-Scale Storage Applications; Sandia National Laboratories: Albuquerque, NM, USA, 2010.
  16. Ma, Q.; Lu, H. Wind energy technologies integrated with desalination systems: Review and state-of-the-art. Desalination 2011, 277, 274–280. [Google Scholar] [CrossRef]
  17. Forstmeier, M.; Mannerheim, F.; D’Amato, F.; Shah, M.; Liu, Y.; Baldea, M.; Stella, A. Feasibility study on wind-powered desalination. Desalination 2007, 203, 463–470. [Google Scholar] [CrossRef]
  18. Zejli, D.; Benchrifa, R.; Bennouna, A.; Zazi, K. Economic analysis of wind-powered desalination in the south of Morocco. Desalination 2004, 165, 219–230. [Google Scholar] [CrossRef]
  19. Kershrnana, S.A.; Rheinl, J.; Gablerb, H. Seawater reverse osmosis powered Tom renewable energy sources— Hybrid wind/photovoltaic/grid power supply for small-scale desalination in Libya. Desalination 2002, 153, 17–23. [Google Scholar]
  20. United States Department of Energy. 2010 Solar Technologies Market Report; United States Department of Energy: Washington, DC, USA, 2011.
  21. BP Statistical Review of World Energy 2014. Available online: http://www.bp.com/content/dam/bp/pdf/Energy-economics/statistical-review-2014/BP-statistical-review-of-worldenergy-2014-full-report.pdf (accessed on 20 April 2015).
  22. Peterson, G.; Fries, S.; Mohn, J.; Muller, A. Wind and solar powered reverse osmosis desalination units: Description of two demonstation projects. Desalination 1979, 31, 501–509. [Google Scholar] [CrossRef]
  23. Headley, O. Renewable energy technologies in the Caribbean. Sol. Energy 1997, 59, 1–9. [Google Scholar] [CrossRef]
  24. Ghermandi, A.; Messalem, R. Solar-driven desalination with reverse osmosis: The state of the art. Desalin. Water Treat. 2009, 7, 285–296. [Google Scholar] [CrossRef]
  25. Weiner, D.; Fisher, D.; Moses, E.J.; Katz, B.; Meron, G. Operation experience of a solar- and wind-powered desalination demonstration plant. Desalination 2001, 137, 7–13. [Google Scholar] [CrossRef]
  26. Zhu, A.; A. Rahardianto, P.D.C.; Cohen, Y. Reverse Osmosis Desalination with High Permeability Membranes—Cost Optimization and Research Needs. Desalin. Water Treat. 2010, 15, 256–266. [Google Scholar]
  27. Gude, V.G. Energy storage for desalination processes powered by renewable energy and waste heat sources. Appl. Energy 2015, 137, 877–898. [Google Scholar] [CrossRef]
  28. Charcosset, C. Combining membrane processes with renewable energy technologies: Perspectives on membrane desalination, biofuels and biogas production, and microbial fuel cells. Membr. Clean Renew. Power Appl. 2014, 1, 44–62. [Google Scholar]
  29. Chow, T. A review on photovoltaic/thermal hybrid solar technology. Appl. Energy 2010, 87, 365–379. [Google Scholar] [CrossRef]
  30. Skoplaki, E.; Palyvos, J. On the temperature dependence of photovoltaic module electrical performance: A review of efficiency/power correlations. Sol. Energy 2009, 83, 614–624. [Google Scholar] [CrossRef]
  31. Skoplaki, E.; Palyvos, J. Operating temperature of photovoltaic modules: A survey of pertinent correlations. Renew. Energy 2009, 34, 23–29. [Google Scholar] [CrossRef]
  32. Solimpeks Academy. Volther Hybrid PV-T Panels; Solimpeks Academy: Karatay, Turkey, 2010. [Google Scholar]
  33. Mittelman, G.; Kribus, A.; Mouchtar, O.; Dayan, A. Water desalination with concentrating photovoltaic/thermal (CPVT) systems. Sol. Energy 2009, 83, 1322–1334. [Google Scholar] [CrossRef]
  34. El-dessouky, B.H.; Alatiqi, I.; Bingulac, S.; Ettouney, H. Steady-State Analysis of the Multiple Effect Evaporation Desalination Process. Chem. Eng. Technol. 1998, 21, 437–451. [Google Scholar] [CrossRef]
  35. Mittelman, G.; Kribus, A.; Dayan, A. Solar cooling with concentrating photovoltaic/thermal (CPVT) systems. Energy Convers. Manag. 2007, 48, 2481–2490. [Google Scholar] [CrossRef]
  36. Van Helden, W.G.J.; van Zolingen, R.J.C.; Zondag, H.a. PV thermal systems: PV panels supplying renewable electricity and heat. Progr. Photovolt.: Res. Appl. 2004, 12, 415–426. [Google Scholar] [CrossRef]
  37. Davis, T.; Cappelle, M. Hybrid Photovoltaic/Thermal (PV-T) Systems for Water Desalination; UTEP Center for Inland Desalination: Austin, TX, USA, 2013. [Google Scholar]
  38. United States Department of Energy, National Renewable Energy Labotatory. stalled Wind Capacity; United States Department of Energy: Washington, DC, USA, 2014.
  39. United States Department of Energy: National Renewable Energy Laboratory. Dynamic Maps, GIS Data, and Analysis Tool: U.S. 50m Wind Resource Map; United States Department of Energy: Washington, DC, USA, 2009.
  40. Lopez, A.; Roberts, B.; Heimiller, D.; Blair, N.; Porro, G. US Renewable Energy Technical Potentials : A GIS-Based Analysis. Contract 2012, 303, 275–3000. [Google Scholar]
  41. United States Department of Energy, National Renewable Energy Laboratory. Dynamic Maps, GIS Data, and Analysis Tools: Solar Maps; United States Department of Energy: Washington, DC, USA, 2014.
  42. United States Department of Energy, National Renewable Energy Labratory. The Open PV Project; United States Department of Energy: Washington, DC, USA, 2013.
  43. United States Department of Energy, National Renewable Energy Laboratory. Dynamic Maps, GIS Data, and Analysis Tools: 10-Kilometer Solar Data; United States Department of Energy: Washington, DC, USA, 2014.
  44. Wogan, D.M.; Webber, M.E.; da Silva, A. A Framework and Methodology for Reporting Geographically and Temporally Resolved Solar Data: A Case Study of Texas. J. Renew. Sustain. Energy 2010, 2, 053107. [Google Scholar] [CrossRef]
  45. Texas Water Development Board. Groundwater Database; Texas Water Development Board: Austin, TX, USA, 2009.
  46. Al-Karaghouli, A.; Kazmerski, L.L. Energy consumption and water production cost of conventional and renewable-energy-powered desalination processes. Renew. Sustain. Energy Rev. 2013, 24, 343–356. [Google Scholar] [CrossRef]
  47. Klein, G.; Krebs, M. California’s Water—Energy Relationship Final Staff Report 2005. Available online: http://www.energy.ca.gov/2005publications/CEC-700-2005-011/CEC-700-2005-011-SF.PDF (accessed on 20 April 2015).
  48. Semiat, R. Critical Review Energy Issues in Desalination Processes. Environ. Sci. Technol. 2008, 42, 8193–8201. [Google Scholar] [CrossRef] [PubMed]
  49. Texas Comptroller of Public Accounts. Liquid Assest: The State of Texas’ Water Resources. 2009. Available online: http://www.window.state.tx.us/specialrpt/water/2009/PDF/96-1360-LiquidAssets.pdf (accessed on 20 April 2015).
  50. Stillwell, A.S. The Energy-Water Nexus in Texas. Ph.D. Thesis, The University of Texas at Austin, Austin, TX, USA, 2010. [Google Scholar]
  51. Moran, M.J.; Shapiro, H.N.; Boettner, D.D.; Bailey, M.B. Fundamentals of Engineering Thermodynamics, 7 ed.; Wiley: Hoboken, NJ, USA, 2010. [Google Scholar]
  52. Environmental Proctection Agency. Average Temperature of Shallow Groundwater; Environmental Protection Agency: Washington, DC, USA, 2013.
  53. Fudholi, A.; Sopian, K.; Yazdi, M.H.; Ruslan, M.H.; Ibrahim, A.; Kazem, H.A. Performance analysis of photovoltaic thermal (PVT) water collectors. Energy Convers. Manag. 2014, 78, 641–651. [Google Scholar] [CrossRef]
  54. Electric Reliability Coucil of Texas. Abilene Solar Farm Entity-Specific Resource Output; Electric Reliability Council of Texas: Austin, TX, USA, 2002. [Google Scholar]
  55. Electric Reliability Council of Texas. Sweetwater 1 Wind Farm Entity-Specific Resource Output; Electric Reliability Council of Texas: Austin, TX, USA, 2010. [Google Scholar]
  56. Kendrick, D.A.; Mercado, P.R.; Amman, H.M. Computational Economics; Princeton University Press: Princeton, NJ, USA, 2006. [Google Scholar]
  57. Hardberger, A.; Kelly, M. From Policy to Reality; Environmental Defense Fund: NY, USA, 2008. [Google Scholar]
  58. Mickley, M.C. Membrace Concentrate Disposal: Practices and Regulation, Reclamation: Managing Water in the West; Mickley and Associates: Boulder, CO, USA, 2006. [Google Scholar]
  59. Foldager, R.A. Economics of Desalination Concentrate Disposal Methods in Inland Regions: Deep-Well Injection, Evaporative Ponds, and Salinity Gradient Solar Ponds. Ph.D. Thesis, New Mexico State University, Las Cruces, NM, USA, 2003. [Google Scholar]
  60. United States Department of Energy, Energy Information Administration. Annual Energy Review 2011; United States Department of Energy: Washington, DC, USA, 2012.
  61. Electric Reliability Council of Texas (ERCOT). Historical RTM Load Zone and Hub Prices; ERCOT: Austin, TX, USA, 2013.

