Application of System Dynamics to Evaluate the Social and Economic Benefits of Infrastructure Projects


Entrepreneurship, Commercialisation and Innovation Centre (ECIC), The University of Adelaide, South Australia, SA 5005, Australia
*
Author to whom correspondence should be addressed.
Systems 2017, 5(2), 29; https://doi.org/10.3390/systems5020029
Submission received: 20 December 2016
/
Revised: 22 March 2017
/
Accepted: 24 March 2017
/
Published: 29 March 2017
(This article belongs to the Special Issue Systems Approaches and Tools for Managing Complexity)
Abstract
:Cost-Benefit Analysis (CBA) is often employed to inform decision makers about the desirability of transport infrastructure investment options. One of the main limitations of traditional CBA approaches is that they do not provide a dynamic view that explicitly illustrates the cost and benefit relationships between component entities over time. This paper addresses this issue by describing a System Dynamics (SD) approach that can perform transport infrastructure CBA through the application of systems thinking to develop a causal-loop model that can subsequently be operationalised into an executable stock-and-flow model. Execution of this model readily enables sensitivity analysis of infrastructure investment options and visualisation of the cost-benefit behaviour of each variant over time. The utility of the approach is illustrated through a case study, the Co Chien Bridge project in Vietnam, using a model that incorporates conventional economic metrics and factors that measure indirect project benefits, such as impact on gross domestic product, unemployment rate, and total taxes gained from affected economic sectors.
1. Introduction
Physical infrastructure projects currently have an extremely important role in integrating transport networks among states and different countries. Furthermore, these infrastructure projects have been identified as a major contributing factor to economic growth. Infrastructure projects often consume a huge amount of capital and other resources, and, as such, it is vital to select them with care and to understand all of the potential benefits and risks. Otherwise they may suffer from common issues such as cost overrun and benefit shortfalls [1]. Furthermore, decision making at the initiating stage has been highlighted as a critical problem during infrastructure planning [2]. At present, to deal with this issue, planners often use tools, such as Cost-Benefit Analysis (CBA), which have been developed over several decades, to produce evidence to support investment decisions. CBA also enables project managers to allocate resources efficiently and to mitigate project risks.
Studies have identified links between transport infrastructure developments and various economic benefits [3]. When making investment cases, most practitioners focus on using static models that are based on data regarding direct costs and the benefits to society of a particular project and then use the discounted cash flow (DCF) technique and its indices, such as net present value (NPV), internal rate of return (IRR), and cost-benefit ratio (B/C), in order to assess project financial performance. In terms of the economic and social aspects, a number of studies have proposed models that attempt to measure project impacts on the local economy and the community; for example, the General Social Impact Model [4], Leontieff’s Input-Output (IO) [5], the Residential Model [6], Computed General Equilibrium (CGE) Models [7], and macro economic analyses [8,9]. Particularly in guidelines provided by the European Commission [10] and the Asian Development Bank [11], experts and practitioners refer to ‘conversion factors’ used to transfer observed prices or public tariffs into shadow prices that better reflect the social opportunity cost of goods before applying the DCF technique to evaluate project performance.
However, some authors claim that these financial tools of the DCF technique are complicated to understand and may lack benefit and useability [12]. Furthermore, these authors claim that financial tools concentrate on model development and can omit the fundamental essence of the problem. In addition, from the point of view of microeconomic scholars, cost-benefit analysis (CBA) does not demonstrate the real benefits of transport improvements to shippers, including cost savings and service improvements [3]. Despite the fact that numerous performance measurement systems (PMS) have been designed to support planners in identifying the costs and benefits of investing infrastructure projects, many obstacles arise during the process of applying and implementing these systems in practice [13]. Bourne et al. [13] presented the concept of performance as ‘doing today what will lead to an outcome of measured value tomorrow’. In other words, the authors emphasised the ‘measured value tomorrow’ concept, which requires planners to have a different view in identifying the benefits and costs of an infrastructure project. Similarly, Lebas and Euske [14] claim that performance is a complex concept, which needs to be explained by a set of parameters or indicators that are complementary, and in some cases may be contradictory, in order to describe complicated processes with various types of outcomes and results.
The above indicate that it would be advantageous to apply an alternative approach that has the capacity to address critical issues including the omission of critical project factors and the practical difficulties in conceiving, implementing, and using the underlying models. This paper presents background information regarding cost-benefit analysis in transport infrastructure projects and the need for newer approaches, which can cope with difficulties in project evaluation. The paper describes a research methodology based upon system dynamics (SD) to analyse the relationship between socio-economic factors of CBA in both qualitative and quantitative terms. The final section of the paper discusses the application of this approach to provide insights on CBA in a selected case study.
2. Literature Review
Population pressure coupled with high levels of transport congestion and, hence, travel delays are driving demand for transport infrastructure projects. Such projects involve large investments in capital and related resources and, not surprisingly, are subject to substantial project appraisals. Evaluation of projects can be expensive, which is why many decision-making personnel tend to fall back on tried-and-trusted methods like Cost-Benefit Analysis (CBA). CBA is a systematic method to evaluate investment options in terms of costs and benefits, such as ongoing cost-reduction and labour saving [15]. For infrastructure projects, Nickel et al. [16] declare that CBA is among the common methods utilised in performance assessment in the government sector for high-value projects.
CBA was first mentioned in the report of Albert Gallatin in 1808 in the United States [17]. Gallatin was U.S. Secretary of the Treasury at that time and he recommended comparisons in terms of costs and benefits in water infrastructure projects. Perhaps the first widespread use of CBA was instituted by the ‘Federal Navigation Act—1936’ of the U.S.A., which mandated the usage of cost-benefit analysis to assess proposed waterway infrastructure [18]. In 1939, the use of CBA was significantly expanded when the ‘Flood Control Act’ required CBA analysis for all new projects. By the end of 1960s, CBA had become popular and was used in both developed and developing countries. CBA has been used in the decision-making processes of policy makers; for example, CBA was used to estimate both demand and cost functions for public paratransit in the United States [19] and to identify the net benefit of implementing urban road pricing policy [20]. A number of contributions discuss the inclusion of socio-economic factors in CBA. The first contribution came from Stewart [21] when he presented the critical points of using social cost-benefit (SCB) analysis to evaluate proposed projects, and he claims that the outcome of SCB highly depends on the values adopted. Next, Beesley et al. [22] studied changes in London Transport Executive policies to provide insights into the significance of social cost-benefit analysis in examining the impacts of project investment. Regarding the macro-micro economy, Mohring [23] considers CBA in the contexts of a closed and open economy. Furthermore, scholars then focused on specific aspects of transport infrastructure projects such as using cost-benefit ratios to rank road project priorities [24], the relationship between political attitudes and changes in analytic results [25], and the influences of CBA results on investment decisions [26,27]. Although CBA has brought many benefits to policy-decision makers, the Transit Co-operative Research Program found that there are major limitations related to the use of CBA in evaluating project impacts on the local community [28].
Criticism has been reported by many eminent persons regarding the systematic approach adopted by CBA, including the requirement to be comprehensive and accurate while undertaking an analytical method [29]. Furthermore, some authors criticize CBA for lacking a full appreciation of all the factors to be included [30], the need to better combine repercussions related to the environment [31,32], the need for interpretation of CBA results, especially to gain benefits which are hard to quantify [33], and the nature of the outcome presentation [33]. On the same note, Layard et al. [34] (p. 3) state that ‘the right decision only results if the prices used by the decision makers correctly reflects the social values of inputs and outputs at the social optimum or shadow prices’. Thus, the CBA process can incorporate bias that arises from assumptions used to frame the problem. Given the above-mentioned issues, the goal of this research is to produce an improved method for CBA that builds on its strengths and overcomes reported implementation limitations.
In summary, CBA is a valuable decision support method, but it has a number of limitations. Perhaps the first is that it is seen as an expert-driven process that does not allow stakeholders to interact readily with the model. This makes it hard for stakeholders to conduct what-if analysis and sensitivity analysis with respect to the key model parameters. Secondly, the implementation of CBA tends to be formulaic and prescriptive [35] and devoid of systems thinking, and, as such, it is easy for practitioners to miss important social, environmental, and even economic factors. Thirdly, CBA is essentially a functionalist and often reductionist approach that seeks to provide optimal answers to investment problems through the work of expert analysts. Many important authors, including Jackson [36] and Hitchins [37], advocate the use of systems approaches to tackle management challenges and provide a range of approaches, methods, and techniques that can be employed. The first step in such approaches it to identify the stakeholder needs. For an improved CBA, this would include the application of system thinking, the use of multi-methodologies that incorporate functionalist and interpretive approaches to tackle the problem of interest, the explicit inclusion of social and environmental factors in a transparent way, the ability of stakeholders to exercise the model and perform sensitivity analysis, and intuitive and visual ways of displaying the output information. Of the approaches discussed by Jackson [36], system dynamics is the most well suited.
System Dynamics (SD) is a computer-aided approach to policy analysis and design [38]. The SD approaches uses user-friendly software that produces mathematical models in which the system of interest is described by sets of differential equations [39,40]. The elements of system dynamics models are flows (these can be material, information, money, etc.), accumulation of flows into stocks, feedback between the stocks that is also represented as flows, and time delays. The System Dynamics Society [41] describes the utility of SD in an organizational context thus:
‘System dynamics is a technique for strategic and policy simulation modeling based on feedback systems theory. It was invented in the late 1950s by Jay Forrester, a pioneer in engineering and computer design. Since then, SD has developed as its own field, distinct from the larger fields of operations research and management science to which it is related.
SD unites social and behavioral science with the nitty-gritty details of planning and accounting, and requires the careful design and construction of original models with many interacting variables.
SD is used by organizations facing high-stakes decisions and seeking an integrated view of the major forces that can affect key outcomes years or decades into the future. It helps these organizations to better weigh the pros and cons of various options they have been considering or might consider’.
One of the key reasons to apply SD to transport infrastructure projects is its ability to capture and explain system behaviour and its temporal variations [42]. SD can produce simulations that enable researchers to evaluate ‘what-if’ cases and policy tests under varied situations [43]. Rodrigues and Bowers [44] state that in a project management context SD helps to surface and simulate the impact of complicated interrelationships between system elements [44].
SD has been applied to problems similar to the one of interest. Forrester [45] expanded SD beyond its organizational modeling origins to investigate the reasons for urban decay in US cities in the 1960s. Stave [46] used SD to provide the framework for improving public participation in the decision making processes regarding environmental policy. Yang et al. [47] have applied SD to model the redevelopment of old urban areas. In these works, a number of outcomes were uncovered through exercising SD models of old urban areas that were counterintuitive; for example, the policy of building low-cost public housing in decayed inner cities was making poverty and unemployment worse not better.
In 2011, Yuan et al. [48] used SD to construct a cost-benefit analysis model for waste chain management. Yuan et al. were successful in setting up both causal loop and stock-flow diagrams to provide quantitative assessments. In addition, Wei et al. [49] used SD to set up a complex system model to demonstrate component relationships and non-linear interactions between water resources, the natural environment, and social-economic aspects. Mavrommati et al. [50] dealt with critical issues regarding sustainable development in urban coastal systems by using the SD approach. In 2014, Shih and Tseng [51] reported their Air Resource Co-benefits model, which provides estimates of the social benefits of incorporating renewable energy (RE) and energy efficiency improvements (EEI) into Sustainable Energy Policy.
Thus, there is strong evidence that SD is a promising modeling approach from both a systems practice perspective and a CBA perspective.
3. Research Approach
This research employs SD to produce a cost-benefit evaluation for a given transport project. The case study that follows is set in Vietnam. The process is given in Figure 1 and starts with the application of systems thinking to identify the key variables (nodes) in the system and the relationships between them. At this time, the costs and benefits of undertaking the project are uncovered. The production of two types of models follows; a casual-loop model and stock-and-flow model. The main purpose of the causal-loop model is to depict the relationship between the variables in the system and the direction of the influence they have on each other [52]. Many variables have been identified in the case study, such as the total budget spent on the project, the number of vehicles, and the effects of project investment on the local economy. The stock-and-flow model is built from the casual-loop model through the selection of appropriate modelling elements and relationships and through direct or indirect quantification of the model [52]. In the case study this model is used to model the CBA of the system of interest under different conditions related to different internal and external environments and to produce the findings.
Vensim software is used to implement the CBA SD model in the case study system. This software was developed by the Ventana Systems Inc. of Harvard, Massachusetts in 1985 [53]. The Vensim software is designed to enable a person with minimal mathematical modelling skills to produce an executable differential equation model of a real-world system that contains nested feedback loops and non-linearity. SD models in Vensim and similar tools are then used to evaluate systems variants in terms of their performance and behaviour across a range of contexts in order to gain knowledge about the system and to identify configurations that possess desirable characteristics.
4. Case Study
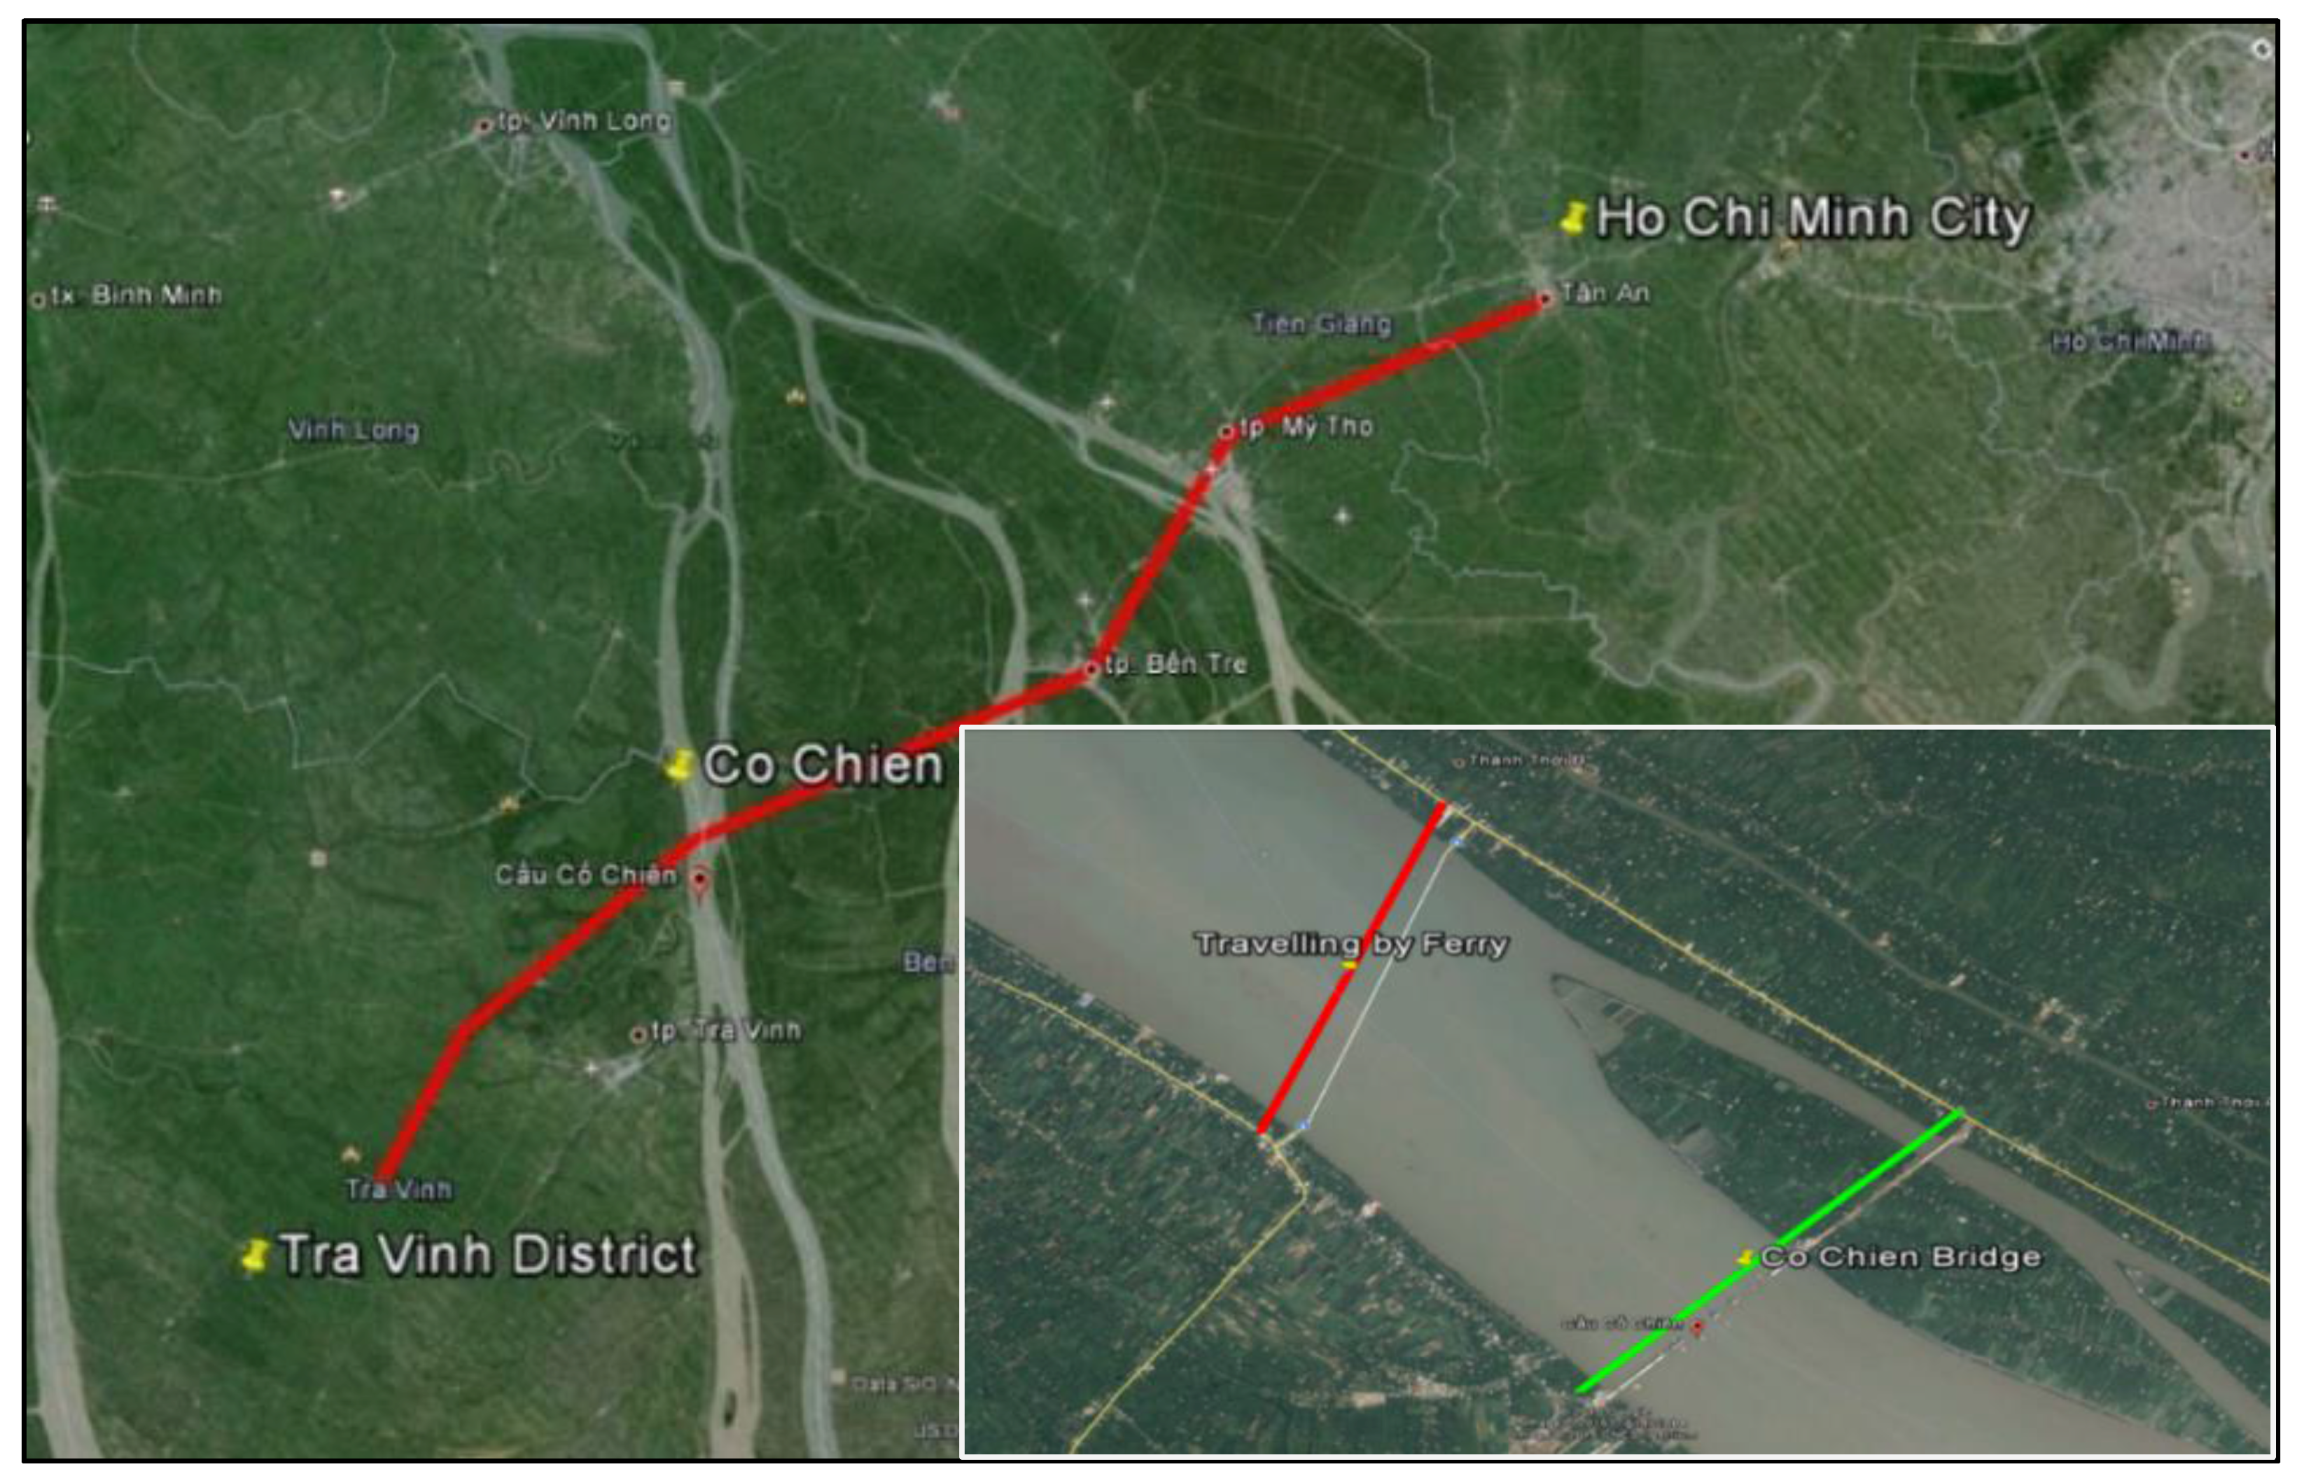
In the last five years, all trading goods from Tra Vinh Province to the big cities in the South of Vietnam were transported via river transport systems such as ferries and boats; see Figure 2. This was a significant barrier to local economic growth because travelling by ferry or boat involves significant time and economic cost for both producers and passengers. According to the National Centre for Socio-Economic Information and Forcast [54], the Gross Domestic Product (GDP) growth rate of Tra Vinh Province during the five year period from 2010 to 2015 was less than the national average GDP because of the under-development of transport infrastructure. To address such transport network needs in the provinces, the Transport Ministry of Vietnam announced plans to invest in and construct the Co Chien Bridge with the aim of connecting rural areas, particularly in Tra Vinh Province, to more developed areas.
The bridge would reduce the travel distance by 70 km and around two hours for a round trip [56], allowing local people and entrepreneurs the opportunity to ship products directly to larger markets such as in Can Tho, Vung Tau and Ho Chi Minh City. The trading route from Tra Vinh to the larger cities is illustrated by the red line in Figure 2. The construction of the bridge was expected to provide significant benefits to the major economic sectors of Tra Vinh and Ben Tre, including agriculture, tourism, and general industry, as well as to the real estate market [56]. Furthermore, the geographic location of these provinces is suitable to develop industries such as fisheries and rice growing, given improved transport access to larger markets.
In our analysis of this case study, we identified all the benefits and costs associated with the construction of the bridge and examine where the costs and benefits appear during the 30-year period from 2015 to 2045.
5. Findings and Discussion
5.1. CBA Qualitative Analysis
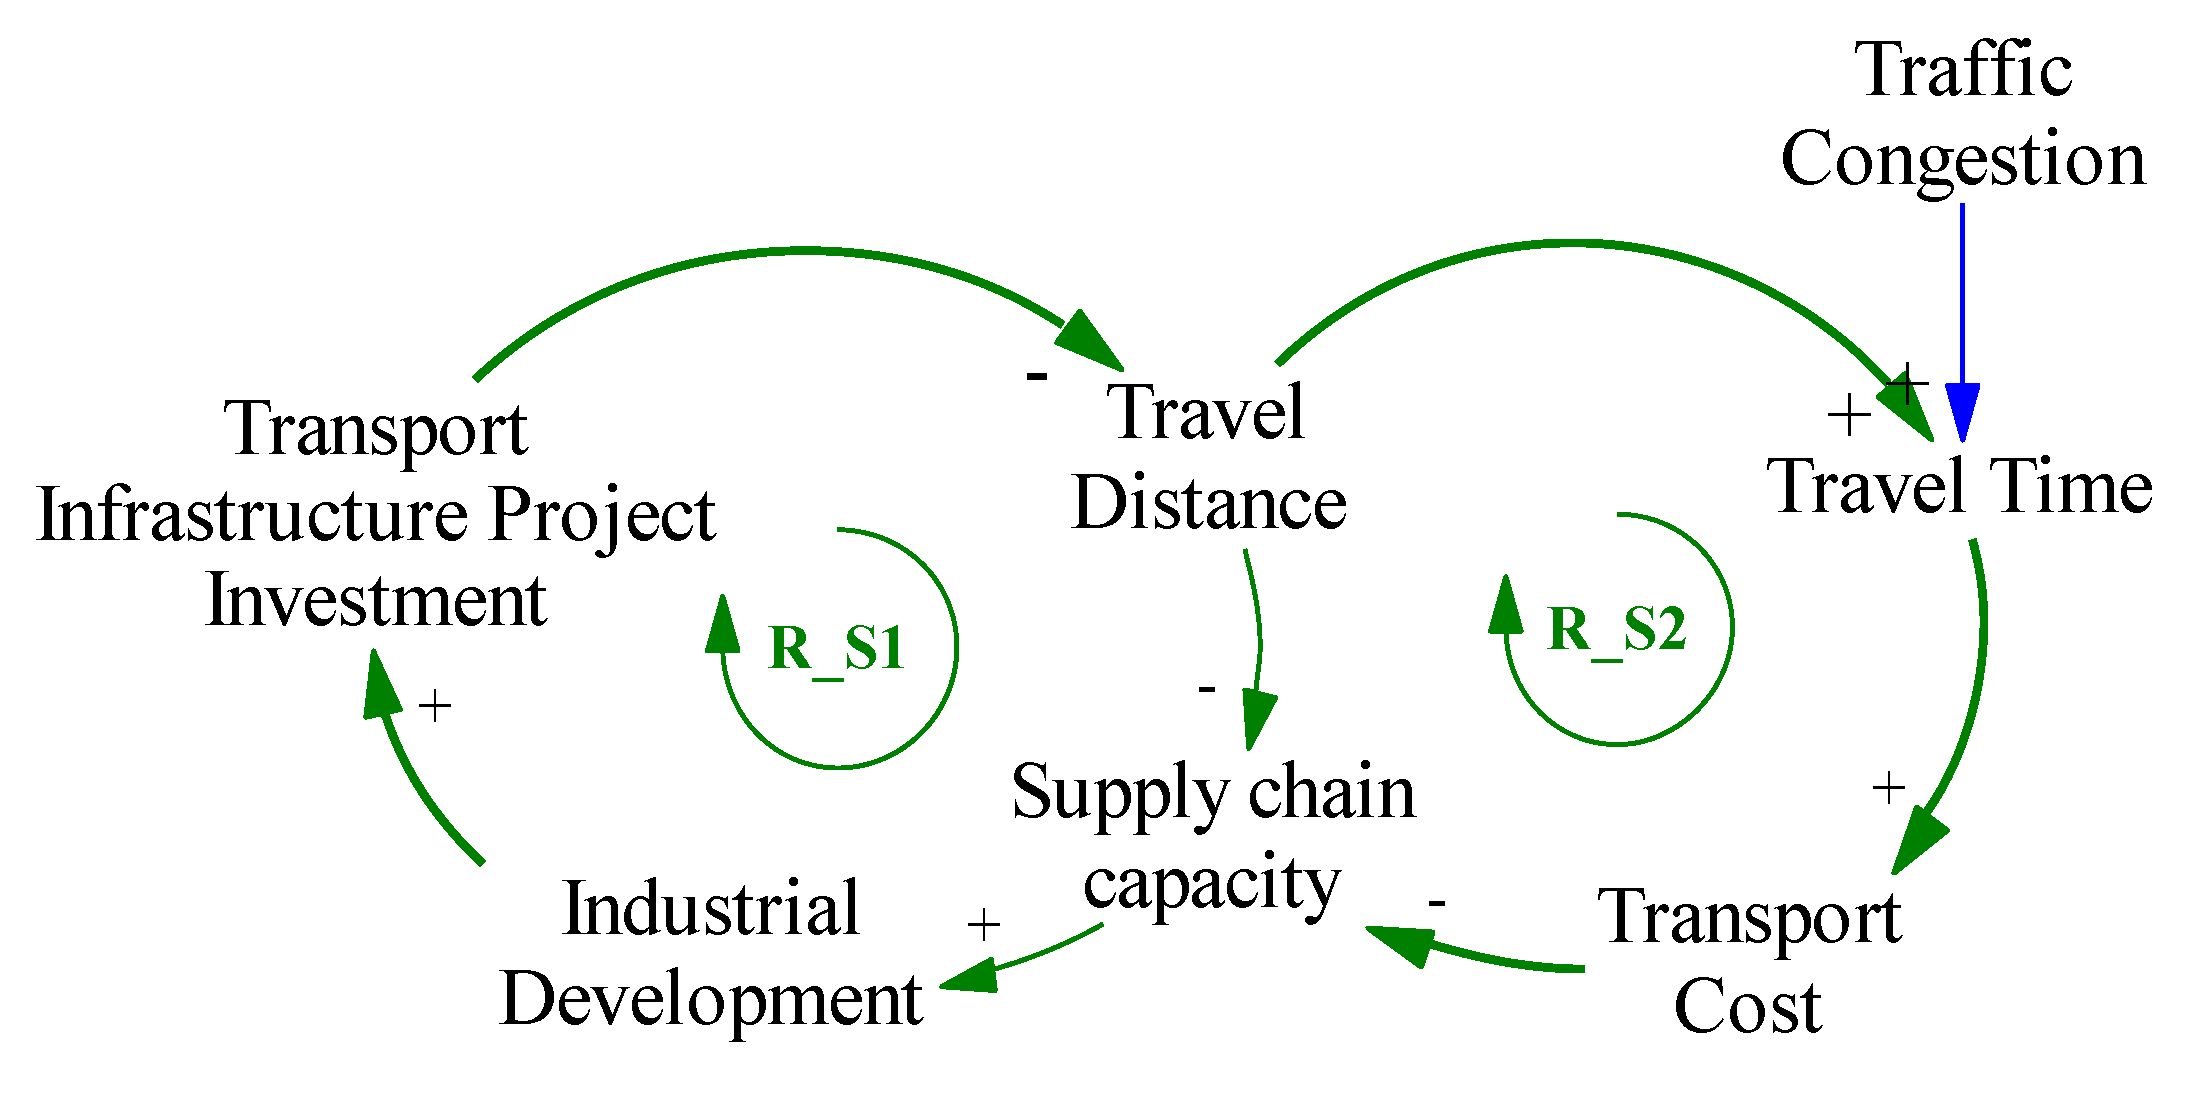
A causal-loop diagram (CLD) was constructed, see Figure 3, that illustrates the impact of travel distance, cost, and time on the industrial development and supply chain capacity of Tra Vinh Province. The model can clarify problems and facilitate a holistic understanding of an infrastructure project in its context.
In such diagrams, the ‘+’ signs at the arrow-heads indicate that the effect is positively related to the cause (an increase/decrease in variable A leads to an increase/decrease in variable B), the ‘−’ signs indicate the opposite, ‘R’ indicates a reinforcing loop, and S1, S2 stands for the loop number; for example, S1 refers to supply chain loop no. 1, and S2 refers to supply chain loop no. 2. Figure 3 illustrates the relationship between an investment in a transport project and supply chain capacity. The ‘exponential growth’ behaviour of this loop points to positive effect that investing in transport projects has on supply chain capacity. Transport projects improve street capacity by allowing a larger number of vehicles to travel a particular route. In the case of the Co Chien Bridge project, the bridge allows each truck to save one hour per trip and US$193,983 per year when travelling between Tra Vinh Province and Ben Tre Province [56]. The decrease in travel time and transport cost would directly influence the capacity of the supply chain system, which is one of the vital factors contributing to industrial development in developing countries. According to the Report of Transport Engineering Design Inc. [56], the Tra Vinh and Ben Tre industrial growth rates have a direct relationship with infrastructure development, so an increase in the industrial growth rate will lead to the need to extend and improve infrastructure. Thus, local governments should pay attention to the loop R_S1 when developing planning strategies for transport projects in new industrial areas.
In Figure 4, the reinforcement loop, R_T1, illustrates the ‘exponential growth’ behaviour of a component group related to the tax system.
In Figure 4, an increase in the number of vehicles travelling across Co Chien Bridge leads to an increase in tax revenue, particularly in terms of road and vehicle taxes. Due to the advantages of implementing the new transport project, the number of vehicles travelling on the Co Chien Bridge from the local area to surrounding areas will significantly increase and contribute a large amount of money to the local budget. As a result, the local government has more capital, which can be used for improving public services, an important factor contributing to the life expectancy of the local people. Also, as public services are improved, there is the potential for a new trend of immigration from other areas to Tra Vinh Province that will increase the local population. An immigration increase causes a ‘positive’ change in the number of vehicles; thus the positive effect in the loop R_T1 is reinforced. In addition to loop R_T1, loop R_T2 reflects the relationship between the tax system, public services, life expectancy, immigration, and the retail market. The key point of loop R_T2 is the relationship between immigration and the retail market. When the population in a place increases, this creates good opportunities to develop the retail market, which provides a convenient role for local people in agricultural trade and export.
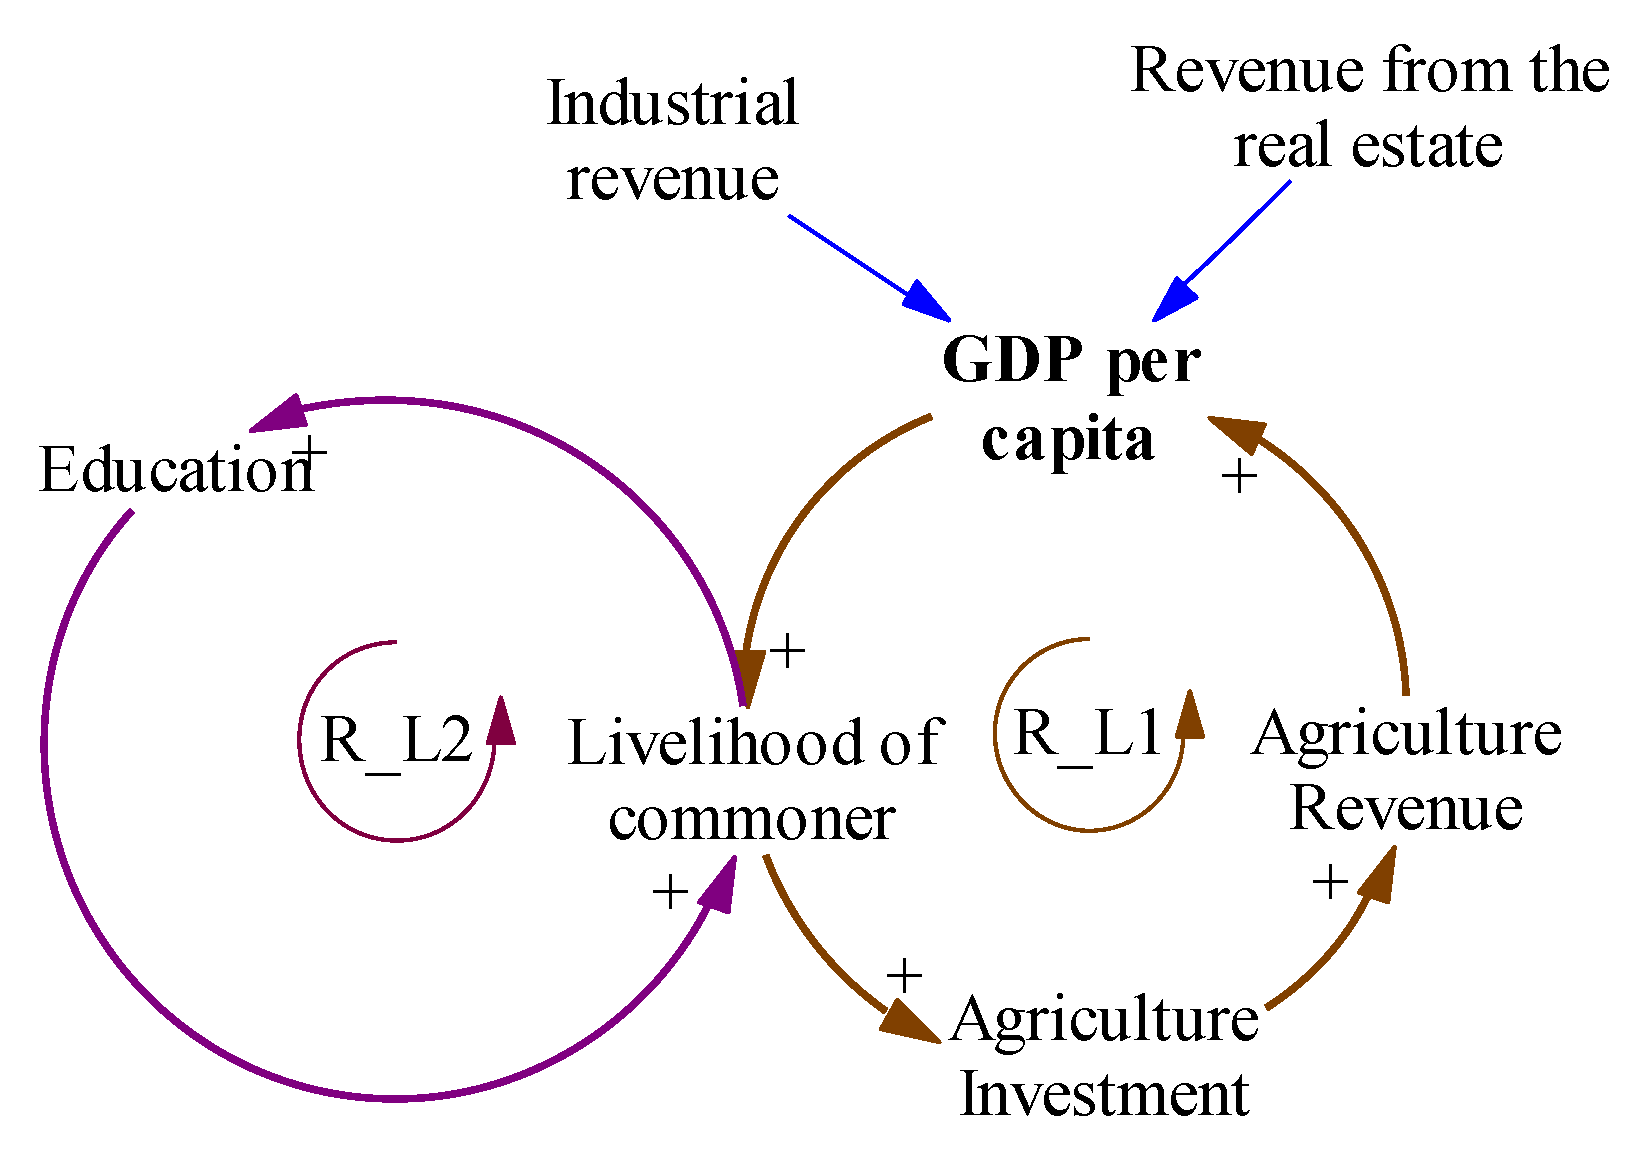
The reinforcement loop R_L1 in Figure 5 focuses on the relationship between the elements of GDP per capita; livelihood of the local people, agricultural investment, and agriculture revenue. Implementing the Co Chien Bridge project in Tra Vinh Province directly leads to an increase in revenue from the industrial sector and the real estate market and indirectly leads to an increase in the GDP per capita of local people. According to a feasibility report by Transport Engineering Design Inc. [56], Tra Vinh Province is one of eight areas in the South of Vietnam that have advantages for exporting rice to many countries. However, a major issue is that young people tend to move to big cities in order to seek jobs to improve their income [57]. Increasing the GDP per capita for local people can be an alternative solution that reduces this trend and preserves the labour supply. When the livelihood of the local people is subsidised in comparison with moving to big cities for work, they can concentrate on investing in the agricultural sector, and the revenue generated from this sector has an influence on GDP per capita. In addition, the illiteracy rate in Tra Vinh Province is high compared to other provinces [58], so increasing the livelihood opportunities for local people can help resolve this issue. When the number of educated people increases, local government has advantages in implementing new policies to support the local people and to increase the average income. This is depicted in reinforcement loop R_L2.
After designing the small causal loop diagrams, the next step was to combine these loops with other factors within a CBA system to provide a holistic picture of the impact of the project within its context. Figure 6 below illustrates the relationships and feedback processes between components of the project.
Figure 6 was created by synthesizing the causal model shown in Figure 3, Figure 4 and Figure 5 to provide a holistic picture of the casual relationships between the investment in the Co Chien Bridge Project and the investment’s impact on local economy and community. These include, for example, the indirect relationship between transport project investment and transport cost saving, the direct relationship between transport cost saving and supply chain capacity improvements, and the relationship between supply chain capacity and the development of economic sectors in Tra Vinh Province. Based on group discussions between experts and invited team members from the Co Chien Bridge Project, these relationships were not only identified but determined to have a positive impact (+) or negative impact (−).
5.2. CBA Quantitative Analysis
After creating the causal-loop diagram, the next step was to use this to inform the creation of what is known as a stock-flow quantitative model that covers the same set of relationships. In this type of model, stocks are things that accumulate, such as water in a cloud, body weight, and anger, and such stocks represent conditions within a system; that is, how things are. In contrast, flows represent the activities that cause conditions to change, such as evaporating/precipitating, gaining/losing, and building/venting. By using the reinforcing loops R_S1, R_S2, and R_T1, the authors selected key factors from the project to include in this new model, including travel time, congestion volume, travel average speed, transport cost, supply chain capacity, the number of vehicles, and the tax system to set up stock-flow processes. The result of this process is shown in Figure 7.
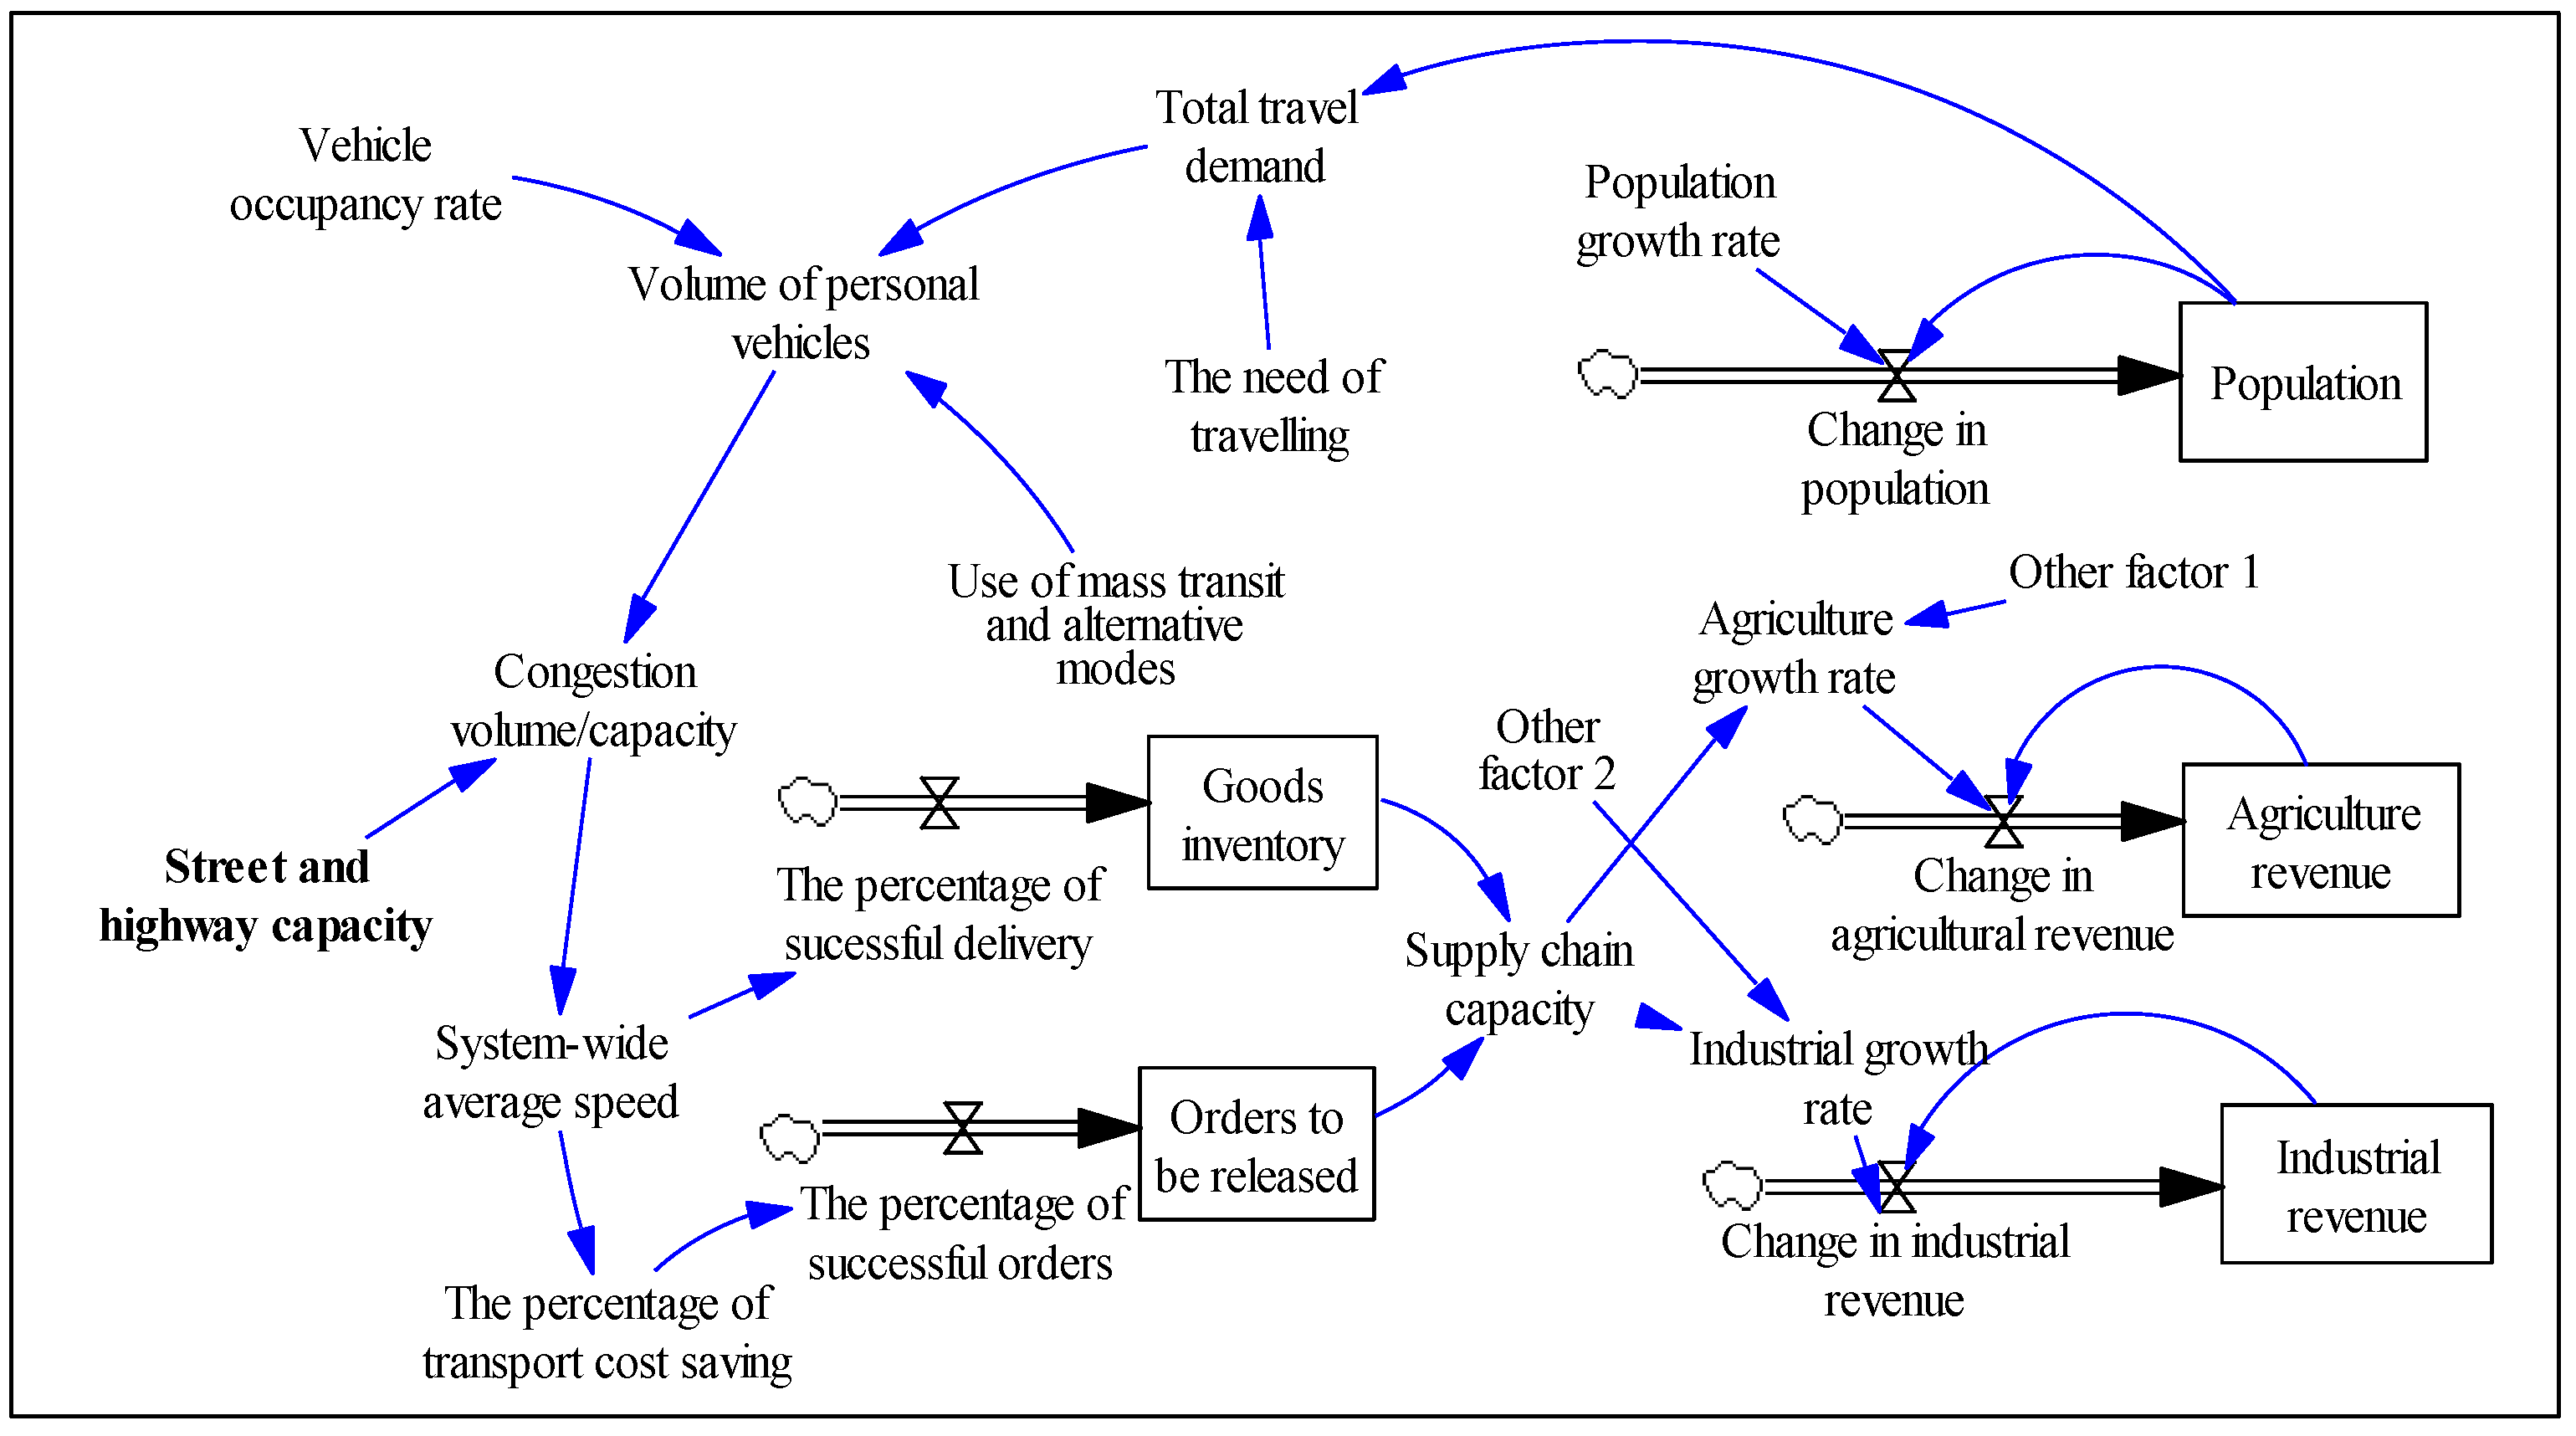
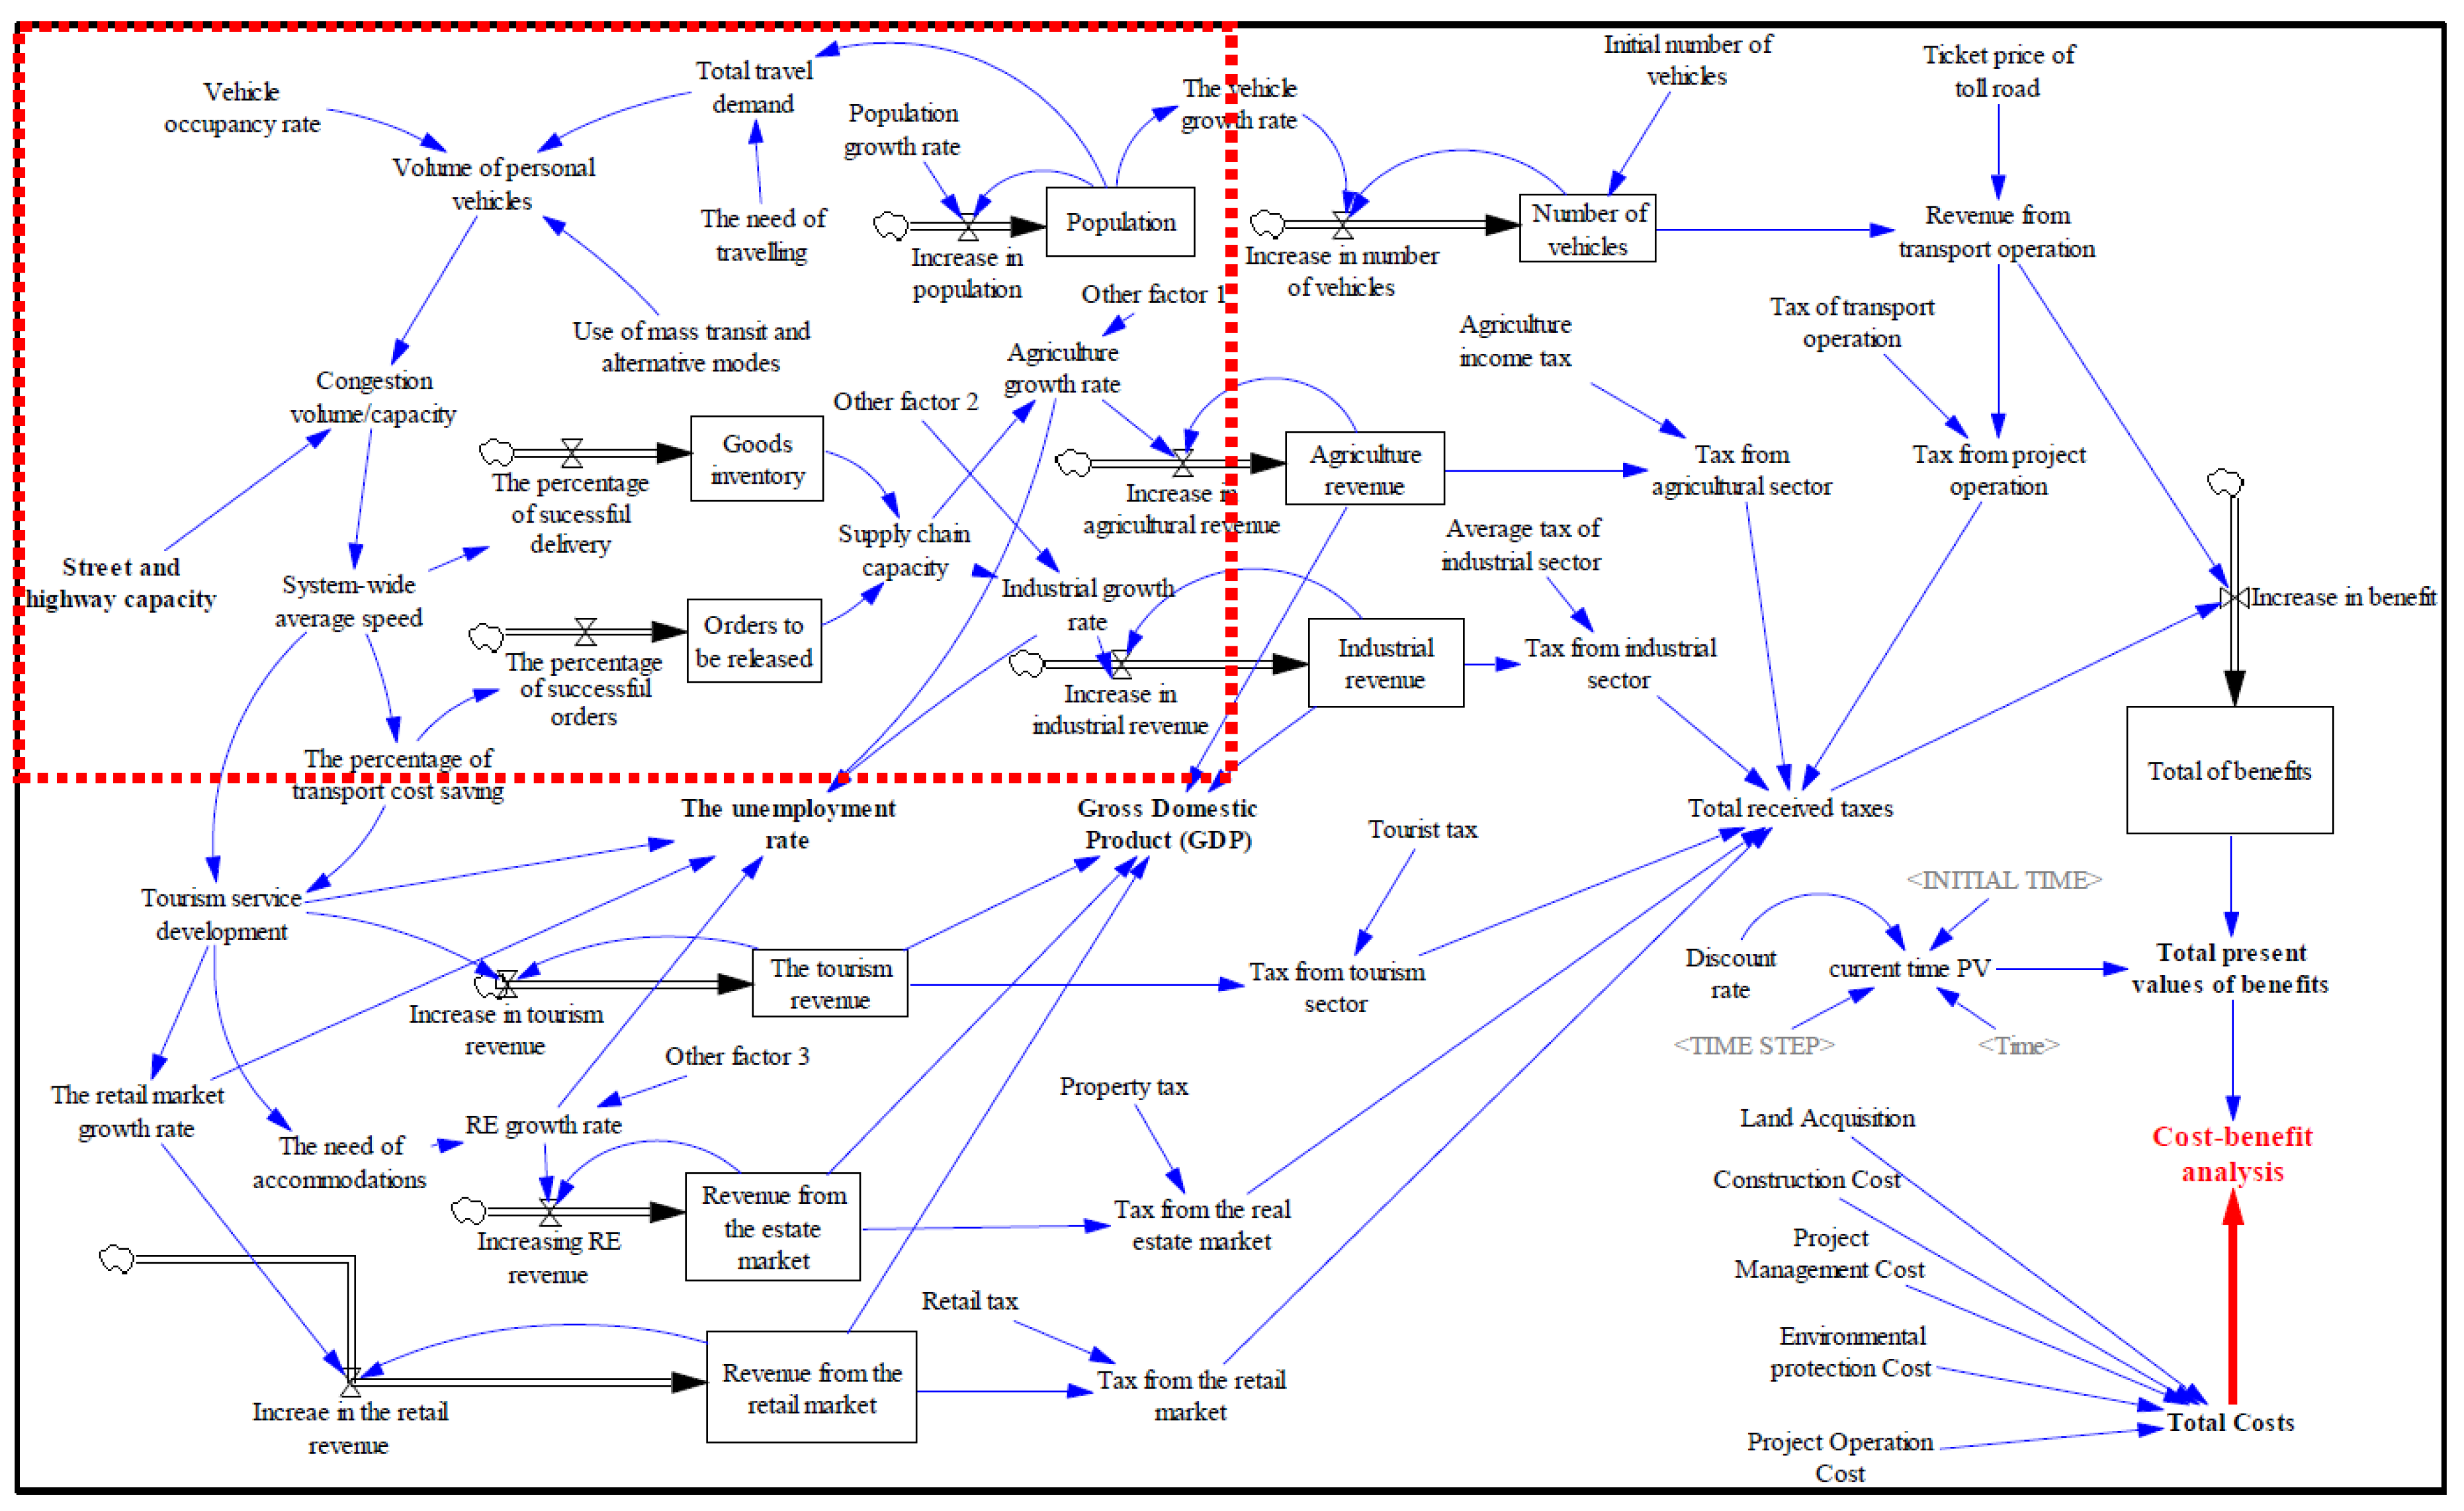
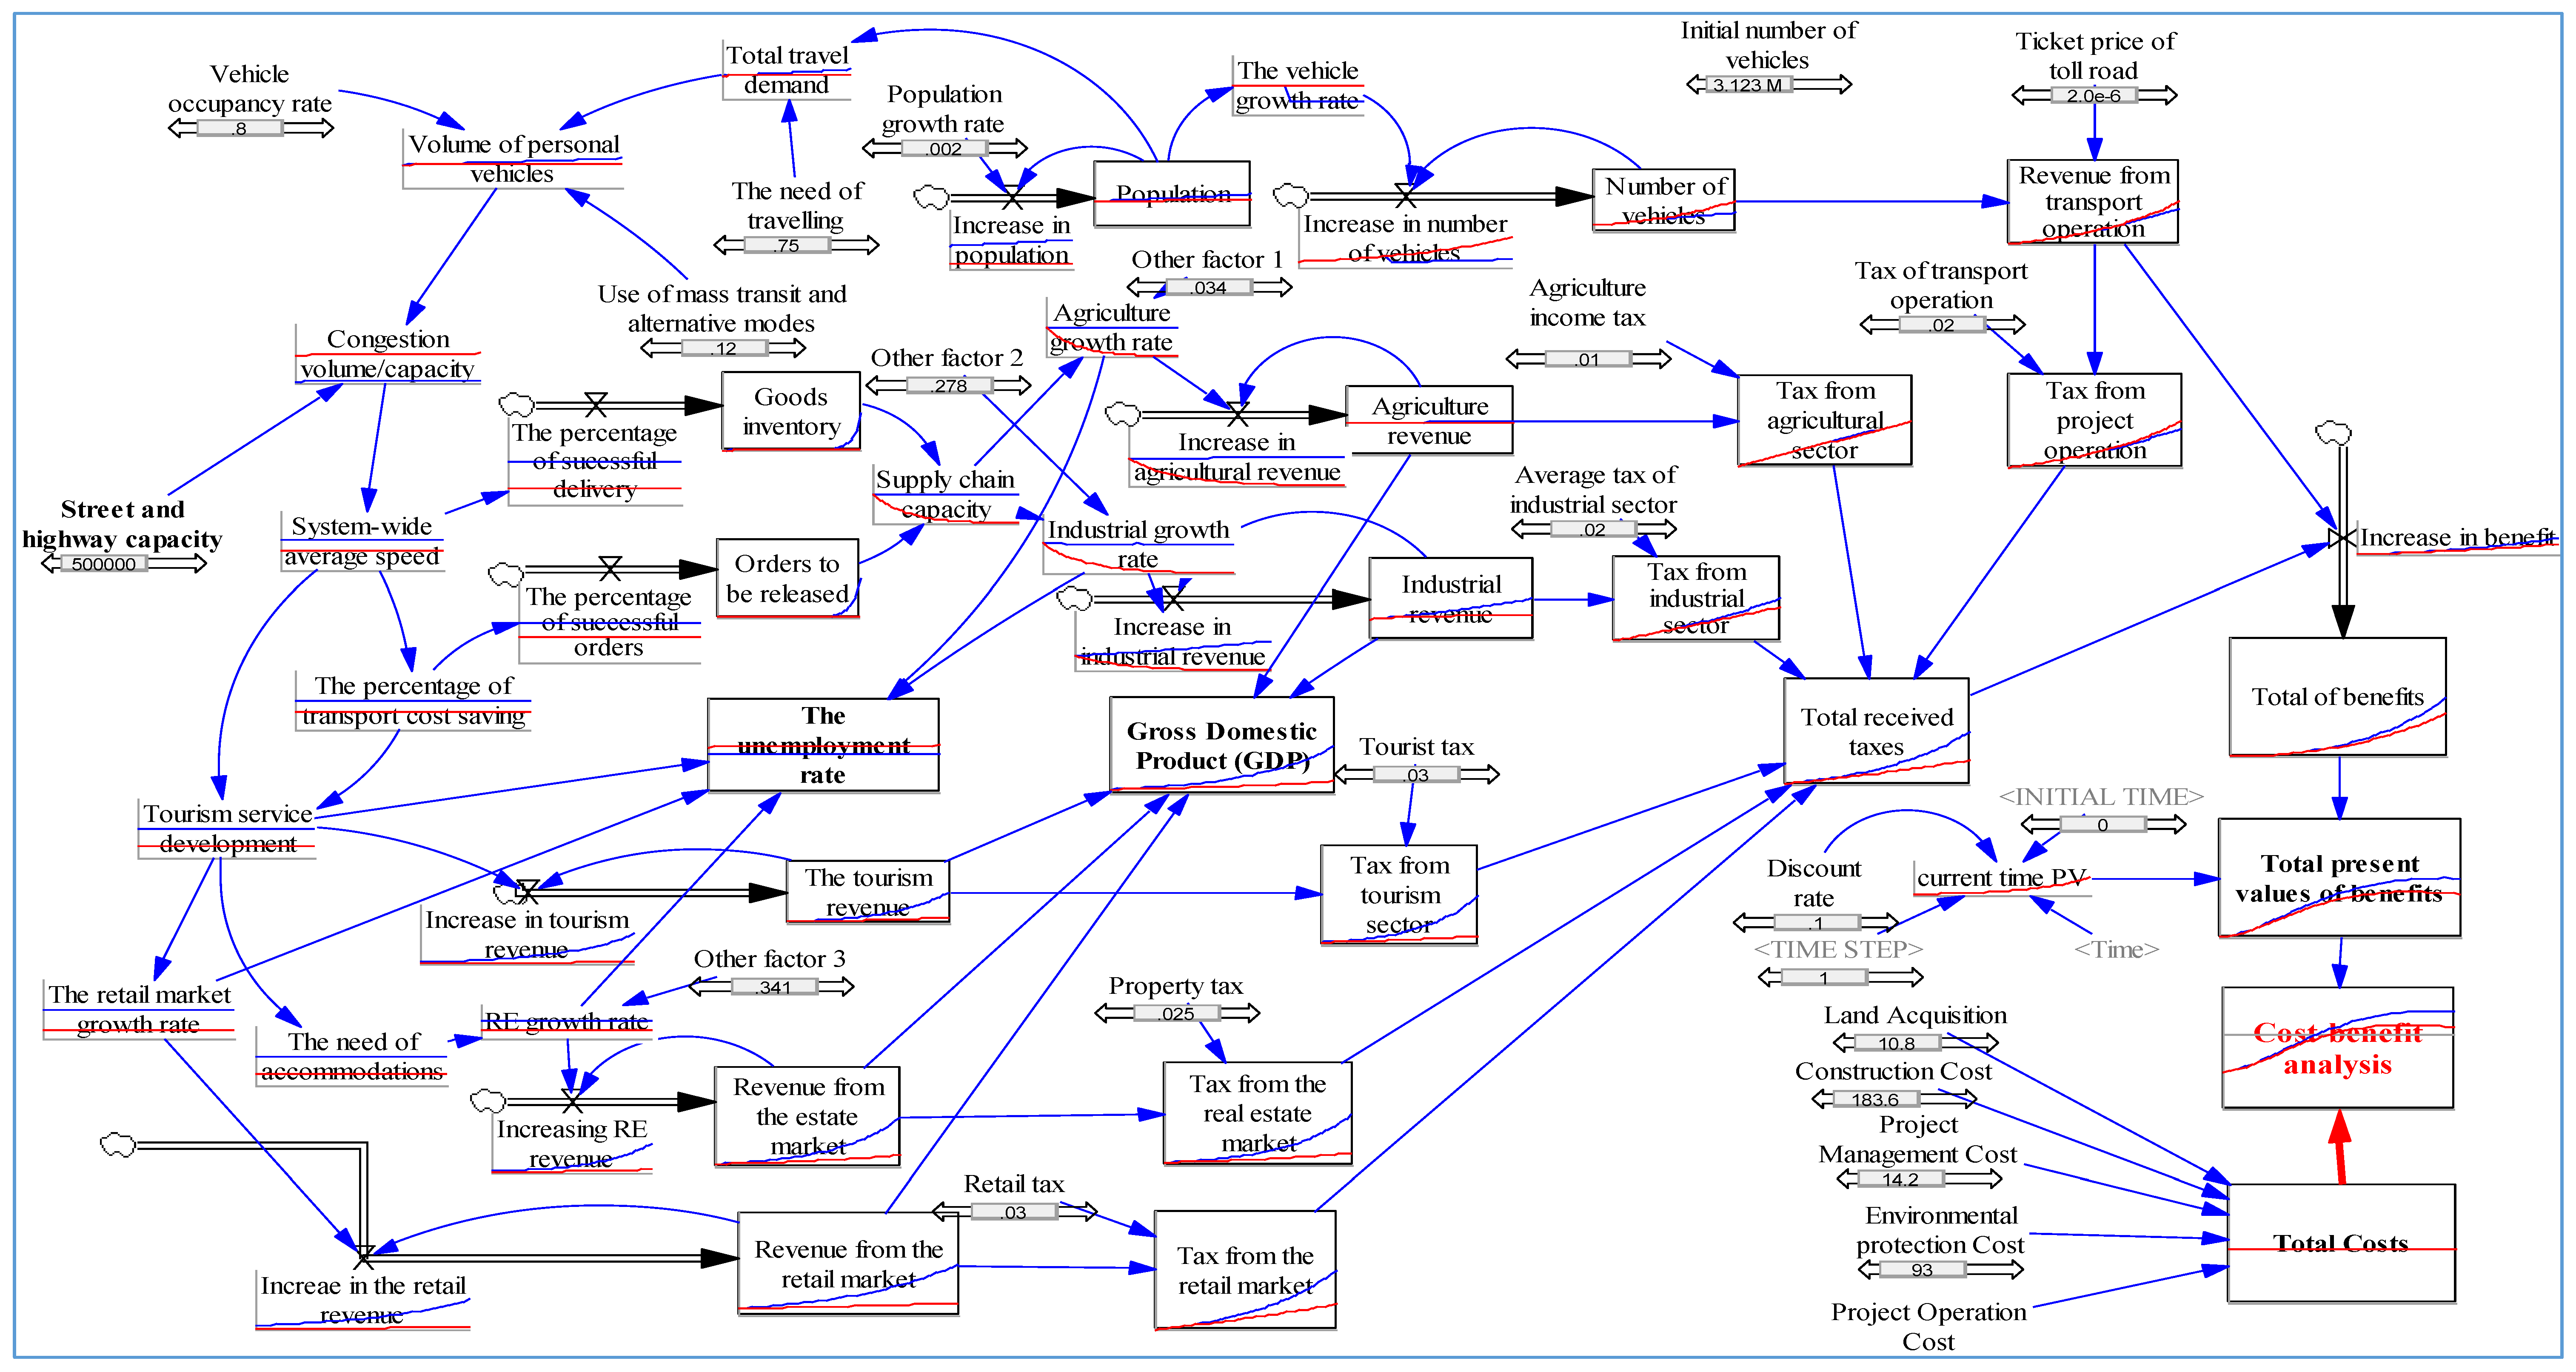
By breaking down the CBA variable into sub-level activities, the authors investigated the relationship between these activities via a range of small research investigations. The full stock-flow diagram is shown in Figure 8, and Appendix A provides some of the parameters and their initial conditions that were used.
The main contribution of the Co Chien Bridge project was to connect Tra Vinh province with the big cities in the South of Viet Nam and improve the street and highway capacity, which is a vital factor to reduce congestion as well as to improve the vehicle system-wide average speed (see the red rectangle area in Figure 8).
The vehicle operating cost (VOC) includes some main costs such as the labor cost, fuel cost, repairing cost, maintaining cost, and depreciation cost. Depending on the speed of vehicle travelling through the bridge, the operating cost for each vehicle is different, and thus the savings to VOC can be measured. In addition, the relationship between VOC savings and supply chain capacity would be explained via the percentage of successful orders and the successful percentage of delivery (see Appendix B). In practice, transport cost, on average, accounts for 6.5% of market revenue and 44% of logistics costs [59], and these figures are varied according to particular contexts. In the case of the Co Chien Bridge project, the relationship between supply chain capacity and the development of economic sectors in Tra Vinh province was set up based on initial conditions and some project assumptions regarding development growth rate (Appendix A). In the context of developing countries, Lean et al. [60] indicates that the ratio of the logistics cost accounts for 18% of total GDP in China, so we assume that the supply chain capacity would contribute 18% to the growth rate of industrial sectors in Tra Vinh province. (These assumptions need to be justified by practical surveys and further research.) The original cost-benefit analysis of the Co Chien Bridge project was carried out by Transport Engineering Design Inc. [56]. In the company’s CBA report, two traditional methods were used for CBA; financial analysis and economic analysis. The financial analysis focused on comparing the direct benefits (revenue from project operation) and direct costs (construction and maintenance costs) over a 30-year period. The economic analysis in the report referred to estimated indirect benefits from time savings, cost savings, and accident reduction, and these benefits were compared with direct costs (construction and maintenance costs) at the initial stage. Both traditional methods also used the DCF technique to discount all future cash flow to the present value before calculating indices like Net Present value (NPV) and Payback Period.
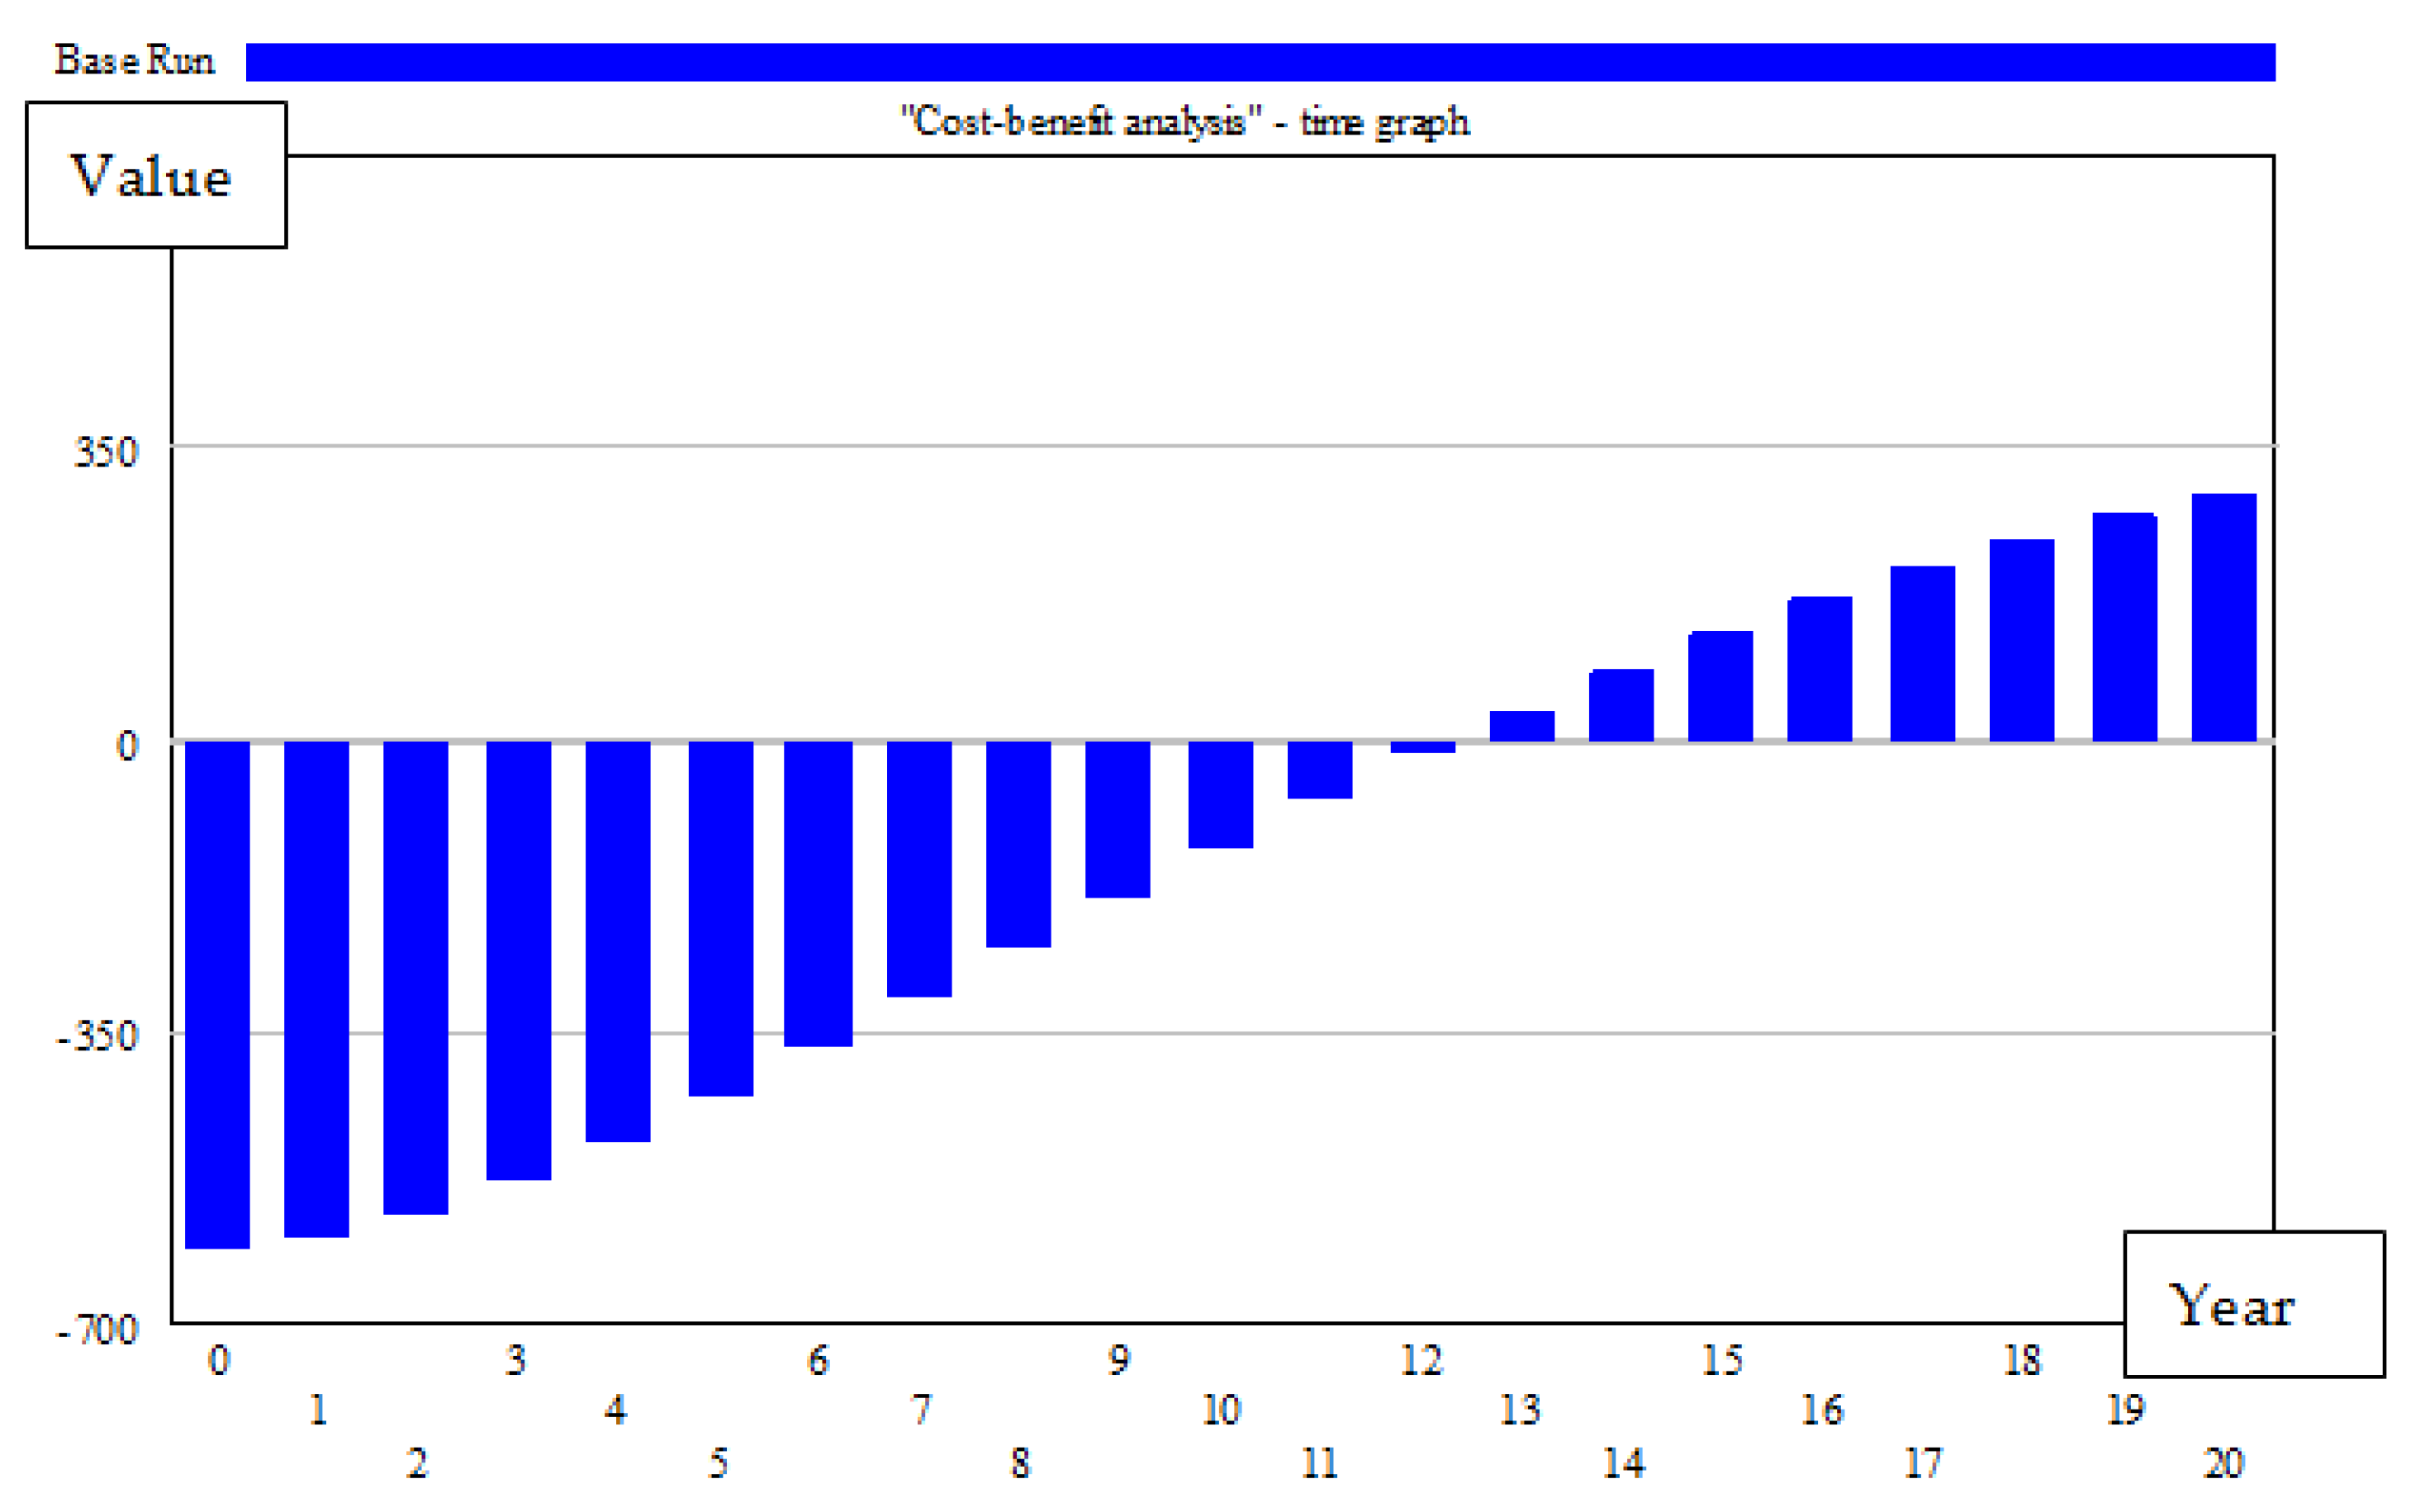
In contrast, this research concentrates more on indirect costs (Appendix C) and indirect project benefits generated from different sectors of Tra Vinh Province such as tax, the unemployment rate, and GDP to provide analyses. The System Dynamics (SD) technique enables us to model and visualize the behavior of a CBA system. All system components of CBA are interconnected and experts can investigate our assumptions or test investment policy via adjusting initial variables such as construction cost, population, ticket price, street capacity, and the number of vehicles (Appendix D). Under the scope of this research, the cost-benefit analysis (CBA) system is set up to model influences of the Co Chien Bridge project on the local area across a 30-year period from project implementation. This research focuses on the main costs during the project life cycle, consisting of construction cost, land acquisition, project management cost, project operation cost, and environmental protection cost. As the report provided by Transport Engineering Design Inc. [56] states, the direct project cost was approximately US$200 million, but the total project cost (see Figure 8), which includes direct cost, project operation cost (over 30 years), and environmental protection cost (Appendix C), is estimated to reach US$604 million. The benefits of the project mainly come from tax contributed from different industrial sectors and the transport operation revenue. All estimated project benefits at different time points were discounted to present values before comparing them with the costs of the project at the initial stage. The CBA below was identified by using the total present values of the project benefits minus the total project costs. The CBA value was accumulated by time, and, when the CBA reaches the zero value (Figure 9), it means that the total benefits are equal with the total cost. In other words, the payback period was identified at the time point of 12 at which NPV is zero.
Based on a feasibility report by Transport Engineering Design Inc. [56], some financial indices of the Co Chien Bridge project can be determined using traditional methods. The net present value (NPV) of the Co Chien Bridge project is US$22 million, the interest internal rate of return (IRR) is 10.97%, and payback time is 19.3 years. In contrast, by using the system dynamics approach described herein that draws on a wider set of criteria, our model gives a payback time of 12.1 years, which is significantly shorter. The reason is that the SD approach outlined in this paper considers the indirect benefits gained by different economic sectors, such as agriculture, industry, tourism, the retail market, and the real estate market. However, the question ‘how much NPV is enough and sufficient for making an investment decision?’ needs to be investigated in further research.
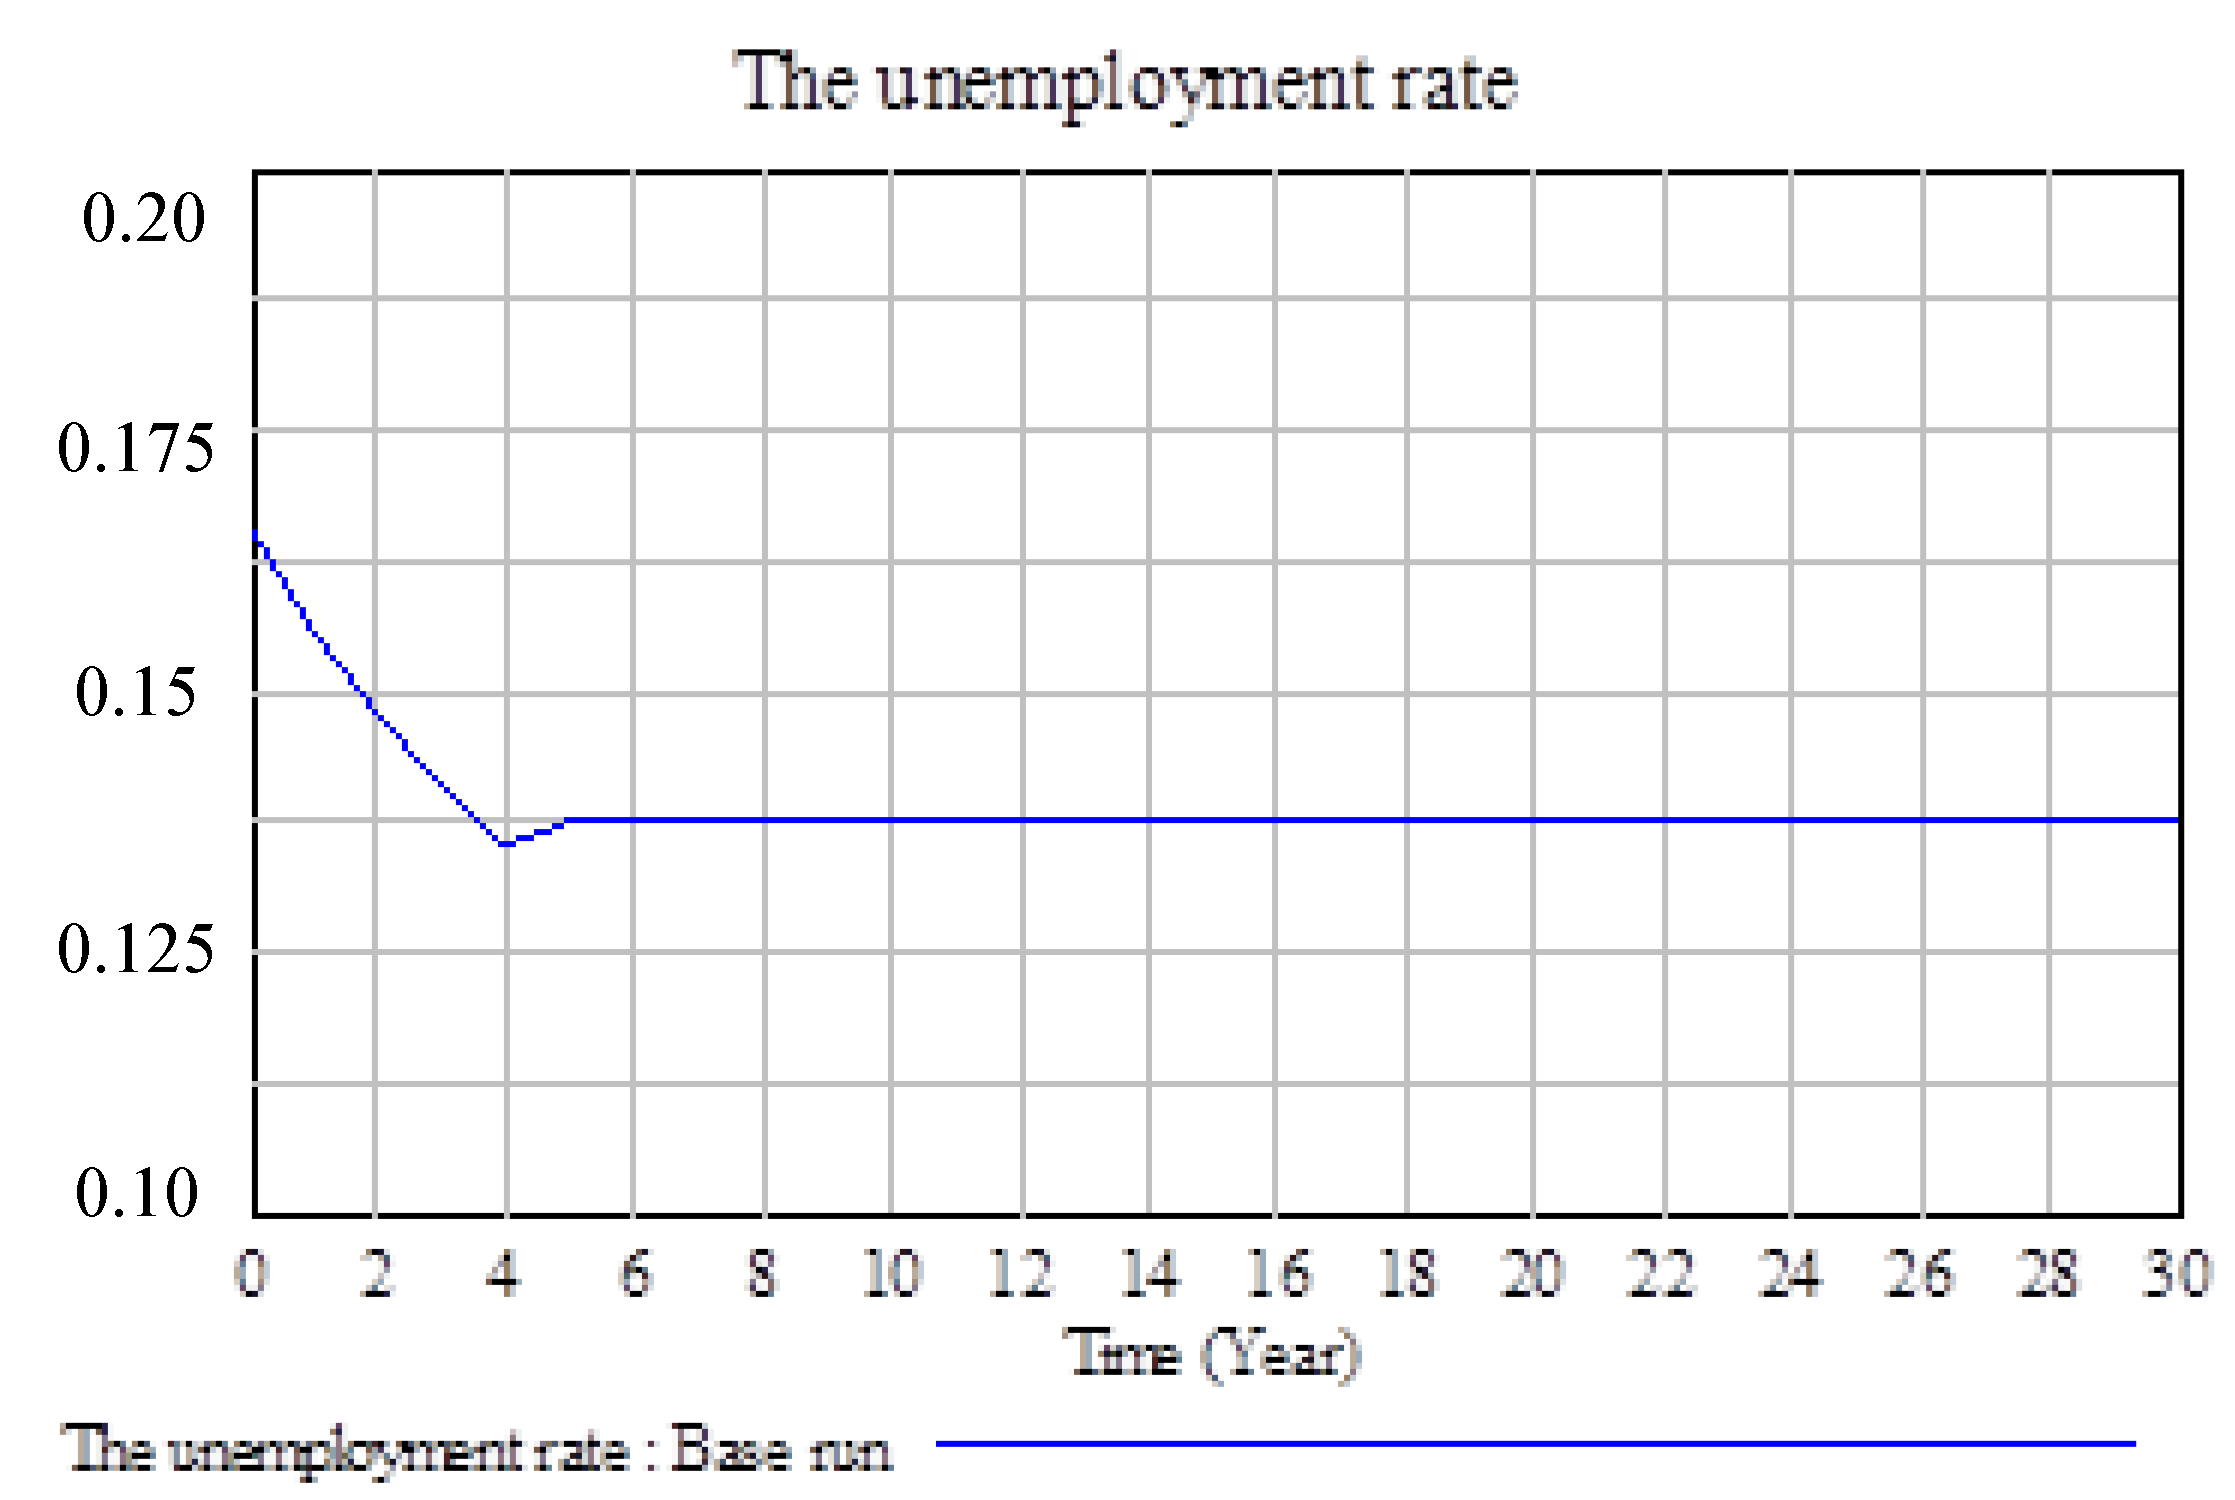
The unemployment rate is the percentage of the total labor force that is unemployed and actively seeking employment and willing to work [50]. According to The World Bank [61], the total youth unemployment rate in Vietnam in 2013 was 5.4%, while the unemployment rate in Tra Vinh Province was 16.67% in the same year. Figure 10, produced by running the SD model, shows that implementing and operating the Co Chien Bridge project brings direct and indirect benefits for local people because jobs are created through the project and across a range of economic sectors. The model predicts that the unemployment rate will decrease from 16.67% to 13.33% (Figure 10) as a result of the investment in the project.
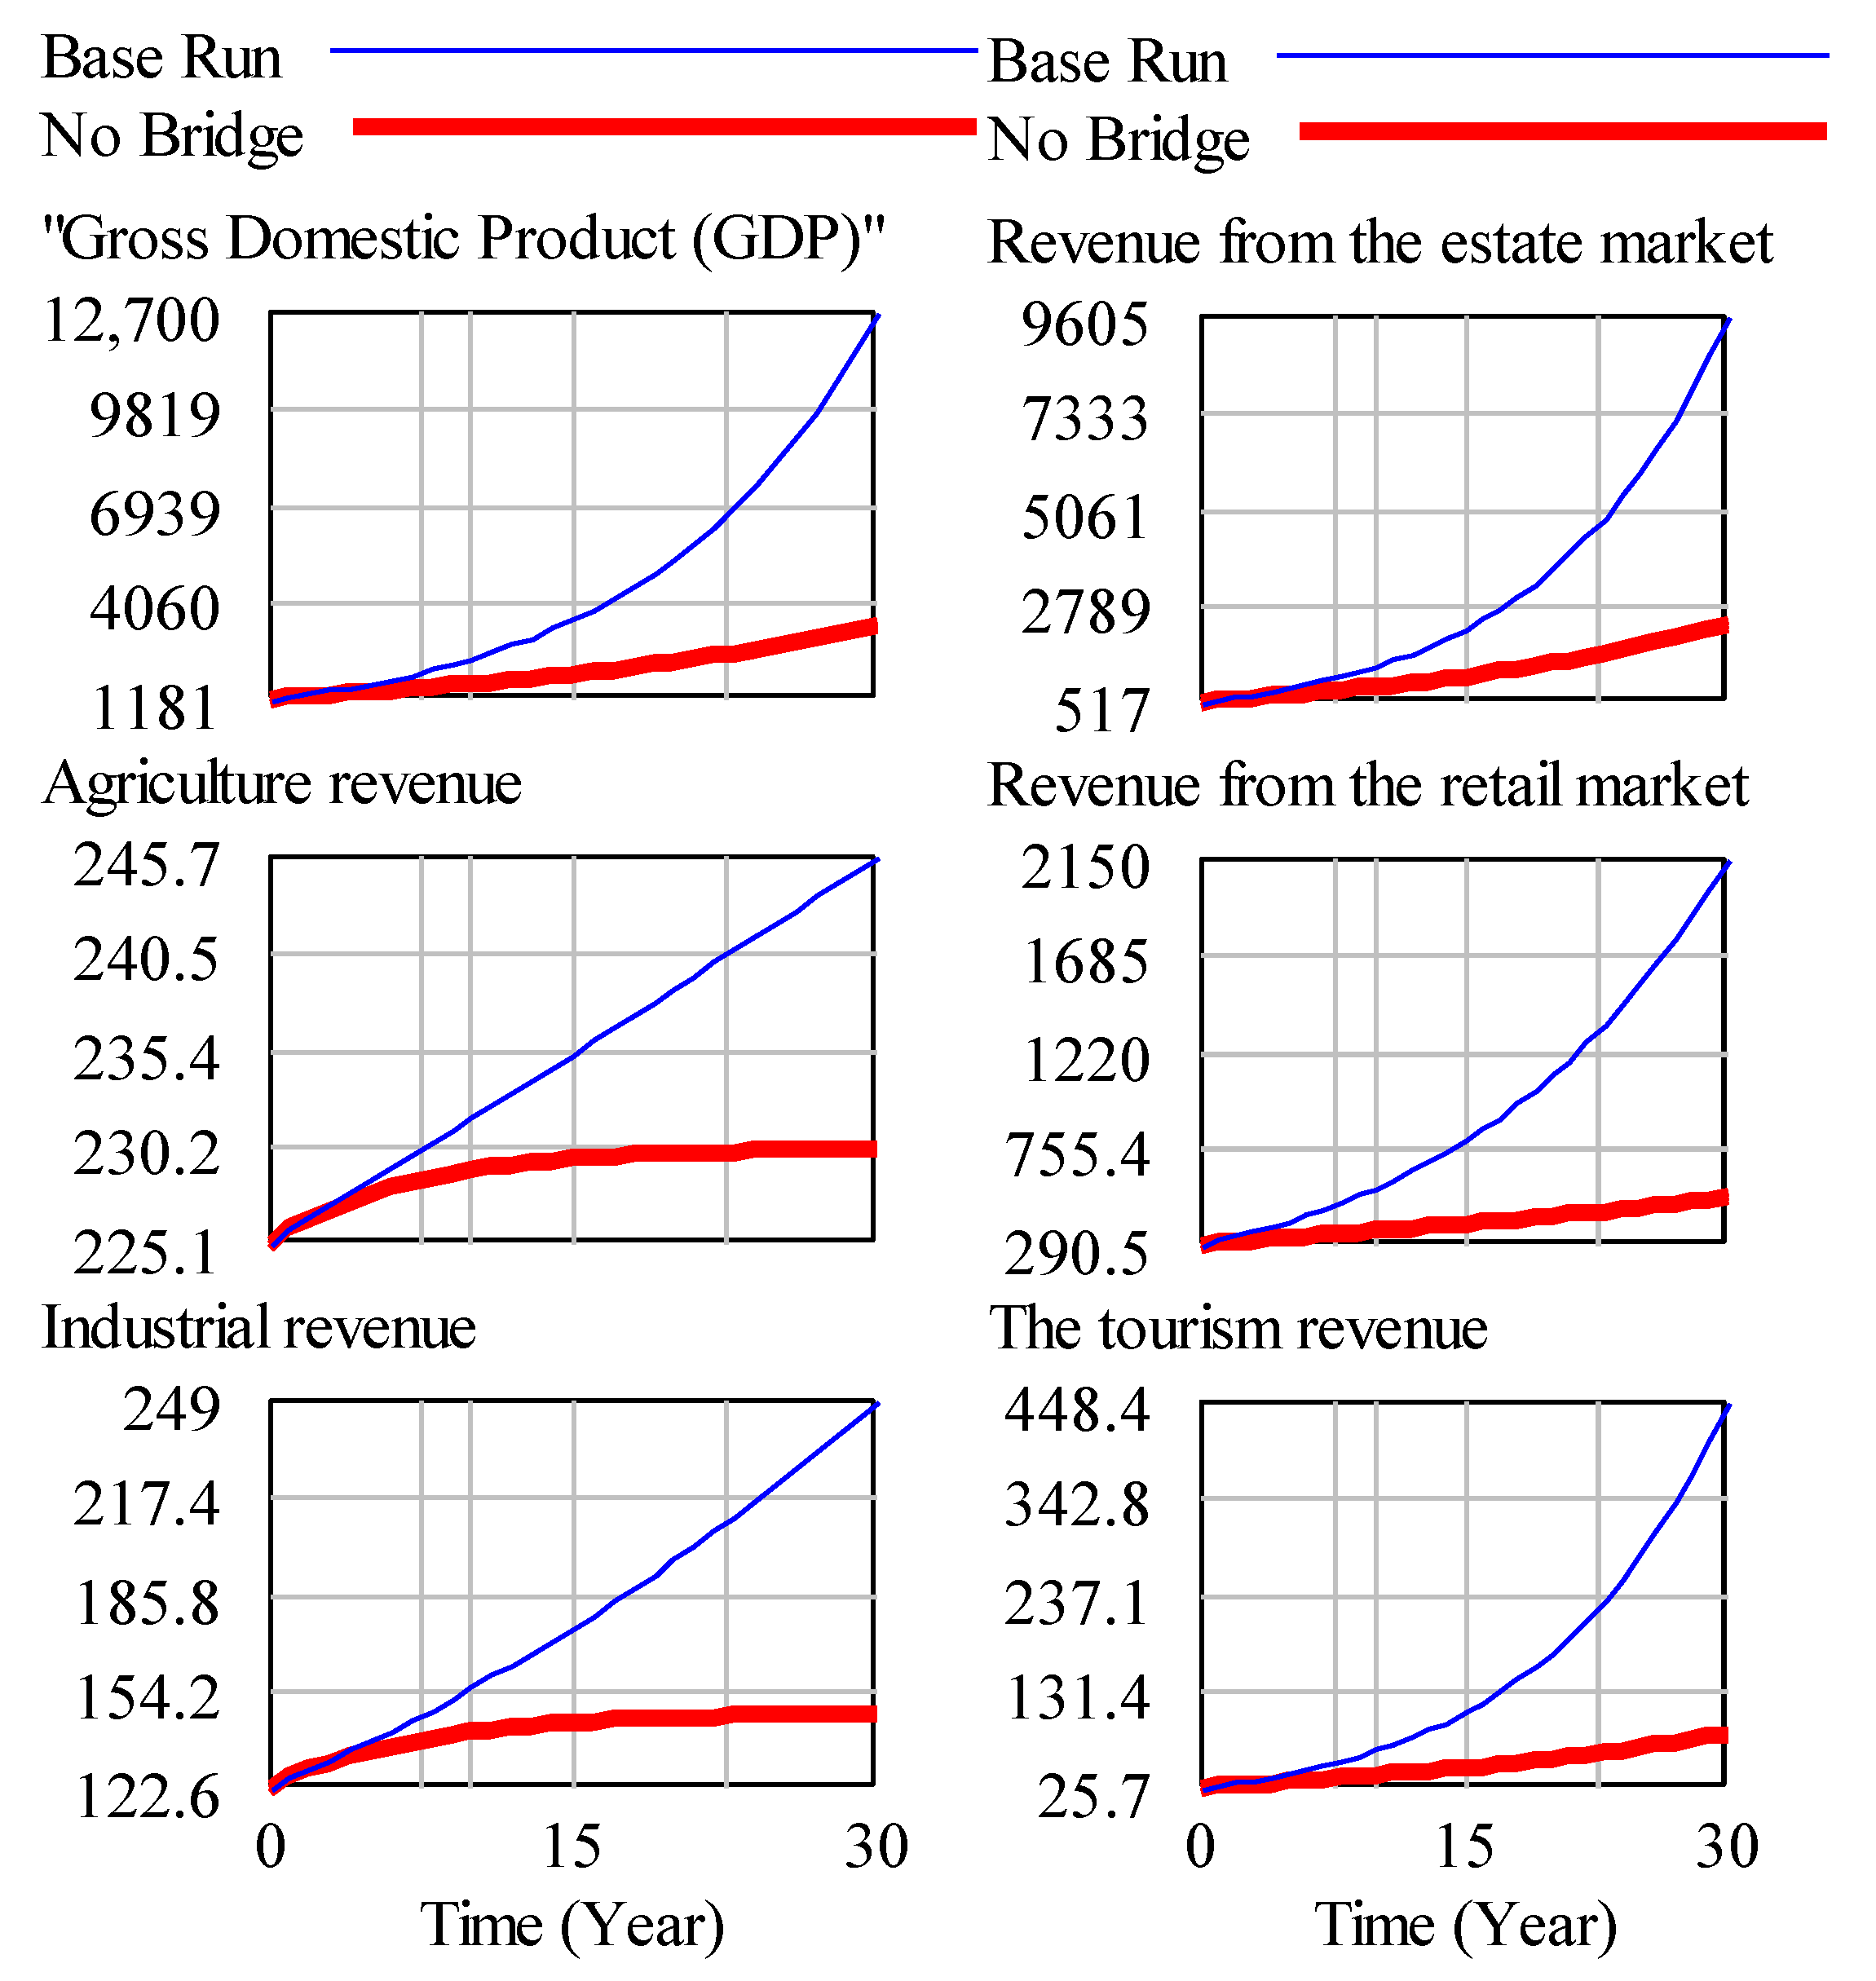
Gross domestic product (GDP) is a measure of the size of an economy. It is defined as ‘an aggregate measure of production equal to the sum of the gross values added of all resident, institutional units engaged in production’ [62]. According to The World Bank [61], the GDP of Vietnam was US$186.2 billion in 2014 from a total population of 90.73 million people. The GDP of Tra Vinh Province was US$1.58 billion in 2014 from 1.028 million people, and this figure is projected to reach US$12.5 billion in the next 30 years. In order to provide a holistic view of GDP for Tra Vinh Province, the graphs in Figure 11 were generated by the model to assess the impact of the Co Chien Bridge project on the different economic sectors, including the real estate market, the agricultural sector, the retail market, tourism, and general industry.
In the base case of the opening of Co Chien bridge, two main economic sectors, tourism and industry, receive the most economic value from the infrastructure development. During the first 10 years, the revenue gained from tourism is projected to reach US$400 million, which is four times greater than the revenue in the first year. Similarly, revenue generated by industry is forecast to reach approximately US$250 million in 2045, which is three times greater than revenue in 2015. The reasons for the significant economic growth rates are that Tra Vinh Province has favourable conditions for the development of tourism, such as its location between two of the largest cities in the south of Vietnam, a diverse ecological environment, traditional food, and numerous historical buildings [63]. Along with the tourism industry, advantages related to human resources, agriculture, forestry, and fisheries are also in evidence in this region and are a strong motivation for industrial development. In contrast, the growth rate of the agricultural sector in the first 10 years after project implementation tends to increase more slowly and then increases slightly faster as industrial zones are established to export agricultural products. In comparison with the case of not implementing Co Chien Bridge project, the revenue from different economic sectors declines significantly, and the real estate market would be one of the most affected sectors due to its contributed revenue. The reason for these declines is because the Co Chien Bridge project is a main connection between Tra Vinh Province and big cities in the South of Vietnam. Without the Co Chien bridge project, two main variables of the CBA system, including street capacity and population growth rate, would have major changes and create significant impacts on the supply chain capacity in Tra Vinh Province. Without project investment, it clearly shown that the revenue from industrial sectors increases slowly and directly affects the total GDP of Tra Vinh province (Figure 11). To sum up, the visualization capability of SD provides us with a holistic picture of the project impacts on the local economy, and the difference between growth rates for different industries should be considered a critical factor used for evaluating and deciding on project prioritisation.
Validation is the next step used to ensure that the model supports the objective truth [40]. As no model exactly represents the real world, the model was verified and validated based on a set of limitations and assumptions. Instead of reflecting exactly historical data, variables of the system should show the meaningful relationship with others in the whole system. In line with this, the CBA model in this research was built based on specific constraints and assumptions (Appendix A) to provide insights on CBA in transport infrastructure projects and to support policy makers in optimizing investment options.
6. Conclusions and Recommendations
This research focused on researching the indirect impacts of transport project investment on the local economy to improve the comprehensiveness of CBA and support decision-making processes. SD provides a causal model, which can help policy-makers to recognise the relationships between transport infrastructure projects and benefits to the local economy. The interactions between CBA components were shown using a number of different feedback loops. Understanding these interactions allows policy-makers to determine the key factors of the system to inform necessary changes during the decision-making process. In addition, the stock-flow model of the CBA system allows experts to measure the impact of project investment on the local economy and determine how individual economic sectors will be affected. By setting the input data for the stock-flow model, together with using the Vensim software, experts can make quantitative evaluations for the economic and social benefits of an infrastructure project.
In order to improve the process of model development in the CBA system and to improve the effectiveness of decision-making processes, some practical suggestions should be implemented. Firstly, the CBA system needs to be discussed by experts, along with specific conditions and assumptions to identify the costs and benefits of investing in a transport infrastructure project. Any changes in environmental conditions or assumptions can lead to changes in outputs, so policy-makers should pay attention to this factor in the early project stages in order to effectively set up the working conditions used for modelling the CBA system before moving to the next stages. Next, the research results should be connected to the planning process after CBA because this allows CBA practitioners to discuss the results of CBA with the people who will use the CBA results. Differences in understanding problems can be solved by direct discussion between experts and local planners. This ensures that policy-makers have a full understanding of the issues of the project (costs), as well as being able to recognise the impact of the project in terms of benefits to the local economy, before making important investment decisions. Finally, human resources are key factors contributing to the success of any project, so it is important to select people who have sufficient understanding of system dynamics and project management for the project team.
7. Limitation and Future Work
While this research has provided an alternative approach to evaluating the economic and social benefits generated from transport infrastructure projects, some uncertainties and several limitations have been identified. Firstly, system dynamics is an approach that is effective for modelling complex systems in the real world, but this approach primarily relies on assumptions and constraints to set up the conditions used for modelling. As these assumptions and constraints will be different for every project, the project team will need to consider these carefully while establishing and identifying the boundary of the CBA system. Secondly, the database of the CBA system is based on project information provided by team members of the Co Chien Bridge project and local government, so there is a slight difference between the economic indices used during project evaluation. Thirdly, resource constraints were also a limitation of this research. It is recommended that future modelling efforts be implemented with the support of additional experts in areas such as system dynamics, project management, and social-economic statistics.
Reflecting on the research limitations mentioned in the previous section, further research is recommended in the following areas. Firstly, breaking down the CBA variable into sub-level activities and studying their dynamics individually could be a fruitful area for future research. Secondly, the methodology used in this research should be applied to different countries, thereby increasing the data available for future comparisons of cost-benefit factors in infrastructure projects in different cultural contexts. Thirdly, it would be useful to organise workshops for practitioners and academics in order to increase their mutual understanding of the application of system dynamics for cost-benefit analyses. Finally, it would be useful to capture the information from the above activities in a generic SD model that can be parameterized for a wide range of situations.
Acknowledgments
We would like to thank many people from Transport Engineering Design Inc. (TEDI) in Vietnam, who provided various data, reports, and information to support this research.
Author Contributions
T.N. contributed to the professional development, data collection and analysis; S.C. contributed to the development of the framework, writing and editing; V.I. contributed to the data analysis.
Conflicts of Interest
The authors declare no conflict of interest.
Appendix A

Table A1.
Variables and Model Parameters.
| List | Parameter | Initial Value Set | Unit | Source |
|---|---|---|---|---|
| 1 | Land acquisition cost | 10.8 | USD Million | Transport Engineering Design Inc. [56] |
| 2 | Construction cost | 183.6 | USD Million | Transport Engineering Design Inc. [56] |
| 3 | Project management cost | 14.2 | USD Million | Transport Engineering Design Inc. [56] |
| 4 | Project operation cost | 305 | USD Million | Transport Engineering Design Inc. [56] |
| 5 | Environment protection cost | 93 | USD Million | Appendix C |
| 6 | Local Population | 1,360,300 | People | General Statistics Office of Vietnam [64] |
| 7 | Population growth rate | 0.8 | %/year | General Statistics Office of Vietnam [64] |
| 8 | Number of vehicles travelling before bridge built | 3,123,000 | vehicles/year | Transport Engineering Design Inc. [56] |
| 9 | The vehicle growth rate | 5.5 | %/year | Transport Engineering Design Inc. [56] |
| 10 | Vehicle occupancy rate | 80% | % | Transport Department |
| 11 | Use of mass transit and alternative modes | 12% | % | Transport Department |
| 12 | Street and highway capacity | 9,061,800 | vehicles/year | Transport Engineering Design Inc. [56] |
| 13 | System wide average speed options | 40; 60; 80 | km/h | Transport Engineering Design Inc. [56] |
| 14 | Goods inventory in Tra Vinh Province | 361,000 | Tons | General Statistics Office of Vietnam [64] |
| 15 | Order to be released in Tra Vinh Province | 520,000 | Tons | General Statistics Office of Vietnam [64] |
| 16 | Agriculture revenue | 225.1 | USD Million | General Statistics Office of Vietnam [64] |
| 17 | Agriculture growth rate | 3.44 | %/year | General Statistics Office of Vietnam [64] |
| 18 | Industry revenue | 122.6 | USD Million | General Statistics Office of Vietnam [64] |
| 19 | Industry growth rate | 27.8%/year | N/A | General Statistics Office of Vietnam [64] |
| 20 | Transport cost saving | Transport Engineering Design Inc. [56] | ||
| + v = 40 km/h | 15 | % | Appendix | |
| + v = 60 km/h | 25 | % | Appendix | |
| 21 | Tourism revenue | 26.7 | USD Million | [64] |
| 22 | Tourism service development | 13.1 | %/year | [64] |
| 23 | The retail market revenue | 290.5 | USD Million | [64] |
| 24 | The retail market growth rate | 20.9 | %/year | [64] |
| 25 | The real estate market revenue | 517.9 | USD Million | [64] |
| 26 | The growth rate of the real estate | 34.1 | %/year | [64] |
| 27 | The unemployment rate of Tra Vinh Province | 13.4 | %/year | [64] |
| 28 | Ticket price of toll road | 2 | USD | Local policy |
| 29 | Tax of transport operation | 2 | %/revenue/year | General Department of Taxation (GDT) 2013 |
| 30 | Agriculture income tax | 1 | %/revenue/year | GDT 2013 |
| 31 | Average tax of industrial sector | 2 | %/revenue/year | GDT 2013 |
| 32 | Tourist tax | 3 | %/revenue/year | GDT 2013 |
| 33 | Property tax | 2.5 | %/revenue/year | GDT 2013 |
| 34 | Retail tax | 3 | %/revenue/year | GDT 2013 |
Appendix B. Scripts and Model Equations
Formal
Script
where Stock (0) is the stock at the initial time
Stock = INTEG (rate1–rate2, Stock_0)
- Number of vehicles (t) = Number of vehicle (t0) +Number of vehicle (0) = 3,123,000 (vehicle)
- Agriculture revenue (t) = Agriculture revenue (0) +Agriculture revenue (0) = 225.1 (US Million)
- Industrial revenue (t) = Industrial revenue (0) +Industrial revenue (0) = 122.6 (US Million)
- Tourism revenue (t) = Tourism revenue (0) +Tourism revenue (0) = 26.7 (US Million)
- Real estate revenue (t) = Real estate revenue (0) +Real estate revenue (0) = 517.9 (US Million)
- Retail market revenue (t) = Retail market revenue (0) +Retail market revenue (0) = 290.5 (US Million)
- GDPin = = (US Million)
According to the report of the Ministry of Planning and Investment [65], the labour market of the Mekong Delta in Vietnam is mainly supplemented by three main economic sectors, which are agriculture (49.5%) and the industrial and real estate markets (17.2%), as well as tourism and the retail market (33.3%). Based on these statistics, the unemployment rate of the Tra Vinh Province is suggested in following equation.
• The unemployment rate = the current unemployment rate (0.167) − 0.495 * agriculture growth rate − 0.172 * (industrial growth rate + real estate market growth rate) − 0.333 * (retail market growth rate + tourism growth rate).
Supply chain activities comprise the transformation of natural resources, raw materials, and components into a finished product that is delivered to the end customer [66]. This relationship can be illustrated in the following equations.
- Supply chain capacity = Orders to be Released/Good Inventory;
- System-wide average speed = IF THEN ELSE (‘Congestion volume/capacity’< 1, 60, 40) (km/h);
- The percentage of successful delivery = IF THEN ELSE (‘System-wide average speed’ ≥ 60%, 80%, 50%);
- The percentage of successful orders = IF THEN ELSE (The percentage of transport cost saving ≥ 25%, 80%, 50%)
- Orders to be Released = The percentage of successful orders * Orders to be Released
- Goods Inventory = The percentage of successful delivery * Goods Inventory
Cost-benefit analysis of the Co Chien Bridge project is defined using the total discounted benefits minus the total costs of the project. The relationship between the total costs and total benefits is calculated in following equations.
- Total present values of benefits =
- PV(t) = benefit(t) *
- Current time PV = (1 + Discount rate * TIME STEP)^((Time − INITIAL TIME)/TIME STEP)
- Discount rate = 10%/year
- Total cost(0) = Land acquisition cost + construction cost + project management cost + Project operation & maintain cost + pollution cost.
- Net present value (NPV) = Total present values of benefits − Total cost(0)
- Payback period = (year).
Appendix C
Table A2.
Environmental Risk Assessment Matrix.
| Risk ID | Risk Categories | Risk Scenario | Likelihood | Cost ($ Million) | ||||
|---|---|---|---|---|---|---|---|---|
| Consequence | Risk Level | |||||||
| Quantitative | Qualitative | Quan | Qual | Quan | Qual | |||
| 1 | Visual Amenity | Degraded visual amenity due to untidy construction site and presence of plant and equipment | 50% | Moderate | 10 | High | 5 | Extreme |
| 2 | Air Quality | Dust generated through excavation works and traffic movement | 100% | Almost certain | 6 | Moderate | 6 | Extreme |
| 3 | Plant, equipment and vehicle emissions during construction | 75% | Likely | 2 | Minor | 1.5 | Moderate | |
| 4 | Noise and vibration | Temporary elevated noise emissions during construction of substation and cable vault (during weekdays and on the weekend) at neighboring residential and commercial properties | 25% | Unlikely | 6 | Moderate | 1.5 | Moderate |
| 5 | Traffic and access | Traffic disruption due to partial closure of the project during the construction of the cable vault | 50% | Moderate | 2 | Minor | 1 | Low |
| 6 | Increase in vehicular traffic on local road network during construction of the substation and cable vault | 75% | Likely | 6 | Moderate | 4.5 | High | |
| 7 | Sustainability and climate change | Inefficient use of resources, plant and equipment during construction | 25% | Unlikely | 6 | Moderate | 1.5 | Moderate |
| 8 | Emissions associated with use of resources during construction | 75% | Likely | 6 | Moderate | 4.5 | High | |
| 9 | Water quality and hydrology | Discharge of ‘dirty’ water and pollution of waterways and drainage lines | 100% | Almost certain | 14 | Extreme | 14 | Extreme |
| 10 | Discharge of contaminant laden runoff from accidental spillage of chemicals and fuels from the operation and maintenance of construction plant and equipment | 25% | Unlikely | 14 | Extreme | 3.5 | Extreme | |
| 11 | Contamination | Contamination of soil, surface water and groundwater from spills and leaks associated with the inappropriate storage and handling of chemicals, oils and fuel | 75% | Likely | 14 | Extreme | 10.5 | Extreme |
| 12 | Localized contaminated material that is excavated during cable vault works | 25% | Unlikely | 10 | High | 2.5 | High | |
| 13 | Socio-economic | Amenity (including traffic, noise and visual) impacts on the surrounding residents and stakeholders during construction | 75% | Likely | 10 | High | 7.5 | Extreme |
| 14 | Safety and access impacts associated with the construction of the bridge | 75% | Likely | 10 | High | 7.5 | Extreme | |
| 15 | Waste management | Potential contamination of land and water due to inappropriate handling and disposal of waste materials | 50% | Moderate | 10 | High | 5 | Extreme |
| 16 | Nonconformance with waste hierarchy and principles of the local government | 75% | Likely | 10 | High | 7.5 | Extreme | |
| 17 | Heritage | Impact to any item of historic during construction | 50% | Moderate | 6 | Moderate | 3 | High |
| 18 | Flora | Spread of exotic species | 25% | Unlikely | 6 | Moderate | 1.5 | Moderate |
| 19 | Cumulative impacts | Cumulative impacts on environment and community due to cumulative construction projects in the immediate vicinity | 50% | Moderate | 10 | High | 5 | Extreme |
| Total | 93 | |||||||
Appendix D
Figure A1.
Assumptions and Policy Test.

References
- Flyvbjerg, B. Policy and Planning for Large Infrastructure Projects: Problems, Causes, Cures; World Bank Publications: Washington, DC, USA, 2005; Volume 3781. [Google Scholar]
- Goodman, A.S.; Hastak, M. Infrastructure Planning Handbook: Planning, Engineering, and Economics; American Society of Civil Engineers (ASCE) Press: Reston, VA, USA, 2006. [Google Scholar]
- US Department of Transport and Federal Highway Administration. Freight Transportation Improvements and the Economy; US Department of Transport and Federal Highway Administration: Washington, DC, USA, 2004.
- Sassone, P.G. Social Impact Assessment and cost-benefit analysis. In Methodology of Social Impact Assessment; Dowden, Hutchinson and Ross, Inc.: Stroudsberg, PA, USA, 1977. [Google Scholar]
- Asensio, J.; Roca, O. Evaluation of transport infrastructure projects beyond cost-benefit analysis: An application to Barcelona’s 4th ring road. Int. J. Transp. Econ. 2001, 28, 387–403. [Google Scholar]
- Kanemoto, Y. Cost-benefit analysis and the second best land use for transportation. J. Urban Econ. 1977, 4, 483–503. [Google Scholar] [CrossRef]
- Venables, A.J.; Gasiorek, M. The welfare implications of transport improvements in the presence of market failure. Rep. Standing Advis. Comm. Trunk Road Assess. 1998, 3, 7–58. [Google Scholar]
- Fraumeni, B.M. Productive Highway Capital Stock Measures; Federal Highway Administration: Washington, DC, USA, 1999.
- Aschauer, D.A. Is public expenditure productive? J. Monet. Econ. 1989, 23, 177–200. [Google Scholar] [CrossRef]
- European Comission. Guide to Cost-Benefit Analysis of Investment Projects; European Union: Luxembourg, 2008; pp. 1–259. [Google Scholar]
- Asain Development Bank. Cost-Benefit Analysis for Development. 1 June 2013. Available online: https://openaccess.adb.org/handle/11540/3217 (accessed on 1 April 2015).
- McCowan, A.K.; Mohamed, S.A.M. Classification of decision support systems for the analysis and evaluation of concession project investments. J. Financ. Manag. Prop. Constr. 2002, 7, 127–137. [Google Scholar]
- Bourne, M.; Mills, J.; Wilcox, M.; Neely, A.; Platts, K. Designing, implementing and updating performance measurement systems. Int. J. Oper. Prod. Manag. 2000, 20, 754–771. [Google Scholar] [CrossRef]
- Lebas, M.; Euske, K. A conceptual and operational delineation of performance. Bus. Perform. Meas. Theory Pract. 2002, 5, 65–79. [Google Scholar]
- David, R.; Ngulube, P.; Dube, A. A cost-benefit analysis of document management strategies used at a financial institution in Zimbabwe: A case study. South Afr. J. Inf. Manag. 2013, 15, 1–10. [Google Scholar] [CrossRef]
- Nickel, J.; Ross, A.M.; Rhodes, D.H. Comparison of project evaluation using cost-benefit analysis and multi-attribute tradespace exploration in the transportation domain. Proceedings of 2nd International Symposium on Engineering Systems, Cambridge, MA, USA, 15–17 June 2009. [Google Scholar]
- Hanley, N.; Spash, C.L. Cost-Benefit Analysis and the Environment; Edward Elgar Aldershot: Cheltenham, UK, 1993. [Google Scholar]
- Barrell, D.W.; Hills, P.J. The application of cost-benefit analysis to transport investment projects in Britain. Transportation 1972, 1, 29–54. [Google Scholar] [CrossRef]
- Nguyen-Hoang, P.; Yeung, R. What is paratransit worth? Transp. Res. A Policy Pract. 2010, 44, 841–853. [Google Scholar]
- Rotaris, L.; Danielis, R.; Marcucci, E.; Massiani, J. The urban road pricing scheme to curb pollution in Milan, Italy: Description, impacts and preliminary cost–benefit analysis assessment. Transp. Res. A Policy Pract. 2010, 44, 359–375. [Google Scholar] [CrossRef]
- Stewart, F. A note on social cost-benefit analysis and class conflict in LDCs. World Dev. 1975, 3, 31–39. [Google Scholar]
- Beesley, M.E.; Gist, P.; Glaister, S. Cost benefit analysis and London’s transport policies. Prog. Plan. 1982, 19, 169–269. [Google Scholar] [CrossRef]
- Mohring, H. Maximizing, measuring, and not double counting transportation-improvement benefits: A primer on closed-and open-economy cost-benefit analysis. Transp. Res. B Methodol. 1993, 27, 413–424. [Google Scholar] [CrossRef]
- Odeck, J. Ranking of regional road investment in Norway. Transportation 1996, 23, 123–140. [Google Scholar] [CrossRef]
- Sager, T.; Ravlum, I.-A. The political relevance of planners’ analysis: The case of a parliamentary standing committee. Plan. Theory 2005, 4, 33–65. [Google Scholar] [CrossRef]
- Eliasson, J.; Lundberg, M. Do cost–benefit analyses influence transport investment decisions? Experiences from the Swedish Transport Investment Plan 2010–21. Transp. Rev. 2012, 32, 29–48. [Google Scholar] [CrossRef]
- Annema, J.A.; Frenken, K.; Koopmans, C.; Kroesen, M. Relating cost-benefit analysis results with transport project decisions in the Netherlands. Lett. Spat. Resour. Sci. 2016, 10, 1–19. [Google Scholar] [CrossRef]
- Transit Cooperative Research Program. Estimating the Benefits and Costs of Public Transit Projects 78; National Research Council: Washington, DC, USA, 2002. [Google Scholar]
- Annema, J.A.; Koopmans, C.; van Wee, B. Evaluating transport infrastructure investments: The Dutch experience with a standardized approach. Transp. Rev. 2007, 27, 125–150. [Google Scholar] [CrossRef]
- Ackerman, F.; Heinzerling, L. Pricing the priceless: Cost-benefit analysis of environmental protection. Univ. Pa. Law Rev. 2002, 5, 1553–1584. [Google Scholar] [CrossRef]
- Ludwig, D.; Brock, W.A.; Carpenter, S.R. Uncertainty in discount models and environmental accounting. Ecol. Soc. 2005, 10, 13. [Google Scholar] [CrossRef]
- Jones, H.; Moura, F.; Domingos, T. Transport infrastructure project evaluation using cost-benefit analysis. Procedia Soc. Behav. Sci. 2014, 111, 400–409. [Google Scholar] [CrossRef]
- Clark, M.; Sartorius, R.; Bamberger, M. Monitoring and Evaluation: Some Tools, Methods and Approaches; The World Bank: Washington, DC, USA, 2004. [Google Scholar]
- Layard, P.R.G.; Layard, R.; Glaister, S. Cost-Benefit Analysis; Cambridge University Press: Cambridge, UK, 1994. [Google Scholar]
- Turner, R.K. Limits to CBA in UK and European environmental policy: Retrospects and future prospects. Environ. Resour. Econ. 2007, 37, 253–269. [Google Scholar] [CrossRef]
- Jackson, M. Systems Approaches to Management; Springer Science & Business Media: New York, NY, USA, 2007. [Google Scholar]
- Hitchins, D.K. Systems Engineering: A 21st Century Systems Methodology; John Wiley & Sons Ltd.: West Sussex, England, 2008. [Google Scholar]
- Richardson, G. Encyclopedia of Operations Research and Management Science, 1st ed.; Kluwer Academic: Boston, MA, USA, 1996. [Google Scholar]
- Forrester, J.W. Industrial dynamics. J. Oper. Res. Soc. 1997, 48, 1037–1041. [Google Scholar] [CrossRef]
- Sterman, J.D. Business Dynamics: Systems Thinking and Modeling for a Complex World; McGraw-Hill/Irwin: New York, NY, USA, 2000. [Google Scholar]
- System Dynamics Society. System Dynamics for Strategy: What, When, and How. Available online: http://www.systemdynamics.org/sd-for-strategy/ (accessed on 1 September 2015).
- Wolstenholme, E.F. System Enquiry: A System Dynamics Approach; John Wiley & Sons, Inc.: New York, NY, USA, 1990. [Google Scholar]
- Richardson, G.P.; Otto, P. Applications of system dynamics in marketing: Editorial. J. Bus. Res. 2008, 61, 1099–1101. [Google Scholar] [CrossRef]
- Rodrigues, A.; Bowers, J. The role of system dynamics in project management. Int. J. Proj. Manag. 1996, 14, 213–220. [Google Scholar] [CrossRef]
- Forrester, J.W. Urban Dynamics; MIT Press: Cambridge, MA, USA, 1969; p. 285. [Google Scholar]
- Stave, K.A. Using system dynamics to improve public participation in environmental decisions. Syst. Dyn. Rev. 2002, 18, 139–167. [Google Scholar] [CrossRef]
- Yang, W.; Xiao-ming, W.; Yang, W. Application of system dynamics to project management in old urban redevelopment. Proceedings of International Conference on Wireless Communications, Networking and Mobile Computing, WiCom 2007, Shanghai, China, 21–25 September 2007; pp. 5236–5239. [Google Scholar]
- Yuan, H.; Shen, L.; Hao, J.J.; Lu, W. A model for cost–benefit analysis of construction and demolition waste management throughout the waste chain. Resour. Conserv. Recycl. 2011, 55, 604–612. [Google Scholar] [CrossRef]
- Wei, S.; Yang, H.; Song, J.; Abbaspour, K.C.; Xu, Z. System dynamics simulation model for assessing socio-economic impacts of different levels of environmental flow allocation in the Weihe River Basin, China. Eur. J. Oper. Res. 2012, 221, 248–262. [Google Scholar] [CrossRef]
- Mavrommati, G.; Bithas, K.; Panayiotidis, P. Operationalizing sustainability in urban coastal systems: A system dynamics analysis. Water Res. 2013, 47, 7235–7250. [Google Scholar] [CrossRef] [PubMed]
- Shih, Y.-H.; Tseng, C.-H. Cost-benefit analysis of sustainable energy development using life-cycle co-benefits assessment and the system dynamics approach. Appl. Energy 2014, 119, 57–66. [Google Scholar] [CrossRef]
- Sterman, J.D. System dynamics modeling: Tools for learning in a complex world. Calif. Manag. Rev. 2001, 43, 8–25. [Google Scholar] [CrossRef]
- Vensim. Vensim History. Available online: http://vensim.com/vensim-history/ (accessed on 20 May 2016).
- National Centre for Socio-Economic Information and Forcast. Economic Development Planning in Tra Vinh Province during the period 2010–2015. Available online: http://www.ncseif.gov.vn/sites/en/Pages/kehoachphattrienkinhte-nd-1379.html (accessed on 1 September 2014).
- Google Maps. Tra Vinh Province. Available online: https://www.google.com.au/maps/@10.0225046,106.3204696,8038m/data=!3m1!1e3 (accessed on 20 June 2015).
- Transport Engineering Design Inc. Co Chien Bridge Project Feasibility; TEDI: Ha Noi, Vietnam, 2013. [Google Scholar]
- Dang, A.; Goldstein, S.; McNally, J. Internal migration and development in Vietnam. Int. Migr. Rev. 1997, 31, 312–337. [Google Scholar] [CrossRef]
- Le, N. Substainable Development of Ethic Minorities. 1 September 2012. Available online: http://www.cantholib.org.vn/Database/Content/280.pdf (accessed on 1 April 2015).
- Chang, Y. Logistical Management; Hwa-Tai Bookstore Ltd.: Taipei, Taiwan, 1998. [Google Scholar]
- Lean, H.H.; Huang, W.; Hong, J. Logistics and economic development: Experience from China. Transp. Policy 2014, 32, 96–104. [Google Scholar] [CrossRef]
- The World Bank. Vietnam. Available online: http://data.worldbank.org/country/vietnam (accessed on 1 September 2014).
- The Organisation for Economic Co-operation and Development. Gross Domestic Product (GDP). 1 September 2001. Available online: https://stats.oecd.org/glossary/detail.asp?ID=1163 (accessed on 1 May 2015).
- Travel Vietnam. Tra Vinh. 1 September 2014. Available online: https://www.travelvietnam.com/about-travel-vietnam.html (accessed on 2 May 2015).
- General Statistics Office of Vietnam. Statistical Data. 1 September 2012. Available online: https://gso.gov.vn/Default_en.aspx?tabid=766 (accessed on 1 April 2015).
- Ministry of Planning and Investment. Labour and Employment Survey in Vietnam. 1 September 2012. Available online: http://www.mpi.gov.vn/Pages/tinbai.aspx?idTin=2942&idcm=37 (accessed on 6 May 2015).
- Nagurney, A. Supply Chain Network Economics: Dynamics of Prices, Flows and Profits; Edward Elgar Publishing: Northampton, MA, USA, 2006. [Google Scholar]
Figure 1.
Generic Flow chart for System Dynamics (SD) modelling.
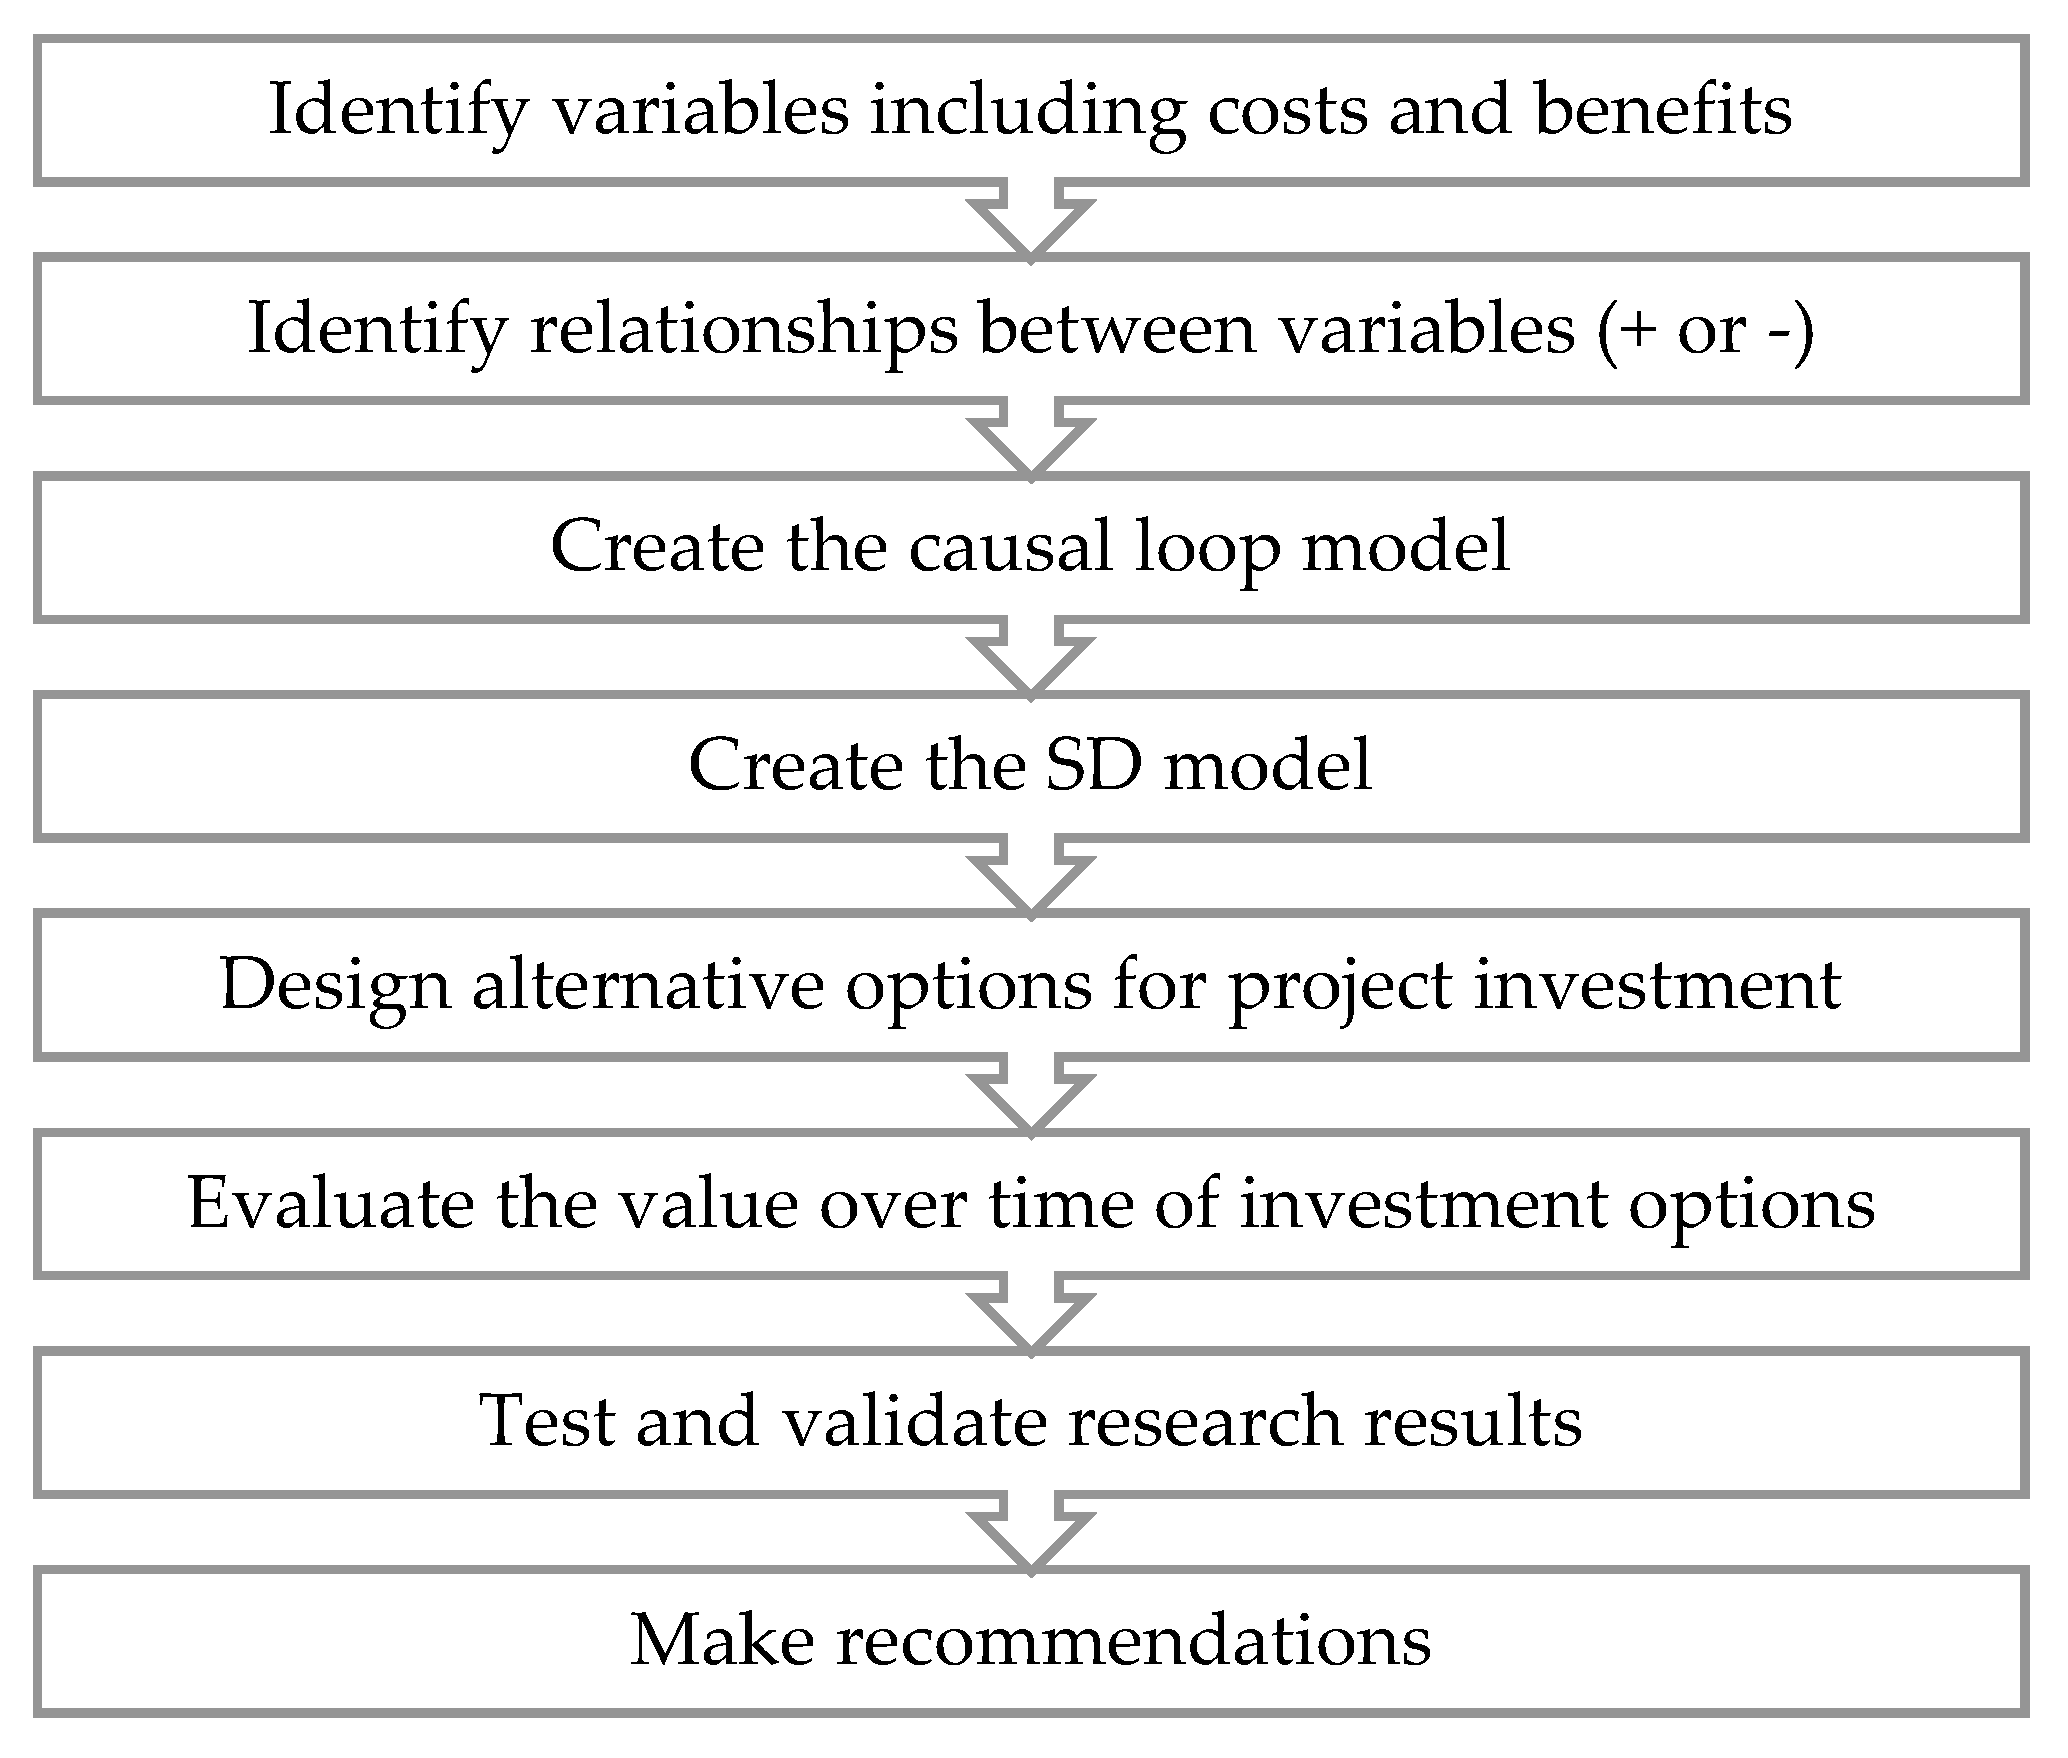
Figure 2.
The main road connecting Tra Vinh Province to Ho Chi Minh City, Vietnam. Adapted from Google Maps [55].
Figure 2.
The main road connecting Tra Vinh Province to Ho Chi Minh City, Vietnam. Adapted from Google Maps [55].

Figure 3.
The relationship between project investment, travel cost saving, and industrial development.
Figure 3.
The relationship between project investment, travel cost saving, and industrial development.

Figure 4.
Reinforcement loop R_T1 and R_T2; T1 and T2 stand for Tax loop no. 1 and Tax loop no. 2.
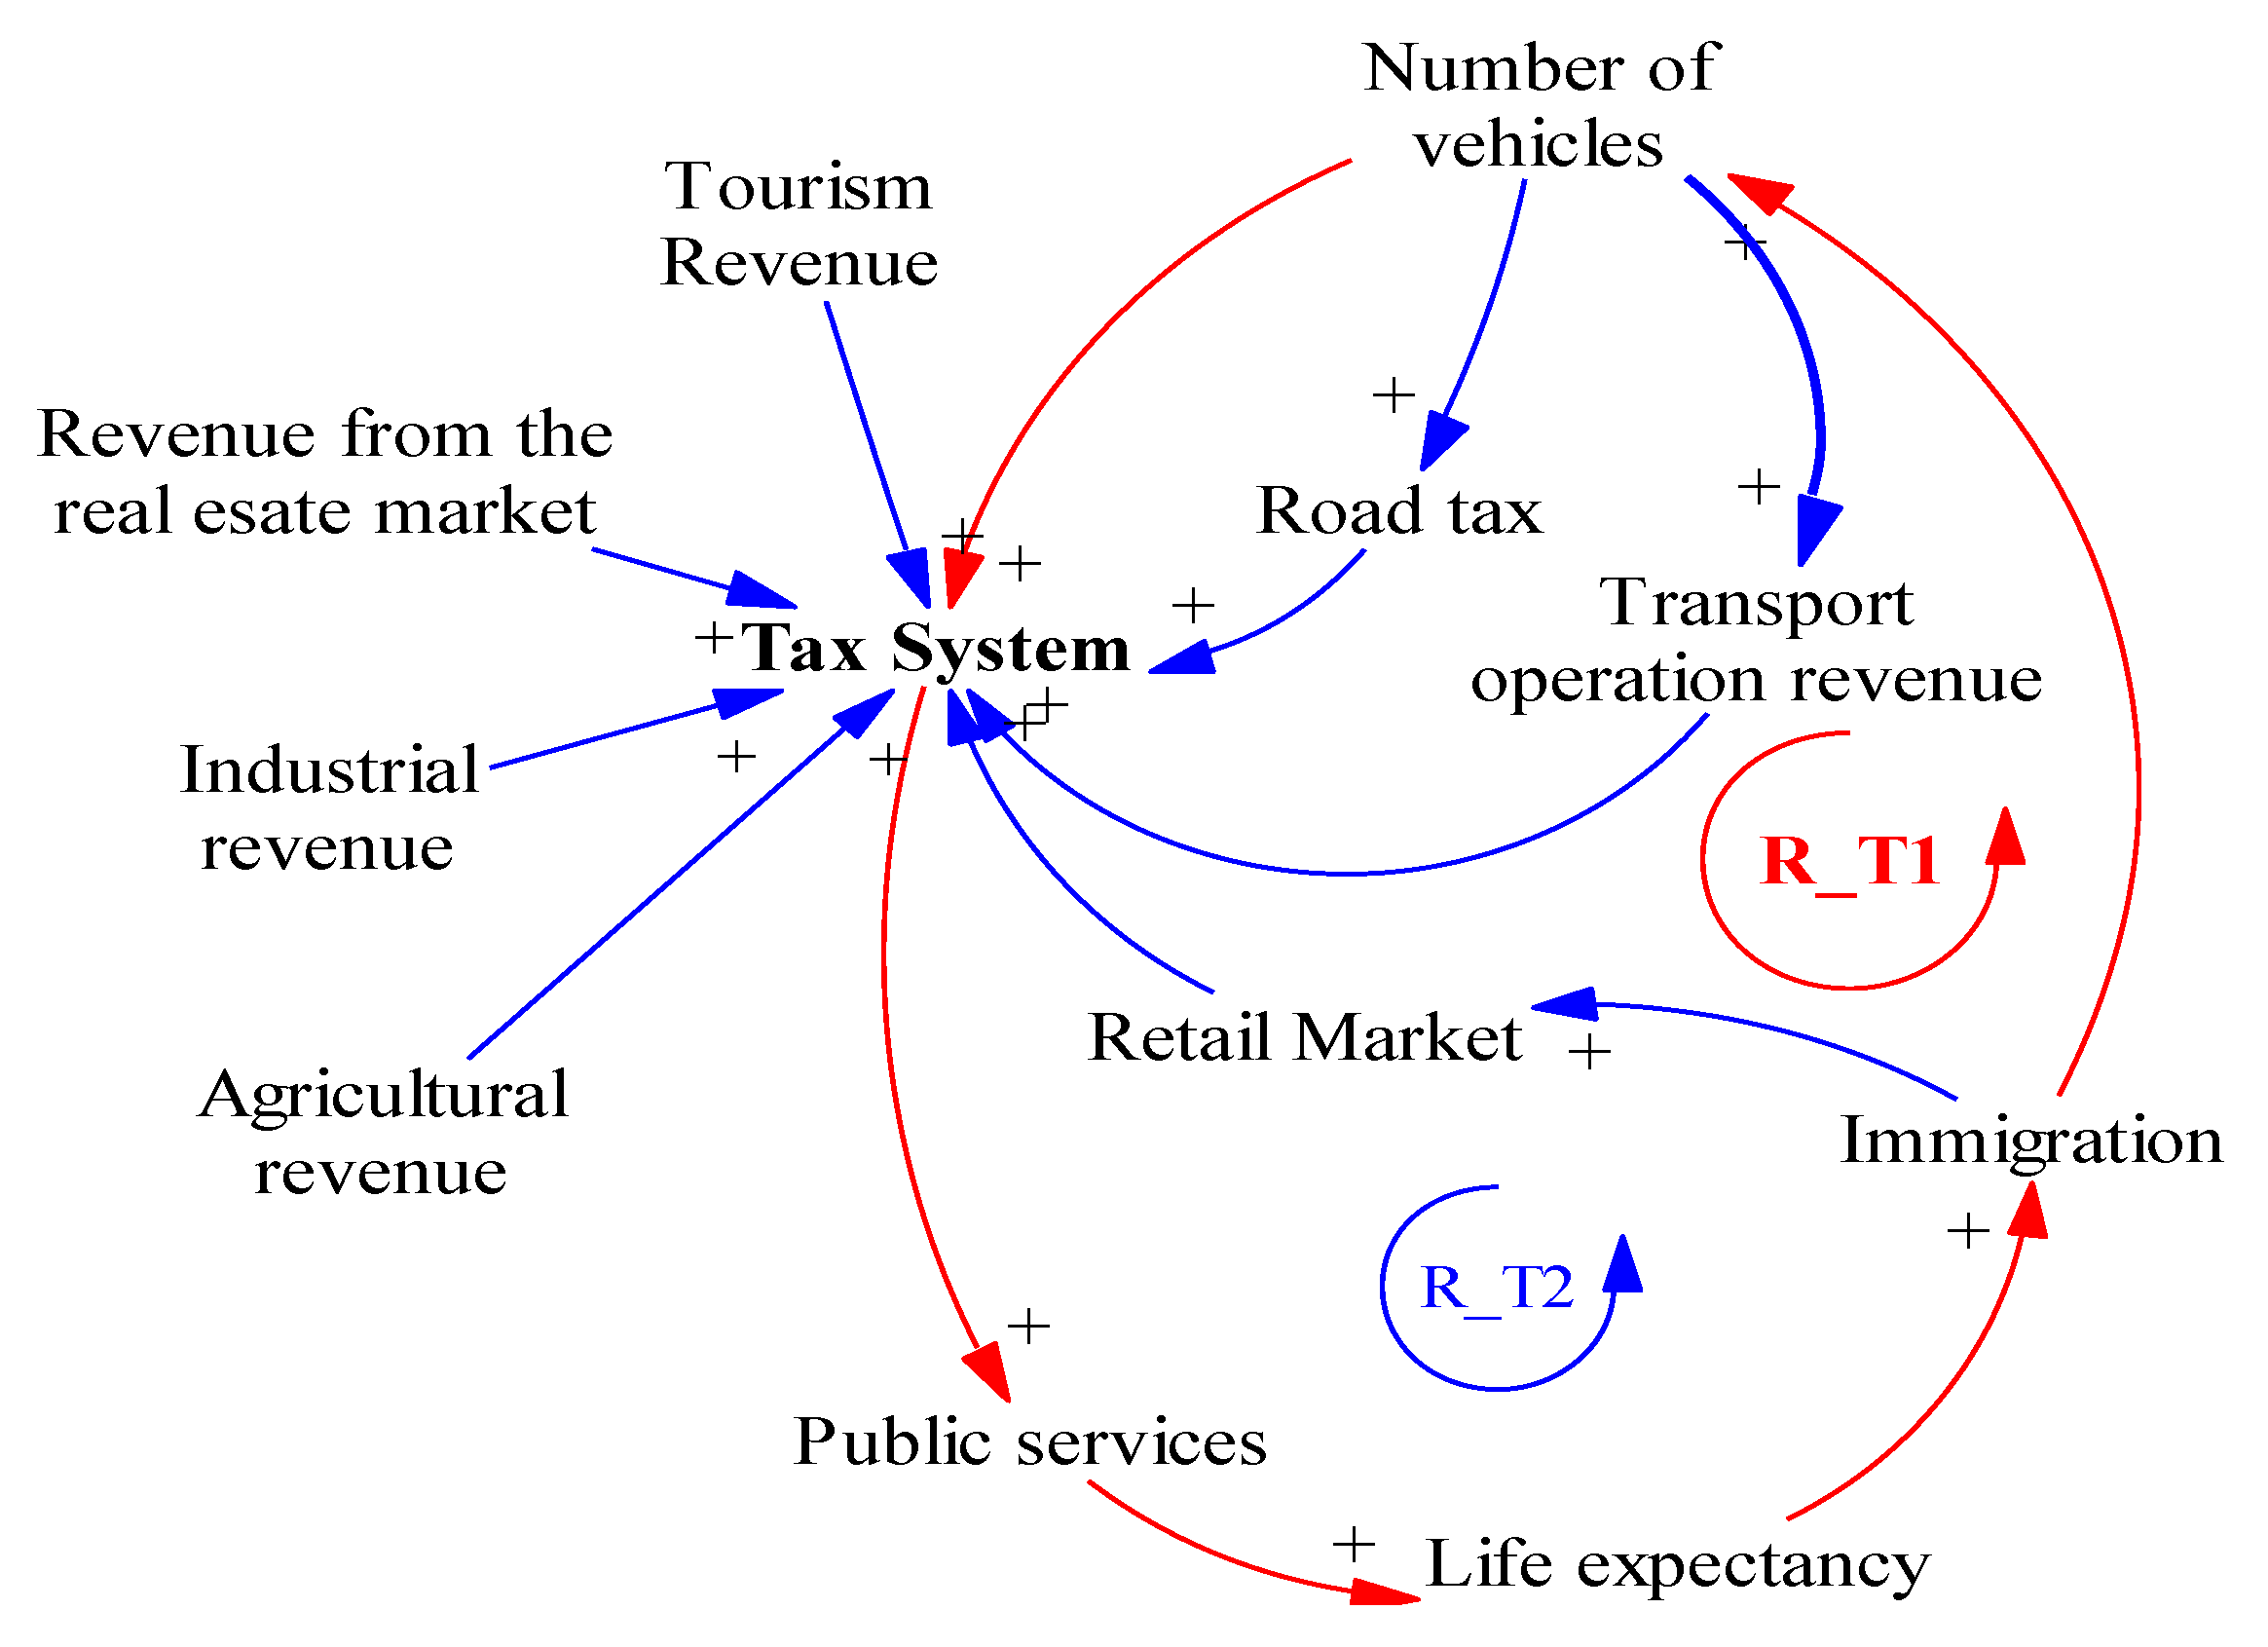
Figure 5.
The two livelihood loops.

Figure 6.
Causal model for the Co Chien Bridge Project.
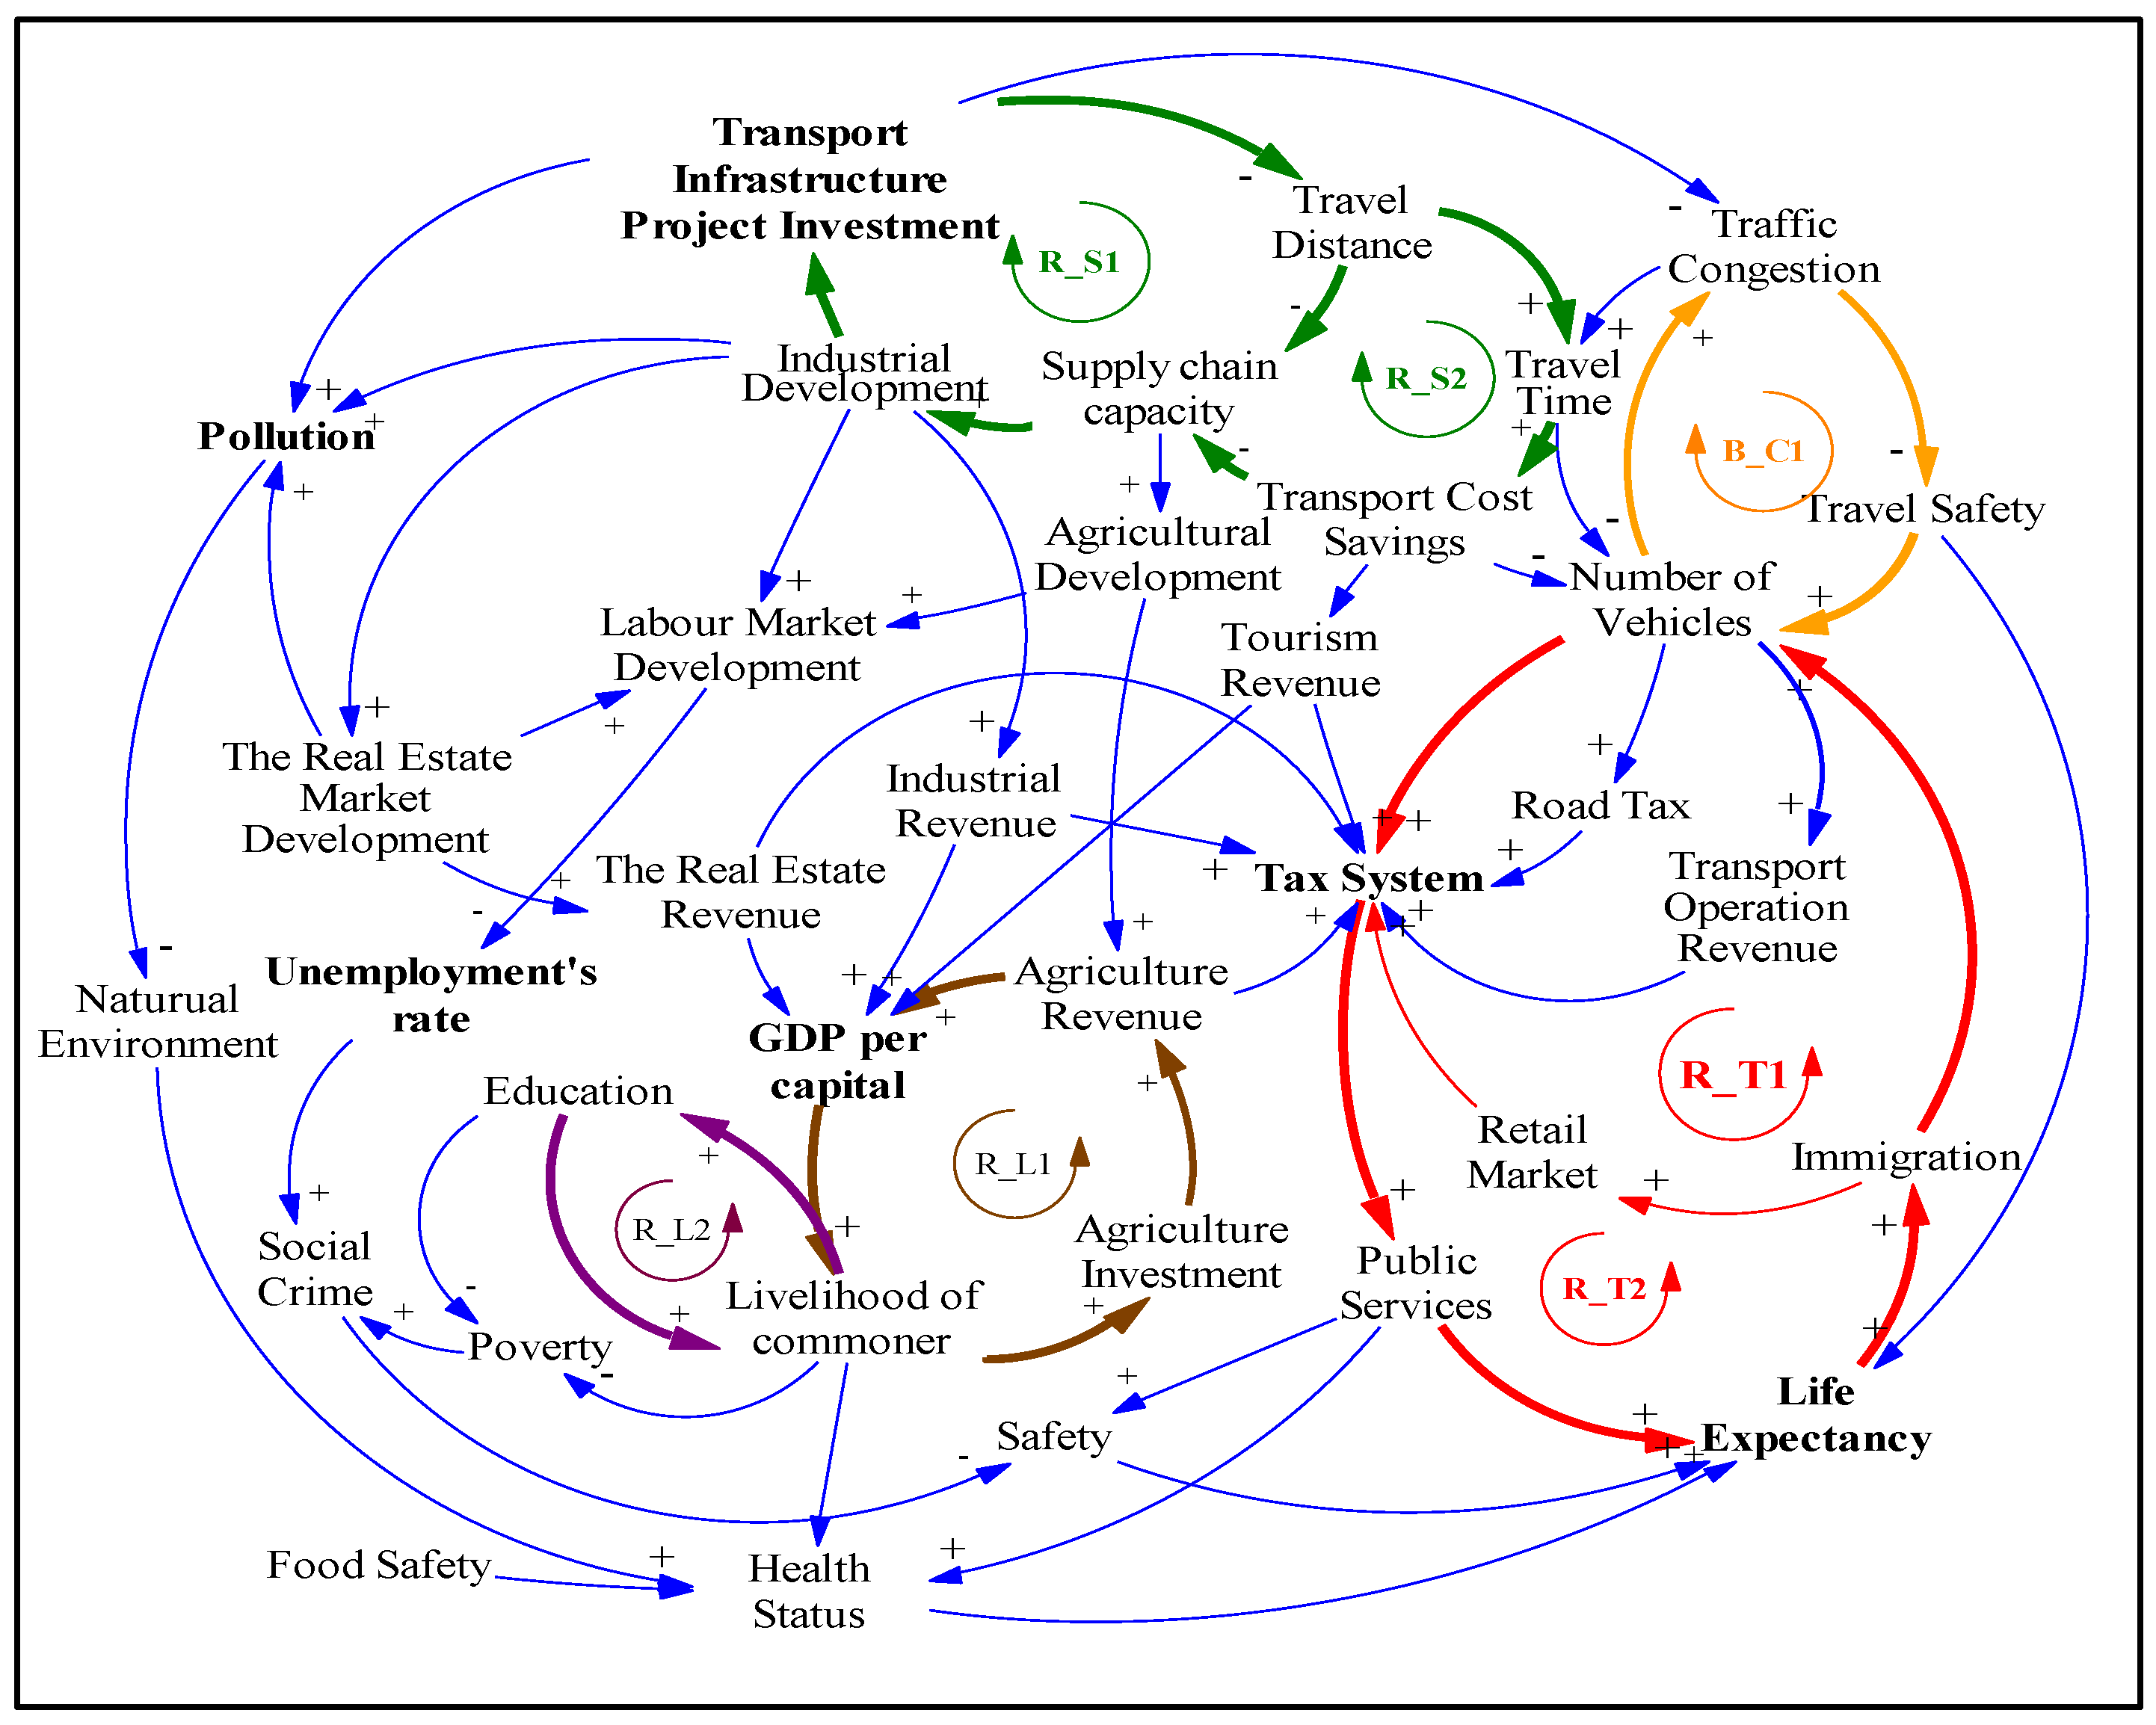
Figure 7.
The relationship between transport project investment and industrial sectors.

Figure 8.
Stock-Flow Model for Transport Infrastructure Project.

Figure 9.
Cost-benefit analysis of the Co Chien Bridge Project in Vietnam.

Figure 10.
Unemployment rate in Tra Vinh Province over a 30-year period from the opening of the bridge.
Figure 10.
Unemployment rate in Tra Vinh Province over a 30-year period from the opening of the bridge.

Figure 11.
Economic sectors’ revenue of Tra Vinh Province from the opening of the bridge.

© 2017 by the authors. Licensee MDPI, Basel, Switzerland. This article is an open access article distributed under the terms and conditions of the Creative Commons Attribution (CC BY) license (http://creativecommons.org/licenses/by/4.0/).
Share and Cite
MDPI and ACS Style
Nguyen, T.; Cook, S.; Ireland, V. Application of System Dynamics to Evaluate the Social and Economic Benefits of Infrastructure Projects. Systems 2017, 5, 29. https://doi.org/10.3390/systems5020029
AMA Style
Nguyen T, Cook S, Ireland V. Application of System Dynamics to Evaluate the Social and Economic Benefits of Infrastructure Projects. Systems. 2017; 5(2):29. https://doi.org/10.3390/systems5020029
Chicago/Turabian StyleNguyen, Tiep, Stephen Cook, and Vernon Ireland. 2017. "Application of System Dynamics to Evaluate the Social and Economic Benefits of Infrastructure Projects" Systems 5, no. 2: 29. https://doi.org/10.3390/systems5020029
Note that from the first issue of 2016, this journal uses article numbers instead of page numbers. See further details here.