
Using Textual Data in System Dynamics Model Conceptualization


UCL Institute for Environmental Design and Engineering, The Bartlett School of Environment, Energy and Resources, University College London, Central House, 14 Upper Woburn Place, London WC1H ONN, UK
*
Author to whom correspondence should be addressed.
Systems 2016, 4(3), 28; https://doi.org/10.3390/systems4030028
Submission received: 2 June 2016
/
Revised: 22 July 2016
/
Accepted: 28 July 2016
/
Published: 4 August 2016
(This article belongs to the Special Issue The Current State-of-the-Art of System Dynamics Modelling and Simulation)
Abstract
:Qualitative data is an important source of information for system dynamics modeling. It can potentially support any stage of the modeling process, yet it is mainly used in the early steps such as problem identification and model conceptualization. Existing approaches that outline a systematic use of qualitative data in model conceptualization are often not adopted for reasons of time constraints resulting from an abundance of data. In this paper, we introduce an approach that synthesizes the strengths of existing methods. This alternative approach (i) is focused on causal relationships starting from the initial steps of coding; (ii) generates a generalized and simplified causal map without recording individual relationships so that time consumption can be reduced; and (iii) maintains the links from the final causal map to the data sources by using software. We demonstrate an application of this approach in a study about integrated decision making in the housing sector of the UK.
1. Introduction
Qualitative data is an important source of information for system dynamics modeling. It can potentially support any stage of the modeling process, yet it is mainly used in the early steps such as problem identification and model conceptualization [1,2]. Interviewing the problem owner and stakeholders is one of the major techniques employed by system dynamicists to collect qualitative data, especially for model conceptualization. Such interviews are conducted in many different ways. For instance, interviewees are asked directly about causal relations to derive influence diagrams or causal loop diagrams [3], or they are presented with initial causal maps to be used in a disconfirmatory manner or to stimulate discussion [4,5,6,7]. Even more often, open or semi-structured interviews are conducted to inform model conceptualization, yet no formal approach is followed in the interview process or in the analysis of results [8,9,10] (These studies do not include an explanation about the approach followed to conduct and analyse interviews, therefore it is concluded that no formal approach is followed.).
Open or semi-structured interviews provide rich qualitative data about the mental models and underlying stories of the interviewees by allowing them to freely elaborate on the topic of interest. However, such qualitative data can be more efficiently and thoroughly utilized for model conceptualization if formal methods are adopted [2,11]. In this respect, the grounded theory approach of Strauss and Corbin [12] is considered as a powerful method to incorporate with system dynamics modeling. The grounded theory approach enables a theory to emerge from the data and is often used in social sciences for qualitative research. Therefore, it enables system dynamicists to explicitly link the main elements and causal relations of the model to information collected from stakeholders [2,11,13].
The grounded theory approach relies on ‘coding’ of textual data. The main steps of the coding process are, as described by Strauss and Corbin [12], (i) open coding, which involves dividing data into parts for comparison and grouping these parts into more abstract categories; (ii) axial coding, where categories are systematically connected to their sub-categories and hierarchical links are formed. These connections can be based on several types of relationships, such as contained, temporal, and causal relationships [14], and coding to derive causal loop diagrams is certainly concerned with the latter.
The use of coding for system dynamics modeling was initially exemplified by Repenning and Sterman [15] and Morrison [16]. Later, Kim and Andersen [17] introduced a formal coding method based on the grounded theory approach to the system dynamics community, and demonstrated generation of causal maps based on qualitative textual data. Their five-step method starts with (i) open coding to identify the themes in the data and continues with (ii) the identification of individual causal relationships, (iii) visualizing these relationships in words-and-arrow diagrams, (iv) generalizing and simplifying these diagrams (axial coding); and (v) recording the links between the final causal map and the data source explicitly in a data source reference table. This method has been thoroughly applied in various domains, such as land use [18], environmental adaptation in industry [19] and real estate developments [20].
The method of Kim and Andersen [17] helps in analyzing the data systematically and adds rigor to the model by preserving the links between the final causal map and the data source. However, as mentioned by the authors, it is labor intensive. To deal with this drawback, Turner et al. [18] deviate from the original method of Kim and Andersen in two aspects. Firstly, they combine Kim and Andersen’s steps i and iv, and they derive aggregate causal relationships instead of individual ones to shorten the process of variable identification. Secondly, they skip forming a data source reference table that records the links between causal relations and the data sources, which is an important step of the original method for building confidence in the model. This choice is justified by the coder’s direct contact with the data source. It is argued that a reference table is not critically important when the coder and interviewer are the same person since the interviewee’s intent and meaning can still be probed and bias can be reduced [21].
Another method to develop causal loop diagrams based on textual data has been introduced by Yearworth and White [22]. This method relies on the use of a computer-aided qualitative data analysis software (CAQDAS) to maintain the links between the resulting causal relations and the data source. Yearworth and White suggest defining a relation based on the occurrence of two codes within the same paragraph of the source, in addition to a hierarchical link determined at the axial coding step. A matrix query is run by using the software, and the intensity of two codes referring to the same paragraph of the text is determined. Yearworth and White acknowledge that a correlation based on the proximity of codes does not imply causality. To overcome this shortcoming, they suggest the analyst to examine all the coded text that result in high correlations so that the significance of a high correlation can be confirmed and causality can be investigated. However, in this case the method cannot be easily argued to be time efficient or to eliminate subjectivity.
In this paper, we introduce an alternative approach that synthesizes the strengths of both methods yet aims at accommodating their shortcomings. This alternative approach (a) is focused on causal relationships starting from the initial steps of coding; (b) generates a generalized and simplified causal map without recording individual relationships so that time consumption can be reduced; and (c) maintains the links from the final causal map to the data sources by using a software. We demonstrate an application of this approach in a study about integrated decision making in the housing sector of the UK.
2. Materials and Methods
In this section, we briefly introduce the case study and explain the data collection method. Then, we describe the alternative coding approach we followed to generate causal diagrams from this data.
2.1. Integrated Decision Making in the UK’s Housing Sector
The housing sector is a focal point of climate change policies in the UK, and it is expected to contribute 40 and 30 per cent of the total energy savings in 2020 and 2030, respectively [23]. Despite such high expectations, energy efficiency policies often fail to deliver satisfactory outcomes mainly due to policy resistance and unintended consequences. These unintended consequences arise in the built-environment as reduced indoor air quality, increased fuel poverty or increased CO2 emissions due to the rebound effect [24]. For instance, insulation measures are reported to cause moisture and lower indoor air quality [25]. Furthermore, unintended consequences extend beyond the built-environment and have various impacts on economic, social and natural environments, such as on population health, emotional wellbeing and community connection [26].
In order to avoid unintended consequences, systems thinking and an integrated approach are suggested both for research and for decision-making [24,26]. Macmillan et al. [27,28] present such a study that adopts a systemic approach to investigate the links between housing, energy and wellbeing, and to inform policymakers and stakeholders about these links and the long-term consequences of policies. The underlying research project included several participatory system dynamics modeling sessions summarized in Zimmermann, et al. [29]. The last of these sessions revealed that fragmentation within and between the organizations involved in the housing projects is a major source of unintended consequences. Following this finding, in January and February 2015, an author and another member of the research team analyzed the clusters of issues elicited in a participatory workshop session held in November 2014. Fragmentation at the local level stood out and we conducted 16 interviews with a group of interdisciplinary stakeholders from government departments, non-governmental organizations (NGOs), industry, academia and community groups between February and October 2015. The semi-structured interviews followed four leading questions about the role of the interviewees, the nature and mission of their organization, their organizational experience with fragmentation and integration at the local level, and the personal and organizational delivery framework, as shown in Table 1. We encouraged participants to tell about their lived organizational experience with fragmentation and integration and followed up with questions why fragmentation or integration emerged in order not to have them report on generalities but on specific causal relationships instead.
The interviews generally lasted between one and two hours, amounting to 21 hours in total. They were audiotaped and transcribed, forming the raw textual data amounting to a total of 155,800 words, which was used as the input of the coding analysis.
2.2. Coding Approach
The purpose of the coding approach is to relate the causal map directly to the data sources. We consider this important because it helps the modeler be more explicit, reflective and rigorous in the conversion of data to causal links. Besides, it highly increases other people’s ability to review the work of the modeler and gain some insight into their mental processes.
As mentioned before, the coding approach we follow in this study is based on the method of Kim and Andersen [17], yet it deviates from this method by excluding the recording of individual relationships and a reference table so that labor-intensity can be reduced. Still, our approach uses a CAQDAS so that the references from the final causal diagram to the data sources can be maintained, as in the approach of Yearworth and White [22]. To better explain the deviations from Kim and Andersen’s method, we use the framework introduced by Turner, Kim and Andersen [21], which identifies six research design dimensions important in forming an alternative coding approach. Table 2 lists these six dimensions and the options present in our case.
The first two dimensions are related to the characteristics of the participant group. In our case, since each participant was interviewed individually, communication is asynchronous and there were many participant groups represented, such as industry, policy, local authority, community and academia. Regarding these two aspects, we choose not to form a causal map for each participant’s mental model, but to form one for each group of interviewees. In other words, participants’ individual mental models are merged into a group map early in the coding process. The causal map of a group is not strictly limited to the information provided by the participants of this group. If other groups’ participants refer to a phenomenon or mechanism that can be included in that causal map, this additional information is also taken into account. These maps, corresponding to actor groups, are then synthesized to form the final causal map by considering the links between the actor subsystems. The coding procedure addresses this choice by categorizing the themes and variables identified in the data accordingly.
In this study, we developed a causal model that represents the shared mental model of the interviewees based on the information they provided about their individual views. Interviewees talked about different interconnecting areas, giving us a much broader picture than one interviewee could provide, so that interviews were additive rather than conflicting. In a later step, we brought together the stakeholders to (dis-)confirm and extend the resulting model in three group model building sessions asking them specifically about the maybe contentious model areas. An alternative approach would be to bring stakeholders together in a group model building setting from the beginning so that they can collectively develop such a shared mental model. We acknowledge the value of this alternative approach. However, individual interviews can sometimes be the only means to elicit knowledge from time-pressured stakeholders. In addition, they enable stakeholders to convey their knowledge and ideas more freely, without focusing on model building, and they generate further information about their underlying understanding of a problem. Such individual interviews are often conducted as the first step of a modeling study. Therefore, it is worthwhile to investigate how to derive model structure based on interviews.
Regarding the two dimensions related to data collection, both the context setter and data collector were a researcher (the second author) in our case. The context setting is provided by the interview questions shown in Table 1, and it was not restraining for the participant due to the semi-structured nature of the interviews. In other words, the participants freely expressed their knowledge and thoughts about various topics, which may not be in the scope of our project, or not directly related to the group (policy, industry etc.) they belong to. In the coding process, the information that is beyond the scope is eliminated at the axial coding step after the main themes are identified so that a decision about the relevance of topics to these main themes could be made.
In our case, data collection was done by a researcher (the second author), so that a rich understanding of the context surrounding the textual data could be conveyed to the analysis stage. However, the majority of data was analyzed by only one coder (the first author) who was not engaged in the data collection. To mitigate the risk of bias introduction by the single coder and to ensure that the data is analyzed in the right context, the second author coded a fraction of the relevant text. She went through two rounds of coding, first with her own coding scheme to check for major differences in interpretation, and second, with the main coder’s scheme to establish higher validity. Results are very comparable in both cases. Differences in the first round emerged rather in the wording of code names and aggregation levels. In the second round differences remained in the length of the coded text fragments: the first coder focused on precise statements and the second coder included more context. This established additional confidence in the coding. Appendix A provides examples of such inter-coder similarities and differences. Furthermore, the references to the data sources are explicitly maintained and the assumptions of the coders are recorded by using a CAQDAS so that the interpretation of the coder could be traced back if necessary.
We used NVivo 11 CAQDAS in the coding process [30]. NVivo allows coding the data from various sources into nodes (Other CAQDAS packages such as Atlas.ti and MAXQDA provide similar functionalities.) Sources refer to the interview transcripts, whereas nodes refer to the codes, i.e., themes and variable names. The nodes can be reorganized in a hierarchical manner, shifted or renamed. These functionalities help in reaching generic variables and relationships iteratively at the axial coding step. NVivo also allows building relationships between the nodes and linking these relationships into the data sources. In that way, the causal relationships and the codes that define these relationships can be recorded in the software.
Table 3 summarizes the steps of our coding approach, which starts with open coding, i.e., identification of themes and variables, as in the method of Kim and Andersen [18]. In this step, the data is simply coded to free nodes that are not linked to each other. Following this initial step, our approach deviates from Kim and Andersen. Instead of recording a causal relationship at any instance that is mentioned in the source data and then generalizing and simplifying these relationships, we form general variables and record the relationships between these general variables rather than identifying each single causal relationship. Therefore, in the second step, we link the nodes to each other in a hierarchical manner. These links do not represent causality for each instance. They can as well be ‘contained’ relationships [14], meaning that the theme in the parent node contains the one in the child node. Such contained relationships enable the aggregation of themes and the generalization of variables. The final coding tree resulting from this step is expected to be formed iteratively.
In the third step, causal relationships are defined between aggregate variables, based on individual causal relationships between the concepts that form these variables. This step can be assisted by defining the relationships on NVivo and linking them to the data source, so that the references to the data are maintained even if a data source reference table is not formed, and in a less time consuming way than forming the reference table. Once the causal relationships are identified, the results are visualized in causal diagrams in the last step.
3. Results
This section demonstrates the application of the coding approach described above on a theme that emerged from a participant group out of the data collected in 16 interviews to understand the mechanisms behind fragmentation in the UK’s housing sector.
Step 1: Identifying concepts and discovering themes in the data
This step corresponds to open coding where the content is processed to understand the main elements and to delineate the boundaries of the system of interest. Understanding the context is necessary in this step in order to code the concepts that are not stated explicitly. The data often include open statements that clearly hint to a concept or theme, as exemplified by the following statement that refers to “Trust of occupants in the building industry”.
our clients on the ground, they will say to us ‘look, can I not just work with my usual boiler engineer?’ because they know them, they trust them, they’ve been servicing their boiler every year for the past 20 years.
However, there are statements that do not disclose a concept with clear references. For instance, the statement below also refers to trust-building by the industry’s involvement in a community with a distinction between the small companies referred to as ‘man and a van’ and big companies referred as ‘cowboys’. The term cowboy implies a lack of trust in big companies, and it is necessary to know the context to derive this interpretation.
the cowboys aren’t necessarily interested in seeing what they can do to help. […] We get, occasionally, people from boiler installers calling us up saying ‘Do you know this person? This person can’t afford it,’ or ‘This person’s not living in great conditions, is there anything you can do to help?’ And we like the fact that they’re taking initiative to call the council, it’s not their job; big companies don’t tend to do that, it’s the little one man and a van people that are more likely.
Additionally, our data includes information of external factors, such as various policy goals and the view of the participant about achieving them, and policy interventions that are implemented or can be potentially implemented. This information does not directly feed into model conceptualization, yet it serves for the purpose of understanding the policy context and forming a framework for the modeling study, for instance for the policy testing stage. Therefore, it is not excluded but coded accordingly.
It is undeniable that, as the themes are identified in this step, the coder also gains an understanding of the causal relationships expressed by the participants. This understanding is highly important for the identification of aggregate causal relationships in Step 3, although our approach does not include a formal recording of these relationships in Step 1. NVivo enables the coders to log their ideas and assumptions in ‘Memos’ that can be linked to the nodes, and in ‘Annotations’ that can be attached right to a piece of source data. We found these two features useful to record the coders’ understanding of causal relationships and to assist in Step 3.
Step 2: Categorizing and aggregating themes into variables
In this step that corresponds to axial coding, the concepts and themes are categorized in a way that a hierarchical coding tree is formed. This categorization is based on two dimensions. The first dimension represents a decomposition based on the interviewee groups and their domains of action. In other words, the primary parent nodes of the coding tree are defined as the interviewee groups taken into account in the system of interest, namely the ‘policy’, ‘industry’, ‘user’ and ‘local authorities’. It is important to note that these groups are not exactly the same as participant groups. Academics, NGO’s and social housing organizations are not explicitly taken into account as distinct groups because they are either included within the ‘user’ group or consulted only for information.
Figure 1 demonstrates this hierarchical decomposition on the NVivo user interface, with the four parent nodes corresponding to policy, industry, user and local authority, and their immediate child nodes. Under the policy node, these child nodes are firstly for the policy goals and policies, then for the mechanisms that are related to ‘policy design and implementation’. The industry node is branched into five, representing three actor subgroups such as constructors, designers and manufacturers, and two phenomena that emerge in the interface between these actors. The user node includes social housing organizations as an immediate child node representing an actor group, and the main themes such as demand and affordability, related to the users of the housing sites. Lastly, the node for local authorities involves themes emerged from the data related to the workforce experience and the interface role of local authorities between the industry, policy and users. An additional parent node is defined to collect information about the technical aspects of ‘building performance’.
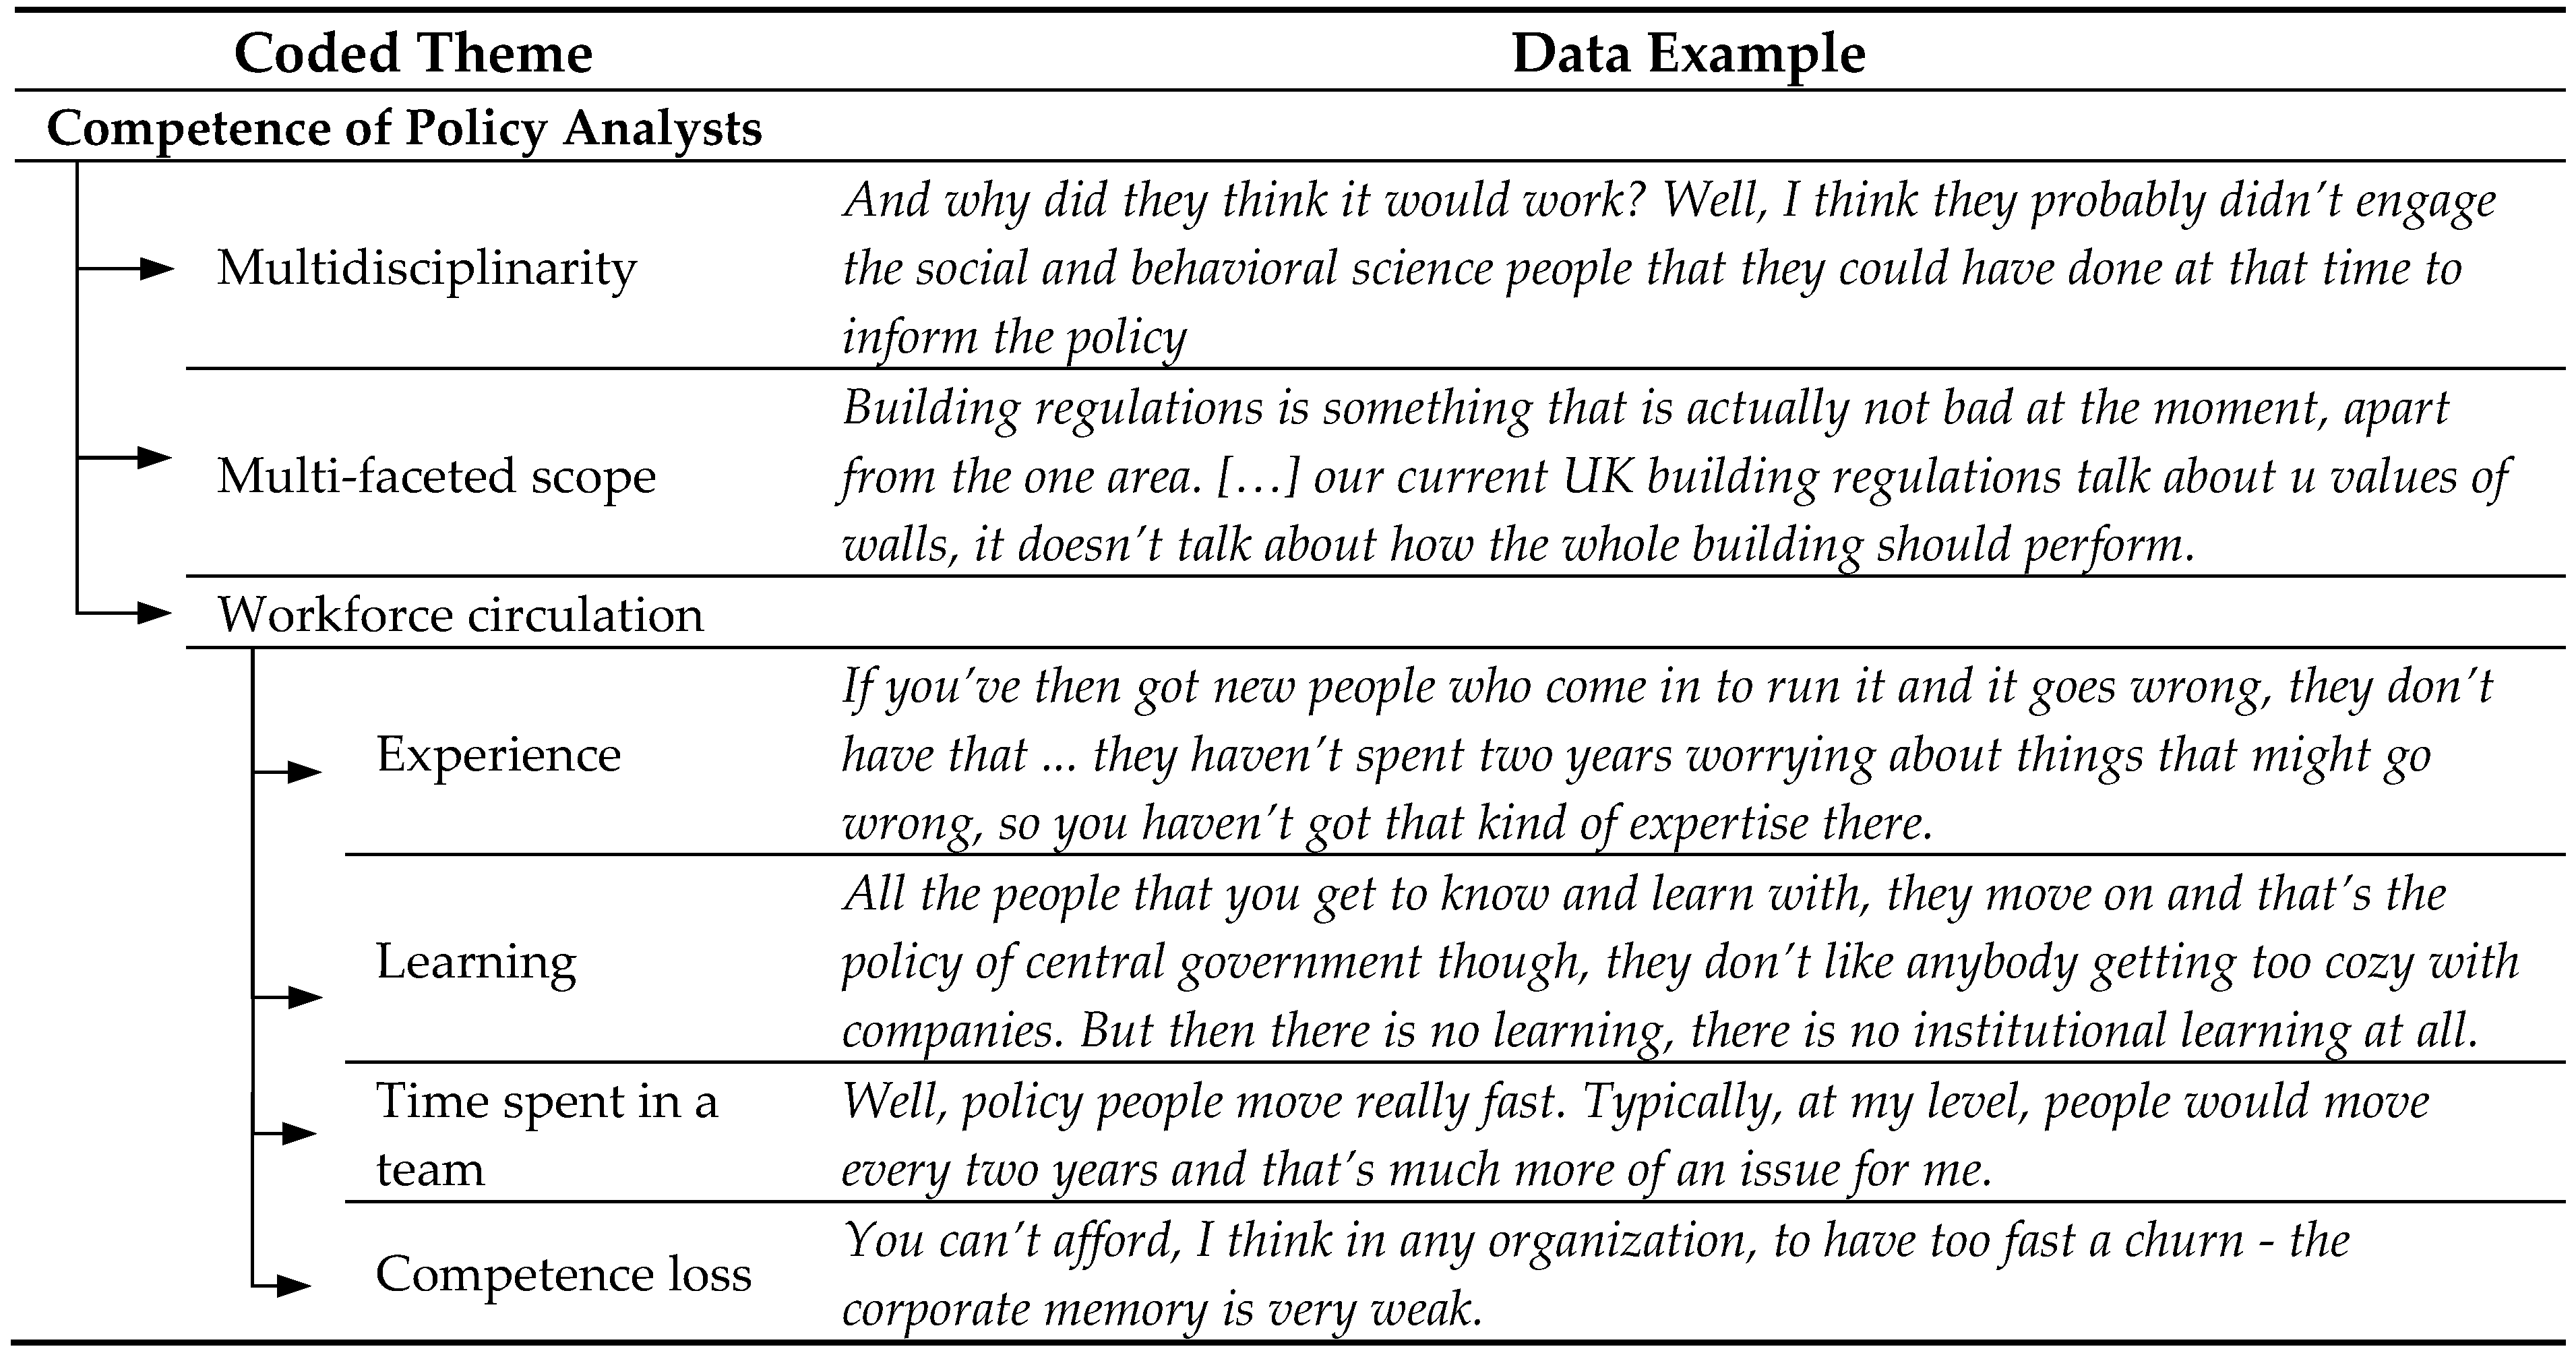
The second dimension of categorization was based on the themes, corresponding to the axial coding stage. The coding hierarchy is formed according to the aggregation of themes observed in the data into a more abstract theme. As mentioned before, the links on the coding tree are not considered causal, but contained relationships. For instance, the interviewees mentioned several factors regarding the ability of policy teams to design more successful policies. These factors are the multidisciplinarity of a team to be able to work with a multi-faceted scope, and a rapid workforce circulation which prevents people from staying at a position long enough to be able to learn, gain experience and improve a policy. These factors are aggregated into the theme Competence of policy analysts, which contains multi-disciplinarity, multi-faceted scope and workforce circulation as child nodes. Table 4 below shows the child nodes of this theme, and an example text piece that led to each code.
Step 3: Identifying causal relationships
Interviewees express causal mechanisms and their mental models in a more detailed way than what can be represented in a simple and plausible model. However, as mentioned before, we aim to define causal relationships between aggregate variables that will be used in the model in order to increase the time-efficiency of the coding process. Still, individual causal relationships found in the data form the basis for the aggregate relationships we define. On the coding tree, causal relationships are found in either vertical or horizontal (i.e., sibling relationships) links.
Continuing with the above example of Competence of policy analysts, the storyline formed by the interviewees’ statements can be summarized as follows: Competence is increased by two main factors, namely by engaging analysts from multiple disciplines and by growing the experience level of the team. The experience level depends on experiential learning, which takes place as people learn from their mistakes and if the time spent at a position is long enough to observe the outcome of their actions. In other words, learning is positively related to the time spent in a team, and the gap between the policy targets and outcomes, which refer to the mistakes that people learn from.
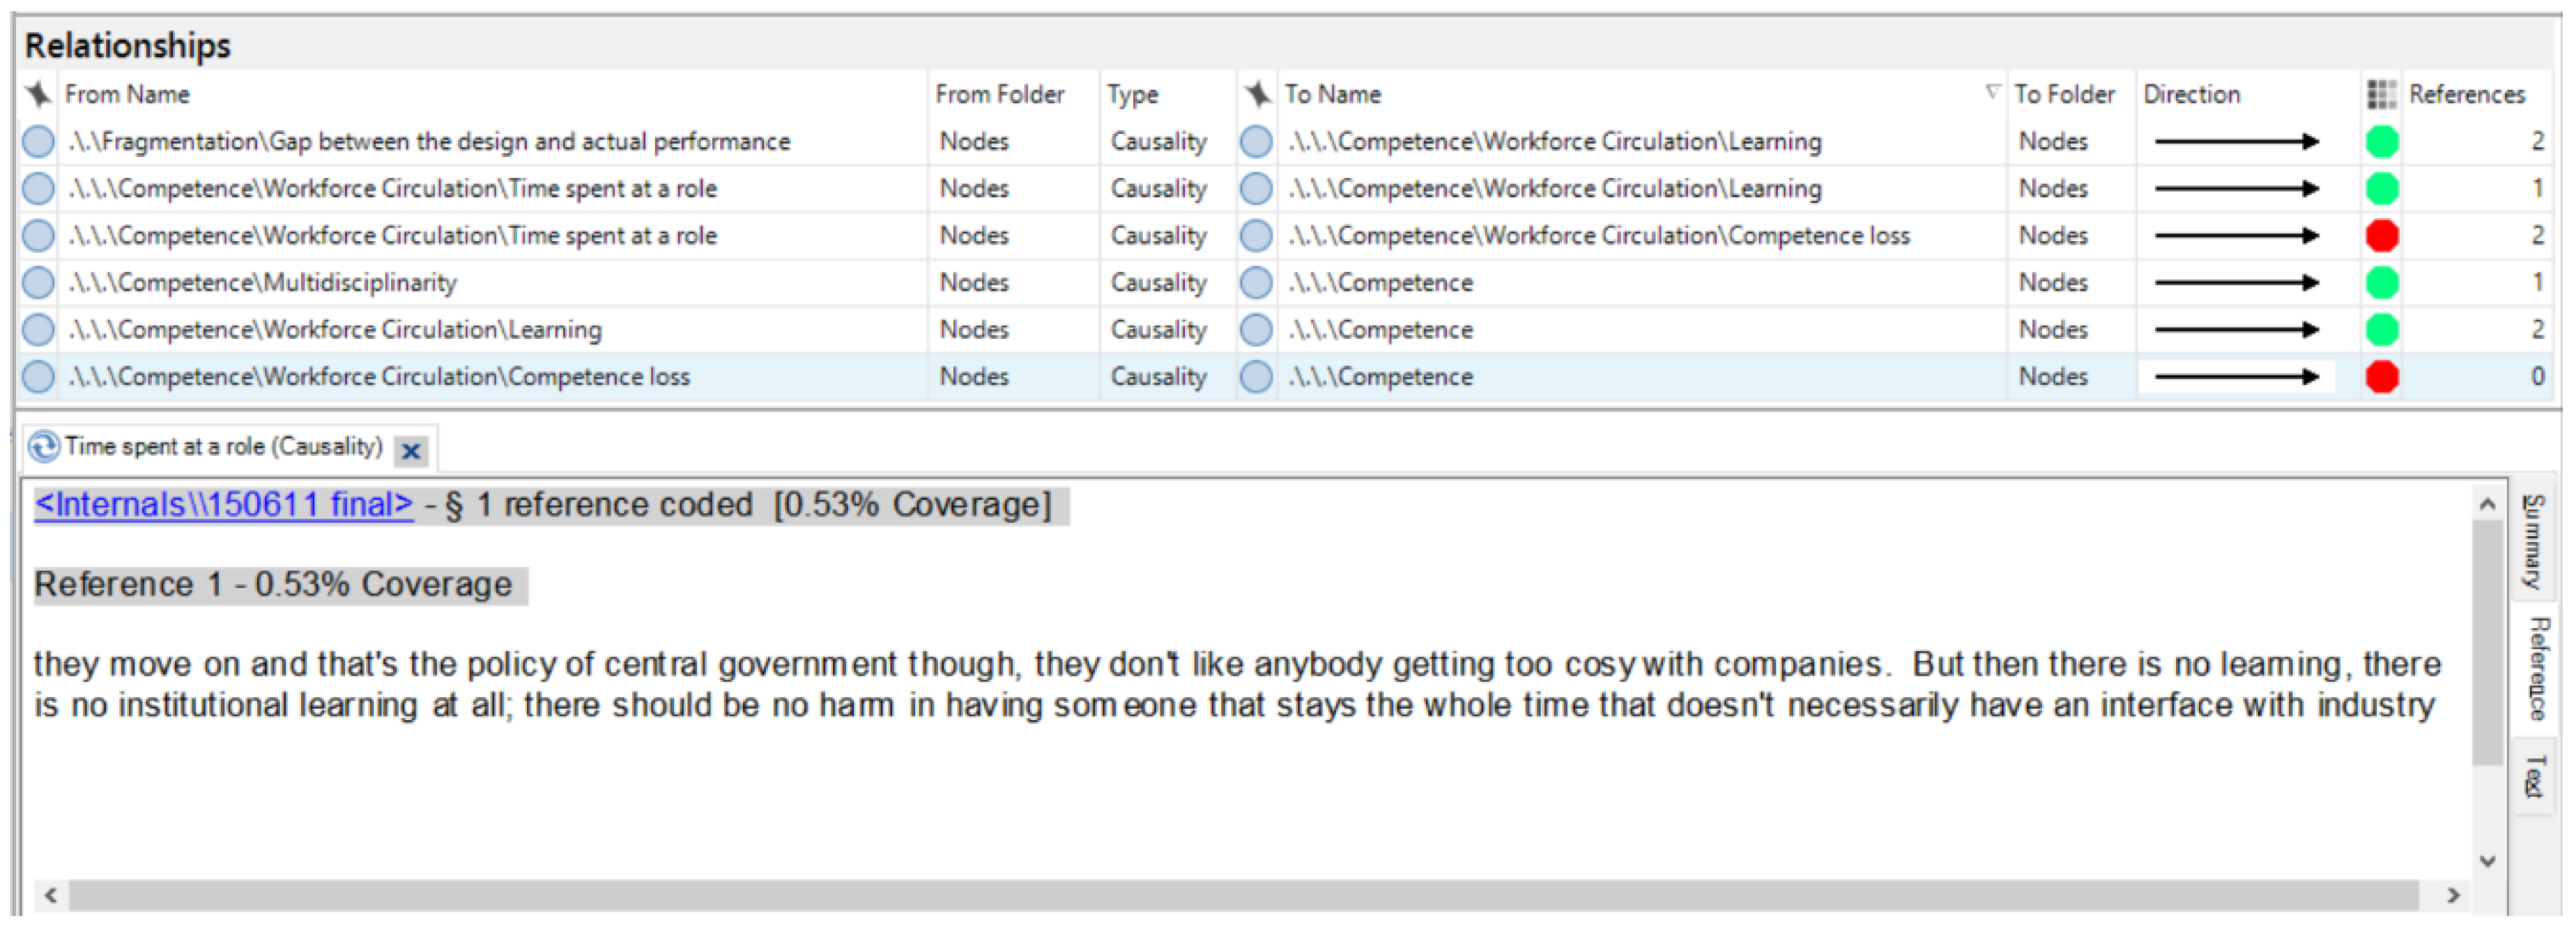
As mentioned before, NVivo allows recording relationships between the nodes in a coding tree, and linking them to the data sources. In this way, the references to the data sources are maintained in a less time-consuming way, without forming a coding chart. Figure 2 shows the NVivo screen, where each relationship regarding Competence of policy analysts is recorded. The direction of causality is represented by a color, and we chose to use green for positive causalities, red for negative causalities. At the bottom of the screen, the data from which the relationship between the time spent in a team and learning is derived can be seen. To establish such causal relationships, we looked out for indicators such as “because”, “if … then”, but we certainly also used our general understanding that someone expresses a causal relationship.
Step 4: Transforming the coding dictionary into causal diagrams
The last step includes visualizing the coding dictionary, i.e., the list of relationships, in a causal loop diagram. It is important to note that NVivo does not support the visualization of relationships yet, therefore the diagrams can be illustrated by using other tools, such as a system dynamics modeling software.
Figure 3 illustrates the causal relations involved in our example related to Competence of policy analysts. The variables and links in black are the ones shown in our running example in Figure 2, whereas the gray ones represent the variables and relationships derived from other branches of the coding tree. The loops that emerged from these relationships are the reinforcing ‘Experiential learning takes place through mistakes’ and balancing ‘Success limits learning’ loops. The competence of policy designers increases the performance level set in building regulations, i.e., Designed Policy Performance. As a result of this, the gap between the designed policy performance and actual policy performance increases, too. The actual policy performance indicates the eventual outcome that is used by policy designers to measure the success of a policy, and the gap between the actual and the designed policy performance represents their mistakes because the design did not match reality. As mentioned before, learning occurs as these mistakes are observed. Since an increase in the actual policy performance would indicate fewer mistakes, success of a policy leads to a narrower gap between the designed and actual policy performance, limiting further learning from mistakes and forming the ‘Success limits learning’ loop.
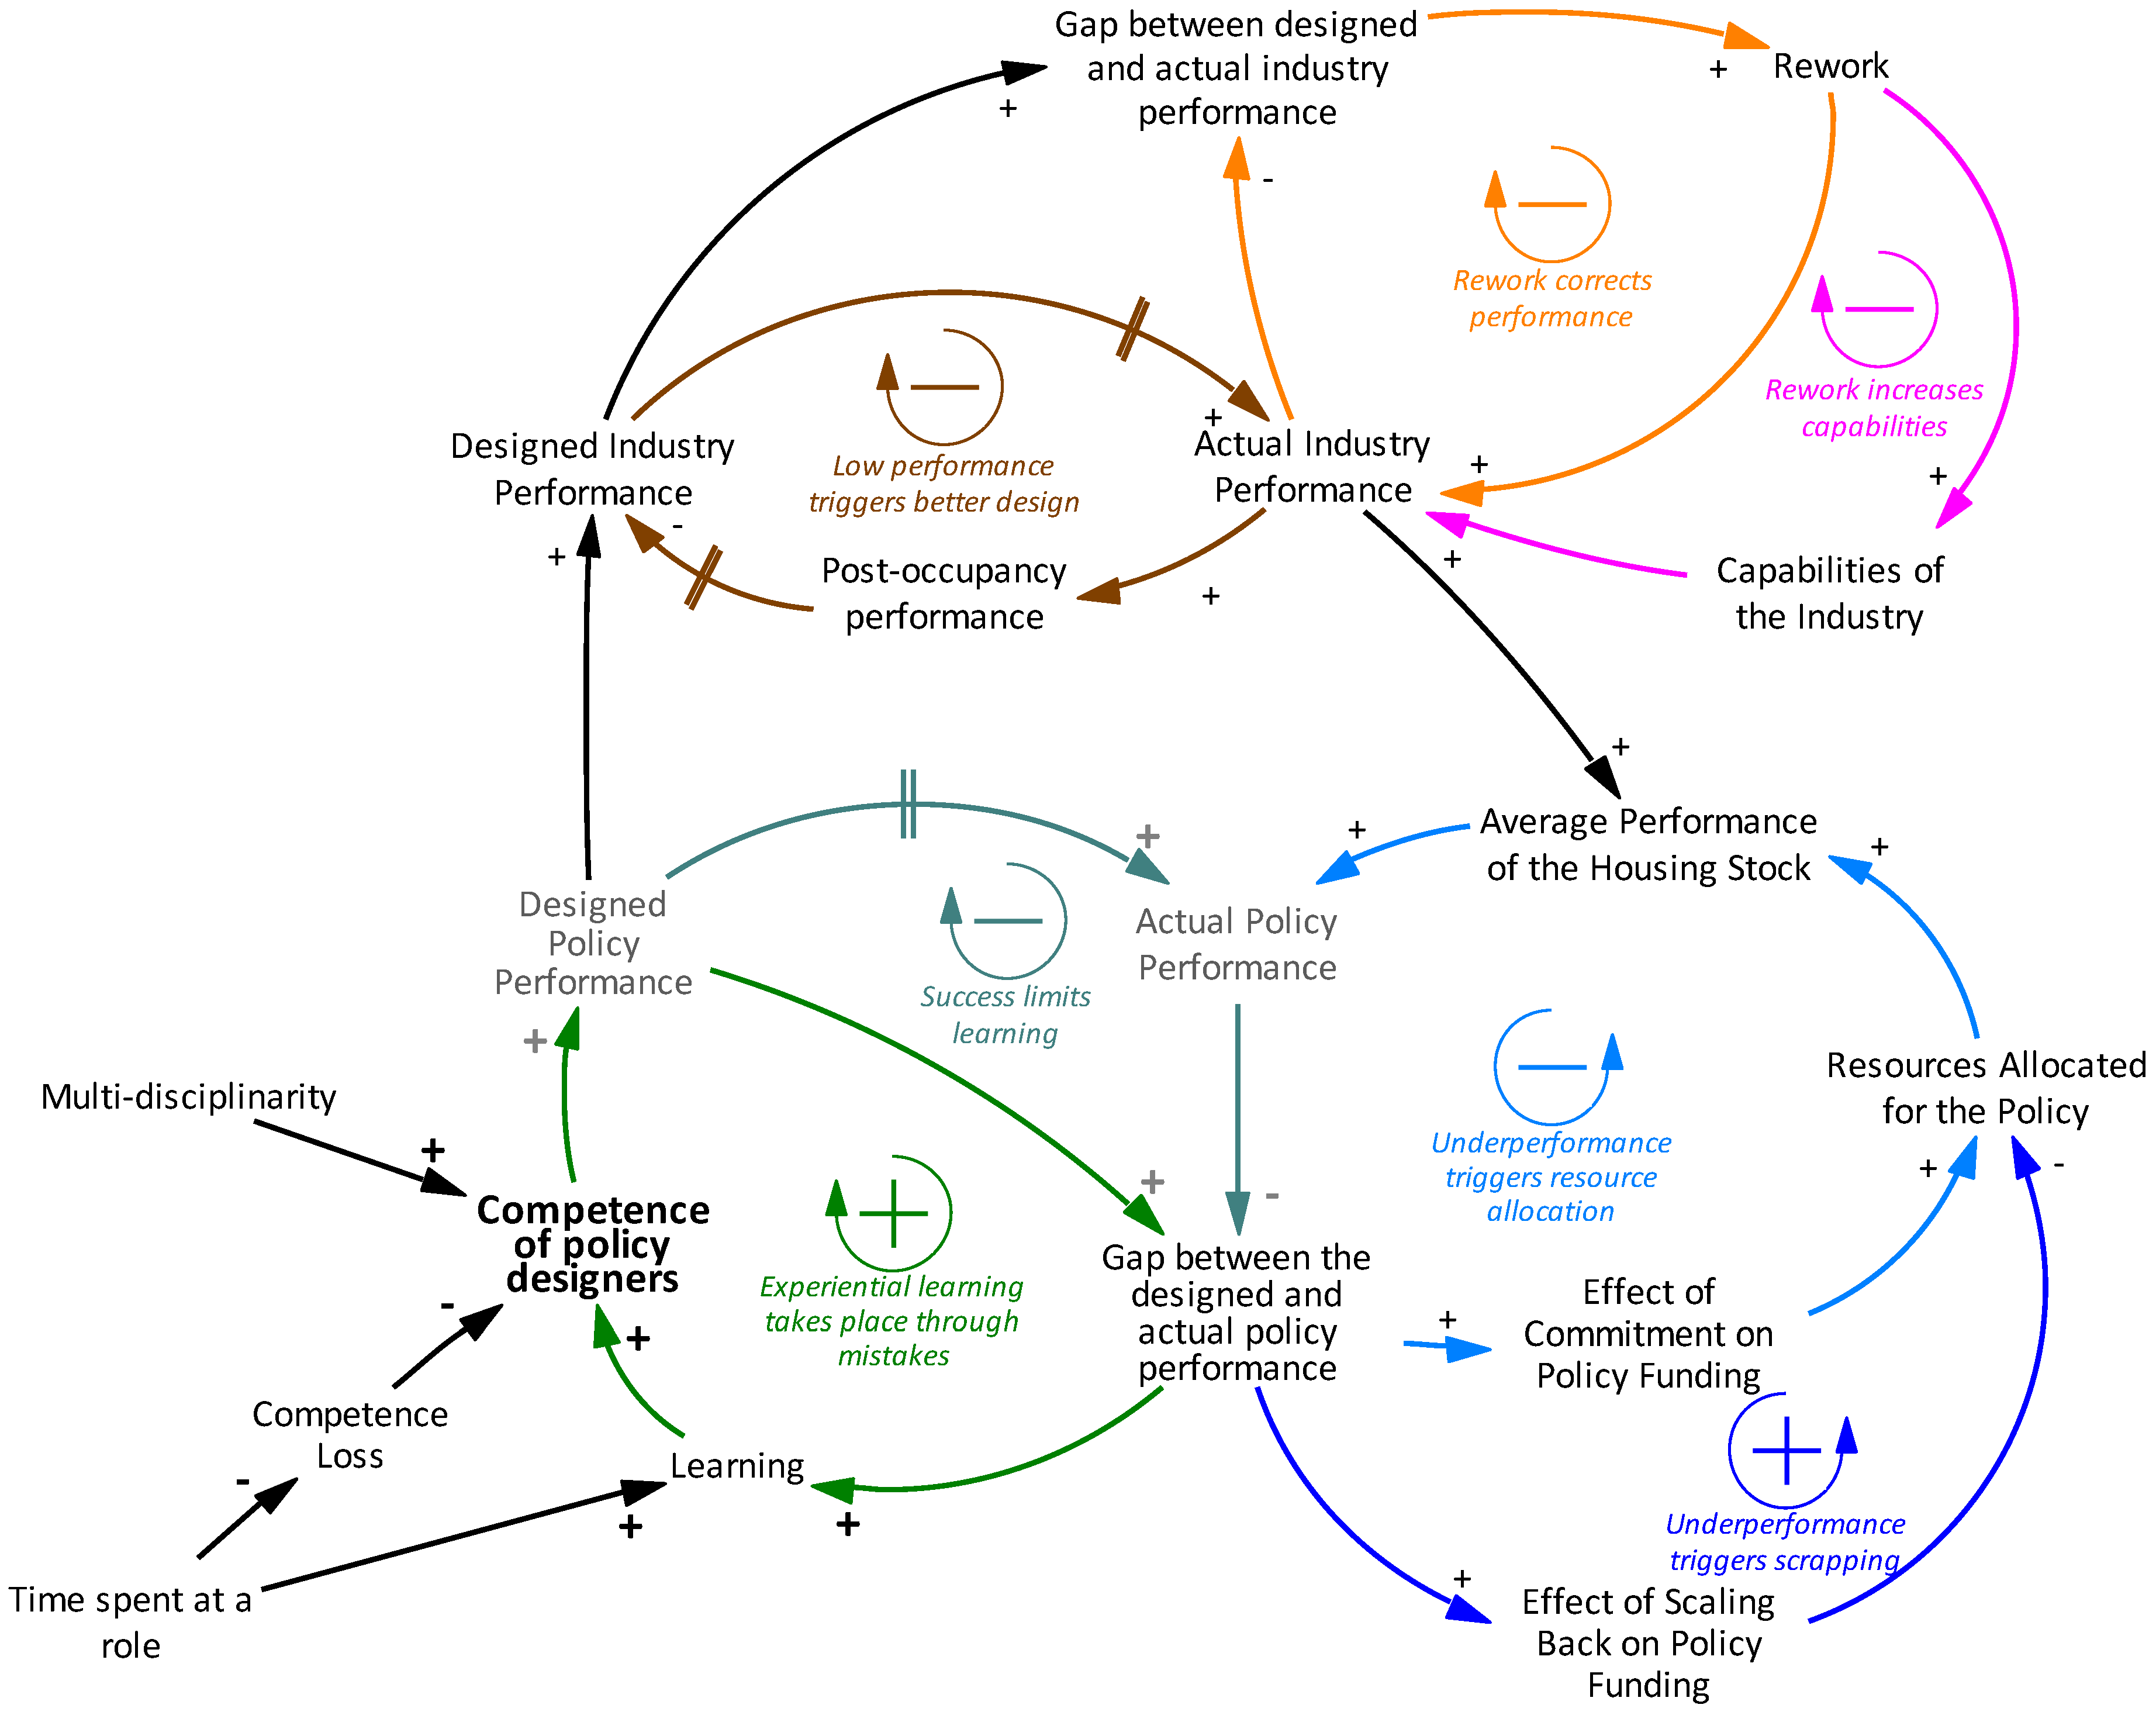
The complete causal diagram obtained as a result of the coding approach can be seen in Figure 4. It is a highly abstract diagram that summarizes the information from 16 interviews into seven feedback loop mechanisms. Related to policy making, in addition to the ones described above, two other mechanisms are identified representing the allocation of resources to housing and energy policies depending on the outcome observed (the gap between the designed and actual policy performance). The first of these two is a balancing feedback loop named ‘Underperformance triggers resource allocation’. This loop is based on the statement that policy makers can allocate more resources to a policy even though it does not meet the expectations (Designed Policy Performance), because they are committed to this policy. The second mechanism is a reinforcing loop named ‘Underperformance triggers scrapping’, which refers to a reduction in resources allocated to a policy, as it does not produce the expected performance.
Related to the industry’s role, designers’ main working mechanism is captured in the loop ‘Low performance triggers better design’, which shows that the design performance is implemented by the builders and results in actual, and then post-occupancy performance, i.e., the performance perceived by residents. Designers change the building designs according to the feedback they receive from residents, for instance by increasing the performance if residents experience low performance. The other two loops related to the industry represent the first-order improvement in the actual industry performance through rework (‘Rework corrects performance’), and the second order improvement through learning and increased capabilities (‘Rework increases capabilities’) as the gap between the designed and actual performance widens. These two loops are balancing, since an increase in Actual Policy Performance decreases the Gap between the designed policy performance and actual policy performance.
4. Discussion
Based on the strengths of existing methods, this paper presented an alternative approach for conceptualizing system dynamics models by using textual data. This alternative approach followed a coding process based on the grounded theory approach to retrieve causal relationships from the data explicitly, and utilized a qualitative analysis software to make the links between the final causal map and the data sources more transparent. This section discusses the implications of this approach and future research possibilities to improve it in two aspects, namely the use of quantitative tools to support coding and the validity of results.
The use of software and data analysis techniques
This study employed the ‘Relationship’ functionality of NVivo software to define causal relationships between the codes and to link them to the data. We used a different software (Vensim) to transform the relationship list into a causal loop diagram, since NVivo does not yet support such a visualization. However, such a visualization feature in the qualitative analysis software packages is deemed valuable because it allows the coder/modeler not only to automatically depict the final diagram but also to monitor the progress of mapping and formation of feedback loops as coding proceeds.
The amount of textual data that can be used for system dynamics modeling is surely not limited to interview transcripts. Scholarly and popular articles, news, organizational reports and meeting minutes constitute a rich textual data source depending on the problem of interest. Given this abundance of data, a thorough but quick analysis of it becomes vitally important to obtain useful information. The matrix query run by Yearworth and White [22] to identify causal relationships is a preliminary step in incorporating such analysis techniques to model conceptualization. Automated techniques are not expected to identify causal relationships completely, yet they can be employed further to assist the coder and modeler to make faster use of large amounts of textual data. It must be noted that several analysis tools are already embedded in NVivo, such as cluster analysis. Yet, they work on already coded data, i.e., on ‘nodes’, not for understanding the content and components of the raw data to support the identification of ‘nodes’.
In this regard, data science techniques can facilitate understanding the content of the raw data and to obtaining useful information from it. As mentioned by Pruyt, et al. [31], big data and data science have potential to assist system dynamics in providing information and inferring plausible theoretical constructs and model structures. Particularly text mining tools such as topic modeling [32,33] can provide benefits by detecting the main themes in the data as well as their intensity and relations to each other. These tools can as well be applied at different stages of coding, i.e. initially for the raw data or for coder-defined nodes. Investigating the applicability of these automated techniques in coding for system dynamics model conceptualization is a potential point of departure for future research.
Validity of the results
This study accelerated the coding process and combined Kim and Andersen’s [17] coding steps of (i) open coding to identify the themes in the data and (iv) generalizing and simplifying (axial coding). It thus developed causal relationships at an already aggregated level in line with Turner, Kim and Andersen [21]. However, it is not only a question of group characteristics, i.e., of synchronous vs. asynchronous communication with one vs. many groups. There is a difference with regards to when abstraction mainly occurs: in the identification of variables already or after the identification of a detailed database of variables and causal relationships. In traditional system dynamics modeling, it is rather more common for abstraction to occur early because a model often emerges out of the modeler’s accumulated and abstracted understanding. However, a comparison of the resulting causal models—derived through a detailed and time-consuming process of coding at the detailed level vs. at already aggregated understanding—has not yet been attempted. Therefore, future studies can investigate the implications of using these two different approaches and the effects that accelerating the process had on the results.
In this study, we analyzed a set of interview data collected from various stakeholders. These interviews provided additive views rather than conflicting ones. However, it is possible to have cases where the interviewees state conflicting opinions about the presence or polarity of causal relationships. In such cases, we acknowledge that both views could be equally plausible, and it is of paramount importance to explicitly link these conflicting views to the data so that a third person can easily recognize the uncertainties in the shape or strength of model structure. Future research may investigate how such uncertainties can result in alternative model structures, and the implications of these alternative structures.
Causal relationships in the models of socioeconomic systems need to include the causal models of people acting in those systems. Thus, they are usually based on causal attributions in mental models of experts and stakeholders. To deal with the subjectivity of these causal attributions, modelers desire a systematic approach with explicit links to the data source, i.e. the expressed mental models of the experts and stakeholders, so that confidence can be built and the resulting model is deemed valid. The use of CAQDAS is promising to achieve this desire, since it links the causal model structure back to the data sources. The process of documenting causal relations in the software serves as a double check for the coder, and it allows other people to relate model structure to original data and thus review the work of the modeler. This helps in improving the modeling process and building confidence in the models. We want to encourage further research of the use of CAQDAS on the accuracy of representations and on quantitative measures of inter-coder reliability, but also on the understandability and replicability of resulting models.
Even though an explicit documentation helps in building confidence in the models, we acknowledge that subjectivity is still apparent because the modelers interpret and abstract at some point, no matter whether they follow Kim and Andersen’s [17], Turner et al.’s [18], or some other approach. Each approach is still based on a step from data interpretation to modeling and from the model to interpreting the model’s results. To be useful, we need to know why we want to model and how we are going to use a resulting model. Hence, the choice and evaluation of a coding approach is dependent on the purpose of the model, and future research can enhance understanding of this dependency.
Acknowledgments
This study is funded by the five-year CBES Platform Grant on The Unintended Consequences of Decarbonising the Built Environment provided by the Engineering and Physical Sciences Research Council (EPSRC) of the UK. In addition, we acknowledge Lai Fong Chiu’s support in discussing the interview design and we would like to thank the two reviewers for their useful comments.
Author Contributions
N.Z. designed and conducted the interviews; S.E. and N.Z. analyzed the data; S.E. and N.Z. discussed the analysis; S.E. and N.Z. wrote the paper.
Conflicts of Interest
The authors declare no conflict of interest.
Abbreviations
The following abbreviations are used in this manuscript:
| MDPI | Multidisciplinary Digital Publishing Institute |
| SD | System dynamics |
| CAQDAS | Computer aided qualitative data analysis software |
Appendix A: Exemplary comparison of coding results obtained by the two coders

References
- Forrester, J.W. Policies, decisions and information sources for modeling. Eur. J. Oper. Res. 1992, 59, 42–63. [Google Scholar] [CrossRef]
- Luna-Reyes, L.F.; Andersen, D.L. Collecting and analyzing qualitative data for system dynamics: Methods and models. Syst. Dyn. Rev. 2003, 19, 271–296. [Google Scholar] [CrossRef]
- Hall, R.I.; Aitchison, P.W.; Kocay, W.L. Causal policy maps of managers: Formal methods for elicitation and analysis. Syst. Dyn. Rev. 1994, 10, 337–360. [Google Scholar] [CrossRef]
- Lattimer, V.; Brailsford, S.; Turnbull, J.; Tarnaras, P.; Smith, H.; George, S.; Gerard, K.; Maslin-Prothero, S. Reviewing emergency care systems i: Insights from system dynamics modelling. Emerg. Med. J. 2004, 21, 685–691. [Google Scholar] [CrossRef] [PubMed]
- Brailsford, S.C.; Lattimer, V.; Tarnaras, P.; Turnbull, J. Emergency and on-demand health care: Modelling a large complex system. J. Oper. Res. Soc. 2004, 55, 34–42. [Google Scholar] [CrossRef]
- Lane, D.C.; Husemann, E. System dynamics mapping of acute patient flows. J. Oper. Res. Soc. 2008, 59, 213–224. [Google Scholar] [CrossRef]
- Andersen, D.L.; Luna-Reyes, L.F.; Diker, V.G.; Black, L.; Rich, E.; Andersen, D.F. The disconfirmatory interview as a strategy for the assessment of system dynamics models. Syst. Dyn. Rev. 2012, 28, 255–275. [Google Scholar] [CrossRef]
- Máñez Costa, M.A. Socioeconomics, policy, or climate change: What is driving vulnerability in southern portugal? Ecol. Soc. 2011, 16, 28. [Google Scholar]
- Macmillan, A.; Connor, J.; Witten, K.; Kearns, R.; Rees, D.; Woodward, A. The societal costs and benefits of commuter bicycling: Simulating the effects of specific policies using system dynamics modeling. Environ. Health Perspect. 2014, 122, 335–344. [Google Scholar] [CrossRef] [PubMed]
- Cagliano, A.C.; De Marco, A.; Rafele, C.; Bragagnini, A.; Gobbato, L. Analysing the diffusion of a mobile service supporting the e-grocery supply chain. Bus. Process Manag. J. 2015, 21, 928–963. [Google Scholar] [CrossRef]
- Kopainsky, B.; Luna-Reyes, L.F. Closing the loop: Promoting synergies with other theory building approaches to improve system dynamics practice. Syst. Res. Behav. Sci. 2008, 25, 471–486. [Google Scholar] [CrossRef]
- Strauss, A.; Corbin, J. Basics of Qualitative Research: Techniques and Procedures for Developing Grounded Theory, 2nd ed.; Sage Publications Thousan Oaks: London, UK; New Delhi, India, 1998. [Google Scholar]
- Yearworth, M. Inductive modelling of an entrepreneurial system. In Proceedings of the 28th International Conference of the System Dynamics Society, Seoul, Korea, 25–29 July 2010; System Dynamics Society: Seoul, Korea, 2010. [Google Scholar]
- Rabinovich, M.; Kacen, L. Advanced relationships between categories analysis as a qualitative research tool. J. Clin. Psychol. 2010, 66, 698–708. [Google Scholar] [CrossRef] [PubMed]
- Repenning, N.P.; Sterman, J.D. Capability traps and self-confirming attribution errors in the dynamics of process improvement. Adm. Sci. Q. 2002, 47, 265–295. [Google Scholar] [CrossRef]
- Morrison, J.B. Co-Evolution of Process and Content in Organizational Change: Explaining the Dynamics of Start and Fizzle. Ph.D. Thesis, Massachusetts Institute of Technology, Cambridge, MA, USA, 2003. [Google Scholar]
- Kim, H.; Andersen, D.F. Building confidence in causal maps generated from purposive text data: Mapping transcripts of the federal reserve. Syst. Dyn. Rev. 2012, 28, 311–328. [Google Scholar] [CrossRef]
- Turner, B.; Tedeschi, L.; Gates, R.; Nichols, T.; Wuellner, M.; Dunn, B. Investigation into land use changes and consequences in the northern great plains using systems thinking and dynamics. In Proceedings of the 31st International Conference of the System Dynamics Society, Cambridge, MA, USA, 21–25 July 2013; Eberlein, R., Martinez-Moyano, I.J., Eds.; System Dynamics Society: Cambridge, MA, USA, 2013. [Google Scholar]
- Nguyen, N.H.; Beeton, R.J.S.; Halog, A. A systems thinking approach for enhancing adaptive capacity in small- and medium-sized enterprises: Causal mapping of factors influencing environmental adaptation in vietnam’s textile and garment industry. Environ. Syst. Decis. 2015, 35, 490–503. [Google Scholar] [CrossRef]
- Hoffer, E.R. Green building policy and real estate development: A causal mapping study derived from qualitative data. In Proceedings of the 33rd International Conference of the System Dynamics Society, Cambridge, MA, USA, 19–23 July 2015.
- Turner, B.L.; Kim, H.; Andersen, D.F. Improving coding procedures for purposive text data: Researchable questions for qualitative system dynamics modeling. Syst. Dyn. Rev. 2013, 29, 253–263. [Google Scholar] [CrossRef]
- Yearworth, M.; White, L. The uses of qualitative data in multimethodology: Developing causal loop diagrams during the coding process. Eur. J. Oper. Res. 2013, 231, 151–161. [Google Scholar] [CrossRef]
- DECC. Energy Efficiency Statistical Summary 2015; Department of Energy and Climate Change: London, UK, 2015. [Google Scholar]
- Davies, M.; Oreszczyn, T. The unintended consequences of decarbonising the built environment: A UK case study. Energy Build. 2012, 46, 80–85. [Google Scholar] [CrossRef]
- May, N.; Rye, C. Responsible Retrofit of Traditional Buildings; STBA (Sustainable Traditional Buildings Alliance): London, UK, 2012. [Google Scholar]
- Shrubsole, C.; Macmillan, A.; Davies, M.; May, N. 100 unintended consequences of policies to improve the energy efficiency of the uk housing stock. Indoor Built Environ. 2014, 23, 340–352. [Google Scholar] [CrossRef]
- Macmillan, A.; Davies, M.; Bobrova, Y. Integrated Decision-Making about Housing, Energy and Wellbeing (Hew): Report on the Mapping Work for Stakeholders; The Bartlett, UCL Faculty of the Built Environment, Institute for Environmental Design and Engineering: London, UK, 2014. [Google Scholar]
- Macmillan, A.; Davies, M.; Shrubsole, C.; Luxford, N.; May, N.; Chiu, L.F.; Trutnevyte, E.; Bobrova, Y.; Chalabi, Z. Integrated decision-making about housing, energy and wellbeing: A qualitative system dynamics model. Environ. Health 2016, 15, 23–34. [Google Scholar] [CrossRef] [PubMed]
- Zimmermann, N.; Black, L.; Shrubsole, C.; Davies, M. Meaning-making in the process of participatory system dynamics research. In Proceedings of the 33rd International Conference of the System Dynamics Society, Cambridge, MA, USA, 19–23 July 2015.
- QSR International Nvivo 11. 2015.
- Pruyt, E.; Cunningham, S.; Kwakkel, J.; De Bruijn, J. From Data-Poor to Data-Rich: System Dynamics in the Era of Big Data, Proceedings of the 32nd International Conference of the System Dynamics Society, Delft, The Netherlands, 20–24 July 2014.
- Blei, D.M.; Lafferty, J.D. Topic models. In Text mining: Classification, Clustering, and Applications; CRC Press: Boca Raton, FL, USA, 2009. [Google Scholar]
- Gupta, V.; Lehal, G.S. A survey of text mining techniques and applications. J. Emerg. Technol. Web Intell. 2009, 1, 60–76. [Google Scholar] [CrossRef]
Figure 1.
NVivo screen that shows the hierarchical categorization of nodes.
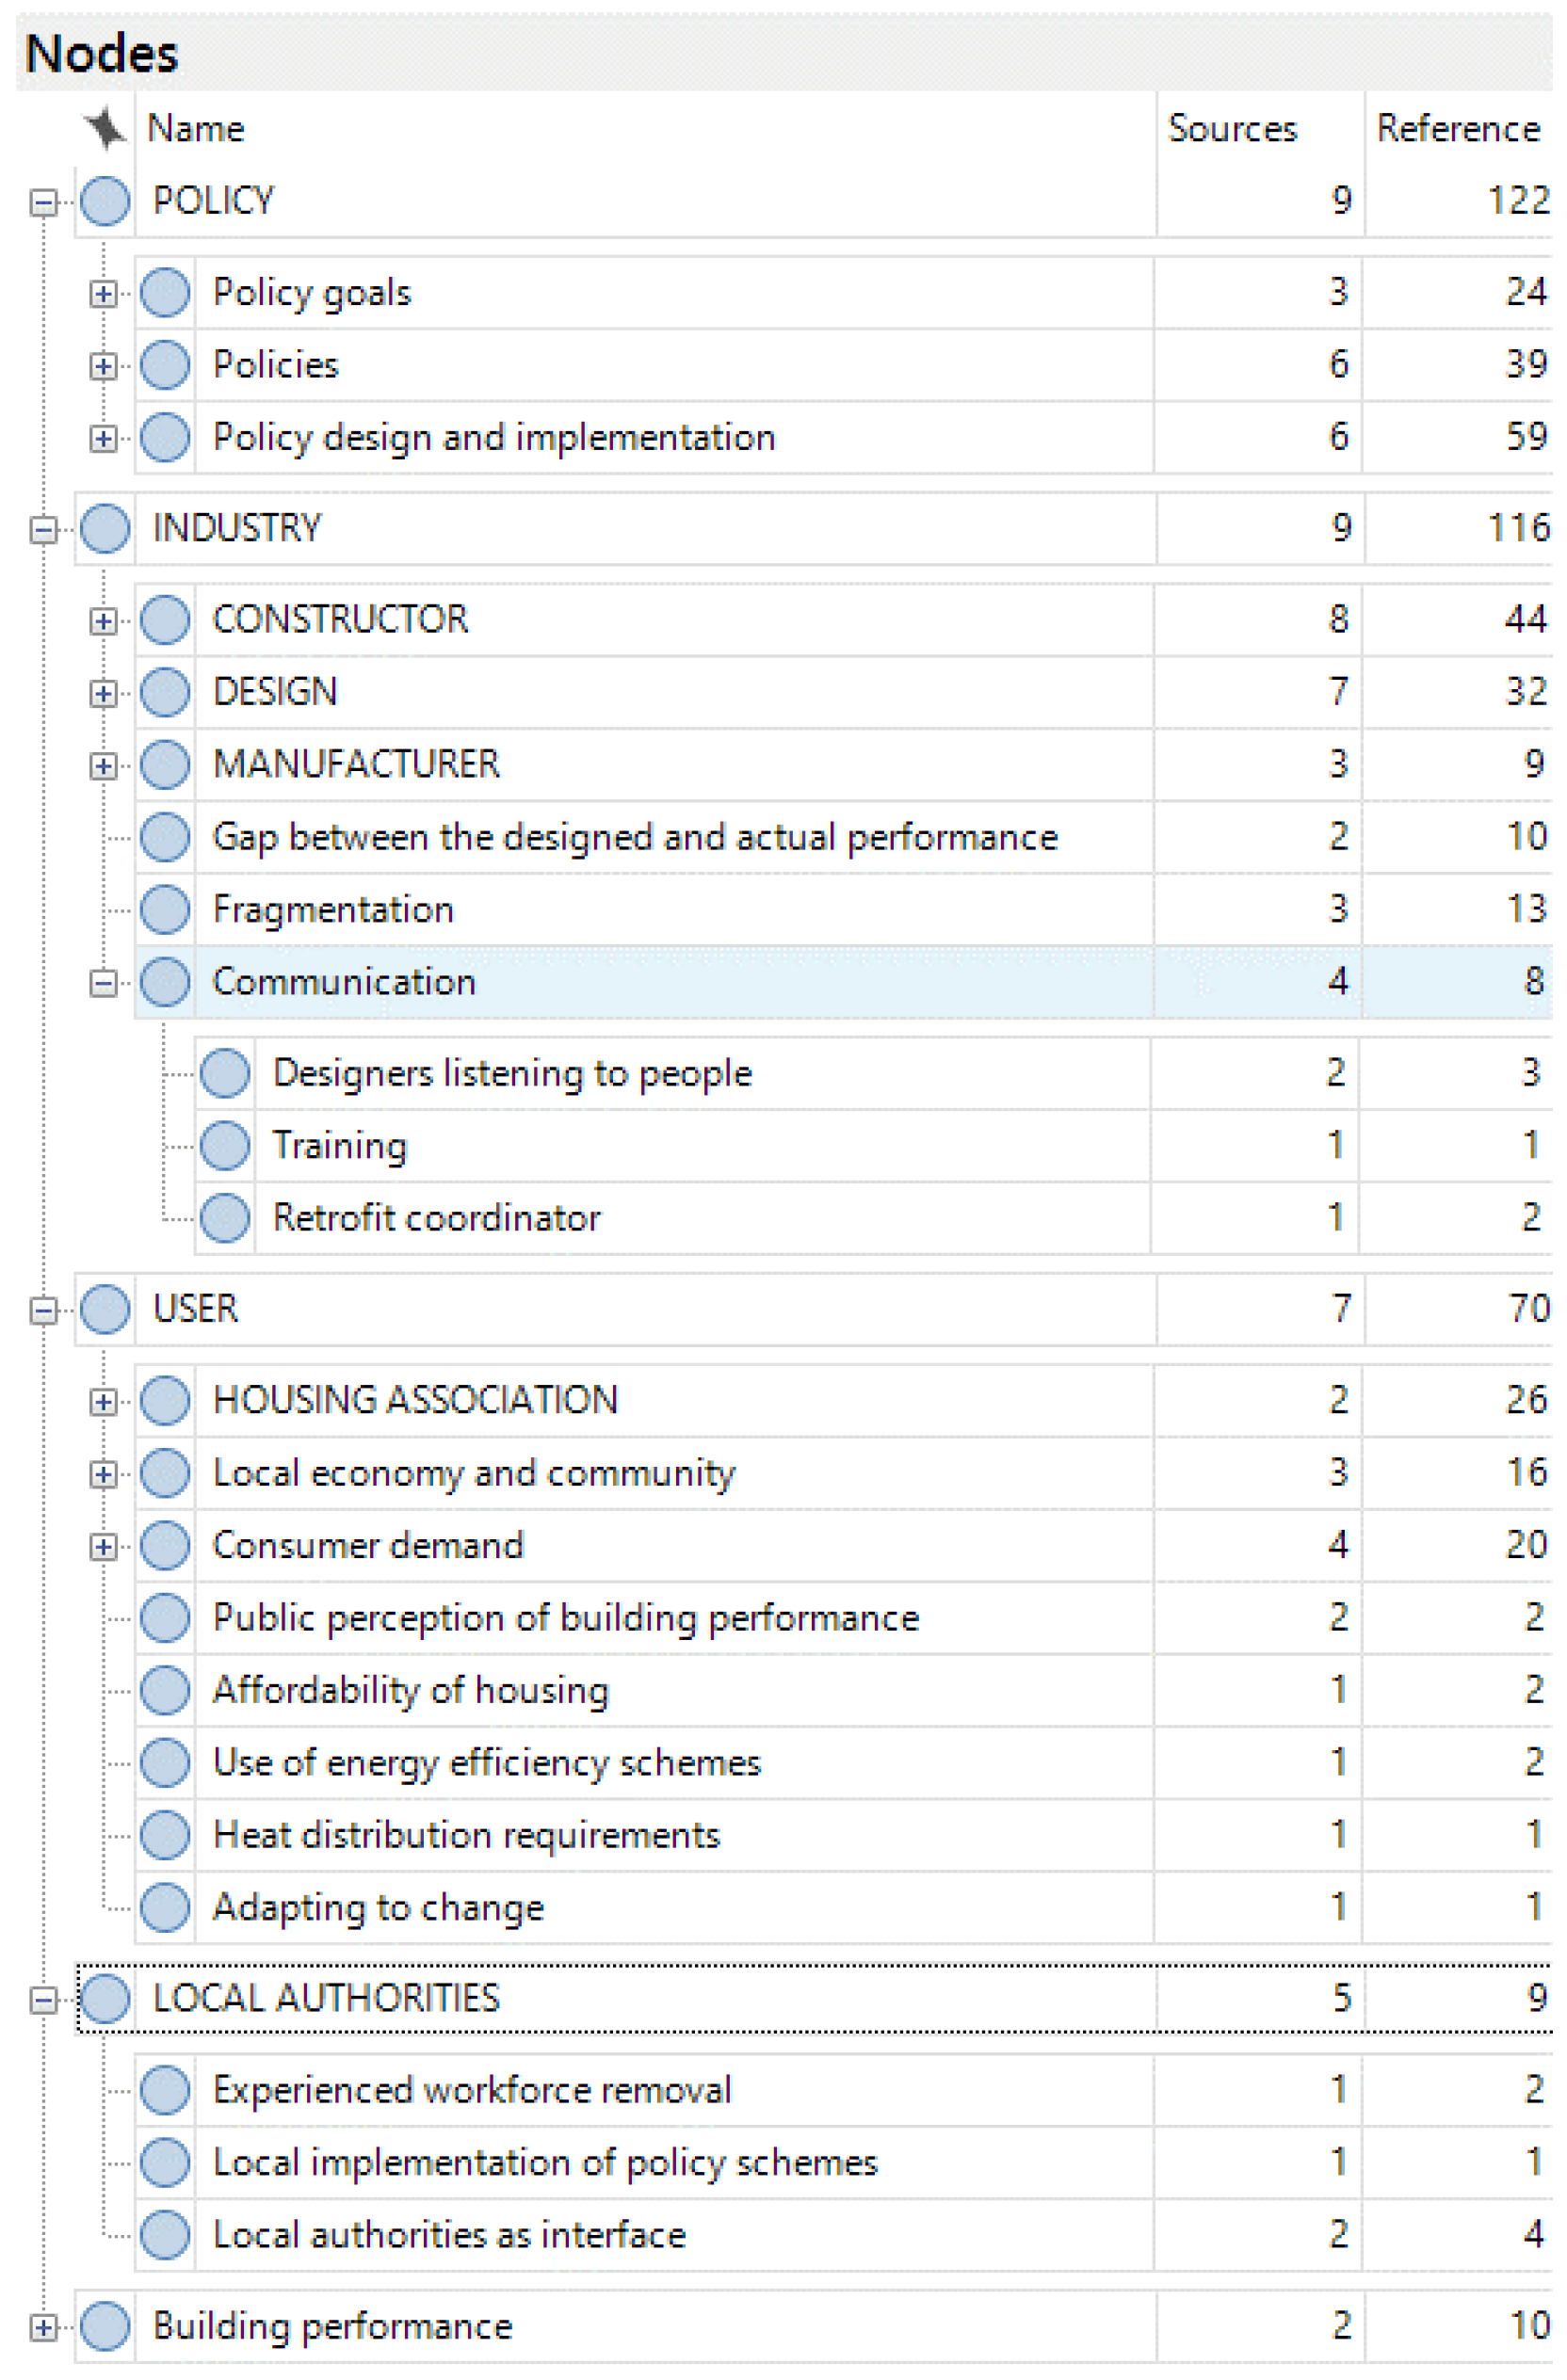
Figure 2.
NVivo screen that shows the causal relationships defined for Competence of policy analysts.
Figure 2.
NVivo screen that shows the causal relationships defined for Competence of policy analysts.

Figure 3.
Causal loop diagram for Competence of policy analysts.
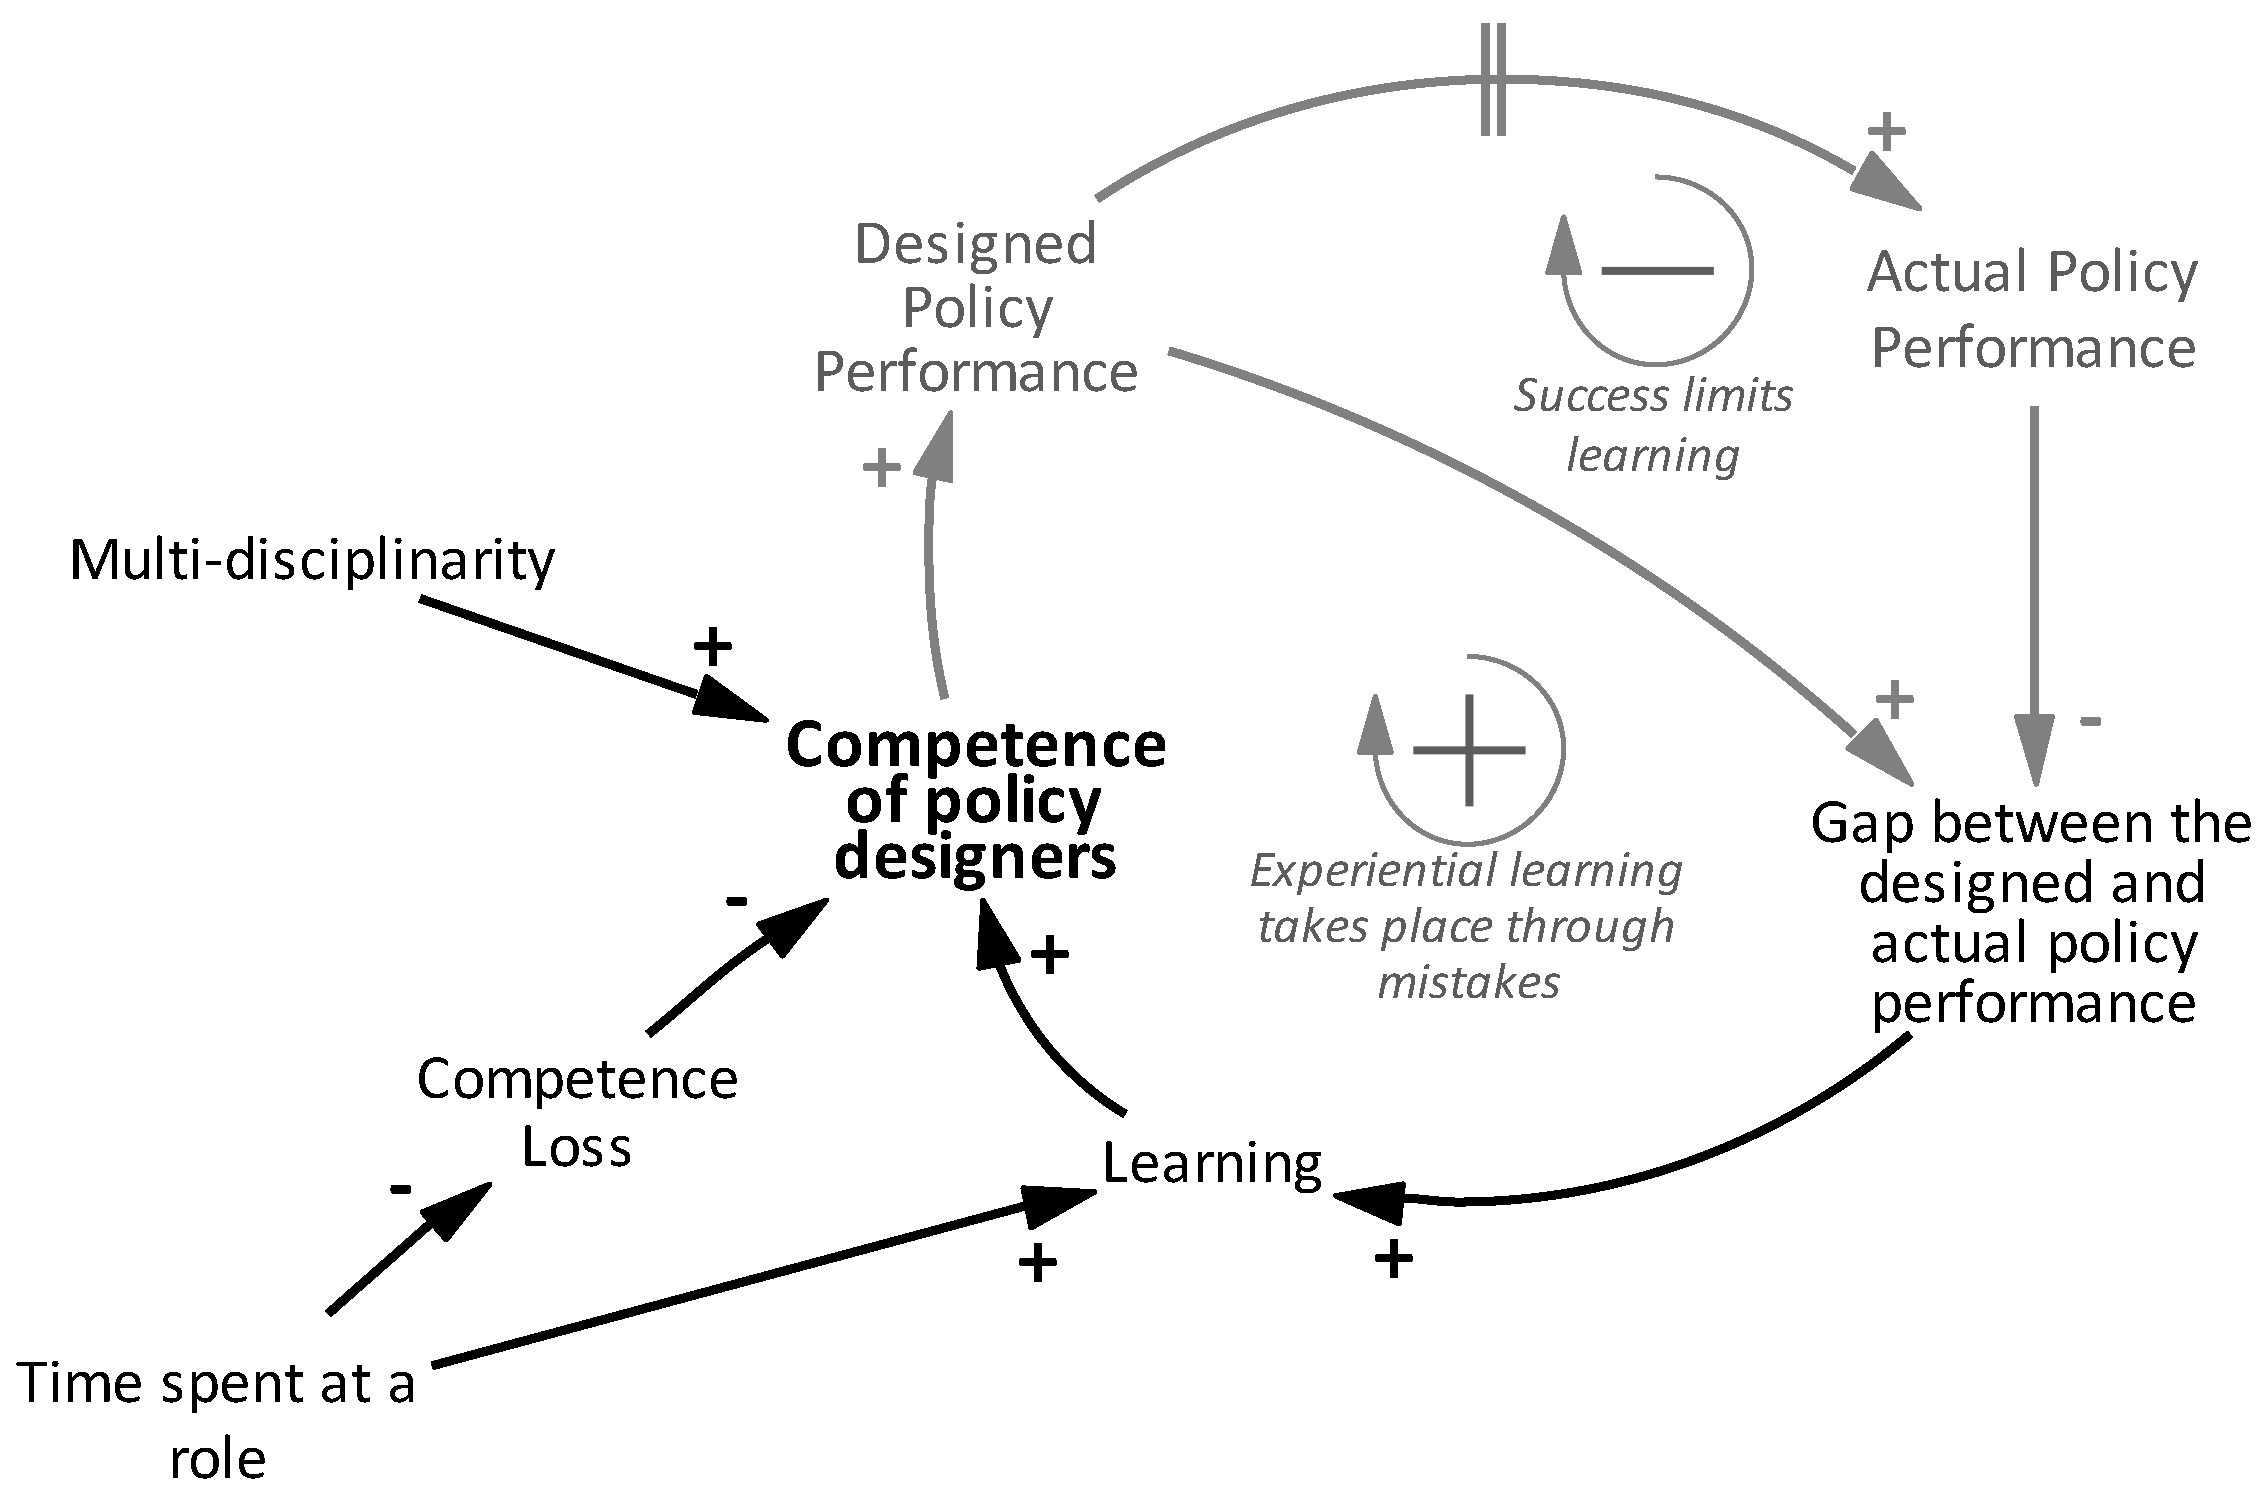
Figure 4.
Complete causal loop diagram.

| Theme | Question |
|---|---|
| Interviewee | What is your role in your organization and for how long have you done this? |
| Organization | What is the nature of your organization/business? |
| Does your organization have a mission statement? If yes, what is it? | |
| Integration | How does integration get enabled and constrained in the context of your organization? Can you tell me about your experience here? |
| Delivery framework, attention | What makes you think you have done a good job? |
| Can you formulate your framework to deliver what you want to deliver, given all the constraints you face? Do you follow specific steps or priorities? |
| Characteristics | Research Design Dimension | In Our Case |
|---|---|---|
| Group characteristics | Synchronous vs. asynchronous communication | Asynchronous |
| One group vs. many groups | Many groups | |
| Data collection characteristics | Context set by researchers vs. by participants | Researcher |
| Data collected by researcher or not | Researcher | |
| Coder characteristics | One coder vs. many coders | One |
| Coder engaged in data collection or not | No |
| Description of the Process | Main Tool | Input | Output |
|---|---|---|---|
| 1. Identifying concepts and discovering themes in the data | Open coding | Raw text data | A list of concepts and themes, and corresponding codes |
| 2. Categorizing and aggregating themes into variables | Axial coding | The list of themes and corresponding codes | Stakeholder groups, a coding tree |
| 3. Identifying causal relationships between aggregated variables | Axial coding, causal links | The coding tree | A list of relationships with references to the data (coding dictionary) |
| 4. Transforming the coding dictionary into causal diagrams | Causal maps | The list of relationships | Final causal map |
Table 4.
The coding tree for the Competence of policy analysts.
© 2016 by the authors; licensee MDPI, Basel, Switzerland. This article is an open access article distributed under the terms and conditions of the Creative Commons Attribution (CC-BY) license (http://creativecommons.org/licenses/by/4.0/).
Share and Cite
MDPI and ACS Style
Eker, S.; Zimmermann, N. Using Textual Data in System Dynamics Model Conceptualization. Systems 2016, 4, 28. https://doi.org/10.3390/systems4030028
AMA Style
Eker S, Zimmermann N. Using Textual Data in System Dynamics Model Conceptualization. Systems. 2016; 4(3):28. https://doi.org/10.3390/systems4030028
Chicago/Turabian StyleEker, Sibel, and Nici Zimmermann. 2016. "Using Textual Data in System Dynamics Model Conceptualization" Systems 4, no. 3: 28. https://doi.org/10.3390/systems4030028
Note that from the first issue of 2016, this journal uses article numbers instead of page numbers. See further details here.