1. Introduction
Erbium-doped fibers (EDF) is at the heart of erbium-doped fiber amplifiers (EDFAs), which serve as an integral part of present day optical communication networks and form the scaffold for almost all wavelength division multiplexing (WDM) networks. They are essential to achieve large flatness and broadening of the gain spectrum, along with minimal interchannel cross-talk, for efficient EDFA modules with ideal performance for Cable TV (CATV) and dense wavelength division multiplexing (DWDM) optical communication networks [
1]. EDFAs are the key component as they can simultaneously amplify many signals within the C (1530−1560 nm) band [
2]. Development of new fiber compositions is one of the approaches for achieving flat gain with a wide amplification bandwidth [
3,
4] to avoid more and higher-cost components. IsoGain
TM EDF has been introduced to obtain flat gain for use in a high-channel-count DWDM system [
5]. In order to achieve uniform signal gain, one common approach is Al
3+ codoped with Er
3+ in EDFs [
6,
7,
8,
9,
10,
11]. In order to tune the spectral characteristics as well as the performance of EDFs, selection of proper glass compositions plays a critical role. Tailoring of the doped host, based on material characterization of the core glass matrix within the optical fiber core region for incorporation of Er
3+ ion, is a crucial factor for improvement of the spectroscopic properties of the fibers to obtain an intrinsic flat gain of EDFA. Interestingly, when Er
2O
3 is doped into alumina–silica-based phase-separated glass hosts, it produces efficient spectral broadening, and it is thus possible to get large gain-bandwidth with improved flatness of the gain spectrum. Alteration of the Er
3+ local environment, symmetry, and ligand field strength are key factors in achieving this spectral broadening of the Er
3+ emission. As the host glass environment affects the spectroscopy of Er
3+ ions, a number of fiber host materials—including silica, fluorozirconate glasses, and chalcogenides—have been investigated in an attempt to identify a host that will provide a larger gain bandwidth for the
4I
13/2→
4I
15/2 transition of erbium [
12,
13,
14]. Although the fluoride and telluride hosts doped with Er
3+ offer high quantum efficiencies for 1.5 μm transitions, they are not suitable for practical device application due to their poor mechanical strength compared to their pure silica glass counterparts. It is extremely difficult to fabricate low-loss fluoride glass fibers as they are prone to crystallization and suffer from poor chemical durability. Telluride glasses, though stable, have a high index of refraction and high thermal expansion, both of which complicate splicing into an all-optical system. The normal alumina–silica glass-based EDF with high Al codoping shows better flatness compared to other silica EDFs, such as those based on germanium–silica and phosphosilicate glasses [
6]. Accordingly, fabrication of high Al-doped silica-based optical fiber has gained significant attention in recent years, and various techniques such as modified chemical vapor deposition coupled with solution doping (MCVD-SD), direct nanoparticle deposition (DND), sol–gel methods etc. have been used to generate EDFs. However, fabrication of phase-separated core glass is especially attractive as it can create more nonuniformity surrounding the Er ions, leading to enhanced stark splitting. Although there are many reports related to fabrication of phase-separated rare-earth (RE)-doped glasses containing Er, Yb, Tm, etc. [
15,
16,
17,
18], our goal was to optimize the associated fabrication process parameters, including heat treatment of fabricated preforms, through different types of material characterization that are not well reported in the literature, especially for high alumina-containing silicate core glass-based fibers. Some reports are available on aluminophosphosilicate-based glass fibers fabricated through MCVD-solution doping technique followed by heat treatment [
19,
20] but not in pure aluminosilicate-based glass fiber doped with Er ions.
In this study—based on the above background and in order to obtain enhanced flatness of around ±0.60 dB over the C band region—Er3+ was incorporated in a modified alumina–silica glass host of suitable composition, which forms a phase-separated region within the glass matrix after optimized annealing conditions. A detailed investigation was performed to optimize different process parameters associated with fabrication of Er-doped alumina–silica-based phase-separated EDF, along with the material characterization necessary to understand the nature and performance of the fiber obtained from the phase-separated glass. The spectroscopic properties and the features of the gain spectra of EDFs fabricated from both phase-separated and non-phase-separated aluminosilicate-based Er2O3-doped preforms are explained on the basis of these experimental results.
2. Basic Principle for Phase-Separation Phenomenon of Optical Fiber Preforms
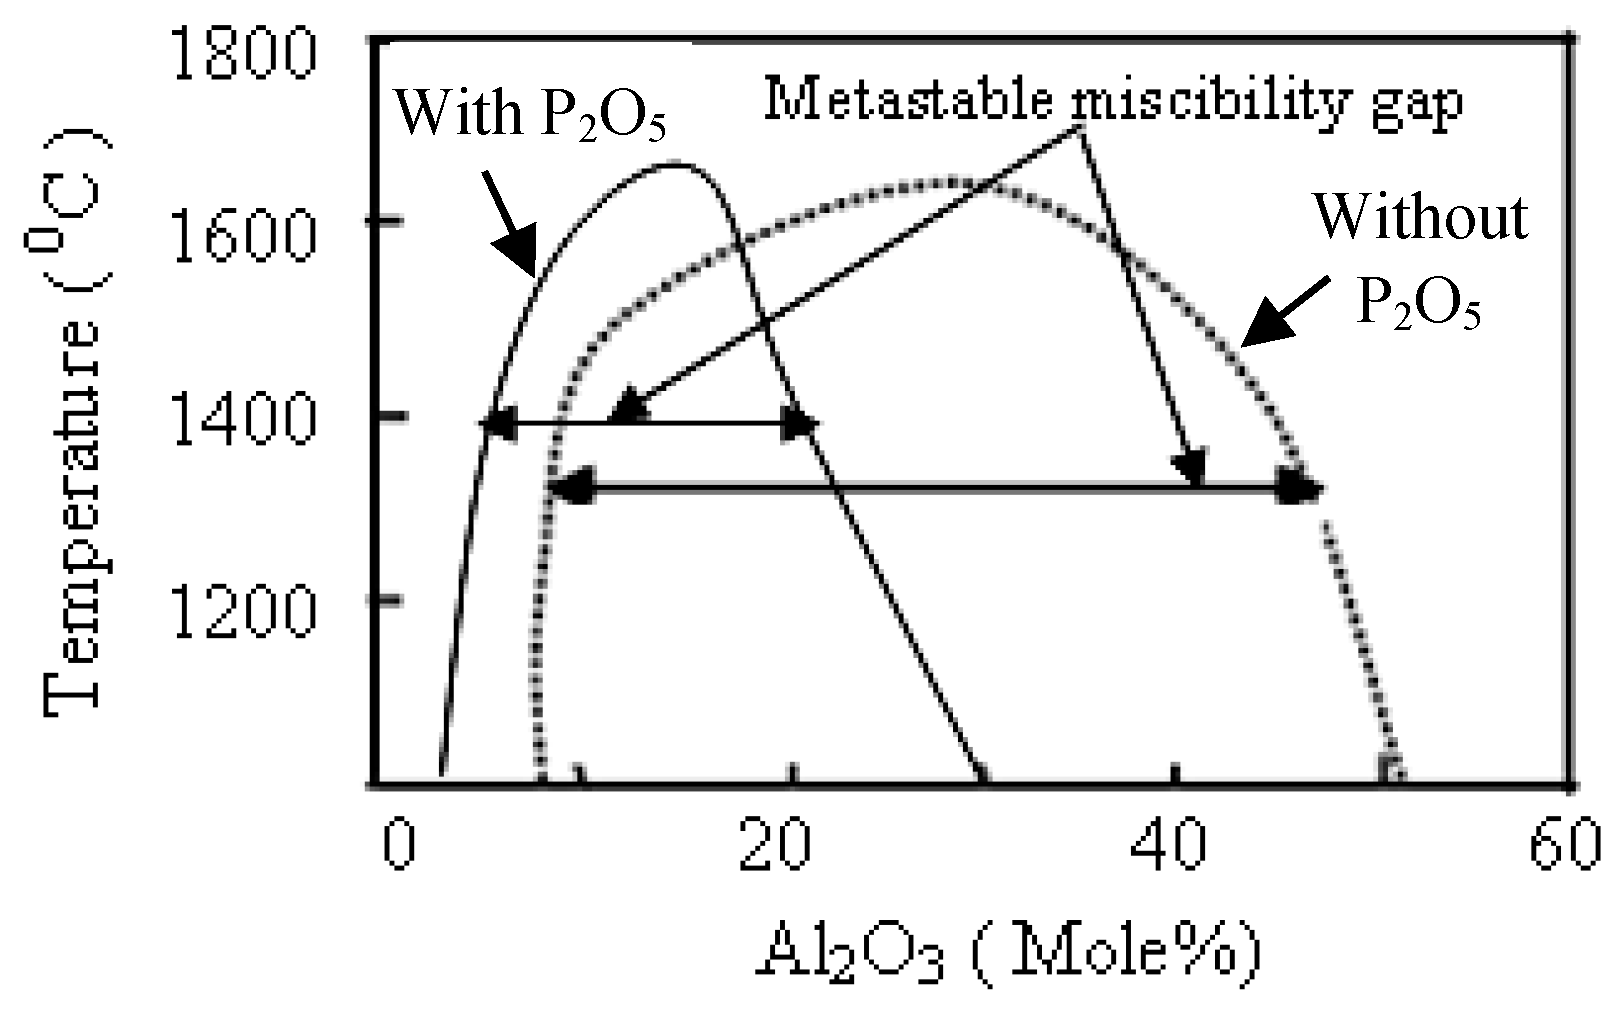
The origin of alumina-rich phase-separated glass arises from the phenomenon of metastable glass-in-glass separation [
21] on rapid quenching of Al
2O
3–SiO
2 melts comprising 4–50 mol% Al
2O
3, as indicated by the phase diagram in
Figure 1. Such phase separation in the glass matrix through the solution-doping process was achieved by incorporating small amounts (<10 mol%) of codopant that lies within their miscibility gap. First, we identified suitable codopants that give rise to immiscibility in silica glass upon incorporation of small amounts of such codopants. Based on different thermodynamical data, such as entropy of mixing, enthalpy of mixing, activity coefficient and Gibbs-free energy change [
22,
23,
24], the phase diagram of binary SiO
2–Al
2O
3 glass was derived by employing FactSage software, and a miscibility gap was found to exist in the range of 4–30 mol% Al
2O
3. The miscibility gap matched closely with the experimentally determined miscibility gap region of binary SiO
2–Al
2O
3 system [
24]. The shape of the metastable binary two-liquid region was found to be asymmetric, with a tail towards the Al
2O
3-rich side of the system in the temperature ranging between 1350−1650 °C (
Figure 1).
In presence of a small amount of phosphorous, the shape of the metastable binary two-liquid region was found to be much more asymmetric in nature, having a tail towards lower Al
2O
3content than that of the binary SiO
2–Al
2O
3 system in the temperature range of 1350−1650 °C (
Figure 1). Accordingly, annealing of the glass in this temperature range induced phase separation without any crystallization of the glass. The prerequisite to achieve phase separation in multicomponent glasses is the presence of an immiscibility region in their phase diagram. It is possible to prepare a clear and transparent glass having composition within the immiscibility region when their melts are quenched rapidly below the glass transition temperature, Tg. It has been found that the glass viscosity is too high and the necessary rearrangements of structural groups for phase separation can be achieved below Tg. However, when these phase-separated glasses are further heated in the range between Tg and the upper critical temperature of the immiscibility region, formation of subliquidus phase separation occurs. Two principal mechanisms of phase separation—through nucleation and growth and by spinodal decomposition—are well known. Nevertheless, the type of mechanism depends on the glass composition as well as the temperature. The phase morphology also depends on the annealing condition of the samples. Opaqueness is a consequence of light scattering from phases with different compositions and refractive indices and depends on the size of the new phases, which in turn depends on the annealing condition. The addition of P
5+ has an accelerating effect on this phase separation [
25]. To induce phase separation, minor amounts of P
2O
5, around 0.15–0.20 mol% is incorporated into such alumina–silica glasses. Preventing nucleation and subsequent crystallization of mullite within the high alumina-dispersed glass phase is important during cooling from the heated melts and on reheating the preform within 1600−1900 °C to achieve the working temperature within 1350−1650 °C. The metastable binary two-liquid region is formed below the temperature around 1650 °C. The phase-separated alumina–silica glass containing at least 4 mol% of Al
2O
3 appears by heating below 1650 °C.
3. Sample Preparation
Three Er
2O
3-doped preform samples (A1, A2, and A3) based on alumina–silica host with different contents of Al
2O
3 and a slight variation of Er
2O
3 concentrations (
Table 1) were prepared employing MCVD coupled with the SD technique (
Figure 2).
All process parameters were standardized, along with the thermal treatment, to get alumina-rich phase-separated glass hosts. The porous SiO
2 soot layer containing minor amounts of P
2O
5 (<0.01 mol%) was deposited along the forward direction inside the substrate silica tube to promote the phase-separation phenomenon. In the forward deposition method, the deposition of porous silica soot layer was done at variable temperatures ranging from 1350 °C to 1450 °C and along the direction of the reactant flow containing halide precursors, such as SiCl
4 and POCl
3. O
2 was used as the carrier gas to adjust the porosity of the deposited SiO
2 soot layer for incorporation of the desired amount of Al
2O
3, which varied from 3.5 mol% to 4.5 mol%, and Er
2O
3, which varied from 0.073 mol% to 0.075 mol%. The list of fabricated preforms/fibers is given in
Table 1. The Al
2O
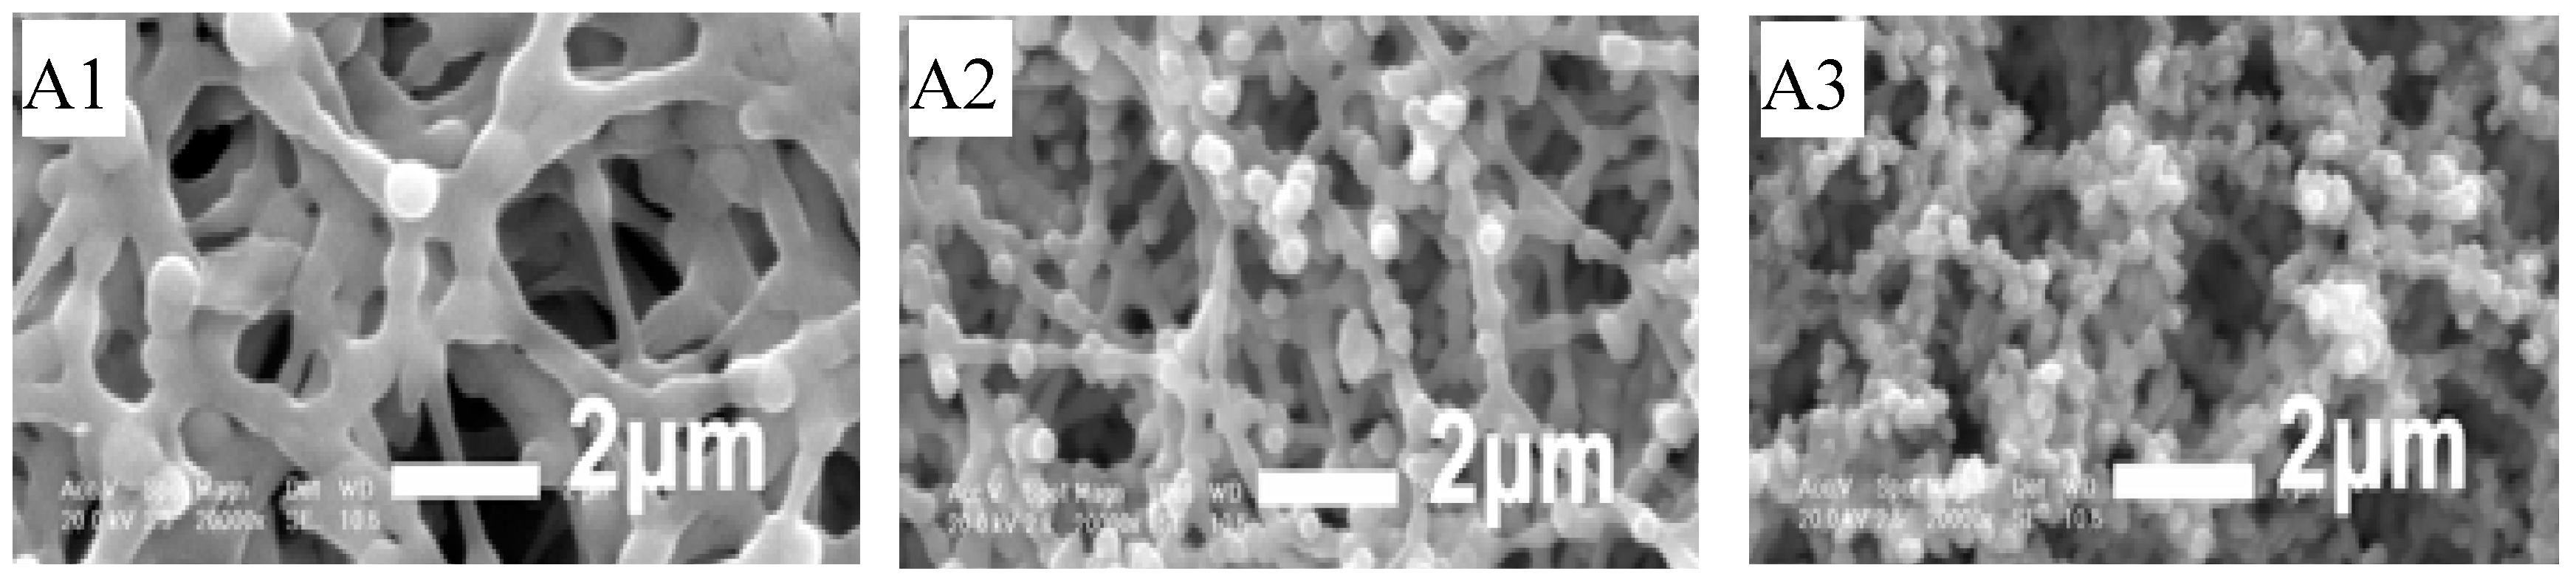
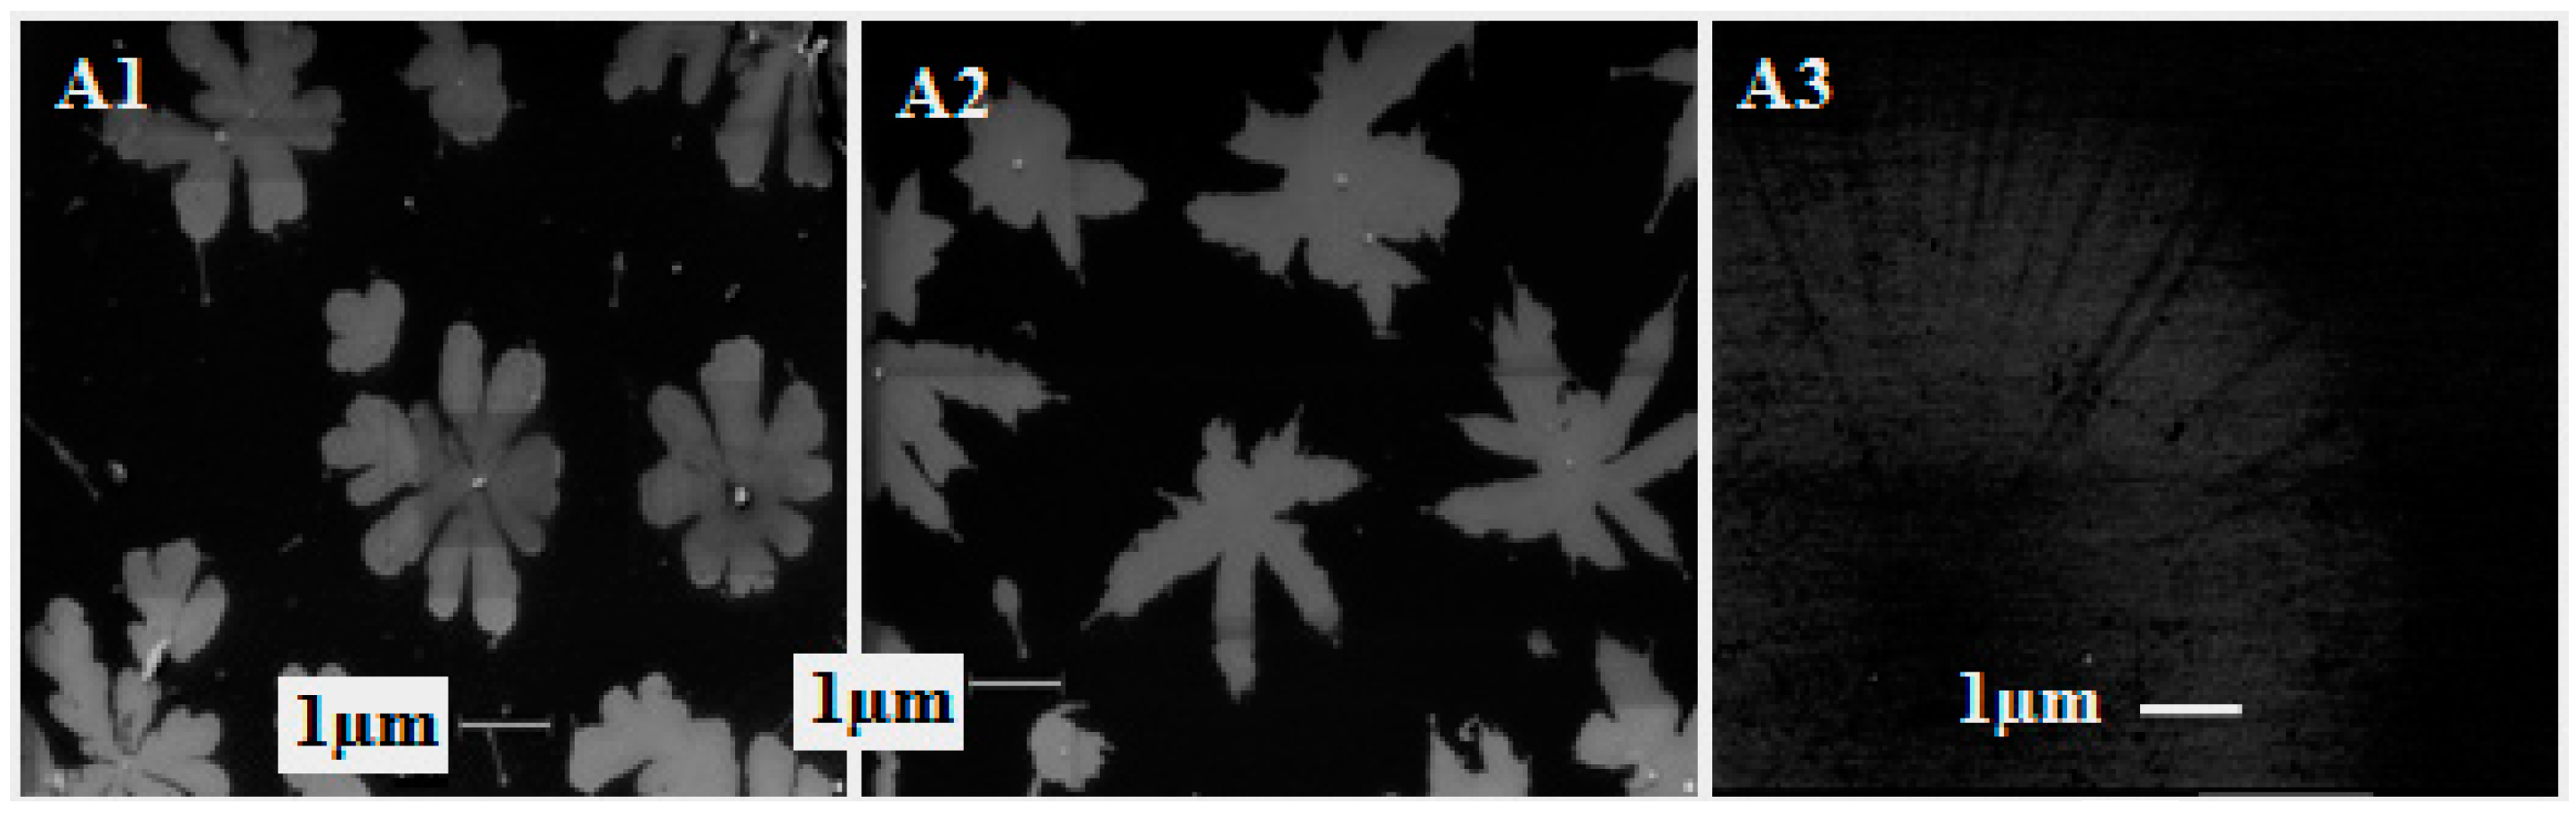
3 content of fibers A1, A2, and A3 became 4.5, 4.0, and 3.5 mol% under the deposition of porous silica soot layers at 1350 °C, 1400 °C, and 1450 °C, respectively. The microscopic view of the porous layers with different porosity and containing minor amounts of P
2O
5 for solution soaking using the same strength of AlCl
3 6H
2O for a fixed soaking period of one hour are shown in
Figure 3.
For incorporation of a desired quantity of Er
3+ and Al
3+ ions, an alcoholic solution of a mixture of suitable strength of the precursor salts was used. The strength of ErCl
3 6H
2O and AlCl
3 6H
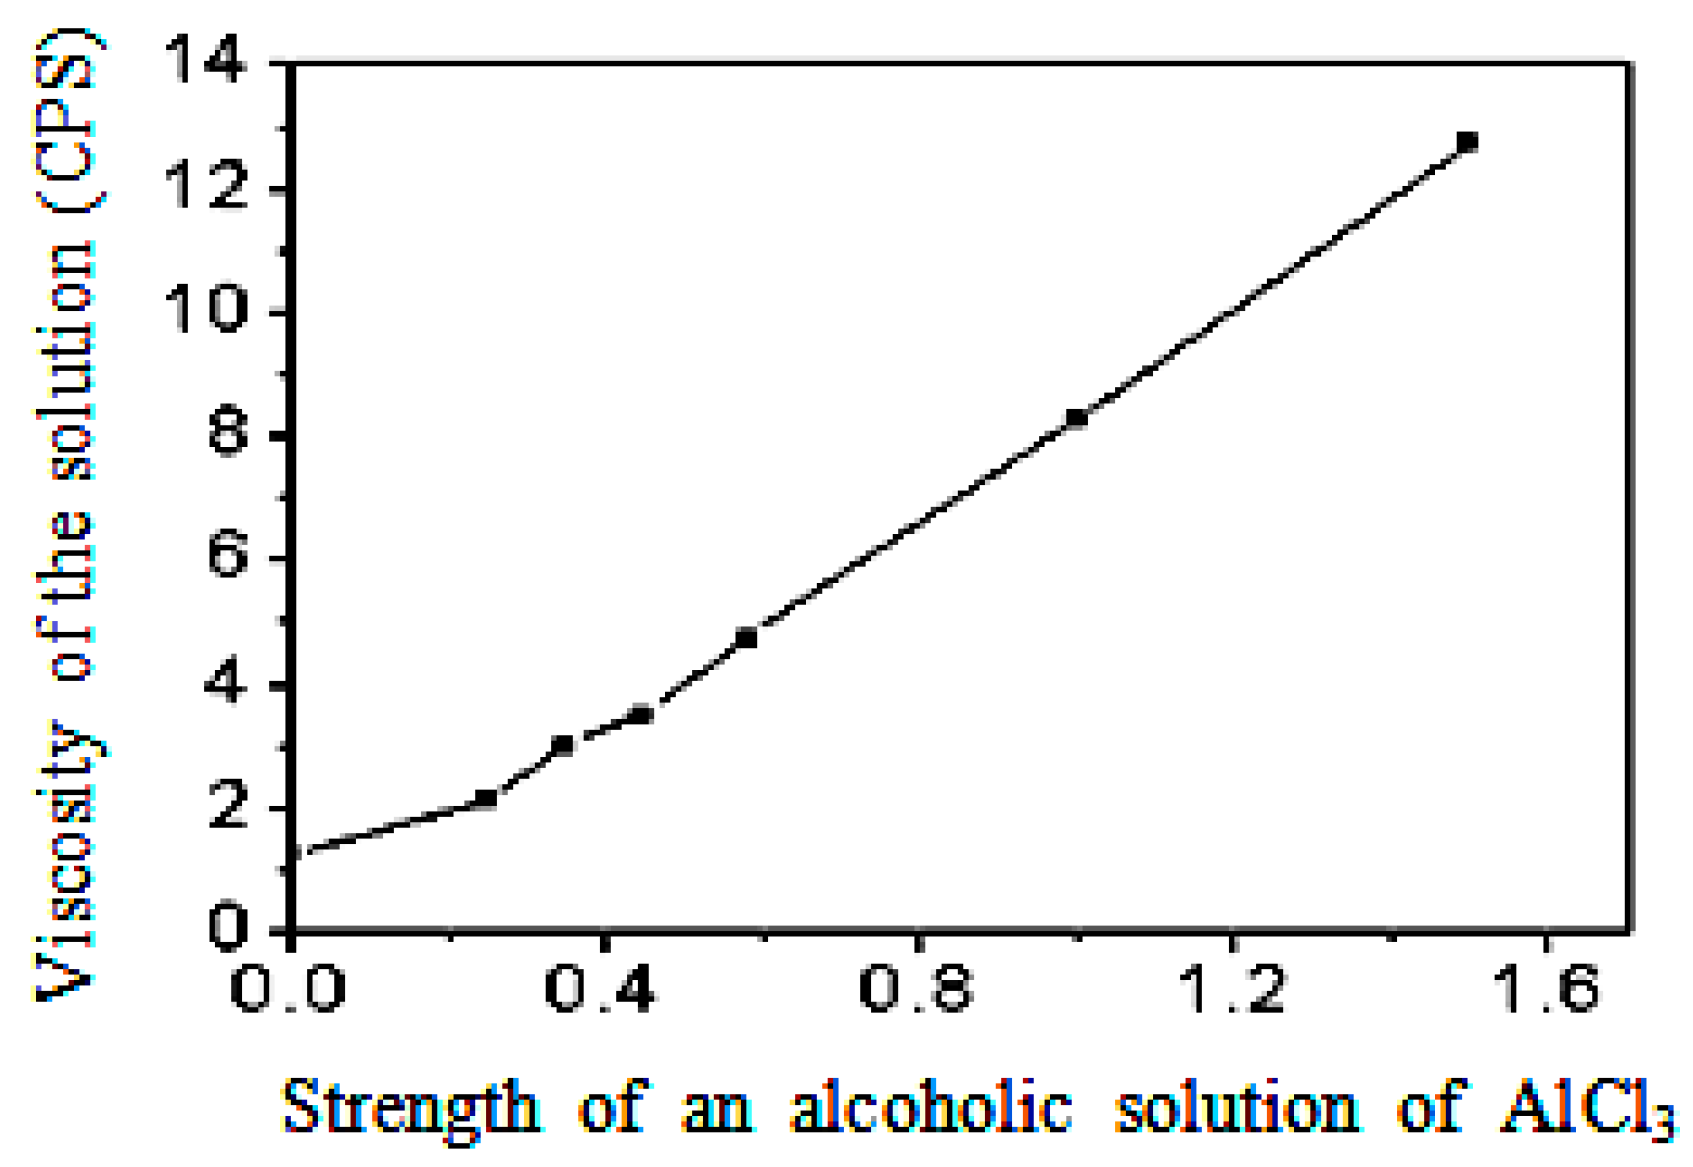
2O was maintained around 0.01 M and 1.5 M, respectively. The dipping time was maintained around 1 h. The porosity of the deposited silica soot layer, which is related to the deposition temperature, is critical with respect to the viscosity of the solution when the strength of precursor of Al
3+ ion becomes high (>1.25 M). The viscosity of an alcoholic solution measured by Brookfield Digital Viscometer (Model LV TDV) was found to increase gradually with increasing strength of AlCl
3 6H
2O, as shown in
Figure 4. The strength of AlCl
3 6H
2O was maintained at 1.5 M to incorporate 3.5–4.5 mol% of Al
2O
3 by adjusting the porosity of the deposited unsintered silica layer. The corresponding viscosity of the solution became around 12.75 centipoise (cP), and led to disturbances of the coated layer when the porous silica layer was deposited at relatively lower temperatures, for example, below 1250 °C, due to lack of proper thermal adhesion of the porous soot layer with the inner silica surface of the tube. The solution soaking period was maintained around one hour to allow sufficient time for diffusion through the porous soot layer, which took place due to capillary action. The viscosity, as well as the surface tension, of the solution increased considerably with increasing strength of the AlCl
3 6H
2O solution, from 0.05 to 1.5 M. As a result, the deposition temperature of the porous soot layer along the forward direction was adjusted carefully with respect to the strength of the soaking solution used during the solution-doping process.
4. Material and Optical Characterization
Electron probe microanalysis (EPMA) (JXA-8530F, JEOL, Peabody, MA, USA) was used to determine the incorporated dopant amount using two-side-polished preform sample of thickness 1−1.5 mm taken from the fabricated preform and by maintaining spatial resolution of 1 μm after applying thin graphite coating, as presented in
Figure 5. The field emission gun scanning electron microscope (FEGSEM) (Carl Zeiss, Jena, Germany) images of small circular polished preform samples were obtained for identification of the phase-separated region and were followed by energy dispersive X-ray (EDX) (LEO S430 I, Berkshire, UK) and X-ray Diffraction (XRD) (PANalytical, Worcestershire, UK) analyses to detect the nature and composition of the phase-separated glass. To evaluate the nature of the phase-separated region, the electron beam was focused on and outside of the phase-separated region during the energy dispersive X-ray data acquisitions. To determine the coordination numbers of Al
3+ ion,
27Al NMR spectroscopy of the core glass of preform samples A1 and A3 was done after complete etching of the surrounding silica glass, covering the open core end with a Teflon tape and using buffer HF solution, followed by powdering of the remaining 0.8 mm thickness of the preform sample.
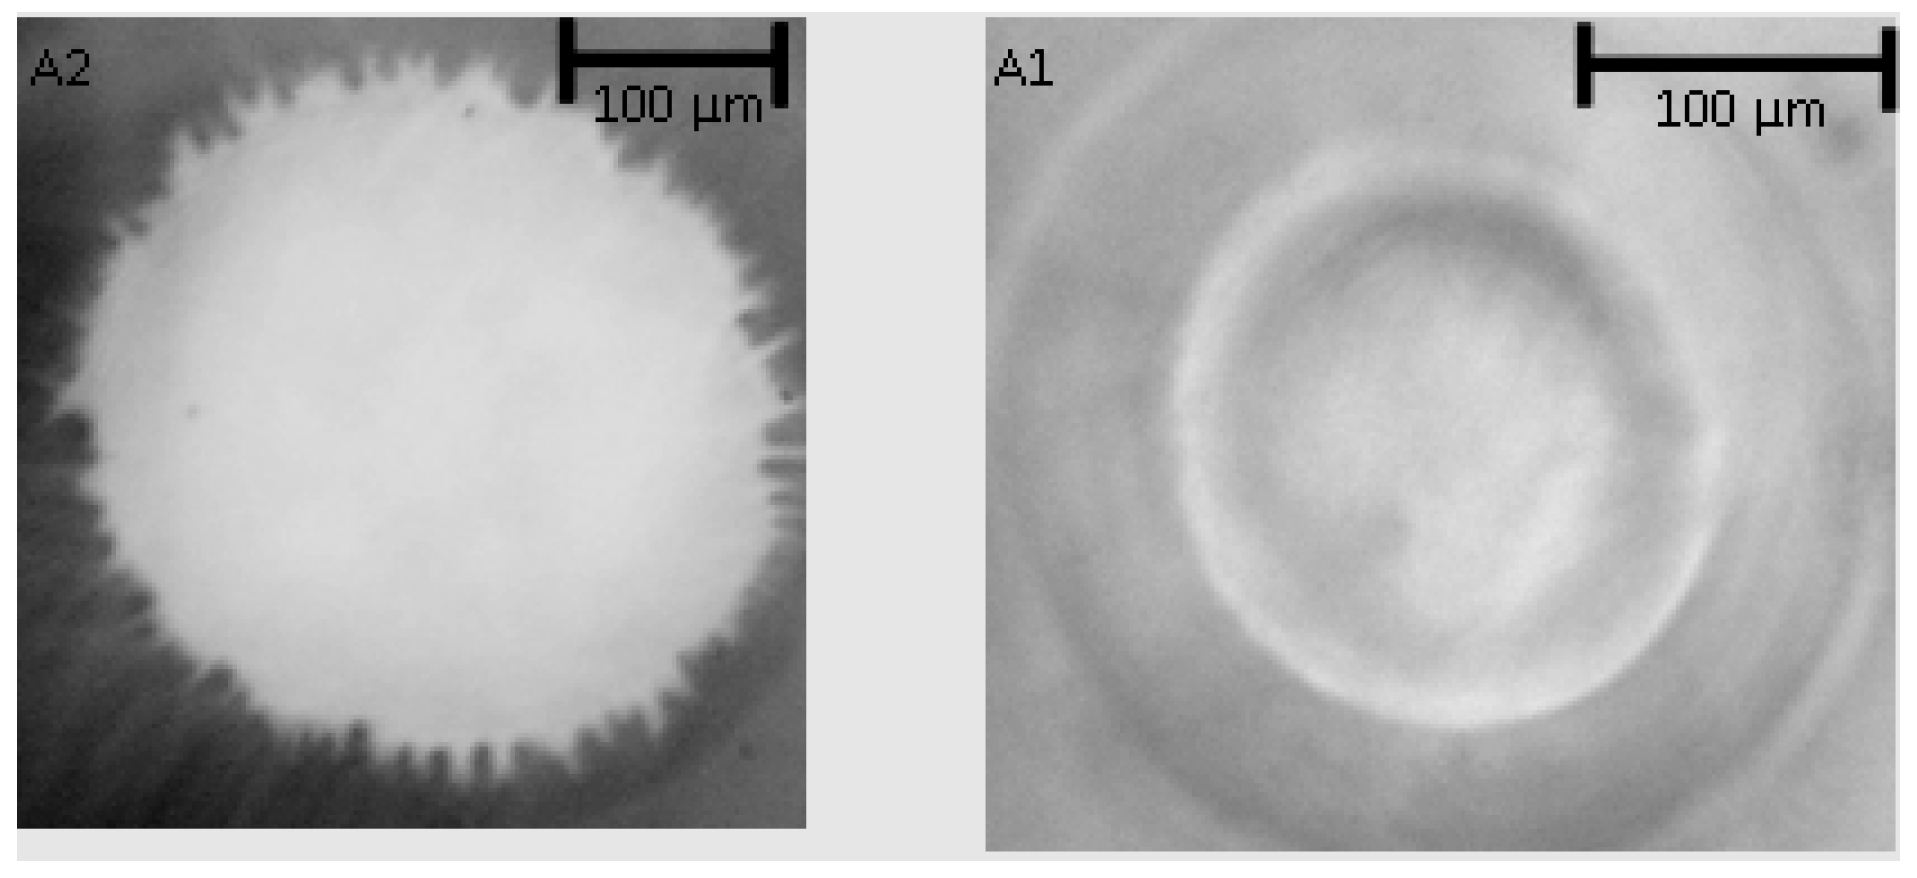
High resolution optical microscopic views of two fabricated preforms are shown in
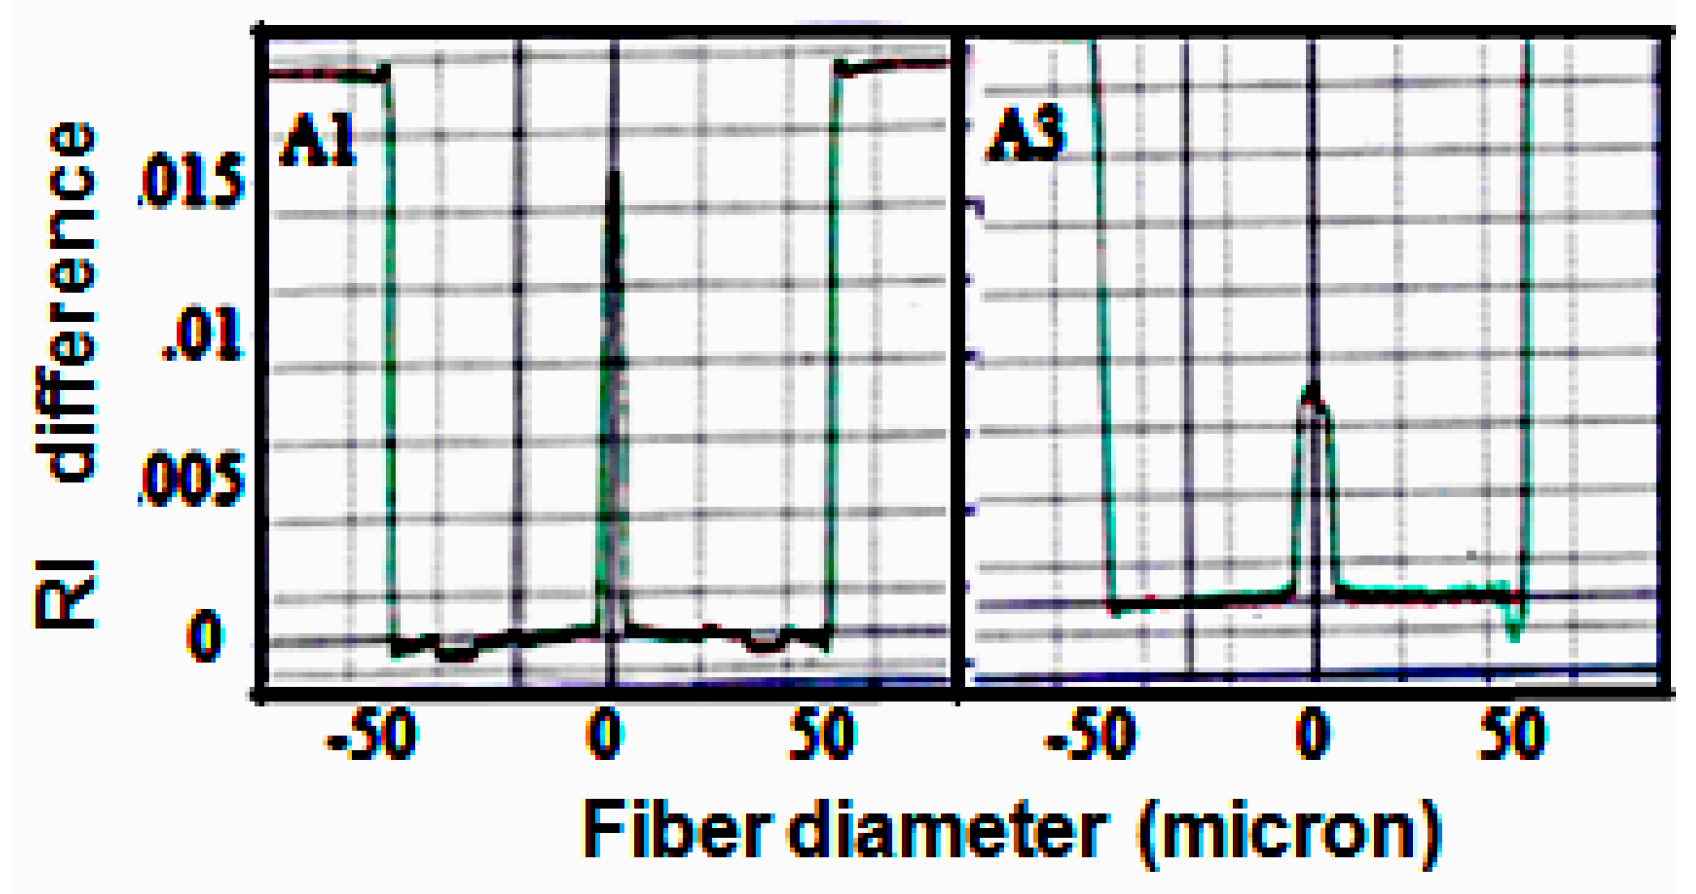
Figure 6, and the corresponding refractive-index profiles (RIP) are presented in
Figure 7. No central dip was observed in the RIP presented in
Figure 7, which is a common feature of preforms fabricated using MCVD due to slow evaporation of the index-raising elements.
The extended X-ray absorption fine structure (EXAFS) measurement was carried out using Si (111) monochromating crystal and a focusing second mirror in order to obtain the smallest X-ray spot size (150 × 800 µm) available on the sample synchrotron radiation. Experiments were carried out in the fluorescence mode using a multielement energy-resolving detector. Liquid nitrogen temperature was used to enhance the signal from the highest coordination shells. EXAFS spectra of all the samples were taken and compared with those of Er2O3 and Al2O3. From the EXAFS analyses, a clear structure was observed until 8 in k-space for the different Er2O3-doped fiber preform samples, which provided sufficient information to understand the nearest-neighbor atom structure.
Different spectroscopic properties, namely absorption coefficient, fluorescence spectra, and lifetime of the fabricated fibers drawn from the phase-separated (A1 and A2) and non-phase-separated glass (A3) based preforms were measured. The fluorescence spectra of the fabricated fiber samples were measured with pumping at 980nm under different pump powers (25 mW, 125 mW and 245 mW) in a lateral direction.
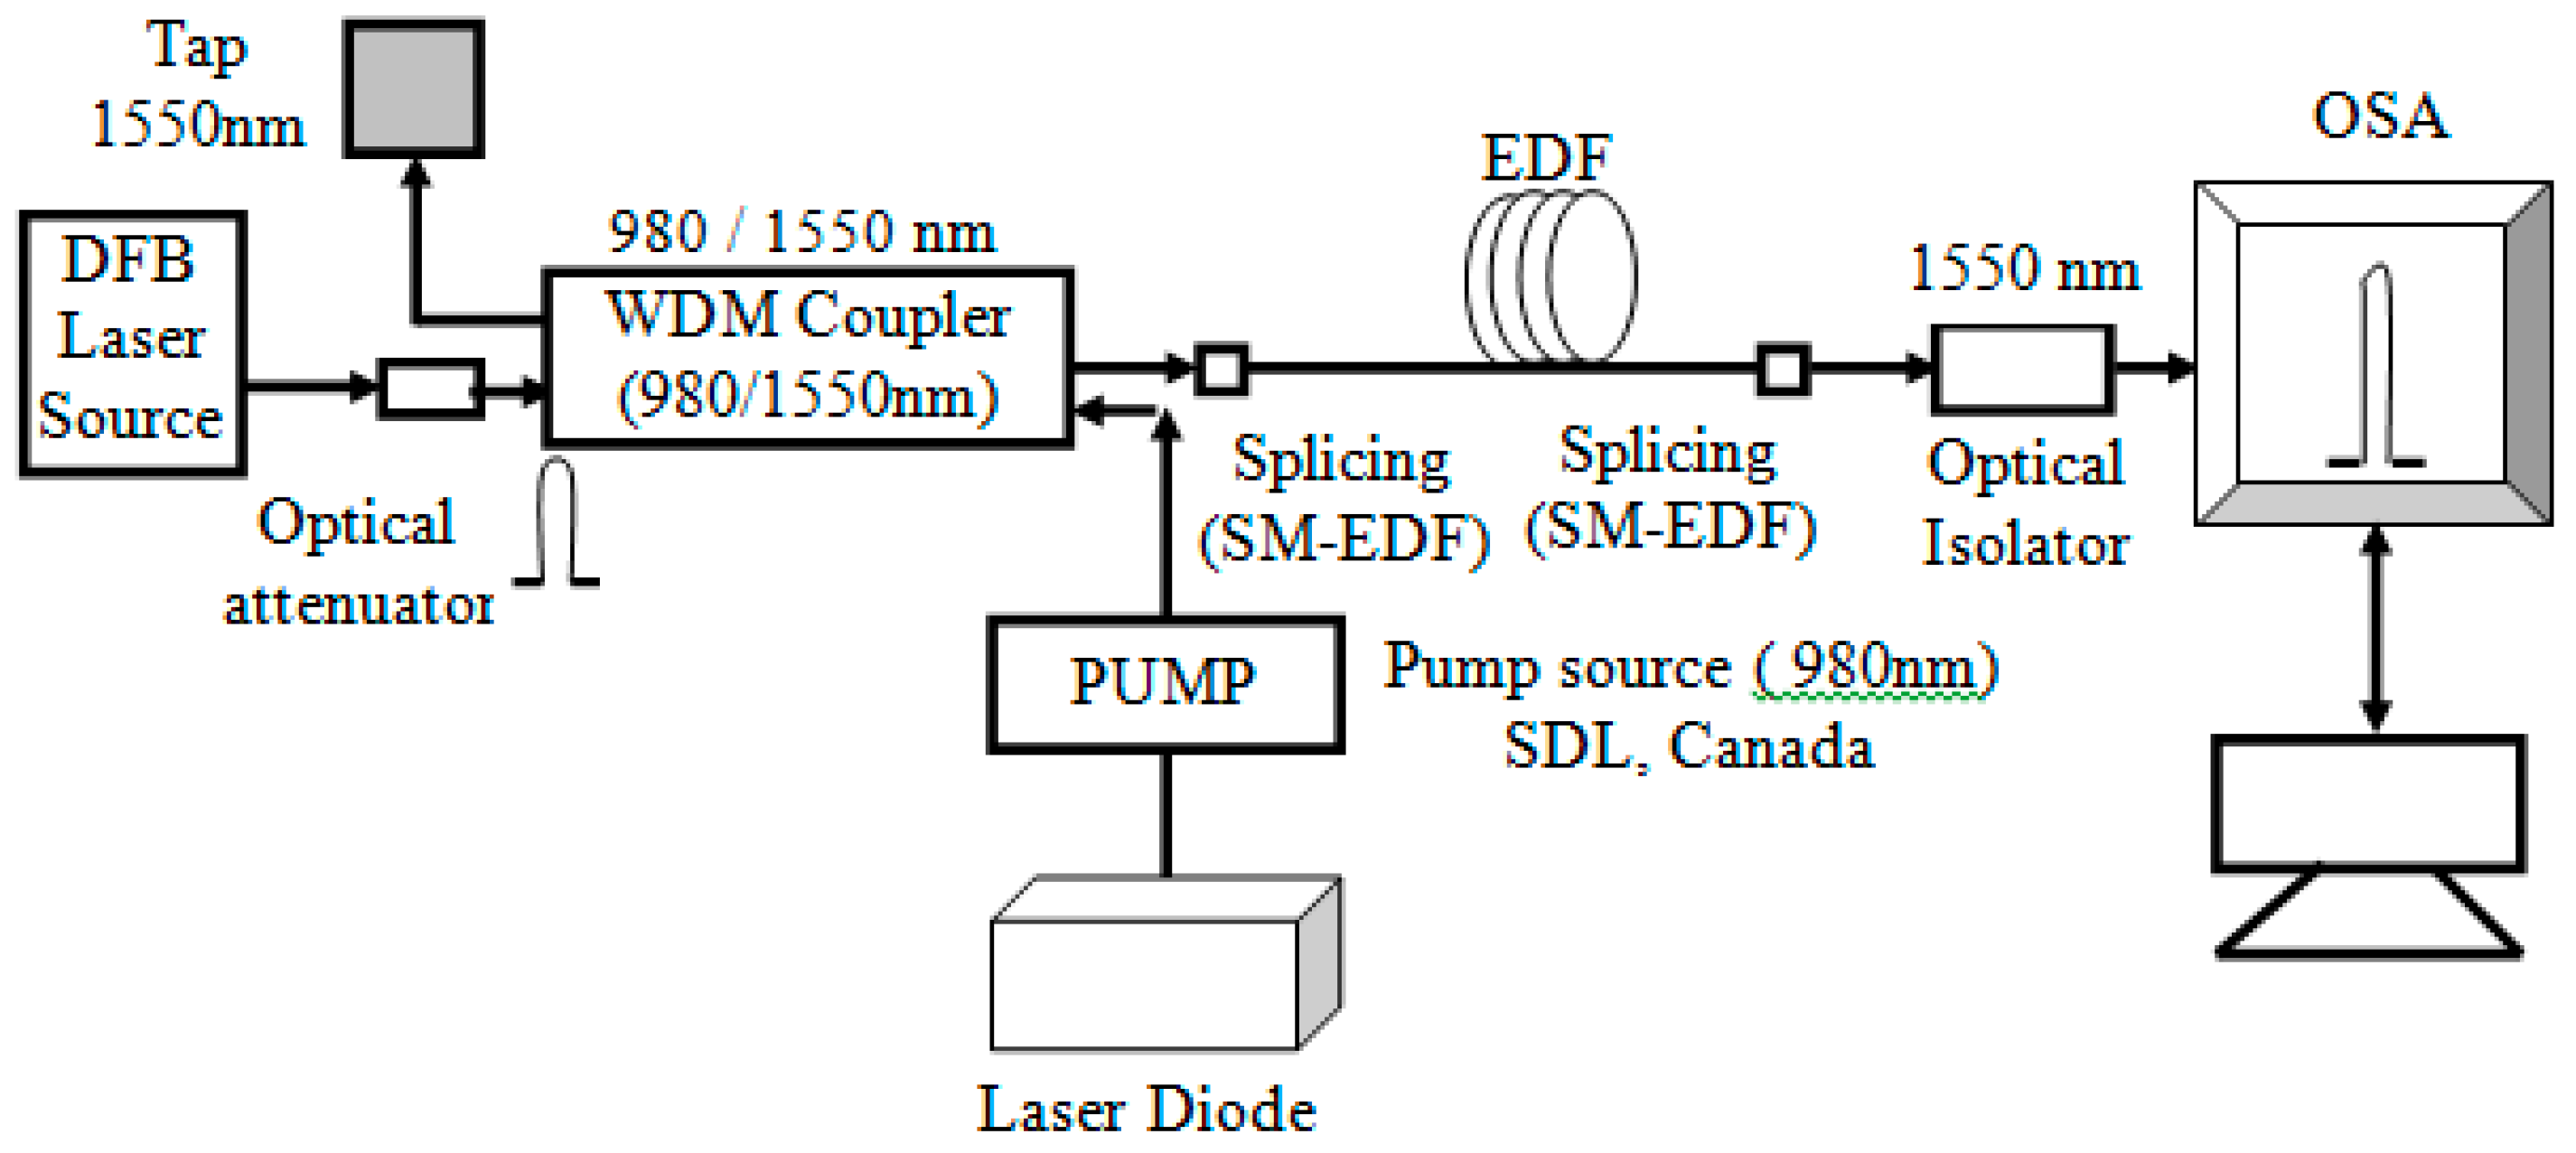
The optical gain spectra of the fabricated EDFs (A1, A2, and A3) were measured within C (1530–1565 nm) band employing a tunable distributed feedback (DFB) laser source under optimized conditions. The input signal level was tuned using an attenuator. The EDF was pumped using a Bragg grating stabilized semiconductor laser diode operating at 980 nm, coupled through 980/1550 nm WDM couplers, as shown in
Figure 8. The length of each fiber was optimized to get the minimum gain difference at constant pump power.
5. Results and Discussion
The phase-separated alumina–silica glass containing at least 4 mol% of Al
2O
3 was achieved by thermal annealing of the fabricated preform below 1900 °C. To maintain the required doping level of Al
2O
3 of at least 4 mol%, the porosity of the unsintered silica layer, along with the strength of the solution of AlCl
3 6H
2O, was optimized. During preform making, no phase separation occurred at the collapsing stage as the glass was heated at around 2300 °C, and no metastable immiscibility arose with rapid cooling to room temperature. To achieve the phase-separated alumina–silica glass, the following two conditions must be satisfied: appropriate doping level of Al
2O
3 and thermal heating treatment in the proper temperature range. To get the phase separation, the minimal doping level of Al
2O
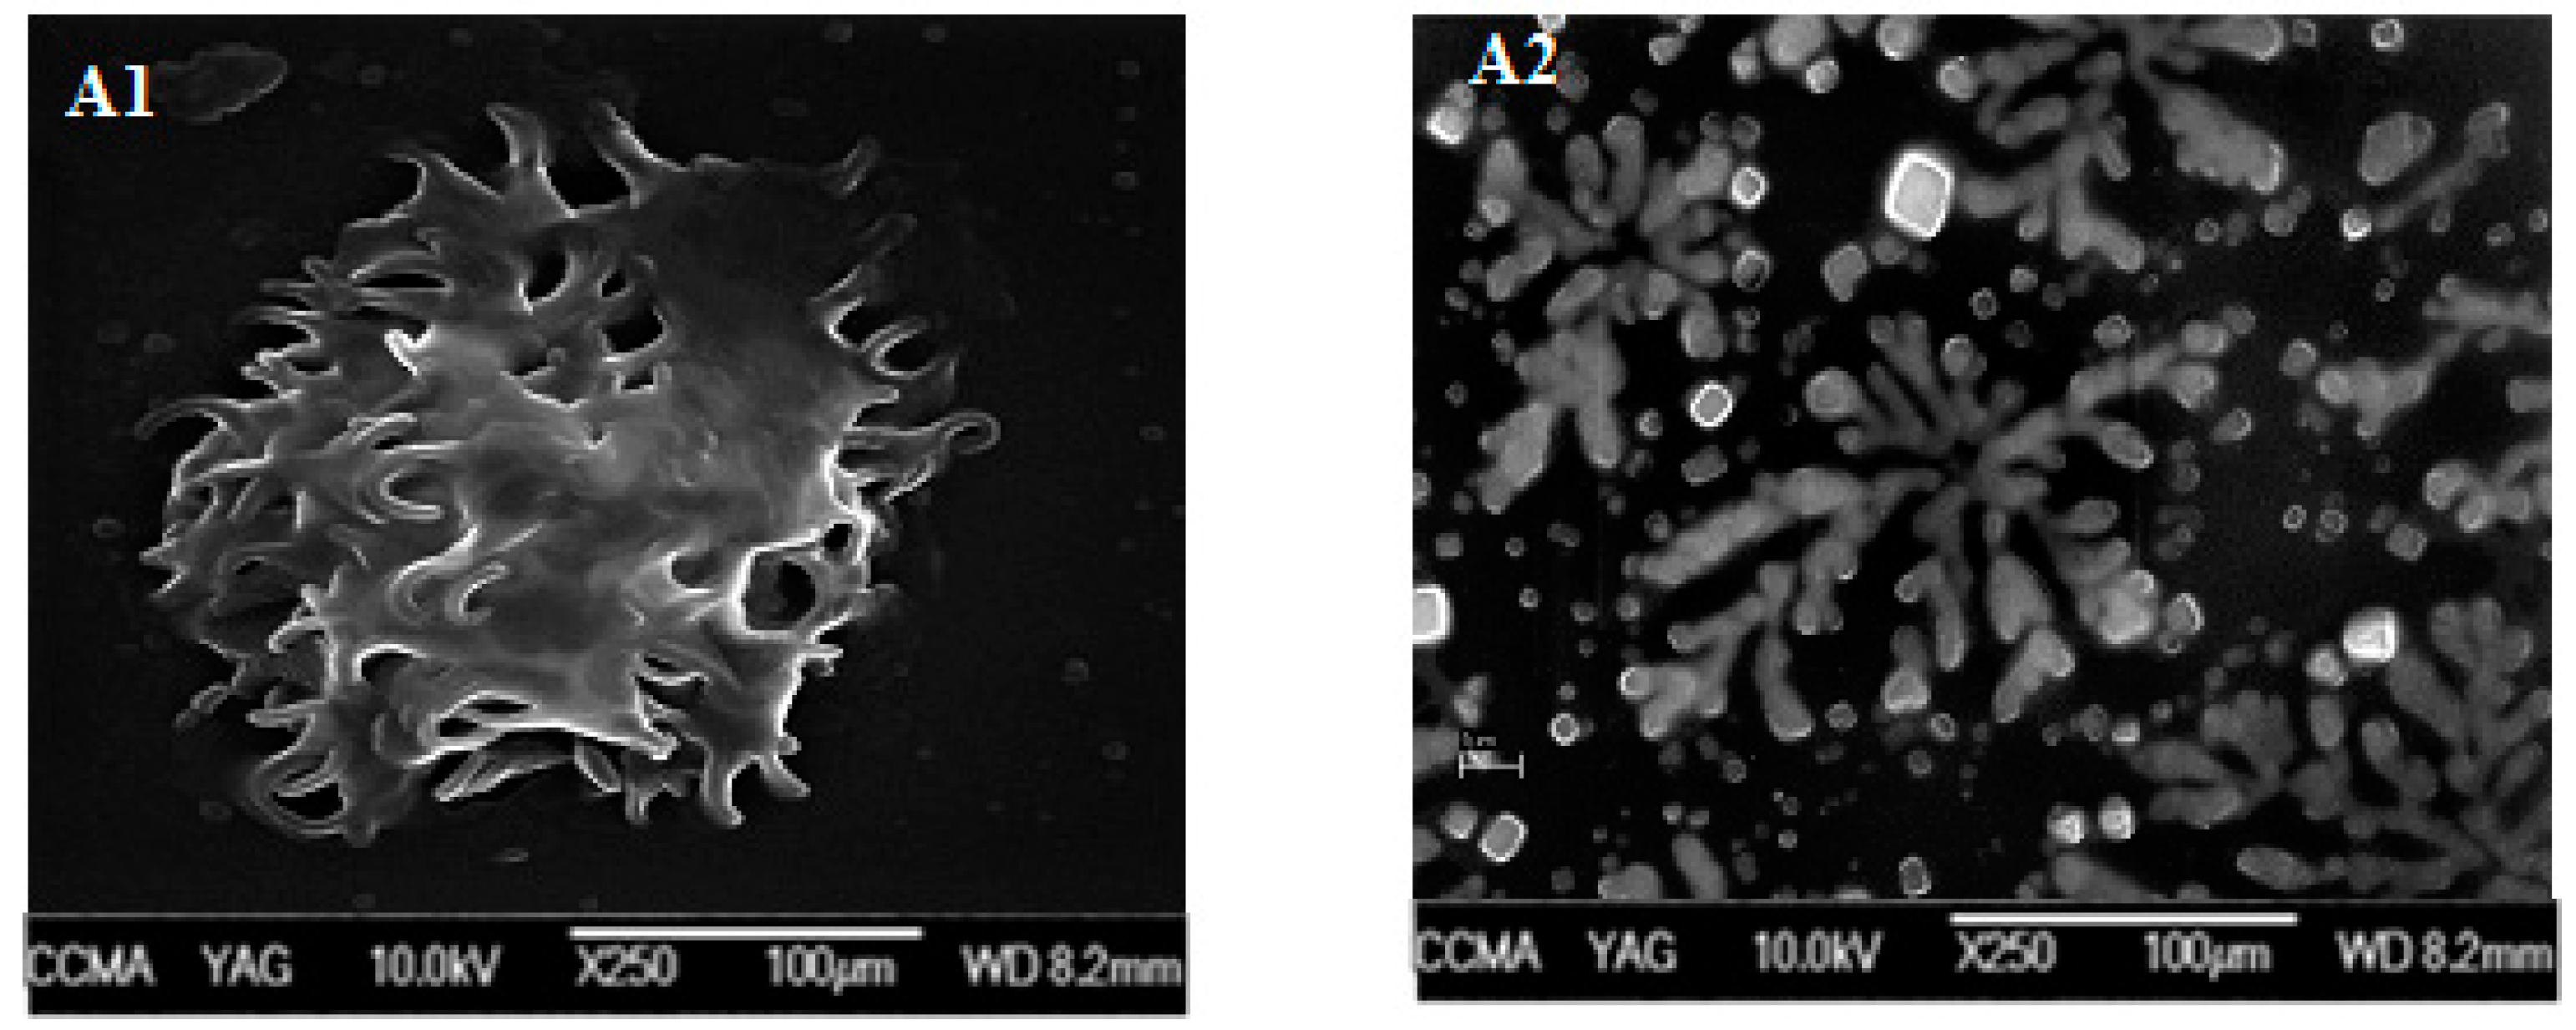
3 should be around 4.0 mol% followed by heating of the preform within the temperature range of 1600−1900 °C. After fabrication, the preform sample was heated around 1600−1900 °C, where the glass formed a metastable immiscibility during fire polishing, resulting in phase separation. However under normal MCVD conditions, the heating period and cooling rate became very low, around 5−8 s and 25−30 °C/s, respectively. The FEGSEM micrographs of two phase-separated alumina–silica-based fiber preform samples (A1 and A2) and the non-phase-separated sample (A3) are given in
Figure 9.
Their microscopic views clearly showed the phase-separated regions. The preform sample A3—containing 3.5 mol% of Al
2O
3 with and without heat treatment within 1600−1900 °C temperature range—did not show any type of phase separation as the glass did not enter into the immiscibility region under this doping level of Al
2O
3 at any temperature. The microscopic picture of such a preform sample is shown in
Figure 9. The fibers A1 and A2 were drawn from the phase-separated preforms melted below 1900 °C so that the doping host senses the temperature below 1700 °C to retain the phase separation within the core of the fiber. The FEGSEM micrograph (
Figure 10) of two such large bare-fiber sections clearly showed the retention of the phase-separation phenomenon in samples A1 and A2. On the other hand, the fiber drawn from the same preform A2 melted at 2100 °C did not produce phase-separated glass (see
Figure 11) as the doped core glass matrix reached temperatures above the upper temperature limit of the immiscibility region. The fiber drawn from the non-phase-separated preform (A3), containing 3.5 mol% of Al
2O
3 melted below 1900 °C, did not show any phase separation as the doping level was below the minimum required level of the immiscibility region.
As a result, EDF drawn below 1900 °C from the phase-separated alumina–silica glass-based optical fiber preform containing at least 4.0 mol% doping level of Al
2O
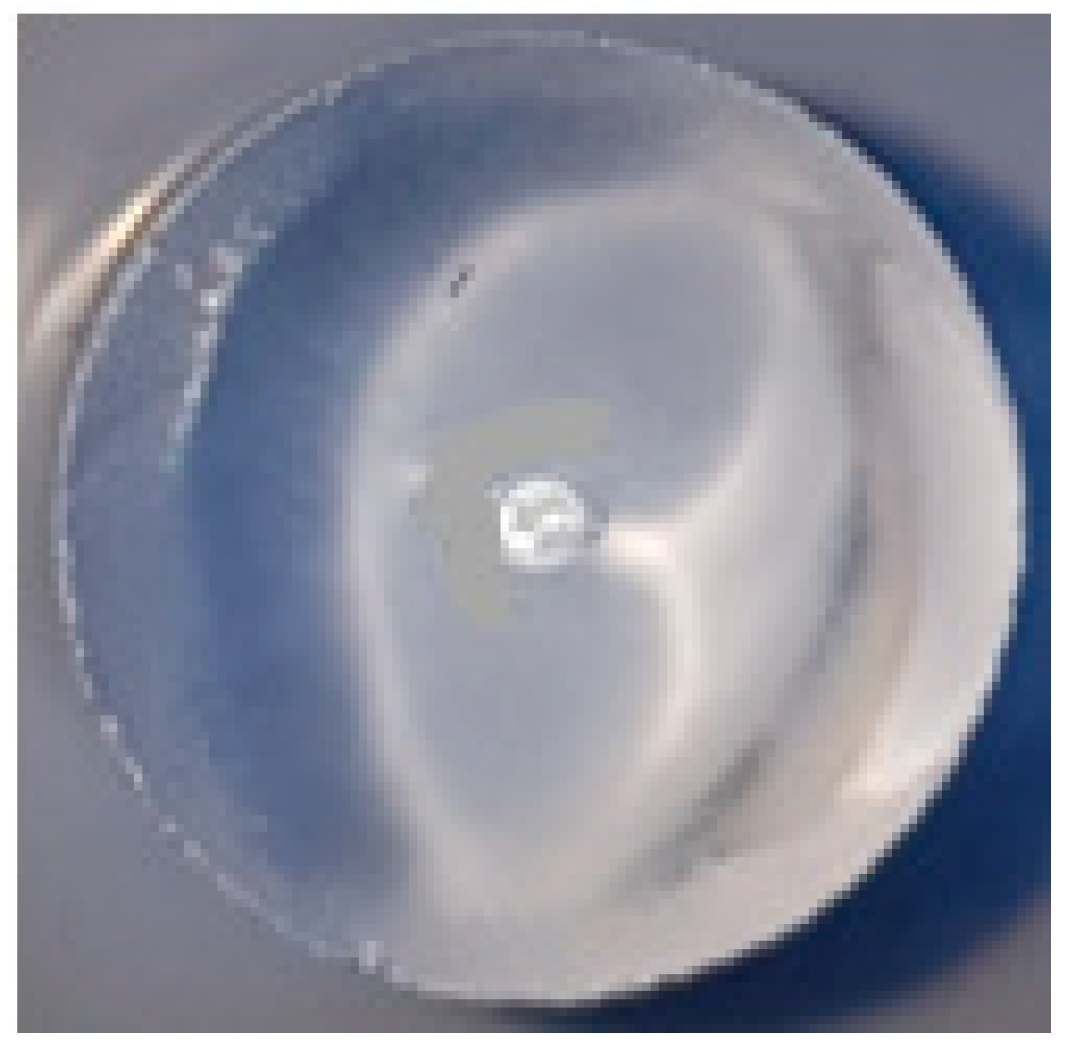
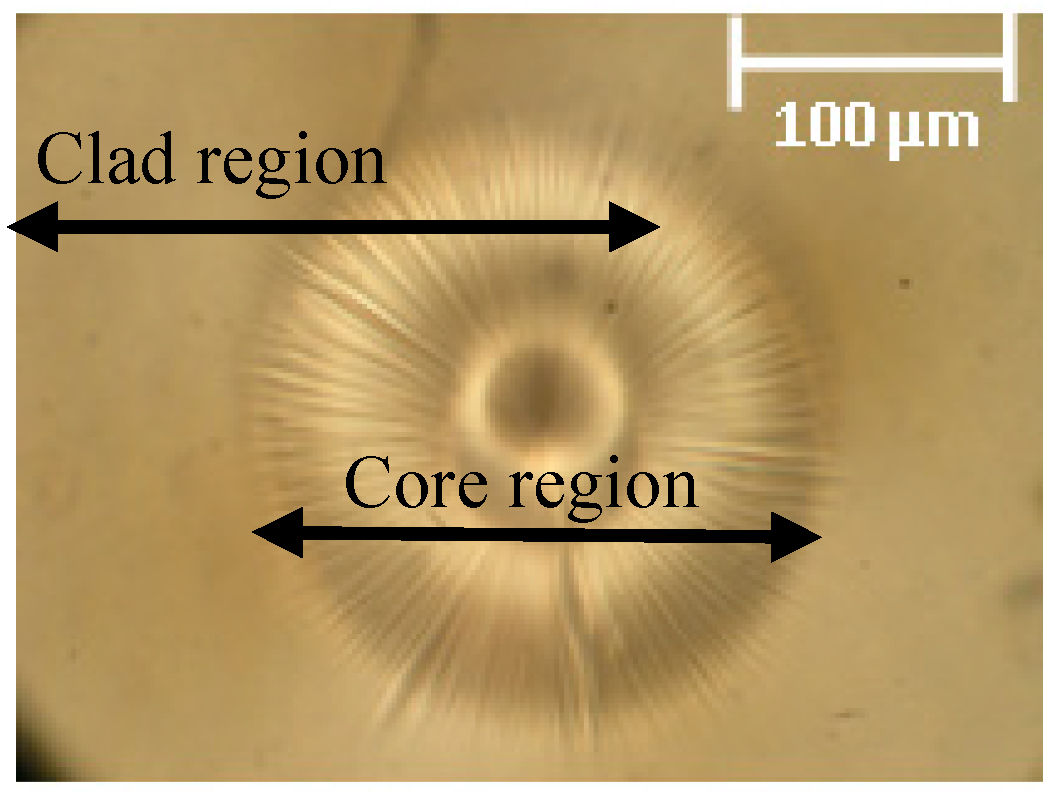
3 retained the phase-separation phenomenon within the core glass matrix. The core–clad boundary of the fabricated fiber made using the solution doping process generally exhibited some imperfection when the core–clad viscosities differed substantially from each other. This resulted in excess loss attributed to scattering at the core–cladding interface and reduced the pump efficiency of the fiber. Incorporation of high content of Al
2O
3, for increasing the solubility of Er
3+ ions in germanium–silica glass, generated another problem of imperfection like a star pattern at the core–clad boundary from significant viscosity differences developed during the collapsing stage [
26,
27,
28]. It is known that the viscosity of pure SiO
2glass becomes higher than that of a GeO
2–Al
2O
3–Er
2O
3 mixture with SiO
2 content of 85−90 mol%. A large viscosity difference between the core and cladding glass produces high chemical potential differences and results in diffusion of the core glass into the cladding glass. These types of imperfections were found in some of the Er
2O
3-doped germanium–alumina–silica glass preform sections, as presented in
Figure 12. On the other hand, such core–clad imperfections were substantially reduced in the case of Er
2O
3-doped alumina–silica optical fiber preform section shown in
Figure 6. These imperfections, in the case of Er
2O
3-doped germanium-alumina silica glass fiber preform, developed from the local change of viscosity in the vicinity of the core–clad interface, which arose during deposition of porous SiO
2–GeO
2 layer. However, in the case of Er
2O
3-doped alumina–silica glass fiber preform, the local viscosity change near the core–clad interface during deposition of pure porous silica layer became much less.
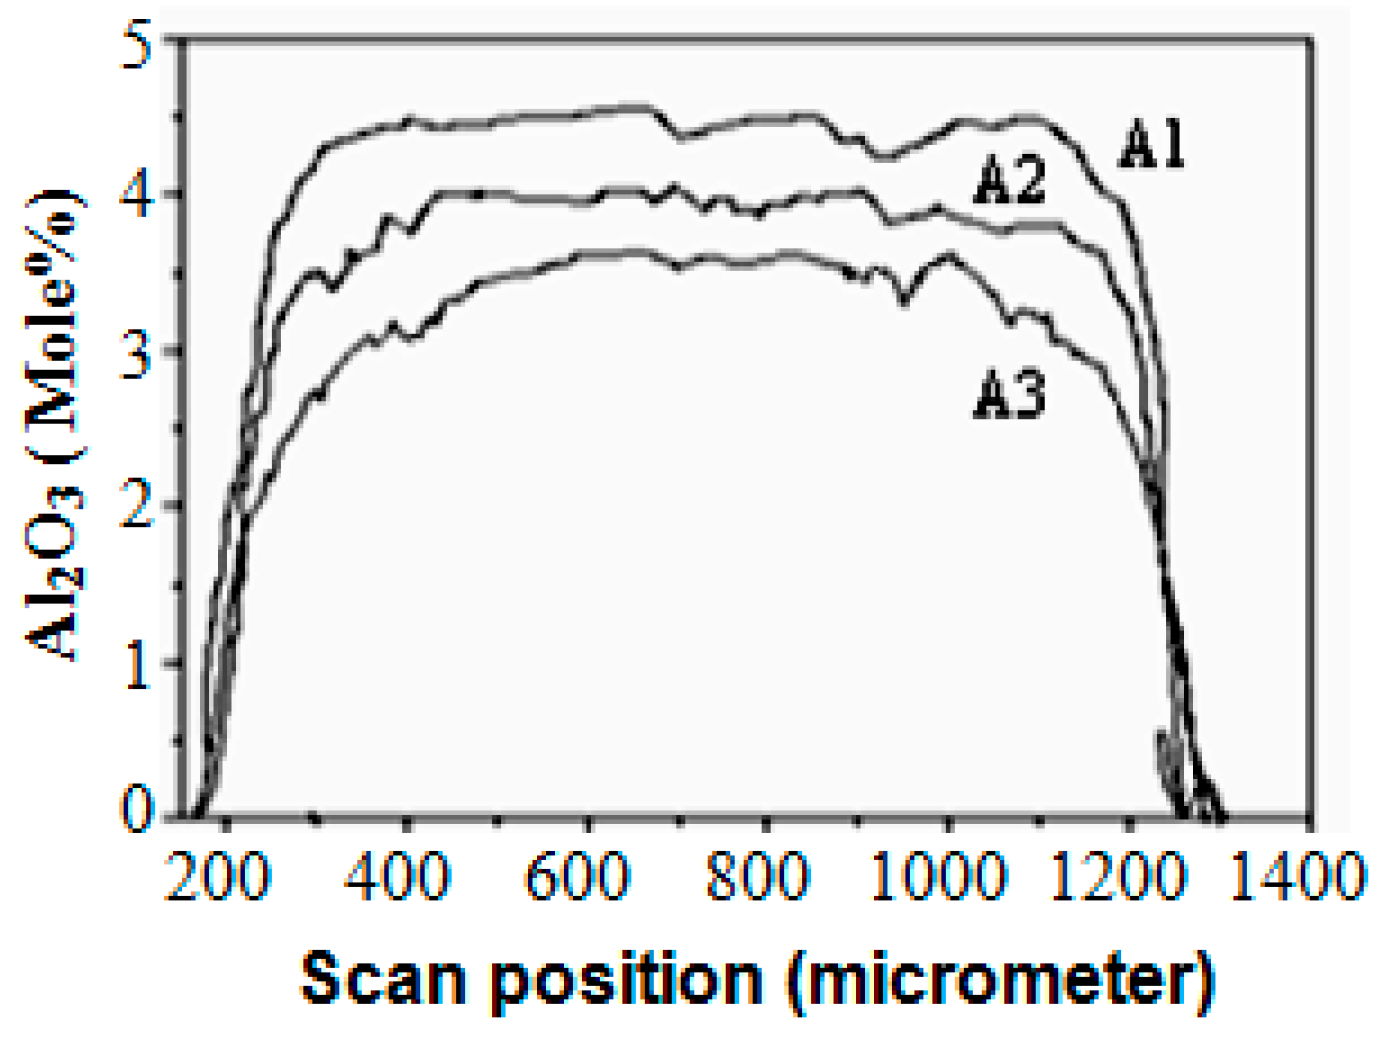
The content of Al
2O
3 in the three fiber preform samples (A1, A2, and A3) was found to be distributed uniformly along their whole diameter region, as shown in
Figure 13. The nature of their RIPs, as shown in
Figure 7, was found to be very sharp, without the formation of any central dip arising from evaporation of the index-raising elements as gaseous mono-oxide species during the collapsing stage. As the vapor pressure of AlO
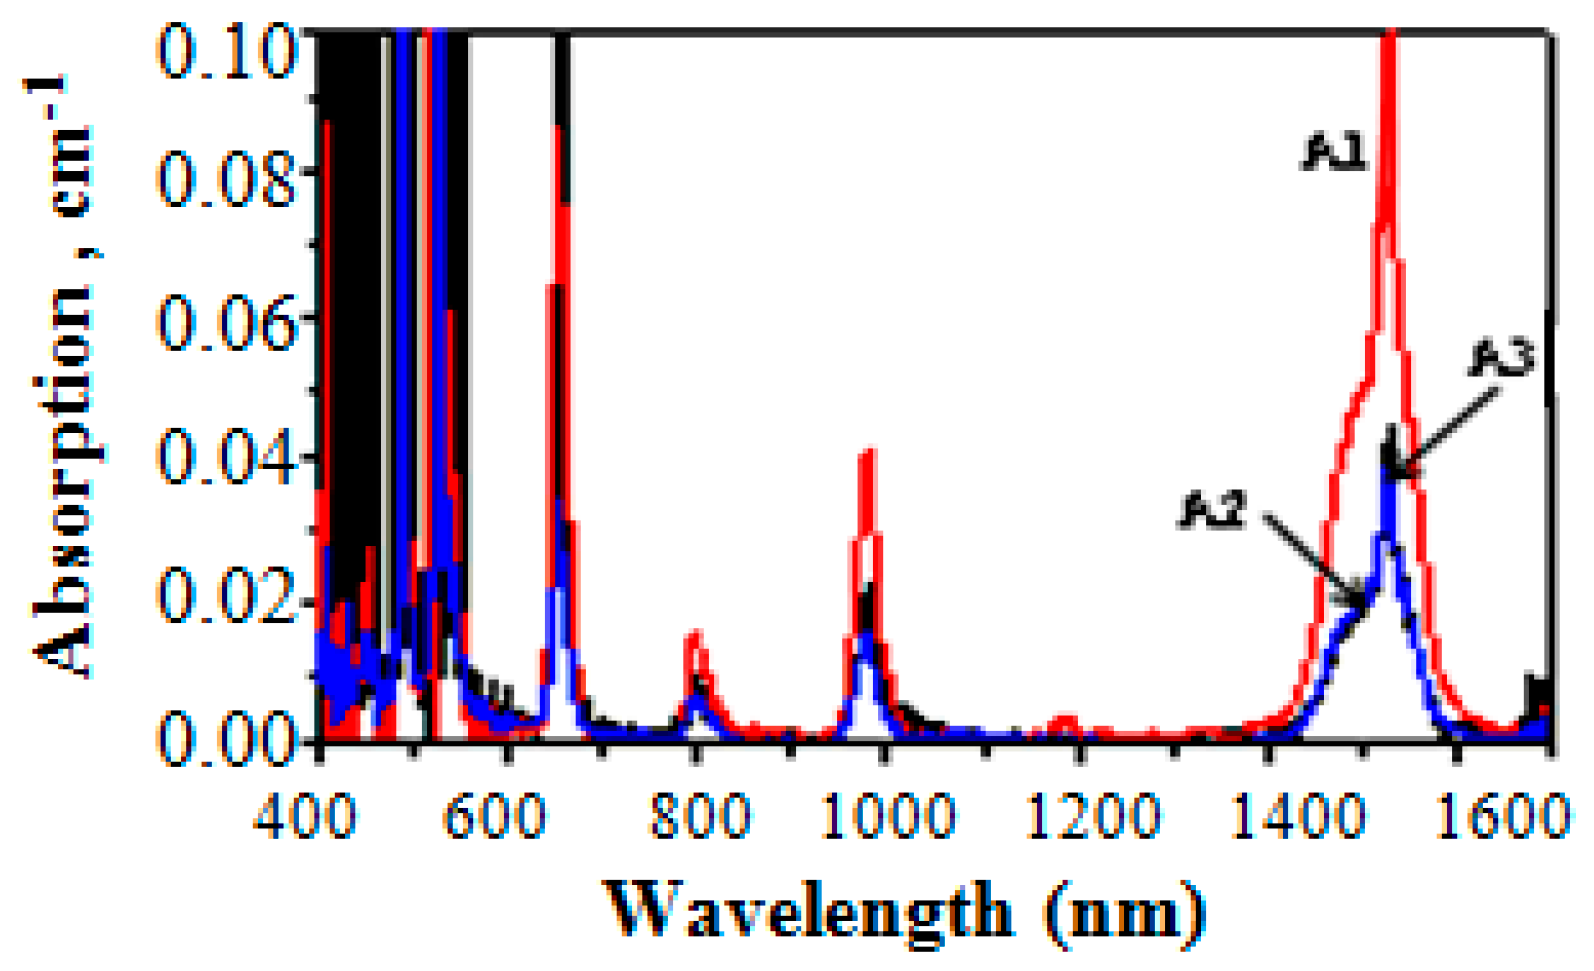
x species is very low, even at high temperatures, no central dip will be generated. The optical absorption spectra of three EDFs based on phase-separated and non-phase-separated alumina–silica glass hosts are shown in
Figure 14. The absorption coefficient of A1 became higher than that of other two EDFs (A2 and A3), which indicates the higher doping level of Er
2O
3 of EDF A1 compared to the other ones.
The Al
2O
3 content of the three preform samples—A1, A2, and A3—was found to be 4.5, 4.0, and 3.5 mol%, respectively, with corresponding concentrations of 0.075, 0.073, and 0.074 mol% Er
2O
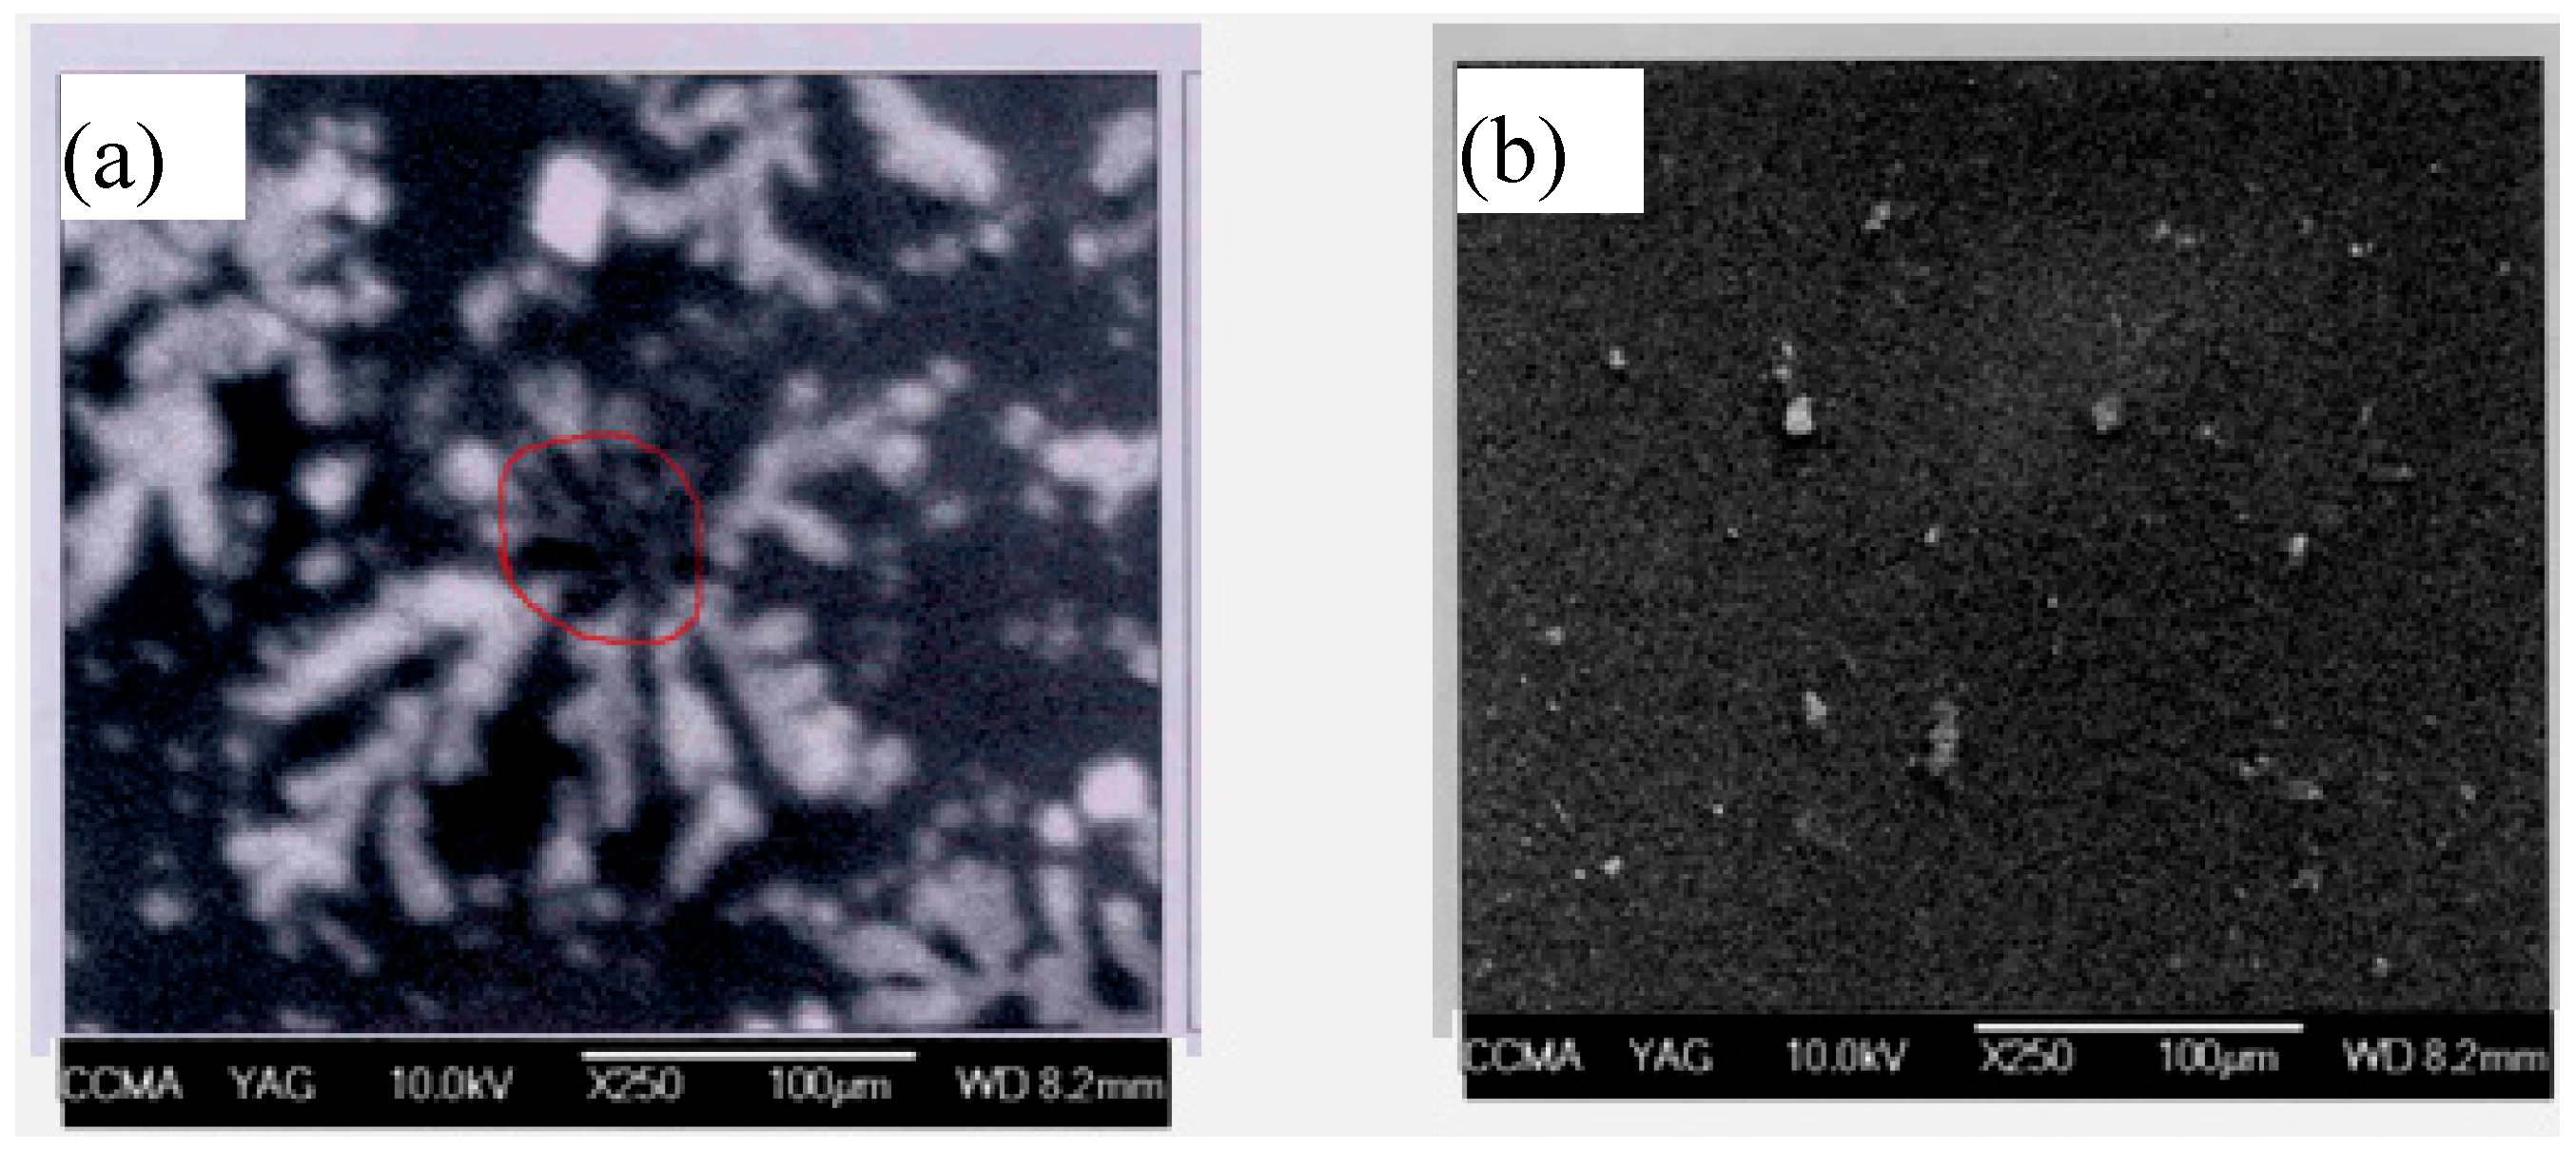
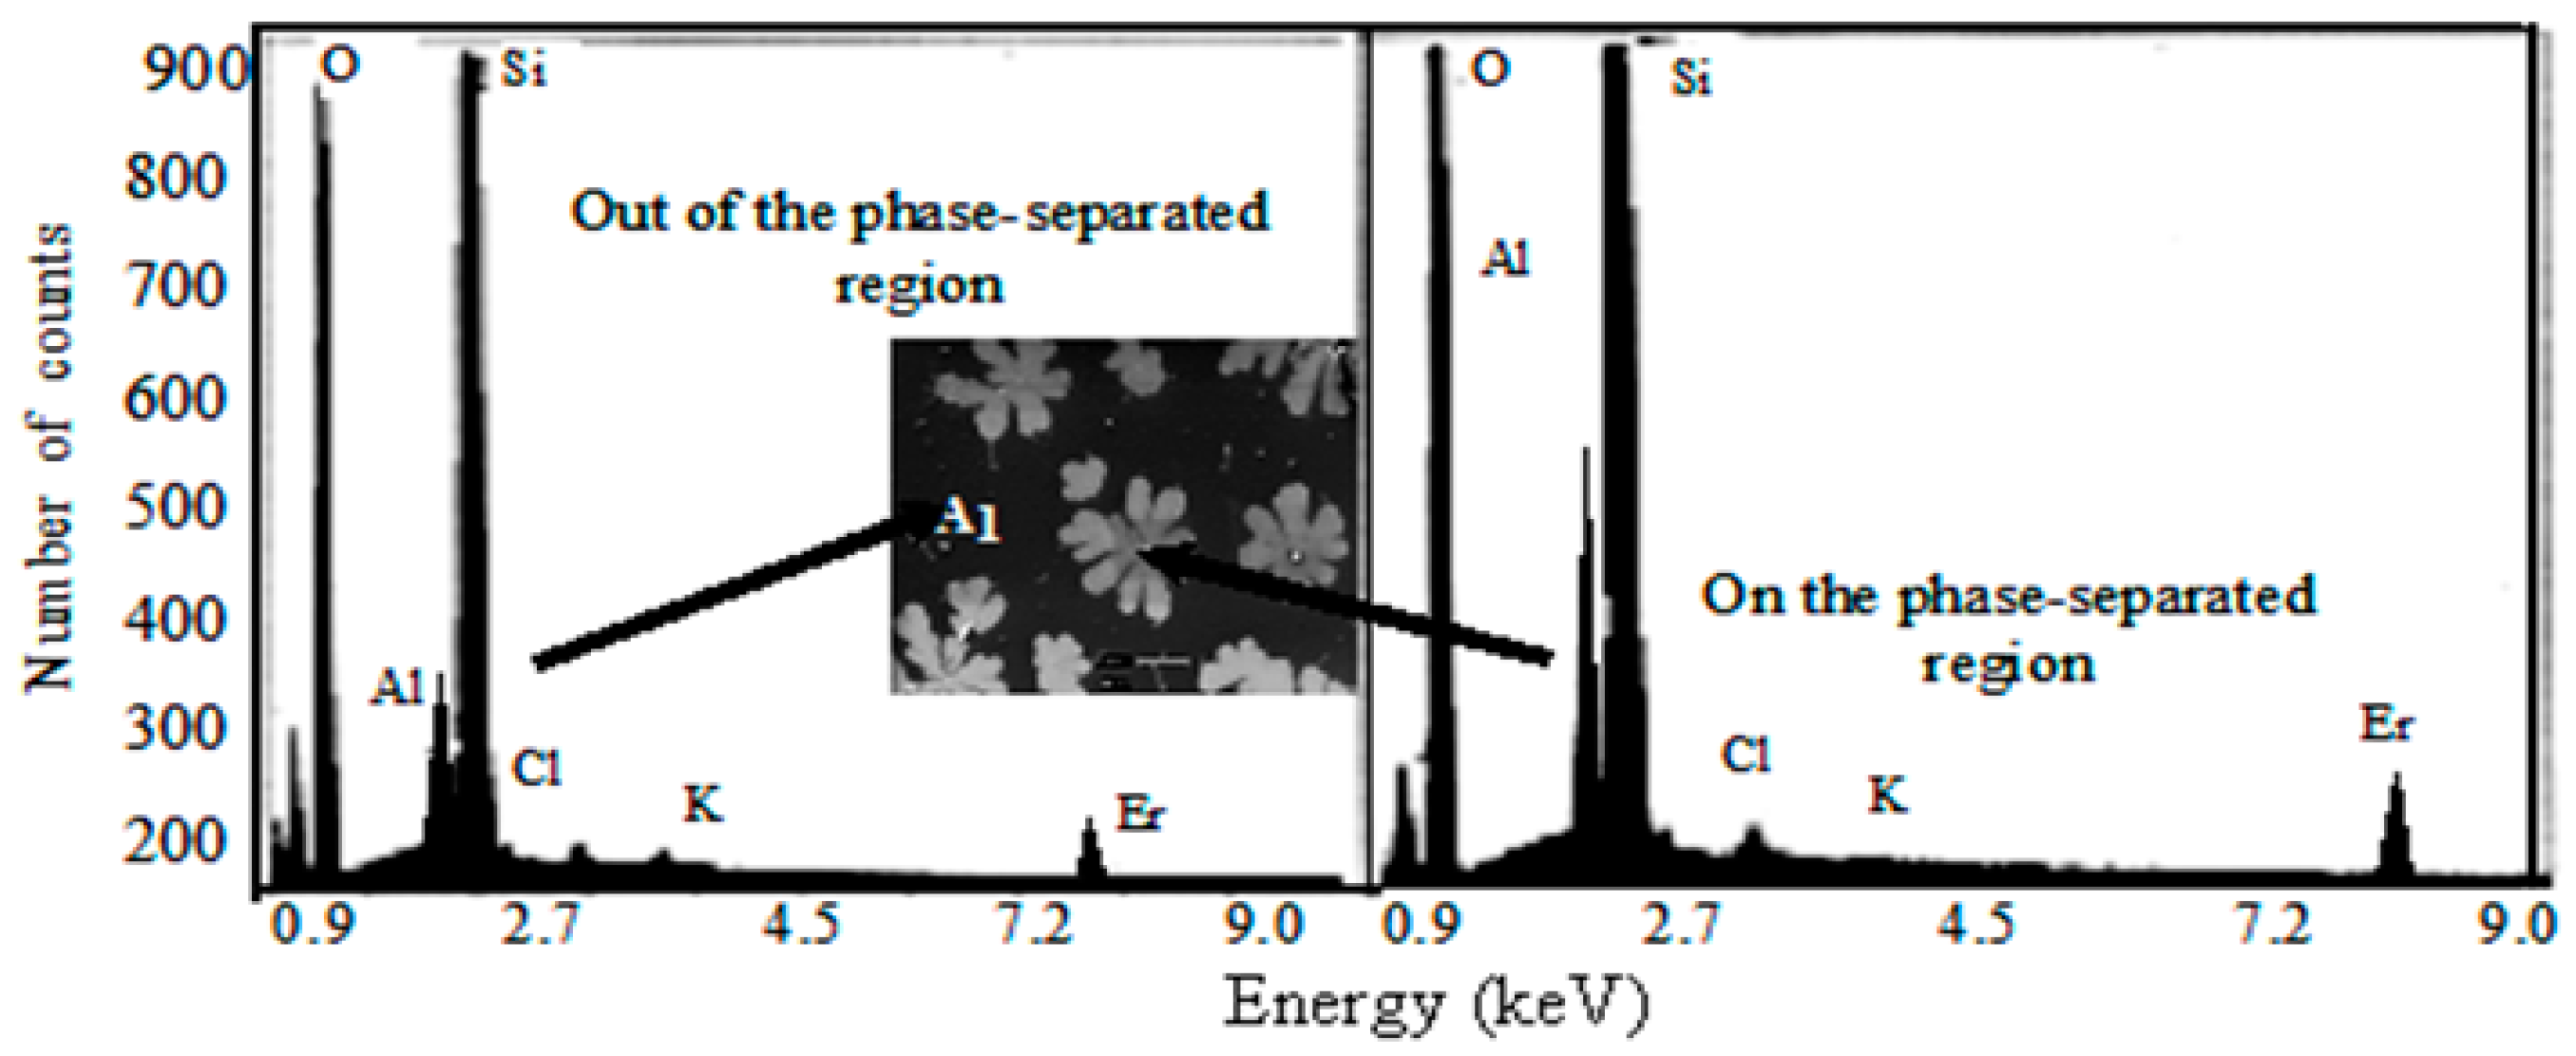
3. The nature, as well as the composition, of the phase-separated alumina–silica fiber preform samples was evaluated by EDX, followed by XRD analyses. A1, containing 4.5 mol% Al
2O
3, clearly showed the phase-separated region, whereas sample A3 did not form any phase-separated region within the core glass matrix. Sample A2 also formed the phase-separated region. The EDX data taken in and outside of the phase-separated region of fiber preform A1, as shown in
Figure 15, clearly revealed that the content of Al
3+ and Er
3+ in the phase-separated region became larger compared to the non-phase-separated region. The corresponding XRD data, shown in
Figure 16, indicated that the phase-separated region did not contain any crystalline phases of Al
2O
3 or the ErAl
3O
6 complex.
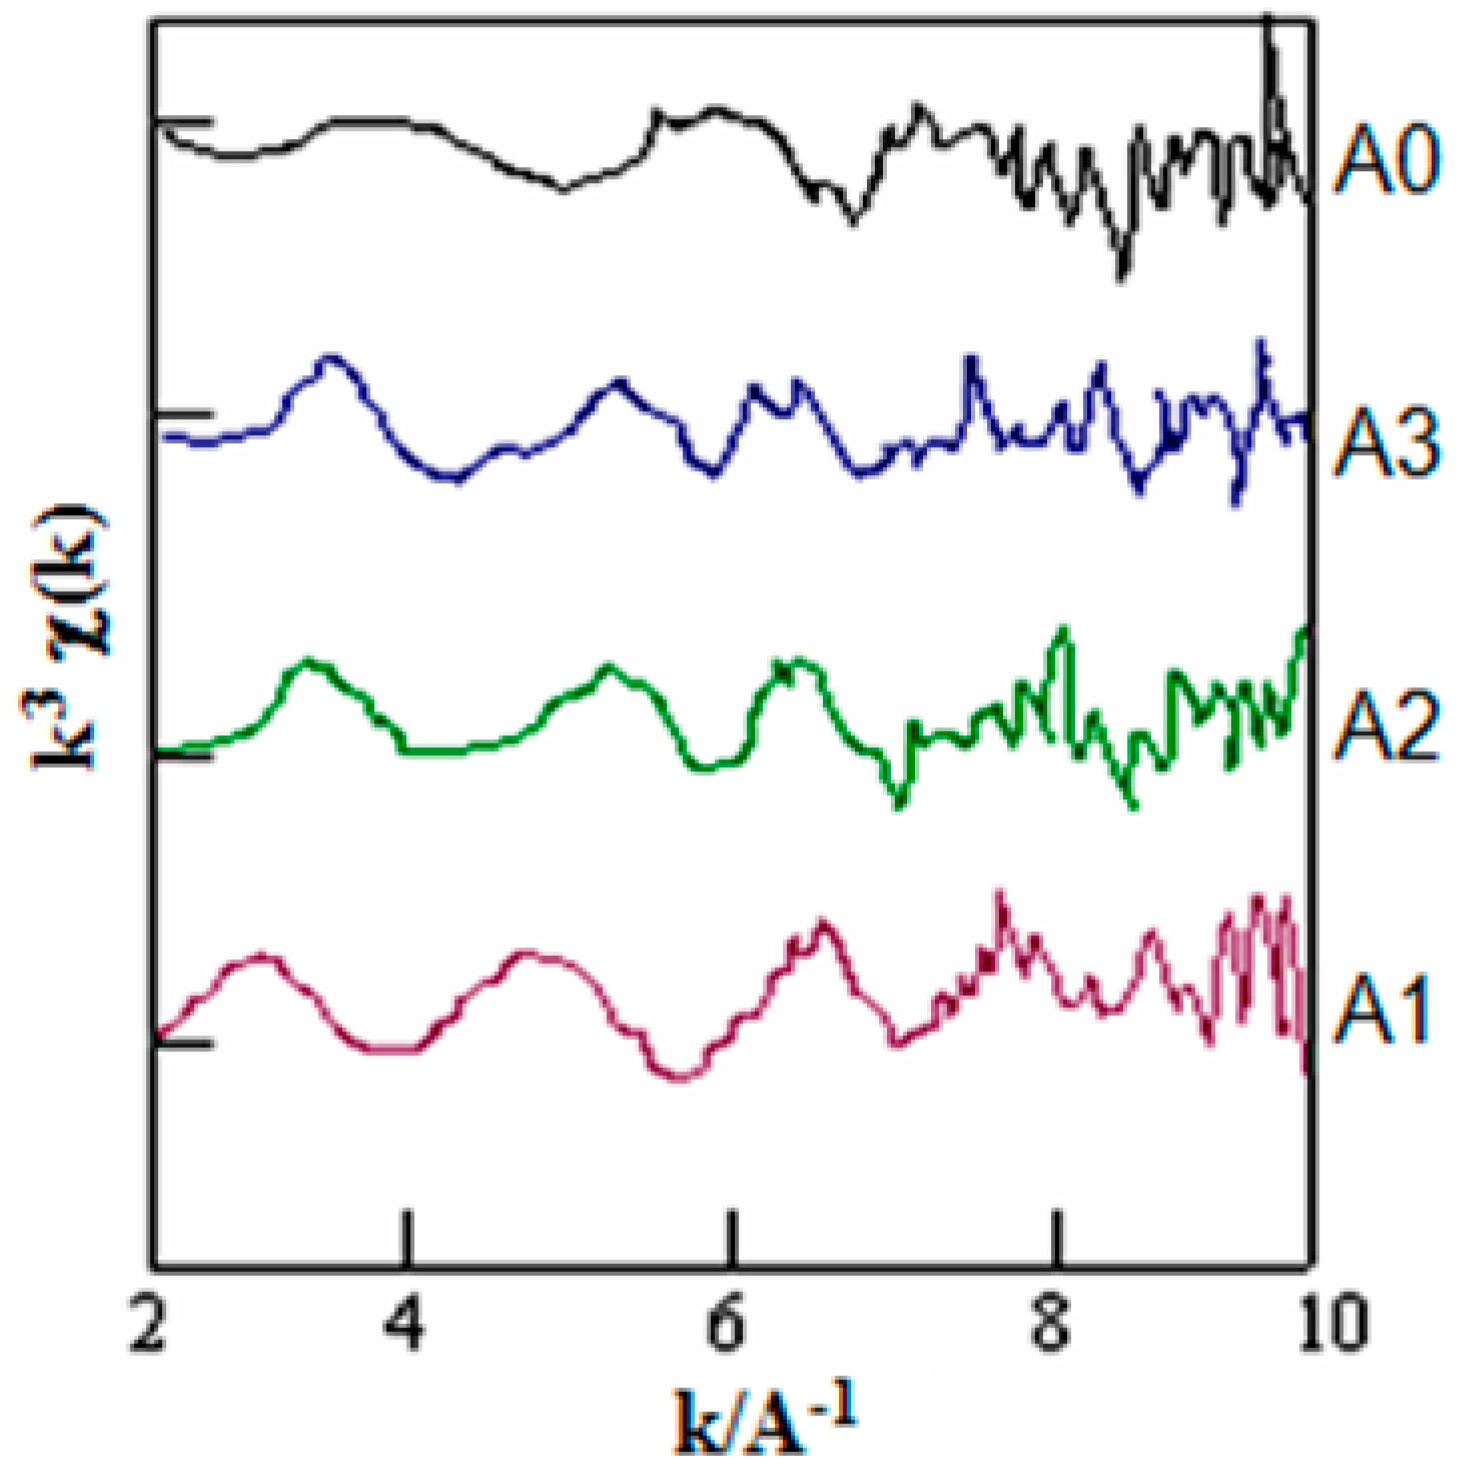
The EXAFS data of EDFs containing different amounts of Al
2O
3 are shown in
Figure 17. From the EXAFS analyses, a clear oscillation structure was observed until approximately 8 in k-space for the different Er
2O
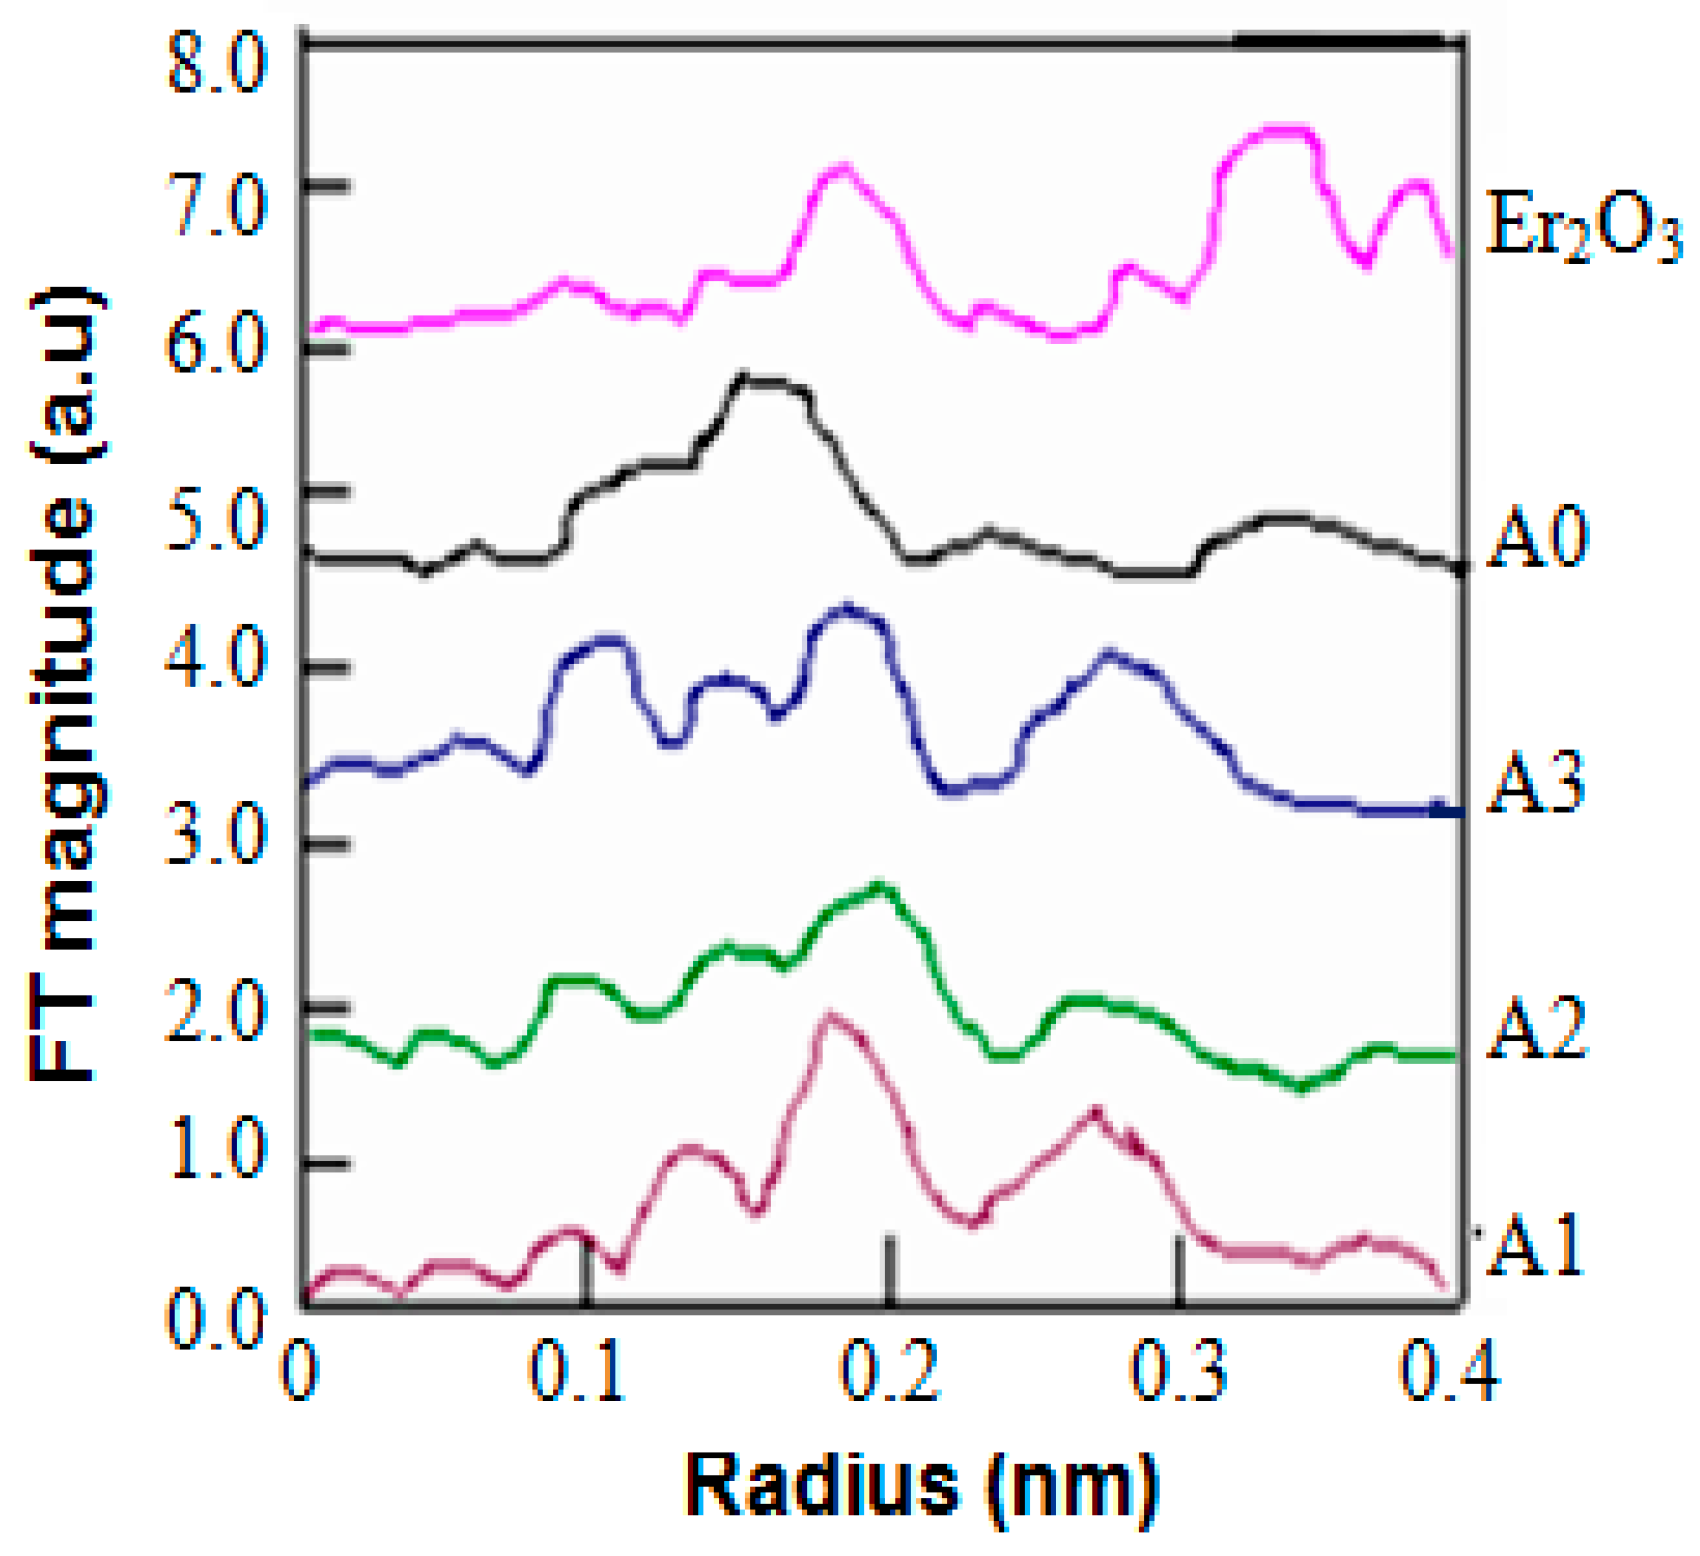
3-doped fiber preform samples, which provided sufficient information to achieve details regarding the nearest-neighbor atom structure. The radial distribution functions of three EDFs (A1, A2, and A3) containing different contents of Al
2O
3 and Er
2O
3, along with one EDF sample without Al
2O
3 (A0), are shown in
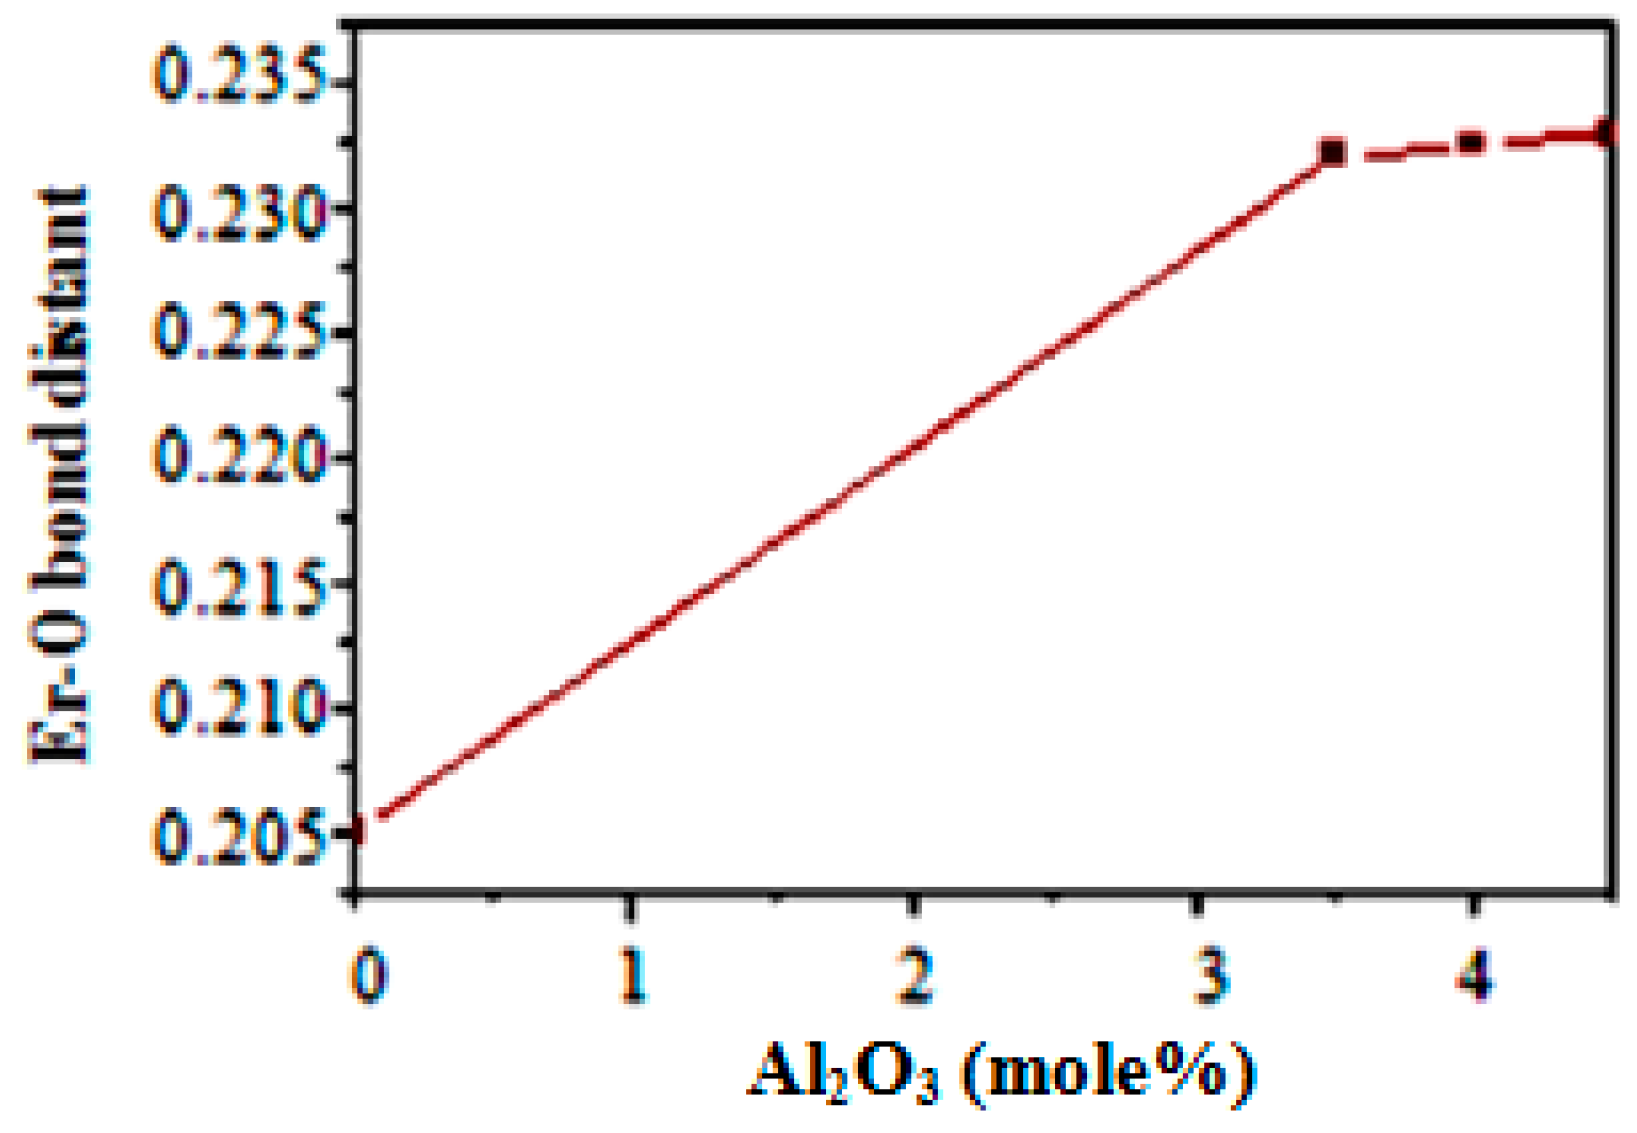
Figure 18. From these analyses, it can be concluded that Er–O bonding existed at approximately 0.2 nm in samples A0, A1, A2, A3, and Er
2O
3. However, the Er–O distance in sample A0 was shorter compared to the other samples. The effect of doping of Al
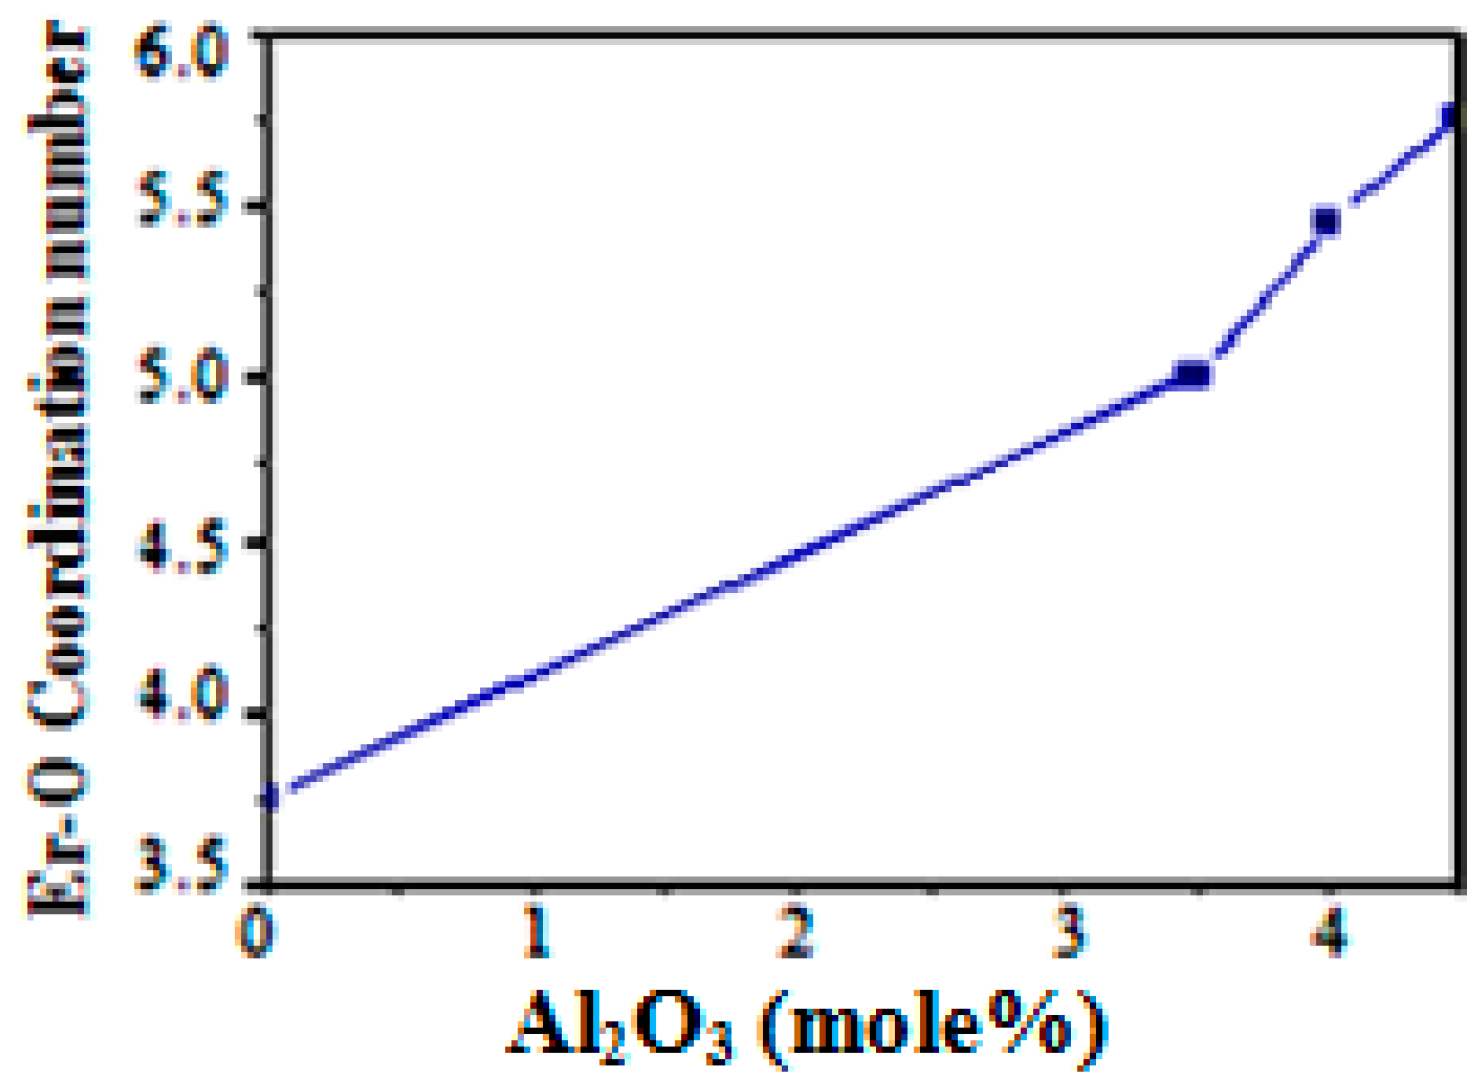
2O
3 on Er
3+ ion coordination number is shown in
Figure 19. The coordination number of Er
3+ ions of EDF (A0) without doping of Al
2O
3 was found to be around 3.75. The effect of Al
2O
3 on Er–O bond distance is shown in
Figure 20. The Er–O bond distance of EDF (A0) without doping of Al
2O
3 was found to be around 0.205 nm.
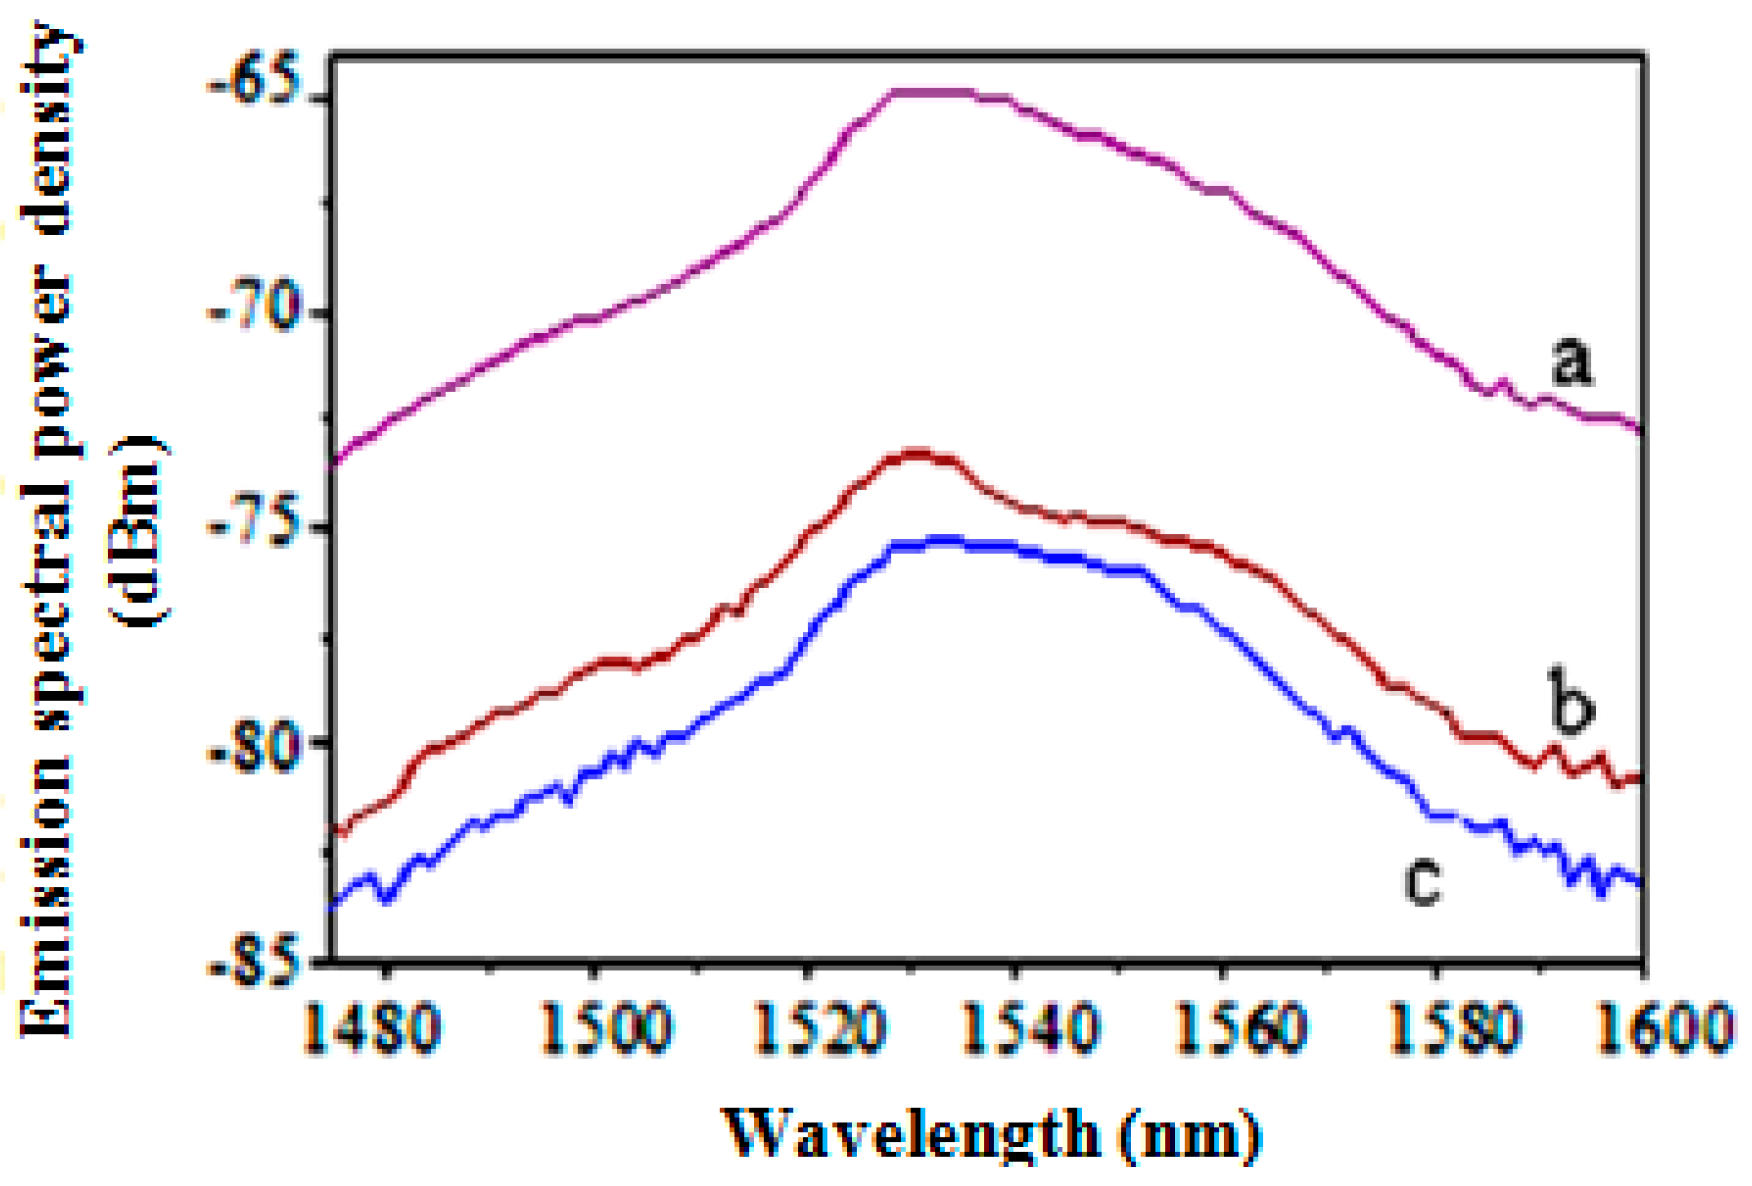
The phase-separated EDFs (A1 and A2) showed improved spectral broadening of the
4I
13/2−
4I
15/2 transition versus that of the non-phase-separated EDF (A3), as shown in
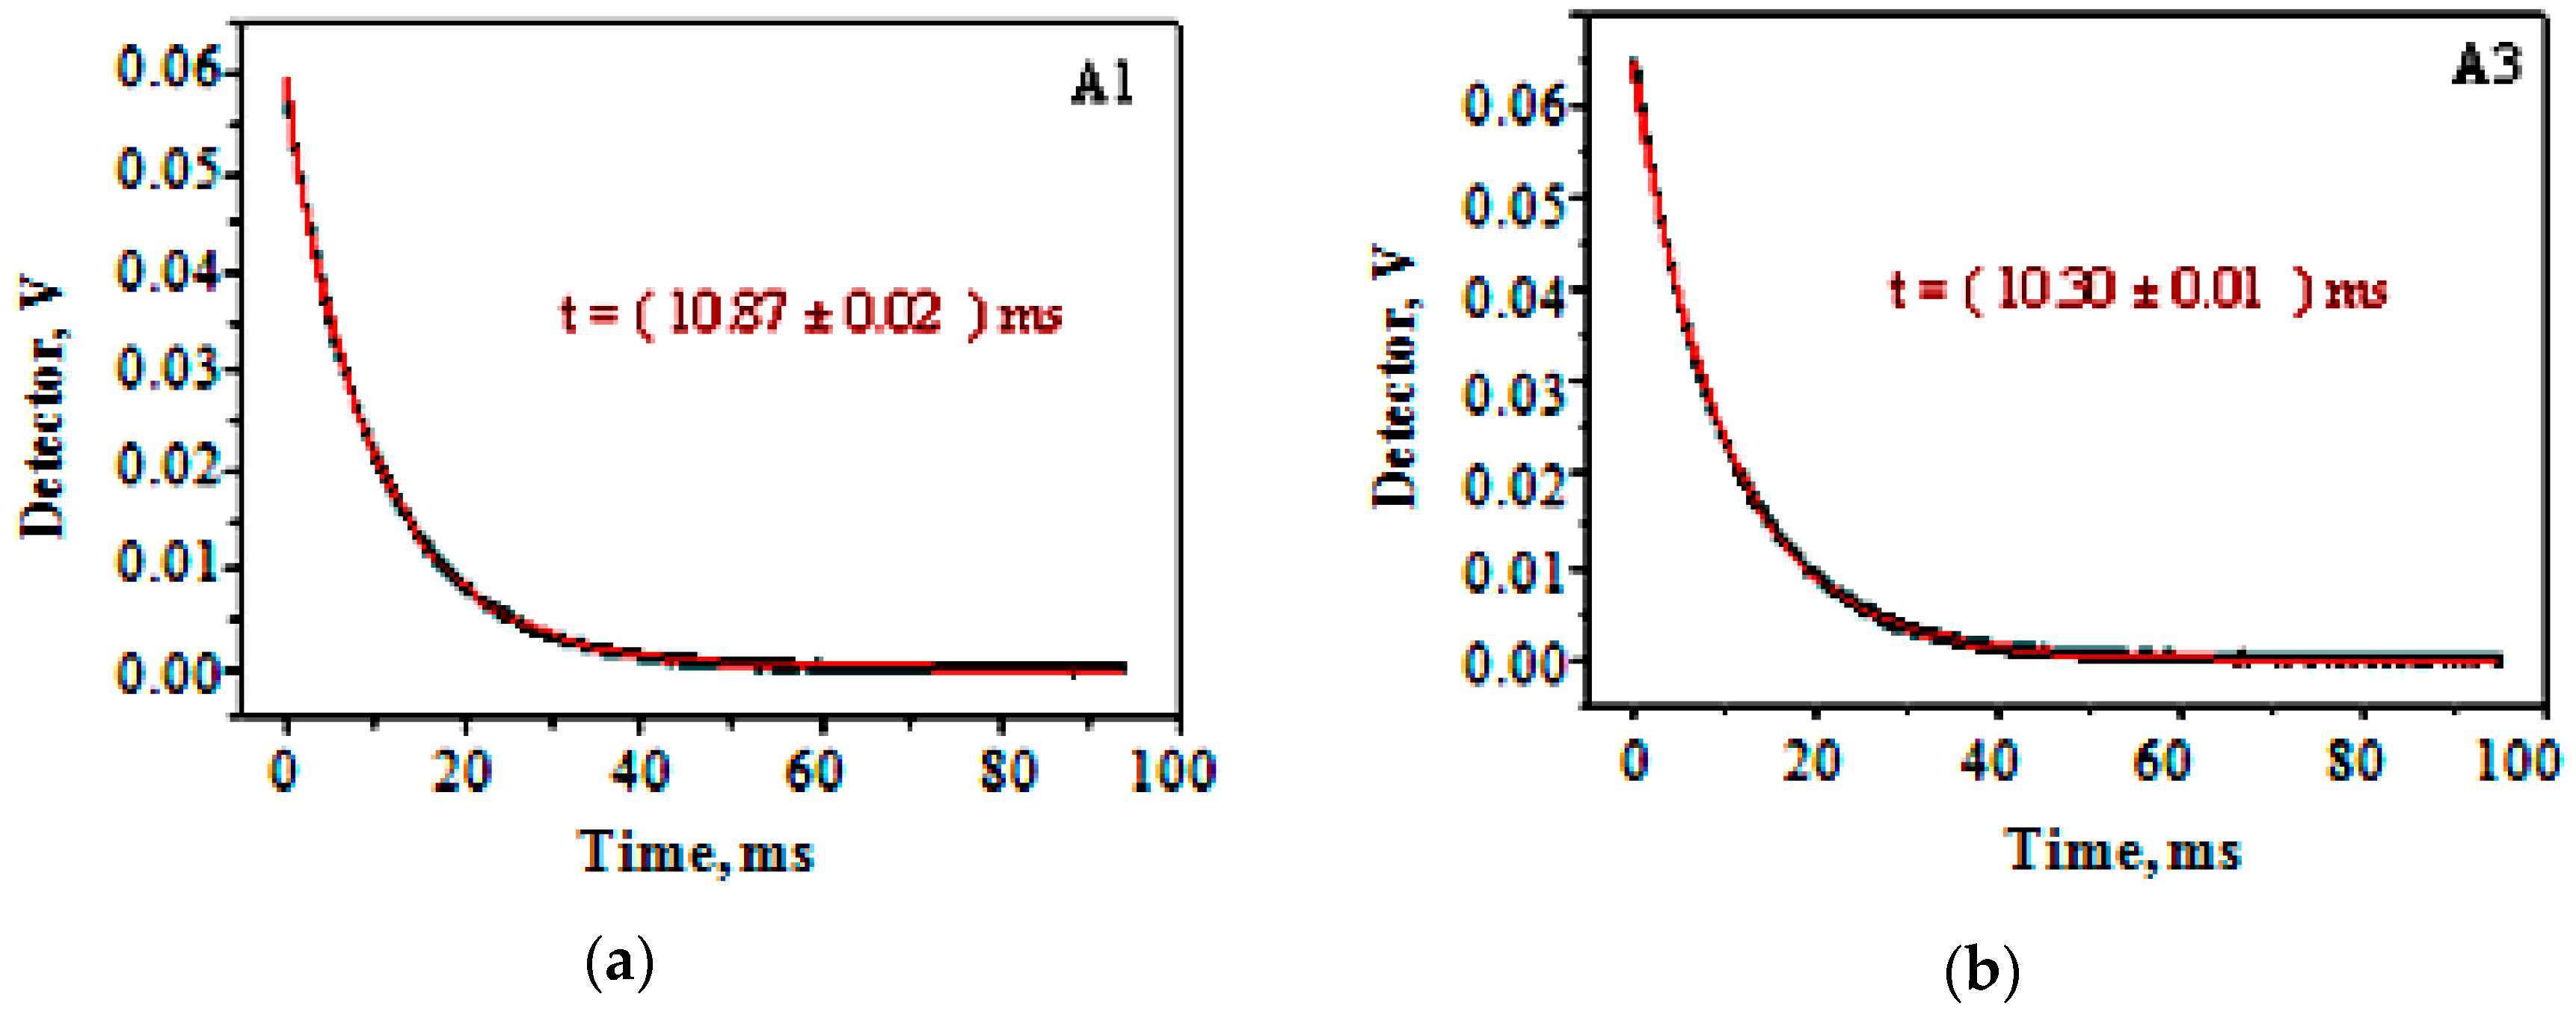
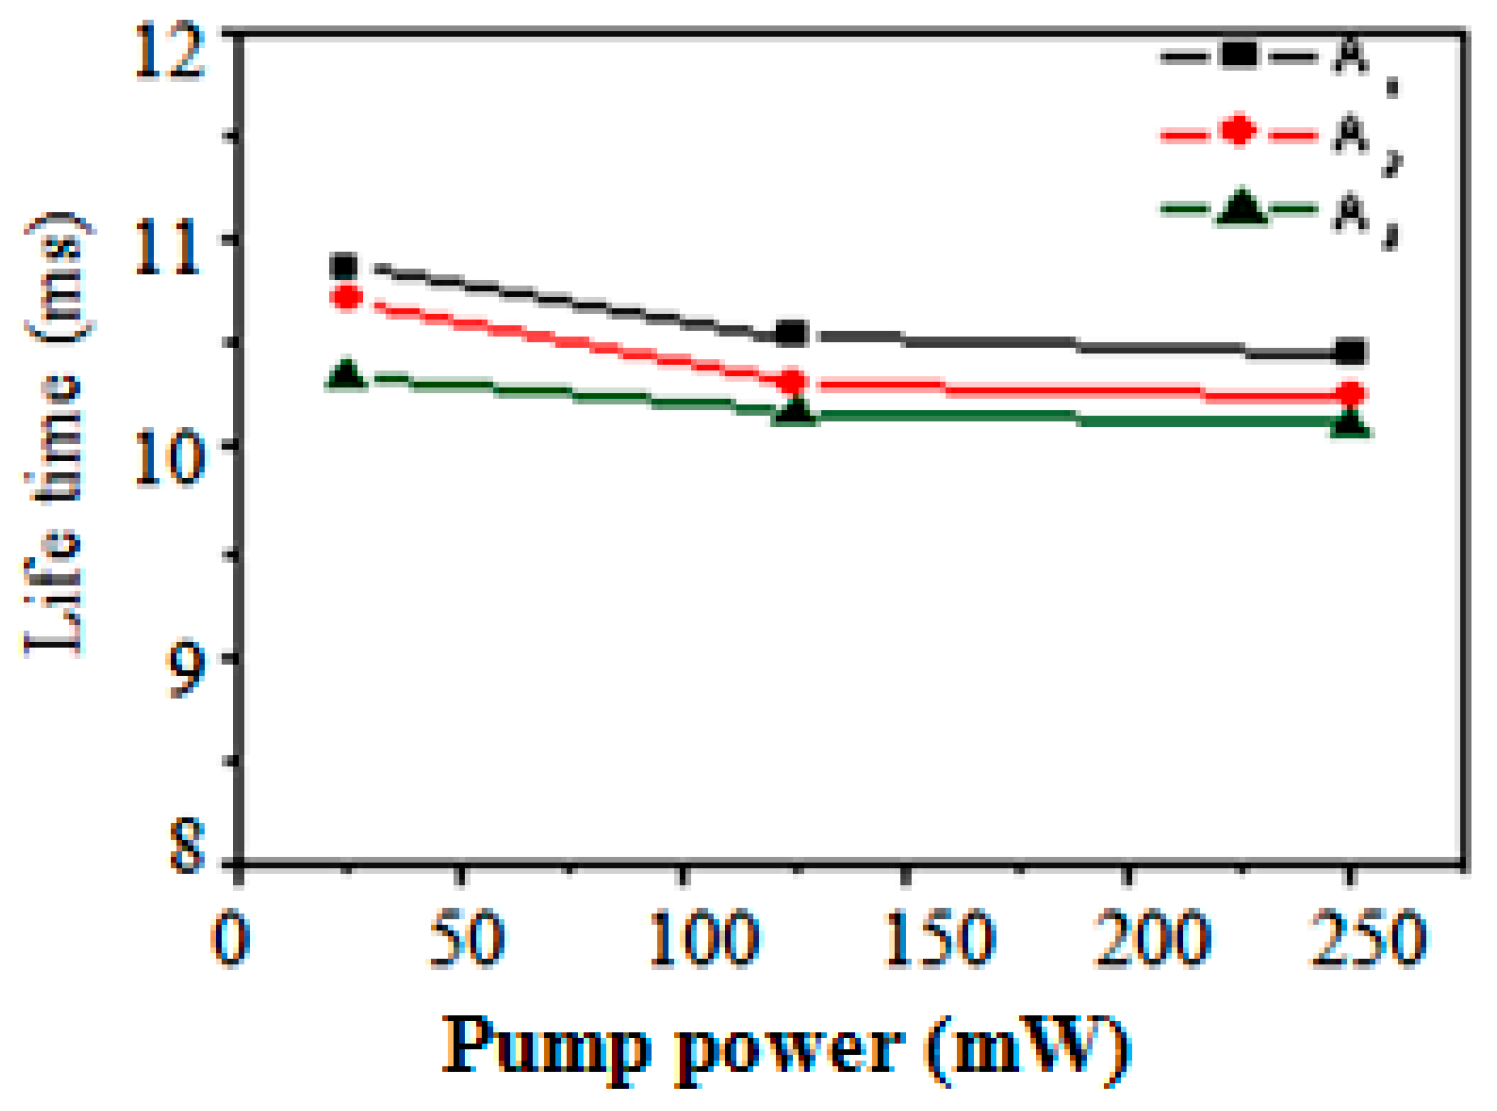
Figure 21. The transition lifetimes of EDFs A1 and A2 (10.87 ms and 10.71 ms) were found to be larger than that of the EDF A3 (10.3 ms), as shown in
Figure 22. All three fibers showed very little change in their lifetime with increasing pump power, as shown in
Figure 23. This indicated that the clustering of Er
3+ ions was almost absent, even though all the fiber samples contained more than 0.07 mol% of Er
2O
3 equivalent to 1400 ppm Er
3+ ions.
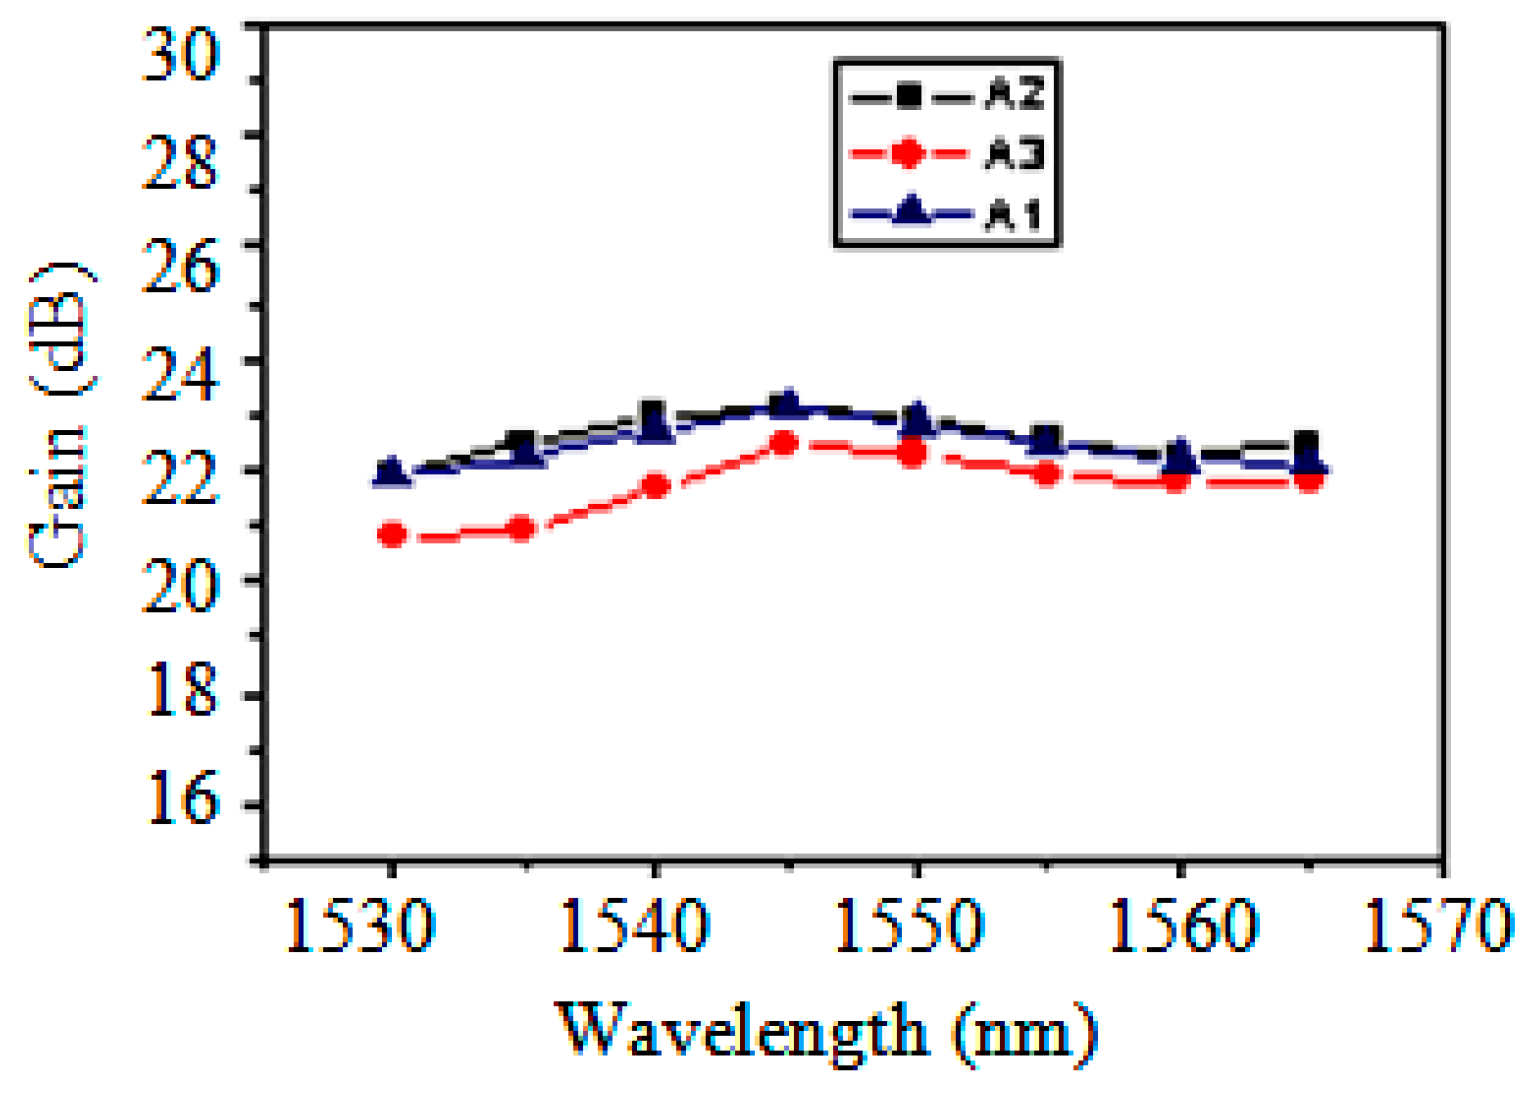
The optical gain spectra of these three EDFs in the C band region are shown in
Figure 24. The gain differences of the phase-separated EDFs (A1 and A2) were within 1.2 dB, whereas that for fiber A3 was 1.70 dB.
In ErO
6 complexes, each Er
3+ ion is surrounded by six neighboring oxygen atoms forming an octahedral structure possessing C
3v point symmetry, which produces the strong Stark splitting, leading to the characteristic Er
3+ emission in the 1460–1610 nm range. The aluminum ions, when incorporated into the silica network, are incorporated either as a network former having a tetrahedral coordination or as a network modifier in higher coordination, for example in fivefold and six fold coordination with oxygen. These Al structures create solvation shells in the glass network and provide necessary valency for rare-earth ions. When Al functions as network former in fourfold coordination and requiring charge compensation, the Er
3+ ions are preferentially found near these aluminum sites. When Al serves as a network modifier, the Al
3+ ions serve to charge-balance Al in fourfold coordination and may also break the silica structure producing non bridging Al–O groups which can coordinate with the Er
3+ ions. The increase of Al
2O
3 content weakens the covalent character of Er–O and leads to formation of the Si–O–Al bond. It is well known that a glass composition with higher basicity prefers lower coordination number compared to the formation of six-coordinated Al
3+ [
29]. Moreover, the optical basicity of four-coordinated Al
3+ in the network of SiO
4 is known to be smaller than that of six-coordinated Al
3+ [
30]. Accordingly, Er
3+ ions prefer four-coordinated Al
3+ ions rather than six-coordinated Al
3+ ions with an increase of Al
2O
3.
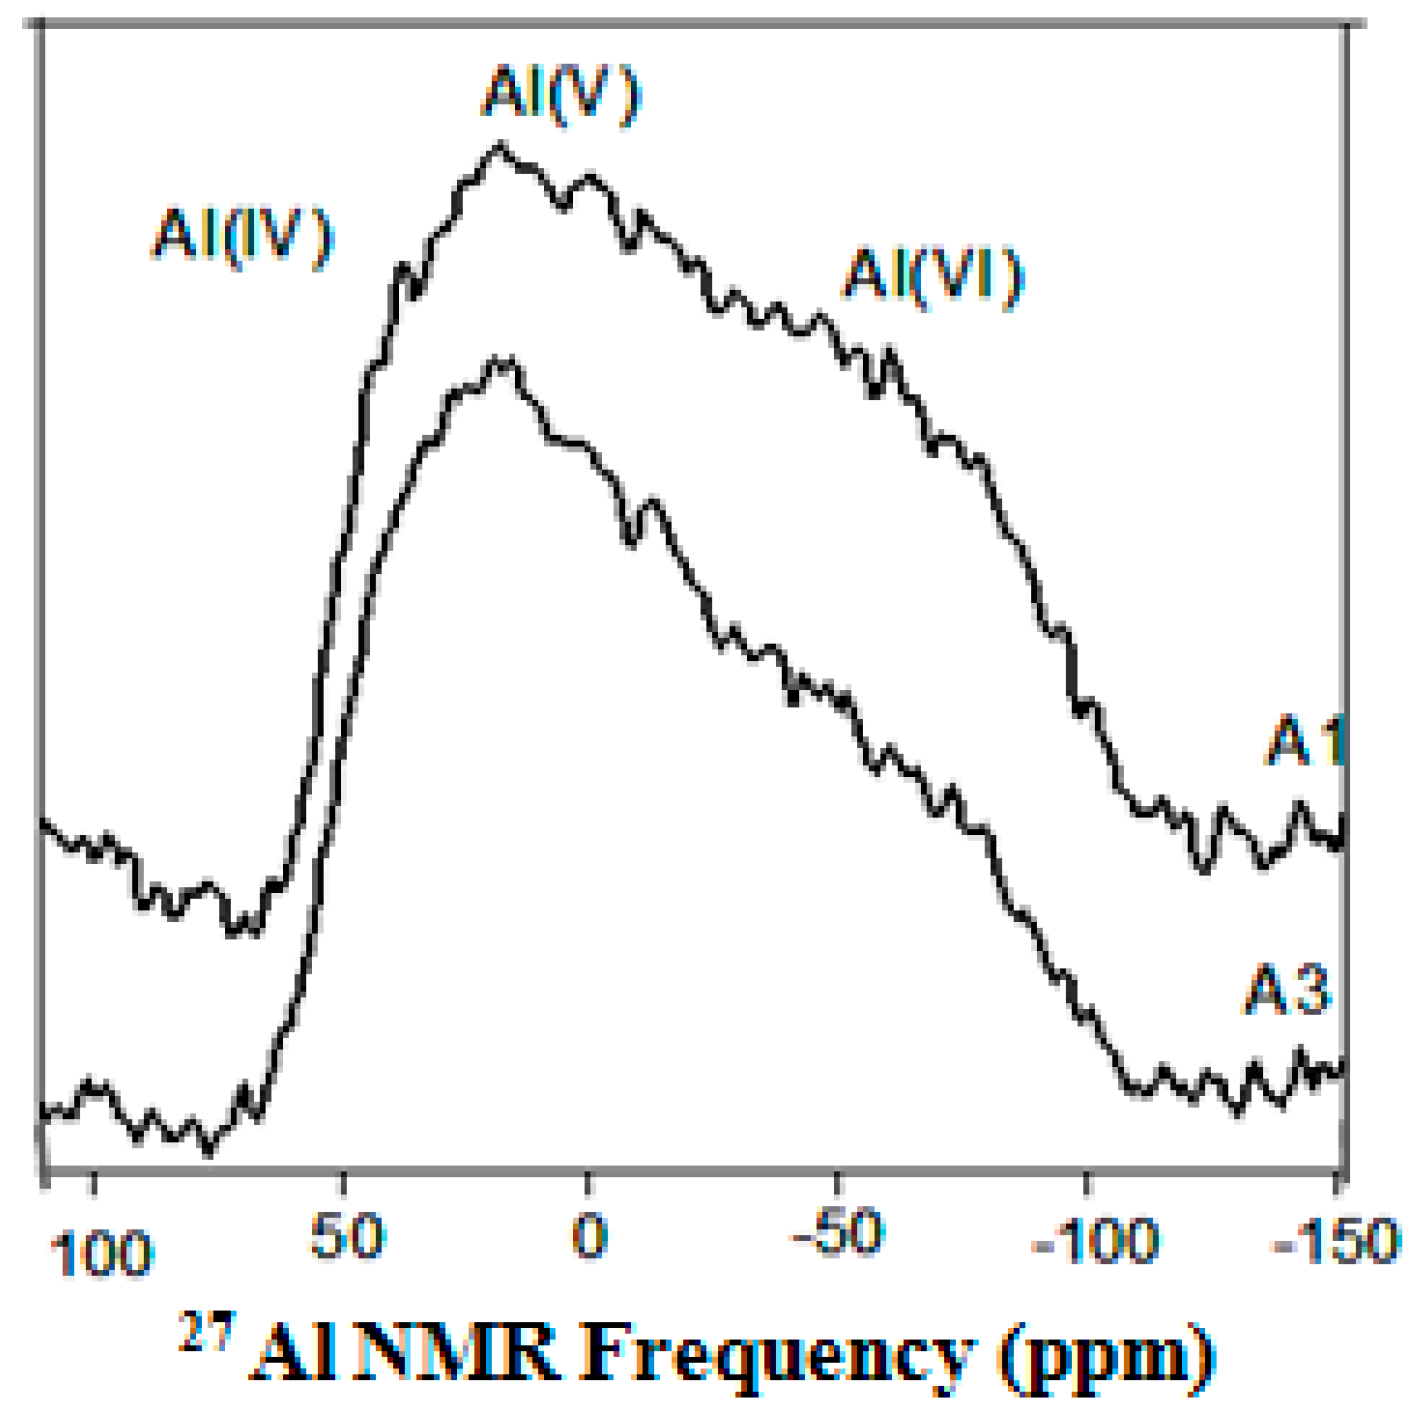
However in our case,
27Al MAS NMR spectroscopic analyses of the Er
2O
3 doped phase-separated alumina–silica fiber preform samples (shown in
Figure 25) revealed that most of the Al
3+ ions were hexa- and penta-coordinated instead of four-coordinated. These results were found to be in good agreement with available literature [
31,
32]. Er
3+ ions surrounded by more hexa- and penta-coordinated Al
3+ ions will experience the larger site-to-site variation of the crystal field strength, which exhibits more homogeneous and inhomogeneous broadening in order to achieve large gain bandwidth with better flatness of the gain spectrum, specifically in the C band region. The coordination numbers of Al
3+ increases upon incorporation of a larger content of Al
2O
3, i.e., more than 3.0 mol%. The substitution of five- and six-coordinated Al
3+instead of four-coordinated Al
3+with increasing Al
2O
3content, can create more ionic environments surrounding the Er
3+ ions. Therefore, high Al
2O
3 doping is likely to increase the distortion of the ligand field of Er
3+ site caused by the existence of six-coordinated Al
3+, which gives rise to the strong interaction effects on the Stark splitting of
4I
15/2 and
4I
13/2 manifolds. This results in broader gain spectra with the much better flatness in the C band region as well as in their fluorescence curves. The phase-separated EDFs (A1 and A2) possessed a slightly longer lifetime than that of non-phase-separated EDF (A3) due to most of the Er
3+ ions being located in the alumina-rich phase-separated region, which possessed lower phonon energy than that of the silica matrix.

 ,
, 


