
Strengthening of Corroded Reinforced SCC-RAP Members with CFRP

1
Civil Engineering Department, Ohio Northern University, Ada Ohio, OH 45810, USA
2
Mechanical Engineering Department, Ohio Northern University, Ada Ohio, OH 45810, USA
*
Author to whom correspondence should be addressed.
Fibers 2016, 4(1), 3; https://doi.org/10.3390/fib4010003
Submission received: 28 October 2015
/
Accepted: 12 January 2016
/
Published: 22 January 2016
Abstract
:Corrosion is one of the major problems affecting the durability of reinforced concrete (RC) structures. This paper investigates the effect of rebar corrosion on the performance of reinforced self-consolidating concrete (SCC) members and the effectiveness of repair. A control RC member, which has no corrosion problem, was prepared to compare against corroded and repaired members. A number of reinforced concrete members having up to 50% corrosion level were constructed and tested to study the effect of corrosion on the structural performance of RC members. The beams with corrosion problem were repaired using carbon fiber reinforced polymer (CFRP) sheets and U-wraps. All of the beams constructed, which are either not repaired or repaired, in this study were tested under two static line loads until failure. The effect of corrosion and effectiveness of repairing technique were assessed by evaluating the performance in terms of load carrying capacity, deflection, and ductility. Test results revealed that as the corrosion level increases, the loss in load carrying capacity increases. Repairing using CFRP improved the performance of corroded members. For example, when 50% corrosion level was achieved, the beam lost approximately 57% of its load carrying capacity, but when it was repaired, it recovered about 42% of its load carrying capacity.
1. Introduction
While concrete is one of the most widely used construction materials in the world, the durability of concrete is critical as it would have great effect on the service life of civil infrastructure and building. However, concrete structures are vulnerable to corrosion when concrete structures are exposed to severe environment. Corrosion causes section loss in the reinforcing steel, therefore, it affects the load capacity of the concrete structure. Corrosion resembles a major threat to hinder the durability and safety of concrete structures. Carbon Fiber Reinforced Polymer (CFRP) is used in strengthening and restoration of concrete structures, thus it can be used to restore the capacity of concrete structures with corrosion problem. CFRP composites are commonly used when there are deficiencies in the quality of concrete and lack of adequate confinement reinforcement [1]. It was found that strengthening affected strength, ductility, and dissipation of energy. A full information about design and installation of externally bonded CFRP laminates are described in ACI 440.2R-08 [2].
CFRP has unique characteristics as it has a high strength to weight ratio. It also has resistance to chemicals and can be applied in the field without disturbance to traffic [3,4]. Debonding is a problem that prevents full utilization of the CFRP capacity [5,6,7,8,9,10,11,12,13,14]. To limit the debonding problem, both vertical and horizontal FRP laminates can be applied [15].
A number of research studies have investigated strengthening deteriorated reinforced concrete (RC) members with CFRP (e.g., [16]). Some studies have addressed the loss of cross-sectional area of reinforcing rebars (e.g., [17,18,19]). Anderson-Wile et al. [20] conducted a comprehensive investigation to study the corrosion of some metals such as stainless steel.
ElSafty et al. [15] investigated the application of different CFRP repair techniques for the repair of prestressed bridge concrete girders that were laterally damaged by overheight vehicle collisions. This investigation suggested using both longitudinal and U-wrapping to effectively restore the flexural capacity of the damaged girders.
Mitsui et al. [21] investigated the effect of externally reinforcing concrete beams with carbon fiber sheets on the cracking and ultimate load strength of the beam. The beams were reinforced with two layers of carbon fibers that were bonded crosswise to each other. Some of the samples were cracked and then repaired by injecting epoxy before applying the sheets. The data showed that while the sheets did not have a significant effect on the cracking load of the beams, they affected the ultimate load of the beam, which was 1.3 to 1.8 times higher than that of the original beam.
In the current research work, the effect of corrosion on the performance of reinforced self-consolidating concrete (SCC) members and the effectiveness of repair have been investigated. In the fresh, hardened, and shrinkage properties of the SCC that contains both supplementary cementitious material (SCM) and 10% recycled asphalt pavement (RAP) selected from Abdel-Mohti et al. [22] have been investigated. It was concluded that it is possible to prepare SCC with RAP and also increasing the RAP content decreases the compressive and tensile strength of concrete and load carrying capacity of the concrete member [22]. More details about the effect of adding RAP to concrete can be found in Abdel-Mohti et al. [22]. Beams having up to 50% level of corrosion in the reinforcing rebars were cast using the SCC concrete mixture developed in this study. The RC members were repaired by applying CFRP in the longitudinal and transverse directions, following the results of ElSafty et al. [15] that investigated a large set of repair configurations, and were tested under four-point test until failure. All of specimens were reapired with the same amount of CFRP in order to assess the effect of level of corrosion on the performance of RC members.
SCC is defined as the fresh concrete that can flow around reinforcement and consolidate under its self-weight without the need of vibration. SCC should not exhibit any segregation or bleeding. SCC is one of the important products in concrete technology. The performance of SCC has been studied by many researchers (e.g., [22,23,24,25,26,27,28,29,30]).
The use of fly ash and slag cement is very effective in producing SCC with reasonable fresh and hardened characteristics. Optimization of mixture proportions and the use of new materials in SCC have been examined by many researchers. Since SCC incorporate a large amount of portland cement, that increases the cost of SCC and results in large CO2 emission. Recycled aggregates invited attention from researchers as they generally come from demolition of roads, returned concrete, and buildings or structures. The use of recycled aggregates can help to reduce the environmental impact of concrete. Also, it can reduce the consumption of natural resources used in concrete. Abdel-Mohti et al. [22] conducted a comprehensive investigation to incorporate recycled asphalt pavement into SCC.
2. Experimental Program
2.1. Preparation of Self-Consolidating Concrete
Following a comprehensive research investigation to investigate the performance of SCC that contains RAP as a replacement to a percentage of coarse aggregates [22], it was decided to use a SCC concrete mixture having both slag and fly ash and 10% RAP. The SCC mixture contains cementitious material including ASTM C 150 Type I portland cement, Class C fly ash, and slag cement. The SCM’s were incorporated to make SCC more sustainable. Natural sand was used as fine aggregate. Coarse aggregates used are #57 and #8 limestone. A fixed ratio between the amounts of #57 to #8 of 1:1 was used. Water to cementitious material ratio (w/cm) of 0.38 was used. The mixtures included RAP to replace 10% of coarse aggregates in an effort to improve the sustainability further. A viscosity enhancing admixture (VMA) and a high range water reducer (HRWR) were used to produce SCC.
A number of tests were performed when concrete was in plastic state. ASTM C 1611 test is the most commonly used test for the SCC. Slump flow, T50, and visual stability index (VSI) were conducted. These tests were performed to measure the filling-ability of concrete and also to determine if there are any signs of segregation. ASTM 1621 test (J-Ring test), which is commonly used to measure the passing-ability of concrete, was also conducted. More details about these tests can be found in Abdel-Mohti et al. [22].
The compressive and tensile strength of SCC mixture were determined at 3, 7, 14, and 28 days of age of concrete to capture the early strength of concrete. A total of 16 samples were taken from each concrete mixture and allowed to cure for 28 days, noting that mix design was the same (Table 1). Curing was performed in accordance with ASTM C192. The strength of each sample was measured and then the average of the results of all the samples was reported. The compression test was performed in accordance with ASTM C39, whereas the splitting tensile test was performed in accordance with ASTM 496. The same standard testing machine was used to conduct both of the compression and tensile tests. A Weibull distribution, density function denoted as f(x) as follows [31], was used to fit the results of compressive and tensile strength to present the calculated mean and size of scatter in the data.

| W/C | 0.38 | |
|---|---|---|
| Water (kg) | 144.0 | |
| Cementitious Materials (kg) | Type I portland cement | 151.6 |
| Flyash | 113.7 | |
| Slag cement | 113.7 | |
| Aggregates (kg) | RAP | 64.9 |
| Coarse | 584.2 | |
| Fine | 625.0 | |
2.2. Corrosion Test
As one of the objectives of the current research work is to investigate the effect of the corrosion of reinforcing rebars, corrosion of the steel needs to be induced in the study. However, the natural process of corrosion takes long time which make is unrealistic to study various conditions in a reasonable timely manner in the lab. The process is therefore accelerated by chemical means to simulate the real condition. The details of the process are presented in the following sections.
2.2.1. Background
Corrosion is a term that refers to the deterioration of a metal through a chemical reaction. It is also called rust specifically for the corrosion in iron and iron-based alloys such as steel. It is an oxidation chemical reaction between atmospheric oxygen and iron in the presence of water. Rust is a mixture of several hydrated iron oxides: iron(III) oxide hydrates, Fe2O3·nH2O, and iron(III) oxide-hydroxide hydrates, FeO(OH)·nH2O and Fe(OH)3. Whenever iron is exposed to water and oxygen, it converts to a mixture of these oxide hydrates. The rust mixture is much less dense than metallic iron and results in an expanded volume of the rust compared to metallic iron. This expansion results in flaking on the surface of the iron metal, constantly exposing unreacted iron for further chemical reaction and eventually consuming the entire piece. Surface rust with iron does not provide any protection of the underlying unreacted metal because of this flaking, unlike some other metals such as aluminum, which forms a passivated layer.
Oxidation is a chemical process resulting in the oxidation state of iron increasing from zero in elemental iron metal to +3 in iron(III) oxide (Fe2O3) as three electrons are given up by each iron atom. This oxidation is accompanied by a reduction in the oxidation state of oxygen from zero in elemental oxygen, O2, to −2 in iron(III) oxide as two electrons are taken up by each oxygen atom. Iron rusting is therefore a redox reaction: a combination of reduction occurring with oxygen and oxidation occurring with iron.
The rate of iron rusting can be increased tremendously by adding salt in the water, which enhances the rate at which electrons can be transported between oxygen and iron. To accelerate the rate further, in the designed experiment, electrical current was also provided to increase the rate of corrosion further by passing electrical current out of the iron (oxidation) and into the water (reduction of oxygen). This test method is called the galvanic cell method and the salt water serves as an electrolyte in this test.
The key equations are the reduction of oxygen:
and the oxidation of iron:
to form iron(III) oxide:
O2(g) + 2H2O(ℓ) + 4 e−(aq) → 4OH−(aq)
Fe(s) → Fe2+(aq) + 2e−(aq)
4Fe2+(aq) + O2(g) → 4Fe3+(aq) + 2O2−(aq) → Fe2O3(s)
In the presence of water, a mixture of iron(III) oxide hydrates are formed with Fe2O3. Once iron(III) and iron(II) ions have been formed, acid-base chemistry also occurs with water to form Fe(OH)2 and Fe(OH)3:
Fe2+(aq) + 2H2O(ℓ) → Fe(OH)2(s) + 2H+(aq)
Fe3+(aq) + 3H2O(ℓ) → Fe(OH)3(s) + 3H+(aq)
The resulting rust is a complicated and uncontrolled mixture of iron oxide hydrates, based on competing equilibria [32].
2.2.2. Small Scale Corrosion Test
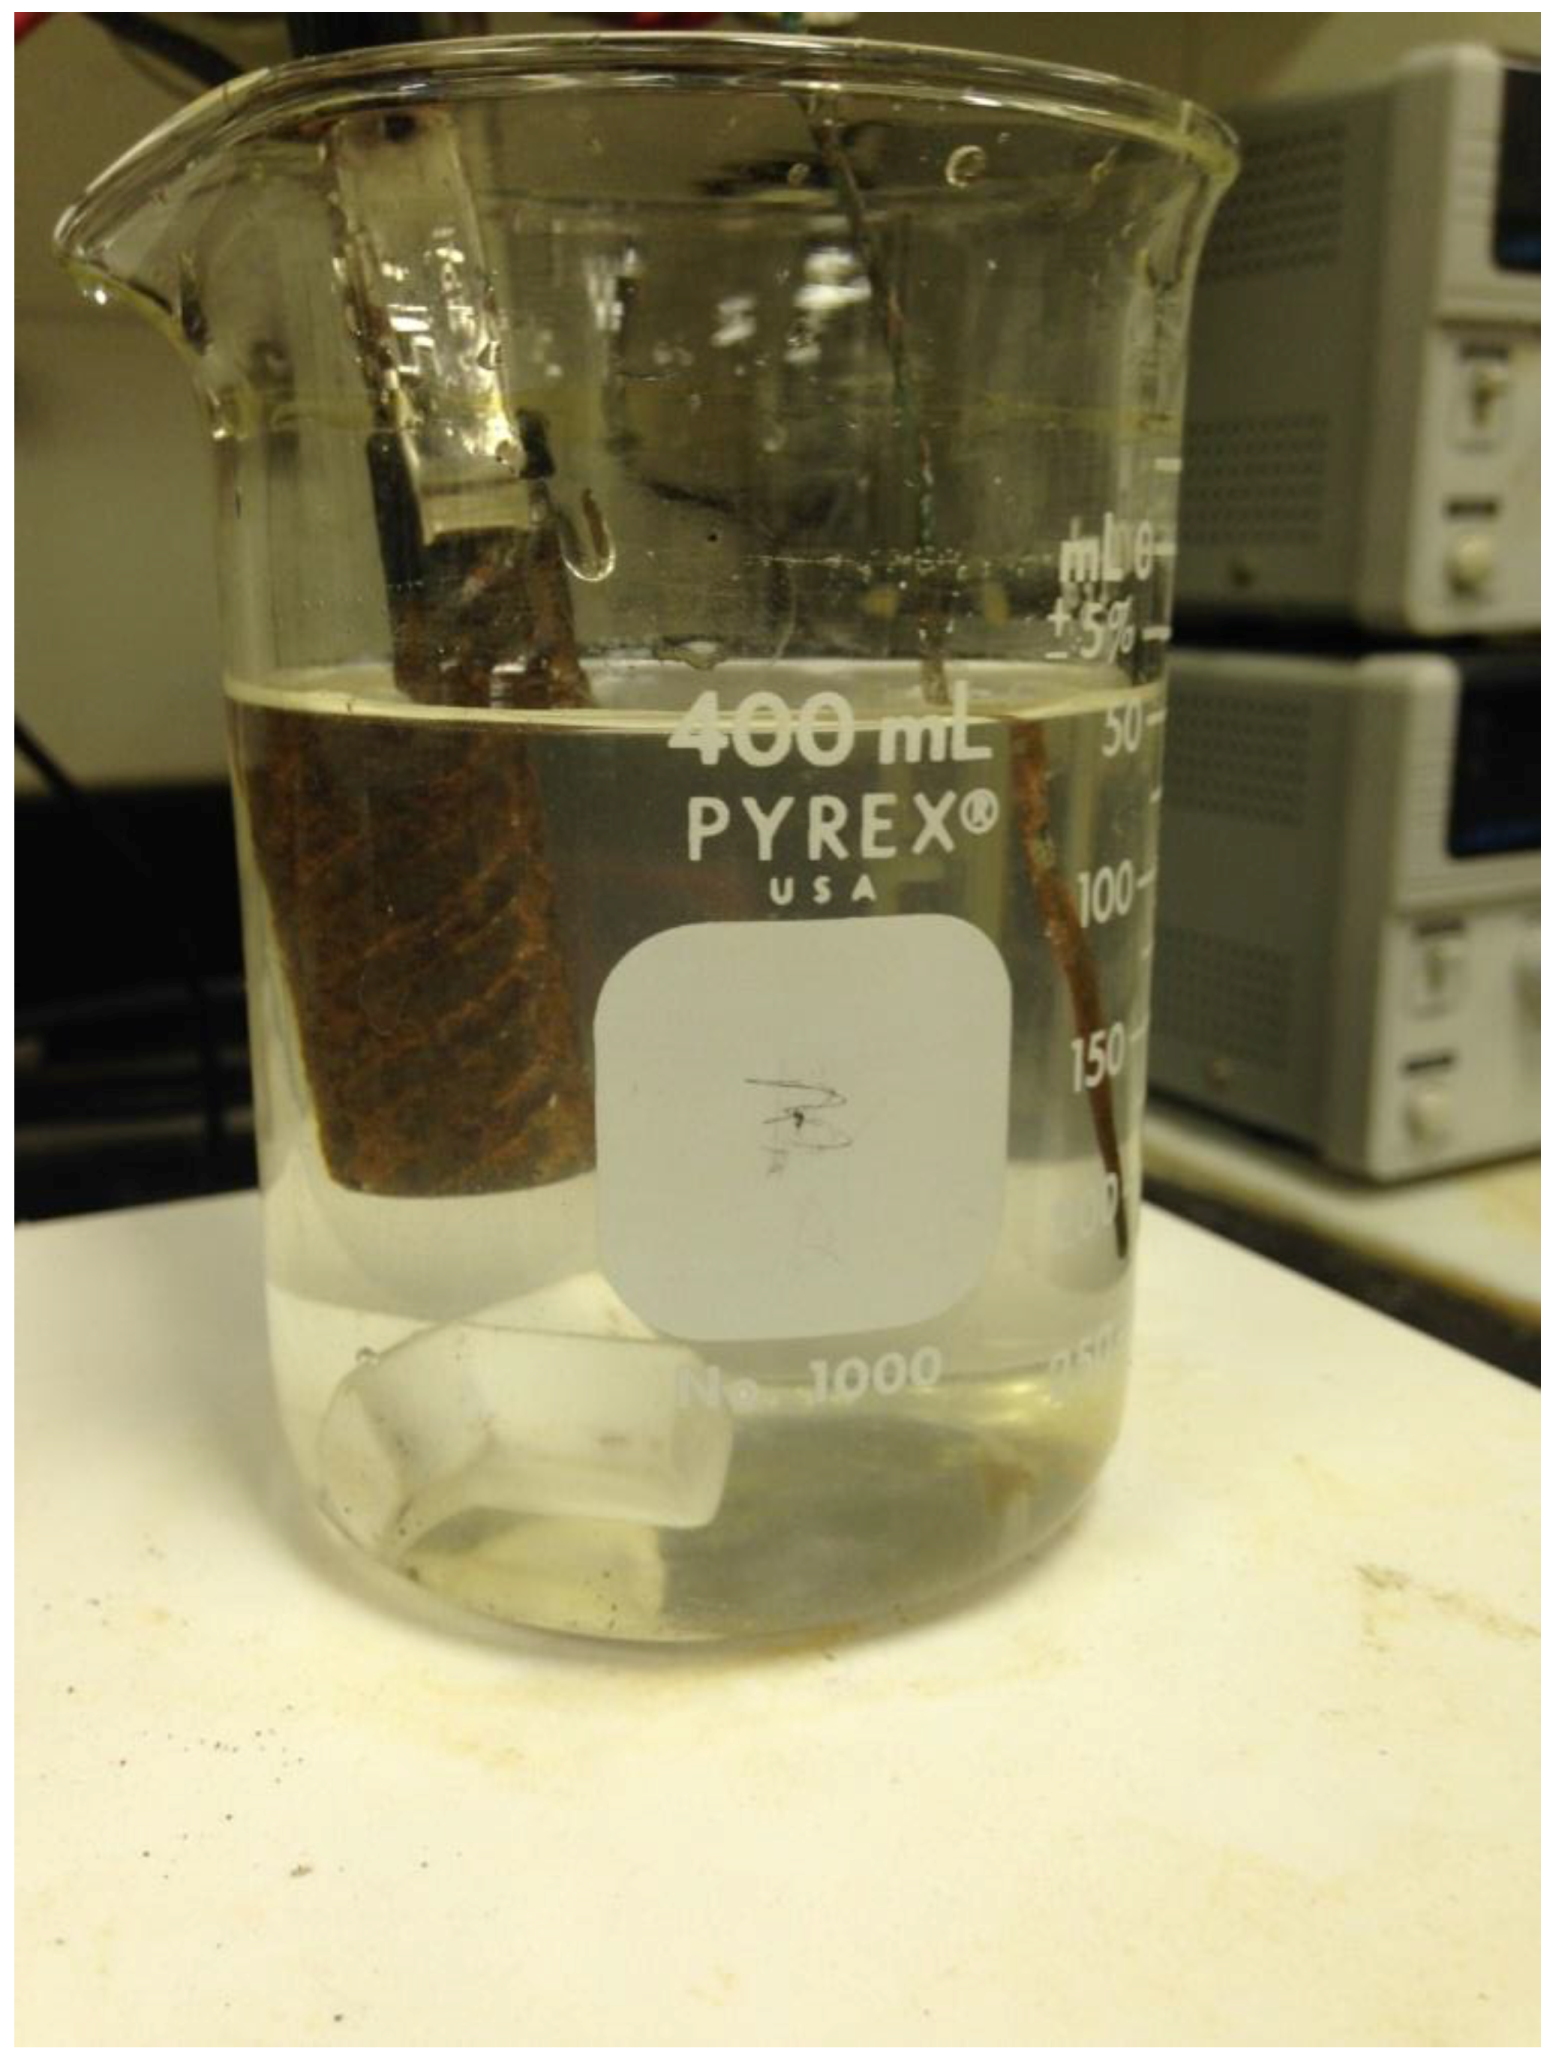
To experimentally determine the relationship between the mass loss due to corrosion and electric current or test temperature, small-scale tests were performed first. The test setup is shown in Figure 1. The steel bars and copper sticks were connected to power terminals and immerged in salt solution. The salt solution is 25 wt%. The salt, which is usually used during winter time to melt snow and available in stores was dissolved in tap water. A macroscopic galvanic cell with steel and copper electrodes and molten salt electrolyte were therefore formed. After a number of trials, finally, tests were narrowed down to four small-scale tests on 63.5 mm long 12.7 mm diameter Grade 60 steel bars (Table 2). Both of constant current of 0.1 and 0.2 Amp electric current were considered in this study and applied by means of external power supplies having capacity of 3 Amp. Room temperature, 24 °C, was used for Tests 1, 3 and 4 and 84 °C for Test 2 to observe the effect of temperature. As shown in Table 2, the steel rebar was connected to the positive terminal of power supply (anode) for the first three tests (Tests 1–3), whereas the copper was connected to the negative terminal of the power supply (cathode). In Test 4, the terminals are switched for the steel and the copper to confirm that connecting steel to the cathode would protect steel from corrosion, which means that there would be no mass loss. The container was placed on a stirring and heating station. A stirring bar was placed in the bottom of the beaker to stir the solution during the test. After approximately four days (95.5 h), the steel bars were retrieved, cleaned and dried to measure the mass to calculate the mass loss. The corroded sample of test 1 is shown in Figure 2.
Figure 1.
Small corrosion test setup.

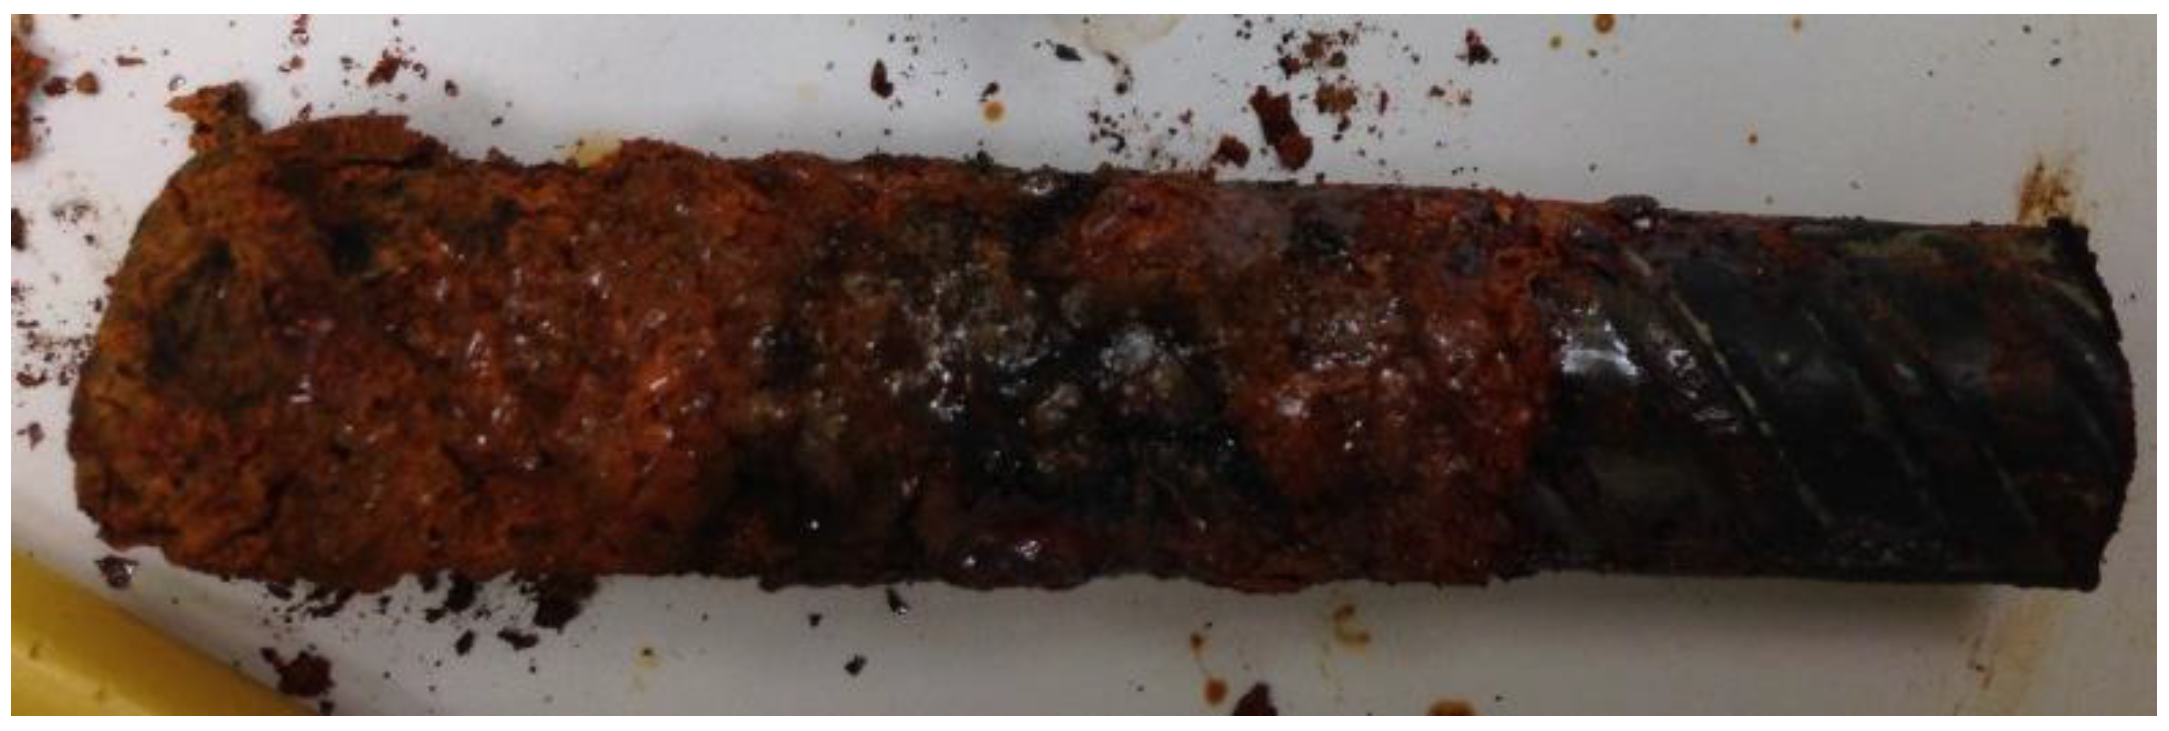
Figure 2.
Rebar sample after corrosion.

| Test | Current (Amp) | Solution Temperature (oC) | Steel Bar Connected to | Original Mass (kg) | Corrosion Time: 95.5 Hours | Estimated Mass Loss (%) per Day | |
|---|---|---|---|---|---|---|---|
| Measured Mass (kg) | Mass Loss (%) | ||||||
| 1 | 0.1 | 24 | + | 0.0620 | 0.0518 | 16.5 | 4.15 |
| 2 | 0.1 | 84 | + | 0.0640 | – | – | – |
| 3 | 0.2 | 24 | + | 0.06128 | 0.0436 | 28.9 | 7.26 |
| 4 | 0.2 | 24 | - | 0.0639 | 0.0639 | 0 | 0 |
Based on the results of small scale corrosion test, the large scale corrosion test to accelerate corrosion process of steel rebars used in reinforcing the tested RC members was designed and executed.
2.2.3. Large Scale Corrosion Test
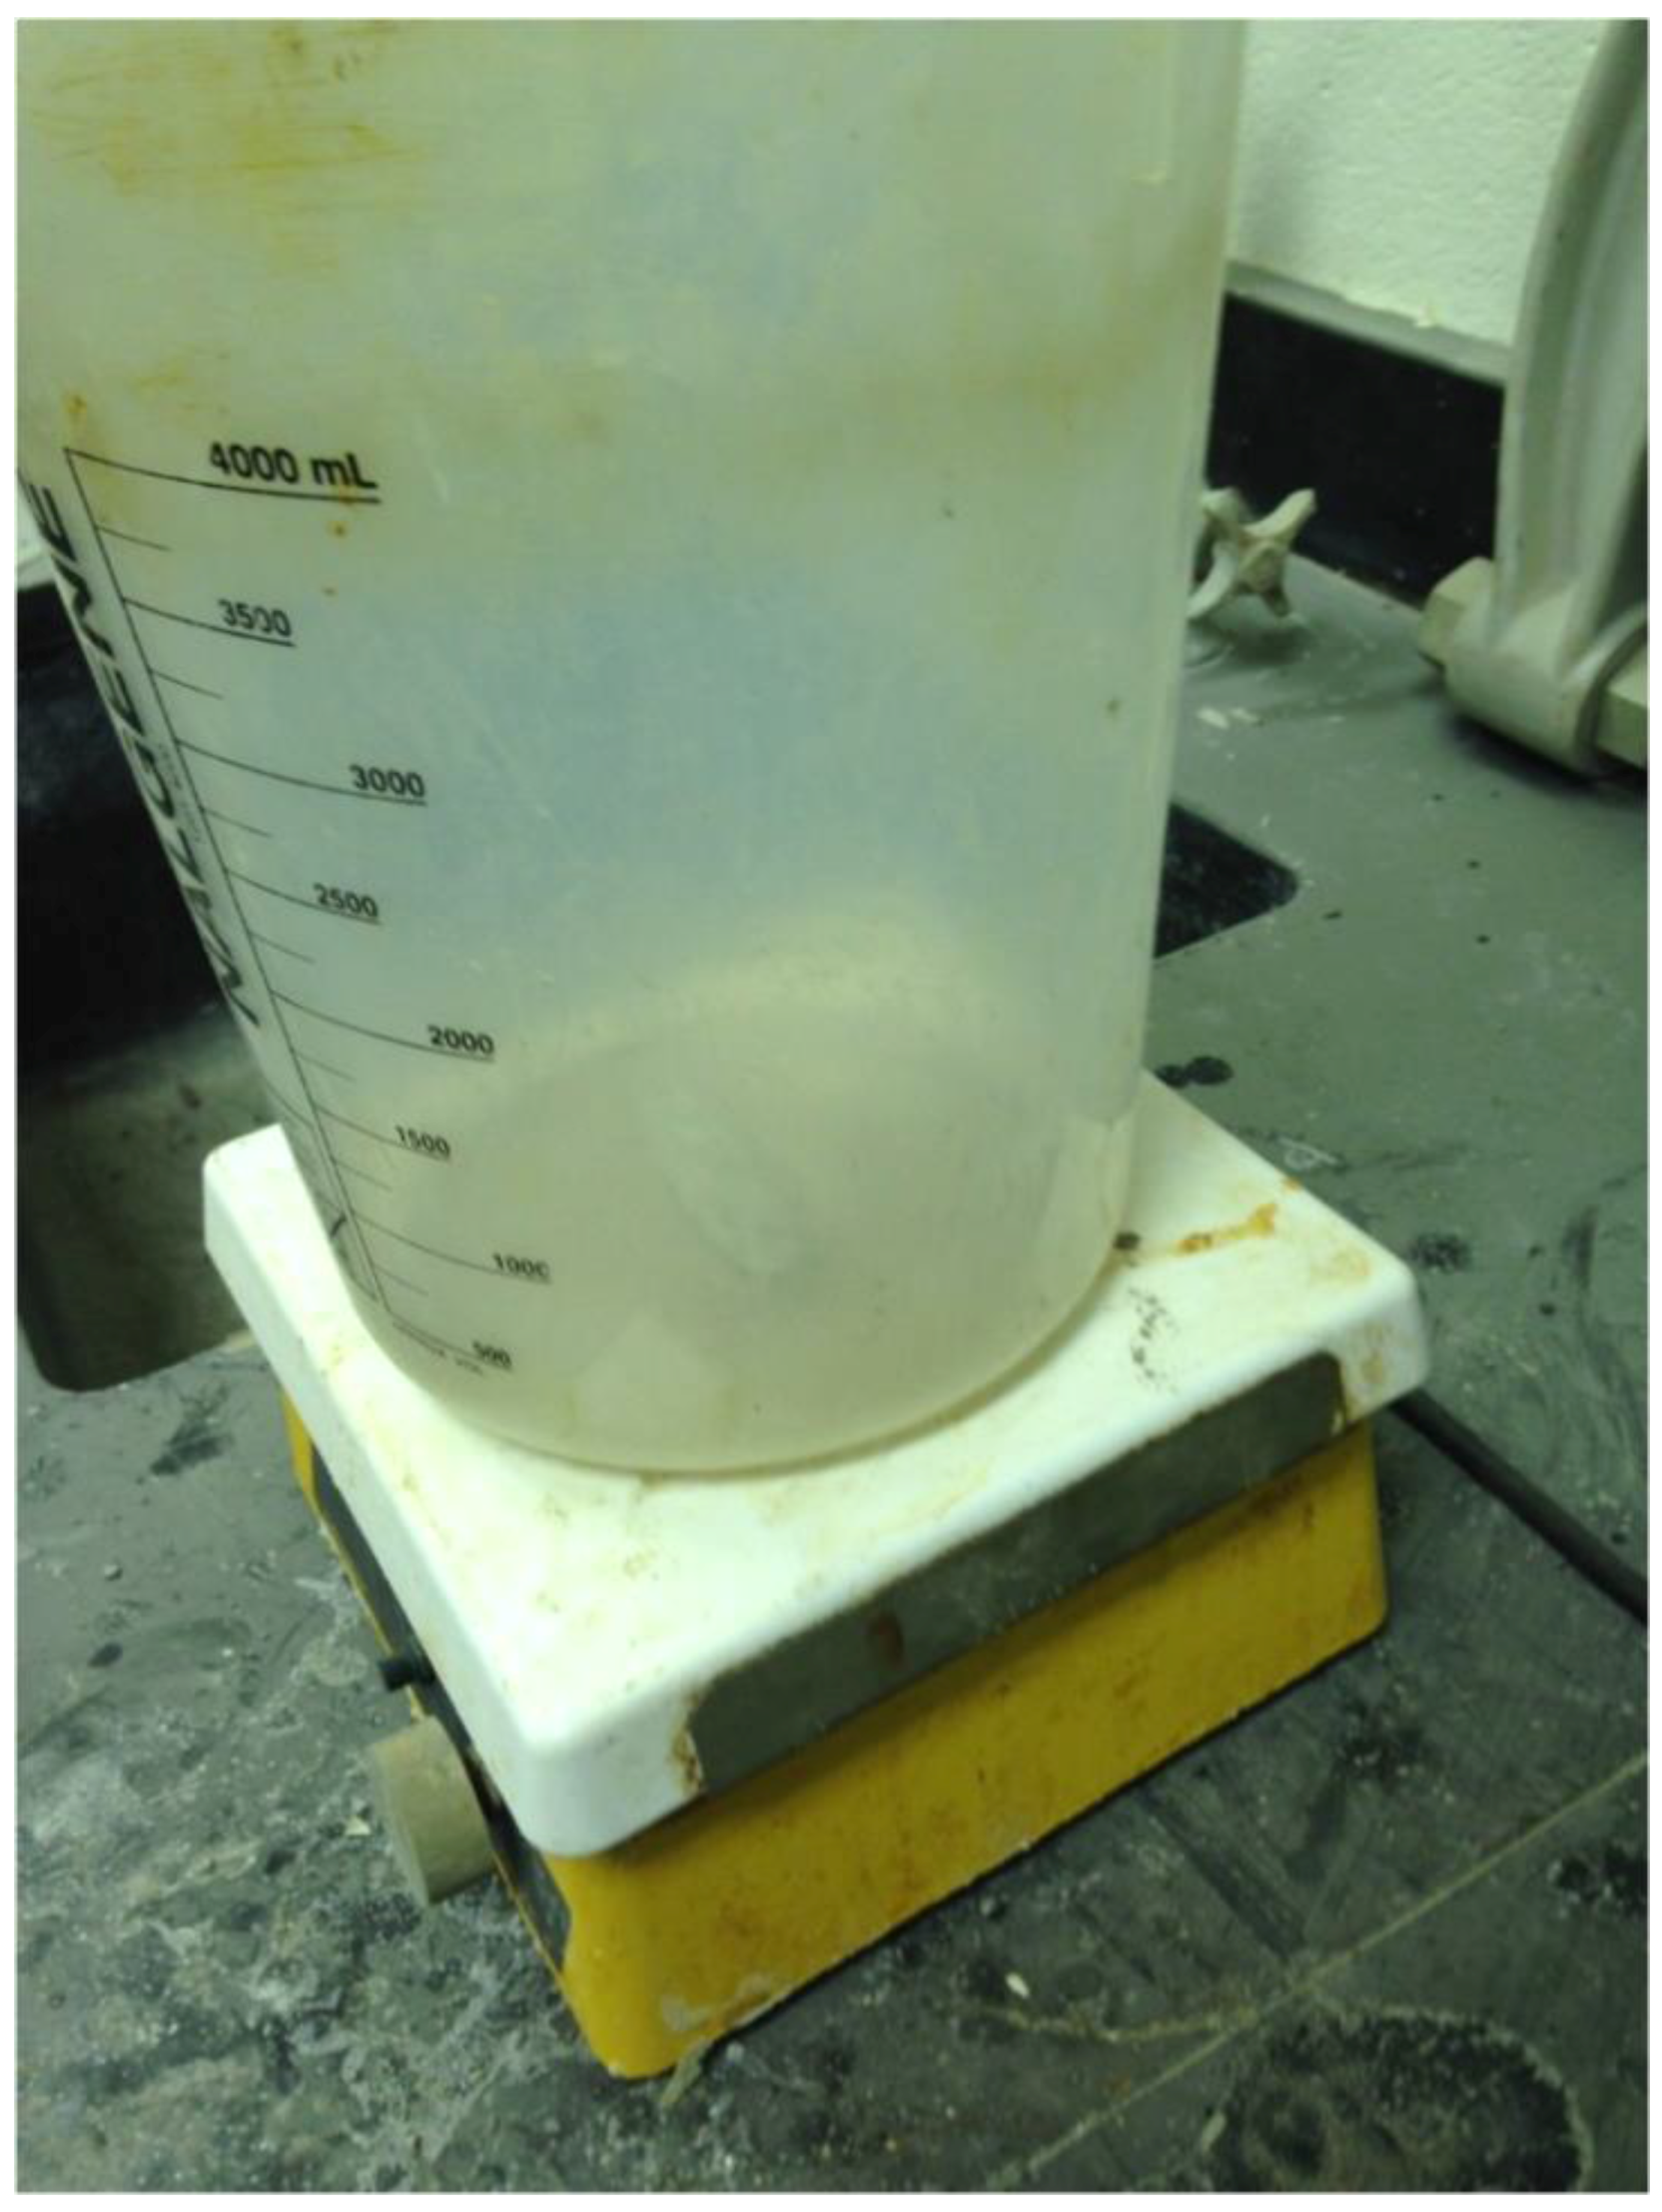
The corrosion test was designed to induce corrosion in a total of twenty Grade 60 deformed steel rebars to achieve different levels of corrosion. The rebars used in this tests are 1.828 m long and (# 5) 15.875 mm in diameter. The level of corrosion was measured by means of measuring the amount of mass loss after the test was completed. Five levels of corrosion were targeted including 10%, 20%, 32%, 40%, and 50%. 32% is very close to 30% so the results of this level of corrosion will provide insight about the 30% of corrosion as well. Based on the amount of mass loss per day that was determined from the small test (Table 2), it was possible to estimate the number of days needed to reach the designated corrosion level. Due to the length of the rebars, gutters with polymer liners were used as testbeds. A total of six testbeds were placed in the laboratory and were filled with salt solution of 25 wt%. The amounts of water and salt were measured in the laboratory to make the salt solution using a stir station (Figure 3).
Figure 3.
Station to prepare salt solution.

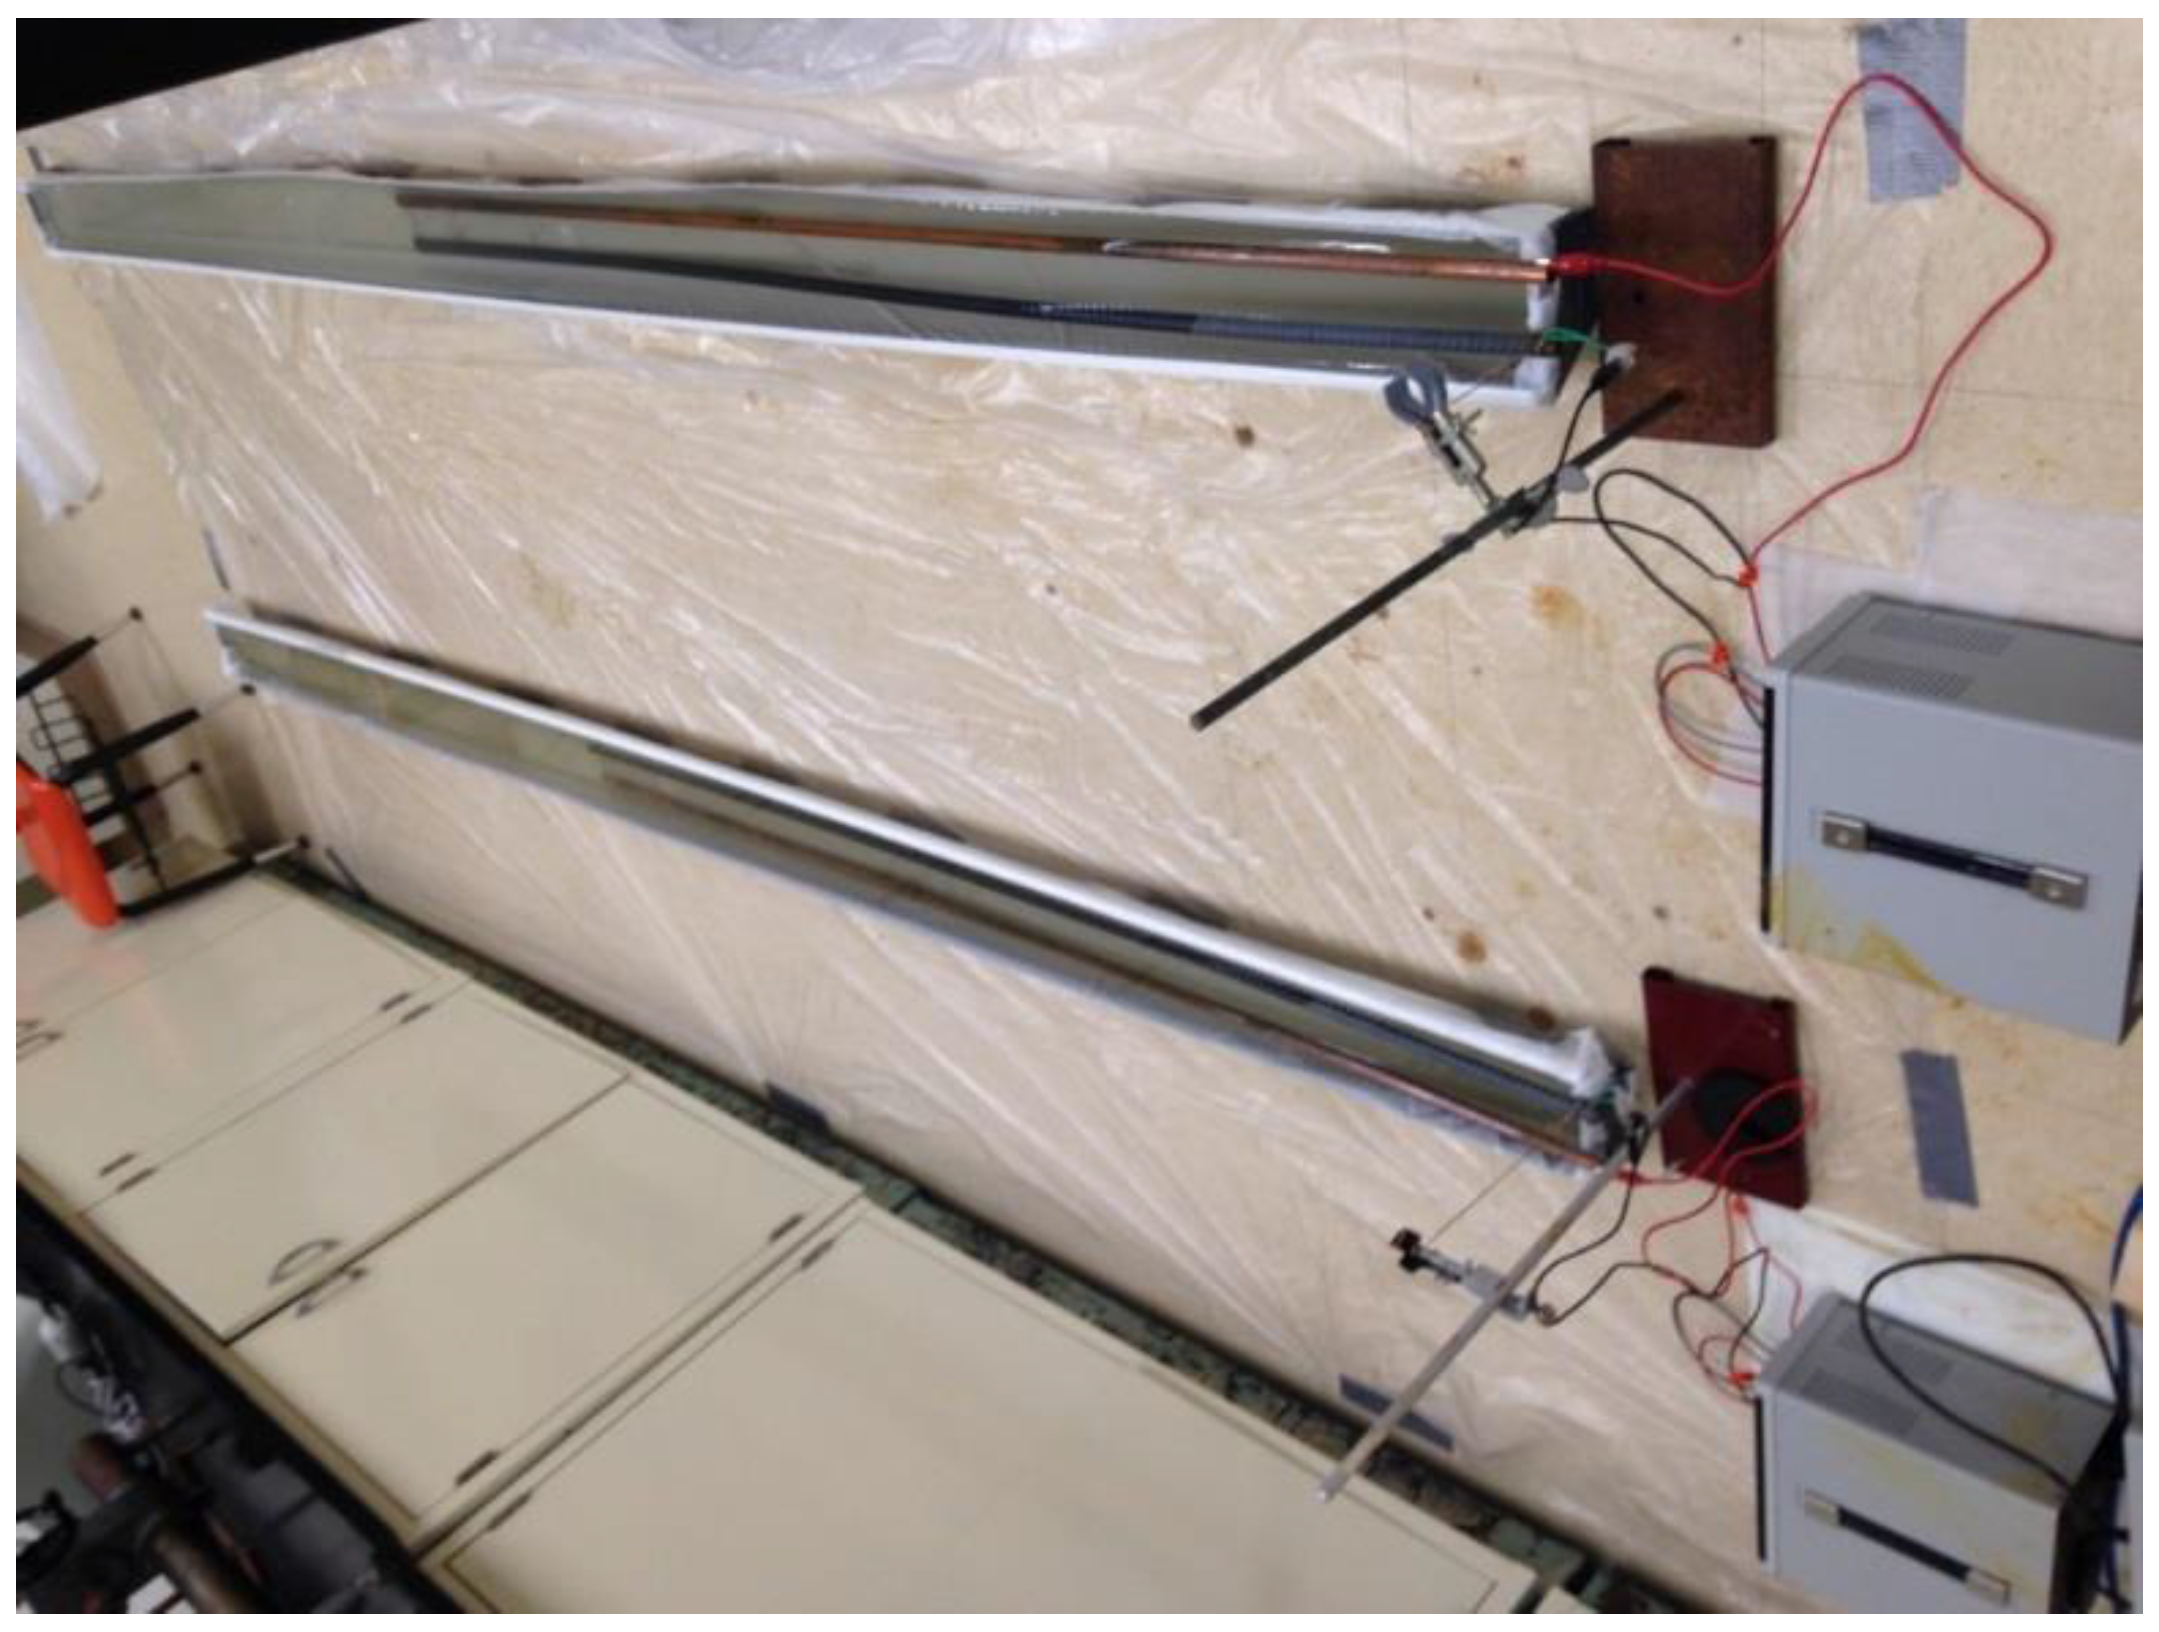
Six power supplies were also placed close to the testbeds, with one power supply on one end of each testbed (Figure 4). Each power supply, with a 3 Amp capacity, has three ports while each port has two terminals; therefore, by connecting two adjacent ports in parallel, it was possible to increase the capacity of the power supply to 6 Amp, which was used in the test. Having six test setups made it possible to induce corrosion in six rebars at one time. In each testbed, a steel rebar was placed next to a copper tube (Figure 5). Both of the steel rebar and the copper tube were clamped to the power supply from only one end using a special clamp, which was designed specifically for this test. The steel rebar was connected to the positive terminal of power supply to act as an anode, whereas, the copper was connected to the negative terminal of the power supply to act as a cathode. A constant current of 5.76 Amp was applied to all of the testbeds through the installed power supplies (Figure 6).
Figure 4.
Actual corrosion test setup.
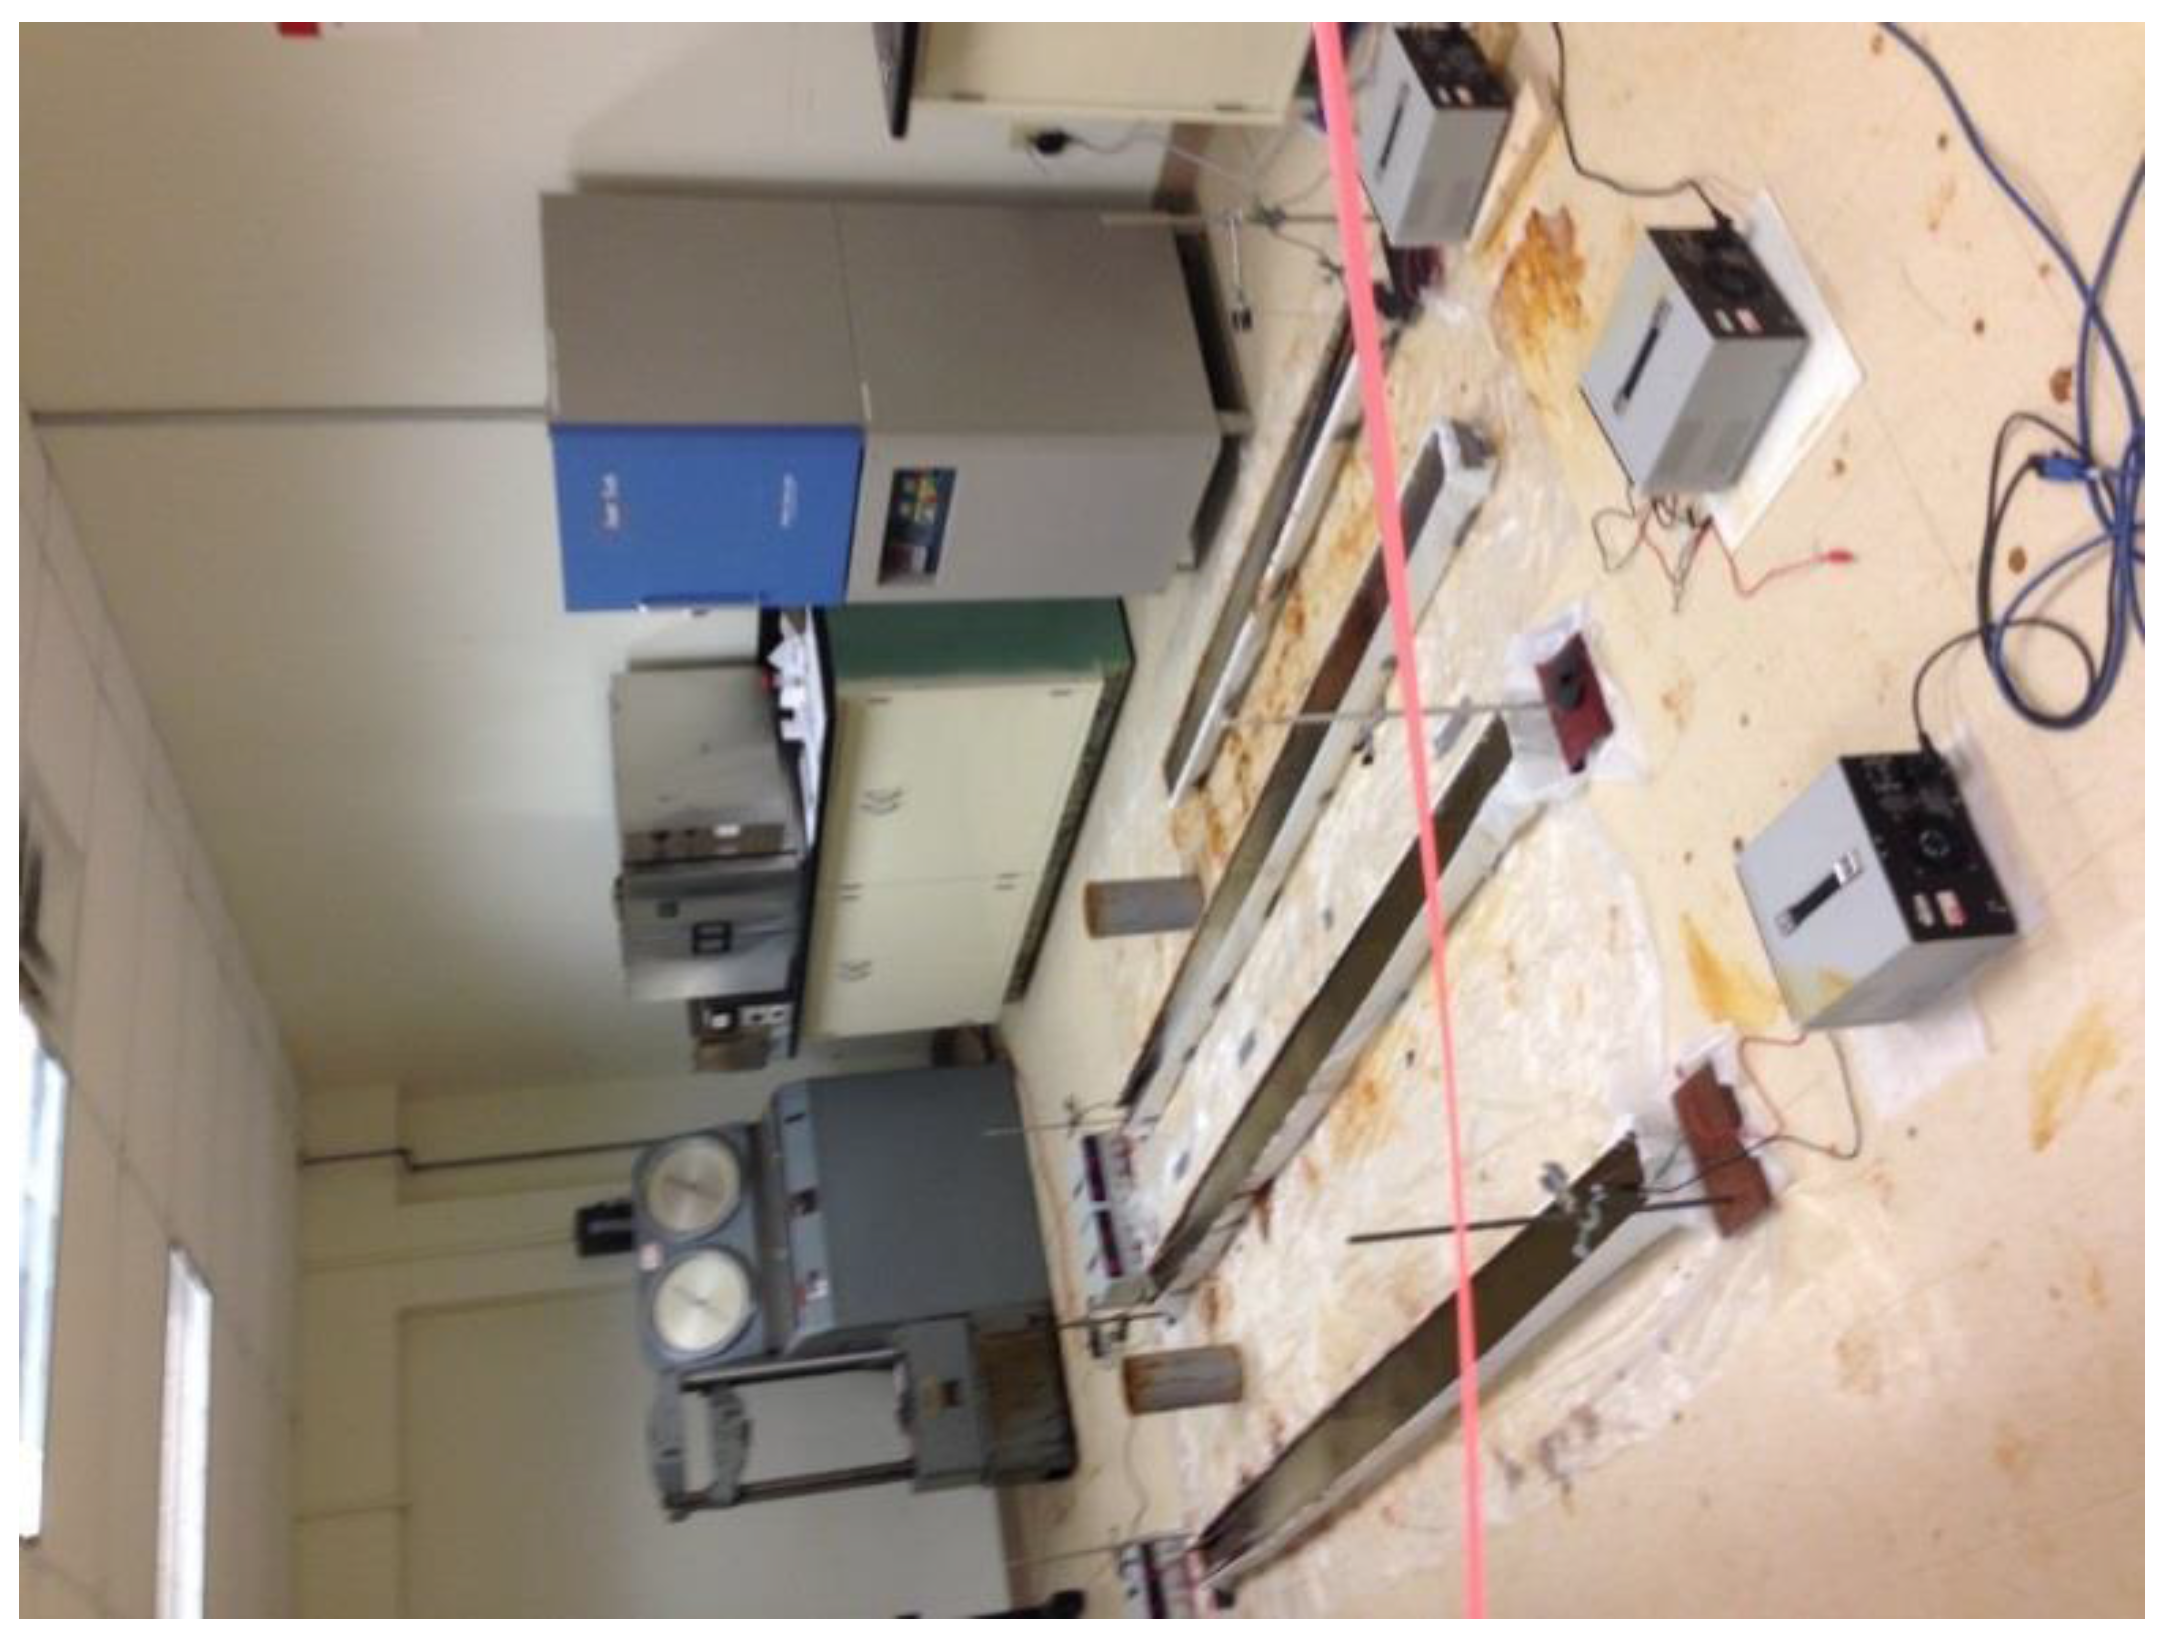
Figure 5.
Placing copper and steel rebars side-by-side at the beginning of the test.

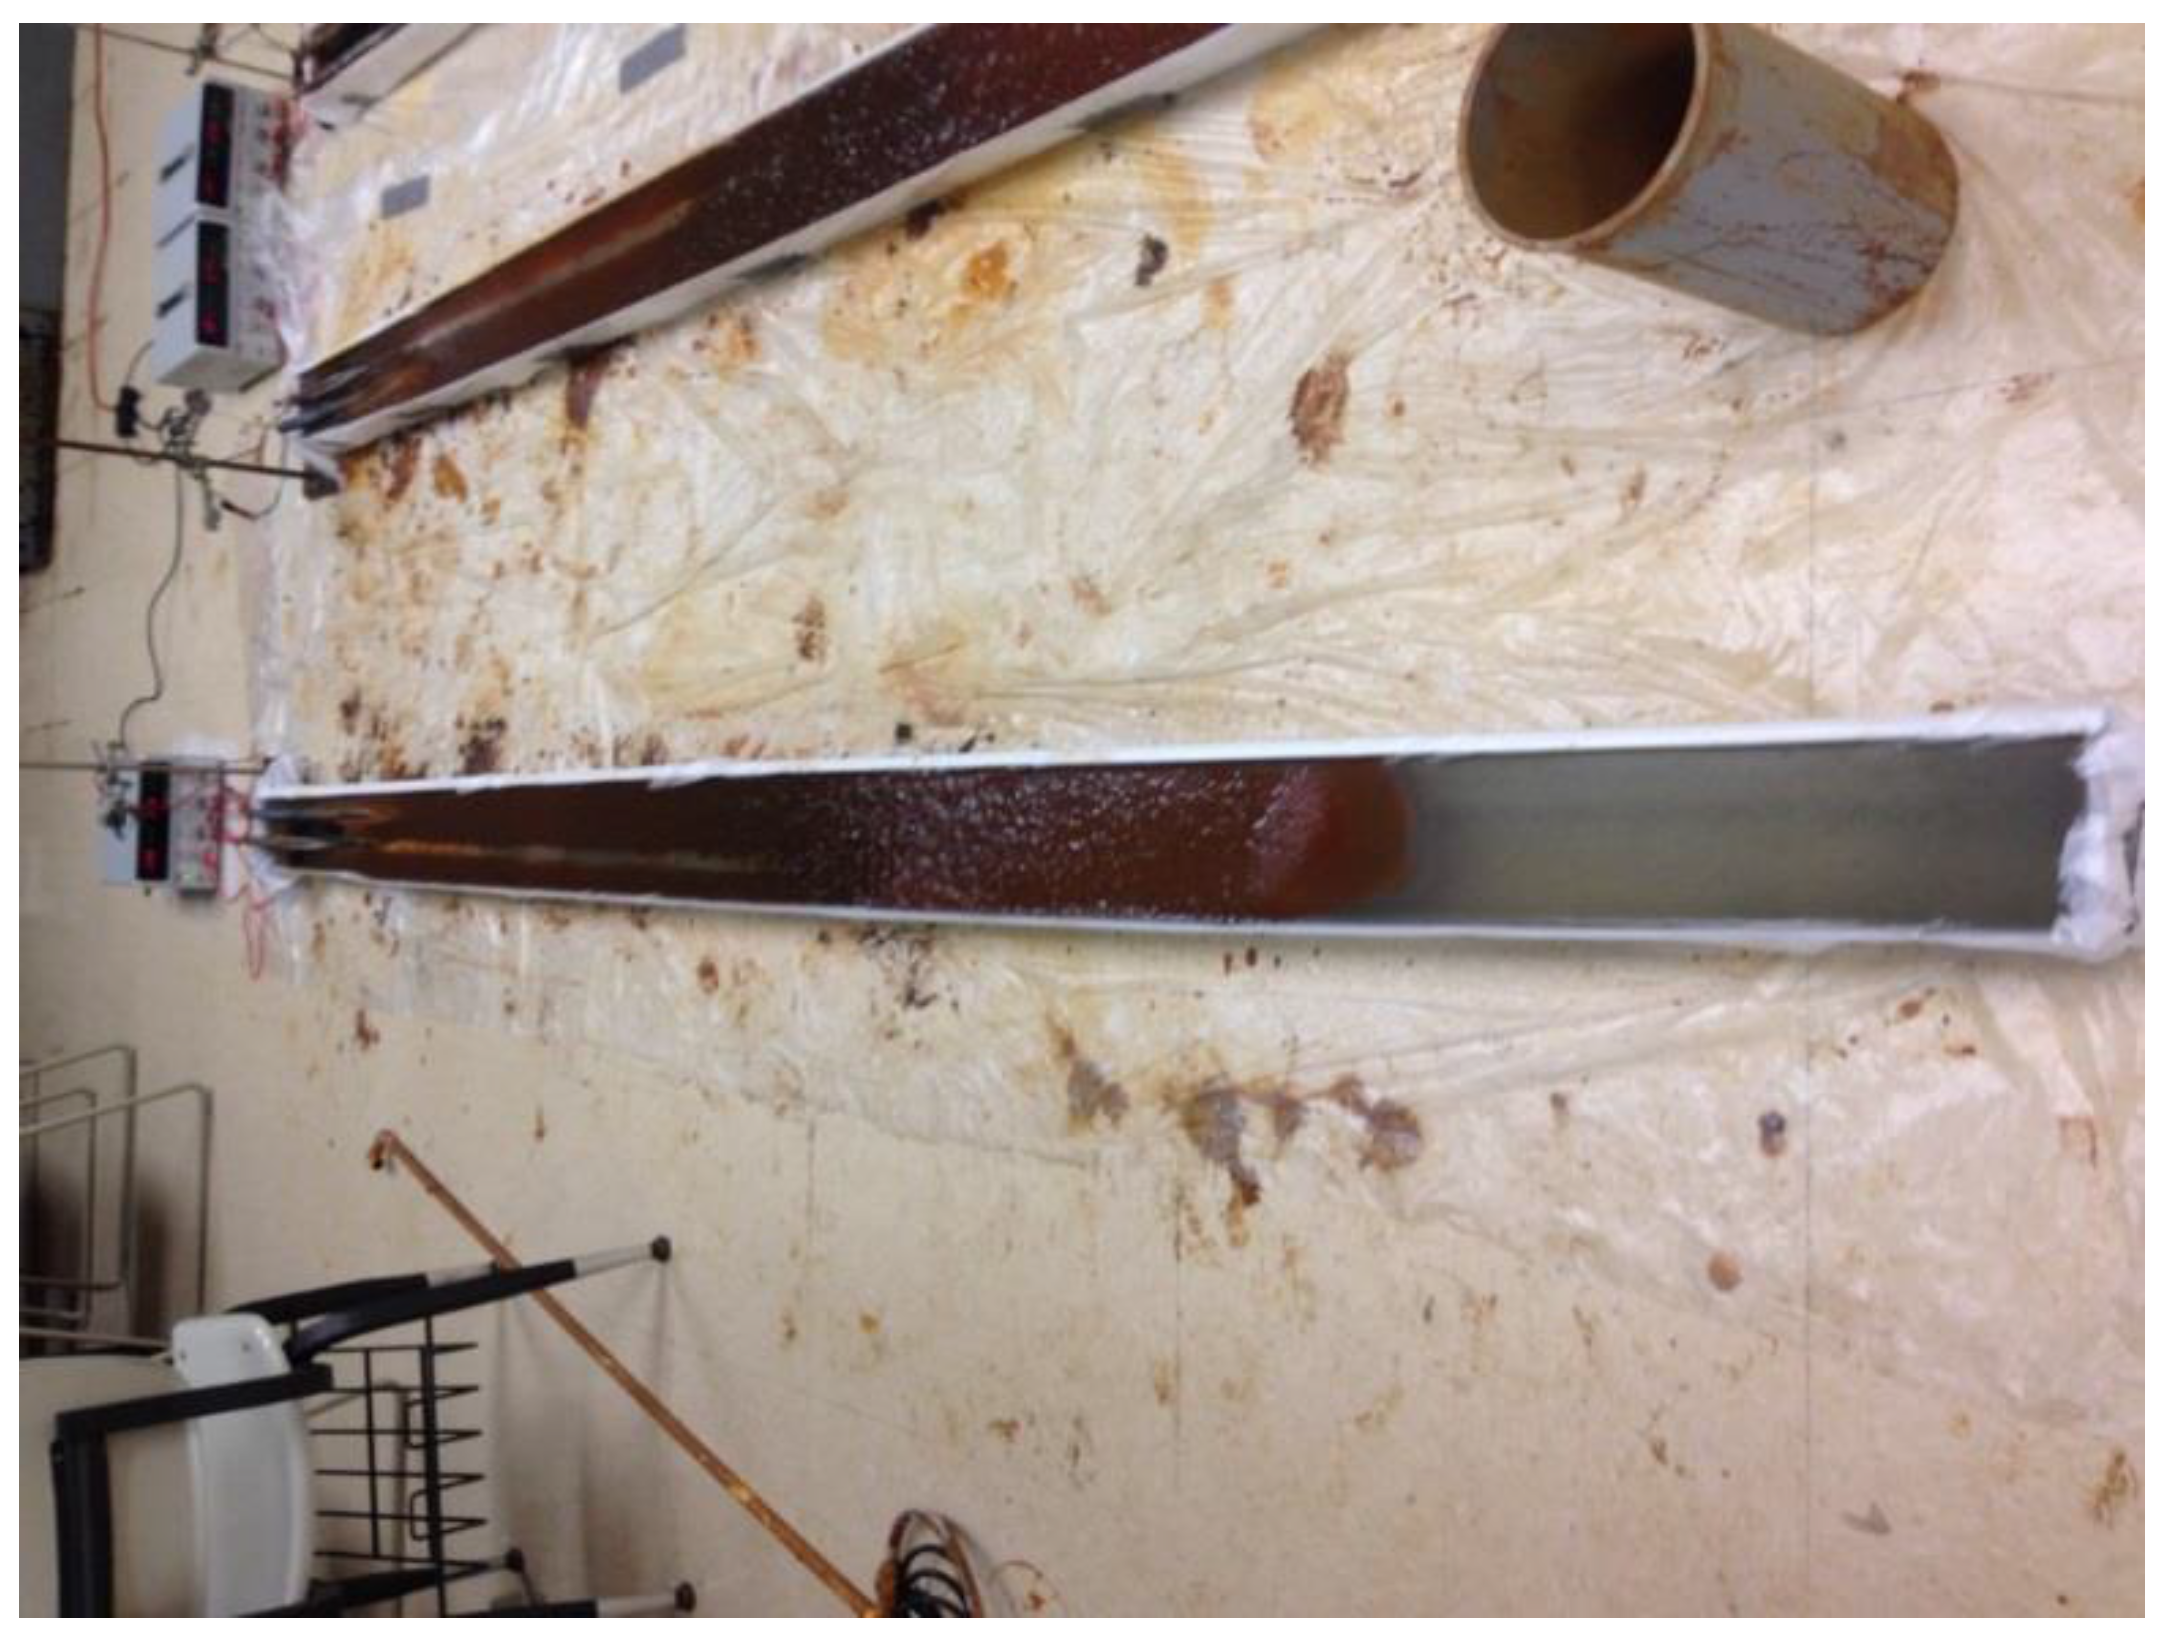
Figure 6.
Steel rebars are corroding during the test.
The test was stopped to determine the mass loss regularly. If the required corrosion level had not been achieved yet, the steel rebar would be put back to resume the test. Meanwhile, the amount of solution in the testbeds was checked daily and solution was added as needed. No heating was applied and all tests were running at room temperature. Also, as needed, the test was stopped and the steel rebar was scrubbed to remove debris to provide a fresh surface to expedite the corrosion process. It required about 3 days, 5–6 days, 10 days, 13 days, and 18 days to reach 10%, 20%, 32%, 40%, and 50% corrosion levels, respectively.
2.3. Casting of Reinforced Concrete Beams
After the SCC was prepared and rebars became ready, twelve beams were casted. A typical beam is 15.24 cm wide, 15.24 cm deep, and 1.828 m long. Distance from one support to another was 1.524 m. A typical beam was also reinforced with two (# 5) 15.875 mm diameter deformed rebars. Shear reinforcement was applied by providing three 6.35 mm diameter A36 stirrups at 203.2 mm spacing. The distance from the center of one support to the center of the first stirrup is 50.8 mm. A cover of 25.4 mm was applied all around the reinforcement.
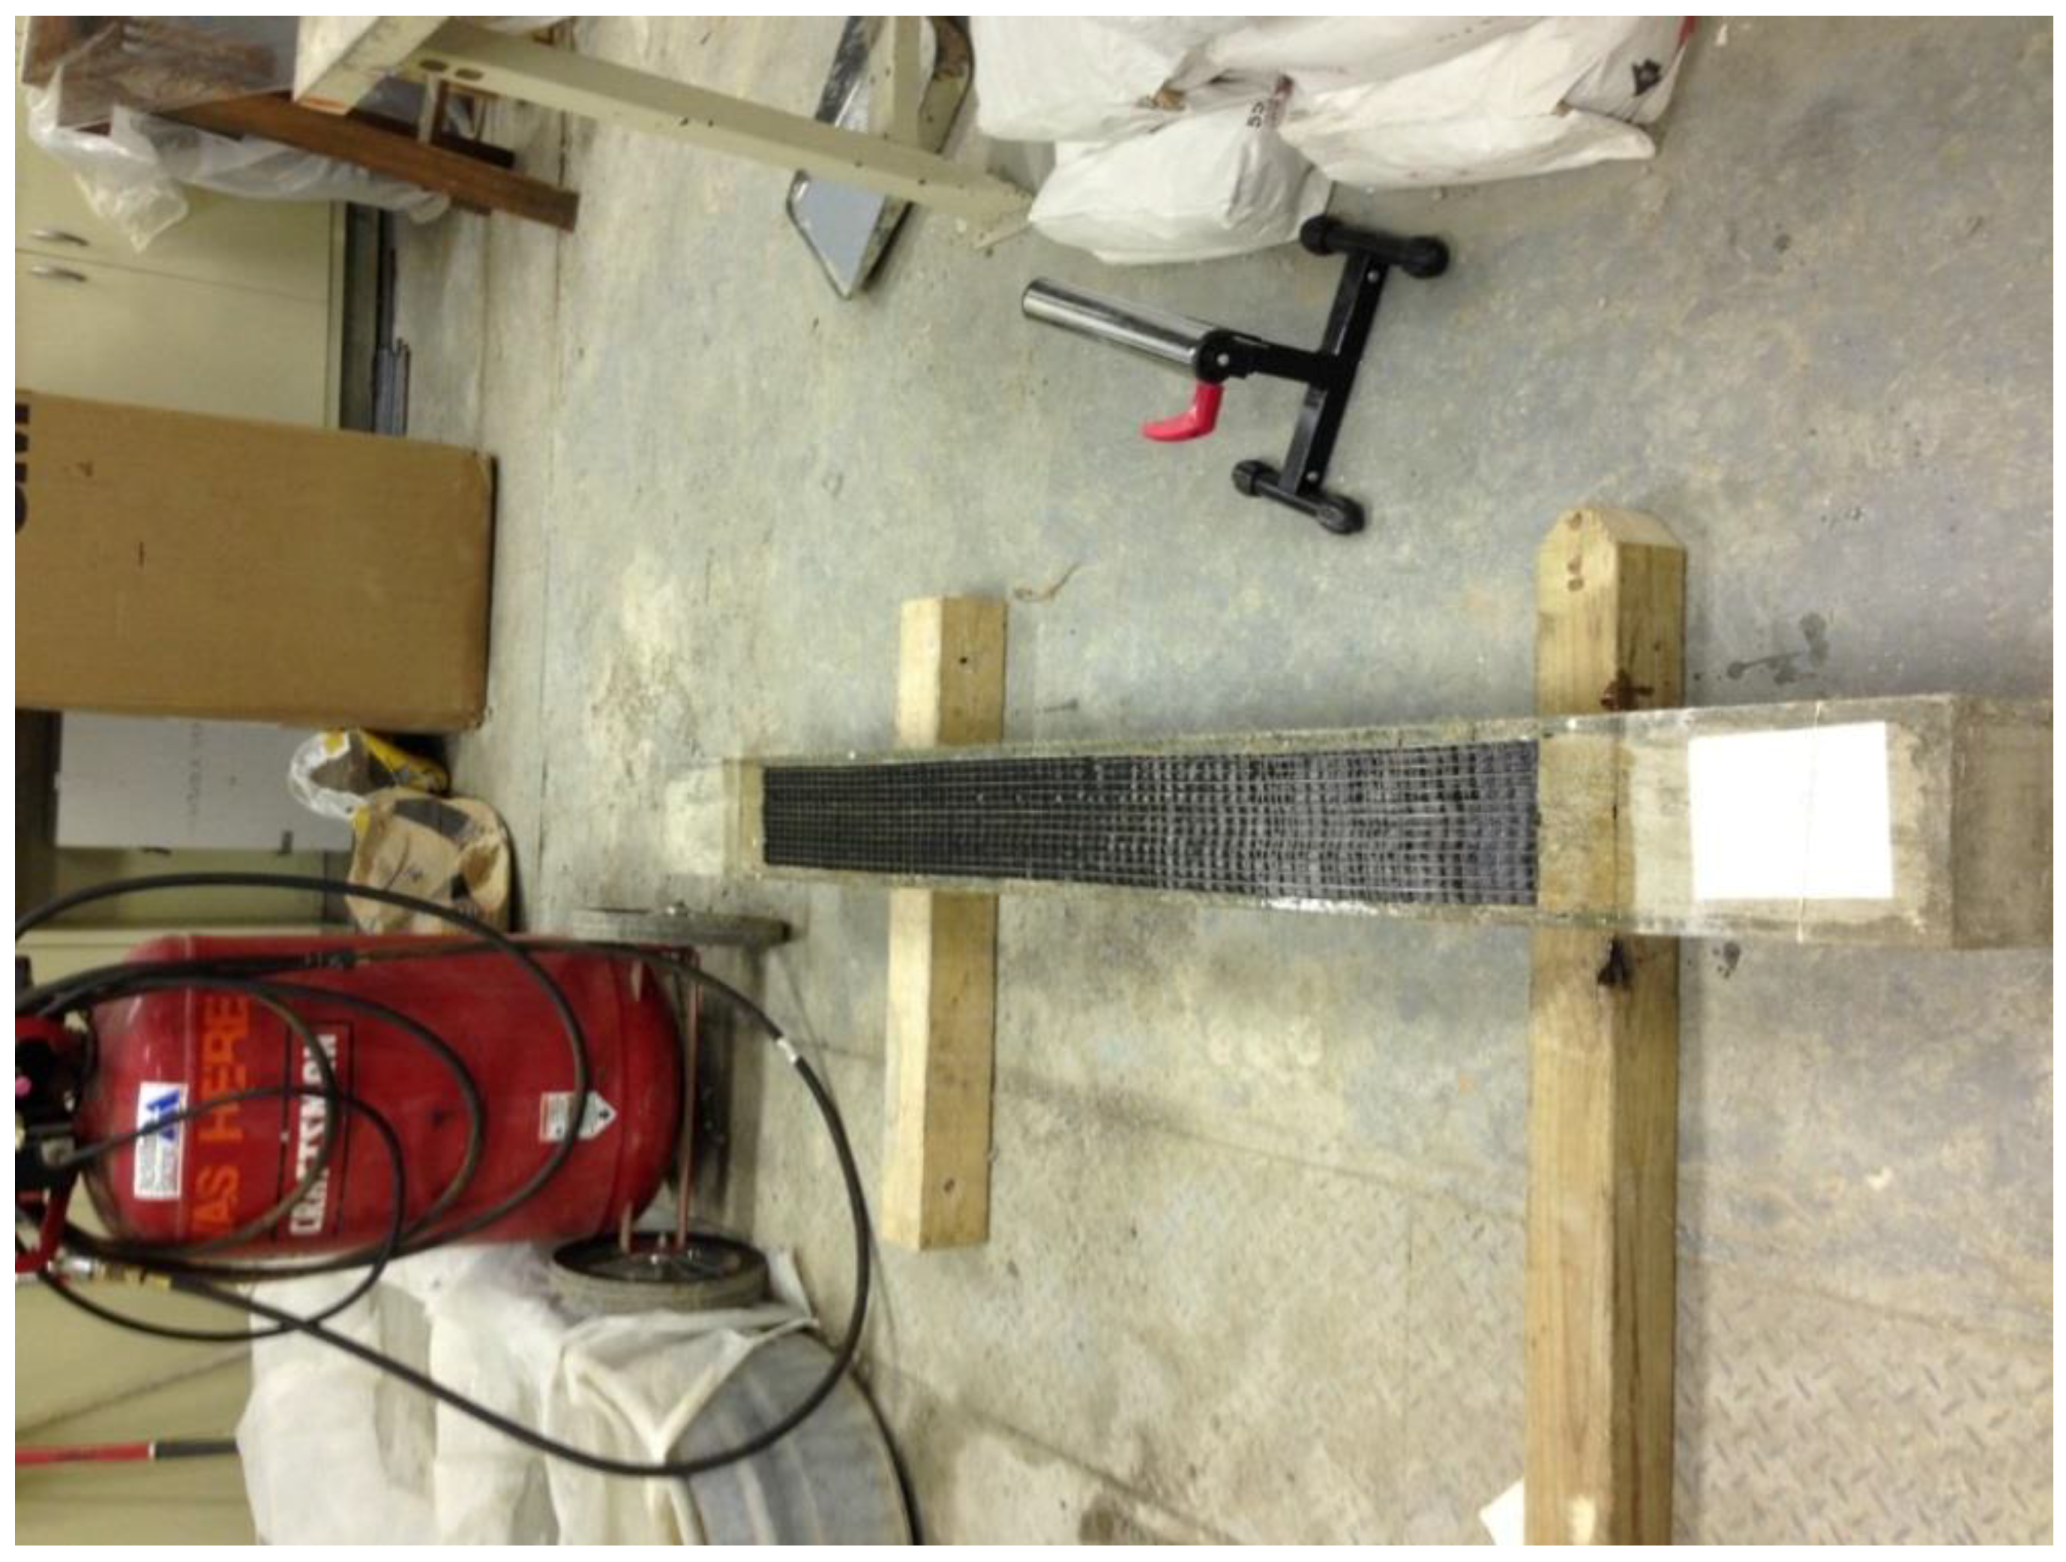
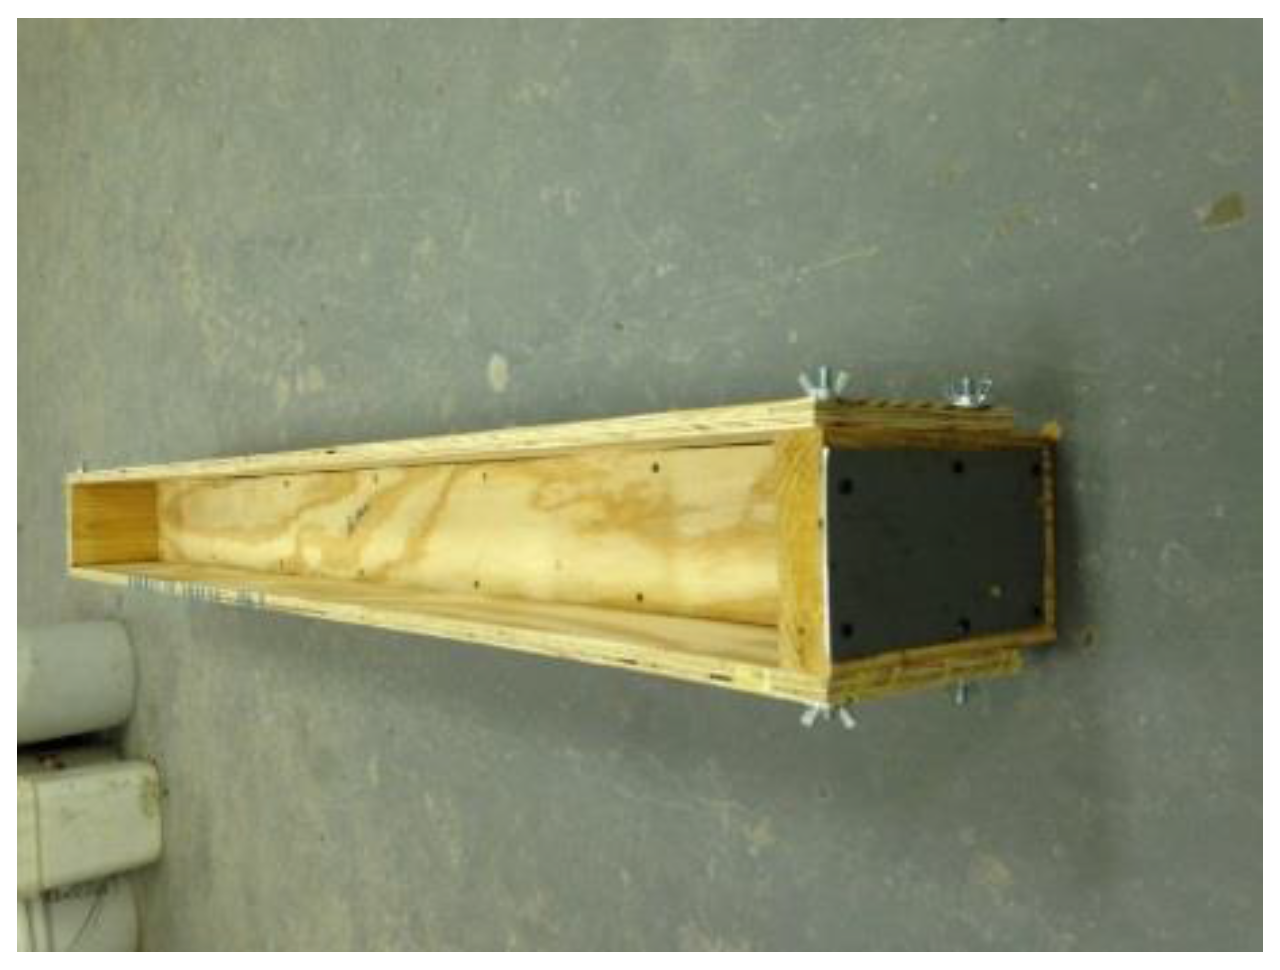
The two control beams were reinforced with two rebars, which did not experience any corrosion, whereas, the remaining beams were reinforced with a pair of rebars that contain different corrosion levels. After the reinforcement cage was assembled, chairs were attached to the bottom and sides of the cage to provide the needed cover. The cage was placed in the designed formwork (Figure 7), and then the prepared SCC was poured. SCC was poured only from one side of the beam and was able to completely fill the formwork without the need for any mechanical compaction. The casted beams were allowed to cure for 28 days, afterwards repair and testing were performed.
Figure 7.
Formwork.
2.4. Repair of Reinforced Concrete Beams
To study the effectiveness of repair, some beams were repaired and some were not for comparison purposes. One of the two control beams did not have any repair (CB-CN) as N represents “no repair”. Beams with rebars with corrosion levels of 10% (E 10–CN), 20% (E 20–CN), 32% (E 30–CN), 40% (E 40–CN), and 50% (E 50–CN) were not repaired. Tyfo SCH-41 CFRP sheets and two-part Tyfo S epoxy were used to repair the beams. The properties of CFRP materials are presented in Table 3. The other control beam (CB-CR) as R represents “repair” is repaired with only CFRP U-wraps to introduce only shear strengthening. The U-wrap is applied as shown in Figure 8. The beams with rebars with corrosion levels of 10% (E 10–CR), 20% (E 20–CR), 32% (E 32–CR), 40% (E 40–CR), and 50% (E 50–CR) were repaired with both one layer CFRP sheets and U-wraps. The CFRP sheets, installed to the bottom of the beams, are 12.7 cm wide and 1.22 m long.
| CFRP Properties | Dry Material Properties | Composite Material Properties |
|---|---|---|
| Tensile Strength (GPa) | 4.0 | 0.834 |
| Tensile Modulus (GPa) | 230.0 | 82.0 |
| Ultimate Elongation (%) | 1.7 | 1.0 |
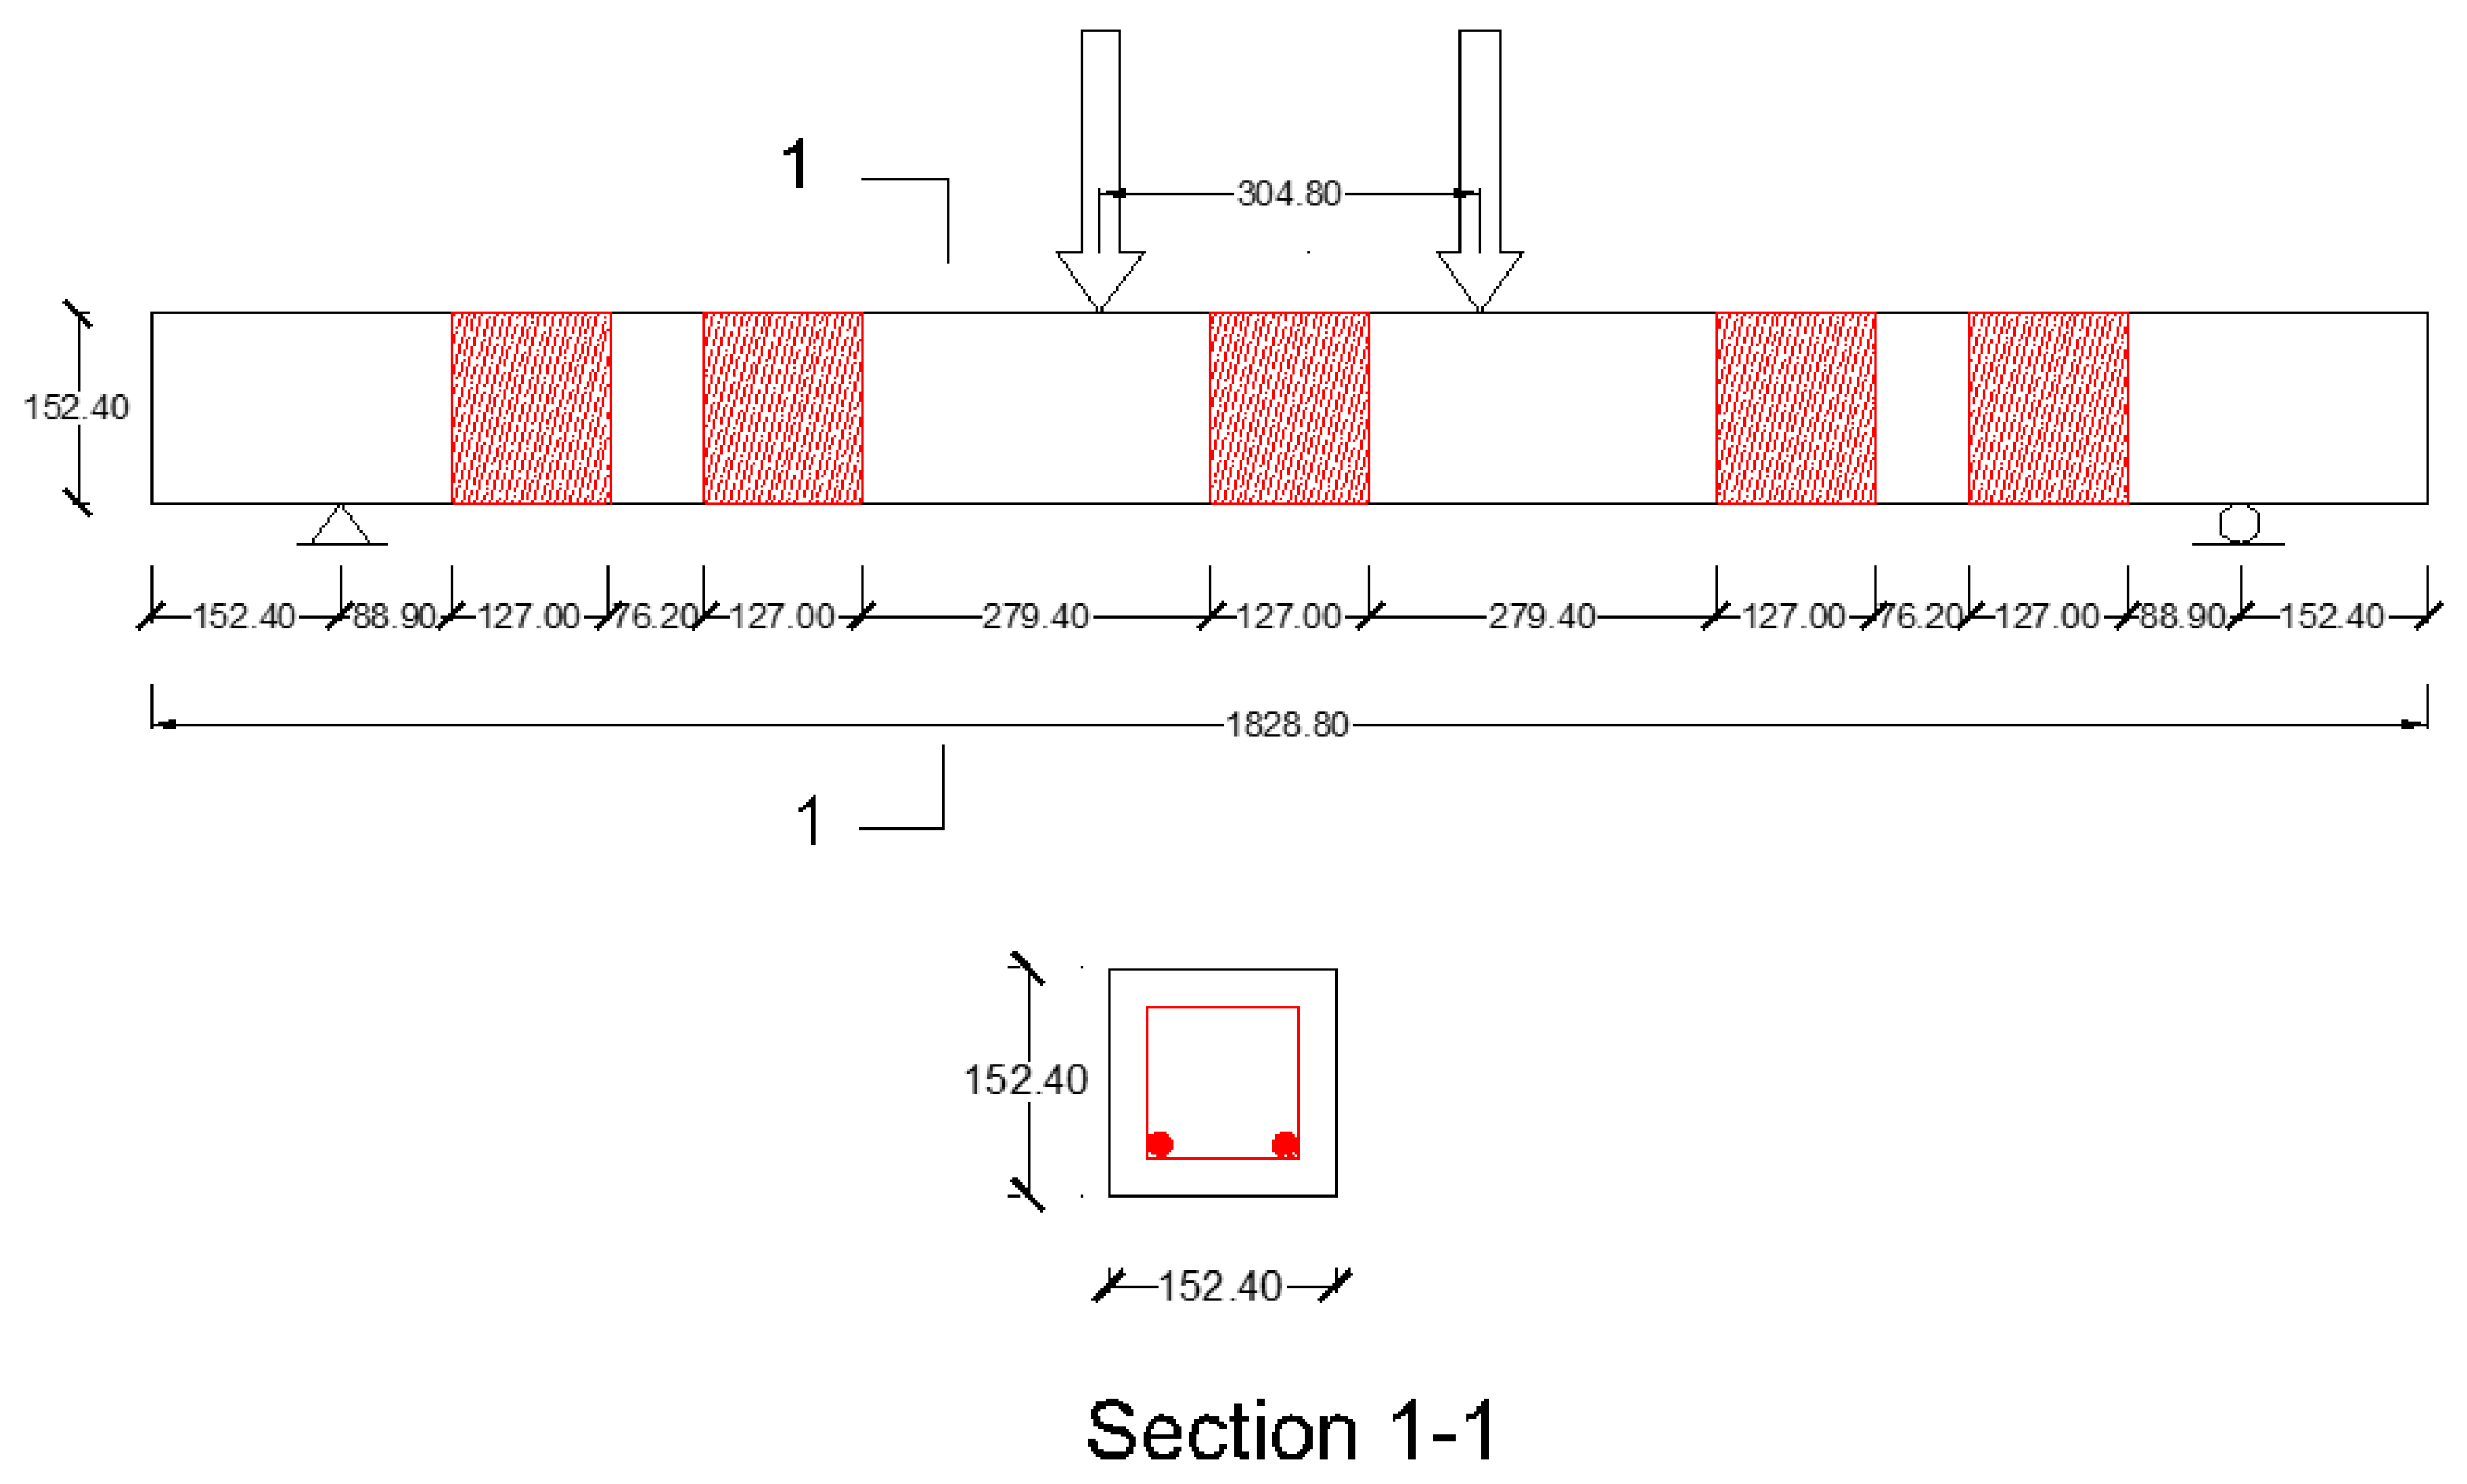
Figure 8.
A Typical test setup for a repaired reinforced concrete (RC) member (dimensions are in mm).
Figure 8.
A Typical test setup for a repaired reinforced concrete (RC) member (dimensions are in mm).
A number of steps were undertaken to prepare the beam before CFRP was applied as recommended by the manufacturer. The beams were flipped so the bottom is facing up. The CFRP sheets and U-wrap were cut and becoming ready. The beams were sanded and air blasted. A primer layer of epoxy was applied to the beam, where CFRP will be applied. The CFRP that had epoxy already were applied to the designated locations in the beam (Figure 9). Pressure was applied against the fabric to work out any air pockets between the fabric and beam’s surface. Another layer of epoxy was applied to the CFRP using a painting roller. A weight was placed on the top of the beam and also a lateral system was placed to hold the U-wrap in place (Figure 10). After epoxy cured, repaired beams were tested.
Figure 9.
Installation of CFRP sheets.

Figure 10.
RC members after repair.

It should be noted that a number of assumptions were used in this study (1) while the rebars had different levels of corrosion, it was assumed that all beams experienced the same level of deterioration in concrete; (2) a perfect bond between rebars and concrete was assumed; however, bond will be affected since bars surface will become smooth due to corrosion.
2.5. Testing
All of the beams were tested under static loading until failure. The beams are CB–CN, CB–CR, E 10–CN, E 10–CR, E 20–CN, E 20–CR, E 32–CN, E 32–CR, E 40–CN, E 40–CR, E 50–CN, and E 50–CR. The beams were placed on the test setup, where the center to center distance between supports is 1.524 m. Four-point test loads were applied to each beam through a loading frame placed at the mid-span of the beam. The four-point test loads were 30.48 cm apart. The load was applied using an Instron machine until failure.
3. Results and Discussion
3.1. Characteristics of Self-Consolidating Concrete
As stated before, fresh and hardened properties of the SCC concrete mixture containing both SCM and RAP were investigated (Table 4). The concrete mixture achieved a slump flow value above the minimum limits of SCC. Also, the difference in diameter between that from slump flow and that from J-Ring tests was smaller than 50.8 mm. Also, VSI score did not exceed 1.
| VSI | 1 |
|---|---|
| Slump Flow (mm) | 749.3 |
| Slump Flow with J-Ring (mm) | 698.5 |
| T50 (seconds) | 5.0 |
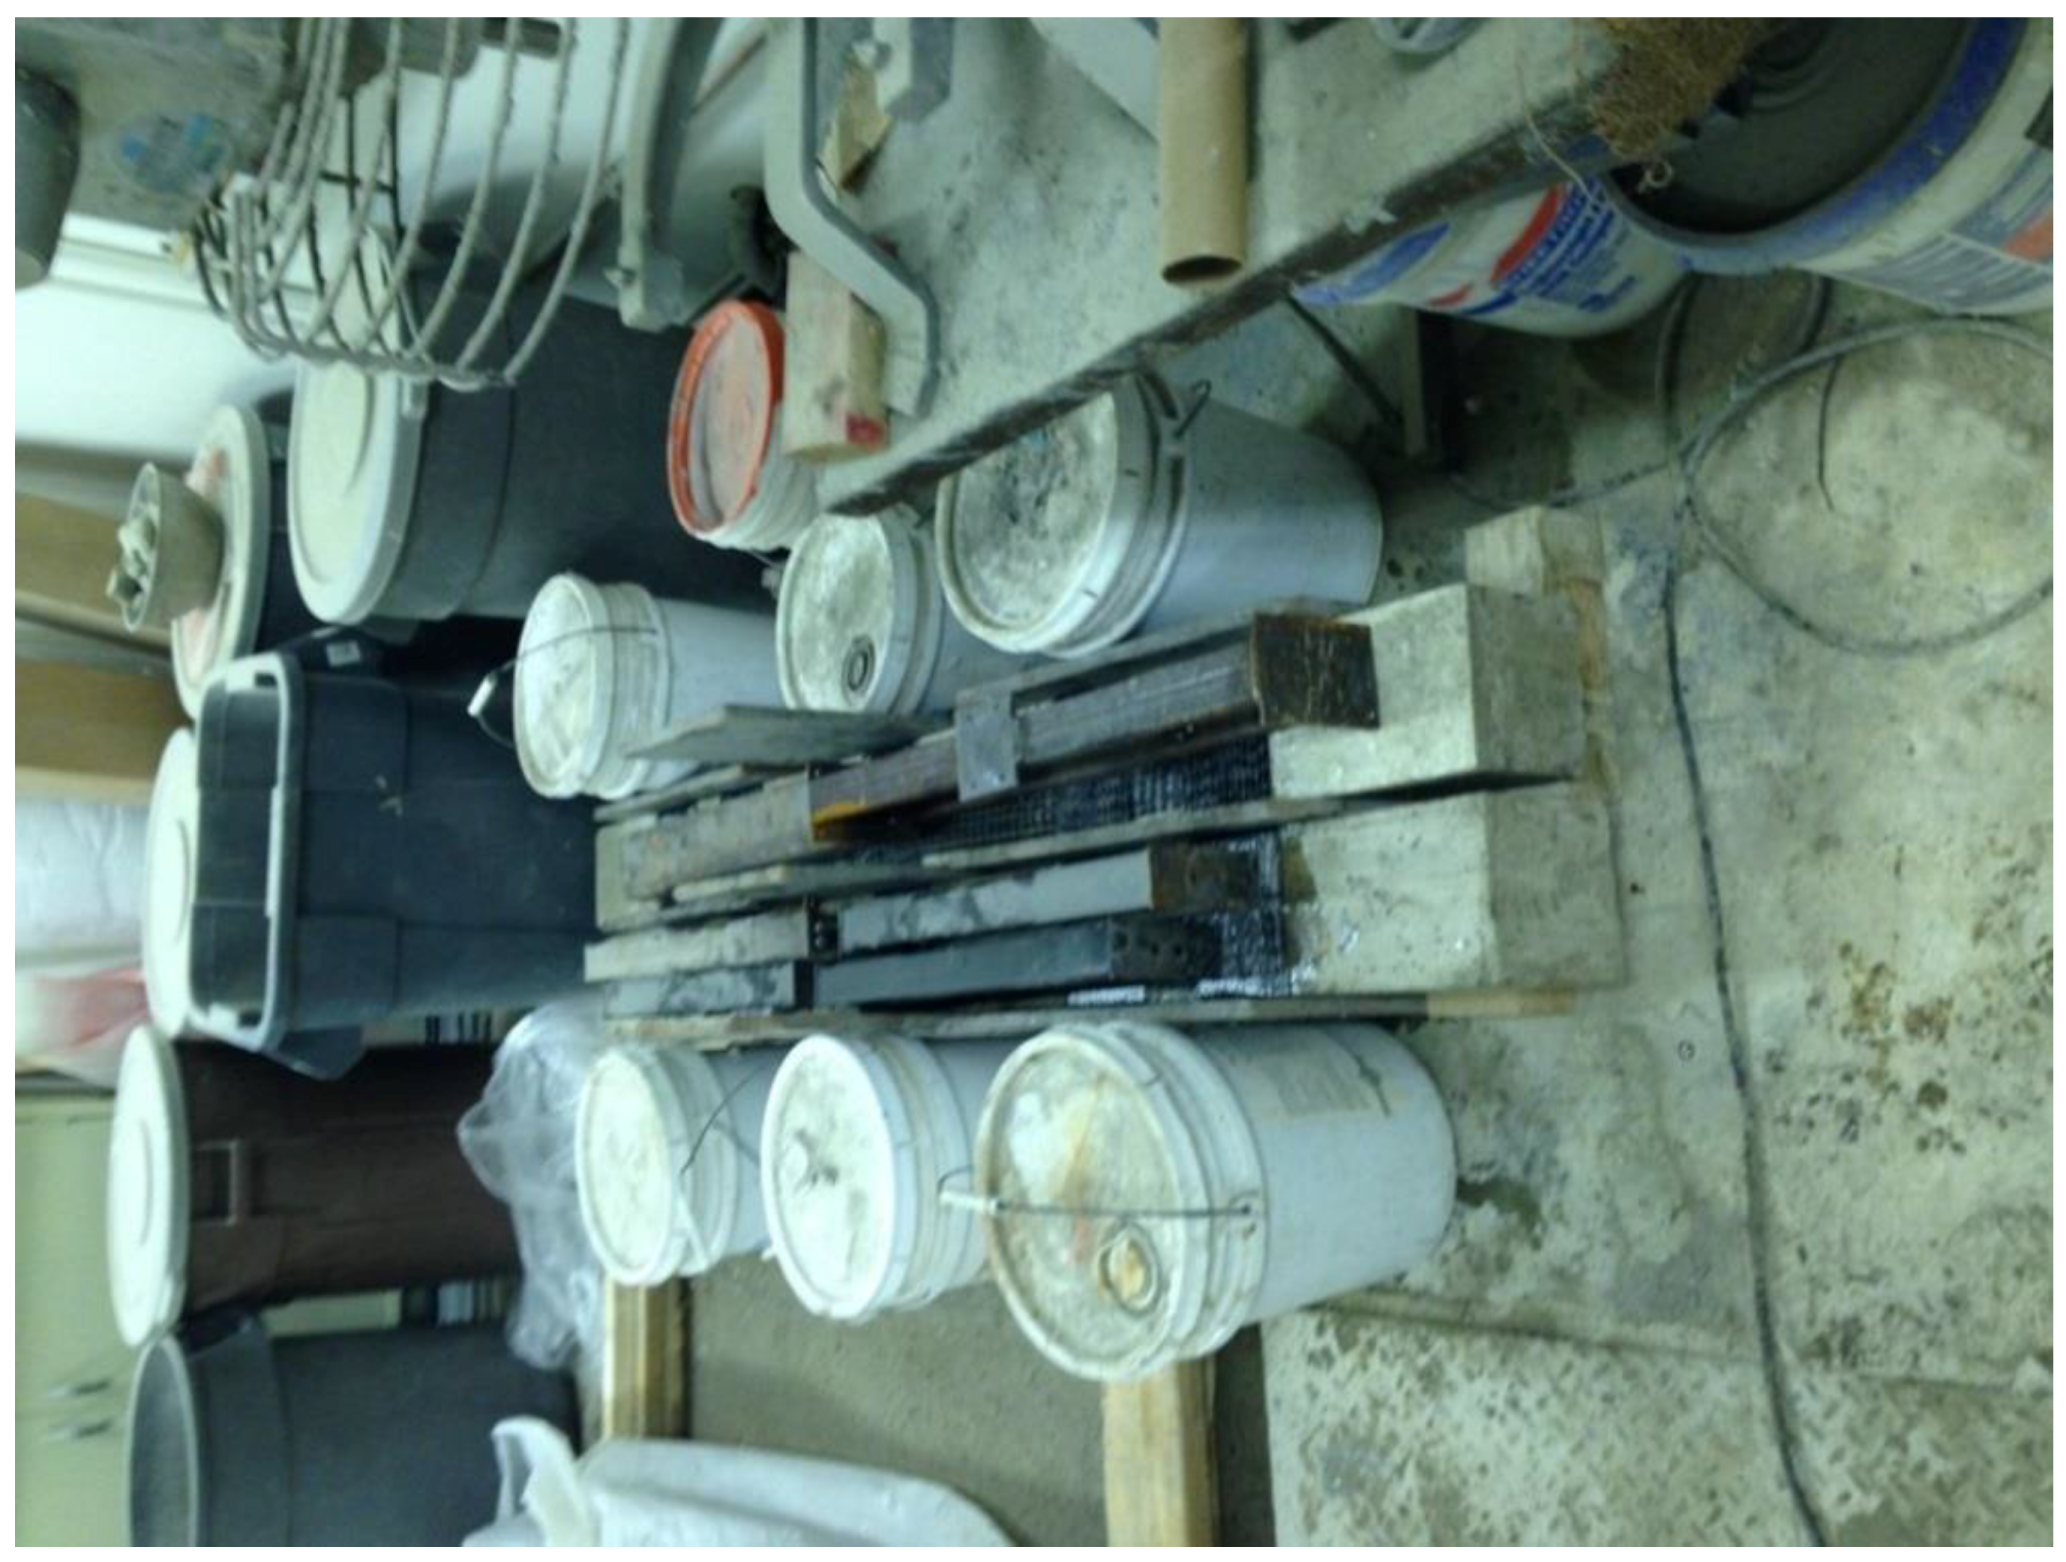
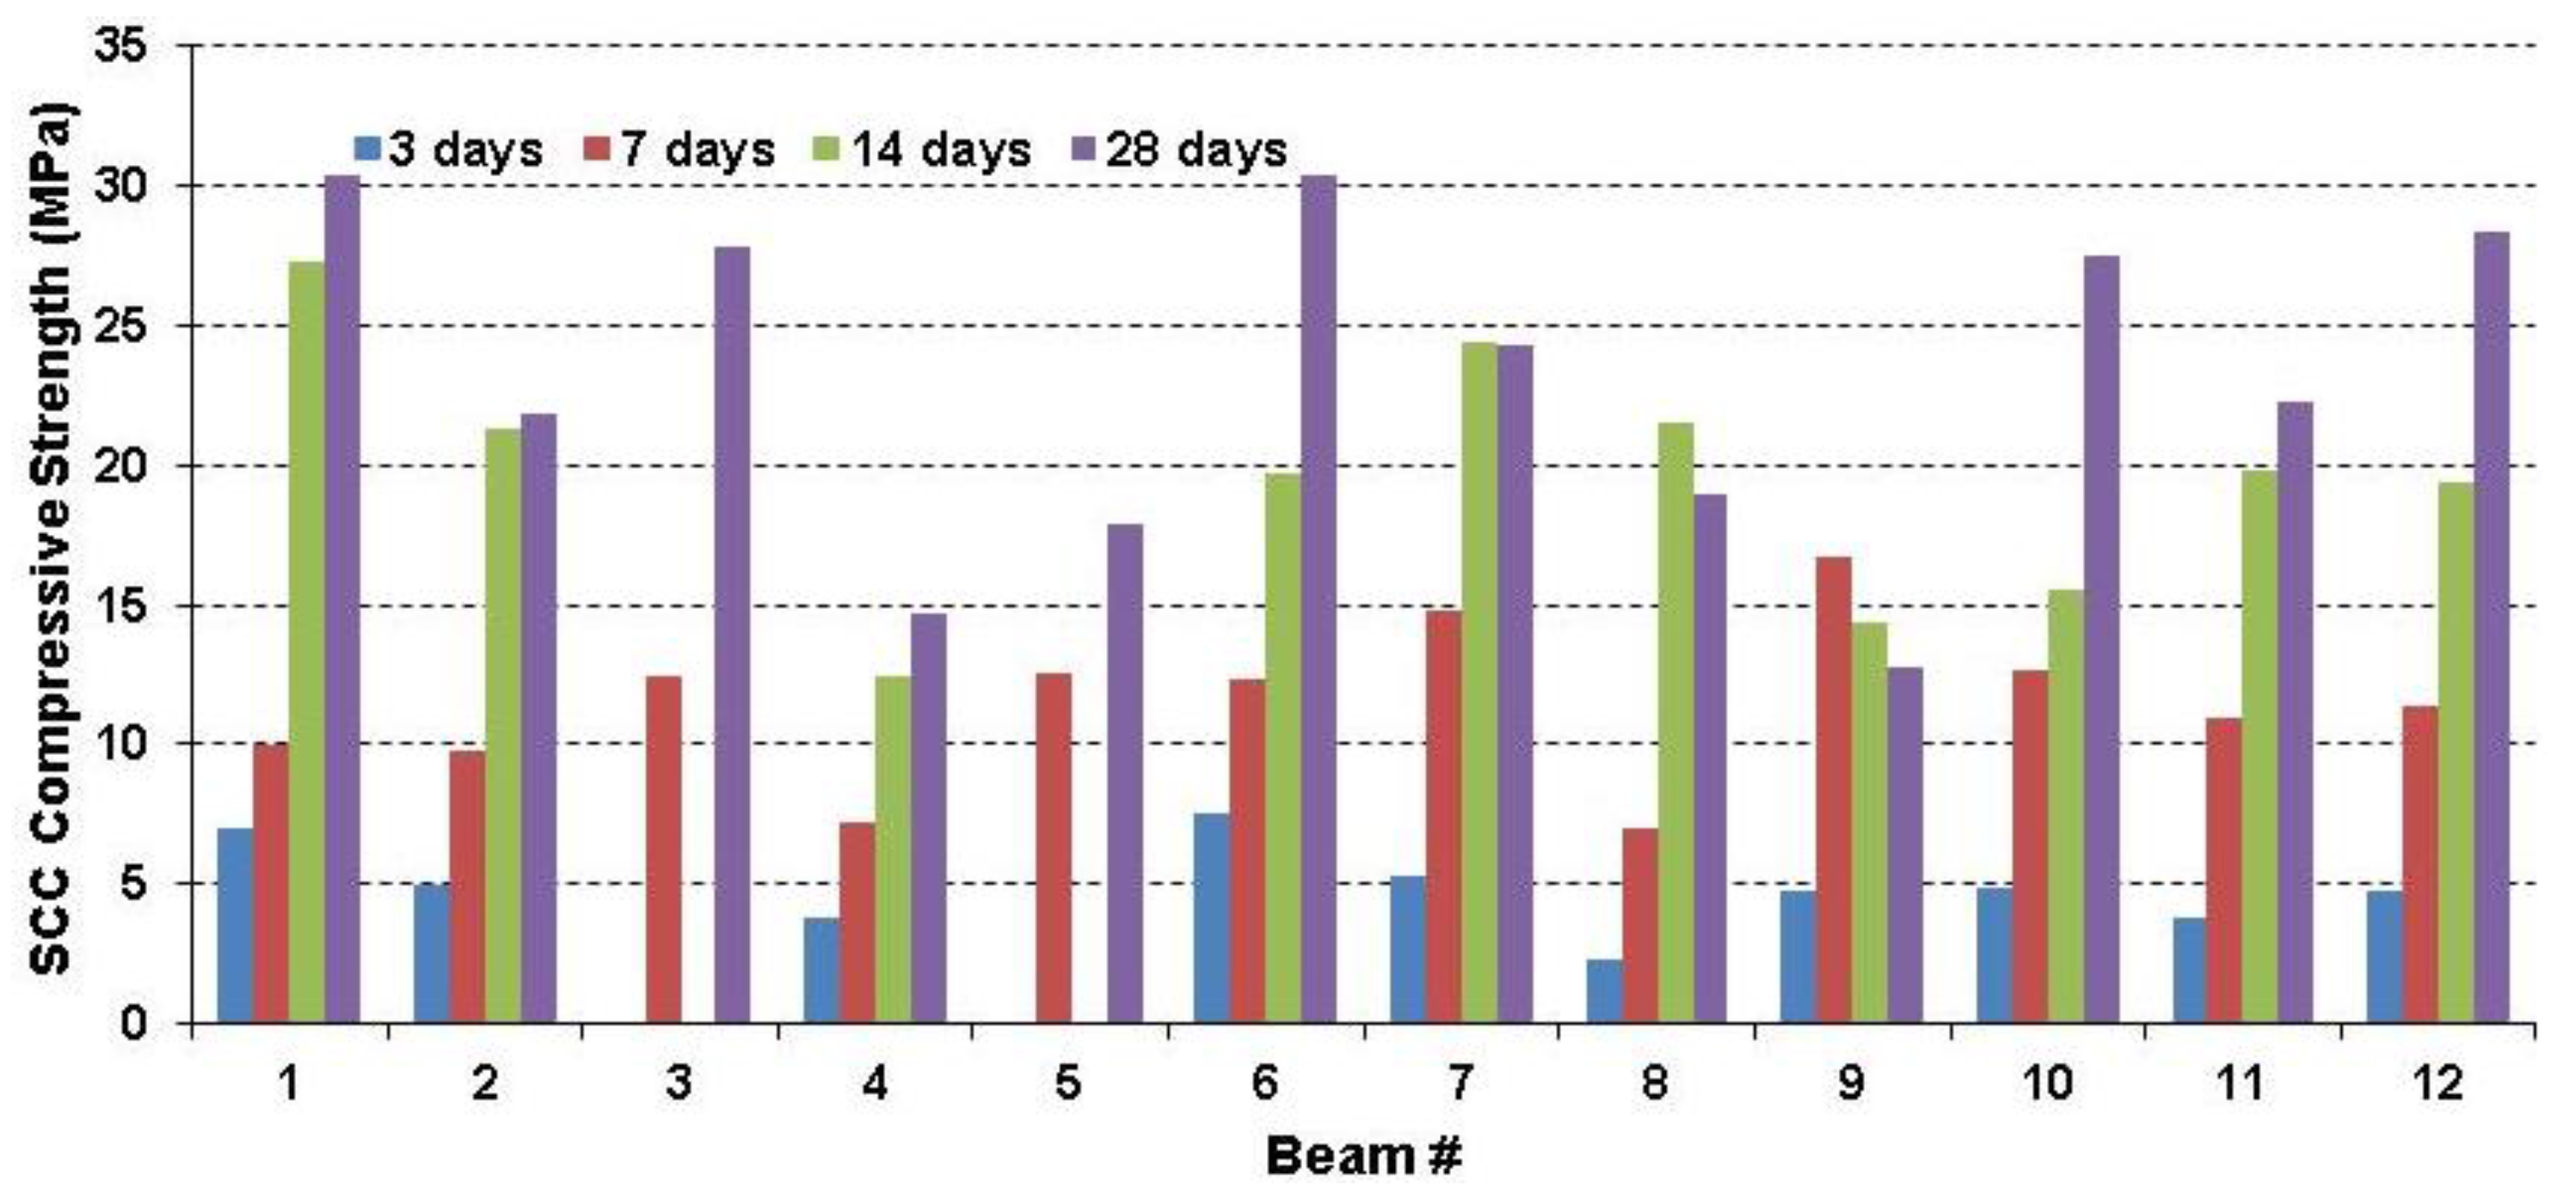
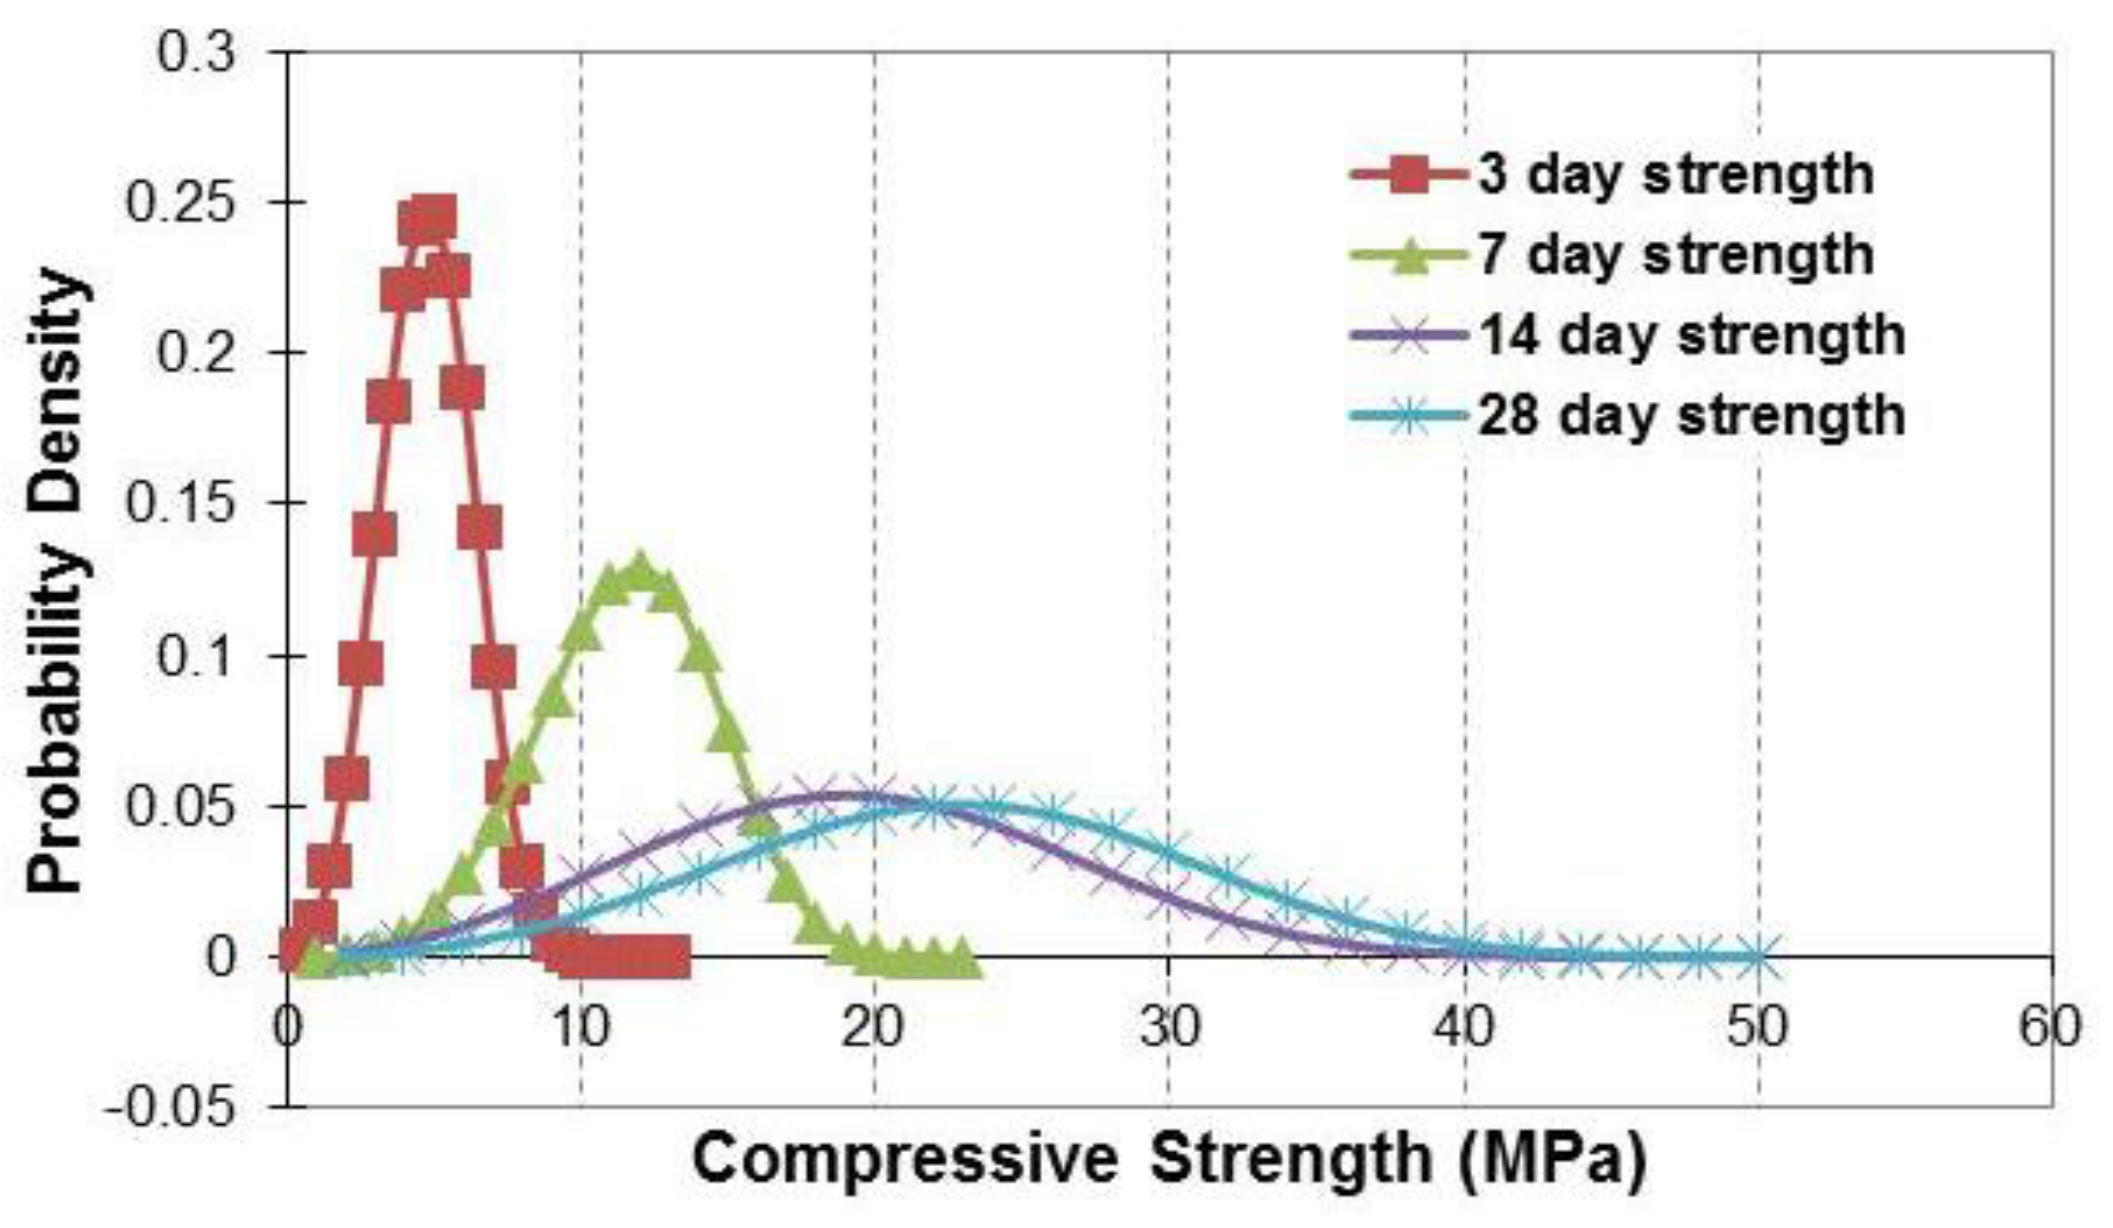
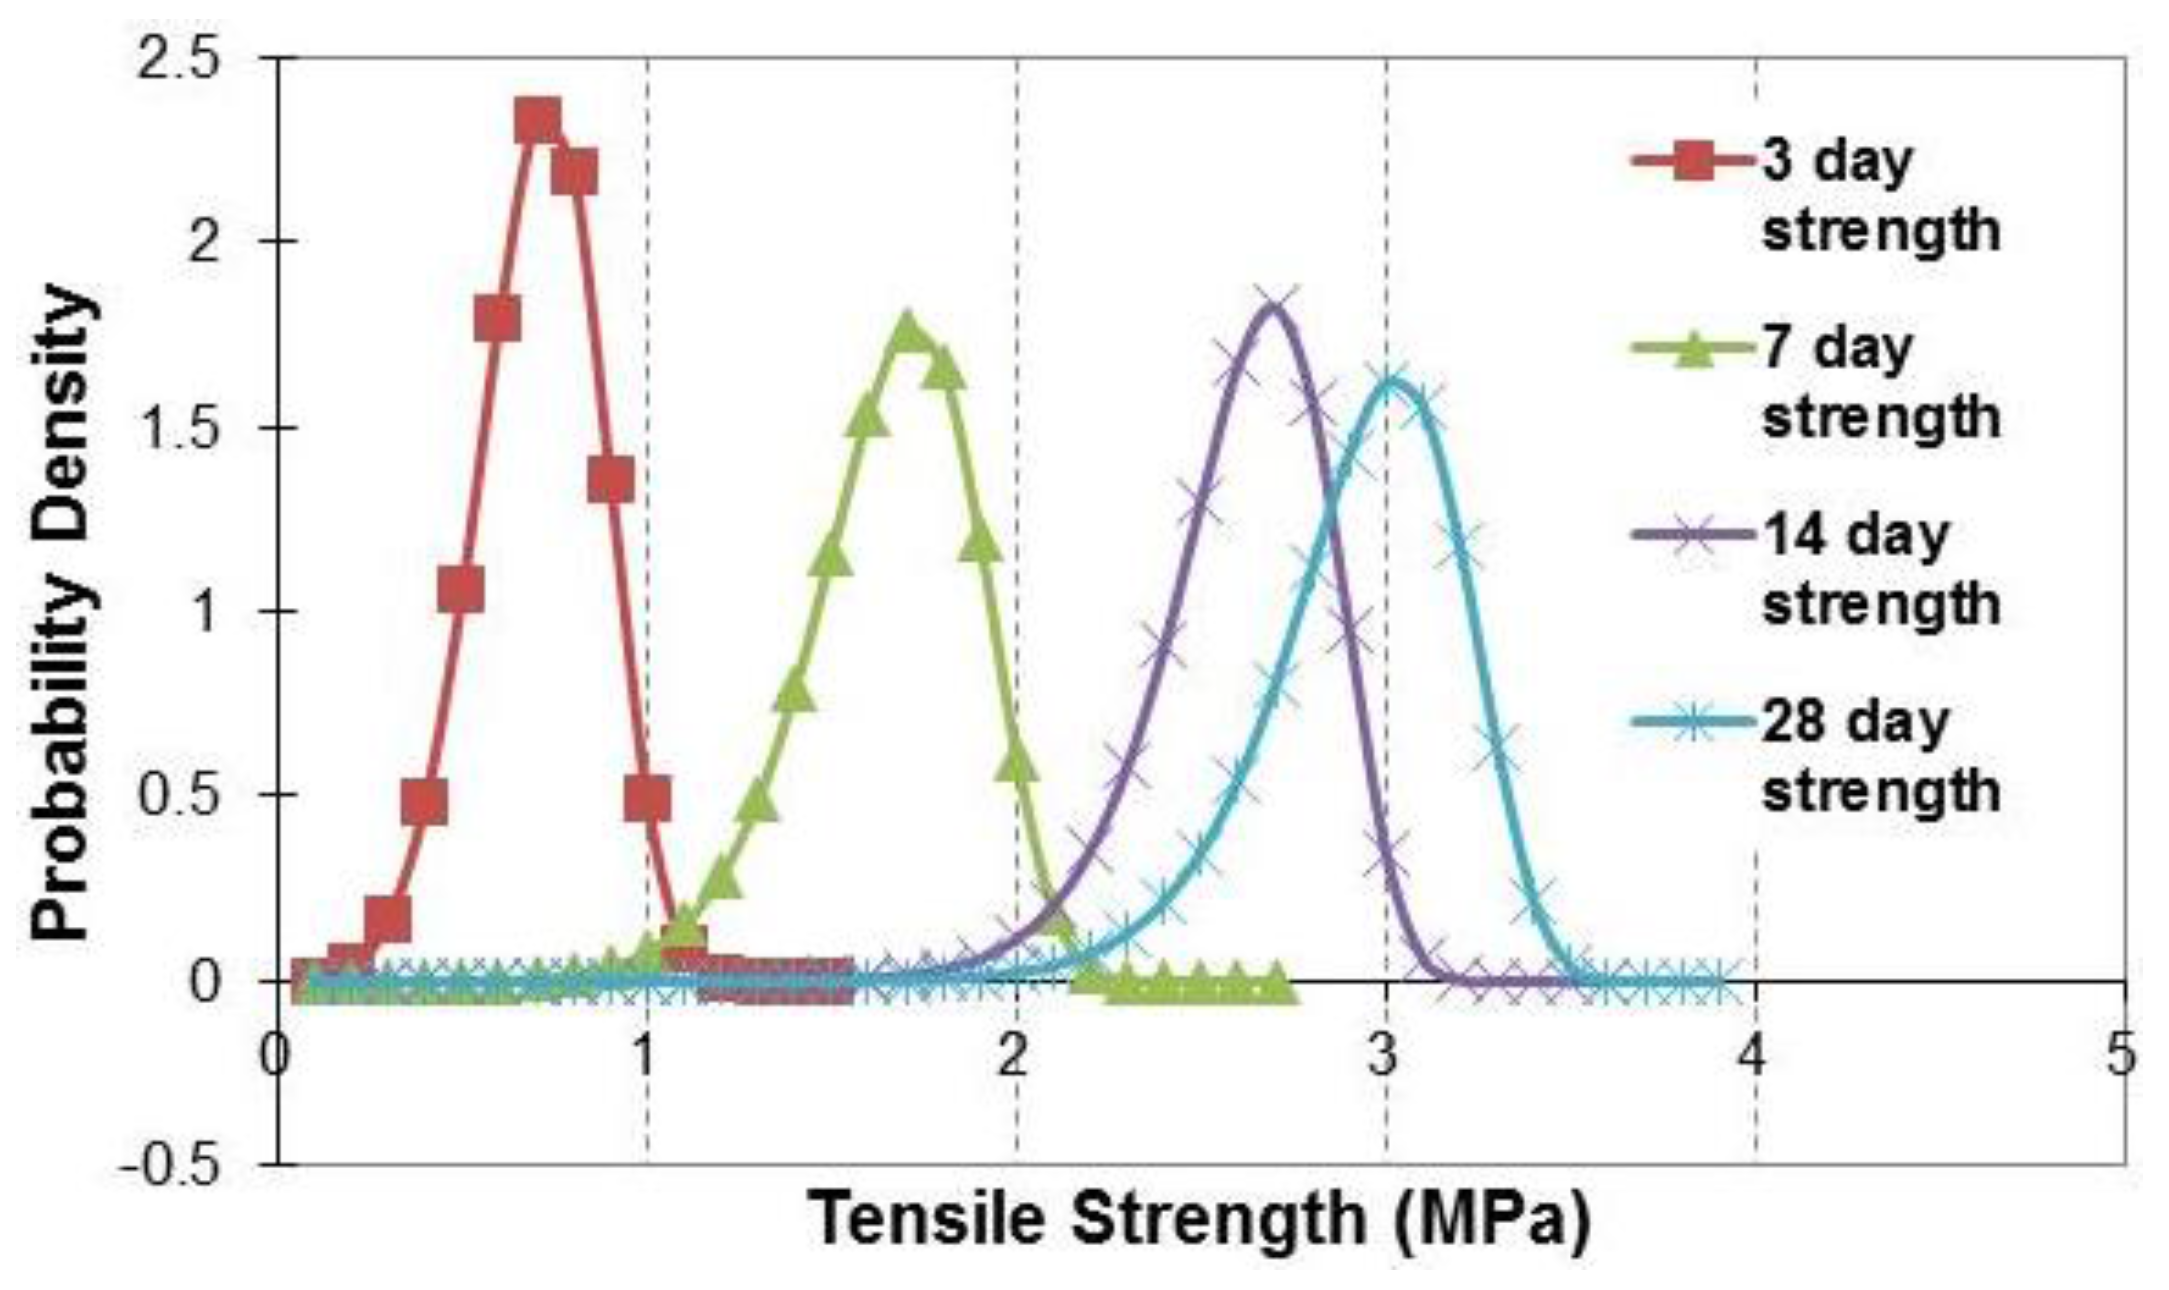
Figure 11 and Figure 12 show the results of compressive and tensile strength at 3, 7, 14, and 28 days for all of the concrete samples taken from SCC mixtures for all of the twelve beams (Figure 13), respectively. Results analyzed statically using Weibull distribution are also presented in Figure 14 and Figure 15. Table 5 presents a comparison between the average concrete strength and mean concrete strength calculated using Weibull distribution.
Figure 11.
Compressive strength of concrete used in beams.

Figure 12.
Tensile strength of concrete used in beams.
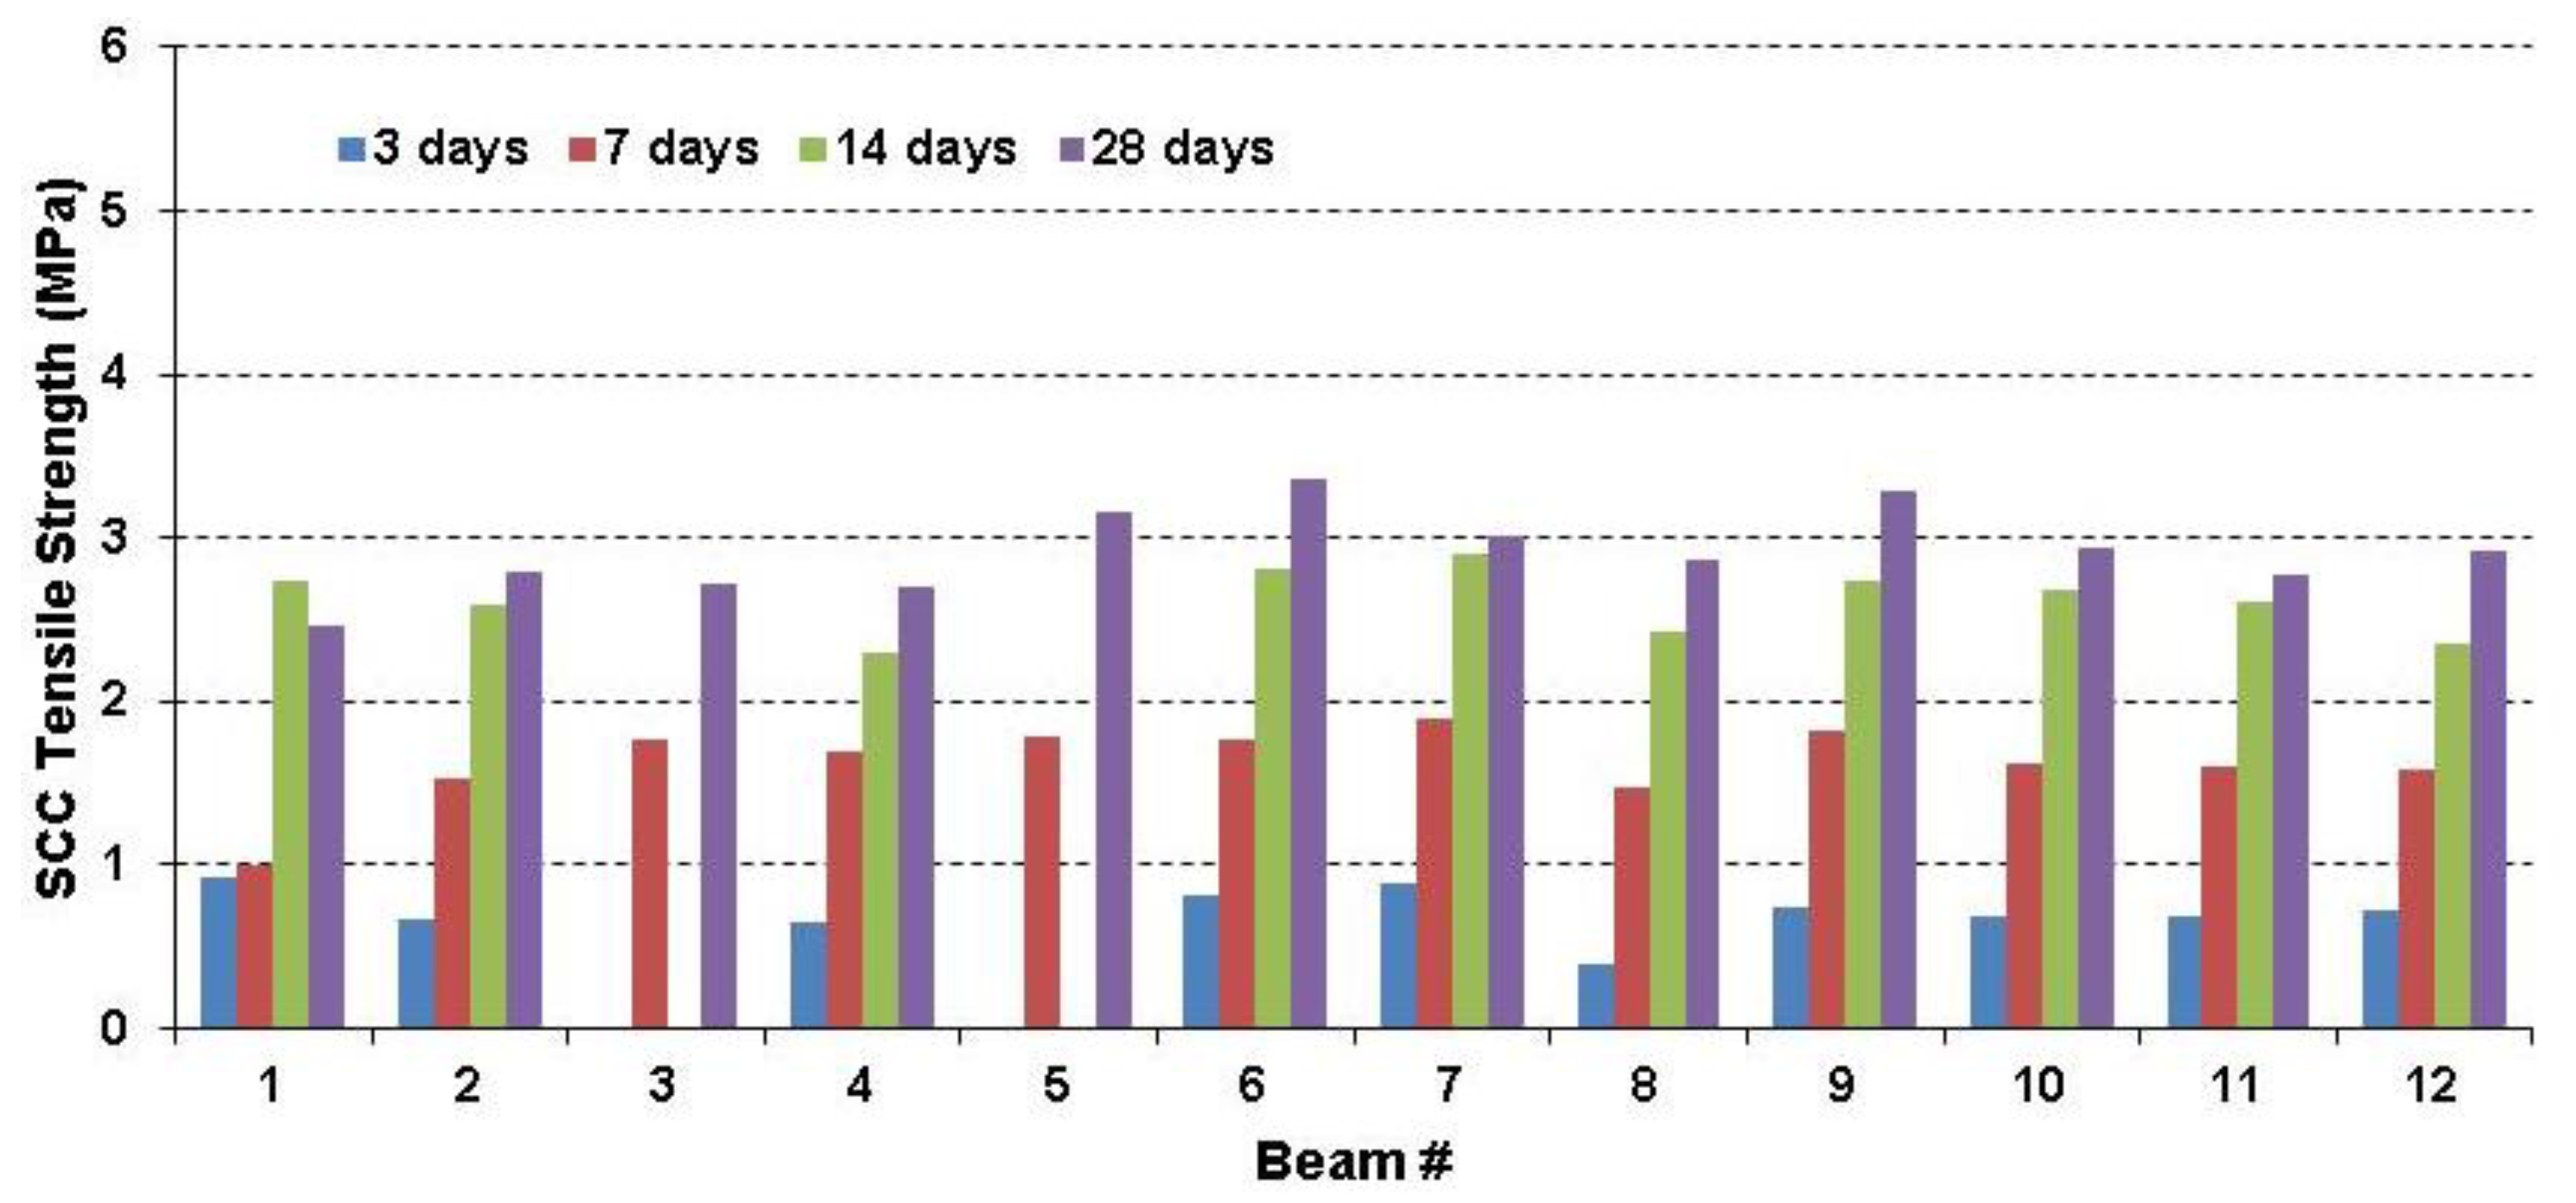
Figure 13.
A sample of concrete samples taken for concrete mixtures.
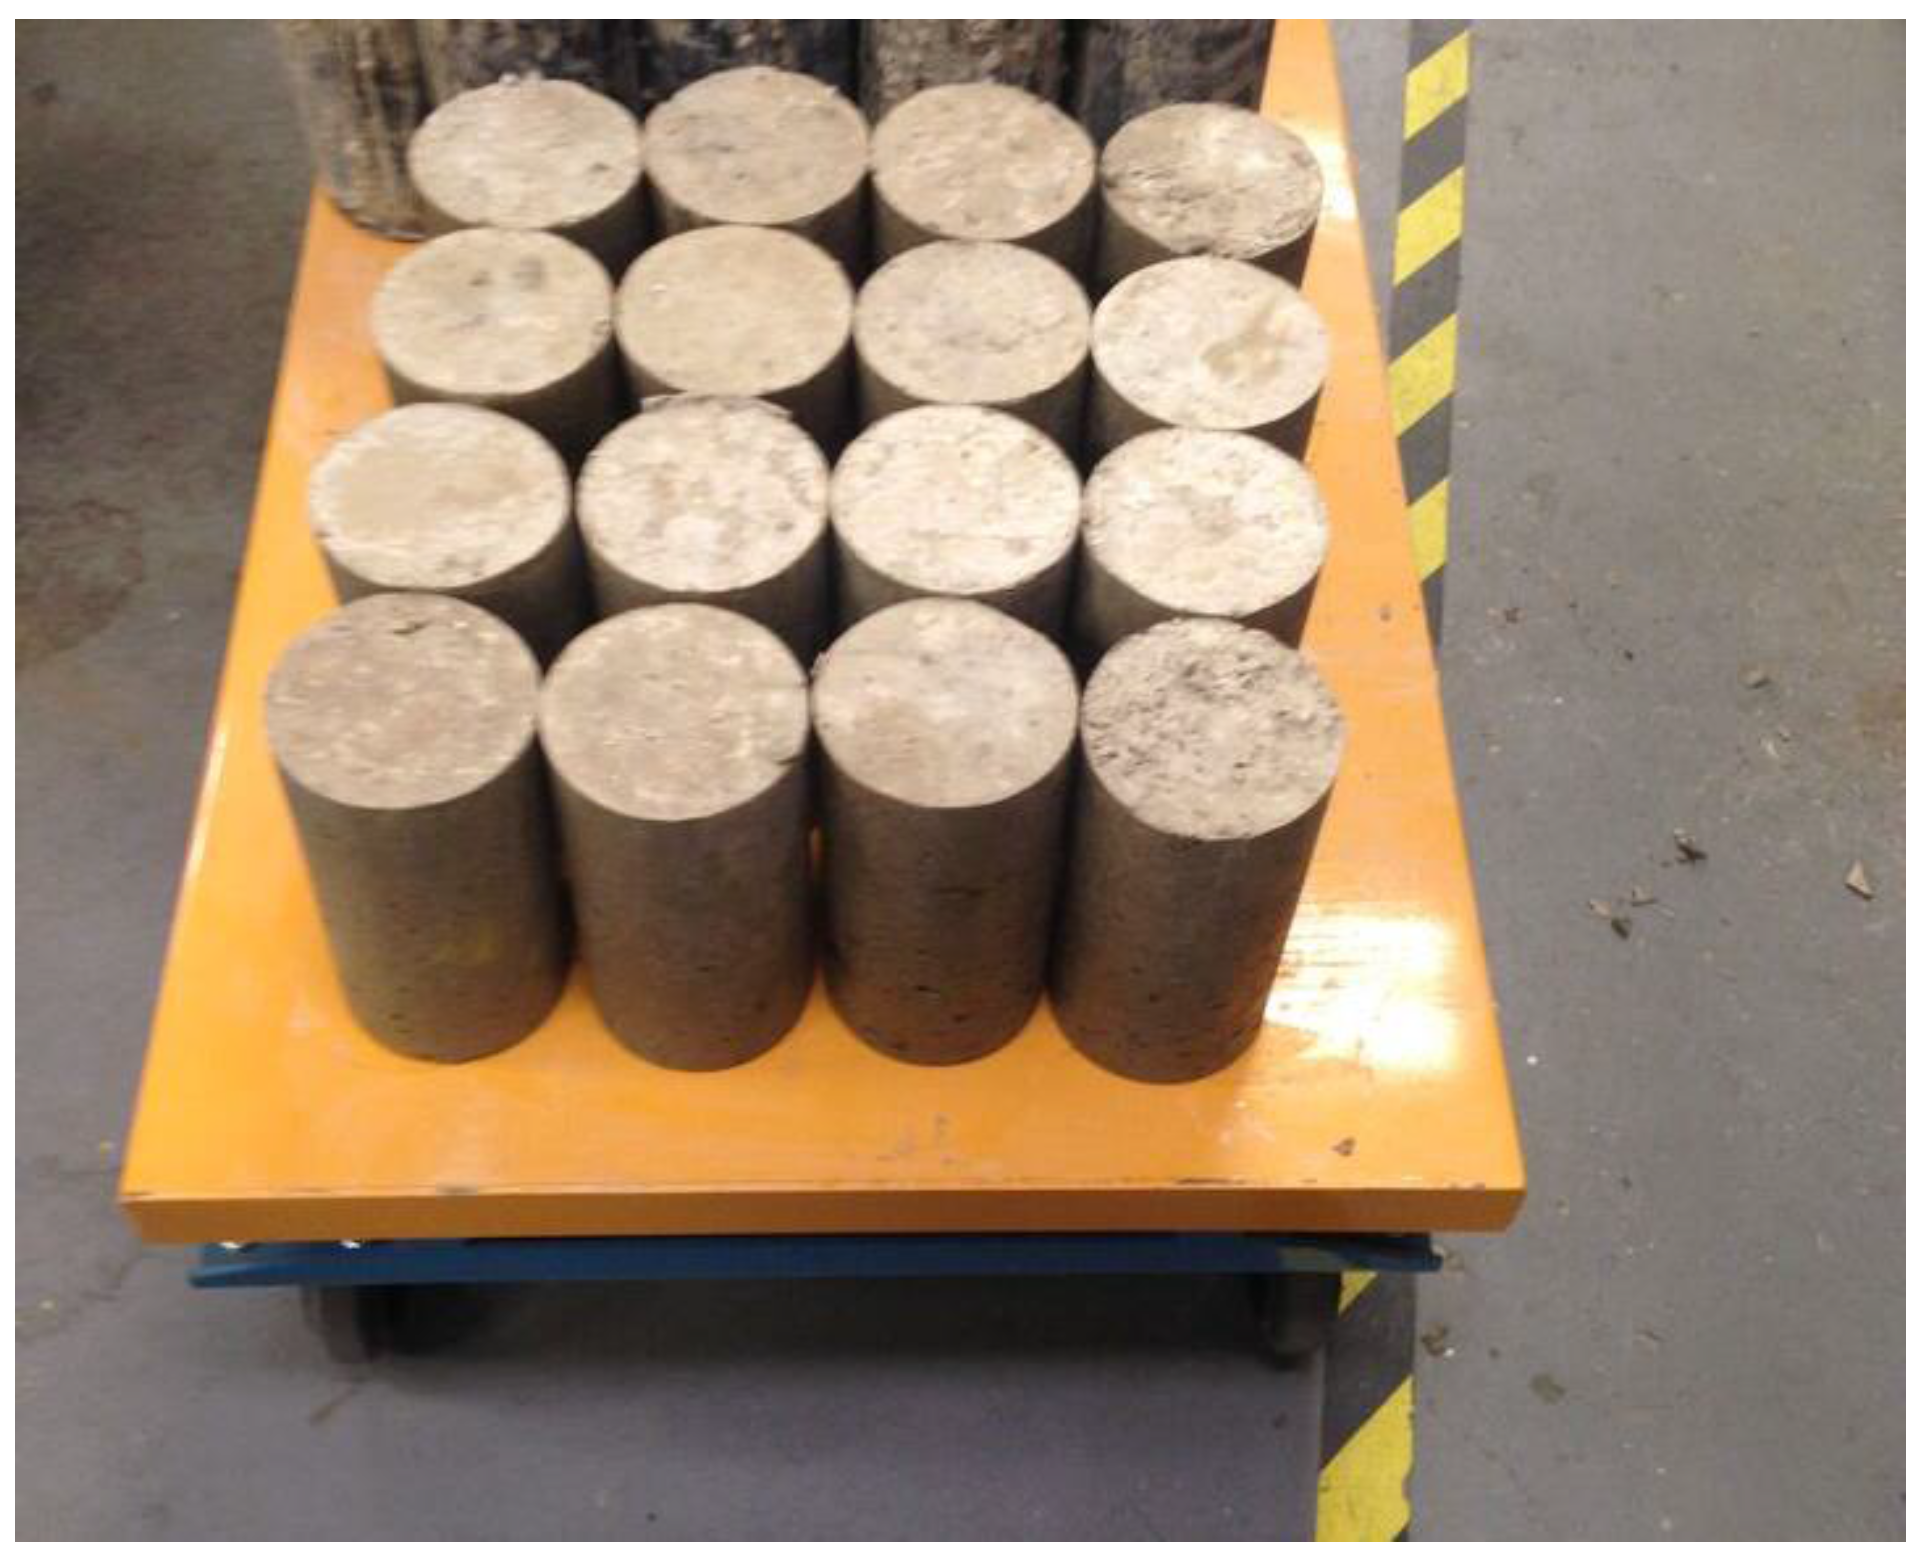
Figure 14.
Weibull distribution of compressive strength of concrete used in all beams.

Figure 15.
Weibull distribution of tensile strength of concrete used in all beams.

| Age of Concrete (days) | Compressive Strength | Tensile Strength | ||
|---|---|---|---|---|
| Strength Average (MPa) | Calculated Weibull Mean (MPa) | Strength Average (MPa) | Calculated Weibull Mean (MPa) | |
| 3 | 4.77 | 4.77 | 0.70 | 0.71 |
| 7 | 11.54 | 11.53 | 1.65 | 1.65 |
| 14 | 19.19 | 19.48 | 2.61 | 2.61 |
| 28 | 22.81 | 22.90 | 2.93 | 2.93 |
3.2. Results of Corrosion Tests
3.2.1. Small Scale Corrosion Test
For the small scale corrosion test, the four test setups and results are shown in Table 2. Results of the small-scale test show that the mass loss of the rebar in Test 3 (28.9%) is 1.75 times of that of Test 1 (16.5%) as the electric current of Test 3 is twice of that of Test 1. This verified that electric current would play a big role in accelerating the corrosion process. The results also provide the approximate rate of corrosion under certain currents, which can be used for conducting large-scale test. For example, it was found that the 12.7 mm diameter rebar experienced 4.15% mass loss per day in Test 1. The corroded sample of Test 1 is shown in Figure 2. For Test 2, which was at temperature of 84 °C, there was no valid result because the solution got vaporized so much due to the high temperature that a large portion of the rebar got exposed in air and could not react with oxygen in the solution. Considering the amount of work that would be needed for the large-scale test to keep the solution at the same level, it was determined to use room temperature for the large-scale test. Besides, the mass loss rate results of Tests 1 and 3 were promising. In Test 4, the steel bar was connected to the negative terminal of power supply, which forced the steel not to lose electrons. There was no mass loss observed for the steel rebar. The copper stick, which was connected to positive terminal, was almost gone after one-day test. This result verifies that the steel rebar should be anode to get corrosion process accelerated.
3.2.2. Large Scale Corrosion Test
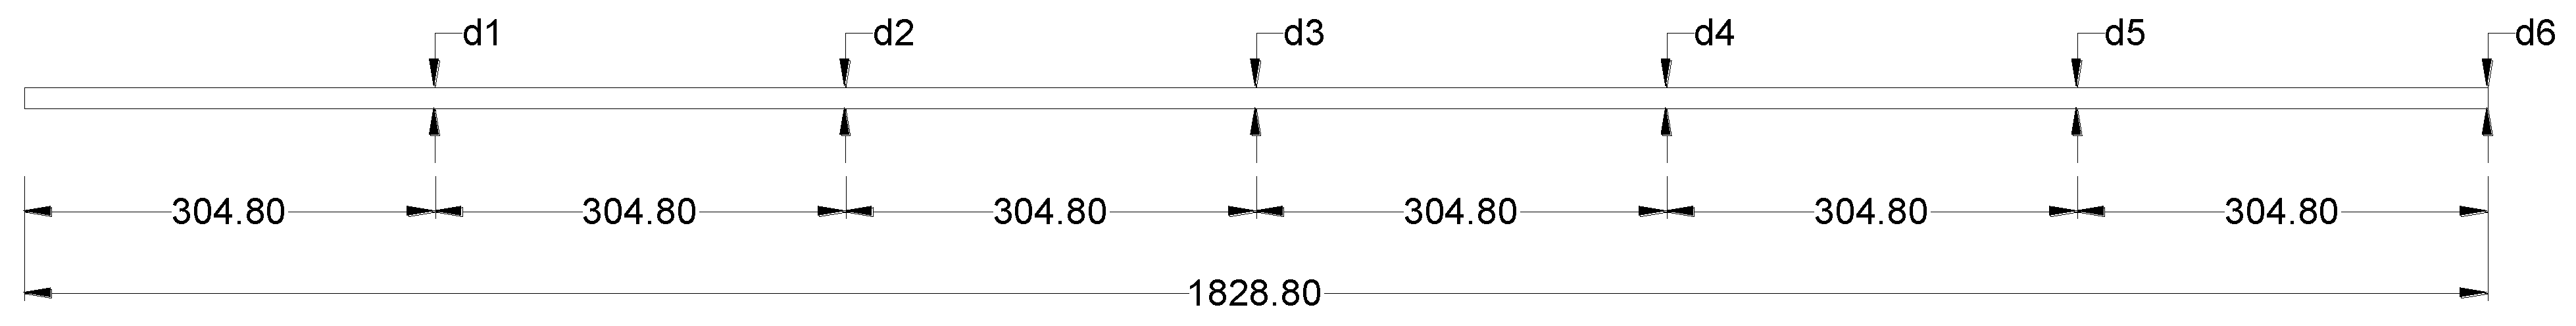
Based on the results of the small-scale tests, it was decided to use 0.2 Amp and 24 °C to run the actual test, but the amount of electric current was scaled up to 5.76 Amp to account for the different the rebar length used in the actual test. The actual corrosion test was successful as it was possible to achieve the targeted levels of corrosion in the 20 steel rebars that were subjected to salt solution and constant current. When using the galvanic cell method to cause corrosion on the rebars submerged in 25 wt% salt water, several patterns emerged. The rebar lost approximately 4% mass in 24 h if left untouched. If left for longer time than 24 h without removing the debris from the bar, the bar would lose approximately 2–3 additional percent of mass before coming to a stop due to the debris covering the bar. Once the bar lost approximately 35%–40%, the process sped up and the bar lost around 5%–6% mass in 24 h, if left untouched. Figure 16 defines the notations used in Table 6 for the diameter schedule of the corroded rebars.
Figure 16.
Diameter schedule for rebars (dimensions are in mm).
| Beam | Rebar # | d0 (mm) | d1 (mm) | d2 (mm) | d3 (mm) | d4 (mm) | d5 (mm) | d6 (mm) | Corrosion Level (%) |
|---|---|---|---|---|---|---|---|---|---|
| E10-CN | 1 | 14.86 | 14.86 | 14.73 | 14.16 | 14.17 | 14.10 | 14.25 | 10.5 |
| 2 | 15.00 | 14.78 | 14.49 | 14.15 | 14.15 | 14.10 | 13.08 | 10.6 | |
| E10-CR | 1 | 16.73 | 16.09 | 15.80 | 15.80 | 15.11 | 14.88 | 16.13 | 10 |
| 2 | 15.93 | 15.68 | 15.62 | 15.80 | 15.82 | 14.48 | 15.88 | 8.7 | |
| E20-CN | 1 | 15.01 | 14.90 | 13.55 | 13.12 | 12.97 | 13.09 | 13.21 | 21 |
| 2 | 14.64 | 14.99 | 13.27 | 13.12 | 12.52 | 13.67 | 12.87 | 20.7 | |
| E20-CR | 1 | 16.18 | 15.67 | 13.92 | 13.51 | 13.46 | 13.16 | 11.96 | 19 |
| 2 | 15.79 | 14.99 | 14.43 | 13.59 | 13.28 | 13.42 | 13.34 | 18 | |
| E32-CN | 1 | 15.15 | 15.10 | 13.55 | 11.82 | 10.59 | 11.44 | 11.48 | 31.9 |
| 2 | 14.88 | 15.15 | 12.66 | 11.63 | 11.15 | 10.34 | 10.38 | 31.9 | |
| E32-CR | 1 | 14.78 | 14.58 | 12.27 | 12.24 | 11.68 | 11.28 | 11.80 | 31.8 |
| 2 | 15.20 | 14.06 | 12.83 | 12.52 | 11.95 | 11.33 | 11.84 | 31.6 | |
| E40-CN | 1 | 14.95 | 15.16 | 11.85 | 13.65 | 9.00 | 7.16 | 10.10 | 40.2 |
| 2 | 15.07 | 14.94 | 12.76 | 11.18 | 10.50 | 11.16 | 13.69 | 39.5 | |
| E40-CR | 1 | 16.59 | 14.05 | 12.27 | 11.54 | 11.34 | 9.60 | 10.33 | 39.5 |
| 2 | 15.90 | 15.15 | 12.78 | 11.65 | 9.69 | 9.11 | 12.14 | 40.6 | |
| E50-CN | 1 | 15.23 | 14.11 | 9.04 | 8.23 | 9.08 | 10.62 | 12.87 | 49.3 |
| 2 | 15.16 | 15.04 | 7.75 | 6.74 | 10.68 | 10.41 | 12.76 | 49.3 | |
| E50-CR | 1 | 15.76 | 12.83 | 10.29 | 8.79 | 8.84 | 10.06 | 12.08 | 52 |
| 2 | 15.95 | 12.00 | 9.98 | 8.67 | 9.00 | 9.47 | 11.32 | 54 |
3.3. Results of Testing
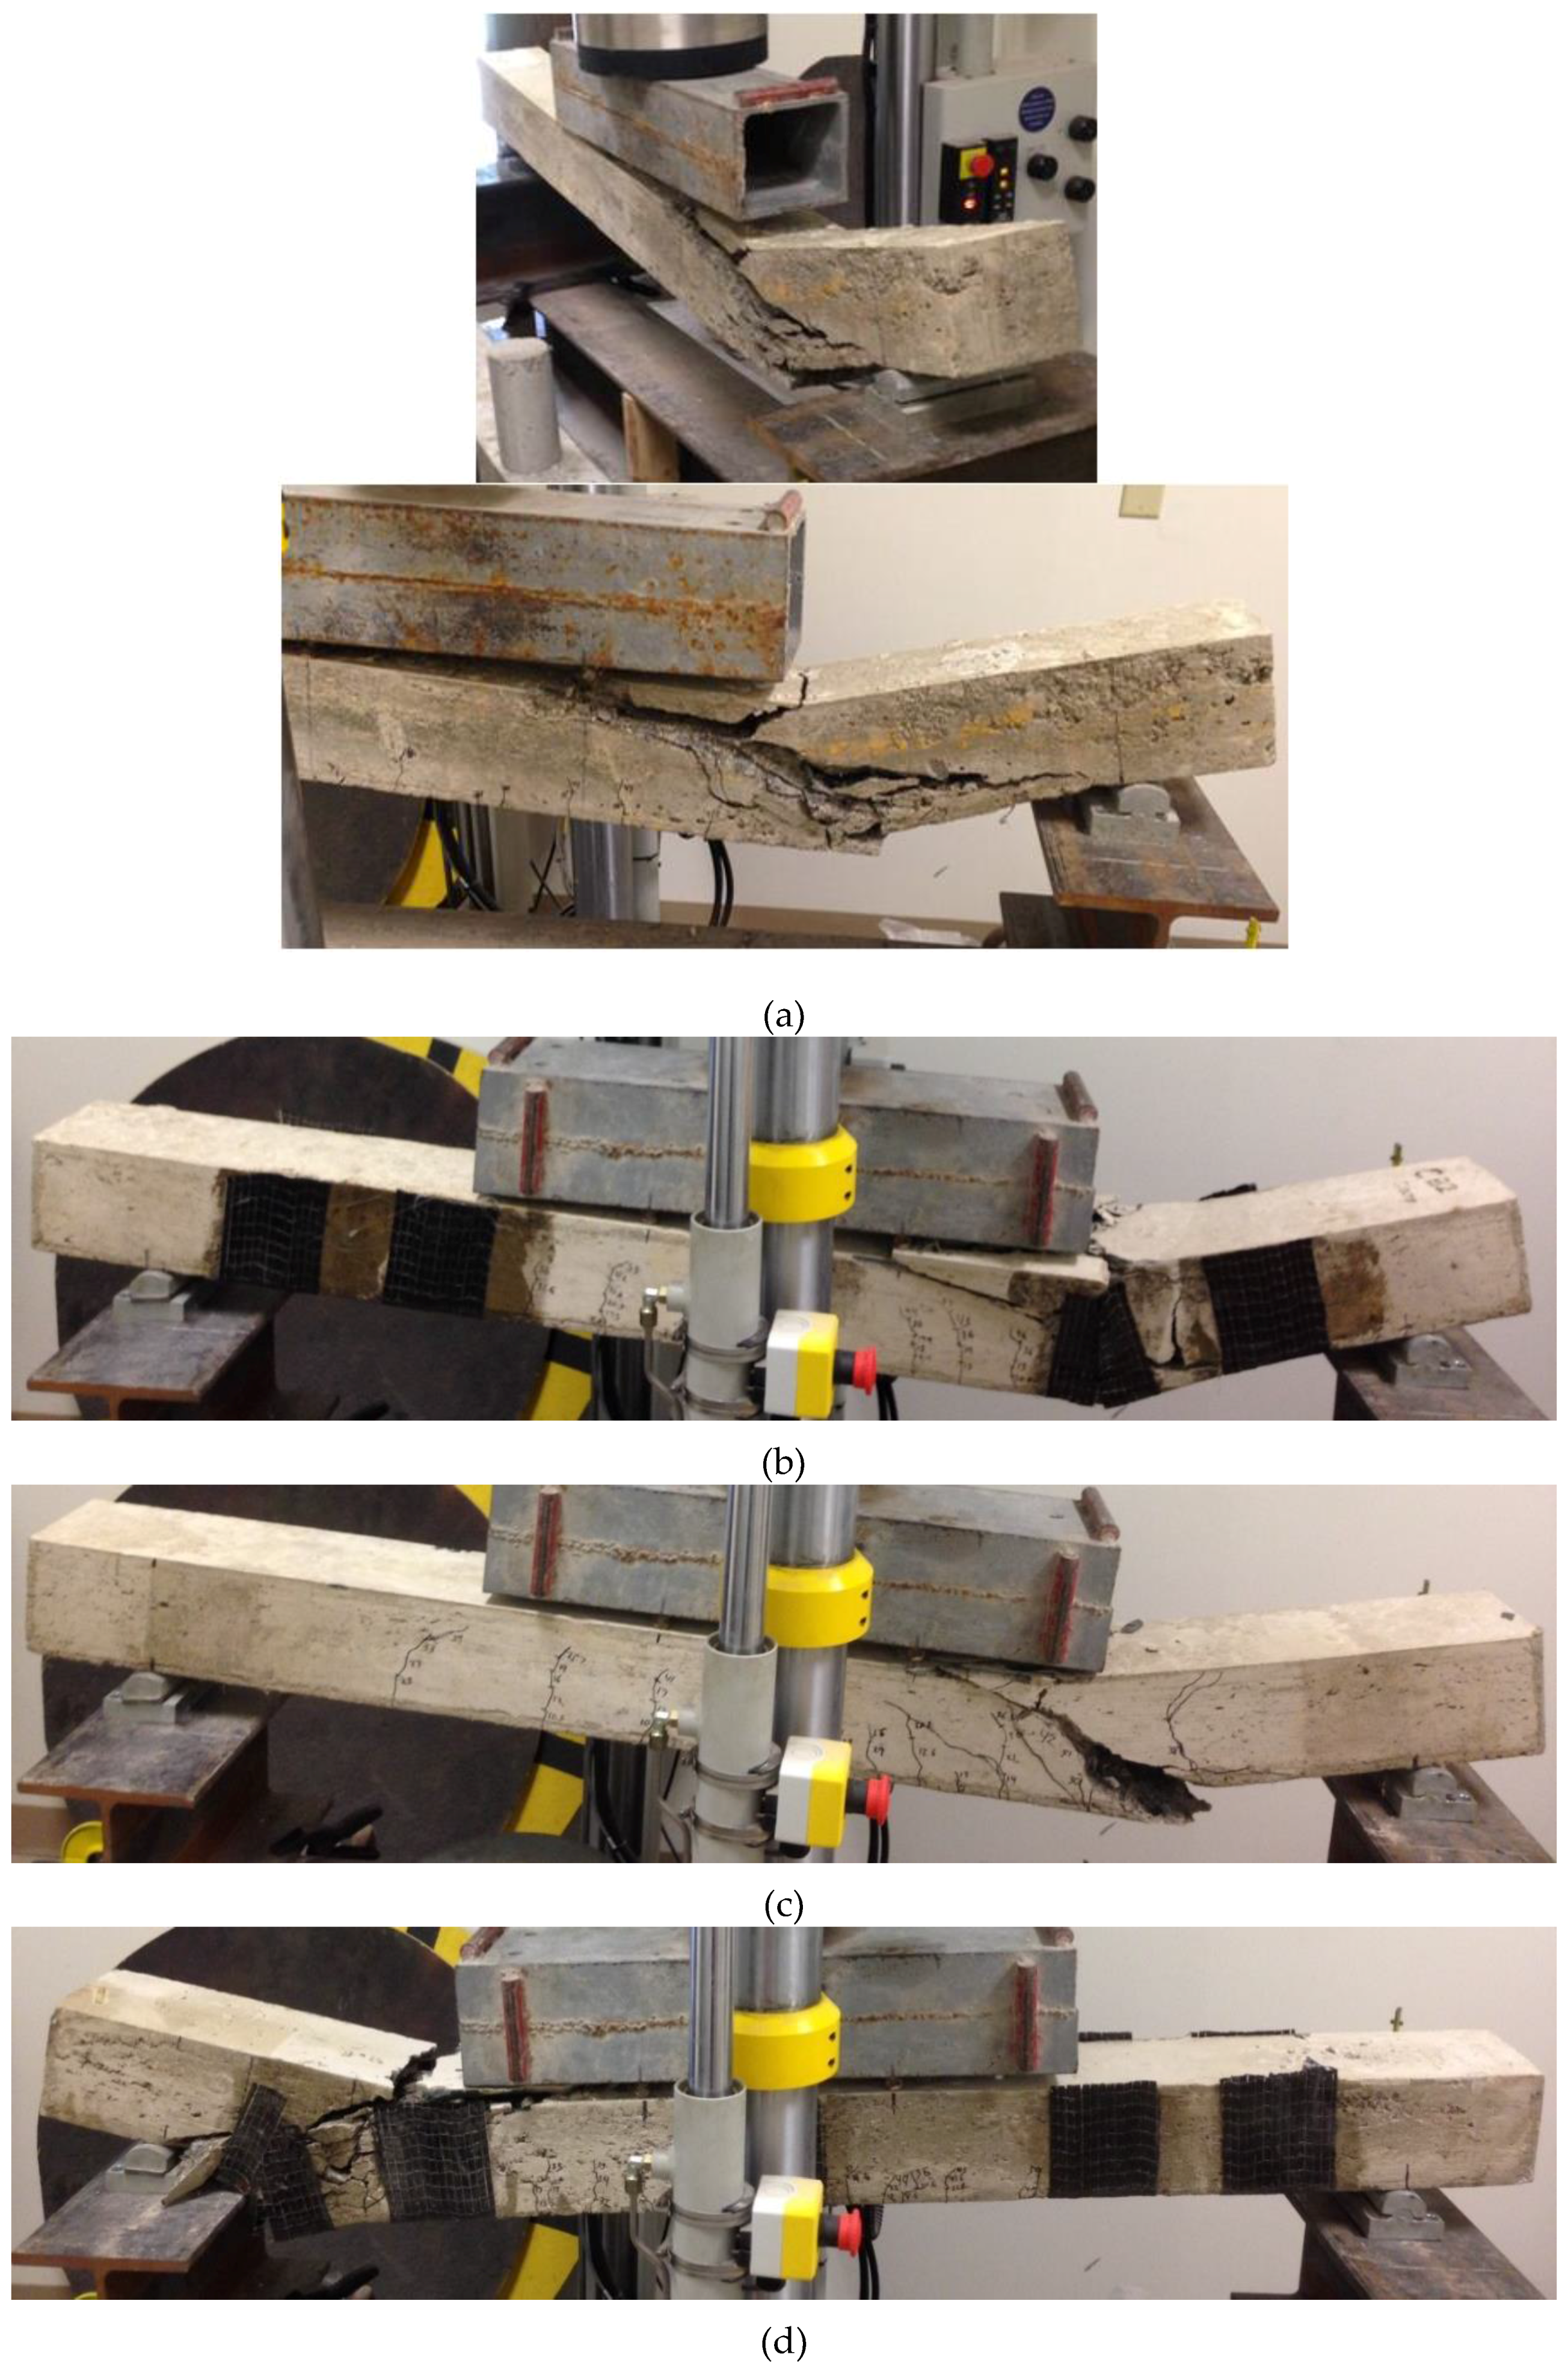
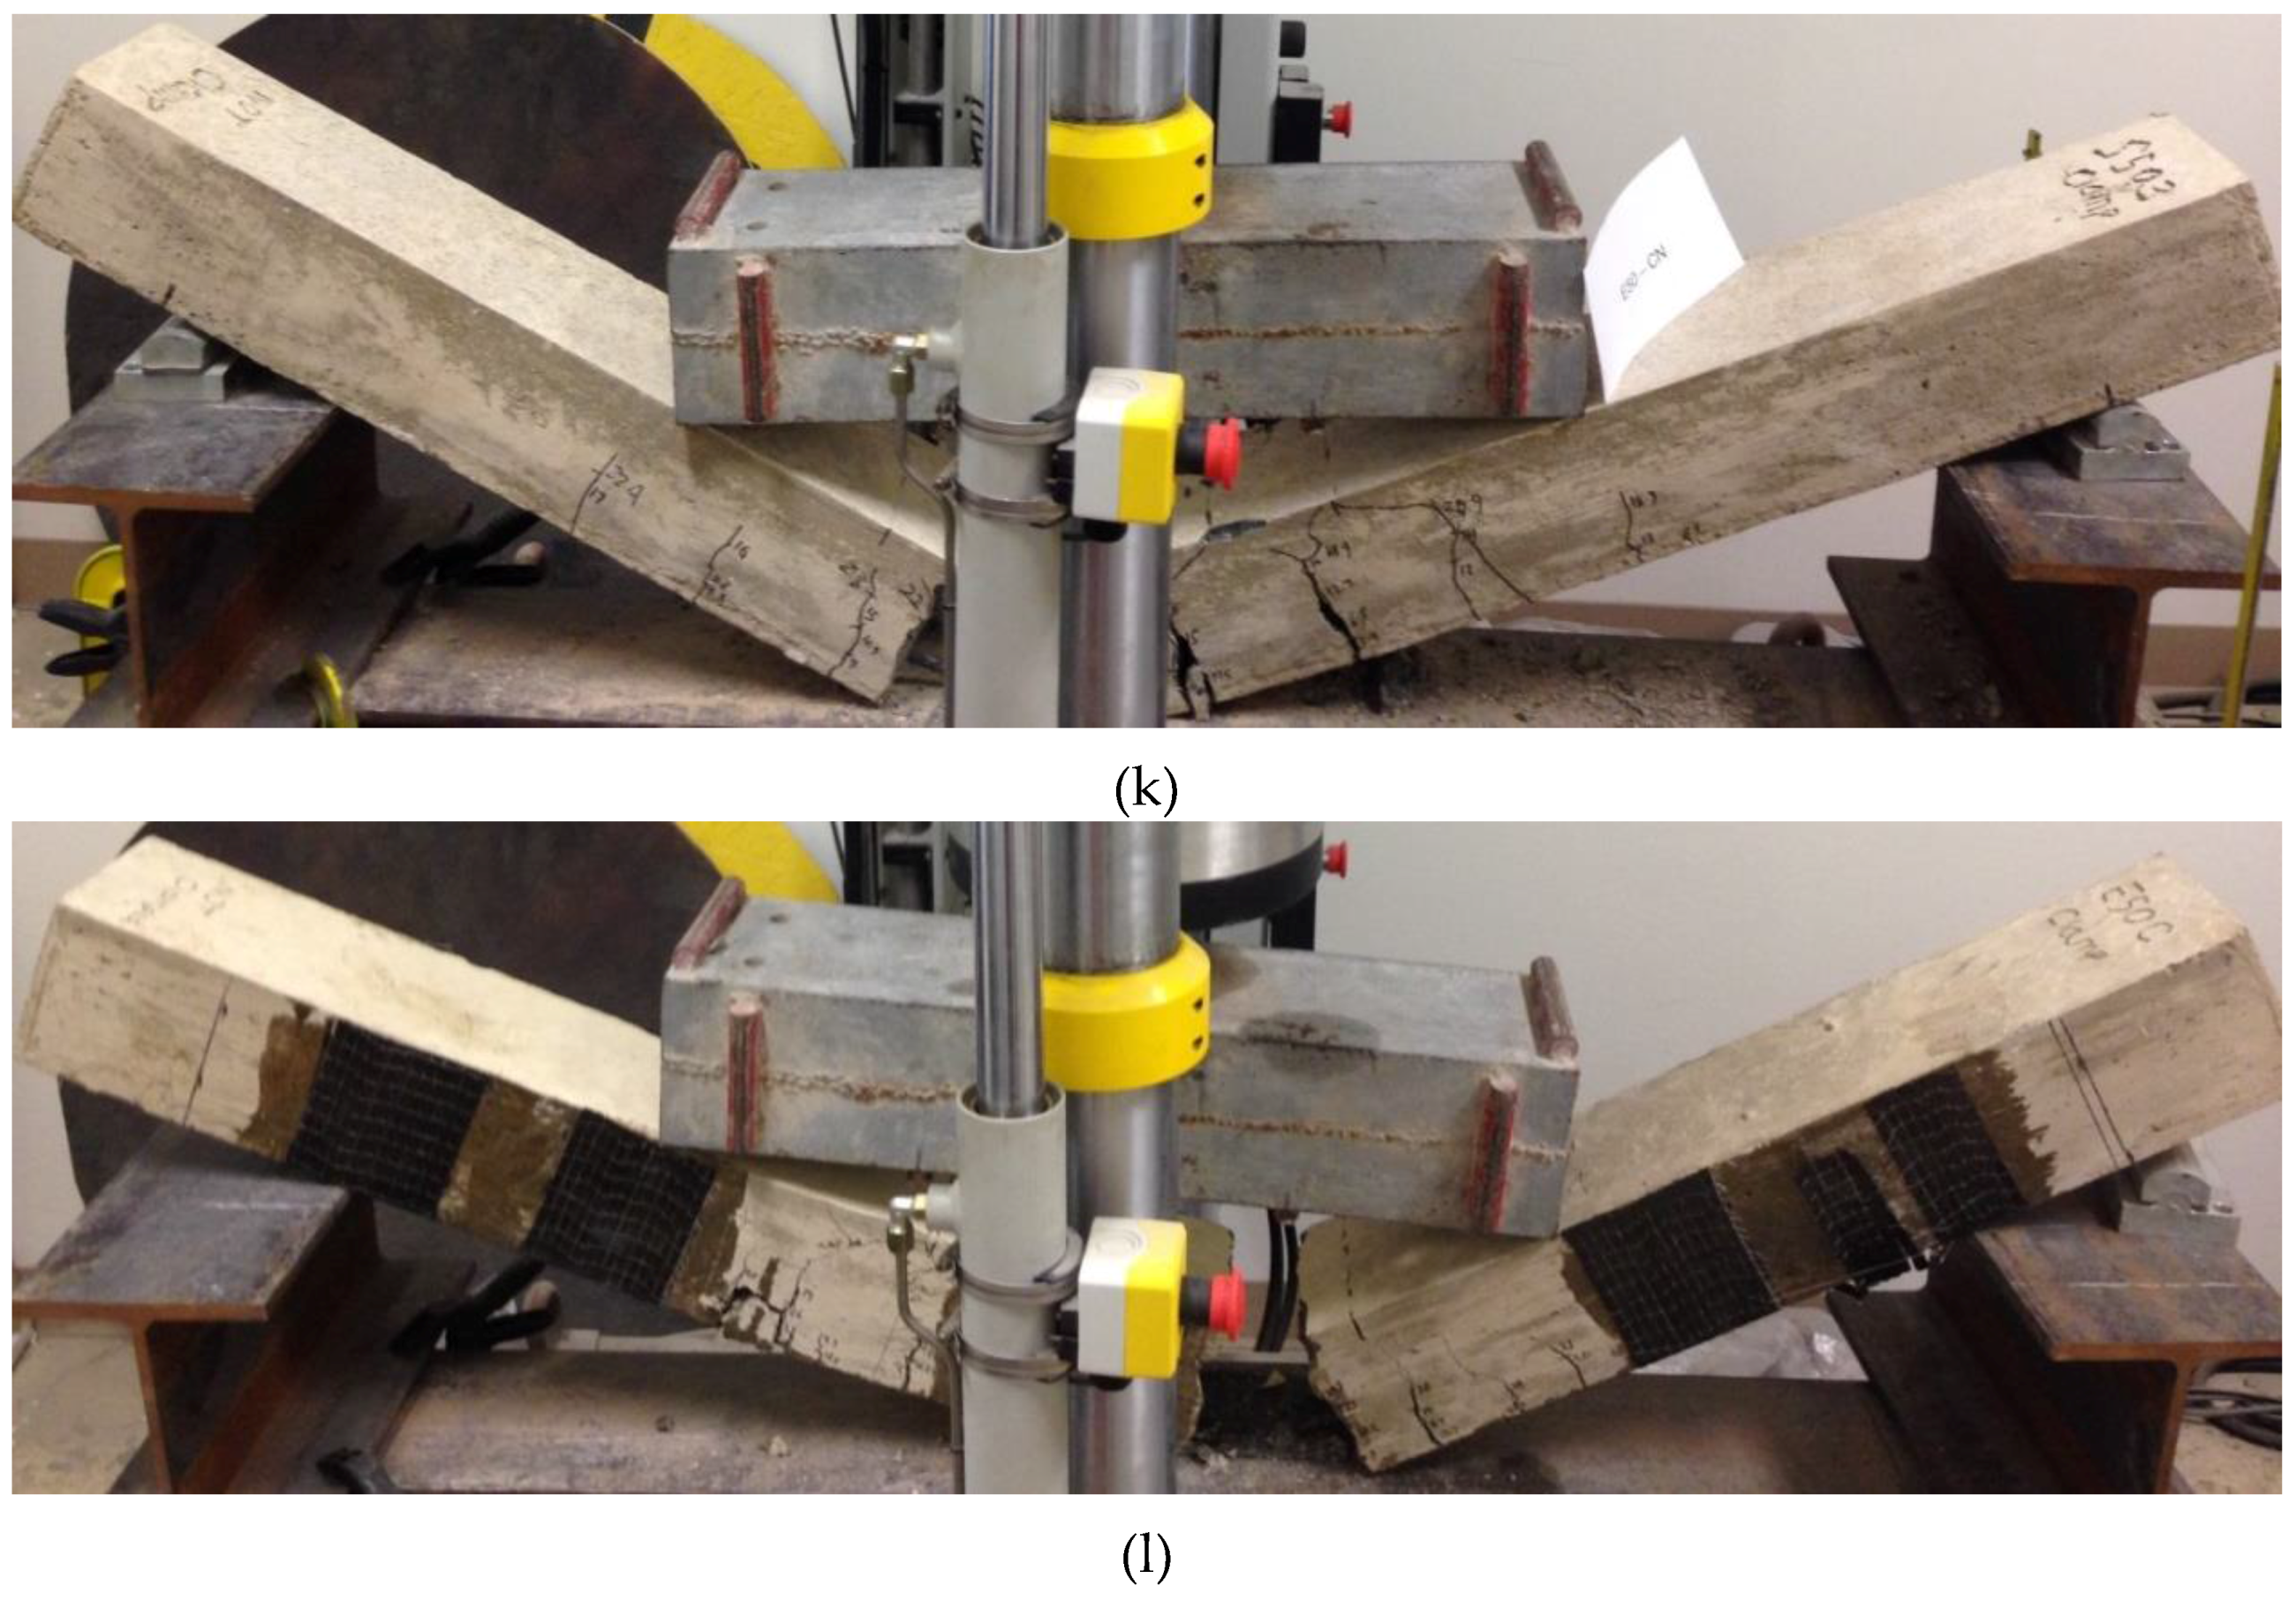
As mentioned before, all of the twelve beams were tested under four-point test until failure using the same test setup (Figure 17). The load-deflection relationships for all of the tested beams were generated.
Figure 17.
Failure of all tested beams. (a) CB–CN; (b) CB–CR; (c) E 10–CN; (d) E 10–CR; (e) E 20–CN; (f) E 20–CR; (g) E 32–CN; (h) E 32–CR; (i) E 40–CN; (j) E 40–CR; (k) E 50–CN; (l) E 50–CR.
Figure 17.
Failure of all tested beams. (a) CB–CN; (b) CB–CR; (c) E 10–CN; (d) E 10–CR; (e) E 20–CN; (f) E 20–CR; (g) E 32–CN; (h) E 32–CR; (i) E 40–CN; (j) E 40–CR; (k) E 50–CN; (l) E 50–CR.


3.3.1. Failure Mode of Beams
All of the tested beams experienced extensive flexural cracks close to mid-span before failure. Failure of each beam is described as follows:
For CB–CN (Control Beam), the first crack appeared at 9.9 kN in the middle of the beam. The next crack appeared to the right of the first crack at 28 kN. The third crack appeared to the left of the original crack at 32 kN. A splitting crack occurred at the very end of the test at approximately 55 kN close to the clamped side, where rebars were clamped during the corrosion process. Note that beam CB–CN did not have any corrosion problem. Failure was initiated by flexural cracks.
For CB–CR, which is only reinforced with U-wraps (U). It had its first crack appear at 8.6 kN. At 28 kN a little bit of a popping sound, indicating debonding of CFRP, was heard in the middle U. At 48 kN some popping was heard in the second U from the clamped side. There were a number of flexural cracks close to the mid-span and propagated towards the top. At 54 kN more snapping noise was heard in the middle U and at 58 kN the beginning of a hairline splitting crack started from the loading point on the clamped side and propagated downward. Subsequently, the second U on the clamped side debonded. Then the splitting crack propagated from that loading point down to the support and both of the first U on the clamped side and the second U on the unclamped side debonded. There was also crushing of the concrete in the top. Failure was in initiated by flexural cracks.
For E 10–CN, The beam showed its first crack at 7 kN. Extensive flexural cracking took place close to the mid-span. At 42 kN, a splitting crack started to propagate on the clamped side between the second and third stirrups. At 44 kN the beam failed due to the splitting crack and crushing of the top concrete. Failure was in initiated by flexural cracks.
For E 10–CR, the beam first cracked at 4.9 kN. It showed extensive flexural cracking close to the mid-span. At 24.7 kN, a little popping noise was heard from the second U on the unclamped side, indicating debonding of CFRP. At 30 kN a puff of dirt came from the bottom sheet from under the middle U. At 43.kN, a little popping noise was heard from the second U on the clamped side. At 50.5 kN, a splitting crack appeared, originating from near the support on the unclamped side. Subsequently, there was crushing of the concrete on the top of the beam, debonding of both of the first U and the second U on the unclamped side, which partially debonded. There were also signs of debonding of the second U on the clamped side after the splitting crack took place. Failure was in shear.
For E 20–CN, the beam had its first crack at 2.5 kN in the concrete cover. More cracks were developed in the cover. There was extensive cracking close to the midspan of the beam. At 44 kN, a splitting crack started close to the left loading point on the unclamped side of the beam. There was another splitting crack on the other side. Both of the splitting cracks propagated close to the mid-span. The beam later failed due to a flexural crack that propagated at the mid-span and crushing of the top concrete, which is a different mode of failure from the other tested beams. Failure was in flexure.
For E 20–CR, The beam first cracked at 7 kN. Extensive flexural cracking took place close to the mid-span. At 28 kN, popping noise was heard from the bottom close to the second U on the unclamped side, indicating debonding of CFRP. Some dust escaped the bottom sheet at 33 kN from close to the midspan. Popping noise was heard from the middle U at 40 kN. The bottom sheet debonded near the mid-span at 44 kN. A stronger popping noise was heard at 47 kN. At 61 kN, a snapping noise was heard. At 62 kN, a splitting crack appeared close to the support on the unclamped side. The first and second U on the unclamped side debonded and there was crushing of the concrete in the top of the beam. Failure was in shear.
For E 32–CN, the beam had its first crack at 9 kN. Extensive flexural cracking occurred close to the mid-span. Some of the cracks extended all of the way to the top of the concrete. At 36 kN, a splitting crack started from the loading point on the unclamped side and propagated down near the support on the unclamped side. Later, as that crack propagated, a similar crack propagated on the clamped side. There was also crushing of the top concrete. Failure was in initiated by flexural cracks.
For E 32–CR, the beam showed its first crack at 10.2 kN. It had a number of flexural cracks close to the mid-span. At 14 kN, popping noise was heard from bottom close to the middle U, indicating debonding of CFRP. At 16 kN, popping noise was heard from the second U on the unclamped side and at 19 kN dust was seen escaping from under the second U on the clamped side. At 27 kN, a snapping noise was heard from the bottom of the unclamped side and at 30 kN, the middle U debonded. At 36 kN a hairline splitting crack was propagating close to the clamped side. At 38 kN, the second U on the clamped side debonded. Later, the splitting crack became more pronounced while the first U on the clamped side debonded and the top concrete crushed. Failure was in initiated by flexural cracks.
For E 40–CN, the beam showed its first crack at 9 kN. There were extensive flexural cracks close to the mid-span of the beam. Some of the cracks extended to the top of the beam. At 28 kN, a hairline splitting crack developed from under the loading point close to the clamped side and propagated downward. At 30 kN, another hairline splitting crack developed on the other side. At 33 kN, failure took place due to the splitting crack on the unclamped side. There was also crushing of concrete in the top. Failure was in flexure.
For E 40–CR, the beam showed its first crack at 2.5 kN. There were extensive flexural cracks close to the mid-span of the beam. Noise indicating debonding in the FRP was first heard at 42 kN in the middle of the beam. A splitting crack occurred close to the unclamped side of the beam at 47 kN. Slight crushing of top concrete also took place. There were signs of debonding in the bottom sheet; however, there were no signs of fracture. Failure was in initiated by flexural cracks.
For E 50–CN, the beam showed its first crack at 5.9 kN. There were extensive flexural cracks close to the mid-span of the beam. Most of the cracks extended to the top of the beam. At 23 kN, a loud noise was heard close to the mid-span, then the beam splitted into two halves at 25 kN. It was found that both of the two rebars have fractured. Failure took place due to the fracture of the two rebars and crushing of concrete. Failure was in flexure.
For E 50–CR, the beam first cracked at 8.5 kN. Popping sound was first noted at 10 kN. Extensive flexural cracking occurred close to the mid-span of the beam. The popping sound occurred more frequently at 27 kN and at 31 kN. Subsequently, the bottom sheet and the U sheets located at the mid-span and the support on the clamped end ruptured at 31 kN and the load dropped to 25 kN. Flexural failure occurred resulting in the beam to split into two halves. The rebars also ruptured and top concrete crushed. Failure was in flexure.
It seems that the CFRP repairs held up the failure process, which is confirmed with the load-deflection curves as discussed below.
3.3.2. Load-Deflection Relationships
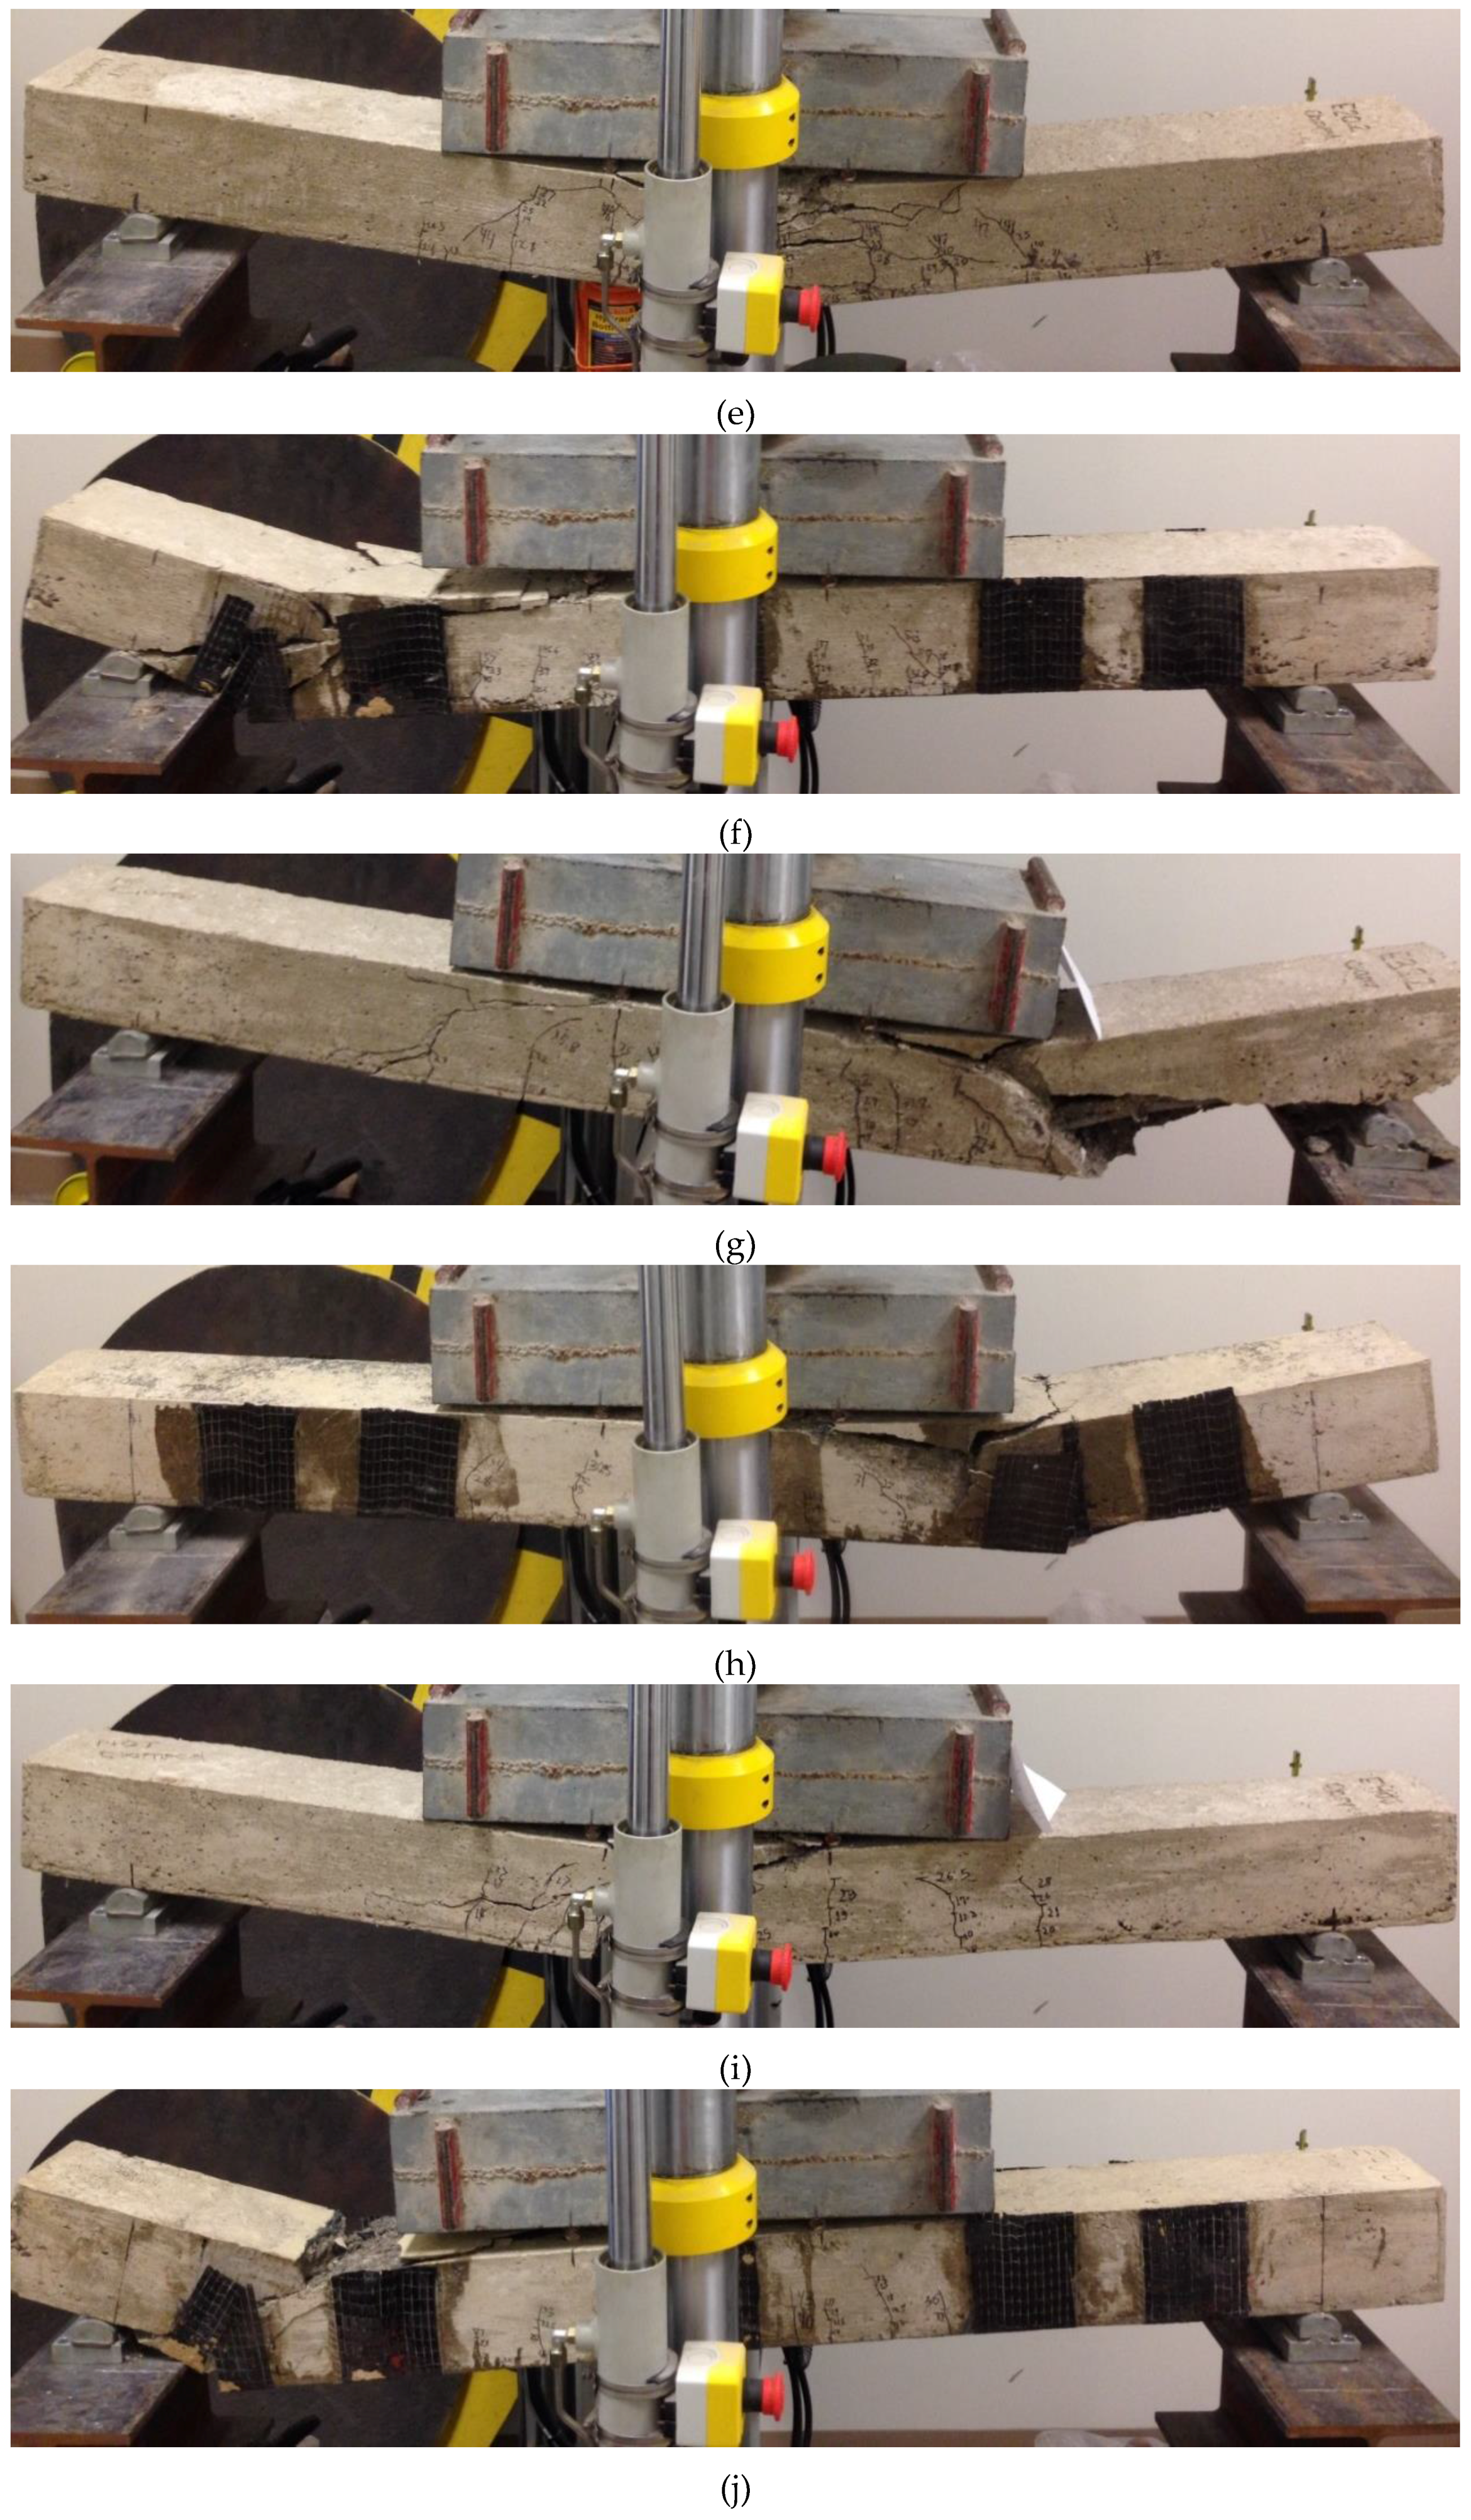
From comparing load-deflection relationships of beams CB–CN, E 10–CN, E 20–CN, E 32–CN, E 40–CN, and E 50–CN (Figure 18), it can be determined that as the level of corrosion increased, the beam became less stiff. As the corrosion level increased, beams became more ductile except for beam with 40% corrosion as it showed similar stiffness to that with 32% corrosion, but it showed less ductility. Overall, it can be concluded that the cracking load did not changed significantly due to corrosion. It can also be concluded that load capacity decreased as the level of corrosion became higher (Table 7). For example, the beam with 40% corrosion level lost about 39% of its carrying capacity while the one with 50% corrosion level lost about 56% of its carrying capacity when they were compared to CB-CN. Thus, the relationship between the corrosion level and the loss in load carrying capacity of RC members seem not linear.
Figure 18.
Load-Deflection relationships for all beams without repair.

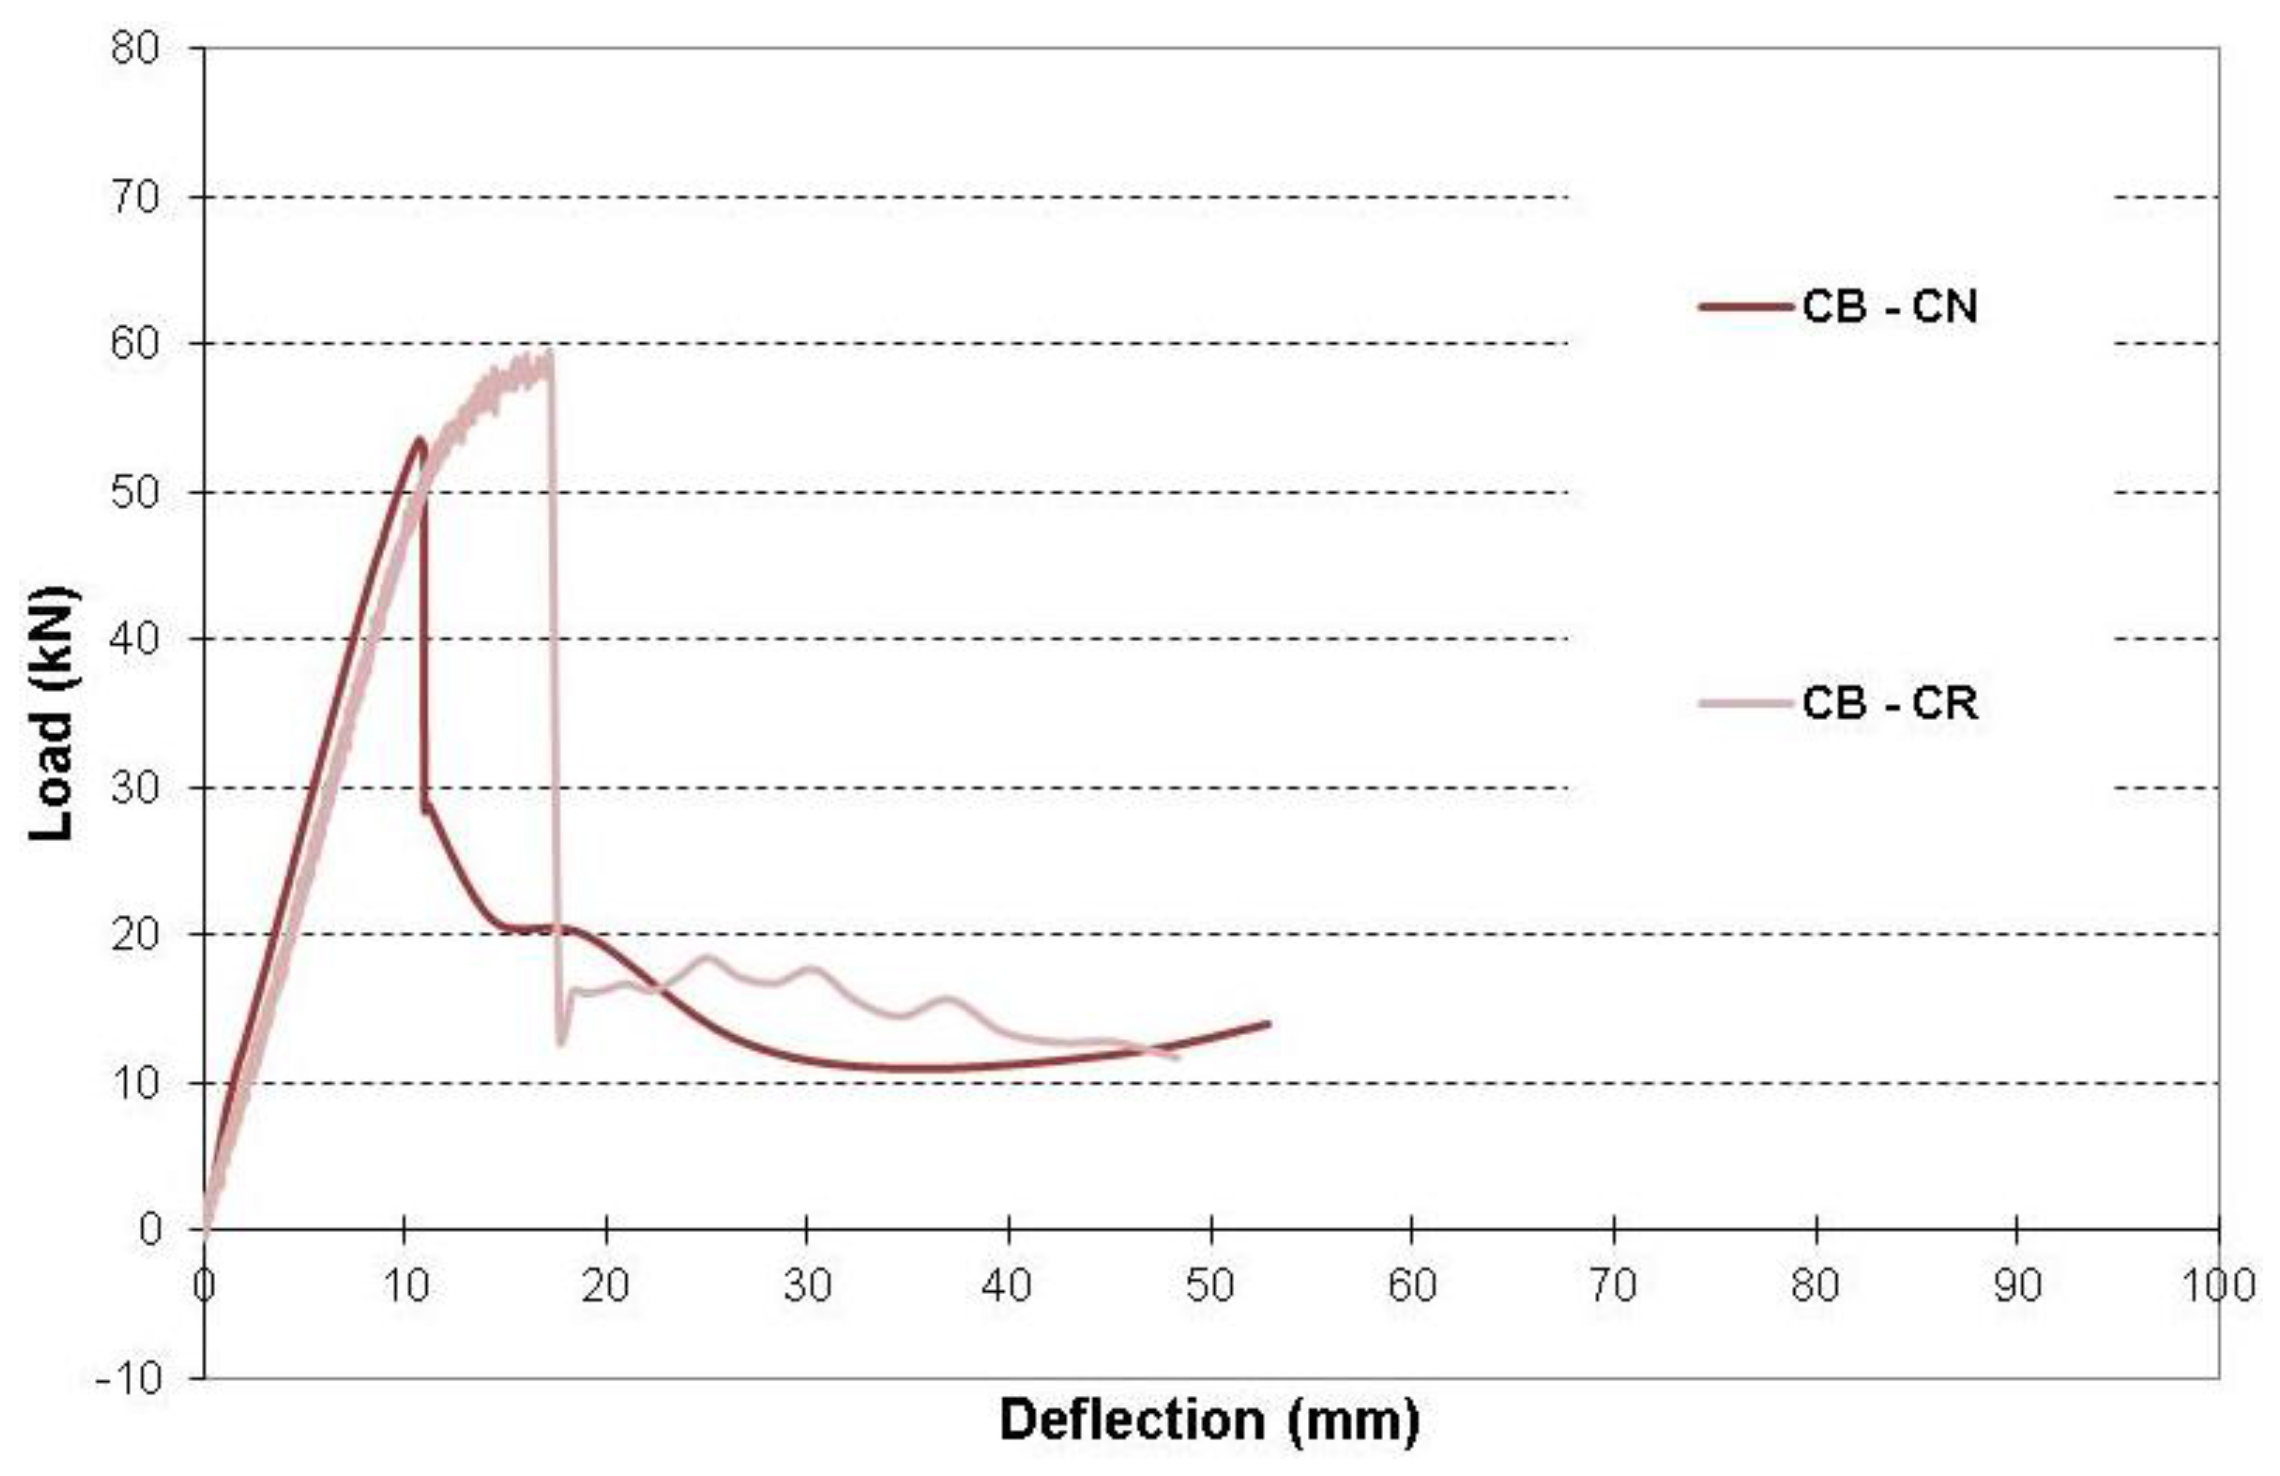
Figure 19 presents a comparison between load-deflection relationships of non-repaired and repaired beams, CB-CN and CB-CR. It is clear that adding only U-Wraps to the CB-CN (control beam) improved its load capacity and ductility. Progressive debonding and then rupture of some of the U-wraps led to the yielding point on the load-deflection curve. As load increased, the beam completely failed. It can also be observed that both CB-CN and CB-CR had similar reserve load capacity after failure.
Figure 19.
Load-Deflection relationships of control beams without and with repair.
| Beam | Load Capacity (kN) | % of Change from CB–CN | % of Change from CB–CR | % of Change from E10–CN | % of Change from E20–CN | % of Change from E32–CN | % of Change from E40–CN | % of Change from E50–CN |
|---|---|---|---|---|---|---|---|---|
| CB–CN | 53.59 | – | −9.99 | – | – | – | – | – |
| CB–CR | 59.54 | 11.09 | – | – | – | – | – | – |
| E10–CN | 41.87 | −21.87 | −29.67 | – | – | – | – | |
| E10–CR | 50.94 | −4.96 | −14.45 | 21.64 | – | – | – | – |
| E20–CN | 50.49 | −5.78 | −15.19 | – | – | – | – | – |
| E20–CR | 64.00 | 19.41 | 7.49 | – | 26.74 | – | – | – |
| E32–CN | 36.73 | −31.46 | −38.30 | – | – | – | – | – |
| E32–CR | 38.81 | −27.58 | −34.81 | – | – | 5.67 | – | – |
| E40–CN | 32.90 | −38.61 | −44.74 | – | – | – | – | – |
| E40–CR | 45.82 | −14.50 | −23.04 | – | – | – | 39.27 | – |
| E50–CN | 23.35 | −56.44 | −60.79 | – | – | – | – | – |
| E50–CR | 45.81 | −14.52 | −23.06 | – | – | – | – | 96.21 |
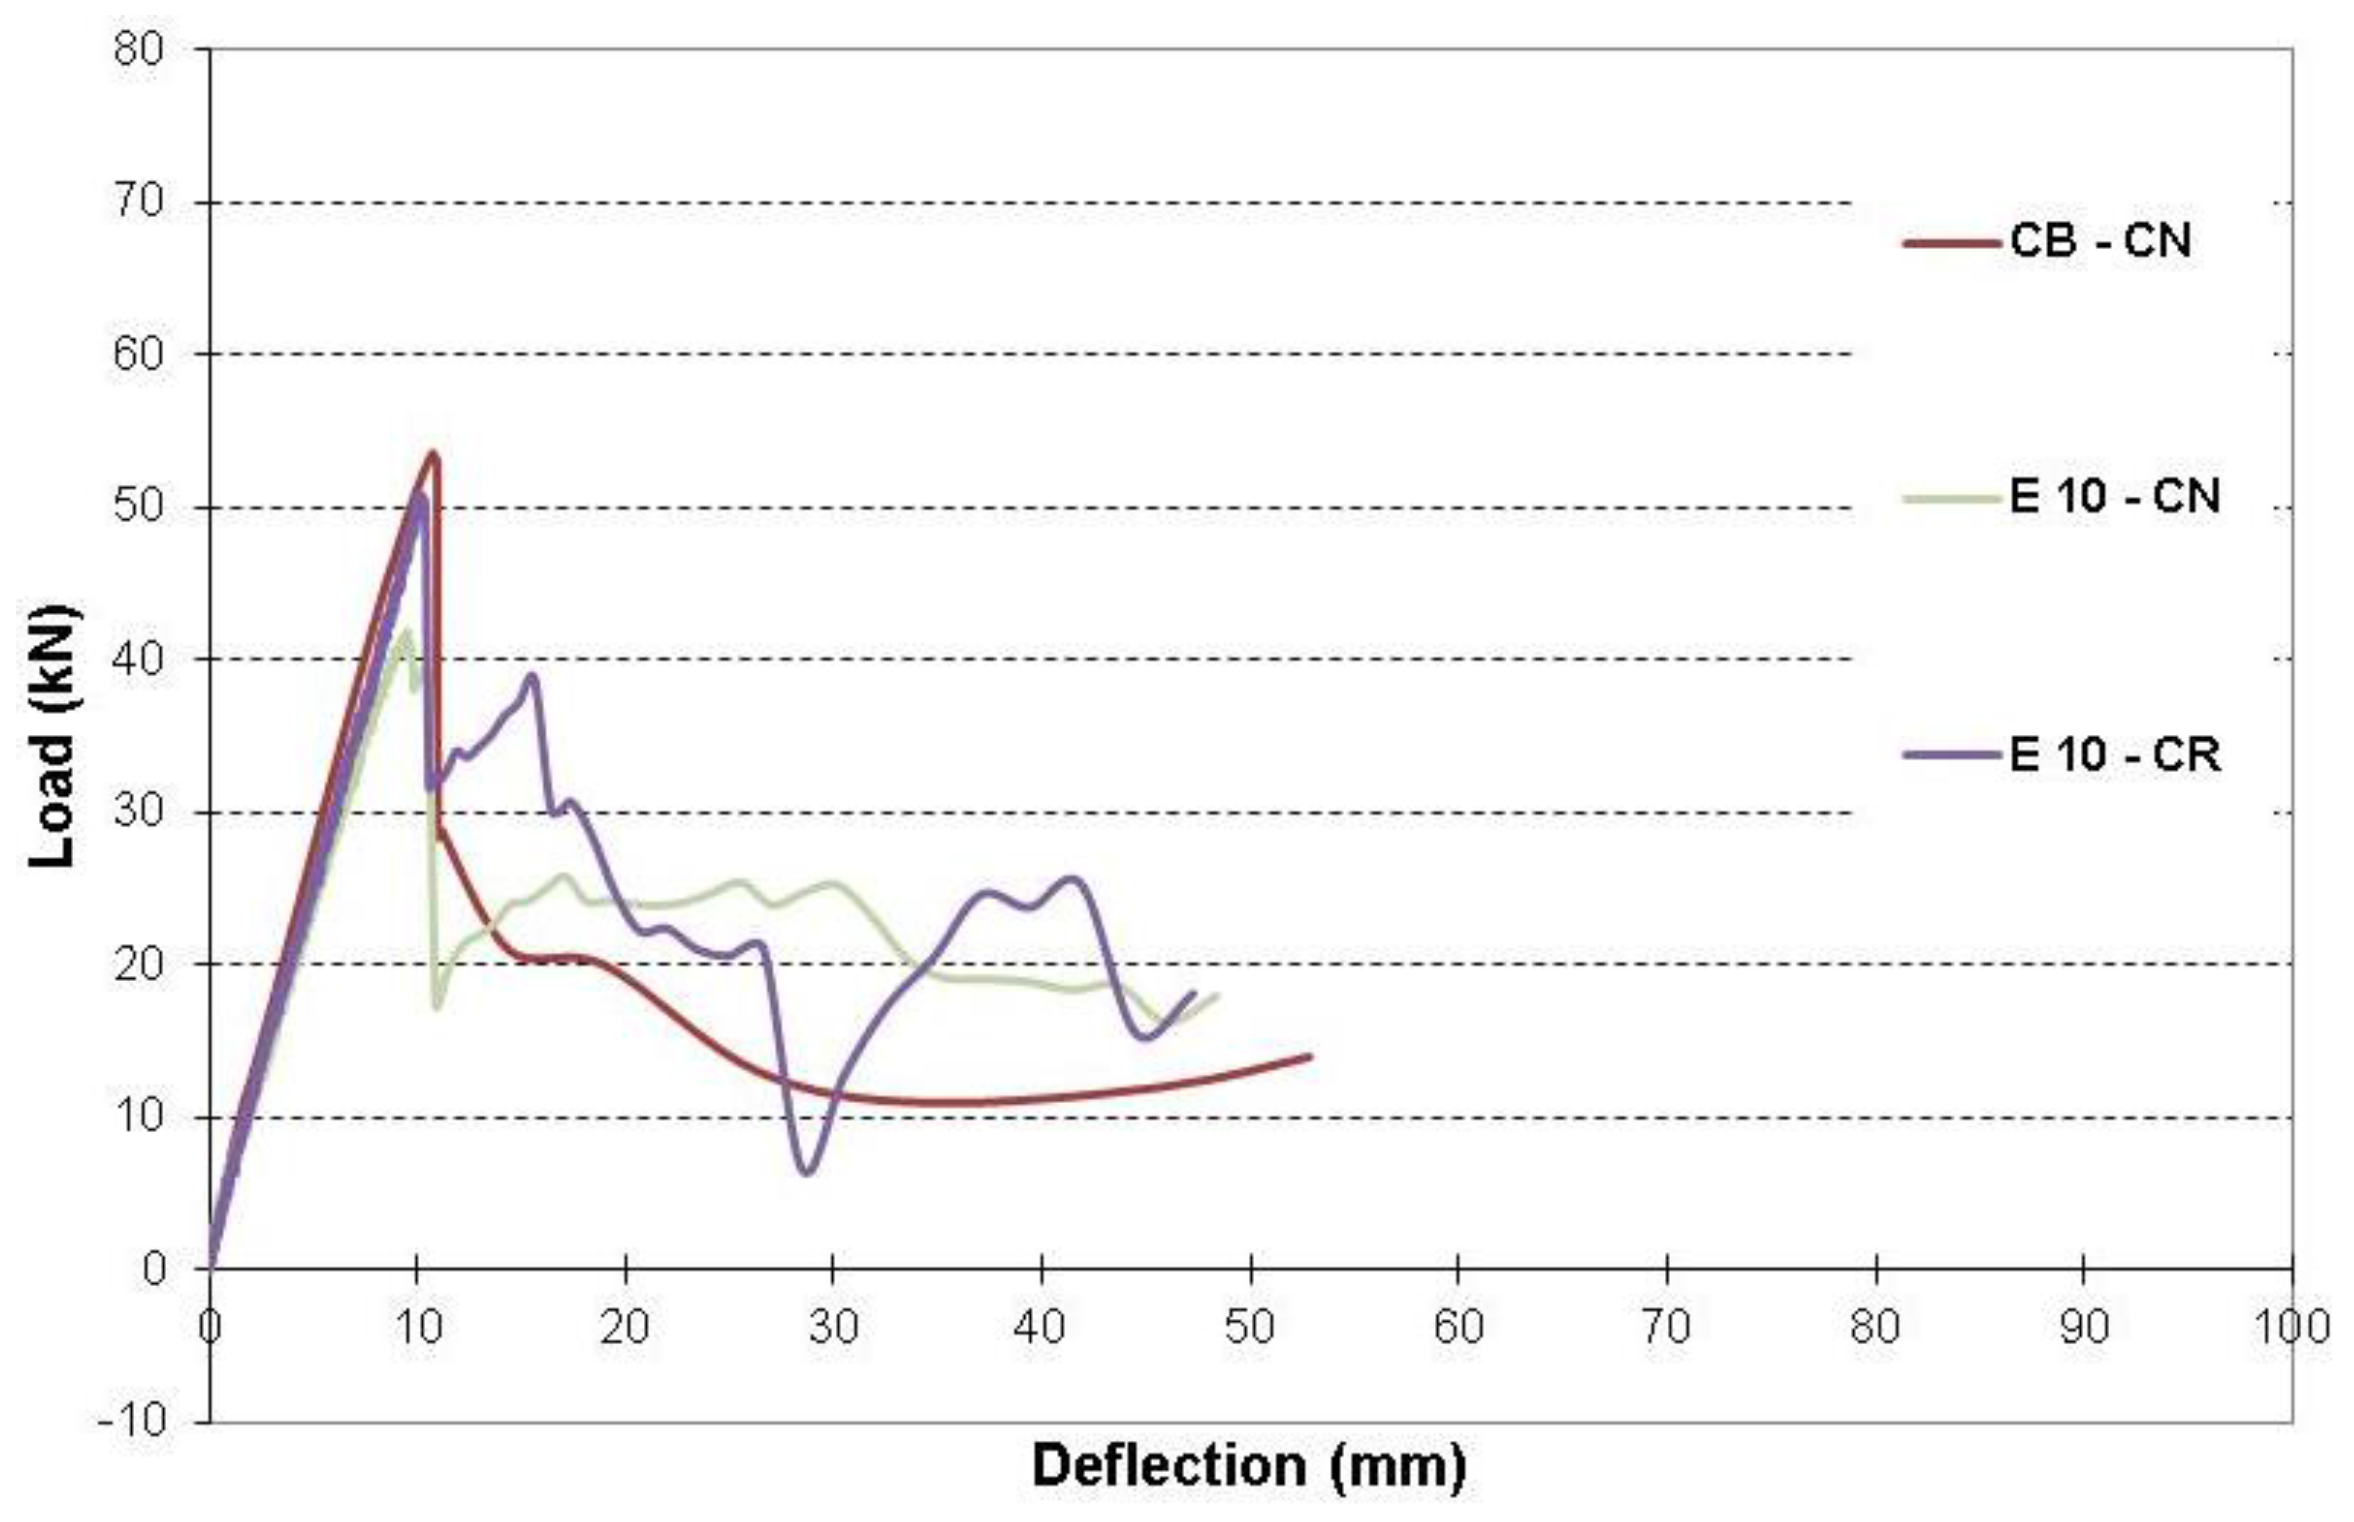
Figure 20 presents a comparison between load-deflection relationships of the control beam (CB–CN), E 10–CN, and E 10–CR. Due to 10% corrosion level in rebars, the beam lost about 22% of its load carrying capacity, but when repaired with both CFRP sheet and U-wraps, it recovered about 17% of its load carrying capacity.
Figure 20.
Effect of 10% corrosion level on load-deflection relationship.

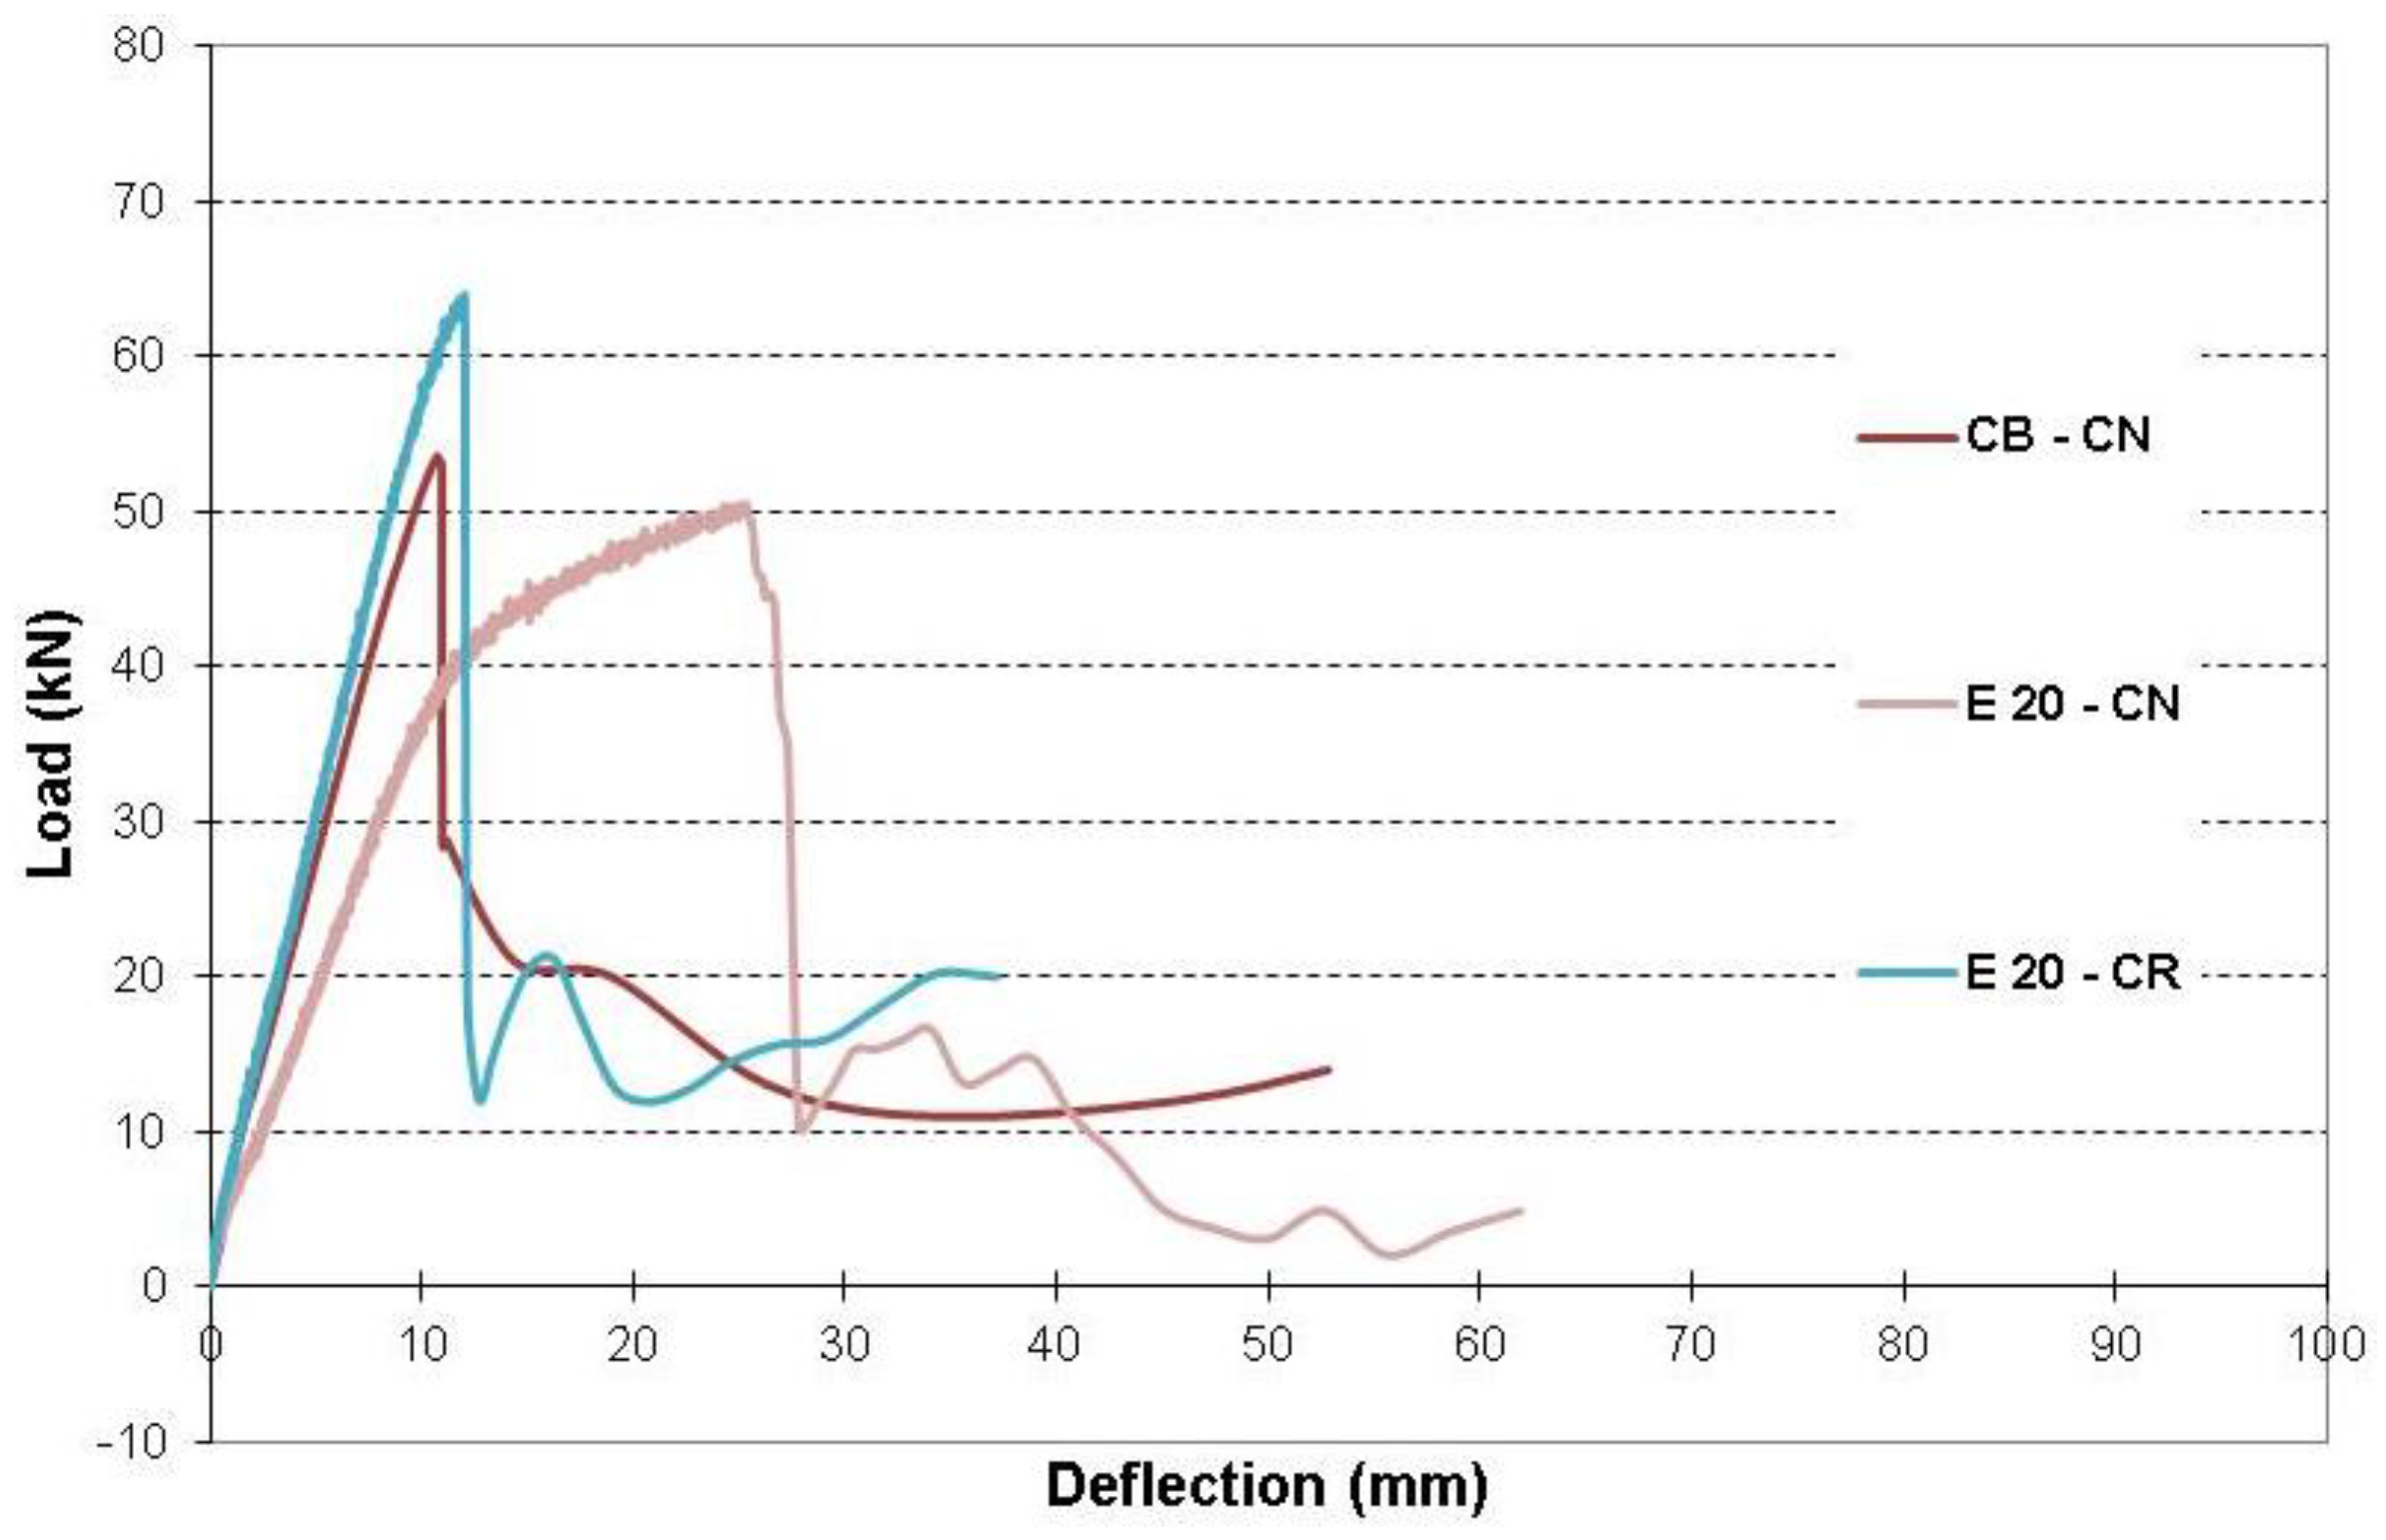
Figure 21 presents a comparison between load-deflection relationships of the control beam (CB–CN), E 20–CN, and E 20–CR. Due to 20% corrosion level in rebars, the beam lost about 6% of its load carrying capacity, but when repaired with both CFRP sheet and U-wraps, it had about 19% higher load capacity than the control beam. This can be attributed to the fact that E 20–CN experienced different mode of failure than E 10–CN. It should be also noted that E 20–CN had smaller stiffness than the control beam and was more ductile, but when repaired it had a similar stiffness to the control beam and became less ductile.
Figure 21.
Effect of 20% corrosion level on load-deflection relationship.

Figure 22 presents a comparison between load-deflection relationships of the control beam (CB–CN), E 32–CN, and E 32–CR. Due to 32% corrosion level in rebars, the beam lost about 32% of its load carrying capacity, but when repaired with both CFRP sheet and U-wraps, it only recovered about 4% of its load carrying capacity. This little improvement can be owing to the early signs of debonding in CFRP, which adversely affected the capacity of the repaired beam. Both beams with 32% corrosion level had smaller stiffness than their counterpart control beam and were more ductile. However, E 32–CR became stiffer and less ductile than E 32–CN.
Figure 22.
Effect of 32% corrosion level on load-deflection relationship.
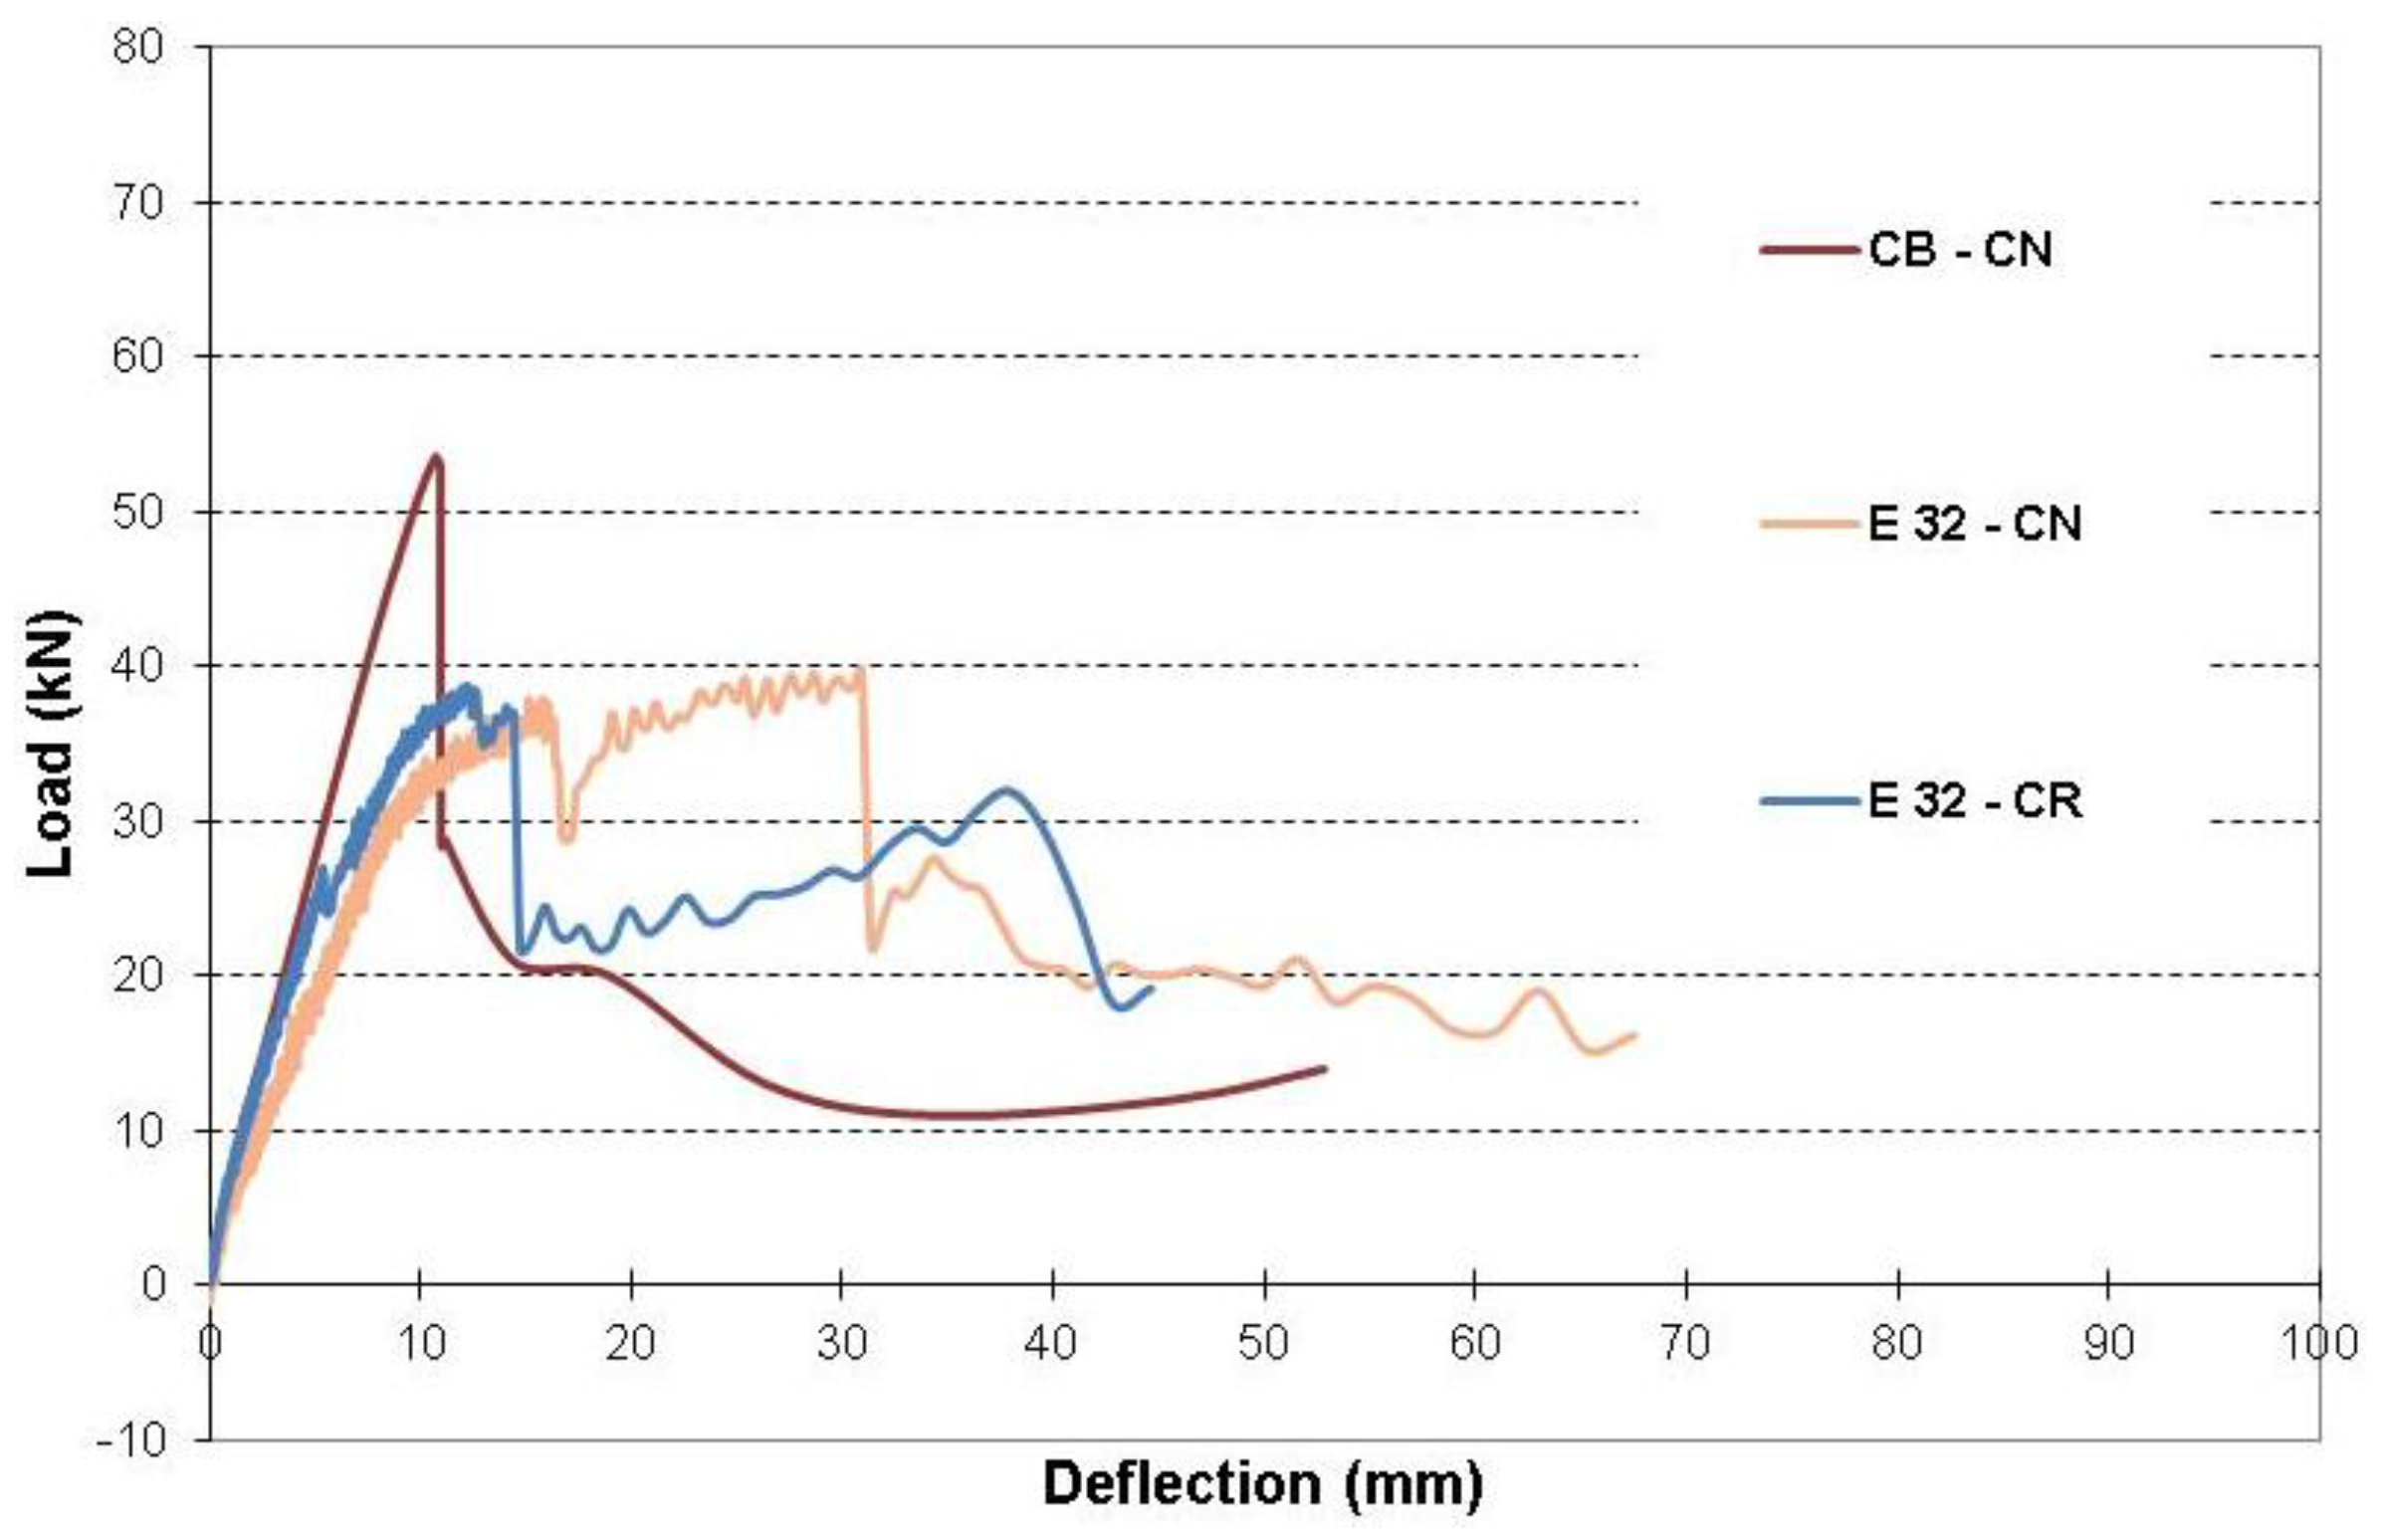
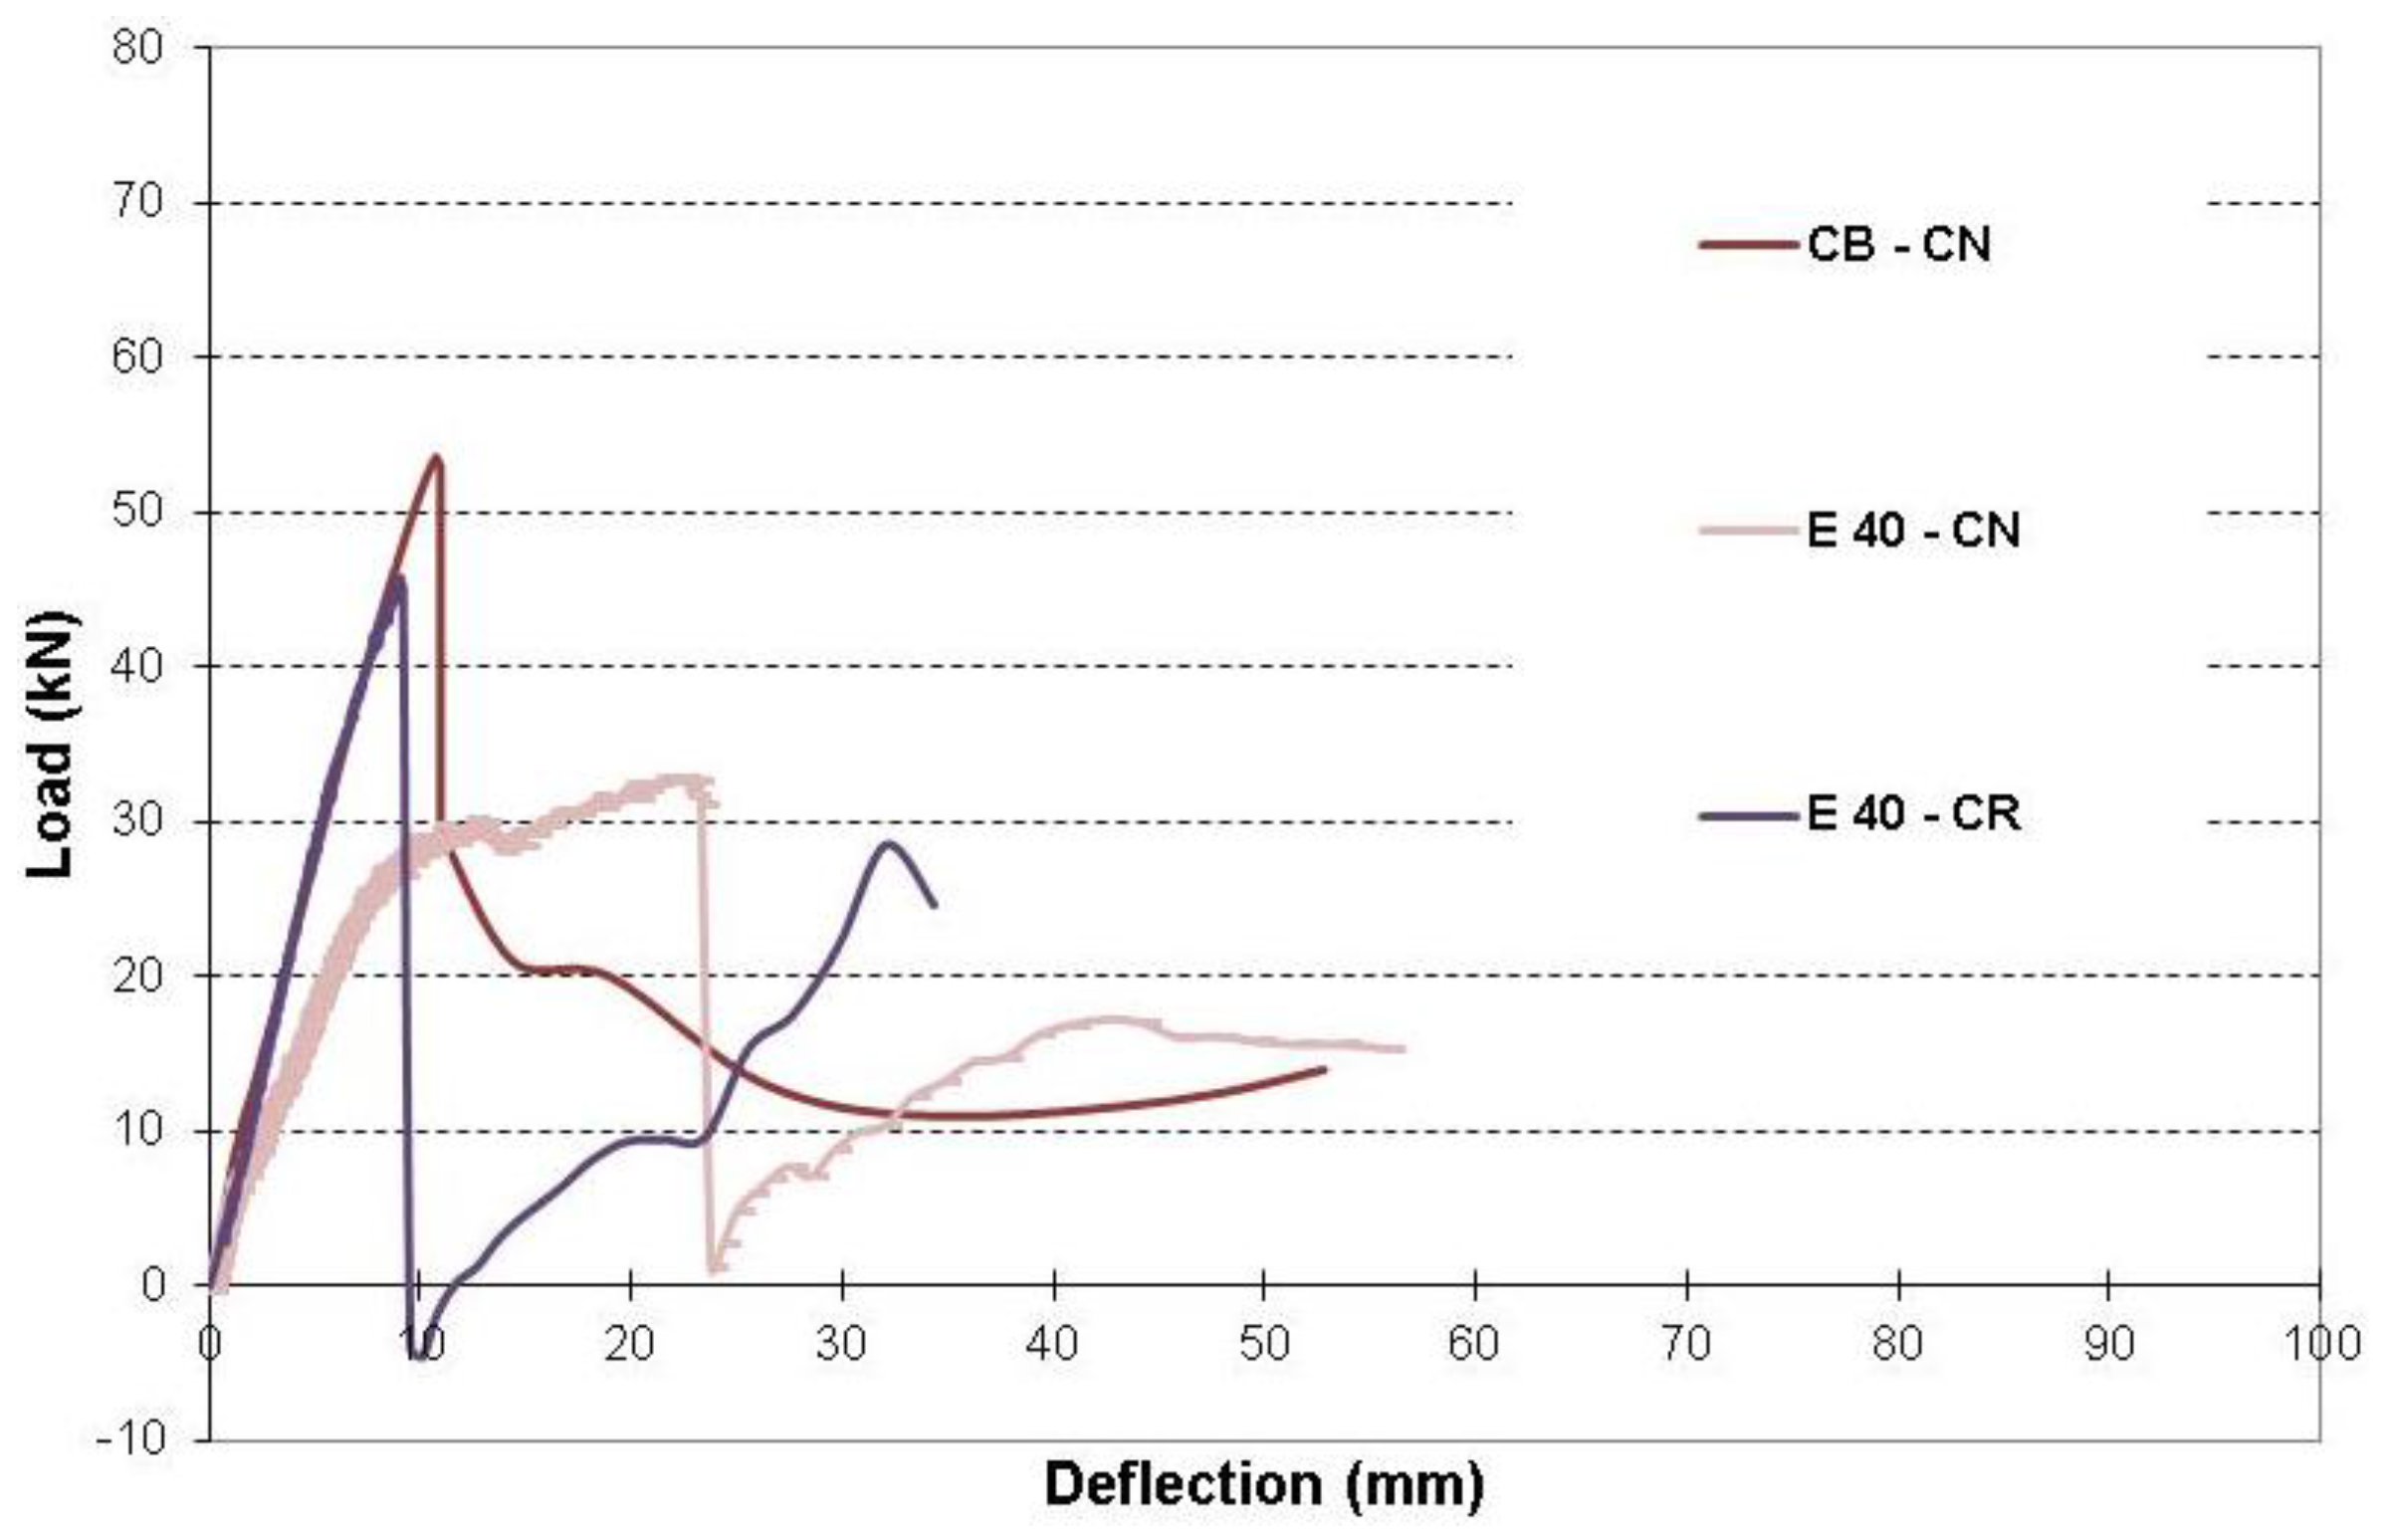
Figure 23 presents a comparison between load-deflection relationships of the control beam (CB–CN), E 40–CN, and E 40–CR. Due to 40% corrosion level in rebars, the beam lost about 39% of its load carrying capacity, but when repaired with both CFRP sheet and U-wraps, it recovered about 24% of its load carrying capacity. Beams with 40% corrosion level had smaller stiffness and experienced more ductility than their counterpart control beam, but when repaired, it had stiffness close to the control beam and became even less ductile than the control beam.
Figure 23.
Effect of 40% corrosion level on load-deflection relationship.

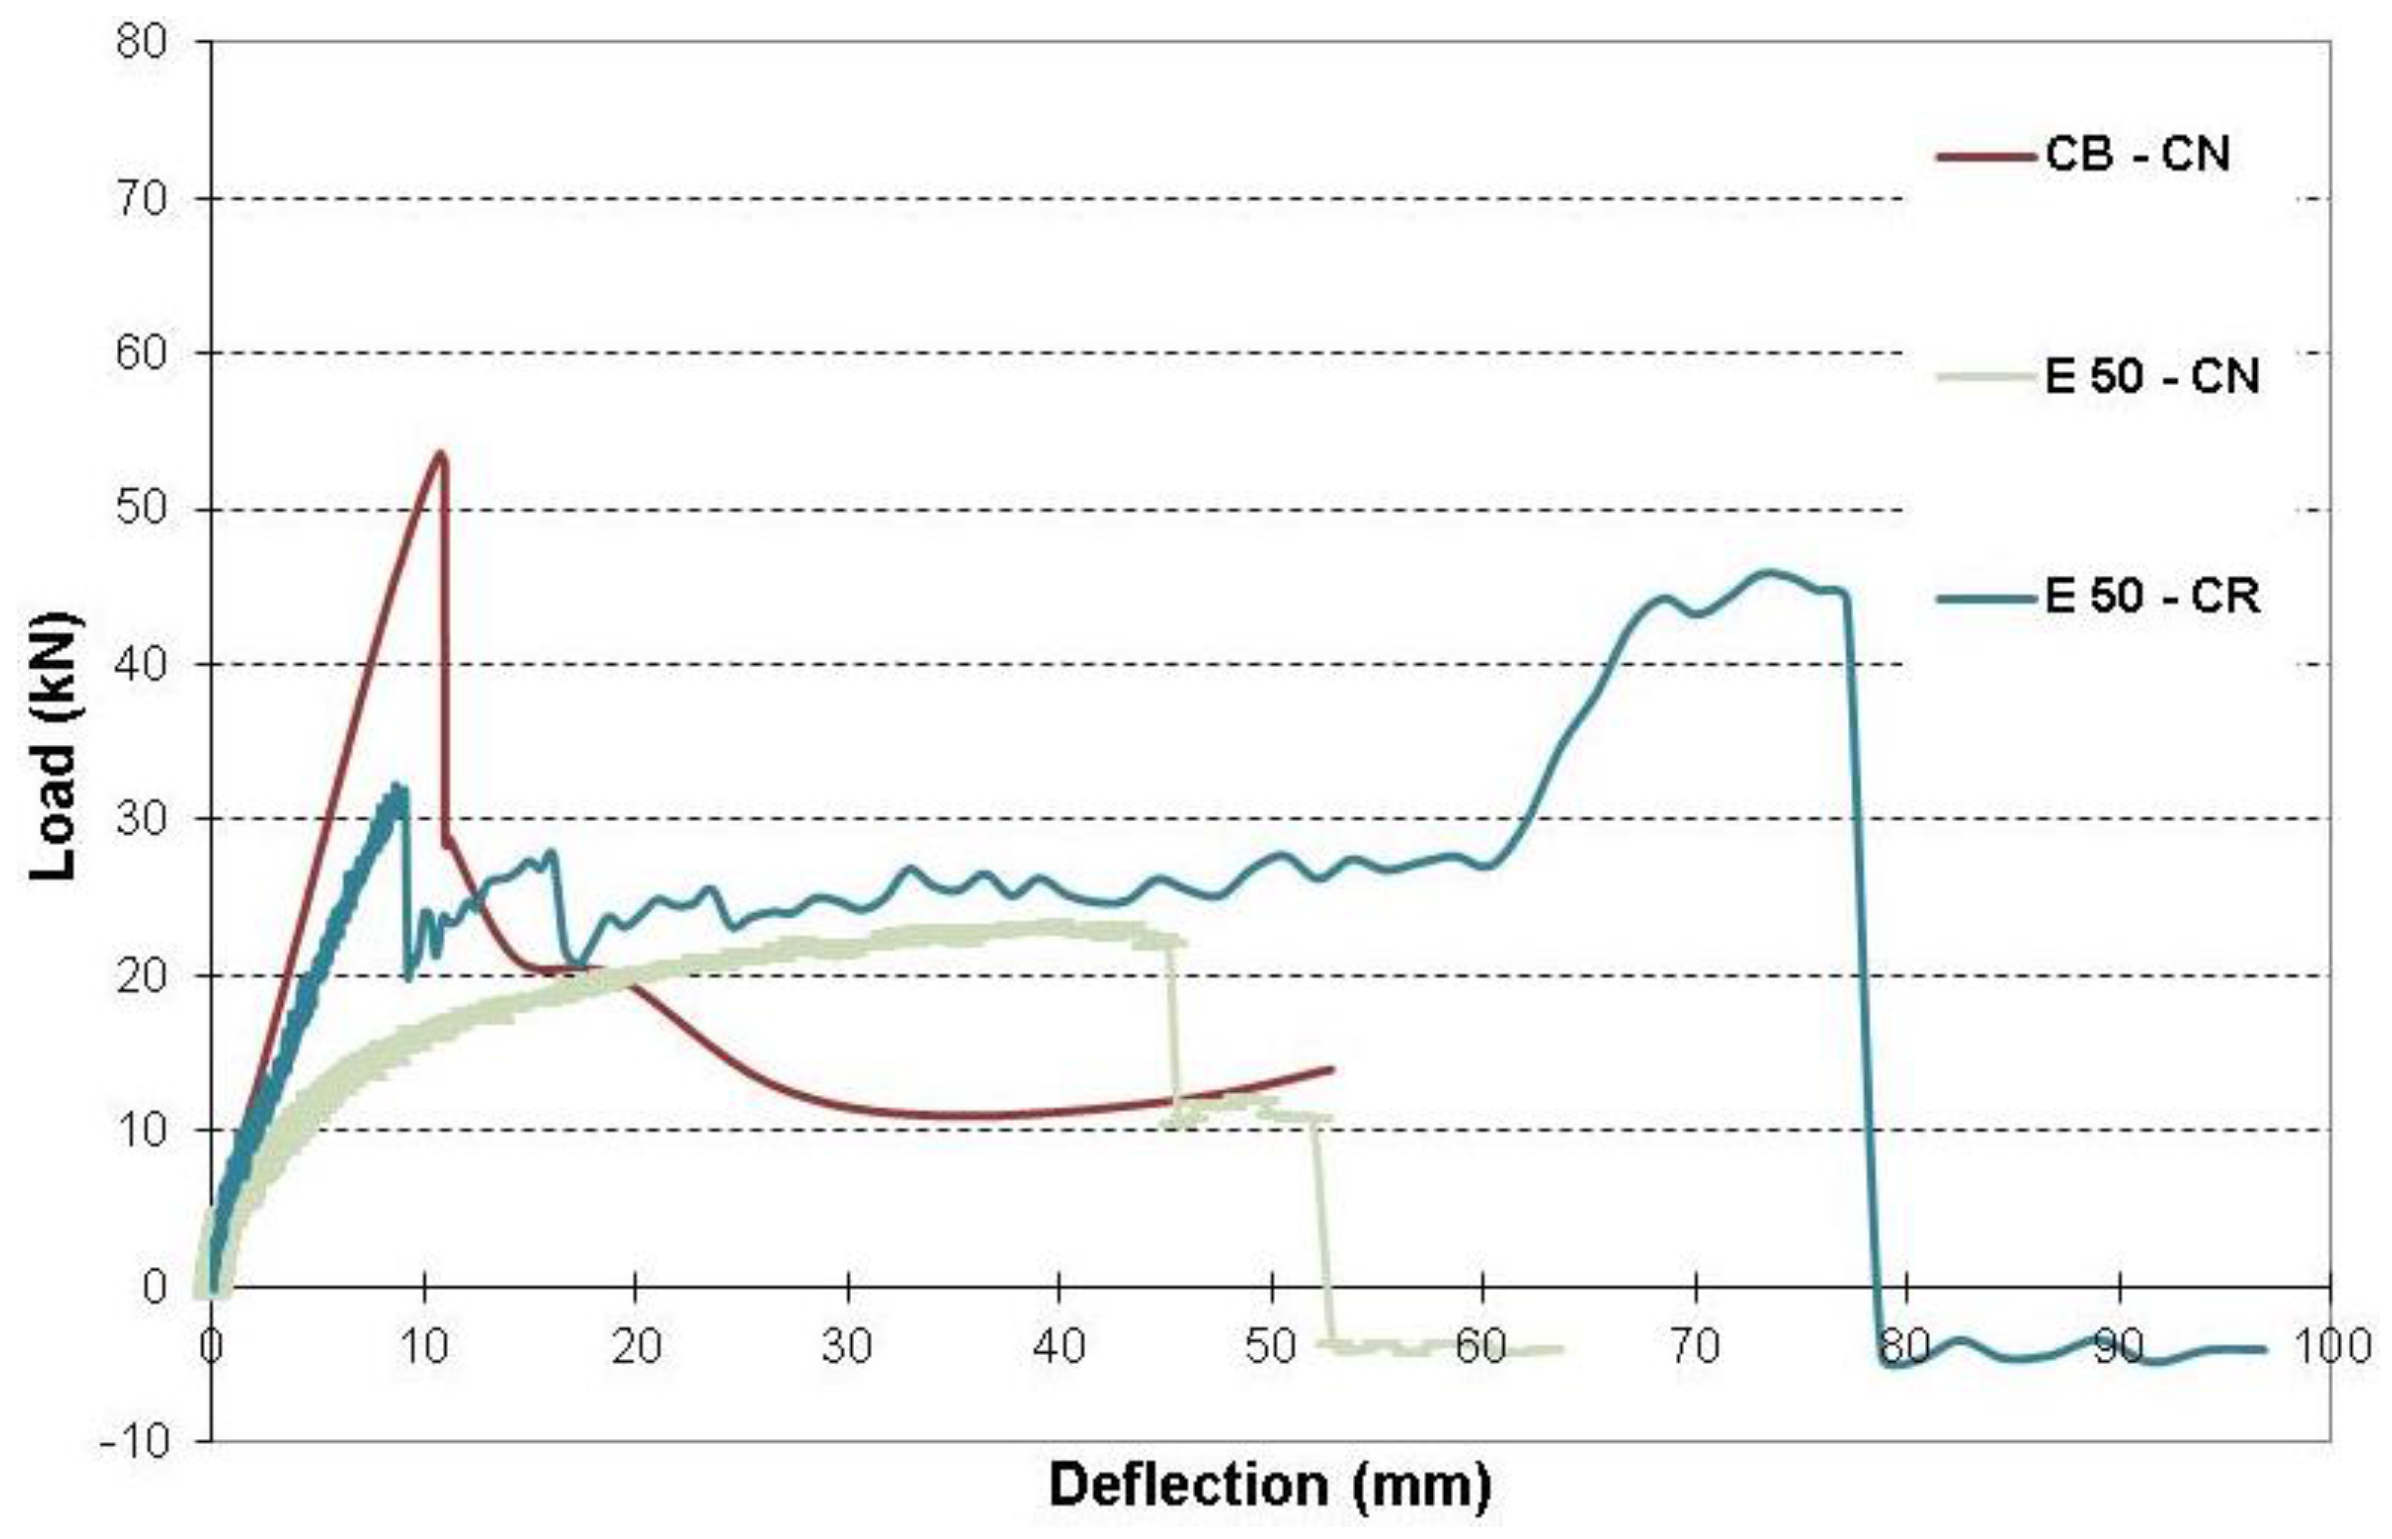
Figure 24 presents a comparison between load-deflection relationships of the control beam (CB–CN), E 50–CN, and E 50–CR. Due to 50% corrosion level in rebars, there was a drastic loss in capacity. The beam lost about 56% of its load carrying capacity, but when repaired with both CFRP sheet and U-wraps, it recovered about 42% of its load carrying capacity. Both beams with 50% corrosion level exhibited ductile performance as rebars fully yielded, formed nicking, and then ruptured. Furthermore, E 50–CR had load-deflection curve similar to the stress-strain diagram of the steel. E 50–CR experienced drop in capacity before the load levels out due to debonding and rupture of some of CFRP. E 50–CN had smaller stiffness and experienced more ductility than their counterpart control beam, but when repaired, it had larger stiffness yet smaller than that of the control beam and became more ductile than the control beam.
Figure 24.
Effect of 50% corrosion level on load-deflection relationship.

4. Conclusions
This investigation aimed to quantify the effect of corrosion level on the performance of reinforced SCC members. Up to 50% corrosion level was considered and investigated. Also, the effectiveness of repaing RC members using both CFRP sheets and U-wraps was evaluated. The beams were cast using the SCC concrete mixtures with 10% RAP, some repaired, and tested under two static line loads at the mid-span until failure. The following conclusions are drawn:
- The developed concrete mixture had slump flow values above the minimum limits of SCC.
- Level of corrosion did not seem to affect the cracking load.
- In general, as the corrosion level increases, the RC members become less stiff and load carrying capacity becomes smaller. The relationship between the level of corrosion and load capacity loss is not linear. For example, when 40% corrosion level was achieved, beam lost about 39% of its load capacity, whereas when 50% corrosion level was achieved, beam lost about 56%.
- Using both CFRP sheets and U-wraps was found to be an effective method to repair corroded RC members.
- Percent of improvement in load capacity after repair varied based on the level of corrosion. For example, when beam with 40% corrosion level was repaired, it recover about 24% of its load capacity while when beam with 50% corrosion level was repaired, it recovered about 42%.
- For up to 20% corrosion level, repairing the RC member with CFRP may restore the full capacity of the beam or even bring it a higher capacity. Also, stiffness may be restored and become very similar to that without any corrosion problem.
- Beyond 20% corrosion level, repairing may not restore the beam to its full capacity. Also, stiffness of the beam may not be restored even after repair is undertaken.
References
- Alper, I.; Nahit, K. Repair and Strengthening of damaged reinforced concrete members by carbon fiber reinforced polymer composites. Teknik Dergi Tech. J. Turk. Chamb. Civ. Eng. 2002, 13, 2597–2616. [Google Scholar]
- American Concrete Institute. Guide for the Design and Construction of Externally Bonded FRP Systems for Strengthening Concrete Structures (ACI 440.2R-08); American Concrete Institute: Farmington Hills, MI, USA, 2008; p. 76. [Google Scholar]
- Shin, Y.S.; Lee, C. Flexural behavior of RC beams strengthened with carbon fiber-reinforced polymer laminates at different levels of sustaining load. ACI Struct. J. 2003, 100, 231–239. [Google Scholar]
- Nanni, A. Carbon FRP Strengthening: New Technology Becomes Mainstream Concrete International. Des. Constr. 1997, 19, 19–23. [Google Scholar]
- Green, P.S.; Boyd, A.J.; Lammert, K. CFRP Repair of Impact-Damaged Bridge Girders, Vol. I: Structural Evaluation of Impact Damaged Prestressed Concrete I Girders Repaired with FRP Materials, BC-354 RPWO #55; Florida Department of Transportation: Tallahassee, FL, USA, 2004. [Google Scholar]
- Klaiber, W.F.; Wipf, T.J.; Kempers, B.J. Repair of damaged prestressed concrete bridges using CFRP. In Proceedings of the Mid Continent Transportation Research Symposium, Ames, IA, USA, 15–16 August 2003.
- Di Ludovico, M. Experimental Behavior of Prestressed Concrete Beams Strengthened with FRP; Report CIES 03-42; University of Missouri: Rolla, MO, USA, 2003. [Google Scholar]
- Klaiber, F.W.; Wipf, T.J.; Russo, F.M.; Paradis, R.R.; Mateega, R.E. Field/Laboratory Testing of Damaged Prestressed Concrete Girder Bridges; Iowa DOT Report HR-397; Iowa State University: Ames, IA, USA, 1999; p. 261. [Google Scholar]
- Xu, R.Q.; Liu, C. CZM-based debonding simulation of cracked beams strengthened by FRP sheets. J. Eng. Mech. 2011, 138, 210–220. [Google Scholar] [CrossRef]
- Coronado, C.A.; Lopez, M.A. Experimental characterization of concrete-epoxy interfaces. J. Mater. Civ. Eng. 2008, 20, 303–312. [Google Scholar] [CrossRef]
- Wang, J.L. Cohesive zone model of intermediate crackinduced debonding of FRP-plated concrete beam. Int. J. Solids Struct. 2006, 43, 6630–6648. [Google Scholar] [CrossRef]
- Leung, C.K.Y. FRP debonding from a concrete substrate: some recent findings against conventional belief. Cem. Concr. Compos. 2006, 28, 742–748. [Google Scholar] [CrossRef]
- Leung, C.K.Y.; Tung, W.K. Three-parameter model for debonding of FRP plate from concrete substrate. J. Eng. Mech. 2006, 132, 509–518. [Google Scholar] [CrossRef]
- Buyukozturk, O.; Hearing, B. Failure behavior of precracked concrete beams retrofitted with FRP. J. Compos. Constr. 1998, 2, 138–144. [Google Scholar] [CrossRef]
- ElSafty, A.; Graeff, M. The Repair of Damaged Bridge Girders with Carbon Fiber Reinforced Polymer (CFRP) Laminates; Final Report, FDOT Contract # BDK82 977-03; University of North Florida: Jacksonville, FL, USA, 2012. [Google Scholar]
- Hussein, M.; Fawzy, T. Structural performance of CFRP strengthened RC slabs in a corrosive environment. ASCE J. Compos. Constr. 2010, 14, 865–869. [Google Scholar] [CrossRef]
- Ting, S.; Nowak, A. Effect of reinforcing steel area loss on flexural behavior of reinforced concrete beams. ACI Struct. J. 1991, 88, 309–314. [Google Scholar]
- Leung, C.; Hou, D. Numerical Simulation of Chloride-Induced Corrosion Initiation in Reinforced Concrete Structures with Cracks. J. Mater. Civ. Eng. 2014, 27, 04014122. [Google Scholar] [CrossRef]
- Jang, B.S.; Oh, B.H. Effects of non-uniform corrosion on the cracking and service life of reinforced concrete structures. Cem. Concr. Res. 2010, 40, 1441–1450. [Google Scholar] [CrossRef]
- Anderson-Wile, A.M.; Wile, B.M.; Wen, Q.; Shen, H. Corrosion at the Polymer-Metal Interface in Artificial Seawater Solutions. Int. J. Corros. 2012, 2012. [Google Scholar] [CrossRef]
- Mitsui, Y.; Murakami, K.; Takeda, K.; Sakai, H. A Study on Shear Rein-forcement of Reinforced Concrete Beams Externally Bonded with Carbon Fiber Sheets. Compos. Interface 1998, 5, 285–295. [Google Scholar] [CrossRef]
- Abdel-Mohti, A.; Shen, H.; Khodair, Y. Characteristics of self-consolidating concrete with RAP and SCM. Constr. Build. Mater. 2016, 102, 564–573. [Google Scholar] [CrossRef]
- Ibrahim, A.; Mahmoud, E.; Khodair, Y.; Patibandla, V. Fresh, Mechanical, and Durability Characteristics of Self-Consolidating Concrete Incorporating Recycled Asphalt Pavements. J. Mater. Civ. Eng. 2014, 26, 668–675. [Google Scholar] [CrossRef]
- Hossain, K.M.A.; Lachemi, M. Fresh, mechanical, and durability characteristics of self-consolidating concrete incorporating volcanic ash. J. Mater. Civ. Eng. 2010, 22, 651–657. [Google Scholar] [CrossRef]
- Khatib, J.M. Performance of self-compacting concrete containing fly ash. Constr. Build. Mater. 2008, 22, 1963–1971. [Google Scholar] [CrossRef]
- Ozawa, K.; Maekawa, K.; Kunishima, H.; Okamura, H. Performance of concrete based on the durability design of concrete structures. In Proceedings of the 2nd East-Asia-Pacific Conference on Structural Engineering and Construction, Chiang Mai, Thailand, 11–13 January 1989; pp. 445–456.
- Petersson, O. Application of Self-Compacting Concrete for Bridge Castings; Swedish Cement and Concrete Research Institute: Stockholm, Sweden, 1998. [Google Scholar]
- Khayat, K.H.; Paultre, P.; Tremblay, S. Structural performance and in-place properties of self-consolidating concrete used for casting highly reinforced columns. ACI Mater. J. 2001, 98, 371–378. [Google Scholar]
- Lachemi, M.; Hossain, K.M.A.; Lambros, V.; Bouzoubaa, N. Development of cost effective self-consolidating concrete incorporating fly ash, slag cement or viscosity modifying admixtures. ACI Mater. J. 2003, 100, 419–425. [Google Scholar]
- Yurugi, M. Application of self-compacting concrete in Japan. In Proceedings of the 23rd OWICS conference, CI-Premier, Singapore, 25–26 August 1998; pp. 29–42.
- Tobias, P.A.; Trindade, D.C. Applied Reliability; Van Nostrand Reinhold: New York, NY, USA, 1995; pp. 81–104. [Google Scholar]
- Gräfen, H.; Horn, E.; Schlecker, H.; Schindler, H. Corrosion. In Uhlmann’s Encyclopedia of Industrial Chemistry; Wiley-VCH: Hoboken, NJ, USA, 2000. [Google Scholar]
© 2016 by the authors; licensee MDPI, Basel, Switzerland. This article is an open access article distributed under the terms and conditions of the Creative Commons by Attribution (CC-BY) license (http://creativecommons.org/licenses/by/4.0/).
Share and Cite
MDPI and ACS Style
Abdel-Mohti, A.; Shen, H. Strengthening of Corroded Reinforced SCC-RAP Members with CFRP. Fibers 2016, 4, 3. https://doi.org/10.3390/fib4010003
AMA Style
Abdel-Mohti A, Shen H. Strengthening of Corroded Reinforced SCC-RAP Members with CFRP. Fibers. 2016; 4(1):3. https://doi.org/10.3390/fib4010003
Chicago/Turabian StyleAbdel-Mohti, Ahmed, and Hui Shen. 2016. "Strengthening of Corroded Reinforced SCC-RAP Members with CFRP" Fibers 4, no. 1: 3. https://doi.org/10.3390/fib4010003
Note that from the first issue of 2016, this journal uses article numbers instead of page numbers. See further details here.