Article

Characterization of Developing Cotton Fibers by Confocal Raman Microscopy

1
Department of Physics and Engineering, California State University at Bakersfield, 9001 Stockdale Highway, Bakersfield, CA 93311, USA
2
Fiber and Biopolymer Research Institute, Department of Plant and Soil Science, Texas Tech University, Lubbock, TX 79403, USA
3
Department of Physics, University of Texas at El Paso, El Paso, TX 79968, USA
*
Author to whom correspondence should be addressed.
Fibers 2014, 2(4), 285-294; https://doi.org/10.3390/fib2040285
Submission received: 21 September 2014 / Revised: 17 October 2014 / Accepted: 22 October 2014 / Published: 27 October 2014
(This article belongs to the Special Issue Cellulose Fibers)

Abstract

:
Cellulose deposition in developing cotton fibers has been studied previously with analytical techniques, such as Fourier transform infrared spectroscopy (FTIR), High-performance liquid chromatography (HPLC) and Thermogravimetric analysis (TGA). Recent technological developments in instrumentation have made Raman microscopy emerge as an extraordinary analytical tool in biological and plant research. The advantage of using confocal Raman microscopy (CRM) resides in the lateral spatial resolution and in the fact that Raman spectroscopy provides not only chemical composition information, but also structural information. Cross-sections of cotton fibers harvested at different developmental stages were studied with CRM. The Raman bands assigned to cellulose were analyzed. The results of this study indicate that CRM can be used as a tool to study cellulose deposition in cotton fibers and could provide useful information on cellulose deposition during cotton fiber development.

Graphical Abstract

1. Introduction

Raman scattering involves the excitation of a molecule by inelastic scattering with a photon, and it depends on changes in the polarizability due to molecular vibrations. Because of recent technological developments in instrumentation, Raman microscopy has emerged as a powerful analytical tool in biological and plant research [1]. Confocal Raman microscopy (CRM) presents some advantages compared to other chemical imaging techniques. Due to the fact that Fourier transform infrared spectroscopy (FTIR) uses longer wavelengths, the diffraction-limited resolution is in the micron scale, around 5 microns with attenuated total reflectance (ATR) imaging [2]. In addition, Raman spectroscopy is not sensitive to water content in samples, as is the case with IR spectroscopy [1]. UV microscopy is close in resolution (~250 nm) to CRM, but it lacks the precise functional group identification [3]. The resolution of CRM is in the submicron scale, close to 200 nm, using a laser in the visible region [4]. Moreover, with CRM, it is possible to obtain structural information of the material, such as crystallinity [5,6], and also to analyze the depth profiles of the samples [7].
In this paper, we analyzed cross-sections of developing cotton fibers with CRM. Cotton fiber development consists of five major overlapping developmental stages: differentiation, initiation, polar elongation, secondary cell wall (SCW) deposition and maturation. Fiber initiation commences at anthesis (0 days post anthesis = 0 dpa) and signals the onset of fiber morphogenesis. Within three weeks after anthesis, fiber growth is characterized by the synthesis of the primary cell wall (PCW) and an increase in fiber length. Around 21 dpa, the secondary cell wall growth initiates and continues for a period of three to six weeks post anthesis. The transition period between 16 and 21 dpa is considered to represent a developmental switch in emphasis from primary to secondary cell wall [8]. Previously, we reported on the use of different analytical techniques to study cellulose development in cotton fibers harvested from two cultivars, TX55 and TX19, at different stages post anthesis [9,10]. The results converged towards the conclusion that SCW in fibers from the TX19 cultivar develops earlier than in fibers from the TX55 cultivar. For the above-mentioned studies, cross-sections of developing cotton fibers were obtained and analyzed with image analysis software in order to calculate the degree of maturity. These cross-sections could be used to obtain additional information on the developing cotton fibers. CRM has been used previously on cross-sections and the surfaces of cellulosic materials. This analytical technique was used to illustrate the changes in molecular composition in the SCW of cross-sections of poplar wood cells [11]. The morphological and structural changes associated with the mercerization of cellulose fibers were studied with atomic force microscopy (AFM) and CRM [7]. In addition, the distribution of lignin and cellulose in black spruce wood was investigated previously by Raman imaging [12]. Furthermore, wood extractives from cellulose surfaces were studied by combining AFM and CRM [13]. The spatial distribution of cell wall polymers in Arabidopsis thaliana was studied by CRM, as well [14]. Moreover, imaging of lignification in cell walls of transgenic Populus trichocarpa was performed by Raman microscopy [15]. CRM can also be used to study the surface modification of cellulose and other materials. Mangiante et al. [16] used RCM to analyze alkyne-derivatized fibers cross-sections. The results showed that alkyne moieties were incorporated all over the fibers. Song et al. [17] reported that Raman microscopy is capable of detecting specific vibrational stretches, as well as imaging cells. All of these reports support the idea that CRM can be used as a tool to study developing cotton fibers.
Our objective is to analyze cellulose deposition in the secondary cell wall of developing fibers and to obtain chemical and structural information. The thickness of the primary cell wall of cotton fibers is less than 500 nm [18], and the diameter of the fibers from the cotton variety used in this study range from 11 to 22 µm [19]. CRM is ideal for this study, due to its high lateral resolution.

2. Experimental Section

2.1. Materials

In this work, cotton fiber (Gossypium hirsutum L cv. TX55) samples were planted in a greenhouse and harvested at 21, 27 and 56 dpa. The pericarp was immediately removed, and isolated ovules were transferred into cryogenic vials and stored in a cryobiological storage system filled with liquid nitrogen. Fiber samples were thawed and rinsed with water to remove sugars and other water-soluble compounds [10]. Fiber cross-sections were performed according to the protocol reported in [8]. Briefly, fiber samples were embedded in methacrylate polymer. This polymer holds the cotton fibers until they can be glued to a slide for observation. Then, the methacrylate polymer is dissolved in methyl ethyl ketone.

2.2. Methods

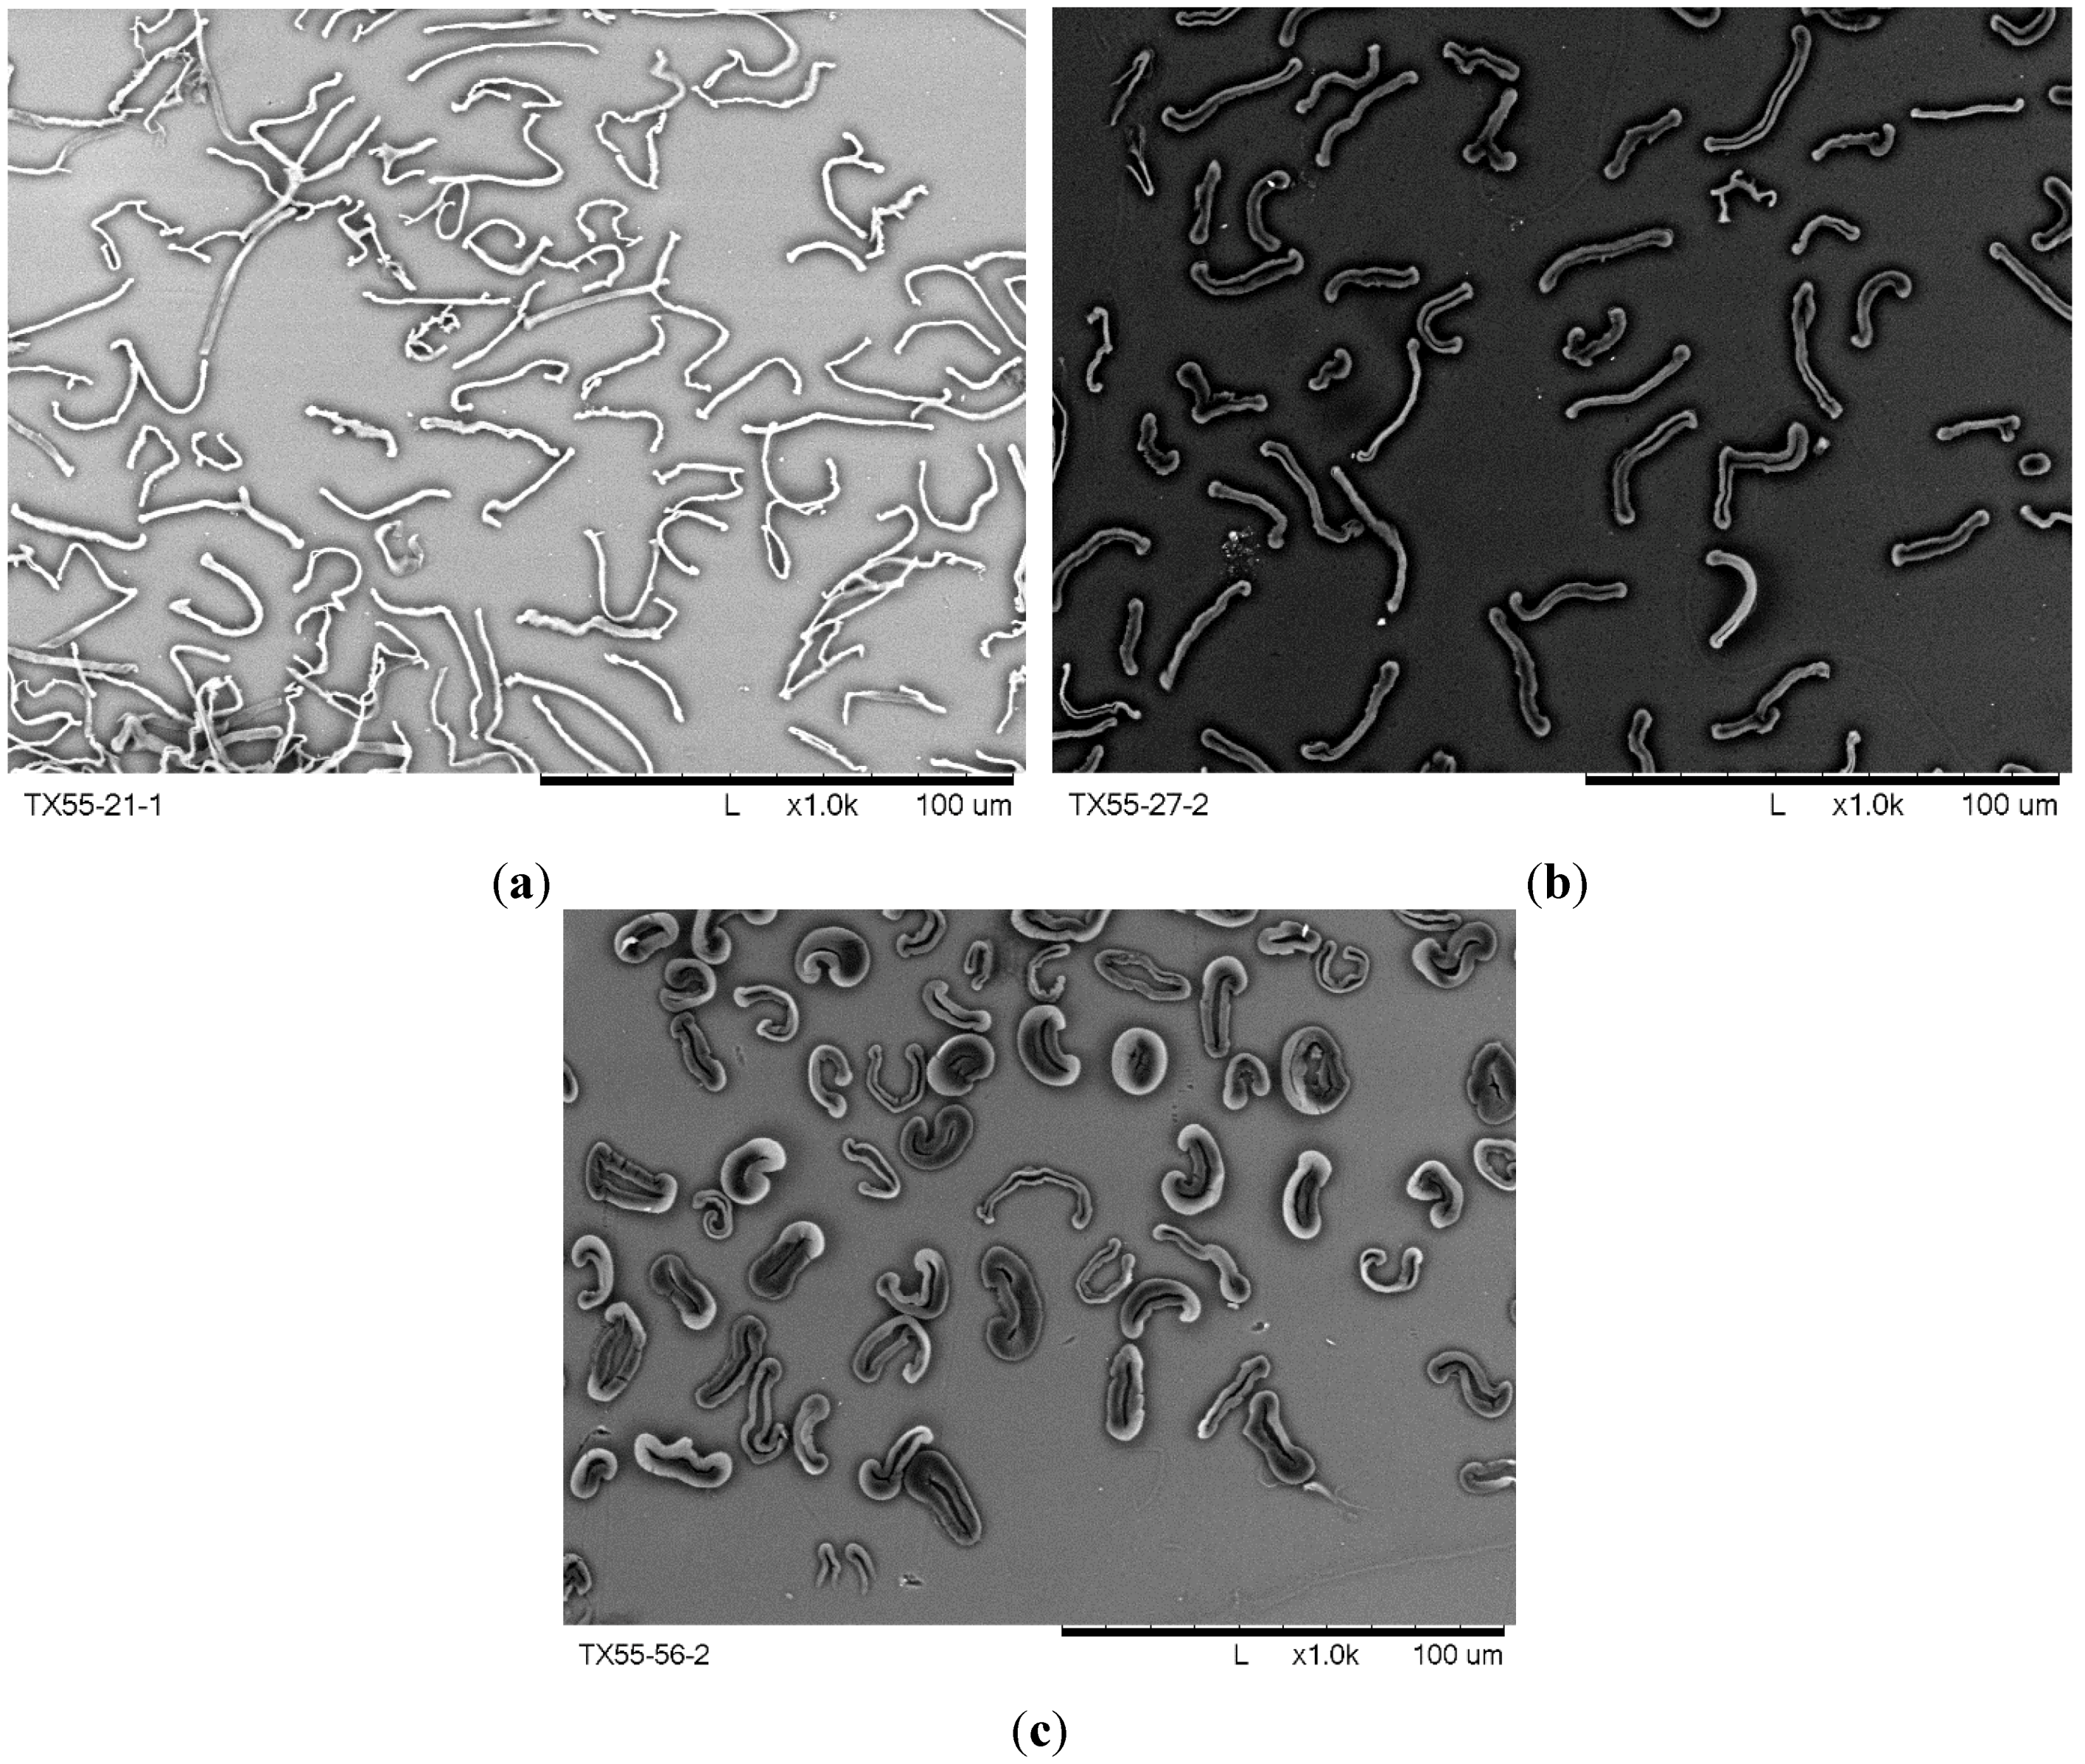
2.2.1. Scanning Electron Microscopy

Scanning electron microscopy of the cotton fibers was performed with Hitachi Microscope TM-1000 (Tokyo, Japan) using an accelerating voltage of 15 kV. Fibers were placed on a carbon disk, and no coating was performed prior to testing.

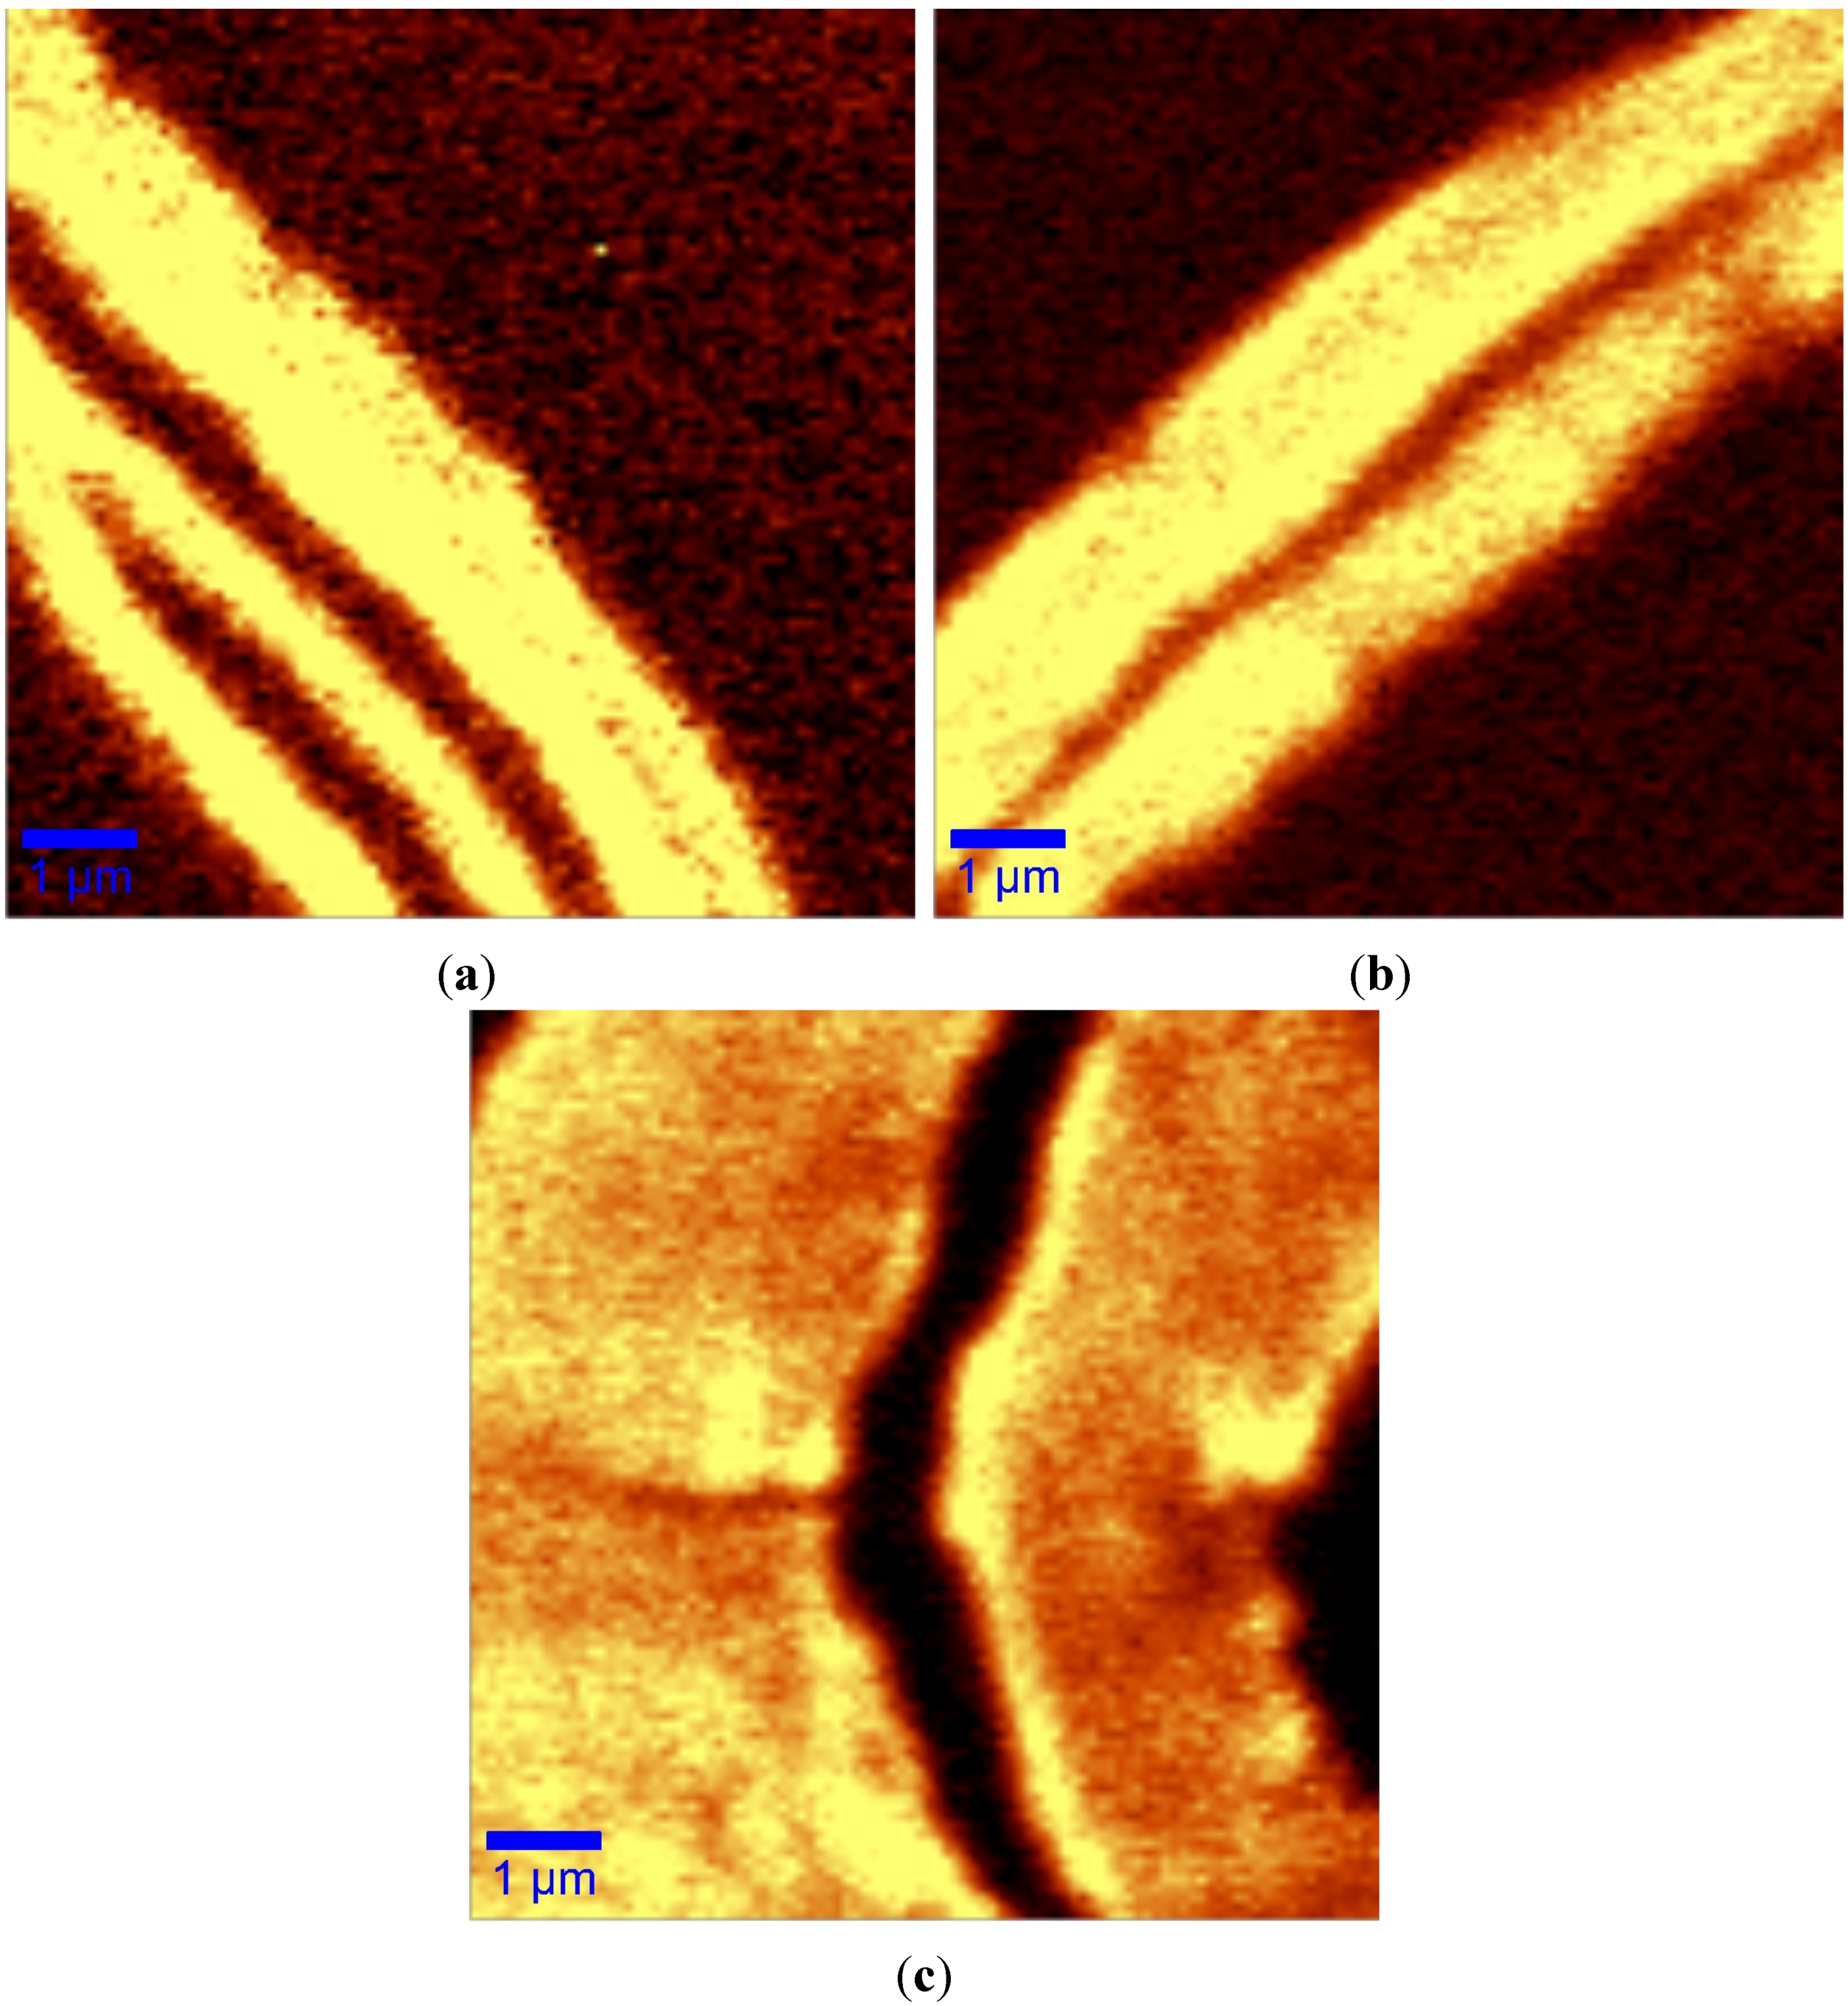
2.2.2. Confocal Raman Microscopy (CRM)

CRM was carried out in an Alpha300 Raman Microscope (Witec, Germany). A 532-nm laser was used as a monochromatic light source. The Raman spectrum of each sample corresponds to the average of all of the spectra in each image. Analysis of the Raman spectra was performed in KnowItAll® Information Systems Academic edition software from Bio-Rad (Berkeley, CA, USA). All spectra were baseline corrected and normalized with the band at 1099 cm−1.

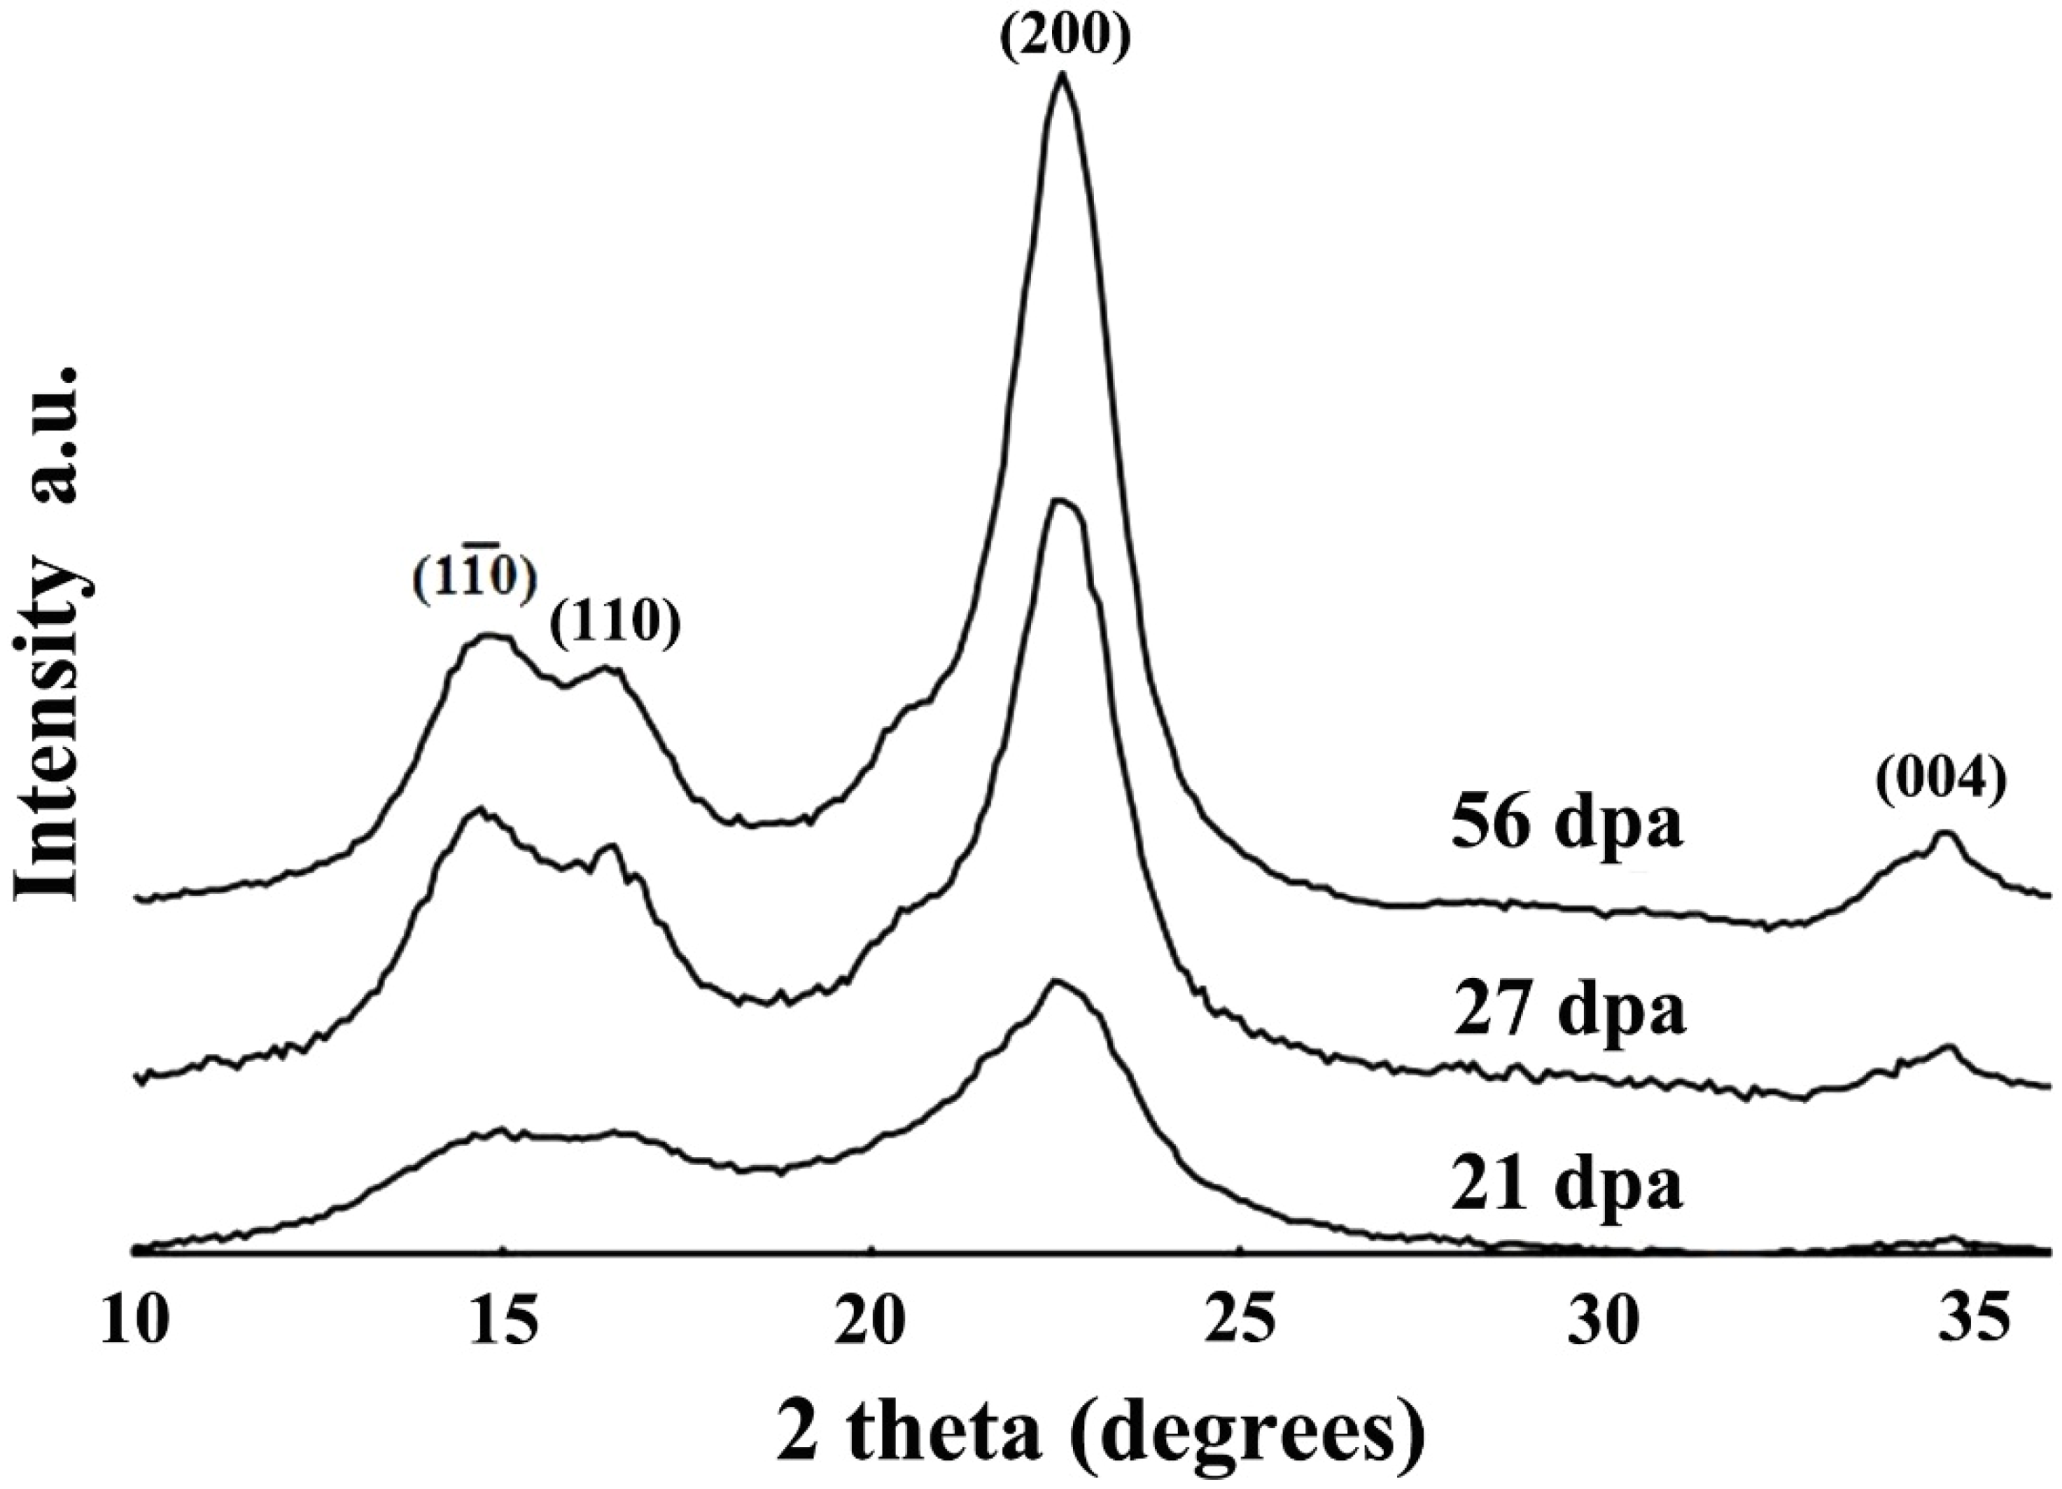
2.2.3. X-Ray Diffraction

X-ray diffraction measurements of cotton fibers were performed on powder samples. Cotton fibers were ground in a Wiley mill to pass through a 20 mesh screen. Measurements were carried in a Rigaku Smartlab instrument. CuKα radiation was generated at 40 kV and 44 mA. The crystallinity of the powdered samples was determined by the use of PDXL software from Rigaku (Tokyo, Japan). The crystallinity was calculated by the ratio of the total area of the crystalline resolved peaks to the total unresolved area.

3. Results and Discussion
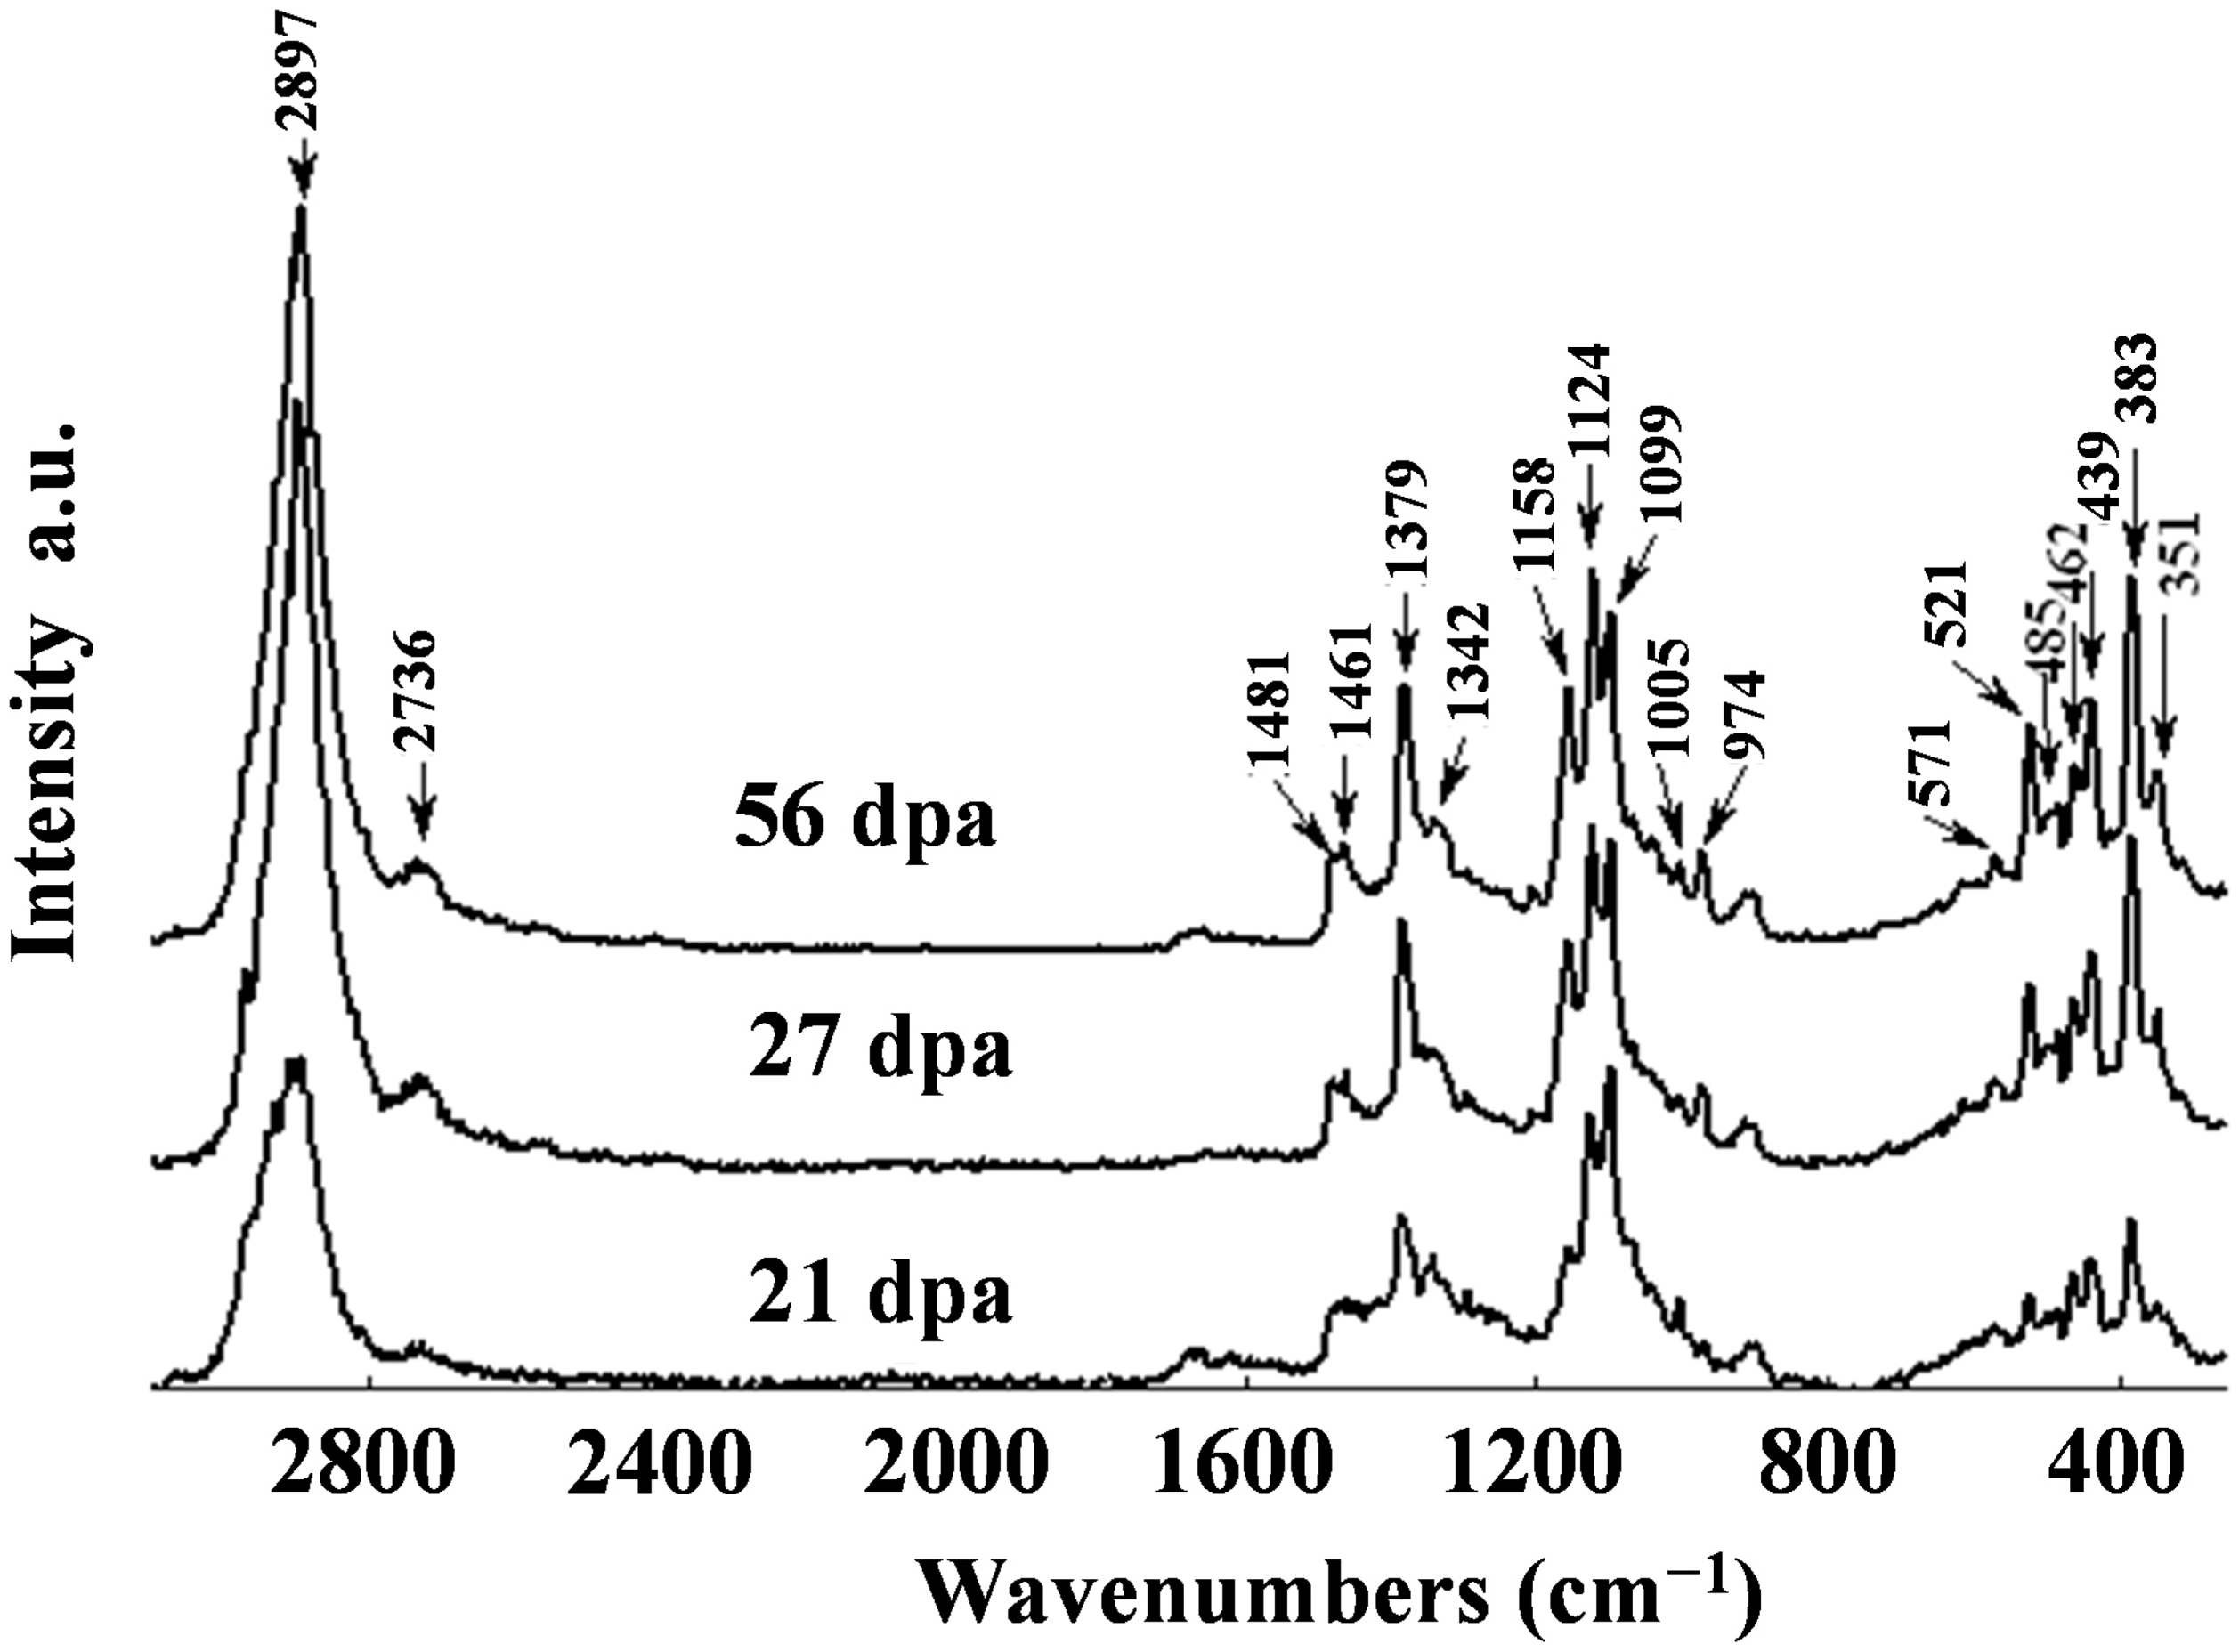
As reported in our previous work, the secondary cell wall synthesis in cotton fibers from the TX55 cultivar is initiated at around 21 dpa [9,10]. The period between 21 and 27 dpa is characterized by an increase in the amount of cellulose in the fibers. The cellulose content of fibers from the TX55 cultivar harvested at 21, 27 and 56 dpa has been reported as 34%, 81% and 88%, respectively [9]. SEM images of cotton fiber cross-sections at different developmental stages are shown in Figure 1. These images illustrate the increase of the secondary cell wall thickness as a function of dpa. The cross-section at 21 dpa has a thin SCW, and its main constituent is the primary cell wall. At 27 dpa, the development of SCW is more pronounced. Maturity is reached at 56 dpa, and the SCW is clearly the main constituent of the cotton fiber [8].
Figure 1. SEM images of fiber cross-sections at different developmental stages: (a) 21 dpa (days postanthesis); (b) 27 dpa; and (c) 56 dpa.
Fibers 02 00285 g001
Representative confocal Raman images of cotton fiber cross-sections at different dpa are shown in Figure 2. These images were created by mapping the intense band around 2800–2900 cm−1 (i.e., CH, CH2). These images also illustrate the increase of the secondary cell wall thickness as a function of dpa. The advantage of using CRM is that every pixel of each image of Figure 2 is a Raman spectrum. Thus, the deposition of cellulose in developing cotton fibers can be investigated by this label-free imaging technique.
Figure 2. Confocal Raman images of fiber cross-sections at different developmental stages: (a) 21 dpa; (b) 27 dpa; and (c) 56 dpa.
Fibers 02 00285 g002
Figure 3 shows the Raman spectra acquired from the images of Figure 2 of three samples. The spectrum at each dpa has different band intensities, which is due to differences in the chemical composition and structural organization of developing cotton fibers at different stages of maturity. Table 1 shows the relative intensity values and the assignment of some of the principal Raman bands corresponding to cellulose.
Figure 3. Raman spectra of cross-sections of fibers at different developmental stages: 21 dpa, 27 dpa and 56 dpa. The spectra are shifted vertically for clarity.
Fibers 02 00285 g003
Vibration at 2897 cm−1: The intense vibration at 2897 cm−1 is attributed to CH and CH2 stretching in cellulose macromolecules [7]. The relative intensity of this band is low at 21 dpa compared to the intensity of the same band in the spectra from fibers harvested at 27 and 56 dpa. These results are in agreement with the cellulose content determined using the anthrone method from our previous work.
Vibration at 2736 cm−1: This vibration is assigned to the methine group in cotton [20]. Noticeably high relative intensity is observed in the spectra of fibers harvested at 27 and 56 dpa when compared with the intensity in the spectra of fibers harvested at 21 dpa.
Vibrations at 1379 and 1158 cm−1: These vibrations are assigned to CH2 and C–C ring breathing asymmetric stretching of cellulose, respectively [21]. For fibers harvested at 27 and 56 dpa, the relative intensities of these vibrations are higher compared to the relative intensities at 21 dpa.
Vibrations at 1124, 974 and 521 cm−1: The intensity of the band at 1124 cm−1, attributed to the glycosidic bond symmetric stretching, showed an increase between 21 and 56 dpa. The vibration at974 cm−1 is assigned to CH2 stretching. The intensity of this vibration increased from 21 to 56 dpa, indicating structural changes during the development of the fiber. The vibration at 521 cm−1 is also assigned to C–O–C glycosidic. The intensity of this vibration increased by about 130% between 21 and 56 dpa. This indicates massive deposition of cellulose during this period of fiber development.
Vibrations at 439, 383, and 346 cm−1: Bands at 439, 383 and 346 cm−1 have been previously attributed to cellulosic ring deformation, and their intensities are significantly lower at 21 dpa than at 27 and 56 dpa [21].
Vibrations at 1481 and 1462 cm−1: Schenzel et al. [5] reported that the vibration at 1482 cm−1 is indicative of crystalline cellulose I, while the vibration at 1462 cm−1 is indicative of amorphous cellulose. The intensity of this vibration is low compared to the vibration intensity in the spectra of fibers harvested at 27 dpa. This indicates higher amorphous cellulose at 27 dpa. The intensity of the vibration at 1481 cm−1 is higher in the spectra of fibers harvested at 56 dpa, which indicates high crystalline cellulose at this stage. It should be pointed out that there is not a big difference between the intensity of this vibration at 27 and 56 dpa. This indicates that there is no major change in the crystallinity of cellulose between 27 and 56 dpa.
Table 1. Assignment of some of the Raman bands of cellulose in cotton fibers and the relative intensities at different dpa.
Wavenumbers (cm−1)Relative intensity (a.u.)Assignment [5,6,7,21,22]
56 dpa27 dpa21 dpa
2897225222871015CH, CH2 stretching
273623627097CH Methine
1481236234218Correlated to cellulose crystalline
1461250279230Correlated to amorphous cellulose
1379774685501CH2, HCC, HCO, COH
1158763681436CC, CO ring breathing, asymmetric stretching
112411351041825COC glycosidic linkage, symmetric stretching
1099100010001000COC glycosidic, ring breathing
974264237137CH2
521656555286COC glycosidic
439738654397CCC, CCO ring deformation
38311081008526CCC, CO, CCO, ring deformation/correlated to cellulose crystallinity
346502470256CCC, CO, CCO, ring deformation
Agarwal et al. [6] reported that the ratio of Raman bands at 380 and 1096 cm−1 is directly correlated to the crystallinity of cellulose. In our study, the normalization was performed with the band at 1099 cm−1. Therefore, the relative intensities of the band at 380 cm−1 can be compared directly for all samples. The results showed that the highest intensity is obtained for fibers harvested at 56 dpa, and the lowest intensity is obtained for fibers harvested at 21 dpa. These results are in good agreement with the percent of crystallinity obtained from the traditional X-ray diffraction. The XRD patterns of the powdered cotton samples were collected (Figure 4). The fibers harvested at 21, 27 and 56 dpa had 52%, 72% and 80% crystallinity, respectively. These results are in agreement with the previously-reported crystallinity of developing cotton fibers [23].
Figure 4. X-ray diffraction pattern of cotton fibers at different developmental stages: 21 dpa, 27 dpa and 56 dpa. The patterns are shifted vertically for clarity.
Fibers 02 00285 g004

4. Conclusions

In this study, CRM was used to analyze cross-sections of developing cotton fibers. The results point to the conclusion that the relative intensity values of the Raman spectra of the principal bands corresponding to cellulose macromolecules presented in Table 1 were significantly lower in the spectra of fibers harvested at 21 dpa compared to 56 dpa. These results are in agreement with the previously-reported cellulose content by the anthrone method. Furthermore, the crystallinity of developing cotton fibers was obtained by XRD, and the results are in agreement with previously-reported results. The intensity of the Raman band of developing cotton fibers at 383 cm−1, which has been correlated to cellulose crystallinity, is in agreement with XRD results. The submicron resolution of CRM presents an opportunity to gain insight into the deposition of cellulose in the secondary cell wall. The results showed that it is possible to obtain information on the chemical composition and structure of the deposited cellulose in developing cotton fibers. CRM can be used as a tool to differentiate between cotton fibers at different developmental stages and could provide useful information of fiber development.

Acknowledgments

The authors would like to thank Cotton Incorporated/Texas State Support Committee for financial support. Texas Tech University manuscript number T-4-663.

Author Contributions

The manuscript was finalized through contribution from all authors and all authors read and approved the final manuscript.

Conflicts of Interest

The authors declare no conflict of interest.

References

  1. Gierlinger, N.; Schwanninger, M. The potential of Raman microscopy and Raman imaging in plant research. Spectr. Int. J. 2007, 21, 69–89. [Google Scholar] [CrossRef]
  2. Chan, K.L.A.; Kazarian, S.G.; Mavraki, A.; Williams, D.R. Fourier Transform Infrared imaging of Human hair with high spatial resolution without the use of a synchrotron. Appl. Spectrosc. 2005, 59, 149–155. [Google Scholar] [CrossRef]
  3. Roder, T.; Koch, G.; Sixta, H. Application of confocal Raman spectroscopy for the topochemical distribution of lignin and cellulose in plant cell walls of beech wood (Fagus sylvatica L.) compared to UV microspectrophotometry. Holzforschung 2004, 58, 480–482. [Google Scholar] [CrossRef]
  4. Dieing, T.; Hollricher, O. High resolution, high-speed confocal Raman imaging. Vib. Spectrosc. 2008, 48, 22–27. [Google Scholar] [CrossRef]
  5. Schenzel, K.; Fischer, S.; Brendler, E. New method for determining the degree of cellulose I crystallinity by means of FT Raman spectroscopy. Cellulose 2005, 12, 223–231. [Google Scholar] [CrossRef]
  6. Agarwal, U.P.; Reiner, R.S.; Ralph, S.A. Determination of Cellulose I Crystallinity by FT-Raman Spectroscopy. In Proceeding of the 15th International Symposium on Wood; Fiber and Pulping Chemistry: Oslo, Norway, 2009. [Google Scholar]
  7. Eronen, P.; Osterberg, M.; Jaaskelainen, A.S. Effect of alkaline treatment on cellulose supramolecular structure studied with combined confocal Raman spectroscopy and atomic force microscopy. Cellulose 2009, 16, 167–178. [Google Scholar] [CrossRef]
  8. Abidi, N.; Hequet, E.; Cabrales, L.; Gannaway, J.; Wilkins, T.; Wells, L.W. Evaluating cell wall structure and composition of developing cotton fibers using Fourier Transform Infrared spectroscopy and thermogravimetric analysis. J. Appl. Polym. Sci. 2008, 107, 476–486. [Google Scholar] [CrossRef]
  9. Abidi, N.; Hequet, E.; Cabrales, L. Changes in sugar composition and cellulose content during the secondary cell wall biogenesis in cotton fibers. Cellulose 2010, 17, 153–160. [Google Scholar] [CrossRef]
  10. Abidi, N.; Cabrales, L.; Hequet, E. Fourier transform infrared spectroscopy approach to the study of the secondary cell wall development in cotton fiber. Cellulose 2010, 17, 309–320. [Google Scholar] [CrossRef]
  11. Gierlinger, N.; Schwanninger, M. Chemical imaging of poplar wood cell walls by confocal Raman microscopy. Plant Physiol. 2006, 140, 1246–1254. [Google Scholar] [CrossRef]
  12. Agarwal, U.P. Raman imaging to investigate ultrastructure and composition of plant cell walls: distribution of lignin and cellulose in black spruce wood (Picea mariana). Planta 2006, 224, 1141–1153. [Google Scholar] [CrossRef]
  13. Osterberg, M.; Schmidt, U.; Jaaskelainen, A.S. Combining confocal Raman spectroscopy and atomic force microscopy to study wood extractives on cellulose surface. Colloid Surf. A Physicochem. Eng. Asp. 2006, 291, 197–201. [Google Scholar] [CrossRef]
  14. Schmidt, M.; Schwartzberg, A.M.; Carroll, A.; Chaibang, A.; Adams, P.D.; Schuck, P.J. Raman Imaging of cell wall polymers in Arabidopsis thaliana. Biochem. Biophys. Res. Commun. 2010, 395, 521–523. [Google Scholar] [CrossRef]
  15. Schmidt, M.; Schwartzberg, A.M.; Perera, P.N.; Weber-Bargioni, A.; Carroll, A.; Sarkar, P.; Bosneaga, E.; Urban, J.J.; Song, J.; Balakshin, M.Y.; et al. Label-free in situ imaging of lignification in the cell wall of low lignin transgenic. Populus Trichcarpa. Planta 2009, 230, 589–597. [Google Scholar]
  16. Mangiante, G.; Alcouffe, P.; Burdin, B.; Gaborieau, M.; Zeno, E.; Petit-Conil, M.; Bernard, J.; Charlot, A.; Fleury, E. Green nondegrading approach to alkyne-functionalized cellulose fibers and biohybrids thereof: Synthesis and maping of the derivatization. Biomacromolecules 2013, 14, 254–263. [Google Scholar] [CrossRef]
  17. Song, Z.; Chen, Z.; Bian, X.; Zhou, L.; Ding, D.; Liang, H.; Zou, Y.; Wang, S.; Chen, L.; Yang, C.; et al. Alkyne-functionalized superstable graphitic nanoparticles for Raman imaging. J. Am. Chem. Soc. 2014, 136, 13558–13561. [Google Scholar] [CrossRef]
  18. Abidi, N.; Hequet, E.; Ethridge, D. Thermogravimetric analysis of cotton fibers: Relationships with maturity and finneness. J. Appl. Polym. Sci. 2007, 103, 3476–3482. [Google Scholar] [CrossRef]
  19. Kim, H.J.; Triplett, B.A. Cotton fiber growth in planta and in vitro. Models for plant cell wall elongation and cell wall biogenesis. Plant Physiol. 2001, 127, 1361–1366. [Google Scholar] [CrossRef]
  20. Adebajo, M.O.; Frost, R.L.; Kloprogge, J.T.; Kokot, S. Raman spectroscopic investigation of acetylation of raw cotton. Spectroc. Acta A Molec. Biomolec. Spectr. 2006, 64, 448–453. [Google Scholar] [CrossRef] [Green Version]
  21. Liu, Y.L.; Kokot, S.; Sambi, T.J. Vibrational spectroscopic investigation of Australian cotton cellulose fibres. Part 1. A Fourier transform Raman study. Analyst 1998, 123, 633–636. [Google Scholar] [CrossRef]
  22. Schenzel, K.; Fischer, S. NIR FT Raman spectroscopy—A rapid analytical tool for detecting the transformation of cellulose polymorphs. Cellulose 2001, 8, 49–57. [Google Scholar] [CrossRef]
  23. Hu, X.-P.; Hsieh, Y.-L. Crystalline structure of developing cotton fibers. J. Polym. Sci. B Polym. Phys. 1996, 34, 1451–1459. [Google Scholar] [CrossRef]

