Electrochemical Properties of Niobium Coating for Biomedical Application

School of Mechanical & Electrical Engineering, Wuhan Institute of Technology, 206 Guanggu 1st Road, Wuhan 430205, China
*
Author to whom correspondence should be addressed.
Coatings 2019, 9(9), 546; https://doi.org/10.3390/coatings9090546
Submission received: 26 July 2019
/
Revised: 17 August 2019
/
Accepted: 21 August 2019
/
Published: 26 August 2019
Abstract
:The preparation of the Nb coating was performed on the bare Ti–6Al–4V alloy using the double glow discharge plasma technique. It was characterized that the Nb coating exhibited a face centered cubic (fcc) crystal structure and a pronounced (200) preferred orientation. The SEM micrograph of the cross section for the coating displayed dense microstructure with a thickness of approximately 18 µm. The critical load (Lc) of the coating was determined to be about 83.5 N by the scratch tests. The electrochemical corrosion resistance of the coating was examined in Ringer’s solution at 37 °C by a series of electrochemical techniques, including open-circuit potential (OCP), potentiodynamic polarization, electrochemical impedance spectroscopy (EIS), and a Mott–Schottky analysis. As the result of the potentiodynamic polarization, the Nb coating possessed a more positive corrosion potential and lower corrosion current density than the Ti–6Al–4V substrate. EIS fitting date showed that the Nb coating always possessed a higher value of impedance and lower effective capacitance than those of the substrate during the five days of immersion testing. The main component of the passive film developed on the Nb coating was Nb2O5, confirmed by an X-ray photoelectron spectroscopy (XPS) analysis. A Mott–Schottky analysis demonstrated typical n-type semiconductor characteristics of the Nb coating, and both the donor density and flat band potential of the coating were lower than those of the substrate at all the given formation potential. These investigations demonstrate that the Nb coating can significantly improve the corrosion protection of uncoated Ti–6Al–4V and is thus a promising coating for the surface protection of bioimplants.
1. Introduction
Due to the excellent corrosion resistance and biocompatibility of the Ti–6Al–4V alloy, it has been diffusely and successfully used as an implant material in orthopedic and dental applications [1,2,3,4]. However, this alloy is prone to localized corrosion in the human body fluids containing chloride ions, typically with a concentration of about 1 wt.% NaCl [5]. Furthermore, the corrosion induced release of V and Al ions into tissues around the implants could results in a significant inflammatory and toxic reactions which are harmful to the human body in the long term [6]. It is well known that niobium is chemically very stable even under the most hostile environments. As such, more attention has been focused on the application of niobium as implant material in the body due to its outstanding biocompatibility [7,8]. However, niobium is mechanically weak in the pure form. Consequently, depositing an Nb coating on a suitable substrate is an alternative method which combines the high strength of a substrate with the superior corrosion resistance and outstanding biocompatibility of the Nb coating to fulfil the function for which was initially designed.
Regarding the fabrication of Nb coatings, many deposition methods have been proposed, including electrodeposition [9], physical vapor deposition (PVD) [10,11], ion-beam assisted deposition (IBAD) [12], and high energy micro arc alloying technique (HEMAA) [13]. Unfortunately, Nb coatings deposited by electrodeposition, PVD and IBAD are only a few microns thick, which is too thin to provide effective surface protection during the long-term service of implants. Some studies had proved that the corrosion resistance generally improves with the thickness of the coating increasing [14,15]. Though HEMAA was applied to make dense and thicker Nb coatings of approximately 20 µm, the adhesive strength between the coatings and substrate was poor. This impairs the durability of Nb as a protective coating when exposed in the acid solution for a long time [13]. As a result, only a few studies have thus far been conducted on the application of niobium coatings despite their outstanding performance.
The outstanding corrosion resistance of niobium is commonly considered to stem from a stable niobium oxide passive film developed on the surface. Therefore, its corrosion behavior mainly depends on the nature and stability of the oxide film [16,17]. Studies have shown that the passive film developed on niobium surface is an n-type semiconductor [18,19]. It is of great significance to investigate the semiconductor properties of the passive film to further understand niobium corrosion behavior. For instance, Wang et al. [20] investigated the influence of crystallographic orientation on semiconductor properties of the passive film on Nb using a Mott–Schottky analysis. The results showed that the passive film developed on the (100) crystal face exhibited the lowest corrosion rate and lowest donor density. Li et al. [19] investigated the transport property of the point defect in the film formed on Nb in an HCl solution applying a point defect model (PDM). However, many previous studies mainly focused on the corrosion resistance of the niobium bulk in acid solutions [21,22,23]. Prakash C et al. [24] prepared a TiO2–TiC–NbO–NbC coating on a Ti–6Al–4V substrate by electric discharge coating (EDC) and electric discharge technique to improve the mechanical properties, the wear resistance, corrosion resistance and bioactivity of the Ti–6Al–4V substrate. Up to now, there have been few reports on the corrosion behavior of niobium coatings on the Ti–6Al–4V alloy in simulated body fluids.
In this study, the double cathode glow discharge plasma technique was used to prepare a thick and adhesive niobium coating. The phase composition and microstructure of the cross-section for the coating was characterized by X-ray diffraction (XRD) and scanning electron microscopy (SEM), respectively. The corrosion performances of the coating and the bare Ti–6Al–4V were investigated by an array of complementary electrochemical techniques in Ringer’s solution at 37 °C, which was employed to simulate the typical environment of human body fluids, with the aim of evaluating its suitability as a candidate coating for implants.
2. Experiment
2.1. Substrate Preparation
The Ti–6A1–4V alloy was sectioned to disc-shaped substrates with the size of Φ 35 × 3 mm, the chemical composition of which (in wt.%) is given as Al, 6.04; V, 4.03; Fe, 0.3; C, 0.1; N, 0.05; O, 0.15 and Ti, the balance. For obtaining a smooth surface, the substrates were polished with 50#, 20#, and 5# metallographic sandpaper, followed by a polishing of 2000 and 5000 grit waterproof silicon carbide papers before the preparation of the coatings. Finally, the specimens were rinsed with distilled water, wiped with medical cotton balls and alcohol, and dried.
2.2. Coating Preparation
The deposition of the niobium coating was conducted on the polished substrate alloy using a double cathode glow discharge apparatus. A 99.99% Nb disk (Φ 100 × 5 mm) was placed at one cathode as the target, and the substrate was placed at the other cathode. The pressure in the chamber of the apparatus was emptied to 3 × 10⁻³ Pa before preparation, and the surfaces of both the target and the substrates were carried out by Ar ion bombardment at −700 V for 15 min to get rid of contaminants on the substrate for further clean. Generally, reducing the distance between the target and the substrate and extending the treatment time can increase the thickness of the coating. However, the coating has a higher probability of defects such as cracks or holes with the thickness of the coating increasing. The depositing parameters were determined by the working temperature ranges of the target materials and the substrate materials. Finally the depositing parameters for the coating were as follows: Deposition pressure, 35 Pa; target voltage, −900 V; substrate voltage, −350 V; substrate temperature, 640 °C; target/substrate distance, 10 mm; and treatment time, 3 h.
2.3. Materials Characterization
The phase composition of the coating was investigated by X-ray diffraction instrument (D8 ADVANCE and DAVINCI DESIGN Diffractometer, Bruker, Billerica, MA, USA) employing Cu Kα irradiation (λ = 0.154060 nm). The XRD test was conducted in 2θ range from 25° to 80° at a scan rate of 0.02° with a counting time of 1 s, and operating at 30 kV and 35 mA. Before observing the cross-sectional morphology of the coating, Kroll’s reagent (HF:HNO3:H2O = 4:10:86) was employed to etch it’s surface to uncover the interface between the coating and the Ti–6A1–4V substrate. Then the cross-sectional morphology of the coating was characterized by a field emission scanning electron microscope (FESEM; ZEISS GeminiSEM 450, Oberkochen, Germany) equipped with an energy-dispersive X-ray (EDS) analyzer employed to investigate the chemical composition distribution in the cross-section of the coating. Furthermore, the detailed chemical composition of the passive film formed on the coating was analyzed by X-ray photoelectron spectroscopy (XPS) (GENESIS, Sanford, FL, USA).
2.4. Scratch Test
The adhesive strength at the position of coating/substrate interface was evaluated using the scratch tester (WS-2005, Zhongkekaihua, Lanzhou, China), equipped with a Rockwell C diamond stylus with a spherical tip of 200 μm in radius. During the scratch test, a linearly increased normal load was applied at a speed of 100 N/min from 0 to 150 N, and the scratch speed was maintained at 4 mm/min. The critical load (Lc) was determined by the acoustic signals from acoustic emission (AE) detector, indicating the the coating was damaged. The value of the Lc was generally adopted to characterize the adhesive strength of coating/substrate interface. After the scratch test, the scratch morphology was observed by the FESEM.
2.5. Electrochemical Characterization
An electrochemical performance test was conducted on an electrochemical work station (CHI660E, Chenhua, Shanghai, China) equipped with a standard three-electrodes system in Ringer’s solution at 37 °C. The working electrode was the test specimen and it was reserved 1 cm2 for experimental area. Pt served as the auxiliary electrode. And the saturated calomel electrode (SCE) served as the reference electrode. The working electrode was depolarized at −1.0 VSCE for 10 min before a series of the electrochemical test to dissolve the passive films spontaneously developed on the test specimens. Then, an open-circuit potential (OCP) test was employed to ensure that the following experiments were performed at a stable potential. The potentiodynamic polarizations were started from −250 mVOCP to the final potential of 1200 mVSCE by a constant sweep rate of 40 mV per minute. Electrochemical impedance spectroscopy (EIS) measurements were carried out at EOCP with a frequency range from 100 kHz to 10 mHz. Before the Mott–Schottky analysis, potentiostatically polarization was conducted at different potentials (0.4, 0.6, 0.8, and 1.0 V) on the two specimens in Ringer’s solution for 1 h to form a stable passive oxide film. The Mott–Schottky analysis was performed by capacitance measurement as a function of the applied potential from a negative potential to the formation potentials (Ef), and the measurement parameter was a potential step of 50 mV at a frequency of 1 kHz.
3. Results and Discussion
3.1. Characterization of Niobium Coating
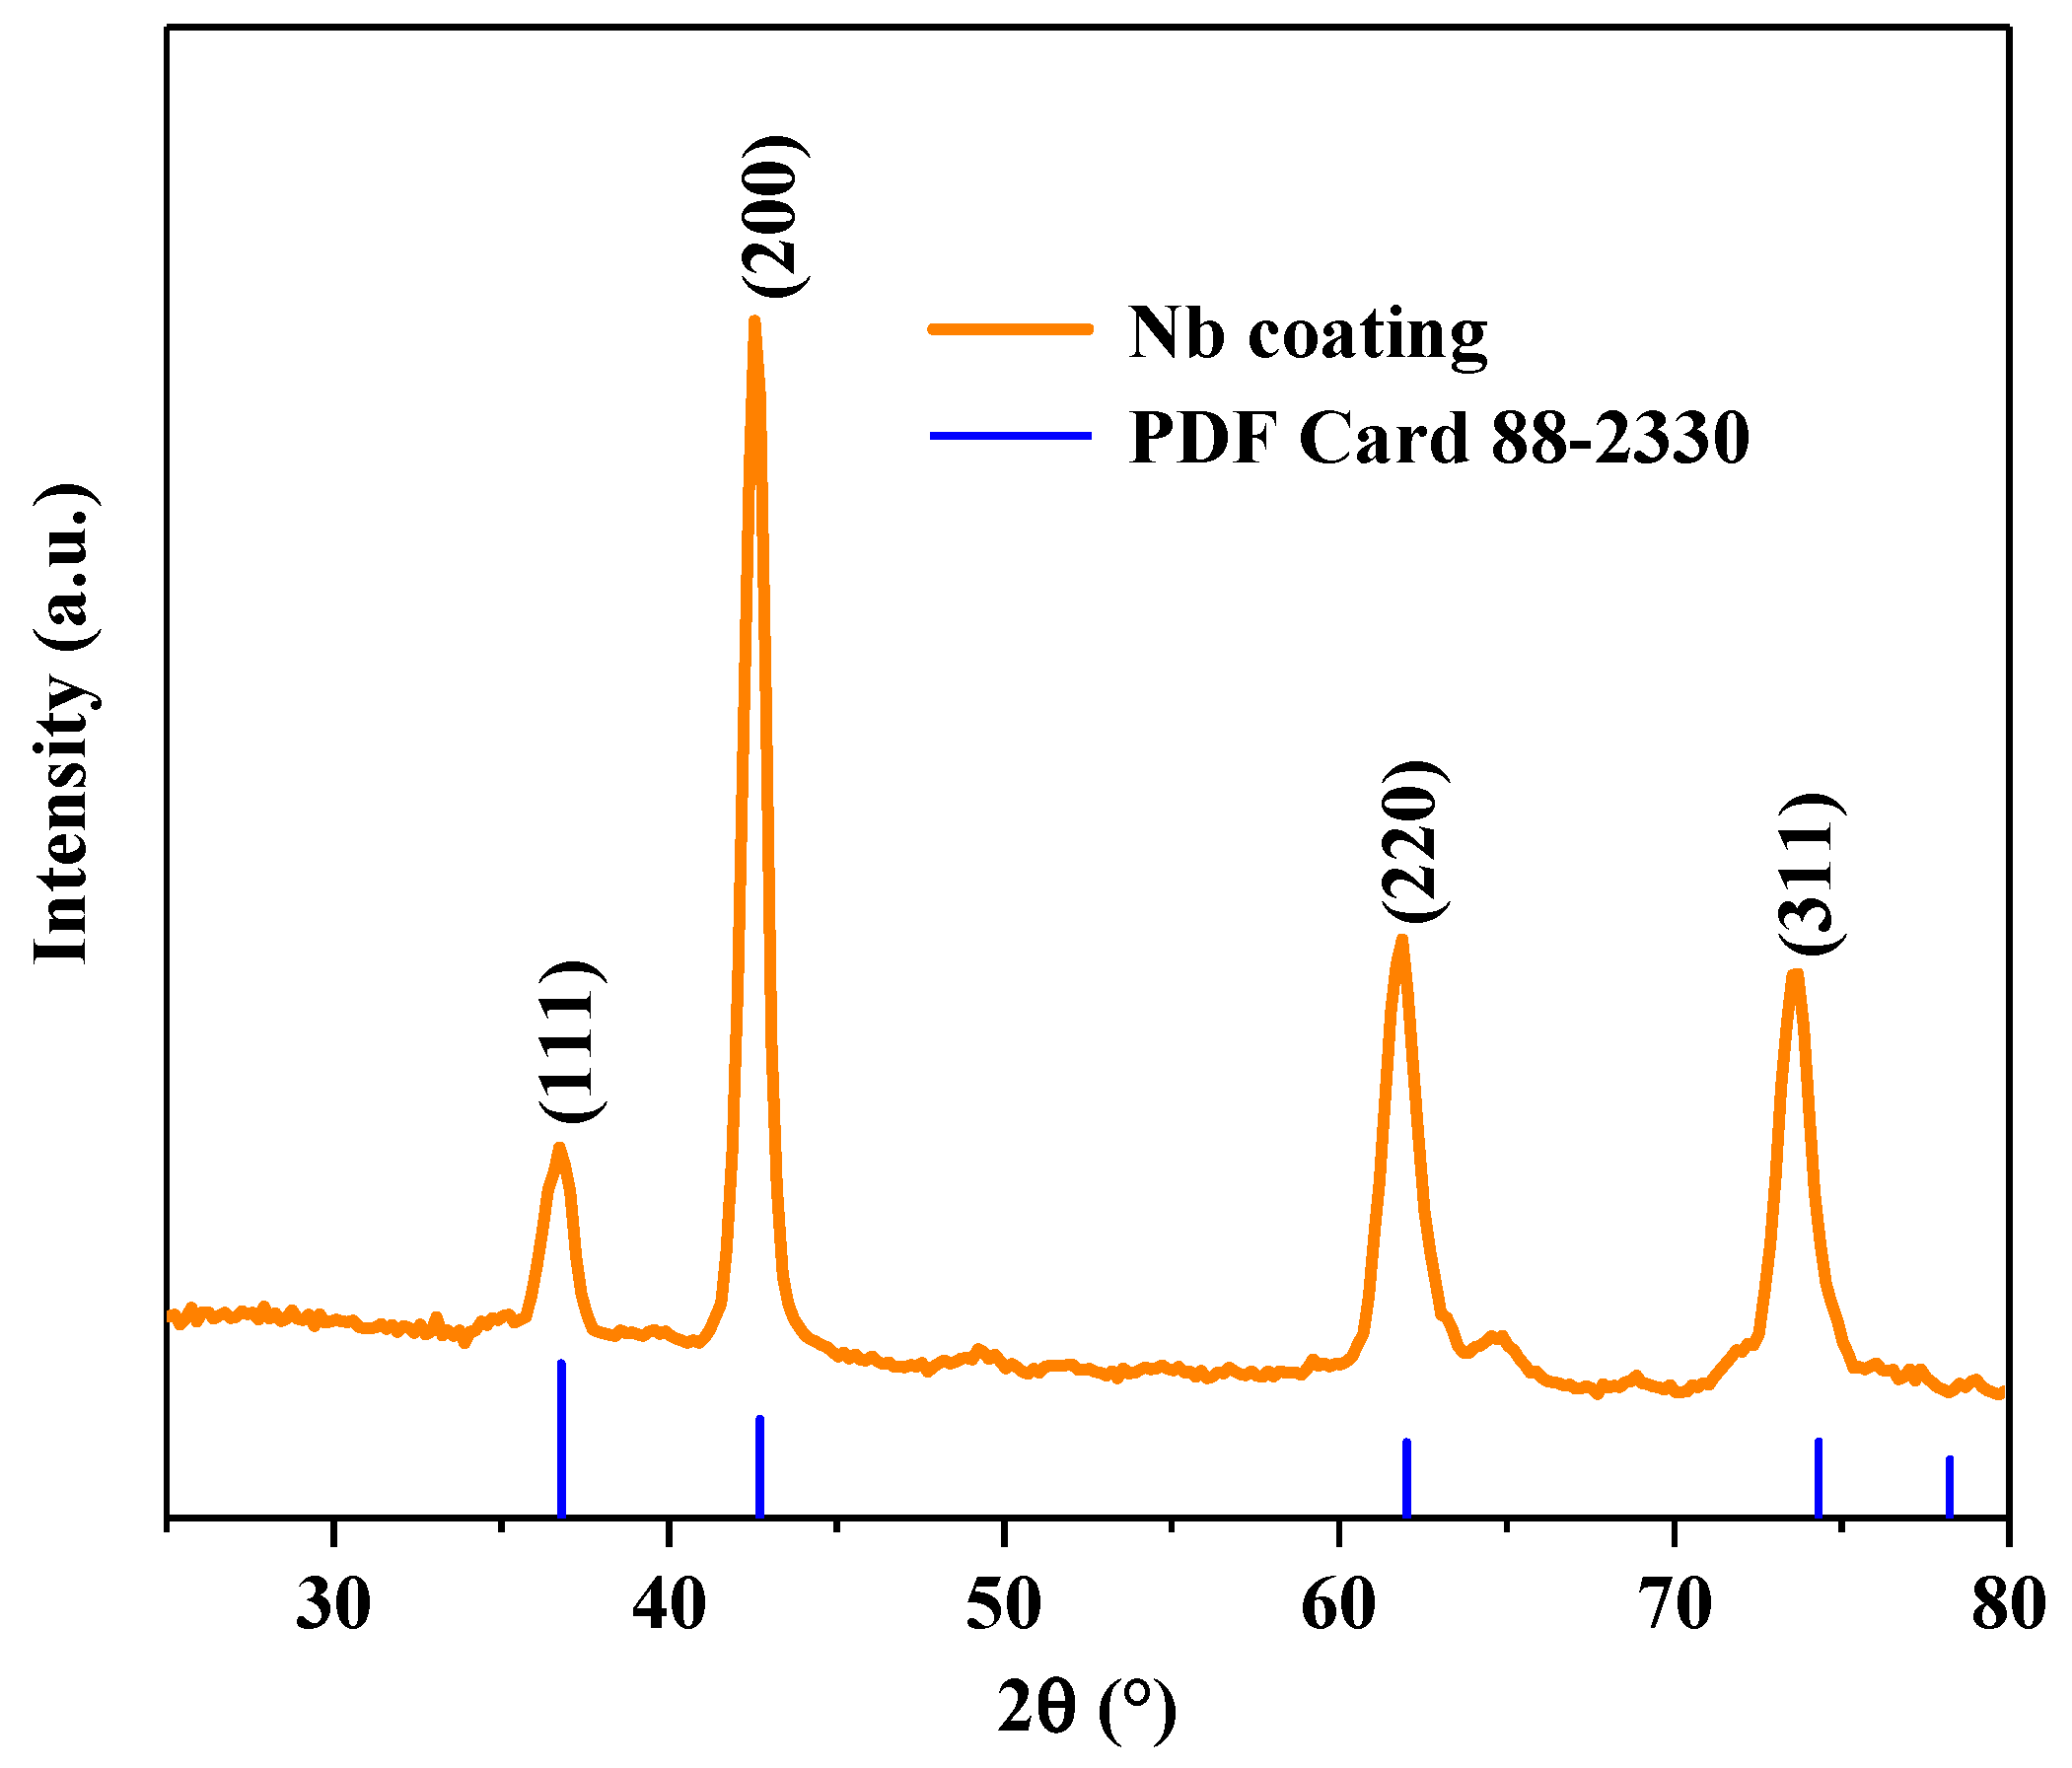
The typical XRD pattern of the Nb coating prepared on the bare Ti–6Al–4V is displayed in Figure 1. It is evident that all the diffraction peaks located at 36.8°, 42.6°, 61.9° and 73.8° were consistent with the (111), (200), (220) and (311) planes of the face centered cubic (fcc) Nb phase (PDF Card 88-2300). The Nb coating showed a larger diffraction peak intensity of the (200) plane than that of the standard powder diffraction file data for Nb, suggesting that the coating possessed an obvious (200) preferred orientation. The texture coefficient (TChkl) was generally employed to evaluate the preferred orientation of the coating [25]. The TChkl values of the Nb coating calculated from the intensity values are shown in Table 1. It is evident that the TChkl value of (200) plane, 2.58, was greater than 1, further indicating a strong (200) texture for the Nb coating. The high deposition temperature of the double glow discharge plasma technique provided energy to the deposited atoms for preferred orientation to a particular crystal plane, which was positive to the preparation of compact coatings. It was also helpful for the coatings to obtain better electrochemical behavior.
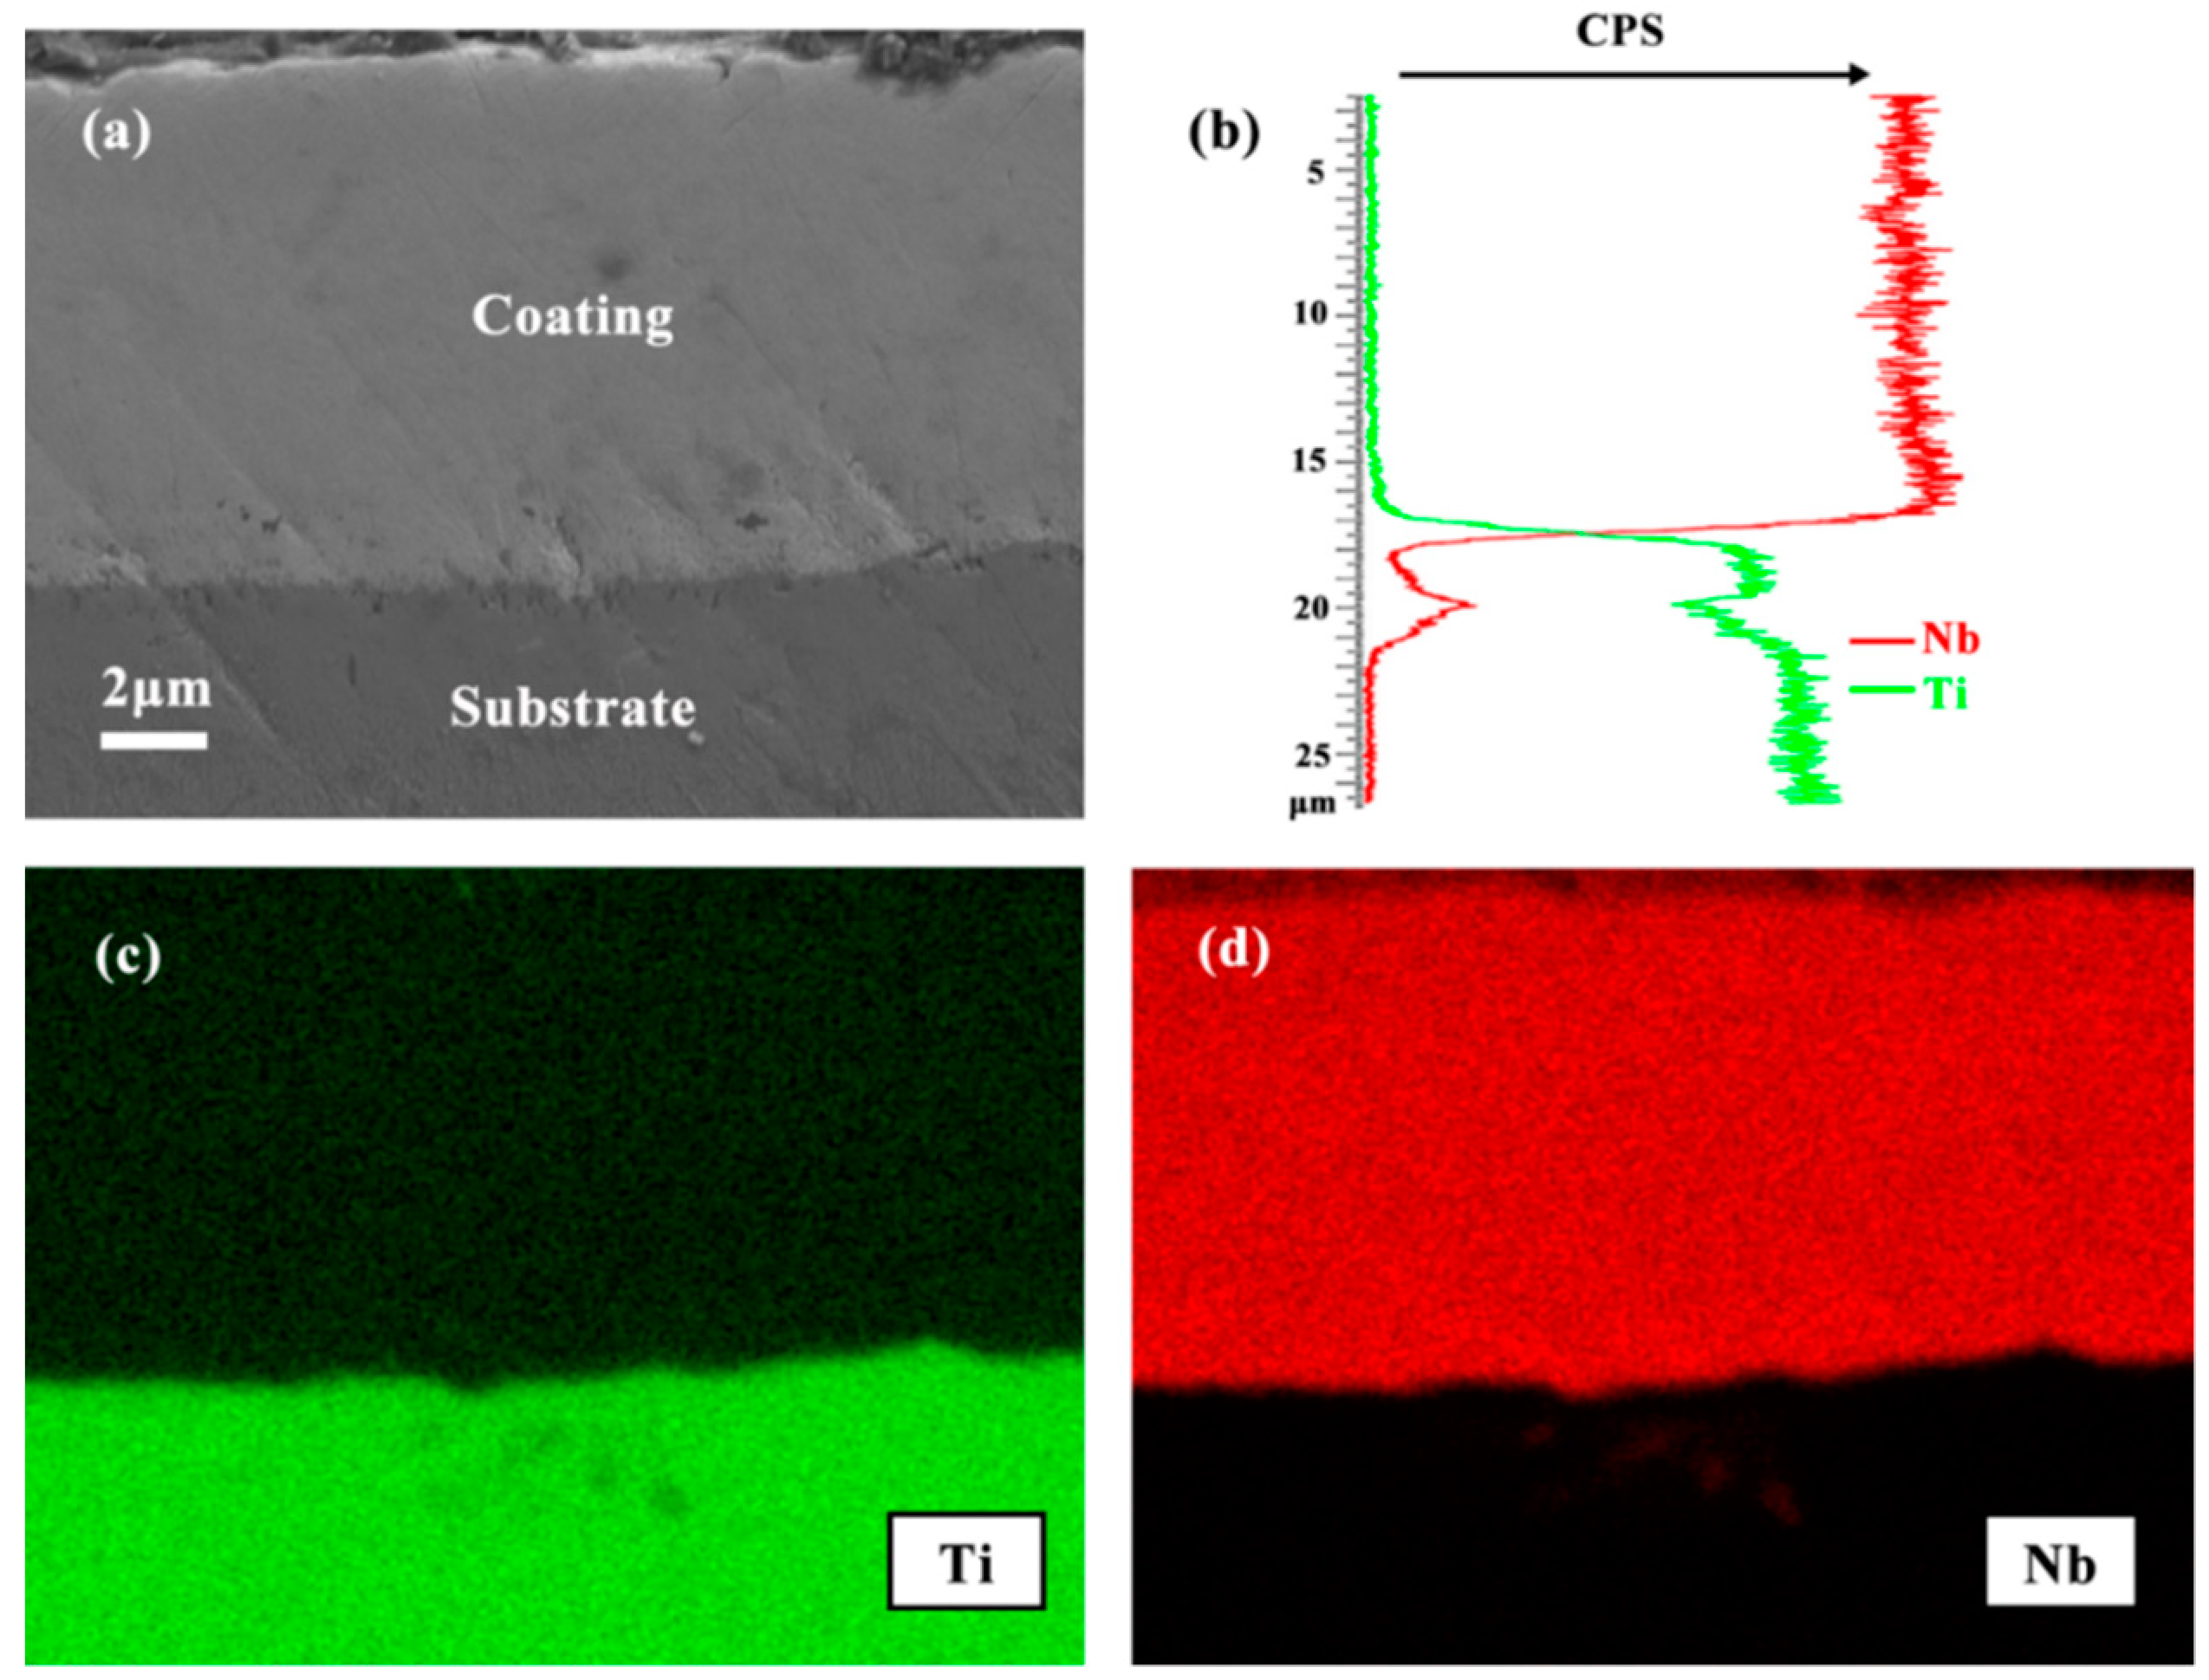
Figure 2 exhibits the SEM micrograph of the cross-section for the Nb coating, the EDS line-scans obtained from the surface of the coating to the substrate, and the corresponding EDS elemental maps for Ti and Nb of the deposited Nb coating. As observed in Figure 2a, the Nb coating with a thickness of approximately 18 µm exhibited a dense and compact microstructure almost free from pinholes and cracks. EDS line-scans (Figure 2b) and elemental maps analysis (Figure 2d) revealed that the Nb element was homogeneously distributed across the entire coating. Moreover, Figure 2b shows that Nb and Ti appeared graded distribution at coating/substrate interface, and the signal of Nb appeared in the position of the substrate at a thickness of about 20 µm. This was attributed to the characteristics of the double glow discharge plasma technique that target atoms will permeate slightly into the substrate at the high deposition temperature, suggesting that the metallurgical bonding was achieved between the coating and substrate, which is helpful to improve the adhesive strength at the interface between the Nb coating and the Ti–6A1–4V substrate.
The scratch test was carried out to assess the adhesive strength at the coating/substrate interface. Figure 3 shows an acoustic emission intensity curve with an increasing load. Observed in Figure 3, there is no acoustic emission signal occurred at the beginning of the test, while acoustic emission peaks occurred and fluctuated violently when the normal load was more than 83.5 N. The inset SEM image in Figure 3 shows the corresponding scratch scar morphology, which reveals that when the load exceeded 83.5 N, some chips were separated from the substrate on one side of the scratch, implying coating failure (delamination) [26]. Therefore, the critical load the niobium coating can withstand is about 83.5 N, which is above 30 N, generally accepted to be adequate for sliding contact applications [27,28].
3.2. Open Circuit Potential Measurement
The relationship between OCP and time is commonly adopted to evaluate the corrosion resistance of test materials. Generally, a more positive potential of the EOCP implies a better corrosion resistance of test material [29]. Figure 4 displays the change curves of the OCP with time for the Nb coating and the Ti–6Al–4V substrate in Ringer’s solution at 37 °C. Observed in the curves, the EOCP of both samples reached a platform after a period of time, indicating that passive films of two specimens were developed spontaneously. When the immersion time was approximately 300 s, the EOCP of the Nb coating nearly reached a stable value, −120 mVSCE, with a positive shift amplitude of 45 mV. However, it needed a longer time, about 1600 s, for the substrate to reach a stable value, −248 mVSCE, with a positive shift amplitude of 100 mV. In addition, the Nb coating had a more positive EOCP than that of the substrate during the entire immersion time. Therefore, the passive film of the Nb coating was formed faster and more stable on the same experimental condition than that of the substrate.
3.3. Potentiodynamic Polarization Measurement
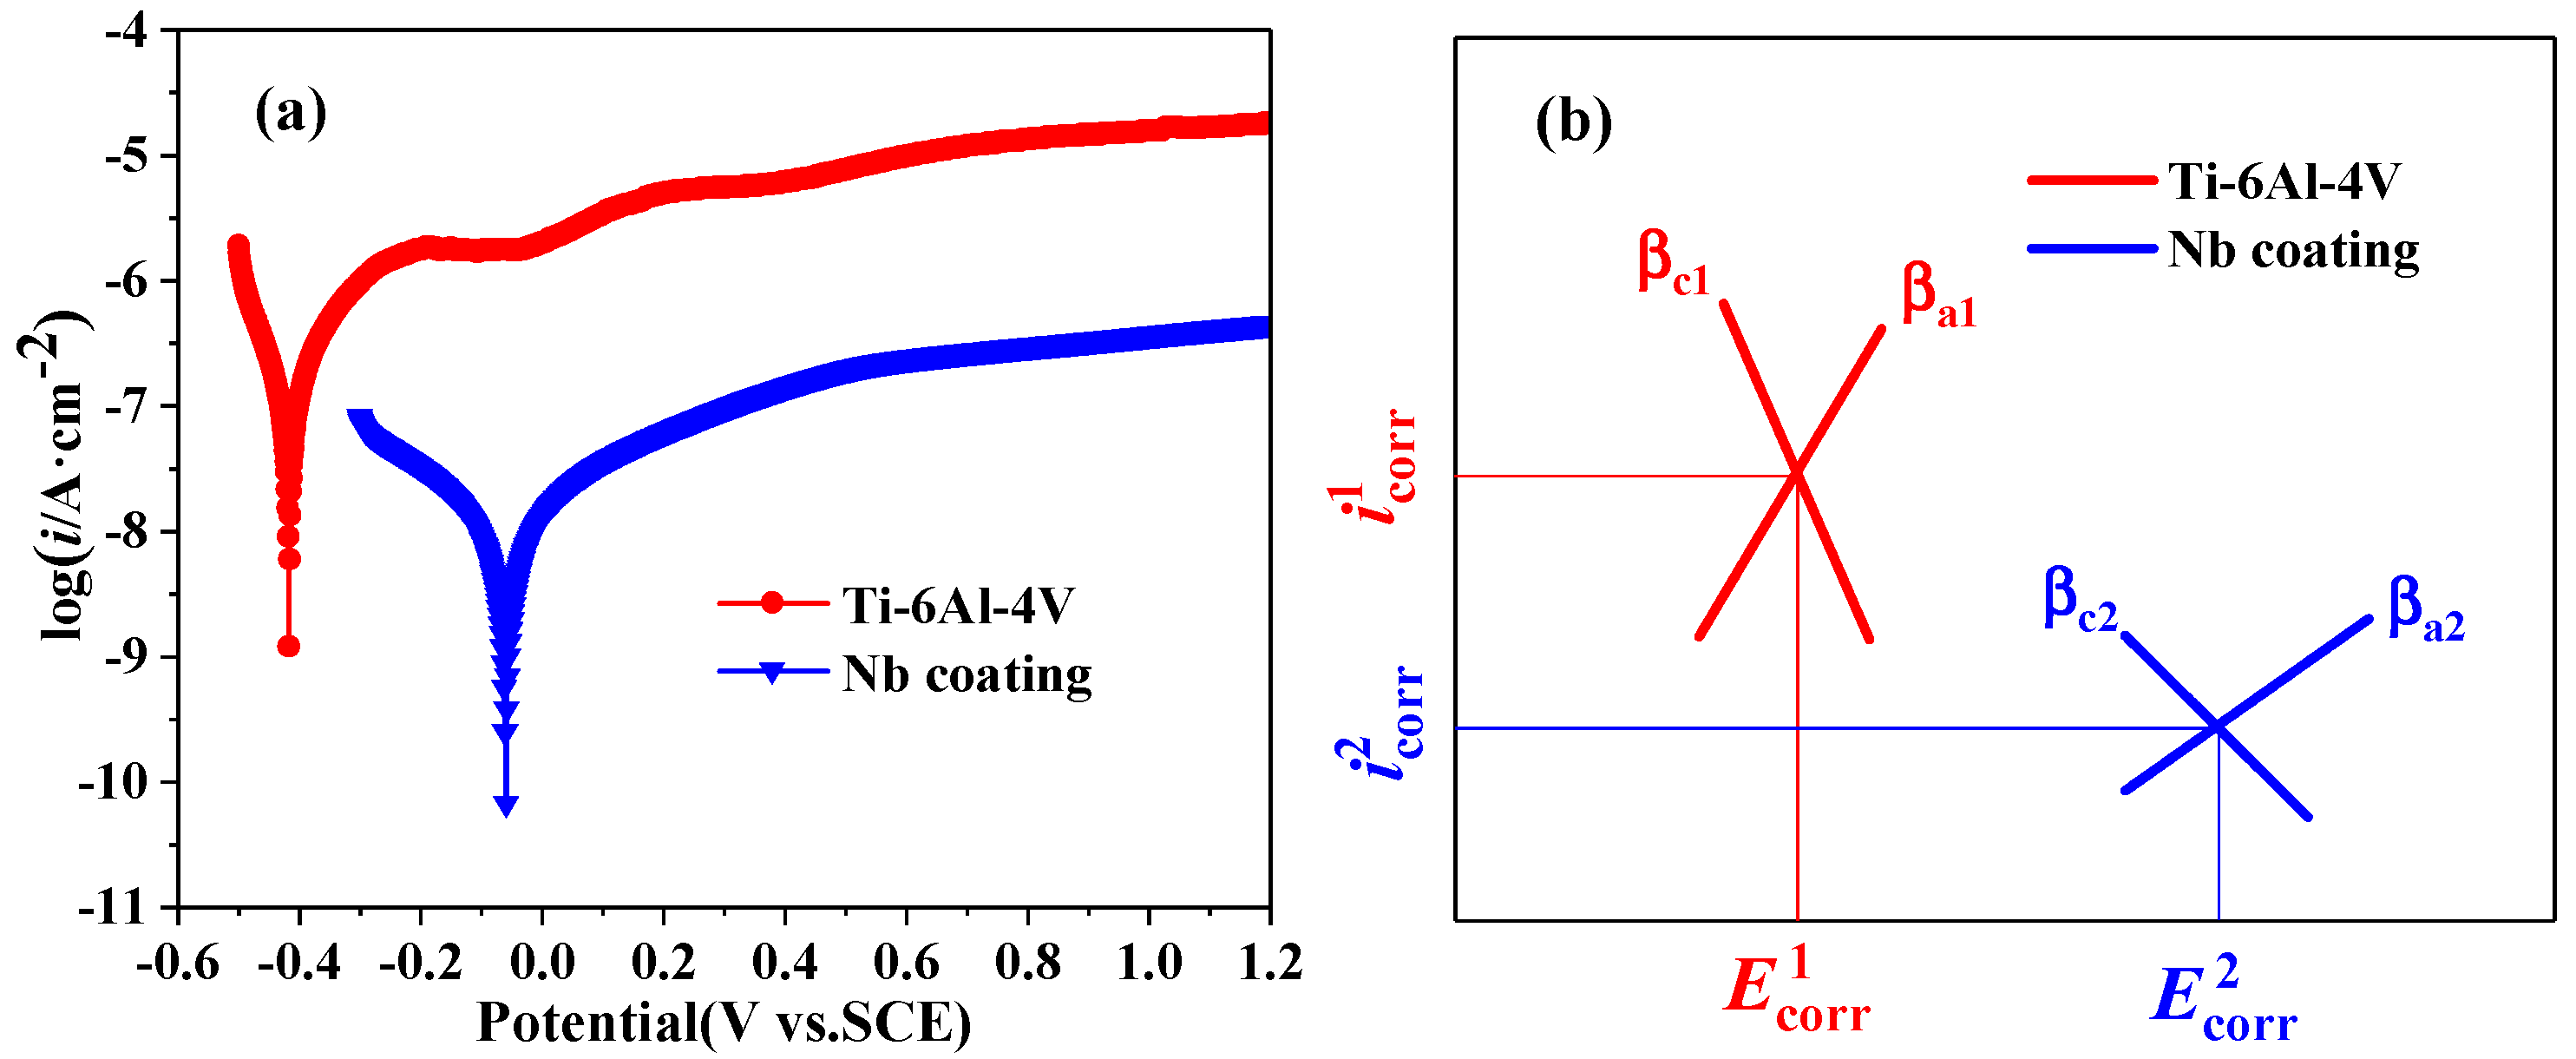
As shown in Figure 5a, potentiodynamic polarization measurements were performed for the Nb coating and the Ti–6Al–4V substrate in Ringer’s solution at 37 °C. The polarization parameters, i.e., corrosion potential (Ecorr), corrosion current density (icorr), polarization resistance (Rp), protection efficiency (Pe), and anodic (βa) and cathodic (βc) Tafel slopes using Tafel analysis are presented in Table 2. As shown in Figure 5a, the polarization curves for the two specimens exhibit similar shapes, a wide passivation range until the corrosion potential reached 1.2 V changed from the “Tafel region” [30], indicating both of the samples were able to form passive film spontaneously in Ringer’s solution at Ecorr. It is noted in Table 2 that the Ecorr of the Nb coating was approximately 360 mV higher than that of uncoated substrate. Furthermore, the icorr of the coating was one order of magnitude lower than that of the bare Ti–6Al–4V. This indicates that the Nb coating exhibits a better corrosion behavior than the substrate [31,32]. The polarization resistance values of both samples were calculated according to the Equation (1) [33] and the parameters in Table 2.
where βa, βc, and icorr, are the anodic Tafel slope, cathodic Tafel slope, and corrosion current density, respectively. The Pe of the Nb coating is defined by the Equation (2) [34]:
where icorr and i0corr are the corrosion current densities of the Nb coating and the Ti–6Al–4V substrate, respectively. The protective efficiency of the Nb coating was approximately 92.57%, which confirmed the excellent performance as a protective layer for the Ti–6Al–4V alloy.
In addition, on the basis of the anodic and cathodic Tafel slopes presented in Table 2, the cathodic and anodic branches of the Nb coating and the Ti–6Al–4V substrate shifted according to the order of βc1→βc2 and βa1→βa2, respectively, as shown in Figure 5b. Observed in Table 2 and Figure 5, compared to uncoated substrate, the Nb coating possessed a larger RP, and the Ecorr shifted toward a more positive direction; however, the current density for anodic branch of the coating reached a lower level, implying the Nb coating had a stronger ability to reduce anode electrochemical reaction, which ultimately resulted in a decrease of the corrosion rate. These results demonstrate the Nb coating can act as a protective layer to prevent the bare substrate from corrosion attack.
It is worth noting in the potentiodynamic polarization plot that the Ecorr for the two specimens was different from the value of their EOCP, as shown in the OCP versus time curves (Figure 4). The Ecorr of the Ti–6Al–4V substrate shifted toward a more negative potential compared to open circuit potential, while the Nb coating showed a different performance, with the Ecorr of the coating being more positive than the corresponding EOCP. This may be due to different experiment conditions adopted in the two electrochemical measurement methods. Before the potentiodynamic polarization test, cathodical polarization were conducted on both samples for 10 min at the same experimental condition, which aimed to remove the passive film spontaneously developed on the surfaces of the samples. The time and potential used by depolarization were not sufficient to remove the passive film of the Nb coating probably because an insoluble passive film was generated on the coating, which can improve the corrosion resistance effectively.
3.4. Electrochemical Impedance Spectroscopy
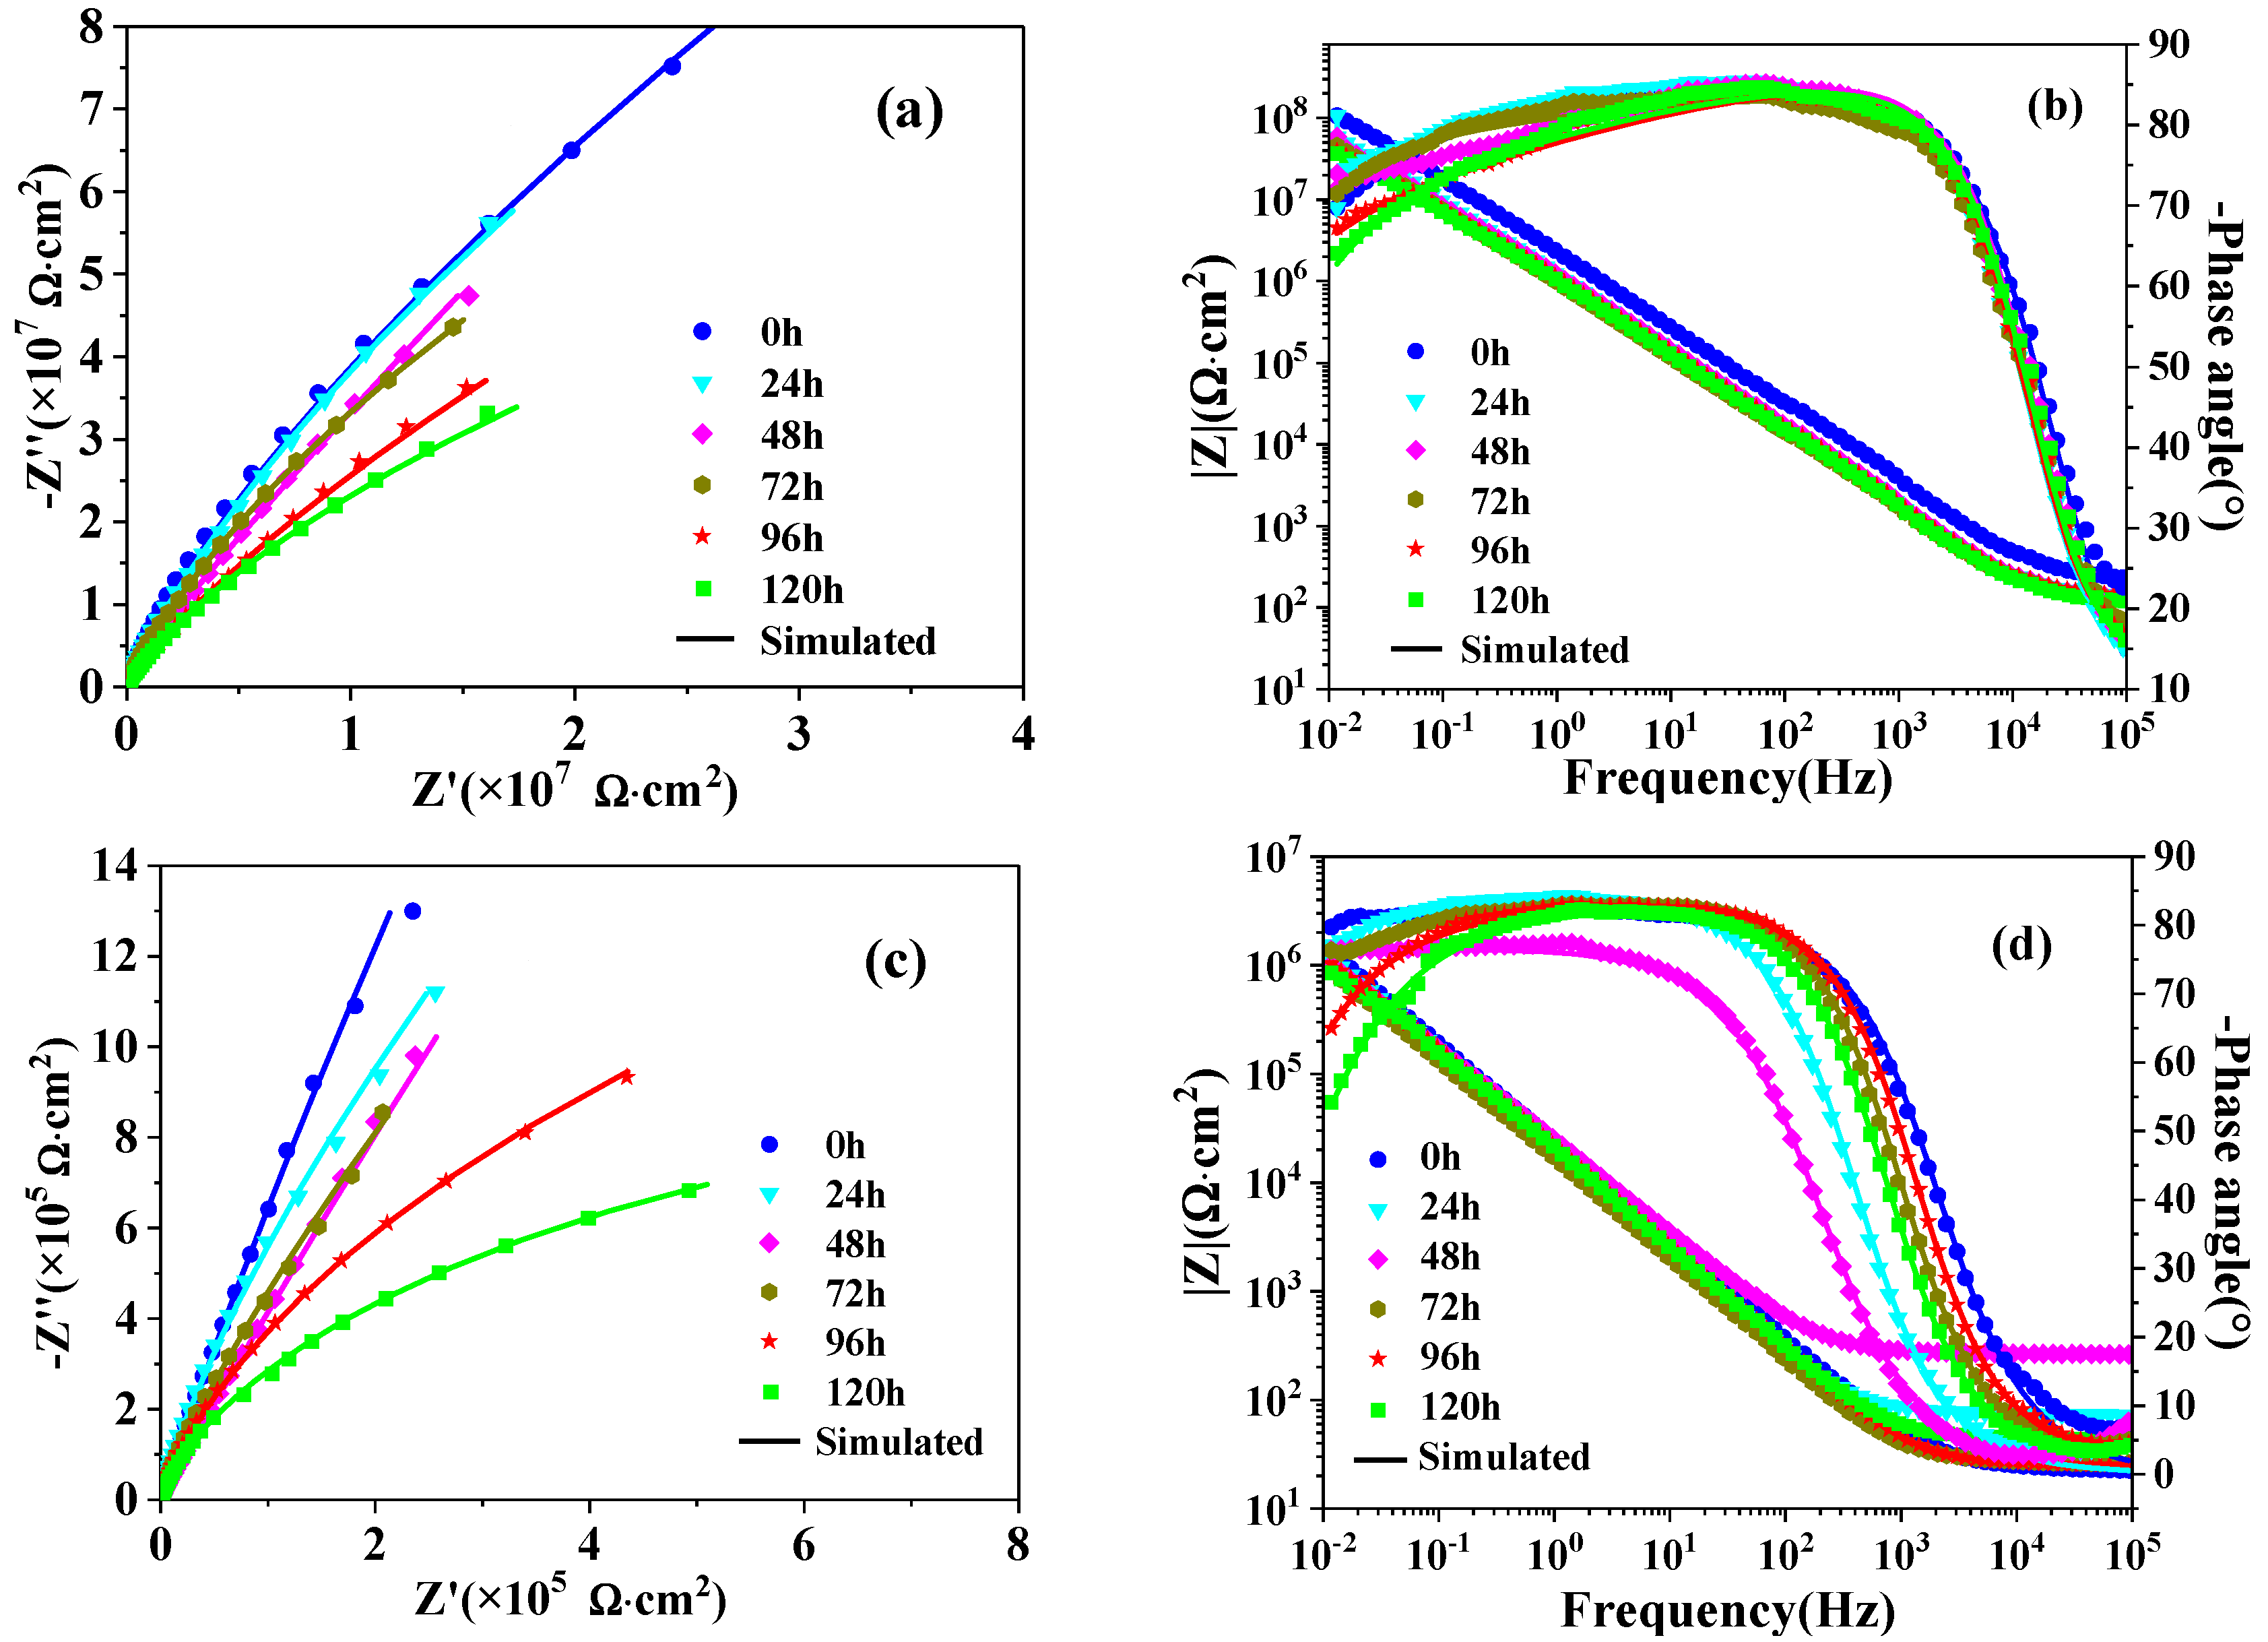
EIS is a non-destructive, high-sensitivity detection technology that is generally employed to research corrosion behavior of the coatings or alloys working in corrosive solution environments [35]. Generally, human implants serve in body fluids containing chloride ions for a long period of time. Therefore, the corrosion resistance of the implant material is crucial after long period immersion [36]. In this research, EIS was used to evaluate the electrochemical behavior of the Nb coating and the Ti–6Al–4V substrate immersed in the same experimental condition for five days. The Nyquist and Bode plots of two specimens recorded from five days of immersion time at their respective EOCP are presented in Figure 6. The Nyquist plots of two samples possess similar behavior that all the curves exhibit a single capacitive loop, indicating a typical capacitive response of the passive film [37,38,39]. Observed in the Nyquist plot for two specimens, the diameter of capacitive loop for the Nb coating was much larger than that of the substrate at all immersion times, demonstrating a better electrochemical performance of the coating in Ringer’s solution. All Bode plots of two specimens showed similar shapes throughout the immersion time, demonstrating that the corrosion mechanism barely changed with the immersion time. In the high frequency region, impedance magnitude |Z| was independent with frequency, and the plots show a phase angle of about −20° for the Nb coating and −5° for the substrate, indicating that the solution resistance dominates impedance of the samples in the high frequency range. In the midband region, the impedance magnitude of both specimens presented a linear relationship with frequency of a slope of about −1. In addition, the phase plateaued at about −80°, which is typical response of capacitive behavior [40]. It is noticeable that the phase angle of the coating was stable with the immersion time, but the substrate obviously decreased. Therefore, the electrochemical stability of the Nb coating was better than that of the substrate after five days of immersion time. In the low frequency region, the |Z|f→0 in the Bode plots is always used to evaluate the corrosion rate of test specimens. Obviously, the |Z|f→0 of the Nb coating (108) was two orders of magnitude higher than that of the substrate (106) at all the given times, indicating the protective capability of passive films developed on the Nb coating was better than that of the substrate throughout the immersion time.
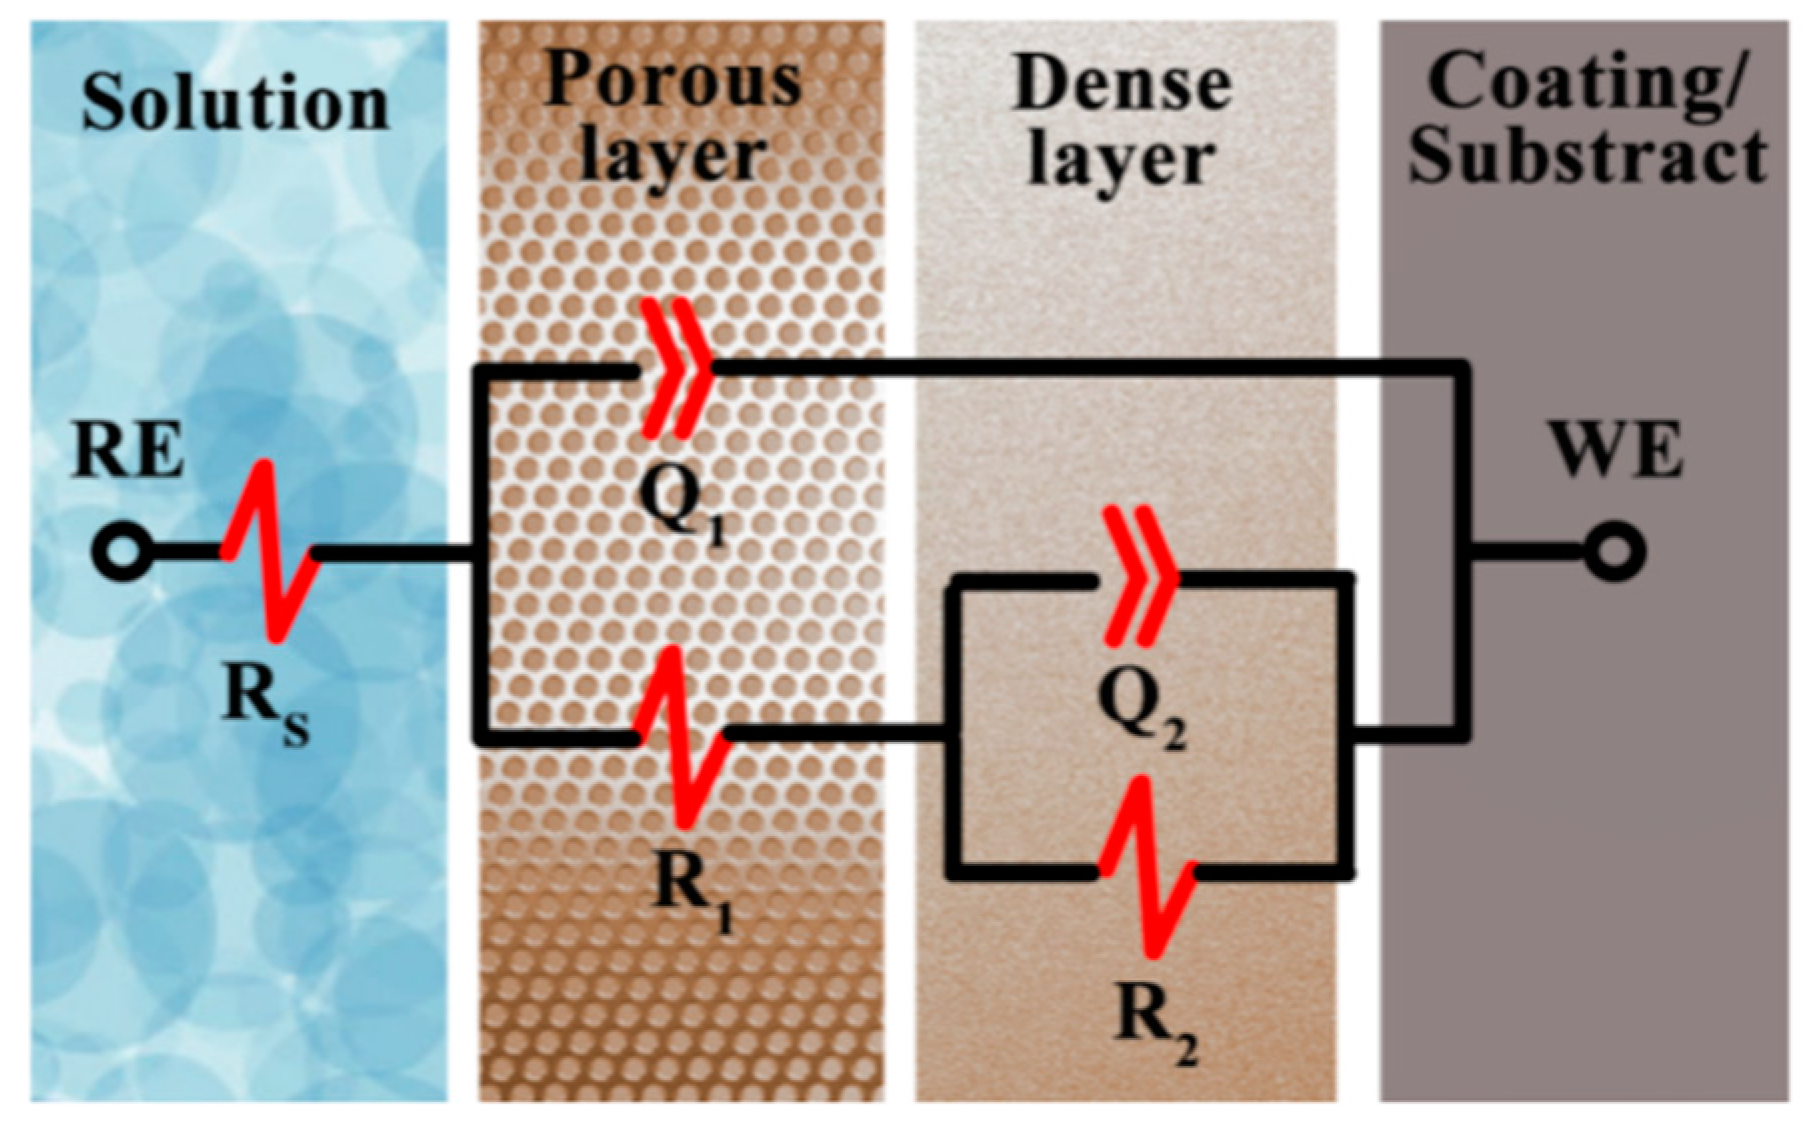
The electric equivalent circuit (EEC) was applied to analyze quantitatively the EIS data to explore the electrochemical processes between the samples and Ringer’s solution. Observed by the Nyquist and Bode plots presented in Figure 6, all the impedance data fit well with the applied electric equivalent circuit presented in Figure 7. Furthermore, this equivalent circuit model had been employed in previous research to fit the impedance spectra of the Nb coating in an acidic environment [13]. The passive film developed on the specimens is considered as defective layer, including a porous outer layer and a dense barrier layer. In the proposed equivalent circuit (Rs(Q1(R1(Q2R2)))), Rs is the solution resistance, and R1, Q1, R2 and Q2 are the resistance and capacitance of the outer layer and the barrier layer, respectively. The chi-square (χ2) from the fitting results are on the order of 1 × 10⁻⁴, indicating that there is a good fitting with this equivalent circuit. The impedance of constant phase element (CPE) is usually described as:
where Q is the frequency independent parameter, j is the imaginary unit, and the ω is the angular frequency. The factor n, decided by surface roughness and porosity, is a parameter that always lies in the range of 0.5–1. The passive oxide film is nearer to ideal capacitance while the n is closer to 1.
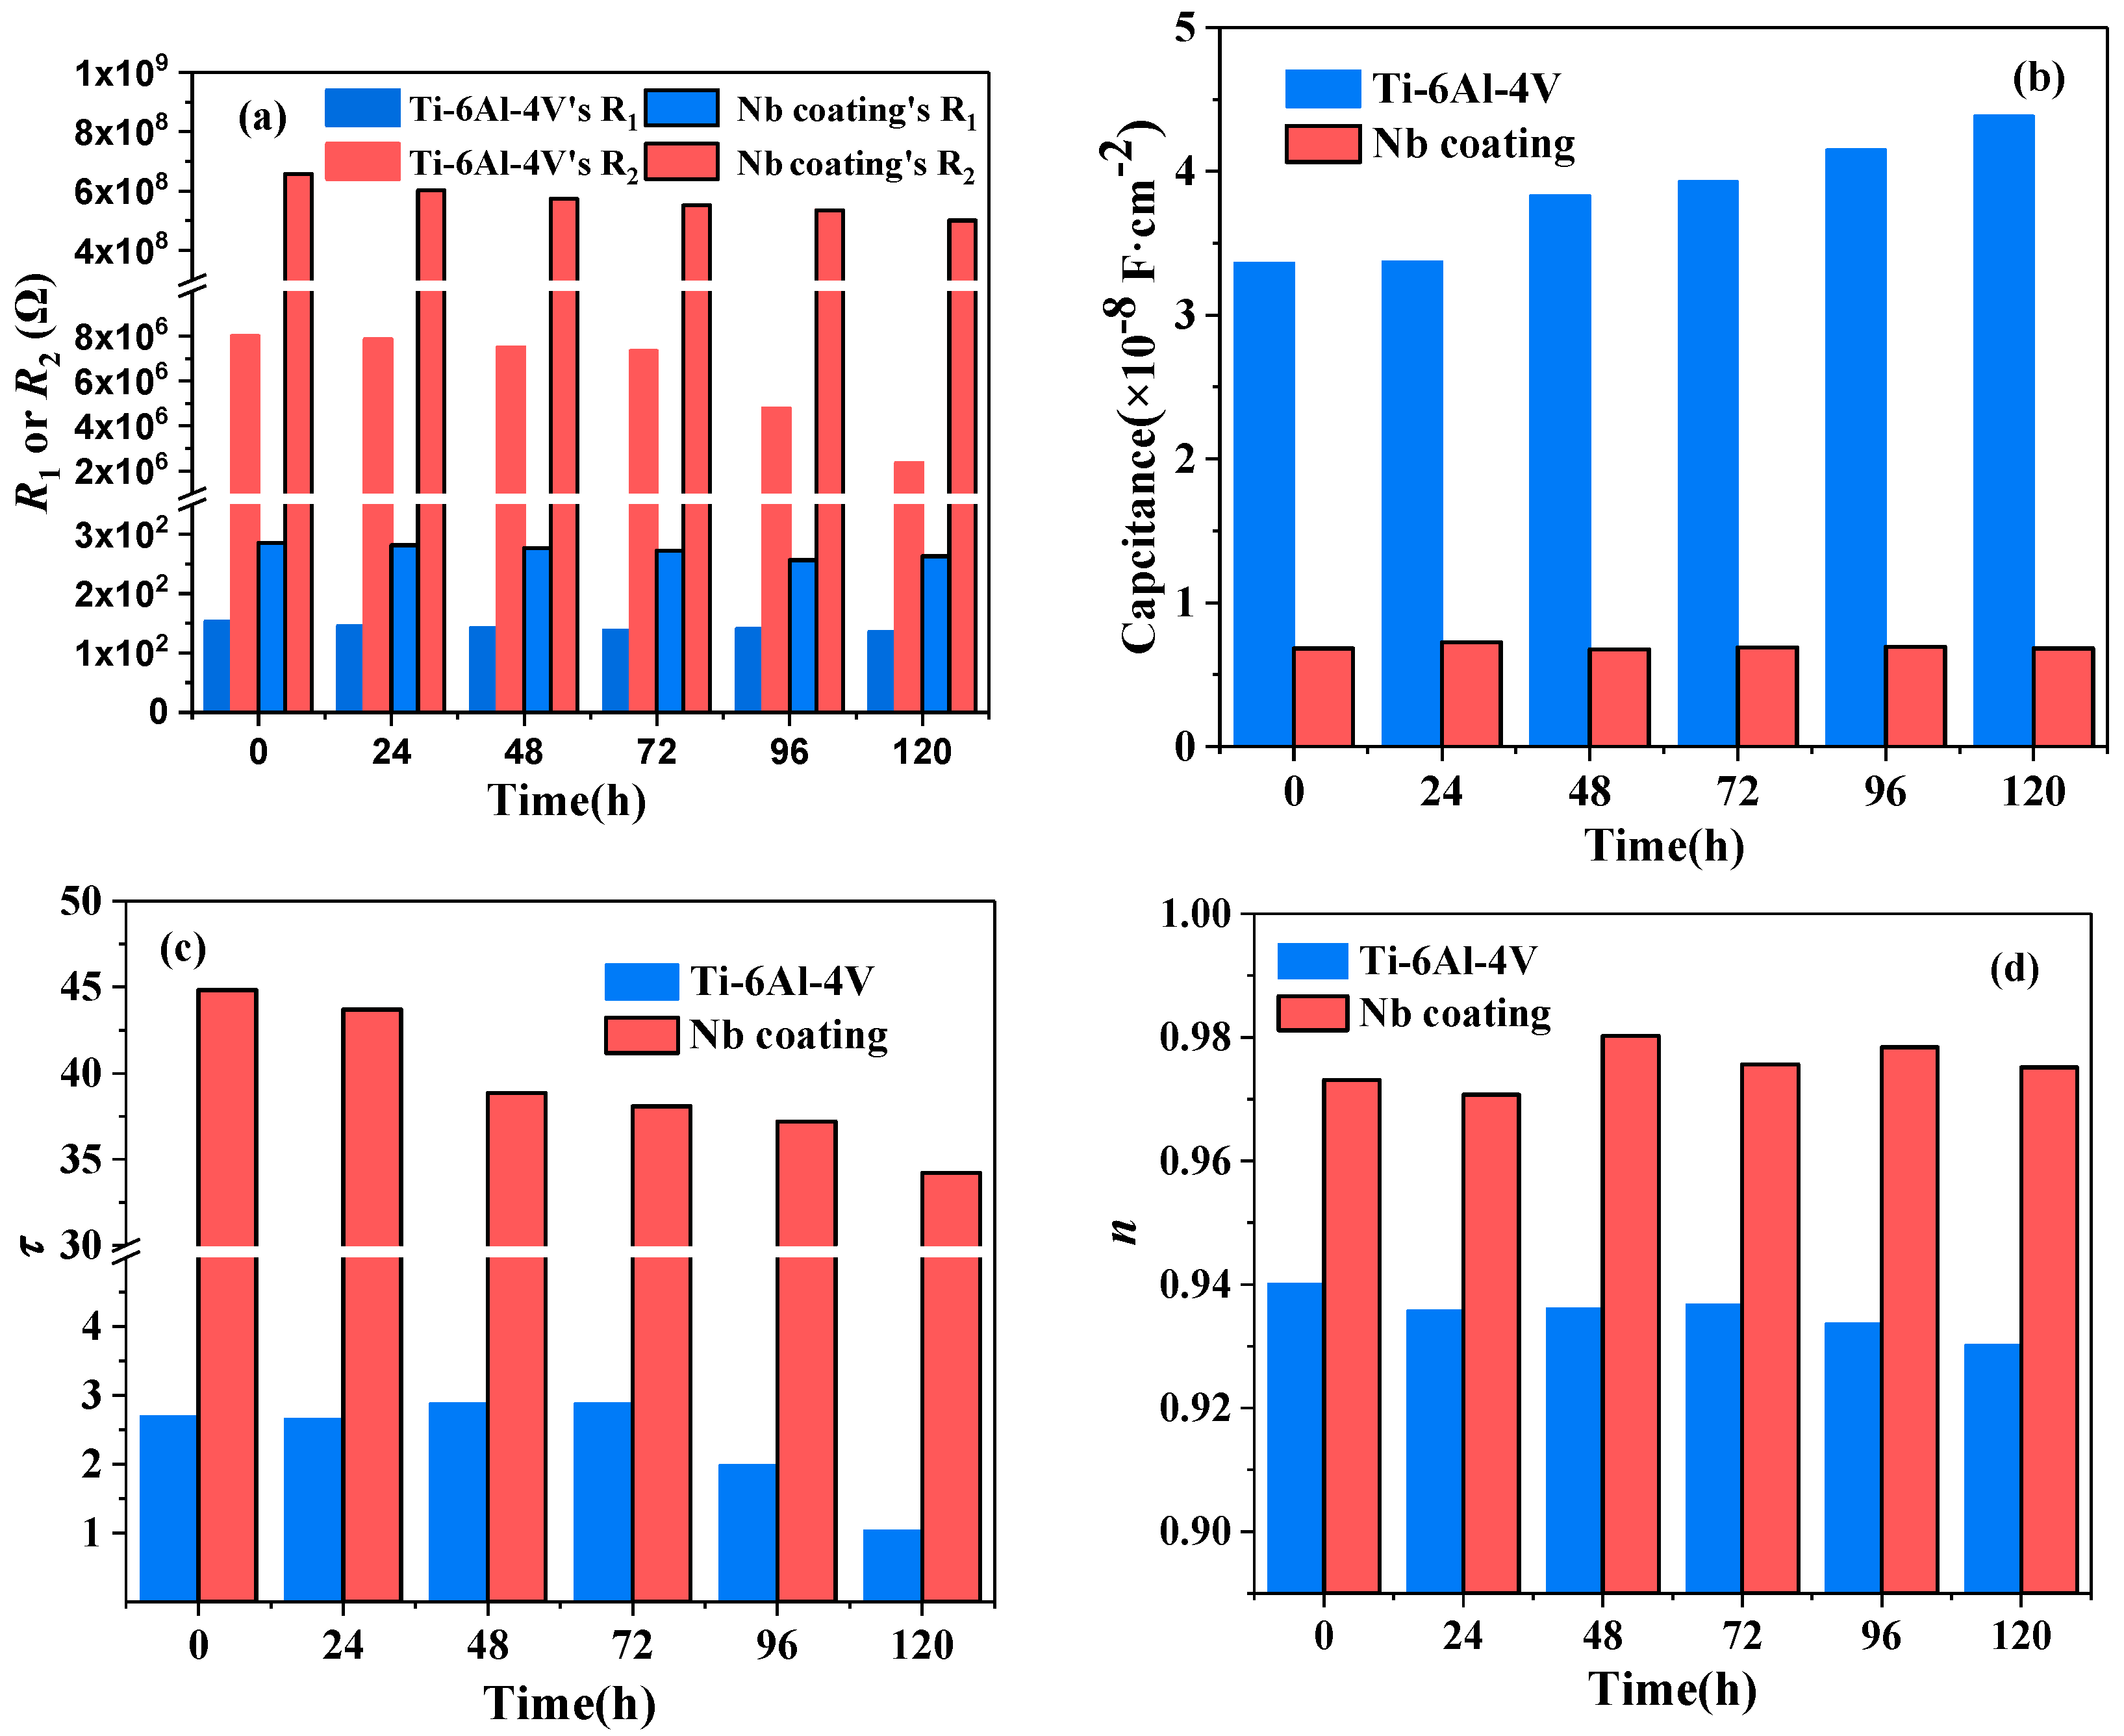
Figure 8 shows fitting data of the test samples (R1, R2, C, τ and n) at different immersion times. Observed in Figure 8a, the resistance of the porous layer (R1) for the Nb coating was approximately twice as high as that of the substrate at all times, implying that the Nb coating can more effectively retard the movement of chloride ion through the out porous layer. The resistance of the inner dense layer (R2) for the coating and the substrate were 4 and 6 orders of magnitude more than R1 for the two specimens, respectively, indicating that the inner dense layer dominated the prevention from ion conduction and the barrier characteristic for both the Nb coating and the bare substrate. Additionally, the R2 of the Nb coating was always higher than that of the substrate. The former did not change significantly, while the latter decreased with immersion time. Therefore, the Nb coating shows a superior corrosion resistance than the substrate over five days of immersion. Because the dense layer was the main barrier, the effective capacitance (C) of the barrier layer was calculated from the EIS data by the equation proposed by Brug et al. as Equation (4) [41]:
According to Figure 8b, the capacitance of the Ti–6Al–4V substrate was always higher than that of the Nb coating, and the former increased with immersion time, while the latter did not change significantly. Those results demonstrate that the Nb coating possessed a higher resistance and a lower capacitance can effectively improve the insulating and protecting properties of the substrate. The time constant τ, defined as τ = R × C, was employed to evaluate the corrosion rate of the eletrochemical process [42]. As shown in Figure 8c, compared to the substrate, the Nb coating possessed a larger τ value during the immersion time, demonstrating that the coating was more effective to retard the charge transfer than uncoated substrate. The CPE power, n, was used to evaluate the surface quality and the electrochemical performance [43,44]. As is shown in Figure 8d, the values of n of the Nb coating were always higher than that of the substrate during the exposure period, implying the coating possessed a smoother surface with less defects than that of the bare Ti–6Al–4V.
3.5. XPS Analysis
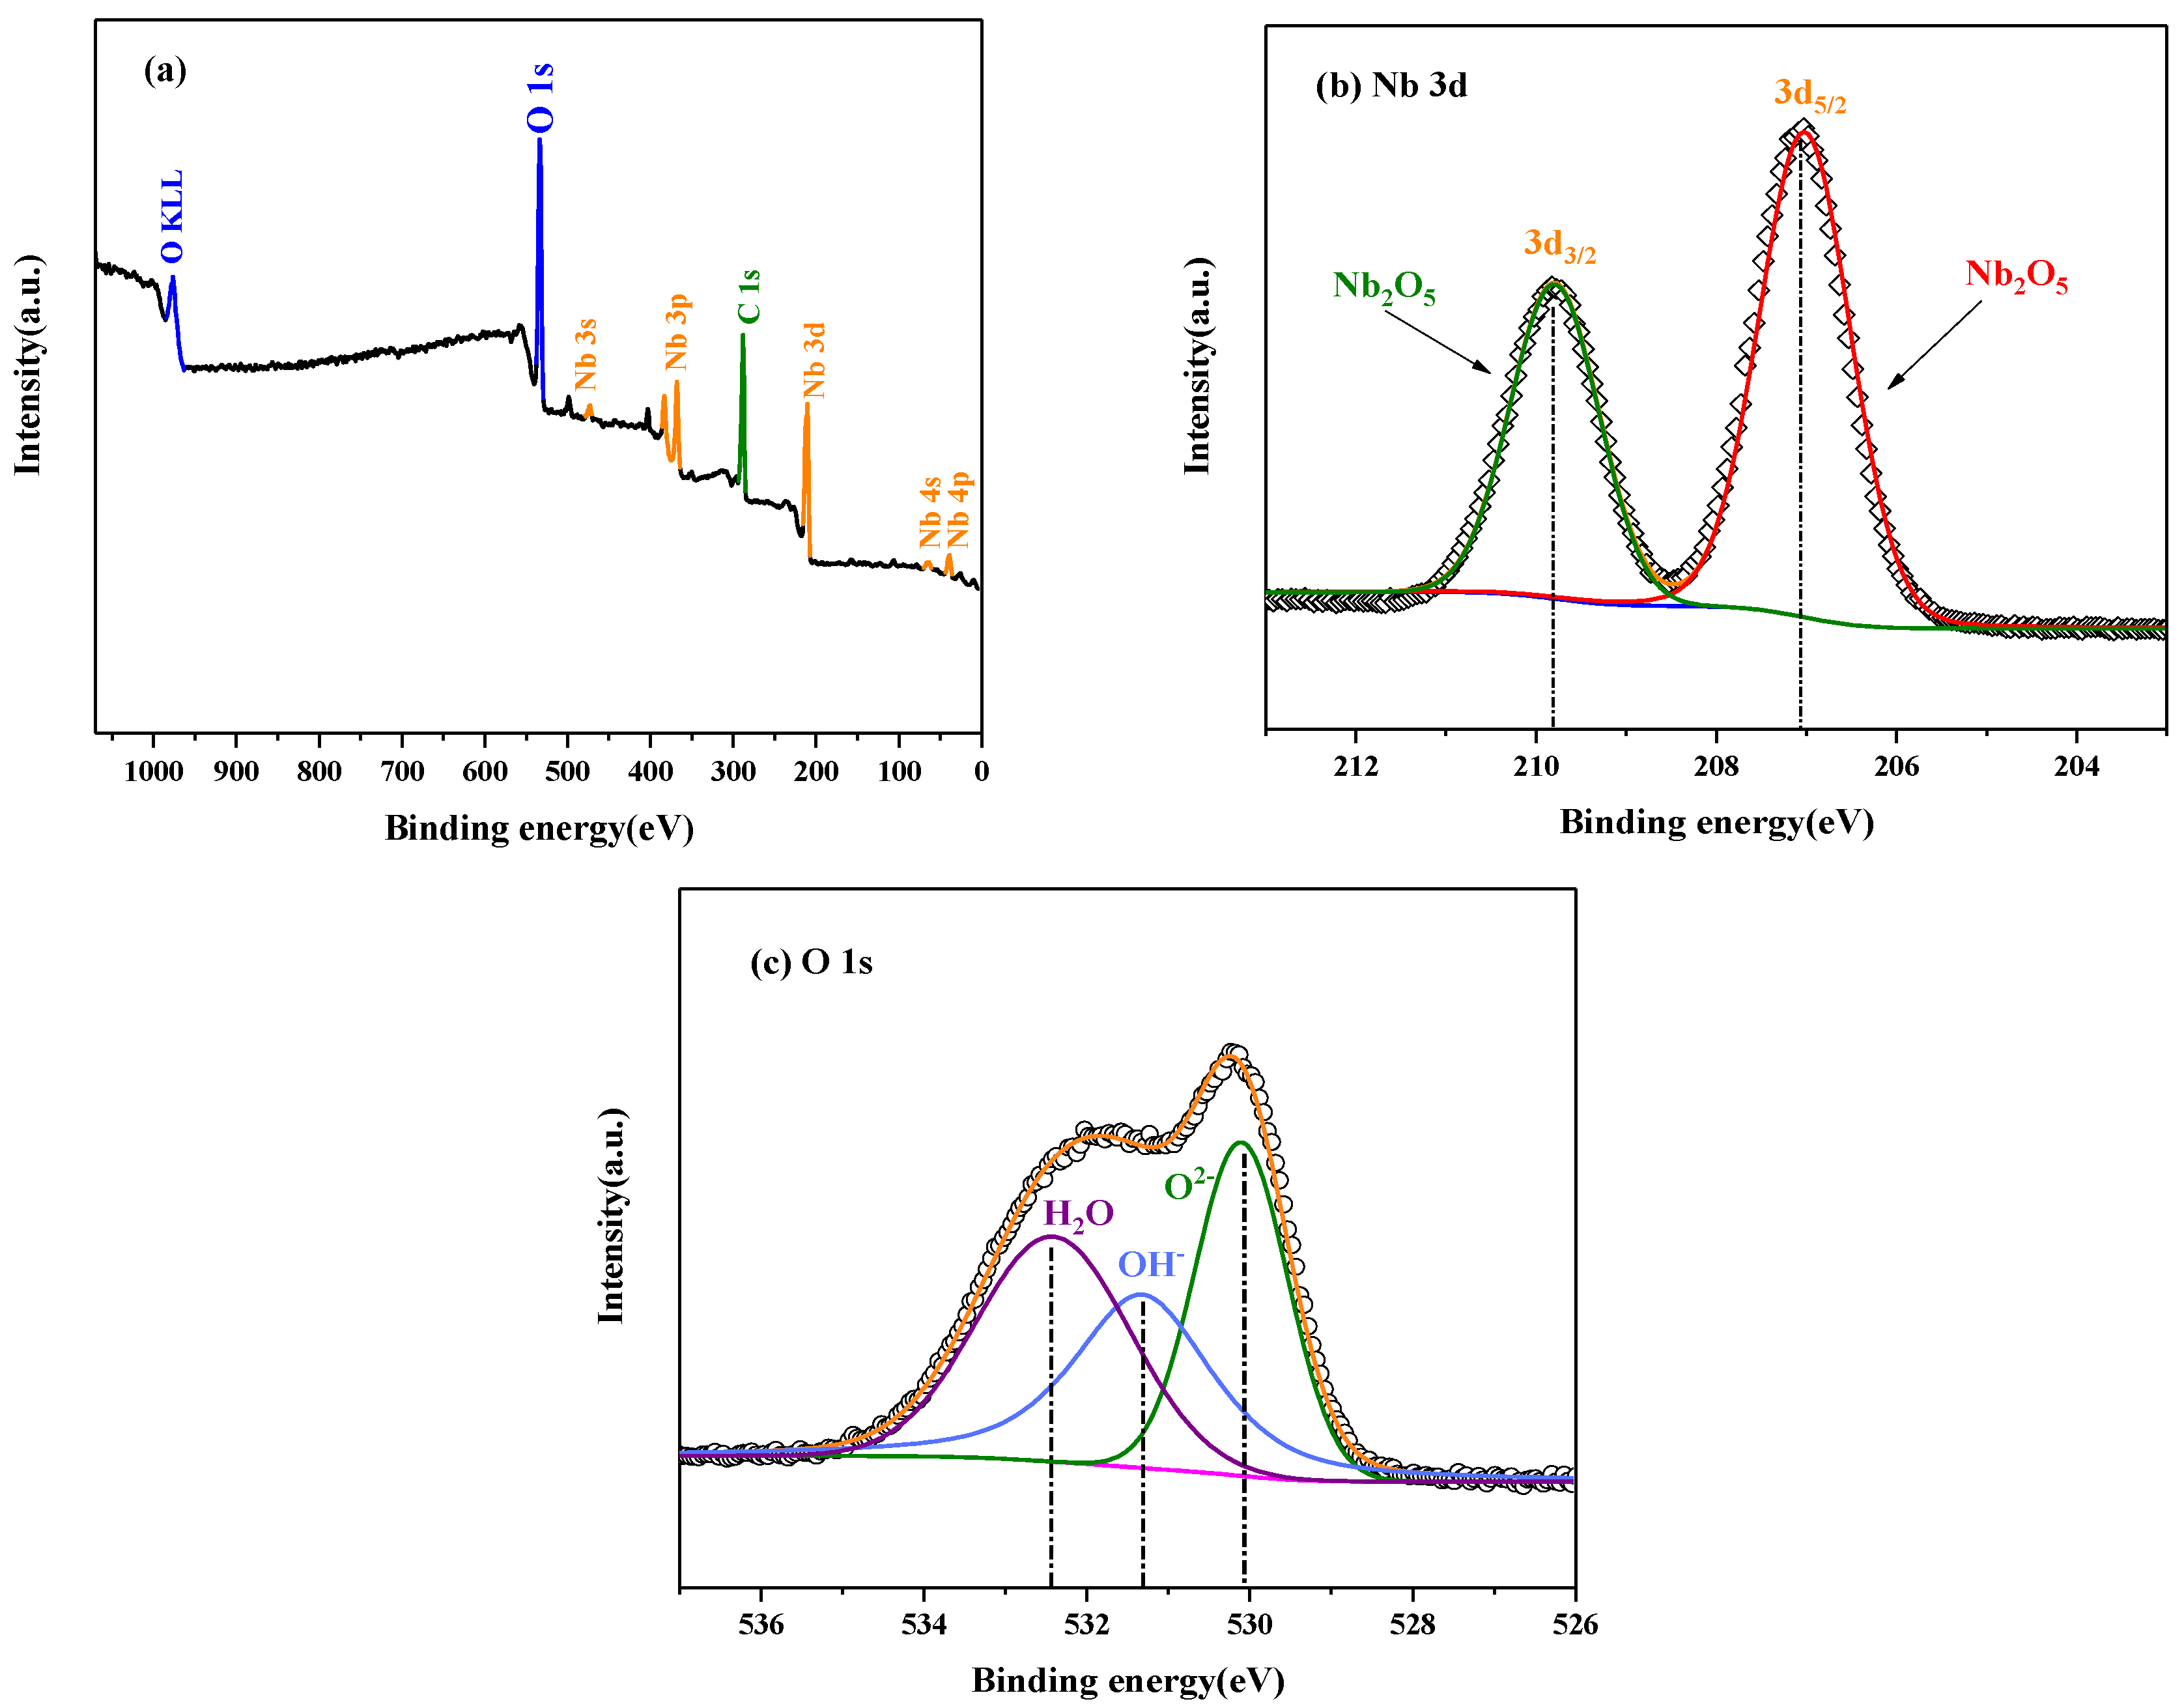
XPS analysis was carried out to characterize the chemical compositions of the passive oxide film developed on the Nb coating. Before the analysis, the coating was potentiostatically polarized at 1.0 VSCE for 1 h at the same experimental condition. Presented in Figure 9a, the XPS spectrum exhibited characteristic photoelectron peaks for Nb (Nb 3s, Nb 3p, Nb 3d, Nb 4s and Nb 4p), O 1s and C 1s. The C 1s peak can be associated with carbon contamination presented on the surface of the Nb coating. Figure 9b,c displays high resolution spectra for Nb 3d and O 1s obtained from the coating, respectively. As is obviously seen in Figure 9b, two characteristic peaks of the Nb 3d core level spectrum with binding energies located at 207.1 and 209.8 eV can be fitted as a sum of two different spin–orbit doublets with the separation of 2.7 eV between Nb 3d3/2 and Nb 3d5/2 [45,46], revealing that the peaks of Nb 3d were ascribed to Nb2O5 [47]. As shown in Figure 9c, the broad O 1s peak can be fitted to three different peaks. Then the peaks at binding energies of 530.1, 531.3 and 532.4 eV can be attributed to O2− ion in Nb2O5, oxygen ions in OH−, and oxygen ions absorbed H2O, respectively [48,49]. As a result, the main component of the passive film of the Nb coating was confirmed to be Nb2O5 by the XPS analysis.
3.6. Mott–Schottky Analysis
It is widely accepted that the semiconducting properties of the passive film, including the donor density and flat-band potential, are essential factors to evaluate the electrochemical stability and protective properties [19]. A Mott–Schottky analysis is a capacitance measurement as a function of the applied potential, and it is usually used to investigate the semiconducting properties of a passive film on a metal or alloy. The reciprocal of the square of the space charge capacitance (Csc) exhibit a linear relationship with the applied potential (E) under the depletion condition. This can be described by Equation (5):
where εr is the dielectric constant of the passive film, ε0 is the vacuum permittivity (8.854 × 10⁻¹⁴ F·cm−1), q is the elementary charge, Nq is the carrier concentration for a donor or acceptor, Efb is the flat-band potential, k is the Boltzmann constant (1.38 × 10⁻²³ J/K), and T is absolute temperature.
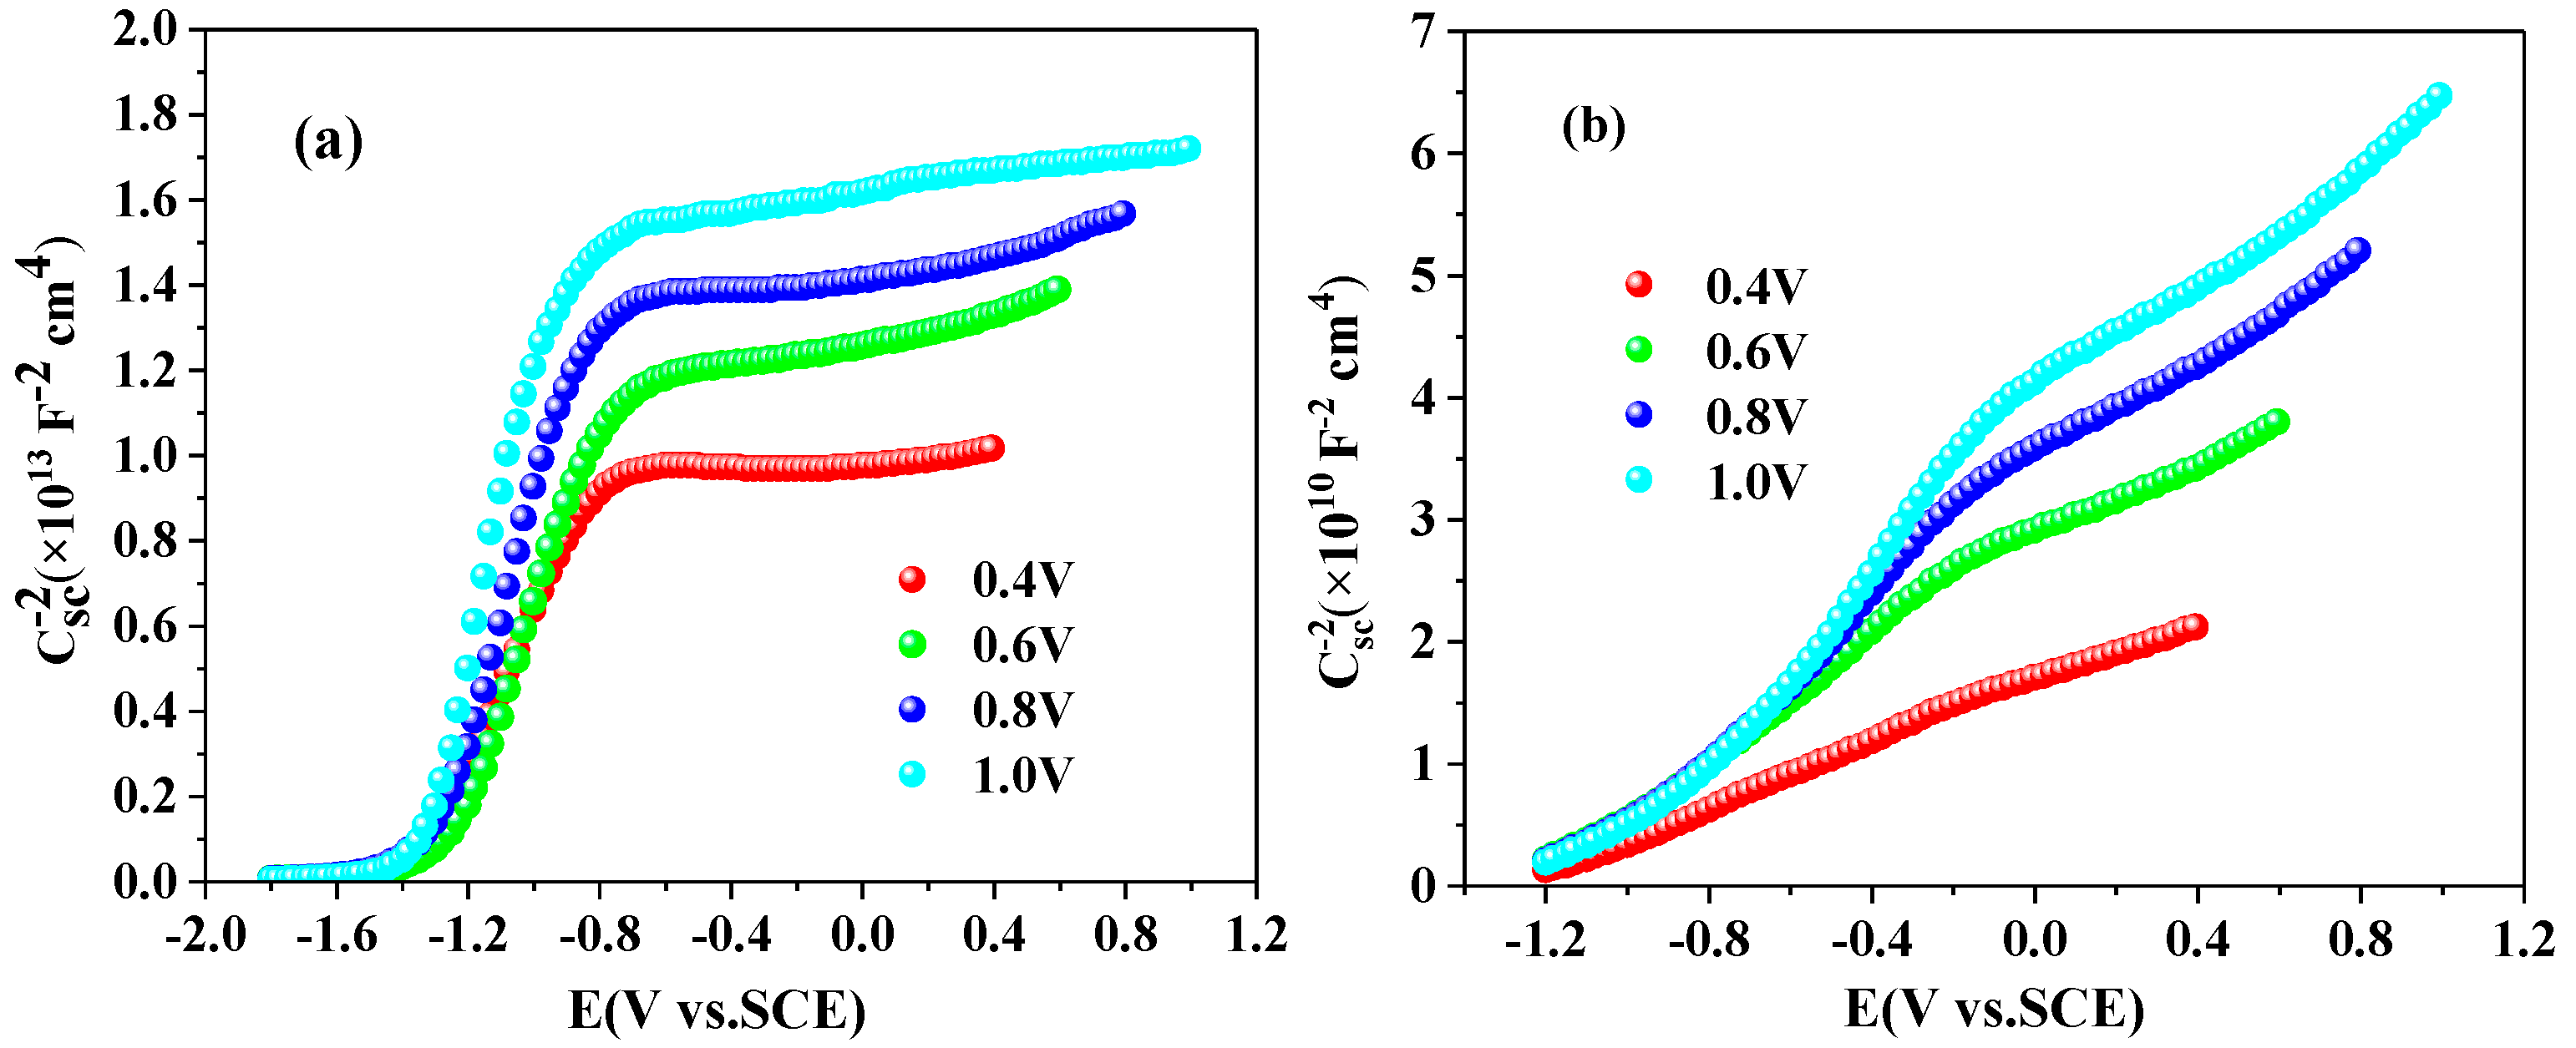
Before the capacitance measurement, the passive films of the specimens were generated at different Ef (0.4, 0.6, 0.8, and 1.0 V) for 1 h in the former experimental condition. According to Figure 10, these Mott–Schottky plots almost display two linear regions with different slopes. Quarto et al. considered that uniform donor density, the presence of deep doping levels, or the ionization of surface states maybe lead to a change of the slopes for the Mott–Schottky plots [18]. In the linear region below the turning point, all of the plots display a positive slope, demonstrating that the passive films of both specimens at various Ef were characterized as n-type semiconductors, which is consistent with previous results obtained from the passive film on niobium bulk [20].
According to XPS analysis, the chemical composition of the passive film for the Nb coating was mainly Nb2O5. The εr of the passive films for the coating and the substrate were determined as 5 (Nb2O5) [50] and 60 (TiO2) [51], respectively. The donor density could be calculated from the slope of the linear region below the turning point potential, and the Efb was determined by the extrapolation to 1/Csc2 = 0. The calculated results are presented in Table 3. It is obvious that the donor density of the Nb coating was 2–3 orders of magnitude less than that of the substrate at the same formation potential. The lower donor density, the lower cation vacancies concentration the n-type semiconducting passive film contains. There were fewer possibilities for chloride ions to occupy cation vacancies in chloride-containing solution, resulting in a lower cation vacancy flux, which could effectively protect the passive films and decrease the dissolution rate to prevent local breakdown [52]. Therefore, the Nb coating had higher localized corrosion resistance than the Ti–6Al–4V substrate in Ringer’s solution containing chloride ions. Furthermore, the donor densities for both specimens decreased with increasing Ef, which may be owed to that a denser passive film is developed at a higher Ef. The Efb for the coating was always lower than that of the substrate, and the former did not change significantly with increasing Ef, while the latter increased slightly. The n-type semiconducting passive film behaved with conductivity at potentials more negative than Efb and behaved with dielectric characteristic at potentials more positive than Efb [53]. Thus, the Nb coating with the lower Efb would exhibit dielectric behavior in la arger potential range than the Ti–6Al–4V substrate, indicating the coating possesses a higher corrosion resistance. This provides a valuable explanation of that the Nb coating possesses a better electrochemical stability than the Ti–6Al–4V substrate.
4. Conclusions
An Nb coating with a thickness of ~18 μm was deposited onto a polished Ti–6Al–4V substrate, exhibiting a dense and compact microstructure, with a strong (200) preferred orientation. The critical load of the niobium coating against the scratch damage responses reached about 83.5 N, which was sufficient for sliding contact applications. The electrochemical performances of both the Nb coating and the bare substrate were investigated via various electrochemical measurements in Ringer’s solution at 37 °C. An analysis of polarization curves showed that the Nb coating possessed a higher Ecorr and lower icorr than those of the Ti–6Al–4V substrate. The EIS spectra showed no significant changes in the impedance performance for the Nb coating after exposure in Ringer’s solution for five days, and the resistance of the coating was always two orders of magnitude larger than the substrate. This means that the coating can effectively enhance the corrosion resistance of the bare substrate in the case of long-term exposure in simulated body fluids. A Mott–Schottky analysis shows that the passive film of the Nb coating is an n-type semiconductor. The donor density for the Nb coating was 2–3 orders of magnitude lower than that for the bare Ti–6Al–4V alloy at different Ef, implying a lower possibility to absorb chloride ions. As such, the Nb coating exhibits a better corrosion behavior than the Ti–6Al–4V substrate exposed to a chloride-containing Ringer’s solution for five days.
Author Contributions
Conceptualization, K.S.; Methodology, Y.Z. and J.Z.; Validation, Y.Z.; Formal Analysis, Y.Z. and J.Z.; Investigation, Y.Z. and J.Z.; Resources, K.S.; Data Curation, Y.Z.; Writing—Original Draft Preparation, Y.Z.; Writing—Review and Editing, K.S. and Z.X.; Visualization, K.S.; Supervision, K.S.; Project Administration, K.S.; Funding Acquisition, K.S.
Funding
This research was funded by the National Natural Science Foundation of China, No. 51575406, and the Science Research Foundation for Wuhan Institute of Technology, No. K201519.
Conflicts of Interest
The authors declare no conflict of interest.
References
- Geetha, M.; Singh, A.K.; Asokamani, R.; Gogia, A.K. Ti based biomaterials, the ultimate choice for orthopaedic implants—A review. Prog. Mater. Sci. 2009, 54, 397–425. [Google Scholar] [CrossRef]
- Yanovska, A.; Kuznetsov, V.; Stanislavov, A. Synthesis and characterization of hydroxyapatite-based coatings for medical implants obtained on chemically modified Ti6Al4V substrates. Surf. Coat. Technol. 2011, 205, 5324–5329. [Google Scholar] [CrossRef]
- Afonso, C.R.M.; Aleixo, G.T.; Ramirez, A.J. Influence of cooling rate on microstructure of Ti–Nb alloy for orthopedic implants. Mater. Sci. Eng. C 2007, 27, 908–913. [Google Scholar] [CrossRef]
- Akahori, T.; Niinomi, M. Fracture characteristics of fatigued Ti–6Al–4V ELI as an implant material. Mater. Sci. Eng. A 1998, 243, 237–243. [Google Scholar] [CrossRef]
- Galvanetto, E.; Galliano, F.P.; Fossati, A.; Borgioli, F. Corrosion resistance properties of plasma nitrided Ti–6Al–4V alloy in hydrochloric acid solutions. Corros. Sci. 2002, 44, 1593–1606. [Google Scholar] [CrossRef]
- Gurappa, I. Characterization of different materials for corrosion resistance under simulated body fluid conditions. Mater. Charact. 2002, 49, 73–79. [Google Scholar] [CrossRef]
- Matsuno, H.; Yokoyama, A.; Watari, F.; Uo, M.; Kawasaki, T. Biocompatibility and osteogenesis of refractory metal implants, titanium, hafnium, niobium, tantalum and rhenium. Biomaterials 2001, 22, 1253–1262. [Google Scholar] [CrossRef]
- Fathi, M.H.; Zahrani, E.M.; Zomorodian, A. Novel fluorapatite/niobium composite coating for metallic human body implants. Mater. Lett. 2009, 63, 1195–1198. [Google Scholar] [CrossRef]
- Robin, A.; Rosa, J.L.; Silva, M.B. Electrodeposition and characterization of Cu–Nb composite coatings. Surf. Coat. Technol. 2010, 205, 2152–2159. [Google Scholar] [CrossRef]
- Savisalo, T.; Lewis, D.B.; Hovsepian, P.E.; Münz, W.-D. Influence of ion bombardment on the properties and microstructure of unbalanced magnetron deposited niobium coatings. Thin Solid Films 2004, 460, 94–100. [Google Scholar] [CrossRef]
- Parsapour, A.; Khorasani, S.N.; Fathi, M.H. Effect of surface treatment and metallic coating on corrosion behavior and biocompatibility of surgical 316L stainless steel implant. J. Mater. Sci. Technol. 2012, 28, 125–131. [Google Scholar] [CrossRef]
- Hsieh, J.H.; Lee, R.; Erck, R.A.; Fenske, G.R.; Su, Y.Y.; Marek, M.; Hochman, R.F. Niobium coatings on 316L stainless steel for improving corrosion resistance. Surf. Coat. Technol. 1991, 49, 83–86. [Google Scholar] [CrossRef]
- Pan, T.J.; Chen, Y.; Zhang, B.; Hu, J.; Li, C. Corrosion behavior of niobium coated 304 stainless steel in acid solution. Appl. Surf. Sci. 2016, 369, 320–325. [Google Scholar] [CrossRef]
- Maeng, S.; Axe, L.; Tyson, T.A. Corrosion behaviour of magnetron sputtered α-and β-Ta coatings on AISI 4340 steel as a function of coating thickness. Corros. Sci. 2006, 48, 2154–2160. [Google Scholar] [CrossRef]
- Hu, W.; Xu, J.; Lu, X.; Hu, D.; Tao, H.; Munroe, P.; Xie, Z.-H. Corrosion and wear behaviours of a reactive-sputter-deposited Ta2O5 nanoceramic coating. Appl. Surf. Sci. 2016, 368, 177–190. [Google Scholar] [CrossRef]
- Mawella, K.J.A.; Sheward, J.A. Sputtered alloy coatings by codeposition: Effects of bias voltage. Thin Solid Films 1990, 193, 27–33. [Google Scholar] [CrossRef]
- Nagarajan, S.; Raman, V.; Rajendran, N. Synthesis and electrochemical characterization of porous niobium oxide coated 316L SS for orthopedic applications. Mater. Chem. Phys. 2010, 119, 363–366. [Google Scholar] [CrossRef]
- Di Quarto, F.; Piazza, S.; Sunseri, C. Amorphous semiconductor—Electrolyte junction. Impedance study on the a-Nb2O5—Electrolyte junction. Electrochim. Acta 1990, 35, 99. [Google Scholar] [CrossRef]
- Li, D.G.; Wang, J.D.; Chen, D.R. Influence of potentiostatic aging, temperature and pH on the diffusivity of a point defect in the passive film on Nb in an HCl solution. Electrochim. Acta 2012, 60, 134–146. [Google Scholar] [CrossRef]
- Wang, W.; Alfantazi, A. An electrochemical impedance spectroscopy and polarization study of the role of crystallographic orientation on electrochemical behavior of niobium. Electrochim. Acta 2014, 131, 79–88. [Google Scholar] [CrossRef]
- Macleary, D.L. Testing of columbium and colymbium alloys. Corrosion 1962, 18, 67t–69t. [Google Scholar] [CrossRef]
- Robin, A.; Rosa, J.L. Corrosion behavior of niobium, tantalum and their alloys in hot hydrochloric and phosphoric acid solutions. Int. J. Refract. Met. Hard Mater. 2000, 18, 47–53. [Google Scholar] [CrossRef]
- Asselin, E.; Ahmed, T.M.; Alfantazi, A. Corrosion of niobium in sulphuric and hydrochloric acid solutions at 75 and 95 °C. Corros. Sci. 2007, 49, 694–710. [Google Scholar] [CrossRef]
- Prakash, C.; Singh, S.; Pruncu, C.I.; Mishra, V.; Królczyk, G.; Pimenov, D.Y.; Pramanik, A. Surface modification of Ti-6Al-4V alloy by electrical discharge coating process using partially sintered Ti-Nb electrode. Materials 2019, 12, 1006. [Google Scholar] [CrossRef]
- Jones, M.I.; McColl, I.R.; Grant, D.M. Effect of substrate preparation and deposition conditions on the preferred orientation of TiN coatings deposited by RF reactive sputtering. Surf. Coat. Technol. 2000, 132, 143–151. [Google Scholar] [CrossRef]
- Szala, M.; Walczak, M.; Pasierbiewicz, K.; Kamiński, M. Cavitation erosion and sliding wear mechanisms of AlTiN and TiAlN films deposited on stainless steel substrate. Coatings 2019, 9, 340. [Google Scholar] [CrossRef]
- Hogmark, S.; Jacobson, S.; Larsson, M. Design and evaluation of tribological coatings. Wear 2000, 246, 20–33. [Google Scholar] [CrossRef]
- Chen, J.; Geng, M.; Li, Y.; Yang, Z.; Chai, Y.; He, G. Erosion resistance and damage mechanism of TiN/ZrN nanoscale multilayer coating. Coatings 2019, 9, 64. [Google Scholar] [CrossRef]
- Zhou, X.; Siman, R.; Lin, L.; Mohanty, P. Argon atmospheric plasma sprayed hydroxyapatite/Ti composite coating for biomedical applications. Surf. Coat. Technol. 2012, 207, 343–349. [Google Scholar] [CrossRef]
- Xie, F.; He, X.; Cao, S.; Mei, M.; Qu, X. Influence of pore characteristics on microstructure, mechanical properties and corrosion resistance of selective laser sintered porous Ti–Mo alloys for biomedical applications. Electrochim. Acta 2013, 105, 121–129. [Google Scholar] [CrossRef]
- Bi, P.; Li, H.; Zhao, G.; Ran, M.; Cao, L.; Guo, H.; Xue, Y. Robust super-hydrophobic coating prepared by electrochemical surface engineering for corrosion protection. Coatings 2019, 9, 452. [Google Scholar] [CrossRef]
- Du, C.; He, X.; Tian, F.; Bai, X.; Yuan, C. Preparation of superhydrophobic steel surfaces with chemical stability and corrosion. Coatings 2019, 9, 398. [Google Scholar] [CrossRef]
- Le, D.P.; Yoo, Y.H.; Kim, J.G.; Cho, S.M.; Son, Y.K. Corrosion characteristics of polyaniline-coated 316L stainless steel in sulphuric acid containing fluoride. Corros. Sci. 2009, 51, 330–338. [Google Scholar] [CrossRef]
- Yu, Y.J.; Kim, J.G.; Cho, S.H.; Boo, J.H. Plasma-polymerized toluene films for corrosion inhibition in microelectronic devices. Surf. Coat. Technol. 2003, 162, 161–166. [Google Scholar] [CrossRef]
- Liu, C.; Bi, Q.; Leyland, A.; Matthews, A. An electrochemical impedance spectroscopy study of the corrosion behaviour of PVD coated steels in 0.5 N NaCl aqueous solution: Part II. EIS interpretation of corrosion behaviour. Corros. Sci. 2003, 45, 1257–1273. [Google Scholar] [CrossRef]
- Xie, F.; He, X.; Lv, Y.; Wu, M.; He, X.; Qu, X. Selective laser sintered porous Ti–(4–10)Mo alloys for biomedical applications: Structural characteristics, mechanical properties and corrosion behaviour. Corros. Sci. 2015, 95, 117–124. [Google Scholar] [CrossRef]
- Bai, Y.; Li, S.J.; Prima, F.; Hao, Y.L.; Yang, R. Electrochemical corrosion behavior of Ti–24Nb–4Zr–8Sn alloy in a simulated physiological environment. Appl. Surf. Sci. 2012, 258, 4035–4040. [Google Scholar] [CrossRef]
- Vasilescu, C.; Drob, S.I.; Neacsu, E.I.; Rosca, J.C.M. Surface analysis and corrosion resistance of a new titanium base alloy in simulated body fluids. Corros. Sci. 2012, 65, 431–440. [Google Scholar] [CrossRef]
- Rosalbino, F.; Maccio, D.; Scavino, G. Study of Co–W crystalline alloys as hydrogen electrodes in alkaline water electrolysis. J. Mater. Sci. Mater. Med. 2012, 23, 865–871. [Google Scholar] [CrossRef]
- Li, H.; Sun, P.; Zhu, Y.; Wu, M.; Wang, Q. Influence of C2H2 flows on microstructure and corrosion resistance of TiCN films doped with carbon atoms. Coatings 2018, 8, 458. [Google Scholar] [CrossRef]
- Brug, G.J.; Van Den Eeden, A.L.G.; Sluyters-Rehbach, M.; Sluyters, J.H. The analysis of electrode impedances complicated by the presence of a constant phase element. J. Electroanal. Chem. Interfacial Electrochem. 1984, 176, 275–295. [Google Scholar] [CrossRef]
- Petrossians, A.; Whalen, J.J.; Weiland, J.D.; Mansfeld, F. Surface modification of neural stimulating/recording electrodes with high surface area platinum-iridium alloy coatings. J. Electrochem. Soc. 2011, 158, D269–D276. [Google Scholar] [CrossRef]
- Amaya, A.; Piamba, O.; Olaya, J. Improvement of corrosion resistance for gray cast iron in palm biodiesel application using thermoreactive diffusion niobium carbide (NbC) coating. Coatings 2018, 8, 216. [Google Scholar] [CrossRef]
- Zhao, X.; Qi, Y.; Zhang, Z.; Li, K.; Li, Z. Electrochemical impedance spectroscopy investigation on the corrosive behaviour of waterborne silicate micaceous iron oxide coatings in seawater. Coatings 2019, 9, 415. [Google Scholar] [CrossRef]
- Meléndez-Ceballos, A.; Fernández-Valverde, S.M.; Albin, V.; Lair, V.; Chávez-Carvayar, J.; Ringuedé, A.; Cassir, M. Investigation on niobium oxide coatings for protecting and enhancing the performance of Ni cathode in the MCFC. Int. J. Hydrogen Energy 2016, 41, 18721–18731. [Google Scholar] [CrossRef]
- PremKumar, K.P.; Duraipandy, N.; Syamala, K.M.; Rajendran, N. Antibacterial effects, biocompatibility and electrochemical behavior of zinc incorporated niobium oxide coating on 316L SS for biomedical applications. Appl. Surf. Sci. 2018, 427, 1166–1181. [Google Scholar] [CrossRef]
- Li, Y.; Zhang, J.L.; Qian, X.Y.; Zhang, Y.; Wang, Y.N.; Hu, R.D.; Yao, C.; Zhu, J.W. Nanoporous niobium nitride (Nb2N) with enhanced electrocatalytic performance for hydrogen evolution. Appl. Surf. Sci. 2018, 427, 884–889. [Google Scholar] [CrossRef]
- Vasilescu, C.; Drob, S.I.; Moreno, J.M.C.; Osiceanu, P.; Popa, M.; Vasilescu, E.; Marcu, M.; Drob, P. Long-term corrosion resistance of new Ti–Ta–Zr alloy in simulated physiological fluids by electrochemical and surface analysis methods. Corros. Sci. 2015, 93, 310–323. [Google Scholar] [CrossRef]
- Hu, C.; Wang, J.Z.; Tang, H.X. Preparation and characterization of surface bond-conjugated TiO2/SiO2 and photocatalysis for azo dyes. Appl. Catal. B 2001, 30, 277–285. [Google Scholar] [CrossRef]
- Al-Baradi, A.M.; El-Nahass, M.M.; Hassanien, A.M.; Atta, A.A.; Alqahtani, M.S.; Aldawsari, A.O. Influence of RF sputtering power on structural and optical properties of Nb2O5 thin films. Optik 2018, 168, 853–863. [Google Scholar] [CrossRef]
- Jovic, V.D.; Barsoum, M.W. Corrosion behavior and passive film characteristics formed on Ti, Ti3SiC2, and Ti4AlN3 in H2SO4 and HCl. J. Electrochem. Soc. 2004, 151, B71–B76. [Google Scholar] [CrossRef]
- Liu, L.L.; Xu, J.; Lu, X.; Munroe, P.; Xie, Z.-H. Electrochemical corrosion behavior of nanocrystalline β-Ta coating for biomedical applications. ACS Biomater. Sci. Eng. 2016, 2, 579–594. [Google Scholar] [CrossRef]
- Li, Y.; Zhang, T.; Wang, F. Effect of microcrystallization on corrosion resistance of AZ91D alloy. Electrochim. Acta 2006, 51, 2845–2850. [Google Scholar] [CrossRef]
Figure 1.
Typical XRD pattern for the Nb coating and the standard XRD pattern of face centered cubic (fcc) Nb (PDF Card 88-2330).
Figure 1.
Typical XRD pattern for the Nb coating and the standard XRD pattern of face centered cubic (fcc) Nb (PDF Card 88-2330).

Figure 2.
(a) SEM micrograph of the cross section of the Nb coating, (b) the energy-dispersive X-ray (EDS) line-scans and the EDS elemental distribution for (c) Ti, and (d) Nb, respectively.
Figure 2.
(a) SEM micrograph of the cross section of the Nb coating, (b) the energy-dispersive X-ray (EDS) line-scans and the EDS elemental distribution for (c) Ti, and (d) Nb, respectively.

Figure 3.
Acoustic emission signal intensity versus load curves of the niobium coating and the corresponding scratch scar morphology (inset).
Figure 3.
Acoustic emission signal intensity versus load curves of the niobium coating and the corresponding scratch scar morphology (inset).

Figure 4.
Open circuit potential versus time curves of the niobium coating and the Ti–6Al–4V substrate in Ringer’s solution at 37 °C.
Figure 4.
Open circuit potential versus time curves of the niobium coating and the Ti–6Al–4V substrate in Ringer’s solution at 37 °C.

Figure 5.
(a) Typical potentiodynamic polarization curves of the niobium coating and the substrate in Ringer’s solution at 37 °C. (b) Schematical explanation for the changes in Ecorr and icorr applying the mixed potential theory. Curve βa and curve βc is for the anodic and cathodic semireaction, respectively.

Figure 6.
Nyquist and Bode plots of impedance spectra acquired from two specimens immersing in Ringer’s solution at 37 °C for five days at the corresponding EOCP. Niobium coating: (a) Nyquist plot, (b) Bode plot; Ti–6Al–4V substrate: (c) Nyquist plot, (d) Bode plot.
Figure 6.
Nyquist and Bode plots of impedance spectra acquired from two specimens immersing in Ringer’s solution at 37 °C for five days at the corresponding EOCP. Niobium coating: (a) Nyquist plot, (b) Bode plot; Ti–6Al–4V substrate: (c) Nyquist plot, (d) Bode plot.

Figure 7.
Electronic equivalent circuit applied to fit the electrochemical impedance spectroscopy data of the samples.
Figure 7.
Electronic equivalent circuit applied to fit the electrochemical impedance spectroscopy data of the samples.

Figure 8.
Impedance spectra fitting data of the test samples at the immersion time for five days. (a) Resistance values R1 and R2; (b) capacitance values C; (c) time constant τ; (d) CPE power n.
Figure 8.
Impedance spectra fitting data of the test samples at the immersion time for five days. (a) Resistance values R1 and R2; (b) capacitance values C; (c) time constant τ; (d) CPE power n.

Figure 9.
(a) Typical XPS spectrum and (b,c) high-resolution XPS spectra of Nb 3d and O 1s for the passive film developed on the niobium coating.
Figure 9.
(a) Typical XPS spectrum and (b,c) high-resolution XPS spectra of Nb 3d and O 1s for the passive film developed on the niobium coating.

Figure 10.
Mott–Schottky plots of the passive films developed on (a) the niobium coating and (b) the Ti–6Al–4V substrate at different potentials (0.4, 0.6, 0.8, and 1.0 V) in Ringer’s solution at 37 °C.
Figure 10.
Mott–Schottky plots of the passive films developed on (a) the niobium coating and (b) the Ti–6Al–4V substrate at different potentials (0.4, 0.6, 0.8, and 1.0 V) in Ringer’s solution at 37 °C.


Table 1.
The TChkl values for different planes of the Nb coating.
| Crystal Plane | (111) | (200) | (220) | (311) |
|---|---|---|---|---|
| TChkl | 0.21 | 2.58 | 0.58 | 0.62 |
Table 2.
Electrochemical parameters collected from the polarization curves of the test samples in Ringer’s solution at 37 °C.
Table 2.
Electrochemical parameters collected from the polarization curves of the test samples in Ringer’s solution at 37 °C.
| Samples | Ecorr (V vs. SCE) | icorr (A·cm−2) | βa (mV/decade) | βc (mV/decade) | RP (×105 Ω·cm2) | Pe (%) |
|---|---|---|---|---|---|---|
| Ti–6Al–4V | −0.42 | 1.36 × 10⁻⁷ | 109.13 | 78.31 | 14.65 | – |
| Nb coating | −0.06 | 1.01 × 10⁻⁸ | 244.26 | 186.98 | 45.79 | 92.57 |
Table 3.
Electrochemical parameters collected from capacitance measurement of the niobium coating and the substrate.
Table 3.
Electrochemical parameters collected from capacitance measurement of the niobium coating and the substrate.
| Samples | Ef (V) | Efb (V) | Nd (×1018 cm−3) |
|---|---|---|---|
| Nb coating | 0.4 | −1.34 | 1.948 |
| 0.6 | −1.26 | 1.438 | |
| 0.8 | −1.31 | 1.225 | |
| 1.0 | −1.35 | 1.044 | |
| Ti–6Al–4V | 0.4 | −1.23 | 166.4 |
| 0.6 | −1.12 | 82.49 | |
| 0.8 | −1.01 | 60.23 | |
| 1.0 | −0.92 | 47.86 |
© 2019 by the authors. Licensee MDPI, Basel, Switzerland. This article is an open access article distributed under the terms and conditions of the Creative Commons Attribution (CC BY) license (http://creativecommons.org/licenses/by/4.0/).
Share and Cite
MDPI and ACS Style
Shi, K.; Zhang, Y.; Zhang, J.; Xie, Z. Electrochemical Properties of Niobium Coating for Biomedical Application. Coatings 2019, 9, 546. https://doi.org/10.3390/coatings9090546
AMA Style
Shi K, Zhang Y, Zhang J, Xie Z. Electrochemical Properties of Niobium Coating for Biomedical Application. Coatings. 2019; 9(9):546. https://doi.org/10.3390/coatings9090546
Chicago/Turabian StyleShi, Kunyu, Yi Zhang, Jinzhong Zhang, and Zonghan Xie. 2019. "Electrochemical Properties of Niobium Coating for Biomedical Application" Coatings 9, no. 9: 546. https://doi.org/10.3390/coatings9090546
Note that from the first issue of 2016, this journal uses article numbers instead of page numbers. See further details here.